UNITED STATES
SECURITIES AND EXCHANGE COMMISSION
Washington, D.C. 20549
FORM N-CSR
CERTIFIED SHAREHOLDER REPORT OF REGISTERED
MANAGEMENT INVESTMENT COMPANIES
Investment Company Act file number 811-4118
Fidelity Securities Fund
(Exact name of registrant as specified in charter)
82 Devonshire St., Boston, Massachusetts 02109
(Address of principal executive offices) (Zip code)
Scott C. Goebel, Secretary
82 Devonshire St.
Boston, Massachusetts 02109
(Name and address of agent for service)
Registrant's telephone number, including area code: 617-563-7000
Date of fiscal year end: | November 30 |
| |
Date of reporting period: | November 30, 2011 |
Item 1. Reports to Stockholders
(Fidelity Investment logo)(registered trademark)
Fidelity Advisor®
Growth Strategies
Fund - Institutional Class
Annual Report
November 30, 2011
Contents
Chairman's Message | (Click Here) | The Chairman's message to shareholders. |
Performance | (Click Here) | How the fund has done over time. |
Management's Discussion of Fund Performance | (Click Here) | The Portfolio Manager's review of fund performance and strategy. |
Shareholder Expense Example | (Click Here) | An example of shareholder expenses. |
Investment Changes | (Click Here) | A summary of major shifts in the fund's investments over the past six months. |
Investments | (Click Here) | A complete list of the fund's investments with their market values. |
Financial Statements | (Click Here) | Statements of assets and liabilities, operations, and changes in net assets, as well as financial highlights. |
Notes | (Click Here) | Notes to the financial statements. |
Report of Independent Registered Public Accounting Firm | (Click Here) | |
Trustees and Officers | (Click Here) | |
Board Approval of Investment Advisory Contracts and Management Fees | (Click Here) | |
To view a fund's proxy voting guidelines and proxy voting record for the 12-month period ended June 30, visit http://www.fidelity.com/proxyvotingresults or visit the Securities and Exchange Commission's (SEC) web site at http://www.sec.gov. You may also call 1-877-208-0098 to request a free copy of the proxy voting guidelines.
Standard & Poor's, S&P and S&P 500 are registered service marks of The McGraw-Hill Companies, Inc. and have been licensed for use by Fidelity Distributors Corporation.
Other third party marks appearing herein are the property of their respective owners.
All other marks appearing herein are registered or unregistered trademarks or service marks of FMR LLC or an affiliated company.
Annual Report
This report and the financial statements contained herein are submitted for the general information of the shareholders of the fund. This report is not authorized for distribution to prospective investors in the fund unless preceded or accompanied by an effective prospectus.
A fund files its complete schedule of portfolio holdings with the SEC for the first and third quarters of each fiscal year on Form N-Q. Forms N-Q are available on the SEC's web site at http://www.sec.gov. A fund's Forms N-Q may be reviewed and copied at the SEC's Public Reference Room in Washington, DC. Information regarding the operation of the SEC's Public Reference Room may be obtained by calling 1-800-SEC-0330. For a complete list of a fund's portfolio holdings, view the most recent holdings listing, semiannual report, or annual report on Fidelity's web site at http://www.fidelity.com, http://www.advisor.fidelity.com, or http://www.401k.com, as applicable.
NOT FDIC INSURED • MAY LOSE VALUE • NO BANK GUARANTEE
Neither the fund nor Fidelity Distributors Corporation is a bank.
Annual Report
(Acting chairman's photo appears here)
Dear Shareholder:
The unusually high level of volatility that global equity markets have experienced since early August continued through the end of November. Most major indexes were unable to gain much traction during this time frame, as concern about the sovereign debt crisis in Europe continued to overshadow strong corporate earnings and better-than-expected economic news. High-grade bonds, meanwhile, fared slightly better amid periodic flights to quality. Financial markets are difficult to predict, of course, but you can help put the odds in your favor by following these time-tested investment principles.
One of the basic tenets is to invest according to your time horizon. For long-term investors, riding out the markets' inevitable ups and downs has proven much more effective than making decisions based on short-term developments. If your goal is approaching, you can also benefit from patience and restraint, rather than attempting to time the market. No matter your time horizon, missing only a few of the markets' best days can significantly diminish returns. Patience also affords the benefits of compounding - earning interest on additional income or reinvested dividends and capital gains. While staying the course doesn't eliminate risk, it can considerably lessen the negative impact of short-term downturns.
Asset allocation is another principle to manage risk. As you spread your portfolio among the asset classes, be sure to consider your time horizon, risk tolerance and investment objectives. Younger investors may be better served by emphasizing equities, which historically have been the best-performing asset class over time. Investors who are nearing a specific goal, such as retirement or sending a child to college, may choose to favor bonds and other investments that have tended to be more stable. Studies indicate that asset allocation is the single most important determinant of a portfolio's long-term success. After deciding on a suitable allocation strategy, make sure your portfolio is adequately diversified, with exposure to stocks of small-, mid- and large-cap companies in a range of sectors, for example. And today, more than ever, geographic diversification should be taken into account.
Lastly, investing a certain amount of money on a regular basis - a principle known as dollar-cost averaging - can help lower the average cost of your purchases, while also giving you the discipline to avoid selling weak performers just prior to an upswing, or chasing a hot performer just before a correction.
We invite you to learn more by visiting us on the Internet, dropping by one of our Investor Centers or calling us by phone. It is our privilege to provide the resources you need to choose investments that are right for you.
Sincerely,
(Acting chairman's signature appears here)
James C. Curvey
Acting Chairman
Annual Report
Average annual total return reflects the change in the value of an investment, assuming reinvestment of the class' distributions from dividend income and capital gains (the profits earned upon the sale of securities that have grown in value, if any) and assuming a constant rate of performance each year. The $10,000 table and the fund's returns do not reflect the deduction of taxes that a shareholder would pay on fund distributions or the redemption of fund shares. During periods of reimbursement by Fidelity, a fund's total return will be greater than it would be had the reimbursement not occurred. How a fund did yesterday is no guarantee of how it will do tomorrow.
Average Annual Total Returns
Periods ended November 30, 2011 | Past 1
year | Past 5
years | Past 10
years |
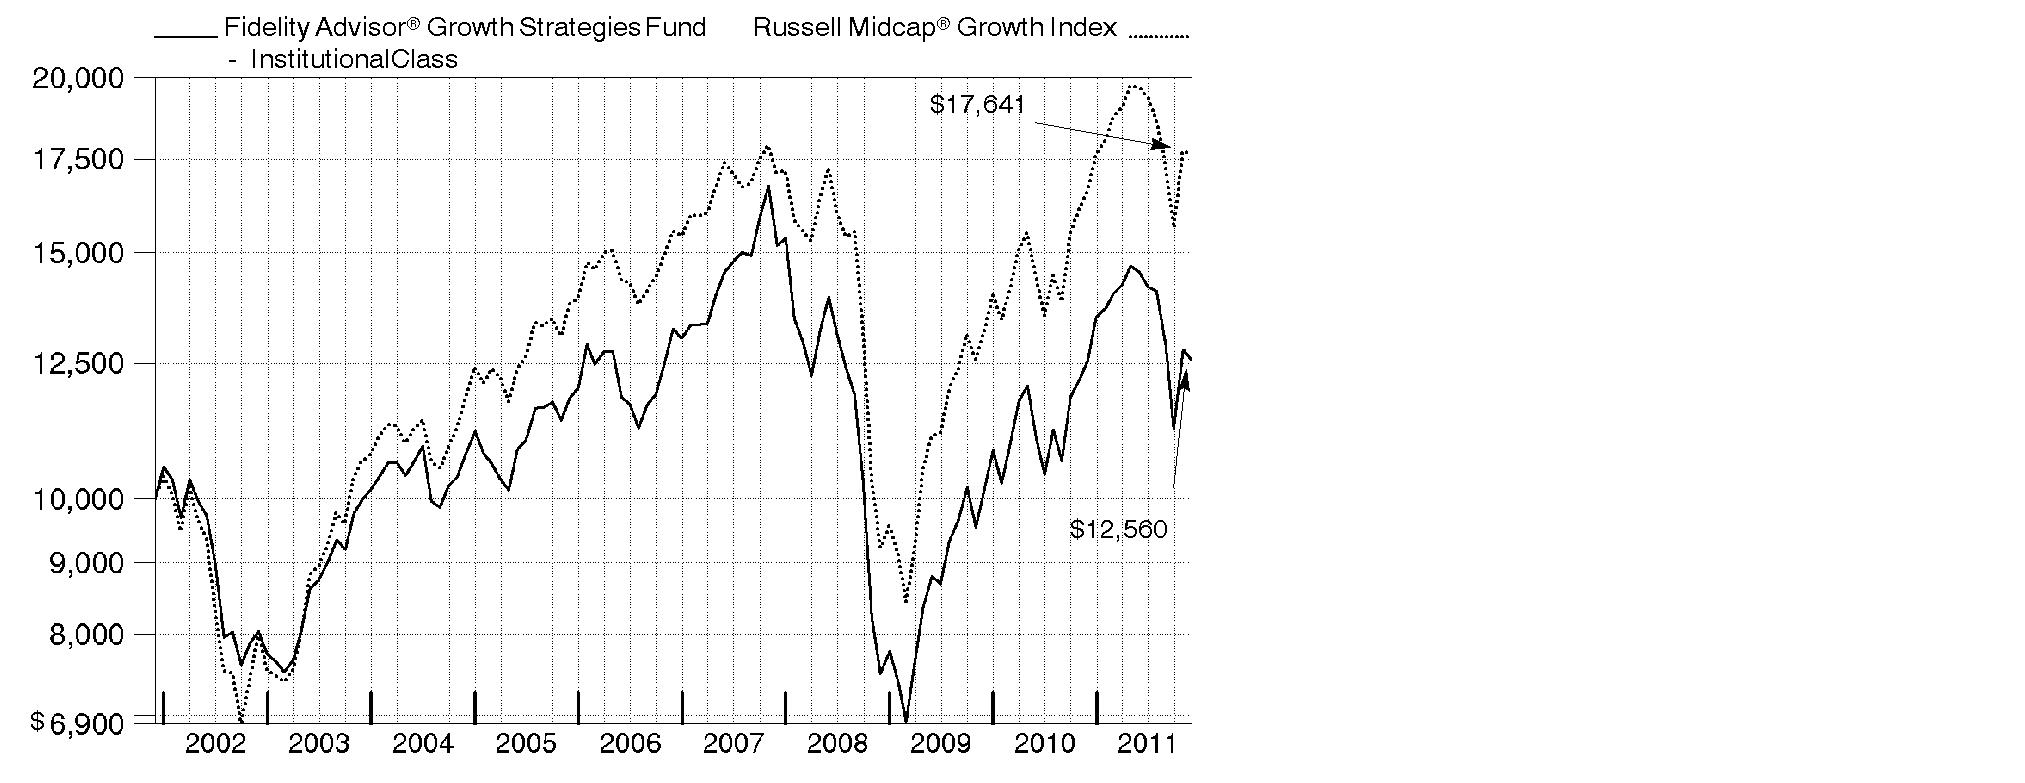
Institutional Class | 0.11% | -1.02% | 2.31% |
$10,000 Over 10 Years
Let's say hypothetically that $10,000 was invested in Fidelity Advisor® Growth Strategies Fund - Institutional Class on November 30, 2001. The chart shows how the value of your investment would have changed, and also shows how the Russell Midcap® Growth Index performed over the same period.
Annual Report
Market Recap: U.S. stocks overcame a sharp summer drop to post solid gains for the year ending November 30, 2011. Bullishness in the first half of the period gave way to a sudden reversal in July and August, as debate over the U.S. debt ceiling, a downgrade of the country's long-term sovereign credit rating and more debt woes in Europe led the S&P 500® Index to its worst calendar-quarter finish in almost three years. However, in October, a possible solution to the eurozone debt crisis and encouraging U.S. economic data fueled a rally that pushed the broad-based index up roughly 11%, its highest monthly return since December 1991. Although a Congressional stalemate over deficit reductions kept volatility alive in November, the S&P 500® finished the year up 7.83%, while the blue-chip Dow Jones Industrial AverageSM added 12.39% and the technology-heavy Nasdaq Composite® Index rose 5.93%. Within the S&P 500®, sector performance was mixed, with financials (-10%) struggling, while the defensive utilities (+20%) and consumer staples (+16%) segments fared best. Small and mid-sized stocks posted more-modest gains than their large-cap counterparts, with the Russell 2000® and Russell Midcap® indexes adding 2.75% and 5.39%, respectively. Uncertainty in Europe hurt foreign developed-markets stocks, as the MSCI® EAFE® (Europe, Australasia, Far East) Index fell 4.01%.
Comments from Steven Calhoun, Portfolio Manager of Fidelity Advisor® Growth Strategies Fund: During the year, the fund's Institutional Class shares returned 0.11%, significantly trailing the 6.07% gain of the Russell Midcap® Growth Index. Versus the index, the biggest head wind was weak stock picking in the consumer discretionary sector. My picks in energy, financials and industrials also detracted. Biotechnology firm Human Genome Sciences was the largest individual detractor. The company's launch of its lupus drug, BENLYSTA®, failed to meet the market's expectations. Other detractors included untimely ownership of online travel site Expedia, which I sold, and positions in China-based seed supplier Origin Agritech and Ultrapetrol (Bahamas), a marine transportation provider. Conversely, positioning in information technology and consumer staples bolstered performance the most. U.K.-based Autonomy - a maker of information management software - was the largest relative contributor, boosted in August by a lucrative takeover bid from Hewlett-Packard. I sold the stock before the deal closed in October. Also lifting our results were biopharmaceutical firm Inhibitex and Heckmann, which transports and remediates waste water created when natural gas is extracted from shale beds. Most of the stocks I've mentioned were not part of the benchmark.
The views expressed above reflect those of the portfolio manager(s) only through the end of the period as stated on the cover of this report and do not necessarily represent the views of Fidelity or any other person in the Fidelity organization. Any such views are subject to change at any time based upon market or other conditions and Fidelity disclaims any responsibility to update such views. These views may not be relied on as investment advice and, because investment decisions for a Fidelity fund are based on numerous factors, may not be relied on as an indication of trading intent on behalf of any Fidelity fund.
Annual Report
Shareholder Expense Example
As a shareholder of the Fund, you incur two types of costs: (1) transaction costs, including sales charges (loads) on purchase payments or redemption proceeds, and (2) ongoing costs, including management fees, distribution and/or service (12b-1) fees and other Fund expenses. This Example is intended to help you understand your ongoing costs (in dollars) of investing in the Fund and to compare these costs with the ongoing costs of investing in other mutual funds.
The Example is based on an investment of $1,000 invested at the beginning of the period and held for the entire period (June 1, 2011 to November 30, 2011).
Actual Expenses
The first line of the accompanying table for each class of the Fund provides information about actual account values and actual expenses. You may use the information in this line, together with the amount you invested, to estimate the expenses that you paid over the period. Simply divide your account value by $1,000.00 (for example, an $8,600 account value divided by $1,000.00 = 8.6), then multiply the result by the number in the first line for a class of the Fund under the heading entitled "Expenses Paid During Period" to estimate the expenses you paid on your account during this period. In addition, the Fund, as a shareholder in the underlying Fidelity Central Funds, will indirectly bear its pro-rata share of the fees and expenses incurred by the underlying Fidelity Central Funds. These fees and expenses are not included in the Fund's annualized expense ratio used to calculate the expense estimate in the table below.
Hypothetical Example for Comparison Purposes
The second line of the accompanying table for each class of the Fund provides information about hypothetical account values and hypothetical expenses based on a Class' actual expense ratio and an assumed rate of return of 5% per year before expenses, which is not the Class' actual return. The hypothetical account values and expenses may not be used to estimate the actual ending account balance or expenses you paid for the period. You may use this information to compare the ongoing costs of investing in the Fund and other funds. To do so, compare this 5% hypothetical example with the 5% hypothetical examples that appear in the shareholder reports of the other funds. In addition, the Fund, as a shareholder in the underlying Fidelity Central Funds, will indirectly bear its pro-rata share of the fees and expenses incurred by the underlying Fidelity Central Funds. These fees and expenses are not included in the Fund's annualized expense ratio used to calculate the expense estimate in the table below.
Please note that the expenses shown in the table are meant to highlight your ongoing costs only and do not reflect any transaction costs. Therefore, the second line of the table is useful in comparing ongoing costs only, and will not help you determine the relative total costs of owning different funds. In addition, if these transactional costs were included, your costs would have been higher.
Annual Report
Shareholder Expense Example - continued
| Annualized
Expense Ratio | Beginning
Account Value
June 1, 2011 | Ending
Account Value
November 30, 2011 | Expenses Paid
During Period*
June 1, 2011 to
November 30, 2011 |
Class A | 1.25% | | | |
Actual | | $ 1,000.00 | $ 863.10 | $ 5.84 |
HypotheticalA | | $ 1,000.00 | $ 1,018.80 | $ 6.33 |
Class T | 1.50% | | | |
Actual | | $ 1,000.00 | $ 861.60 | $ 7.00 |
HypotheticalA | | $ 1,000.00 | $ 1,017.55 | $ 7.59 |
Class B | 2.00% | | | |
Actual | | $ 1,000.00 | $ 859.90 | $ 9.32 |
HypotheticalA | | $ 1,000.00 | $ 1,015.04 | $ 10.10 |
Class C | 2.00% | | | |
Actual | | $ 1,000.00 | $ 859.90 | $ 9.32 |
HypotheticalA | | $ 1,000.00 | $ 1,015.04 | $ 10.10 |
Institutional Class | 1.00% | | | |
Actual | | $ 1,000.00 | $ 864.30 | $ 4.67 |
HypotheticalA | | $ 1,000.00 | $ 1,020.05 | $ 5.06 |
A 5% return per year before expenses
* Expenses are equal to each Class' annualized expense ratio, multiplied by the average account value over the period, multiplied by 183/365 (to reflect the one-half year period).
Annual Report
Investment Changes (Unaudited)
Top Ten Stocks as of November 30, 2011 |
| % of fund's
net assets | % of fund's net assets
6 months ago |
Walter Energy, Inc. | 2.1 | 0.0 |
Cyberonics, Inc. | 2.1 | 1.0 |
Alpha Natural Resources, Inc. | 2.0 | 0.0 |
Heckmann Corp. | 2.0 | 1.3 |
ArthroCare Corp. | 2.0 | 1.1 |
Citrix Systems, Inc. | 1.8 | 0.0 |
CNH Global NV | 1.7 | 1.0 |
Bumi PLC | 1.7 | 1.6 |
Ingersoll-Rand Co. Ltd. | 1.6 | 1.0 |
CVR Partners LP | 1.5 | 1.1 |
| 18.5 | |
Top Five Market Sectors as of November 30, 2011 |
| % of fund's
net assets | % of fund's net assets
6 months ago |
Information Technology | 22.1 | 19.0 |
Consumer Discretionary | 17.5 | 21.0 |
Health Care | 15.1 | 12.5 |
Energy | 14.1 | 12.5 |
Industrials | 12.6 | 12.5 |
Asset Allocation (% of fund's net assets) |
As of November 30, 2011 * | As of May 31, 2011 ** |
 | Stocks 97.9% | | | Stocks 99.5% | |
 | Short-Term
Investments and
Net Other Assets 2.1% | | | Short-Term
Investments and
Net Other Assets 0.5% | |
* Foreign investments | 10.7% | | ** Foreign investments | 20.5% | |

Annual Report
Investments November 30, 2011
Showing Percentage of Net Assets
Common Stocks - 97.9% |
| Shares | | Value |
CONSUMER DISCRETIONARY - 17.5% |
Automobiles - 0.8% |
Tesla Motors, Inc. (a) | 8,219 | | $ 269,090 |
Diversified Consumer Services - 1.0% |
Weight Watchers International, Inc. | 5,419 | | 318,475 |
Hotels, Restaurants & Leisure - 2.1% |
BJ's Restaurants, Inc. (a) | 3,489 | | 167,751 |
Buffalo Wild Wings, Inc. (a) | 2,700 | | 174,096 |
Panera Bread Co. Class A (a) | 1,529 | | 219,228 |
Texas Roadhouse, Inc. Class A | 11,300 | | 151,307 |
| | 712,382 |
Media - 1.0% |
Discovery Communications, Inc. (a) | 7,987 | | 335,294 |
Multiline Retail - 1.1% |
Dollar Tree, Inc. (a) | 4,424 | | 360,512 |
Specialty Retail - 5.7% |
Abercrombie & Fitch Co. Class A | 4,773 | | 228,674 |
Body Central Corp. (a) | 8,111 | | 173,413 |
Limited Brands, Inc. | 9,835 | | 416,316 |
Tiffany & Co., Inc. | 6,986 | | 468,341 |
Tractor Supply Co. | 5,438 | | 392,787 |
Ulta Salon, Cosmetics & Fragrance, Inc. (a) | 2,800 | | 194,964 |
| | 1,874,495 |
Textiles, Apparel & Luxury Goods - 5.8% |
Liz Claiborne, Inc. (a)(d) | 44,767 | | 370,223 |
PVH Corp. | 5,448 | | 369,865 |
Ralph Lauren Corp. | 3,294 | | 467,287 |
Under Armour, Inc. Class A (sub. vtg.) (a) | 4,524 | | 367,937 |
Warnaco Group, Inc. (a) | 6,700 | | 339,623 |
| | 1,914,935 |
TOTAL CONSUMER DISCRETIONARY | | 5,785,183 |
CONSUMER STAPLES - 4.8% |
Beverages - 0.5% |
Hansen Natural Corp. (a) | 1,917 | | 176,747 |
Food & Staples Retailing - 1.4% |
Whole Foods Market, Inc. | 7,000 | | 476,700 |
Common Stocks - continued |
| Shares | | Value |
CONSUMER STAPLES - continued |
Food Products - 2.4% |
Green Mountain Coffee Roasters, Inc. (a)(d) | 6,081 | | $ 318,827 |
Mead Johnson Nutrition Co. Class A | 4,553 | | 343,114 |
Origin Agritech Ltd. (a) | 43,886 | | 113,226 |
| | 775,167 |
Tobacco - 0.5% |
Lorillard, Inc. | 1,531 | | 170,890 |
TOTAL CONSUMER STAPLES | | 1,599,504 |
ENERGY - 14.1% |
Energy Equipment & Services - 3.3% |
Cameron International Corp. (a) | 6,700 | | 361,733 |
Dresser-Rand Group, Inc. (a) | 7,453 | | 388,078 |
Rowan Companies, Inc. (a) | 10,100 | | 342,491 |
| | 1,092,302 |
Oil, Gas & Consumable Fuels - 10.8% |
Alpha Natural Resources, Inc. (a) | 27,434 | | 658,416 |
Amyris, Inc. (a)(d) | 10,264 | | 115,675 |
Bumi PLC | 39,947 | | 549,816 |
Cabot Oil & Gas Corp. | 4,800 | | 425,232 |
EV Energy Partners LP | 4,738 | | 323,369 |
EXCO Resources, Inc. (d) | 32,486 | | 386,908 |
Oasis Petroleum, Inc. (a)(d) | 10,666 | | 324,993 |
QEP Resources, Inc. | 9,600 | | 313,440 |
Range Resources Corp. | 4,800 | | 344,208 |
Solazyme, Inc. (d) | 10,000 | | 116,700 |
| | 3,558,757 |
TOTAL ENERGY | | 4,651,059 |
FINANCIALS - 1.1% |
Real Estate Investment Trusts - 1.0% |
SL Green Realty Corp. | 4,873 | | 320,838 |
Real Estate Management & Development - 0.1% |
Altisource Portfolio Solutions SA (a) | 700 | | 33,327 |
TOTAL FINANCIALS | | 354,165 |
Common Stocks - continued |
| Shares | | Value |
HEALTH CARE - 15.1% |
Biotechnology - 6.5% |
Alexion Pharmaceuticals, Inc. (a) | 4,749 | | $ 326,066 |
Human Genome Sciences, Inc. (a) | 29,638 | | 227,323 |
Idenix Pharmaceuticals, Inc. (a) | 49,945 | | 379,582 |
Inhibitex, Inc. (a) | 26,246 | | 383,192 |
Theravance, Inc. (a) | 8,300 | | 193,722 |
United Therapeutics Corp. (a) | 7,800 | | 319,098 |
Vertex Pharmaceuticals, Inc. (a) | 11,300 | | 327,587 |
| | 2,156,570 |
Health Care Equipment & Supplies - 7.8% |
ArthroCare Corp. (a) | 21,730 | | 647,771 |
Cyberonics, Inc. (a) | 23,073 | | 699,804 |
Insulet Corp. (a) | 9,488 | | 176,287 |
NuVasive, Inc. (a) | 30,343 | | 418,733 |
Volcano Corp. (a) | 6,558 | | 161,786 |
Zeltiq Aesthetics, Inc. | 5,349 | | 76,491 |
Zoll Medical Corp. (a) | 8,502 | | 391,347 |
| | 2,572,219 |
Health Care Technology - 0.8% |
Merge Healthcare, Inc. (a) | 49,572 | | 268,185 |
TOTAL HEALTH CARE | | 4,996,974 |
INDUSTRIALS - 12.6% |
Aerospace & Defense - 1.1% |
BE Aerospace, Inc. (a) | 9,400 | | 366,130 |
Building Products - 2.5% |
Lennox International, Inc. | 12,080 | | 400,210 |
Owens Corning (a) | 14,400 | | 413,280 |
| | 813,490 |
Construction & Engineering - 1.0% |
Fluor Corp. | 6,200 | | 339,884 |
Electrical Equipment - 2.4% |
Cooper Industries PLC Class A | 7,400 | | 410,922 |
Roper Industries, Inc. | 4,700 | | 400,393 |
| | 811,315 |
Machinery - 5.2% |
CNH Global NV (a) | 14,326 | | 569,029 |
IDEX Corp. | 5,900 | | 215,114 |
Common Stocks - continued |
| Shares | | Value |
INDUSTRIALS - continued |
Machinery - continued |
Ingersoll-Rand PLC | 16,475 | | $ 545,652 |
WABCO Holdings, Inc. (a) | 8,490 | | 399,115 |
| | 1,728,910 |
Marine - 0.4% |
Ultrapetrol (Bahamas) Ltd. (a) | 45,157 | | 122,375 |
TOTAL INDUSTRIALS | | 4,182,104 |
INFORMATION TECHNOLOGY - 22.1% |
Communications Equipment - 1.6% |
Polycom, Inc. (a) | 22,475 | | 379,828 |
Riverbed Technology, Inc. (a) | 5,100 | | 132,600 |
| | 512,428 |
Computers & Peripherals - 0.9% |
SanDisk Corp. (a) | 5,800 | | 285,998 |
Electronic Equipment & Components - 1.0% |
Maxwell Technologies, Inc. (a) | 18,874 | | 320,292 |
Internet Software & Services - 2.7% |
Blinkx PLC (a) | 74,691 | | 87,915 |
Rackspace Hosting, Inc. (a) | 7,948 | | 344,784 |
Velti PLC (a) | 12,443 | | 92,078 |
VeriSign, Inc. | 10,900 | | 366,022 |
| | 890,799 |
IT Services - 1.1% |
Cognizant Technology Solutions Corp. Class A (a) | 5,361 | | 361,063 |
Semiconductors & Semiconductor Equipment - 5.0% |
ASML Holding NV | 4,200 | | 166,026 |
Ceva, Inc. (a) | 10,638 | | 306,481 |
Freescale Semiconductor Holdings I Ltd. | 10,200 | | 129,234 |
KLA-Tencor Corp. | 5,900 | | 271,990 |
Lam Research Corp. (a) | 6,100 | | 248,697 |
NVIDIA Corp. (a) | 24,600 | | 384,498 |
NXP Semiconductors NV (a) | 9,600 | | 162,240 |
| | 1,669,166 |
Software - 9.8% |
ANSYS, Inc. (a) | 7,229 | | 447,981 |
Ariba, Inc. (a) | 6,500 | | 197,275 |
Autodesk, Inc. (a) | 11,200 | | 381,584 |
Citrix Systems, Inc. (a) | 8,535 | | 609,314 |
Common Stocks - continued |
| Shares | | Value |
INFORMATION TECHNOLOGY - continued |
Software - continued |
Informatica Corp. (a) | 7,903 | | $ 355,279 |
Intuit, Inc. | 8,200 | | 436,568 |
Magma Design Automation, Inc. (a) | 79,157 | | 452,778 |
Nuance Communications, Inc. (a) | 6,814 | | 167,488 |
Rovi Corp. (a) | 7,456 | | 206,904 |
| | 3,255,171 |
TOTAL INFORMATION TECHNOLOGY | | 7,294,917 |
MATERIALS - 8.6% |
Chemicals - 4.9% |
CF Industries Holdings, Inc. | 2,157 | | 301,549 |
CVR Partners LP | 21,673 | | 496,312 |
Monsanto Co. | 4,400 | | 323,180 |
Rentech Nitrogen Partners LP | 8,500 | | 161,500 |
The Mosaic Co. | 6,200 | | 327,112 |
| | 1,609,653 |
Metals & Mining - 3.7% |
First Quantum Minerals Ltd. | 11,900 | | 240,345 |
Genel Energy PLC | 5,500 | | 75,959 |
Ivanhoe Mines Ltd. (a) | 10,400 | | 224,325 |
Walter Energy, Inc. (d) | 9,800 | | 702,661 |
| | 1,243,290 |
TOTAL MATERIALS | | 2,852,943 |
UTILITIES - 2.0% |
Water utilities - 2.0% |
Heckmann Corp. (a)(d) | 111,797 | | 654,012 |
TOTAL COMMON STOCKS (Cost $34,527,195) |
32,370,861
|
Money Market Funds - 10.4% |
| Shares | | Value |
Fidelity Cash Central Fund, 0.11% (b) | 920,565 | | $ 920,565 |
Fidelity Securities Lending Cash Central Fund, 0.11% (b)(c) | 2,510,847 | | 2,510,847 |
TOTAL MONEY MARKET FUNDS (Cost $3,431,412) |
3,431,412
|
TOTAL INVESTMENT PORTFOLIO - 108.3% (Cost $37,958,607) | | 35,802,273 |
NET OTHER ASSETS (LIABILITIES) - (8.3)% | | (2,728,867) |
NET ASSETS - 100% | $ 33,073,406 |
Legend |
(a) Non-income producing |
(b) Affiliated fund that is available only to investment companies and other accounts managed by Fidelity Investments. The rate quoted is the annualized seven-day yield of the fund at period end. A complete unaudited listing of the fund's holdings as of its most recent quarter end is available upon request. In addition, each Fidelity Central Fund's financial statements, which are not covered by the Fund's Report of Independent Registered Public Accounting Firm, are available on the SEC's website or upon request. |
(c) Investment made with cash collateral received from securities on loan. |
(d) Security or a portion of the security is on loan at period end. |
Affiliated Central Funds |
Information regarding fiscal year to date income earned by the Fund from investments in Fidelity Central Funds is as follows: |
Fund | Income earned |
Fidelity Cash Central Fund | $ 892 |
Fidelity Securities Lending Cash Central Fund | 6,036 |
Total | $ 6,928 |
Other Information |
All investments are categorized as Level 1 under the Fair Value Hierarchy. The inputs or methodology used for valuing securities may not be an indication of the risk associated with investing in those securities. For more information on valuation inputs, please refer to the Security Valuation section in the accompanying Notes to Financial Statements. |
The following is a reconciliation of Investments in Securities for which Level 3 inputs were used in determining value: |
Investments in Securities: | |
Beginning Balance | $ 157,298 |
Total Realized Gain (Loss) | - |
Total Unrealized Gain (Loss) | - |
Cost of Purchases | - |
Proceeds of Sales | (157,298) |
Amortization/Accretion | - |
Transfers in to Level 3 | - |
Transfers out of Level 3 | - |
Ending Balance | $ - |
The change in unrealized gain (loss) for the period attributable to Level 3 securities held at November 30, 2011 | $ - |
The information used in the above reconciliation represents fiscal year to date activity for any Investments in Securities identified as using Level 3 inputs at either the beginning or the end of the current fiscal period. Transfers in or out of Level 3 represent the beginning value of any Security or Instrument where a change in the pricing level occurred from the beginning to the end of the period. The cost of purchases and the proceeds of sales may include securities received or delivered through corporate actions or exchanges. Realized and unrealized gains (losses) disclosed in the reconciliation are included in Net Gain (Loss) on the Fund's Statement of Operations. |
Distribution of investments by country of issue, as a percentage of total net assets, is as follows: (Unaudited) |
United States of America | 89.3% |
Ireland | 2.8% |
Netherlands | 2.7% |
United Kingdom | 2.2% |
Canada | 1.4% |
Others (Individually Less Than 1%) | 1.6% |
| 100.0% |
Income Tax Information |
At November 30, 2011, the Fund had a capital loss carryforward of approximately $3,661,318 of which $3,410,913 and $250,405 will expire in fiscal 2016 and 2017, respectively. Capital loss carryforwards are only available to offset future capital gains of the Fund to the extent provided by regulations and may be limited. |
See accompanying notes which are an integral part of the financial statements.
Annual Report
Statement of Assets and Liabilities
| November 30, 2011 |
| | |
Assets | | |
Investment in securities, at value (including securities loaned of $2,591,651) - See accompanying schedule: Unaffiliated issuers (cost $34,527,195) | $ 32,370,861 | |
Fidelity Central Funds (cost $3,431,412) | 3,431,412 | |
Total Investments (cost $37,958,607) | | $ 35,802,273 |
Receivable for investments sold | | 452,172 |
Receivable for fund shares sold | | 33,094 |
Dividends receivable | | 13,342 |
Distributions receivable from Fidelity Central Funds | | 1,386 |
Prepaid expenses | | 123 |
Other receivables | | 1,129 |
Total assets | | 36,303,519 |
| | |
Liabilities | | |
Payable for investments purchased | $ 496,387 | |
Payable for fund shares redeemed | 139,987 | |
Accrued management fee | 13,421 | |
Distribution and service plan fees payable | 14,118 | |
Other affiliated payables | 8,961 | |
Other payables and accrued expenses | 46,392 | |
Collateral on securities loaned, at value | 2,510,847 | |
Total liabilities | | 3,230,113 |
| | |
Net Assets | | $ 33,073,406 |
Net Assets consist of: | | |
Paid in capital | | $ 39,180,057 |
Accumulated net investment loss | | (13) |
Accumulated undistributed net realized gain (loss) on investments and foreign currency transactions | | (3,950,217) |
Net unrealized appreciation (depreciation) on investments and assets and liabilities in foreign currencies | | (2,156,421) |
Net Assets | | $ 33,073,406 |
See accompanying notes which are an integral part of the financial statements.
Annual Report
Statement of Assets and Liabilities - continued
| November 30, 2011 |
| | |
Calculation of Maximum Offering Price Class A:
Net Asset Value and redemption price per share ($10,792,025 ÷ 1,221,790 shares) | | $ 8.83 |
| | |
Maximum offering price per share (100/94.25 of $8.83) | | $ 9.37 |
Class T:
Net Asset Value and redemption price per share ($14,670,819 ÷ 1,707,516 shares) | | $ 8.59 |
| | |
Maximum offering price per share (100/96.50 of $8.59) | | $ 8.90 |
Class B:
Net Asset Value and offering price per share ($2,120,392 ÷ 259,823 shares)A | | $ 8.16 |
| | |
Class C:
Net Asset Value and offering price per share ($4,869,544 ÷ 596,486 shares)A | | $ 8.16 |
| | |
Institutional Class:
Net Asset Value, offering price and redemption price per share ($620,626 ÷ 68,142 shares) | | $ 9.11 |
A Redemption price per share is equal to net asset value less any applicable contingent deferred sales charge.
See accompanying notes which are an integral part of the financial statements.
Annual Report
Financial Statements - continued
Statement of Operations
| Year ended November 30, 2011 |
| | |
Investment Income | | |
Dividends | | $ 196,708 |
Interest | | 1 |
Income from Fidelity Central Funds | | 6,928 |
Total income | | 203,637 |
| | |
Expenses | | |
Management fee
Basic fee | $ 220,305 | |
Performance adjustment | (58,076) | |
Transfer agent fees | 117,754 | |
Distribution and service plan fees | 191,543 | |
Accounting and security lending fees | 14,308 | |
Custodian fees and expenses | 24,148 | |
Independent trustees' compensation | 202 | |
Registration fees | 59,208 | |
Audit | 62,247 | |
Legal | 233 | |
Miscellaneous | 332 | |
Total expenses before reductions | 632,204 | |
Expense reductions | (83,665) | 548,539 |
Net investment income (loss) | | (344,902) |
Realized and Unrealized Gain (Loss) Net realized gain (loss) on: | | |
Investment securities: | | |
Unaffiliated issuers | 5,072,861 | |
Foreign currency transactions | 1,784 | |
Total net realized gain (loss) | | 5,074,645 |
Change in net unrealized appreciation (depreciation) on: Investment securities | (4,750,746) | |
Assets and liabilities in foreign currencies | (88) | |
Total change in net unrealized appreciation (depreciation) | | (4,750,834) |
Net gain (loss) | | 323,811 |
Net increase (decrease) in net assets resulting from operations | | $ (21,091) |
See accompanying notes which are an integral part of the financial statements.
Annual Report
Statement of Changes in Net Assets
| Year ended
November 30,
2011 | Year ended
November 30,
2010 |
Increase (Decrease) in Net Assets | | |
Operations | | |
Net investment income (loss) | $ (344,902) | $ (348,051) |
Net realized gain (loss) | 5,074,645 | 4,572,068 |
Change in net unrealized appreciation (depreciation) | (4,750,834) | 2,310,518 |
Net increase (decrease) in net assets resulting
from operations | (21,091) | 6,534,535 |
Share transactions - net increase (decrease) | (1,727,692) | (1,781,693) |
Total increase (decrease) in net assets | (1,748,783) | 4,752,842 |
| | |
Net Assets | | |
Beginning of period | 34,822,189 | 30,069,347 |
End of period (including accumulated net investment loss of $13 and $0, respectively) | $ 33,073,406 | $ 34,822,189 |
See accompanying notes which are an integral part of the financial statements.
Annual Report
Financial Highlights - Class A
Years ended November 30, | 2011 | 2010 | 2009 | 2008 | 2007 |
Selected Per-Share Data | | | | |
Net asset value, beginning of period | $ 8.84 | $ 7.18 | $ 5.32 | $ 12.05 | $ 10.53 |
Income from Investment Operations | | | | | |
Net investment income (loss) C | (.06) | (.06) | (.04) F | (.02) G | (.10) |
Net realized and unrealized gain (loss) | .05 | 1.72 | 1.90 | (5.44) | 1.62 |
Total from investment operations | (.01) | 1.66 | 1.86 | (5.46) | 1.52 |
Distributions from net realized gain | - | - | - | (1.27) | - |
Net asset value, end of period | $ 8.83 | $ 8.84 | $ 7.18 | $ 5.32 | $ 12.05 |
Total Return A, B | (.11)% | 23.12% | 34.96% | (50.65)% | 14.43% |
Ratios to Average Net Assets D, H | | | | |
Expenses before reductions | 1.45% | 1.43% | 1.68% | 1.63% | 1.53% |
Expenses net of fee waivers, if any | 1.25% | 1.30% | 1.30% | 1.30% | 1.30% |
Expenses net of all reductions | 1.24% | 1.29% | 1.28% | 1.28% | 1.29% |
Net investment income (loss) | (.67)% | (.77)% | (.58)% F | (.21)% G | (.85)% |
Supplemental Data | | | | |
Net assets, end of period (000 omitted) | $ 10,792 | $ 10,971 | $ 9,369 | $ 6,492 | $ 12,665 |
Portfolio turnover rate E | 176% | 123% | 301% | 276% | 177% |
A Total returns would have been lower if certain expenses had not been reduced during the applicable periods shown.
B Total returns do not include the effect of the sales charges.
C Calculated based on average shares outstanding during the period.
D Fees and expenses of any underlying Fidelity Central Funds are not included in the Fund's expense ratio. The Fund indirectly bears its proportionate share of the expenses of any underlying Fidelity Central Funds.
E Amount does not include the portfolio activity of any underlying Fidelity Central Funds.
F Investment income per share reflects a special dividend which amounted to $.01 per share. Excluding the special dividend, the ratio of net investment income (loss) to average net assets would have been (.66)%.
G Investment income per share reflects a special dividend which amounted to $.01 per share. Excluding the special dividend, the ratio of net investment income (loss) to average net assets would have been (.34)%.
H Expense ratios reflect operating expenses of the class. Expenses before reductions do not reflect amounts reimbursed by the investment adviser or reductions from brokerage service arrangements or reductions from other expense offset arrangements and do not represent the amount paid by the class during periods when reimbursements or reductions occur. Expenses net of fee waivers reflect expenses after reimbursement by the investment adviser but prior to reductions from brokerage service arrangements or other expense offset arrangements. Expenses net of all reductions represent the net expenses paid by the class.
See accompanying notes which are an integral part of the financial statements.
Annual Report
Financial Highlights - Class T
Years ended November 30, | 2011 | 2010 | 2009 | 2008 | 2007 |
Selected Per-Share Data | | | | |
Net asset value, beginning of period | $ 8.62 | $ 7.02 | $ 5.21 | $ 11.83 | $ 10.36 |
Income from Investment Operations | | | | | |
Net investment income (loss) C | (.08) | (.08) | (.05) F | (.04) G | (.12) |
Net realized and unrealized gain (loss) | .05 | 1.68 | 1.86 | (5.34) | 1.59 |
Total from investment operations | (.03) | 1.60 | 1.81 | (5.38) | 1.47 |
Distributions from net realized gain | - | - | - | (1.24) | - |
Net asset value, end of period | $ 8.59 | $ 8.62 | $ 7.02 | $ 5.21 | $ 11.83 |
Total Return A, B | (.35)% | 22.79% | 34.74% | (50.81)% | 14.19% |
Ratios to Average Net Assets D, H | | | | |
Expenses before reductions | 1.75% | 1.73% | 2.04% | 1.94% | 1.88% |
Expenses net of fee waivers, if any | 1.50% | 1.55% | 1.55% | 1.55% | 1.55% |
Expenses net of all reductions | 1.49% | 1.54% | 1.53% | 1.53% | 1.54% |
Net investment income (loss) | (.92)% | (1.02)% | (.83)% F | (.46)% G | (1.10)% |
Supplemental Data | | | | |
Net assets, end of period (000 omitted) | $ 14,671 | $ 14,612 | $ 12,462 | $ 9,388 | $ 19,144 |
Portfolio turnover rate E | 176% | 123% | 301% | 276% | 177% |
A Total returns would have been lower if certain expenses had not been reduced during the applicable periods shown.
B Total returns do not include the effect of the sales charges.
C Calculated based on average shares outstanding during the period.
D Fees and expenses of any underlying Fidelity Central Funds are not included in the Fund's expense ratio. The Fund indirectly bears its proportionate share of the expenses of any underlying Fidelity Central Funds.
E Amount does not include the portfolio activity of any underlying Fidelity Central Funds.
F Investment income per share reflects a special dividend which amounted to $.01 per share. Excluding the special dividend, the ratio of net investment income (loss) to average net assets would have been (.91)%.
G Investment income per share reflects a special dividend which amounted to $.01 per share. Excluding the special dividend, the ratio of net investment income (loss) to average net assets would have been (.59)%.
H Expense ratios reflect operating expenses of the class. Expenses before reductions do not reflect amounts reimbursed by the investment adviser or reductions from brokerage service arrangements or reductions from other expense offset arrangements and do not represent the amount paid by the class during periods when reimbursements or reductions occur. Expenses net of fee waivers reflect expenses after reimbursement by the investment adviser but prior to reductions from brokerage service arrangements or other expense offset arrangements. Expenses net of all reductions represent the net expenses paid by the class.
See accompanying notes which are an integral part of the financial statements.
Annual Report
Financial Highlights - Class B
Years ended November 30, | 2011 | 2010 | 2009 | 2008 | 2007 |
Selected Per-Share Data | | | | |
Net asset value, beginning of period | $ 8.23 | $ 6.74 | $ 5.02 | $ 11.44 | $ 10.06 |
Income from Investment Operations | | | | | |
Net investment income (loss) C | (.13) | (.11) | (.08) F | (.08) G | (.17) |
Net realized and unrealized gain (loss) | .06 | 1.60 | 1.80 | (5.17) | 1.55 |
Total from investment operations | (.07) | 1.49 | 1.72 | (5.25) | 1.38 |
Distributions from net realized gain | - | - | - | (1.17) | - |
Net asset value, end of period | $ 8.16 | $ 8.23 | $ 6.74 | $ 5.02 | $ 11.44 |
Total Return A, B | (.85)% | 22.11% | 34.26% | (51.11)% | 13.72% |
Ratios to Average Net Assets D, H | | | | |
Expenses before reductions | 2.20% | 2.18% | 2.47% | 2.39% | 2.28% |
Expenses net of fee waivers, if any | 2.00% | 2.05% | 2.05% | 2.05% | 2.05% |
Expenses net of all reductions | 1.99% | 2.04% | 2.03% | 2.04% | 2.04% |
Net investment income (loss) | (1.42)% | (1.52)% | (1.33)% F | (.96)% G | (1.60)% |
Supplemental Data | | | | |
Net assets, end of period (000 omitted) | $ 2,120 | $ 3,095 | $ 3,272 | $ 3,203 | $ 9,082 |
Portfolio turnover rate E | 176% | 123% | 301% | 276% | 177% |
A Total returns would have been lower if certain expenses had not been reduced during the applicable periods shown.
B Total returns do not include the effect of the contingent deferred sales charge.
C Calculated based on average shares outstanding during the period.
D Fees and expenses of any underlying Fidelity Central Funds are not included in the Fund's expense ratio. The Fund indirectly bears its proportionate share of the expenses of any underlying Fidelity Central Funds.
E Amount does not include the portfolio activity of any underlying Fidelity Central Funds.
F Investment income per share reflects a special dividend which amounted to $.01 per share. Excluding the special dividend, the ratio of net investment income (loss) to average net assets would have been (1.41)%.
G Investment income per share reflects a special dividend which amounted to $.01 per share. Excluding the special dividend, the ratio of net investment income (loss) to average net assets would have been (1.09)%.
H Expense ratios reflect operating expenses of the class. Expenses before reductions do not reflect amounts reimbursed by the investment adviser or reductions from brokerage service arrangements or reductions from other expense offset arrangements and do not represent the amount paid by the class during periods when reimbursements or reductions occur. Expenses net of fee waivers reflect expenses after reimbursement by the investment adviser but prior to reductions from brokerage service arrangements or other expense offset arrangements. Expenses net of all reductions represent the net expenses paid by the class.
See accompanying notes which are an integral part of the financial statements.
Annual Report
Financial Highlights - Class C
Years ended November 30, | 2011 | 2010 | 2009 | 2008 | 2007 |
Selected Per-Share Data | | | | |
Net asset value, beginning of period | $ 8.23 | $ 6.74 | $ 5.03 | $ 11.45 | $ 10.08 |
Income from Investment Operations | | | | | |
Net investment income (loss) C | (.12) | (.11) | (.08) F | (.08) G | (.18) |
Net realized and unrealized gain (loss) | .05 | 1.60 | 1.79 | (5.15) | 1.55 |
Total from investment operations | (.07) | 1.49 | 1.71 | (5.23) | 1.37 |
Distributions from net realized gain | - | - | - | (1.19) | - |
Net asset value, end of period | $ 8.16 | $ 8.23 | $ 6.74 | $ 5.03 | $ 11.45 |
Total Return A, B | (.85)% | 22.11% | 34.00% | (50.99)% | 13.59% |
Ratios to Average Net Assets D, H | | | | |
Expenses before reductions | 2.20% | 2.18% | 2.47% | 2.38% | 2.28% |
Expenses net of fee waivers, if any | 2.00% | 2.05% | 2.05% | 2.05% | 2.05% |
Expenses net of all reductions | 1.99% | 2.04% | 2.03% | 2.04% | 2.04% |
Net investment income (loss) | (1.42)% | (1.52)% | (1.33)% F | (.96)% G | (1.60)% |
Supplemental Data | | | | |
Net assets, end of period (000 omitted) | $ 4,870 | $ 5,604 | $ 4,603 | $ 3,703 | $ 8,270 |
Portfolio turnover rate E | 176% | 123% | 301% | 276% | 177% |
A Total returns would have been lower if certain expenses had not been reduced during the applicable periods shown.
B Total returns do not include the effect of the contingent deferred sales charge.
C Calculated based on average shares outstanding during the period.
D Fees and expenses of any underlying Fidelity Central Funds are not included in the Fund's expense ratio. The Fund indirectly bears its proportionate share of the expenses of any underlying Fidelity Central Funds.
E Amount does not include the portfolio activity of any underlying Fidelity Central Funds.
F Investment income per share reflects a special dividend which amounted to $.01 per share. Excluding the special dividend, the ratio of net investment income (loss) to average net assets would have been (1.41)%.
G Investment income per share reflects a special dividend which amounted to $.01 per share. Excluding the special dividend, the ratio of net investment income (loss) to average net assets would have been (1.09)%.
H Expense ratios reflect operating expenses of the class. Expenses before reductions do not reflect amounts reimbursed by the investment adviser or reductions from brokerage service arrangements or reductions from other expense offset arrangements and do not represent the amount paid by the class during periods when reimbursements or reductions occur. Expenses net of fee waivers reflect expenses after reimbursement by the investment adviser but prior to reductions from brokerage service arrangements or other expense offset arrangements. Expenses net of all reductions represent the net expenses paid by the class.
See accompanying notes which are an integral part of the financial statements.
Annual Report
Financial Highlights - Institutional Class
Years ended November 30, | 2011 | 2010 | 2009 | 2008 | 2007 |
Selected Per-Share Data | | | | |
Net asset value, beginning of period | $ 9.10 | $ 7.37 | $ 5.44 | $ 12.31 | $ 10.72 |
Income from Investment Operations | | | | | |
Net investment income (loss) B | (.04) | (.04) | (.02) E | - F, H | (.07) |
Net realized and unrealized gain (loss) | .05 | 1.77 | 1.95 | (5.57) | 1.66 |
Total from investment operations | .01 | 1.73 | 1.93 | (5.57) | 1.59 |
Distributions from net realized gain | - | - | - | (1.30) | - |
Net asset value, end of period | $ 9.11 | $ 9.10 | $ 7.37 | $ 5.44 | $ 12.31 |
Total Return A | .11% | 23.47% | 35.48% | (50.59)% | 14.83% |
Ratios to Average Net Assets C, G | | | | |
Expenses before reductions | 1.09% | 1.10% | 1.43% | 1.33% | 1.20% |
Expenses net of fee waivers, if any | 1.00% | 1.05% | 1.05% | 1.05% | 1.05% |
Expenses net of all reductions | .99% | 1.04% | 1.03% | 1.03% | 1.04% |
Net investment income (loss) | (.42)% | (.53)% | (.33)% E | .04% F | (.60)% |
Supplemental Data | | | | |
Net assets, end of period (000 omitted) | $ 621 | $ 542 | $ 362 | $ 338 | $ 959 |
Portfolio turnover rate D | 176% | 123% | 301% | 276% | 177% |
A Total returns would have been lower if certain expenses had not been reduced during the applicable periods shown.
B Calculated based on average shares outstanding during the period.
C Fees and expenses of any underlying Fidelity Central Funds are not included in the Fund's expense ratio. The Fund indirectly bears its proportionate share of the expenses of any underlying Fidelity Central Funds.
D Amount does not include the portfolio activity of any underlying Fidelity Central Funds.
E Investment income per share reflects a special dividend which amounted to $.01 per share. Excluding the special dividend, the ratio of net investment income (loss) to average net assets would have been (.42)%.
F Investment income per share reflects a special dividend which amounted to $.01 per share. Excluding the special dividend, the ratio of net investment income (loss) to average net assets would have been (.09)%.
G Expense ratios reflect operating expenses of the class. Expenses before reductions do not reflect amounts reimbursed by the investment adviser or reductions from brokerage service arrangements or reductions from other expense offset arrangements and do not represent the amount paid by the class during periods when reimbursements or reductions occur. Expenses net of fee waivers reflect expenses after reimbursement by the investment adviser but prior to reductions from brokerage service arrangements or other expense offset arrangements. Expenses net of all reductions represent the net expenses paid by the class.
H Amount represents less than $.01 per share.
See accompanying notes which are an integral part of the financial statements.
Annual Report
Notes to Financial Statements
For the period ended November 30, 2011
1. Organization.
Fidelity Advisor® Growth Strategies Fund (the Fund) is a fund of Fidelity Securities Fund (the Trust) and is authorized to issue an unlimited number of shares. The Trust is registered under the Investment Company Act of 1940, as amended (the 1940 Act), as an open-end management investment company organized as a Massachusetts business trust. The Fund offers Class A, Class T, Class C, and Institutional Class shares, each of which, along with Class B shares, has equal rights as to assets and voting privileges. Effective after the close of business on September 1, 2010, Class B shares were closed to new accounts and additional purchases, except for exchanges and reinvestments by existing shareholders. Each class has exclusive voting rights with respect to matters that affect that class. Class B shares will automatically convert to Class A shares after a holding period of seven years from the initial date of purchase. Investment income, realized and unrealized capital gains and losses, the common expenses of the Fund, and certain fund-level expense reductions, if any, are allocated on a pro-rata basis to each class based on the relative net assets of each class to the total net assets of the Fund. Each class differs with respect to transfer agent and distribution and service plan fees incurred. Certain expense reductions may also differ by class. The Fund's investments in emerging markets can be subject to social, economic, regulatory, and political uncertainties and can be extremely volatile.
2. Investments in Fidelity Central Funds.
The Fund invests in Fidelity Central Funds, which are open-end investment companies available only to other investment companies and accounts managed by Fidelity Management & Research Company (FMR) and its affiliates. The Fund's Schedule of Investments lists each of the Fidelity Central Funds held as of period end, if any, as an investment of the Fund, but does not include the underlying holdings of each Fidelity Central Fund. As an Investing Fund, the Fund indirectly bears its proportionate share of the expenses of the underlying Fidelity Central Funds.
The Money Market Central Funds seek preservation of capital and current income and are managed by Fidelity Investments Money Management, Inc. (FIMM), an affiliate of FMR.
A complete unaudited list of holdings for each Fidelity Central Fund is available upon request or at the Securities and Exchange Commission (the SEC) web site at www.sec.gov. In addition, the financial statements of the Fidelity Central Funds, which are not covered by the Fund's Report of Independent Registered Public Accounting Firm, are available on the SEC web site or upon request.
Annual Report
3. Significant Accounting Policies.
The financial statements have been prepared in conformity with accounting principles generally accepted in the United States of America (GAAP), which require management to make certain estimates and assumptions at the date of the financial statements. Actual results could differ from those estimates. Subsequent events, if any, through the date that the financial statements were issued have been evaluated in the preparation of the financial statements. The following summarizes the significant accounting policies of the Fund:
Security Valuation. Investments are valued as of 4:00 p.m. Eastern time on the last calendar day of the period. The Fund uses independent pricing services approved by the Board of Trustees to value its investments. When current market prices or quotations are not readily available or reliable, valuations may be determined in good faith in accordance with procedures adopted by the Board of Trustees. Factors used in determining value may include market or security specific events. The frequency with which these procedures are used cannot be predicted and they may be utilized to a significant extent. The value used for net asset value (NAV) calculation under these procedures may differ from published prices for the same securities.
The Fund categorizes the inputs to valuation techniques used to value its investments into a disclosure hierarchy consisting of three levels as shown below:
Level 1 - quoted prices in active markets for identical investments
Level 2 - other significant observable inputs (including quoted prices for similar investments, interest rates, prepayment speeds, etc.)
Level 3 - unobservable inputs (including the Fund's own assumptions based on the best information available)
Changes in valuation techniques may result in transfers in or out of an assigned level within the disclosure hierarchy. The aggregate value of investments by input level, as of November 30, 2011, as well as a roll forward of Level 3 securities, is included at the end of the Fund's Schedule of Investments. Valuation techniques used to value the Fund's investments by major category are as follows:
Equity securities, including restricted securities, for which market quotations are readily available, are valued at the last reported sale price or official closing price as reported by an independent pricing service on the primary market or exchange on which they are traded and are categorized as Level 1 in the hierarchy. In the event there were no sales during the day or closing prices are not available, securities are valued at the last quoted bid price or may be valued using the last available price and are generally categorized as Level 2 in the hierarchy. For foreign equity securities, when significant market or security specific events arise, comparisons to the valuation of American Depositary Receipts
Annual Report
Notes to Financial Statements - continued
3. Significant Accounting Policies - continued
Security Valuation - continued
(ADRs), futures contracts, Exchange-traded funds (ETFs) and certain indexes as well as quoted prices for similar securities are used and are categorized as Level 2 in the hierarchy in these circumstances. Utilizing these techniques may result in transfers between Level 1 and Level 2. For restricted equity securities and private placements where observable inputs are limited, assumptions about market activity and risk are used and are categorized as Level 3 in the hierarchy.
Investments in open-end mutual funds, including the Fidelity Central Funds, are valued at their closing net asset value each business day and are categorized as Level 1 in the hierarchy.
Foreign Currency. The Fund may use foreign currency contracts to facilitate transactions in foreign-denominated securities. Gains and losses from these transactions may arise from changes in the value of the foreign currency or if the counterparties do not perform under the contracts' terms.
Foreign-denominated assets, including investment securities, and liabilities are translated into U.S. dollars at the exchange rate at period end. Purchases and sales of investment securities, income and dividends received and expenses denominated in foreign currencies are translated into U.S. dollars at the exchange rate in effect on the transaction date.
The effects of exchange rate fluctuations on investments are included with the net realized and unrealized gain (loss) on investment securities. Other foreign currency transactions resulting in realized and unrealized gain (loss) are disclosed separately.
Investment Transactions and Income. For financial reporting purposes, the Fund's investment holdings and NAV include trades executed through the end of the last business day of the period. The NAV per share for processing shareholder transactions is calculated as of the close of business of the New York Stock Exchange (NYSE), normally 4:00 p.m. Eastern time and includes trades executed through the end of the prior business day. Gains and losses on securities sold are determined on the basis of identified cost and may include proceeds received from litigation. Dividend income is recorded on the ex-dividend date, except for certain dividends from foreign securities where the ex-dividend date may have passed, which are recorded as soon as the Fund is informed of the ex-dividend date. Non-cash dividends included in dividend income, if any, are recorded at the fair market value of the securities received. Distributions received on securities that represent a return of capital or capital gain are recorded as a reduction of cost of investments and/or as a realized gain. The Fund estimates the components of distributions received that may be considered return of capital distributions or capital gain distributions. Interest income and distributions from the Fidelity Central Funds are
Annual Report
3. Significant Accounting Policies - continued
Investment Transactions and Income - continued
accrued as earned. Interest income includes coupon interest and amortization of premium and accretion of discount on debt securities. Investment income is recorded net of foreign taxes withheld where recovery of such taxes is uncertain.
Expenses. Expenses directly attributable to a fund are charged to that fund. Expenses attributable to more than one fund are allocated among the respective funds on the basis of relative net assets or other appropriate methods. Expense estimates are accrued in the period to which they relate and adjustments are made when actual amounts are known.
Income Tax Information and Distributions to Shareholders. Each year, the Fund intends to qualify as a regulated investment company, including distributing substantially all of its taxable income and realized gains under Subchapter M of the Internal Revenue Code and filing its U.S. federal tax return. As a result, no provision for income taxes is required. As of November 30, 2011, the Fund did not have any unrecognized tax benefits in the financial statements. A fund's federal tax return is subject to examination by the Internal Revenue Service (IRS) for a period of three years. Foreign taxes are provided for based on the Fund's understanding of the tax rules and rates that exist in the foreign markets in which it invests.
Distributions are declared and recorded on the ex-dividend date. Income dividends and capital gain distributions are declared separately for each class. Income and capital gain distributions are determined in accordance with income tax regulations, which may differ from GAAP.
Capital accounts within the financial statements are adjusted for permanent book-tax differences. These adjustments have no impact on net assets or the results of operations. Temporary book-tax differences will reverse in a subsequent period.
Book-tax differences are primarily due to foreign currency transactions, passive foreign investment companies (PFIC), partnerships, net operating losses, capital loss carryforwards and losses deferred due to wash sales and excise tax regulations.
The federal tax cost of investment securities and unrealized appreciation (depreciation) as of period end on an unconsolidated basis were as follows:
Gross unrealized appreciation | $ 2,524,587 |
Gross unrealized depreciation | (4,969,860) |
Net unrealized appreciation (depreciation) on securities and other investments | $ (2,445,273) |
| |
Tax Cost | $ 38,247,546 |
Annual Report
Notes to Financial Statements - continued
3. Significant Accounting Policies - continued
Income Tax Information and Distributions to Shareholders - continued
The tax-based components of distributable earnings as of period end were as follows:
Capital loss carryforward | $ (3,661,318) |
Net unrealized appreciation (depreciation) | $ (2,445,360) |
Under the recently enacted Regulated Investment Company Modernization Act of 2010 (the Act), the Fund will be permitted to carry forward capital losses incurred in taxable years beginning after December 22, 2010 for an unlimited period. However, any losses incurred during those future taxable years will be required to be utilized prior to any losses incurred in pre-enactment taxable years, which generally expire after eight years from when they are incurred. Additionally, post-enactment capital losses that are carried forward will retain their character as either short-term or long-term capital losses rather than being considered all short-term as under previous law. The Fund's first fiscal year end subject to the Act will be November, 30, 2012.
New Accounting Pronouncement. In May 2011, the Financial Accounting Standards Board issued Accounting Standard Update No. 2011-04, Fair Value Measurement (Topic 820) - Amendments to Achieve Common Fair Value Measurement and Disclosure Requirements in U.S. GAAP and IFRSs. The update changes the wording used to describe the requirements in GAAP for measuring fair value and for disclosing information about fair value measurements. The update is effective during interim and annual periods beginning after December 15, 2011. Management is currently evaluating the impact of the update's adoption on the Fund's financial statement disclosures.
In December 2011, the Financial Accounting Standards Board issued Accounting Standard Update No. 2011-11, Disclosures about Offsetting Assets and Liabilities. The update creates new disclosure requirements requiring entities to disclose both gross and net information for derivatives and other financial instruments that are either offset in the Statement of Assets and Liabilities or subject to an enforceable master netting arrangement or similar agreement. The disclosure requirements are effective for annual reporting periods beginning on or after January 1, 2013. Management is currently evaluating the impact of the update's adoption on the Fund's financial statement disclosures.
4. Purchases and Sales of Investments.
Purchases and sales of securities, other than short-term securities, aggregated $62,910,516 and $65,196,525, respectively.
Annual Report
5. Fees and Other Transactions with Affiliates.
Management Fee. FMR and its affiliates provide the Fund with investment management related services for which the Fund pays a monthly management fee. The management fee is the sum of an individual fund fee rate that is based on an annual rate of .35% of the Fund's average net assets and an annualized group fee rate that averaged .26% during the period. The group fee rate is based upon the average net assets of all the mutual funds advised by FMR. The group fee rate decreases as assets under management increase and increases as assets under management decrease. In addition, the management fee is subject to a performance adjustment (up to a maximum of ± .20% of the Fund's average net assets over a 36 month performance period). The upward or downward adjustment to the management fee is based on the relative investment performance of the Institutional Class of the Fund as compared to an appropriate benchmark index. For the period, the total annual management fee rate, including the performance adjustment, was .45% of the Fund's average net assets.
Distribution and Service Plan Fees. In accordance with Rule 12b-1 of the 1940 Act, the Fund has adopted separate Distribution and Service Plans for each class of shares. Certain classes pay Fidelity Distributors Corporation (FDC), an affiliate of FMR, separate Distribution and Service Fees, each of which is based on an annual percentage of each class' average net assets. In addition, FDC may pay financial intermediaries for selling shares of the Fund and providing shareholder support services. For the period, the Distribution and Service Fee rates, total fees and amounts retained by FDC were as follows:
| Distribution
Fee | Service
Fee | Total Fees | Retained
by FDC |
Class A | -% | .25% | $ 29,255 | $ 427 |
Class T | .25% | .25% | 77,402 | 235 |
Class B | .75% | .25% | 27,578 | 20,792 |
Class C | .75% | .25% | 57,308 | 5,313 |
| | | $ 191,543 | $ 26,767 |
Sales Load. FDC may receive a front-end sales charge of up to 5.75% for selling Class A shares, and 3.50% for selling Class T shares, some of which is paid to financial intermediaries for selling shares of the Fund. Depending on the holding period, FDC may receive contingent deferred sales charges levied on Class A, Class T, Class B, and Class C redemptions. The deferred sales charges range from 5.00% to 1.00% for Class B, 1.00% for Class C, 1.00% for certain purchases of Class A shares and .25% for certain purchases of Class T shares.
Annual Report
Notes to Financial Statements - continued
5. Fees and Other Transactions with Affiliates - continued
Sales Load - continued
For the period, sales charge amounts retained by FDC were as follows:
| Retained
by FDC |
Class A | $ 5,039 |
Class T | 8,166 |
Class B* | 4,002 |
Class C* | 487 |
| $ 17,694 |
* When Class B and Class C shares are initially sold, FDC pays commissions from its own resources to financial intermediaries through which the sales are made.
Transfer Agent Fees. Fidelity Investments Institutional Operations Company, Inc. (FIIOC), an affiliate of FMR, is the transfer, dividend disbursing and shareholder servicing agent for each class of the Fund. FIIOC receives account fees and asset-based fees that vary according to the account size and type of account of the shareholders of the respective classes of the Fund. FIIOC pays for typesetting, printing and mailing of shareholder reports, except proxy statements. For the period, transfer agent fees for each class were as follows:
| Amount | % of
Average
Net Assets |
Class A | $ 35,833 | .31 |
Class T | 54,701 | .35 |
Class B | 8,409 | .31 |
Class C | 17,591 | .31 |
Institutional Class | 1,220 | .20 |
| $ 117,754 | |
Accounting and Security Lending Fees. Fidelity Service Company, Inc. (FSC), an affiliate of FMR, maintains the Fund's accounting records. The accounting fee is based on the level of average net assets for the month. Under a separate contract, FSC administers the security lending program. The security lending fee is based on the number and duration of lending transactions.
Brokerage Commissions. The Fund placed a portion of its portfolio transactions with brokerage firms which are affiliates of the investment adviser. The commissions paid to these affiliated firms were $1,233 for the period.
Annual Report
6. Committed Line of Credit.
The Fund participates with other funds managed by FMR or an affiliate in a $4.0 billion credit facility (the "line of credit") to be utilized for temporary or emergency purposes to fund shareholder redemptions or for other short-term liquidity purposes. The Fund has agreed to pay commitment fees on its pro-rata portion of the line of credit, which amounted to $112 and is reflected in Miscellaneous expenses on the Statement of Operations. During the period, there were no borrowings on this line of credit.
7. Security Lending.
The Fund lends portfolio securities through a lending agent from time to time in order to earn additional income. For equity securities, a lending agent is used and may loan securities to certain qualified borrowers, including Fidelity Capital Markets (FCM), a broker-dealer affiliated with the Fund. On the settlement date of the loan, the Fund receives collateral (in the form of U.S. Treasury obligations, letters of credit and/or cash) against the loaned securities and maintains collateral in an amount not less than 100% of the market value of the loaned securities during the period of the loan. The market value of the loaned securities is determined at the close of business of the Fund and any additional required collateral is delivered to the Fund on the next business day. If the borrower defaults on its obligation to return the securities loaned because of insolvency or other reasons, a fund could experience delays and costs in recovering the securities loaned or in gaining access to the collateral. Any cash collateral received is invested in the Fidelity Securities Lending Cash Central Fund. The value of loaned securities and cash collateral at period end are disclosed on the Fund's Statement of Assets and Liabilities. Security lending income represents the income earned on investing cash collateral, less rebates paid to borrowers and any lending agent fees associated with the loan, plus any premium payments received for lending certain types of securities. Security lending income is presented in the Statement of Operations as a component of income from Fidelity Central Funds. Total security lending income during the period amounted to $6,036. During the period, there were no securities loaned to FCM.
8. Expense Reductions.
FMR voluntarily agreed to reimburse each class to the extent annual operating expenses exceeded certain levels of average net assets as noted in the table below. Some expenses, for example interest expense, including commitment fees, are excluded from this reimbursement.
Annual Report
Notes to Financial Statements - continued
8. Expense Reductions - continued
The following classes were in reimbursement during the period:
| Expense
Limitations | Reimbursement
from adviser |
Class A | 1.25% | $ 23,064 |
Class T | 1.50% | 37,945 |
Class B | 2.00% | 5,509 |
Class C | 2.00% | 11,444 |
Institutional Class | 1.00% | 570 |
| | $ 78,532 |
Many of the brokers with whom FMR places trades on behalf of the Fund provided services to the Fund in addition to trade execution. These services included payments of certain expenses on behalf of the Fund totaling $5,133 for the period.
9. Share Transactions.
Transactions for each class of shares were as follows:
| Shares | Dollars |
Years ended November 30, | 2011 | 2010 | 2011 | 2010 |
Class A | | | | |
Shares sold | 348,616 | 271,600 | $ 3,339,944 | $ 2,194,435 |
Shares redeemed | (367,362) | (335,188) | (3,463,746) | (2,660,697) |
Net increase (decrease) | (18,746) | (63,588) | $ (123,802) | $ (466,262) |
Class T | | | | |
Shares sold | 284,211 | 310,978 | $ 2,574,964 | $ 2,432,697 |
Shares redeemed | (271,058) | (391,038) | (2,505,414) | (3,005,864) |
Net increase (decrease) | 13,153 | (80,060) | $ 69,550 | $ (573,167) |
Class B | | | | |
Shares sold | 12,134 | 47,922 | $ 107,027 | $ 358,845 |
Shares redeemed | (128,257) | (157,596) | (1,130,647) | (1,183,324) |
Net increase (decrease) | (116,123) | (109,674) | $ (1,023,620) | $ (824,479) |
Class C | | | | |
Shares sold | 115,363 | 123,170 | $ 1,024,037 | $ 931,941 |
Shares redeemed | (199,330) | (125,697) | (1,750,739) | (940,262) |
Net increase (decrease) | (83,967) | (2,527) | $ (726,702) | $ (8,321) |
Institutional Class | | | | |
Shares sold | 26,322 | 29,114 | $ 252,318 | $ 243,469 |
Shares redeemed | (17,715) | (18,741) | (175,436) | (152,933) |
Net increase (decrease) | 8,607 | 10,373 | $ 76,882 | $ 90,536 |
Annual Report
10. Other.
The Fund's organizational documents provide former and current trustees and officers with a limited indemnification against liabilities arising in connection with the performance of their duties to the Fund. In the normal course of business, the Fund may also enter into contracts that provide general indemnifications. The Fund's maximum exposure under these arrangements is unknown as this would be dependent on future claims that may be made against the Fund. The risk of material loss from such claims is considered remote.
Annual Report
To the Trustees of Fidelity Securities Fund and the Shareholders of Fidelity Advisor Growth Strategies Fund:
In our opinion, the accompanying statement of assets and liabilities, including the schedule of investments, and the related statements of operations and of changes in net assets and the financial highlights present fairly, in all material respects, the financial position of Fidelity Advisor Growth Strategies Fund (a fund of Fidelity Securities Fund) at November 30, 2011, the results of its operations for the year then ended, the changes in its net assets for each of the two years in the period then ended and the financial highlights for each of the five years in the period then ended, in conformity with accounting principles generally accepted in the United States of America. These financial statements and financial highlights (hereafter referred to as "financial statements") are the responsibility of the Fidelity Advisor Growth Strategies Fund's management. Our responsibility is to express an opinion on these financial statements based on our audits. We conducted our audits of these financial statements in accordance with the standards of the Public Company Accounting Oversight Board (United States). Those standards require that we plan and perform the audit to obtain reasonable assurance about whether the financial statements are free of material misstatement. An audit includes examining, on a test basis, evidence supporting the amounts and disclosures in the financial statements, assessing the accounting principles used and significant estimates made by management, and evaluating the overall financial statement presentation. We believe that our audits, which included confirmation of securities at November 30, 2011 by correspondence with the custodian and brokers, provide a reasonable basis for our opinion.
PricewaterhouseCoopers LLP
Boston, Massachusetts
January 12, 2012
Annual Report
The Trustees, Members of the Advisory Board, and executive officers of the trust and fund, as applicable, are listed below. The Board of Trustees governs the fund and is responsible for protecting the interests of shareholders. The Trustees are experienced executives who meet periodically throughout the year to oversee the fund's activities, review contractual arrangements with companies that provide services to the fund, oversee management of the risks associated with such activities and contractual arrangements, and review the fund's performance. Except for James C. Curvey, each of the Trustees oversees 226 funds advised by FMR or an affiliate. Mr. Curvey oversees 429 funds advised by FMR or an affiliate.
The Trustees hold office without limit in time except that (a) any Trustee may resign; (b) any Trustee may be removed by written instrument, signed by at least two-thirds of the number of Trustees prior to such removal; (c) any Trustee who requests to be retired or who has become incapacitated by illness or injury may be retired by written instrument signed by a majority of the other Trustees; and (d) any Trustee may be removed at any special meeting of shareholders by a two-thirds vote of the outstanding voting securities of the trust. Each Trustee who is not an interested person (as defined in the 1940 Act) (Independent Trustee), shall retire not later than the last day of the calendar year in which his or her 75th birthday occurs. The Independent Trustees may waive this mandatory retirement age policy with respect to individual Trustees. The executive officers and Advisory Board Members hold office without limit in time, except that any officer and Advisory Board Member may resign or may be removed by a vote of a majority of the Trustees at any regular meeting or any special meeting of the Trustees. Except as indicated, each individual has held the office shown or other offices in the same company for the past five years.
Experience, Skills, Attributes, and Qualifications of the Fund's Trustees. The Governance and Nominating Committee has adopted a statement of policy that describes the experience, qualifications, attributes, and skills that are necessary and desirable for potential Independent Trustee candidates (Statement of Policy). The Board believes that each Trustee satisfied at the time he or she was initially elected or appointed a Trustee, and continues to satisfy, the standards contemplated by the Statement of Policy. The Governance and Nominating Committee also engages professional search firms to help identify potential Independent Trustee candidates who have the experience, qualifications, attributes, and skills consistent with the Statement of Policy. From time to time, additional criteria based on the composition and skills of the current Independent Trustees, as well as experience or skills that may be appropriate in light of future changes to board composition, business conditions, and regulatory or other developments, have also been considered by the professional search firms and the Governance and Nominating Committee. In addition, the Board takes into account the Trustees' commitment and participation in Board and committee meetings, as well as their leadership of standing and ad hoc committees throughout their tenure.
In determining that a particular Trustee was and continues to be qualified to serve as a Trustee, the Board has considered a variety of criteria, none of which, in isolation, was controlling. The Board believes that, collectively, the Trustees have balanced and diverse experience, qualifications, attributes, and skills, which allow the Board to operate effectively in governing the fund and protecting the interests of shareholders. Information about the specific experience, skills, attributes, and qualifications of each Trustee, which in each case led to the Board's conclusion that the Trustee should serve (or continue to serve) as a trustee of the fund, is provided below.
Annual Report
Board Structure and Oversight Function. James C. Curvey is an interested person (as defined in the 1940 Act) and currently serves as Acting Chairman. The Trustees have determined that an interested Chairman is appropriate and benefits shareholders because an interested Chairman has a personal and professional stake in the quality and continuity of services provided to the fund. Independent Trustees exercise their informed business judgment to appoint an individual of their choosing to serve as Chairman, regardless of whether the Trustee happens to be independent or a member of management. The Independent Trustees have determined that they can act independently and effectively without having an Independent Trustee serve as Chairman and that a key structural component for assuring that they are in a position to do so is for the Independent Trustees to constitute a substantial majority for the Board. The Independent Trustees also regularly meet in executive session. Ned C. Lautenbach serves as Chairman of the Independent Trustees and as such (i) acts as a liaison between the Independent Trustees and management with respect to matters important to the Independent Trustees and (ii) with management prepares agendas for Board meetings.
Fidelity funds are overseen by different Boards of Trustees. The fund's Board oversees Fidelity's equity and high income funds and another Board oversees Fidelity's investment-grade bond, money market, and asset allocation funds. The asset allocation funds may invest in Fidelity funds overseen by the fund's Board. The use of separate Boards, each with its own committee structure, allows the Trustees of each group of Fidelity funds to focus on the unique issues of the funds they oversee, including common research, investment, and operational issues. On occasion, the separate Boards establish joint committees to address issues of overlapping consequences for the Fidelity funds overseen by each Board.
The Trustees operate using a system of committees to facilitate the timely and efficient consideration of all matters of importance to the Trustees, the fund, and fund shareholders and to facilitate compliance with legal and regulatory requirements and oversight of the fund's activities and associated risks. The Board, acting through its committees, has charged FMR and its affiliates with (i) identifying events or circumstances the occurrence of which could have demonstrably adverse effects on the fund's business and/or reputation; (ii) implementing processes and controls to lessen the possibility that such events or circumstances occur or to mitigate the effects of such events or circumstances if they do occur; and (iii) creating and maintaining a system designed to evaluate continuously business and market conditions in order to facilitate the identification and implementation processes described in (i) and (ii) above. Because the day-to-day operations and activities of the fund are carried out by or through FMR, its affiliates and other service providers, the fund's exposure to risks is mitigated but not eliminated by the processes overseen by the Trustees. While each of the Board's committees has responsibility for overseeing different aspects of the fund's activities, oversight is exercised primarily through the Operations, Audit, and Compliance Committees. In addition, the Independent Trustees have worked with FMR to enhance the Board's oversight of investment and financial risks, legal and regulatory risks, technology risks, and operational risks, including the development of additional risk reporting to the Board. For example, a working group comprised of Independent Trustees and FMR has worked and continues to work to review the Fidelity funds' valuation-related activities, reporting and risk management. Appropriate personnel, including but not limited to the fund's Chief Compliance Officer (CCO), FMR's internal auditor, the independent accountants, the fund's Treasurer and portfolio management personnel, make periodic reports to the Board's committees, as appropriate, including an annual review of FMR's risk management program for the Fidelity funds. The responsibilities of each standing committee, including their oversight responsibilities, are described further under "Standing Committees of the Fund's Trustees."
Annual Report
Trustees and Officers - continued
The fund's Statement of Additional Information (SAI) includes more information about the Trustees. To request a free copy, call Fidelity at 1-877-208-0098.
Interested Trustees*:
Correspondence intended for each Trustee who is an interested person may be sent to Fidelity Investments, 82 Devonshire Street, Boston, Massachusetts 02109.
Name, Age; Principal Occupations and Other Relevant Experience+ |
James C. Curvey (76) |
| Year of Election or Appointment: 2007 Mr. Curvey is Trustee and Acting Chairman of the Board of Trustees of certain Trusts. Mr. Curvey also serves as Trustee (2007-present) of other investment companies advised by FMR. Mr. Curvey is a Director of Fidelity Investments Money Management, Inc. (2009-present), Director of Fidelity Research & Analysis Co. (2009-present) and Director of FMR and FMR Co., Inc. (2007-present). Mr. Curvey is also Vice Chairman (2007-present) and Director of FMR LLC. In addition, Mr. Curvey serves as an Overseer for the Boston Symphony Orchestra and a member of the Trustees of Villanova University. Previously, Mr. Curvey was the Vice Chairman (2006-2007) and Director (2000-2007) of FMR Corp. |
Ronald P. O'Hanley (54) |
| Year of Election or Appointment: 2011 Mr. O'Hanley is Director of FMR Co., Inc. (2010-present), Director of Fidelity Investments Money Management, Inc. (2010-present), Director of Fidelity Research & Analysis Company (2010-present), President of Fidelity Asset Management and Corporate Services and a member of Fidelity's Executive Committee (2010-present). Previously, Mr. O'Hanley served as President and Chief Executive Officer of BNY Mellon Asset Management (2007-2010). Mr. O'Hanley also served as Vice Chairman of Bank New York Mellon Corp. and a member of that firm's Executive Committee. Prior to the 2007 merger of The Bank of New York and Mellon Financial Corporation, he was Vice Chairman of Mellon Financial Corporation and President and Chief Executive Officer of Mellon Asset Management. He joined Mellon in February 1997. Mr. O'Hanley currently serves as Chairman of the Boston Public Library Foundation Board of Directors and sits on the Board of Directors of Beth Israel Deaconess Medical Center, the Board of Trustees of the Marine Biological Laboratory and the Advisory Board of the Maxwell School of Citizenship and Public Administration at Syracuse University. Mr. O'Hanley also chairs the Council on Asset Management for the Financial Services Roundtable and is a member of the Board of Directors of Institutional Investor's U.S. Institute. |
* Trustees have been determined to be "Interested Trustees" by virtue of, among other things, their affiliation with the trust or various entities under common control with FMR.
+ The information above includes each Trustee's principal occupation during the last five years and other information relating to the experience, attributes, and skills relevant to each Trustee's qualifications to serve as a Trustee, which led to the conclusion that each Trustee should serve as a Trustee for the fund.
Annual Report
Trustees and Officers - continued
Independent Trustees:
Correspondence intended for each Independent Trustee (that is, the Trustees other than the Interested Trustees) may be sent to Fidelity Investments, P.O. Box 55235, Boston, Massachusetts 02205-5235.
Name, Age; Principal Occupations and Other Relevant Experience+ |
Dennis J. Dirks (63) |
| Year of Election or Appointment: 2005 Prior to his retirement in May 2003, Mr. Dirks was Chief Operating Officer and a member of the Board of The Depository Trust & Clearing Corporation (DTCC). He also served as President, Chief Operating Officer, and Board member of The Depository Trust Company (DTC) and President and Board member of the National Securities Clearing Corporation (NSCC). In addition, Mr. Dirks served as Chief Executive Officer and Board member of the Government Securities Clearing Corporation, Chief Executive Officer and Board member of the Mortgage-Backed Securities Clearing Corporation, as a Trustee and a member of the Finance Committee of Manhattan College (2005-2008), and as a Trustee and a member of the Finance Committee of AHRC of Nassau County (2006-2008). Mr. Dirks is a member of the Independent Directors Council (IDC) Governing Council (2010-present) and Board of Directors for The Brookville Center for Children's Services, Inc. (2009-present). |
Alan J. Lacy (58) |
| Year of Election or Appointment: 2008 Mr. Lacy serves as Senior Adviser (2007-present) of Oak Hill Capital Partners, L.P. (private equity). Mr. Lacy also served as Chief Executive Officer (2000-2005) and Vice Chairman (2005-2006) of Sears Holdings Corporation and Sears, Roebuck and Co. (retail). In addition, Mr. Lacy serves as a member of the Board of Directors of Dave & Buster's, Inc. (restaurant and entertainment complexes, 2010-present), The Hillman Companies, Inc. (hardware wholesalers, 2010-present), and Bristol-Myers Squibb Company (global pharmaceuticals, 2007-present). Mr. Lacy is a member of the Board of Trustees of The National Parks Conservation Association (2006-present). Previously, Mr. Lacy served as Chairman of the Board of Trustees of the National Parks Conservation Association (2008-2011) and as a member of the Board of Directors for the Western Union Company (global money transfer, 2006-2011). |
Ned C. Lautenbach (67) |
| Year of Election or Appointment: 2000 Mr. Lautenbach is Chairman of the Independent Trustees of the Equity and High Income Funds (2006-present). Mr. Lautenbach currently serves as the Lead Director of the Eaton Corporation Board of Directors (diversified industrial, 1997-present). Mr. Lautenbach is also a member of the Board of Directors of the Philharmonic Center for the Arts in Naples, Florida (1999-present); a member of the Board of Trustees of Fairfield University (2005-present); and a member of the Council on Foreign Relations (1994-present). Previously, Mr. Lautenbach was a Partner/Advisory Partner at Clayton, Dubilier & Rice, LLC (private equity investment, 1998-2010), as well as a Director of Sony Corporation (2006-2007). |
Joseph Mauriello (67) |
| Year of Election or Appointment: 2008 Prior to his retirement in January 2006, Mr. Mauriello served in numerous senior management positions including Deputy Chairman and Chief Operating Officer (2004-2005), and Vice Chairman of Financial Services (2002-2004) of KPMG LLP US (professional services, 1965-2005). Mr. Mauriello currently serves as a member of the Board of Directors of XL Group plc. (global insurance and re-insurance, 2006-present) and of Arcadia Resources Inc. (health care services and products, 2007-present). Previously, Mr. Mauriello served as a Director of the Hamilton Funds of the Bank of New York (2006-2007). |
Robert W. Selander (61) |
| Year of Election or Appointment: 2011 Previously, Mr. Selander served as a Member of the Advisory Board of Fidelity's Equity and High Income Funds (2011), Executive Vice Chairman (2010), Chief Executive Officer (2009-2010), and President and Chief Executive Officer (1997-2009) of Mastercard, Inc. |
Cornelia M. Small (67) |
| Year of Election or Appointment: 2005 Ms. Small is a member of the Board of Directors of the Teagle Foundation (2009-present). Ms. Small is also a member of the Investment Committee, and Chair (2008-present) and a member of the Board of Trustees of Smith College. In addition, Ms. Small serves on the Investment Committee of the Berkshire Taconic Community Foundation (2008-present). Previously, Ms. Small served as Chairperson of the Investment Committee (2002-2008) of Smith College. In addition, Ms. Small served as Chief Investment Officer, Director of Global Equity Investments, and a member of the Board of Directors of Scudder, Stevens & Clark and Scudder Kemper Investments. |
William S. Stavropoulos (72) |
| Year of Election or Appointment: 2002 Mr. Stavropoulos is Vice Chairman of the Independent Trustees of the Equity and High Income Funds (2006-present). Mr. Stavropoulos serves as President and Founder of the Michigan Baseball Foundation, the Great Lakes Loons (2007-present). Mr. Stavropoulos is Chairman Emeritus of the Board of Directors of The Dow Chemical Company, where he previously served in numerous senior management positions, including President, CEO (1995-2000; 2002-2004), Chairman of the Executive Committee (2000-2006), and as a member of the Board of Directors (1990-2006). Currently, Mr. Stavropoulos is Chairman of Univar (global distributor of commodity and specialty chemicals, 2010-present), a Director of Teradata Corporation (data warehousing and technology solutions, 2008-present), Chemical Financial Corporation, Maersk Inc. (industrial conglomerate), Tyco International, Inc. (multinational manufacturing and services, 2007-present), and a member of the Advisory Board for Metalmark Capital (private equity investment, 2005-present). Mr. Stavropoulos is a special advisor to Clayton, Dubilier & Rice, LLC (private equity investment). In addition, Mr. Stavropoulos is a member of the University of Notre Dame Advisory Council for the College of Science. |
David M. Thomas (62) |
| Year of Election or Appointment: 2008 Previously, Mr. Thomas served as Executive Chairman (2005-2006) and Chairman and Chief Executive Officer (2000-2005) of IMS Health, Inc. (pharmaceutical and healthcare information solutions). In addition, Mr. Thomas serves as a member of the Board of Directors of Fortune Brands, Inc. (consumer products), and Interpublic Group of Companies, Inc. (marketing communication, 2004-present). |
Michael E. Wiley (61) |
| Year of Election or Appointment: 2008 Mr. Wiley also serves as a Director of Asia Pacific Exploration Consolidated (international oil and gas exploration and production, 2008-present). Mr. Wiley serves as a Director of Tesoro Corporation (independent oil refiner and marketer, 2005-present), and a Director of Bill Barrett Corporation (exploration and production, 2005-present). In addition, Mr. Wiley also serves as a Director of Post Oak Bank (privately-held bank, 2004-present). Previously, Mr. Wiley served as a member of the Board of Trustees of the University of Tulsa (2000-2006; 2007-2010), as a Senior Energy Advisor of Katzenbach Partners, LLC (consulting, 2006-2007), as an Advisory Director of Riverstone Holdings (private investment), Chairman, President, and CEO of Baker Hughes, Inc. (oilfield services, 2000-2004), and as Director of Spinnaker Exploration Company (exploration and production, 2001-2005). |
Annual Report
+ The information above includes each Trustee's principal occupation during the last five years and other information relating to the experience, attributes, and skills relevant to each Trustee's qualifications to serve as a Trustee, which led to the conclusion that each Trustee should serve as a Trustee for the fund.
Advisory Board Members and Executive Officers:
Correspondence intended for each executive officer, Edward C. Johnson 3d, and Peter S. Lynch may be sent to Fidelity Investments, 82 Devonshire Street, Boston, Massachusetts 02109.
Name, Age; Principal Occupation |
Edward C. Johnson 3d (81) |
| Year of Election or Appointment: 2011 Member of the Advisory Board of Fidelity's Equity and High Income Funds. Mr. Johnson serves as Chief Executive Officer, Chairman, and a Director of FMR LLC, and also serves as Chairman and Director of FIL Limited. Previously, Mr. Johnson served as a Trustee and Chairman of the Board of certain Fidelity Trusts, Chairman and a Director of FMR, Chairman and a Director of FMR Co., Inc., and President of FMR LLC (2006-2007). |
Peter S. Lynch (67) |
| Year of Election or Appointment: 2003 Member of the Advisory Board of Fidelity's Equity and High Income Funds. Mr. Lynch is Vice Chairman and a Director of FMR and FMR Co., Inc. In addition, Mr. Lynch serves as a Trustee of Boston College and as the Chairman of the Inner-City Scholarship Fund. Previously, Mr. Lynch served on the Special Olympics International Board of Directors (1997-2006). |
Kenneth B. Robins (42) |
| Year of Election or Appointment: 2008 President and Treasurer of Fidelity's Equity and High Income Funds. Mr. Robins also serves as President and Treasurer (2010-present) and Assistant Treasurer (2009-present) of other Fidelity funds and is an employee of Fidelity Investments (2004-present). Previously, Mr. Robins served as Deputy Treasurer of the Fidelity funds (2005-2008) and Treasurer and Chief Financial Officer of The North Carolina Capital Management Trust: Cash and Term Portfolios (2006-2008). |
Brian B. Hogan (47) |
| Year of Election or Appointment: 2009 Vice President of Equity and High Income Funds. Mr. Hogan also serves as President of FMR's Equity Division (2009-present). Previously, Mr. Hogan served as Senior Vice President, Equity Research of FMR (2006-2009) and as a portfolio manager. |
Bruce T. Herring (46) |
| Year of Election or Appointment: 2006 Vice President of certain Equity Funds. Mr. Herring also serves as Chief Investment Officer and Director of Fidelity Management & Research (U.K.) Inc. (2010-present) and Group Chief Investments Officer of FMR. Previously, Mr. Herring served as Vice President (2005-2006) and Senior Vice President (2006-2007) of Fidelity Management & Research Company, Vice President of FMR Co., Inc. (2001-2007) and as a portfolio manager for Fidelity U.S. Equity Funds. |
Scott C. Goebel (43) |
| Year of Election or Appointment: 2008 Secretary and Chief Legal Officer (CLO) of the Fidelity funds. Mr. Goebel also serves as Secretary of Fidelity Investments Money Management, Inc. (FIMM) (2010-present) and Fidelity Research and Analysis Company (FRAC) (2010-present); Secretary and CLO of The North Carolina Capital Management Trust: Cash and Term Portfolios (2008-present); General Counsel, Secretary, and Senior Vice President of FMR (2008-present) and FMR Co., Inc. (2008-present); employed by FMR LLC or an affiliate (2001-present); Chief Legal Officer of Fidelity Management & Research (Hong Kong) Limited (2008-present) and Assistant Secretary of Fidelity Management & Research (Japan) Inc. (2008-present), and Fidelity Management & Research (U.K.) Inc. (2008-present). Previously, Mr. Goebel served as Assistant Secretary of FIMM (2008-2010), FRAC (2008-2010), and the Funds (2007-2008) and as Vice President and Secretary of Fidelity Distributors Corporation (FDC) (2005-2007). |
William C. Coffey (42) |
| Year of Election or Appointment: 2009 Assistant Secretary of Fidelity's Equity and High Income Funds. Mr. Coffey also serves as Senior Vice President and Deputy General Counsel of FMR LLC (2010-present), and is an employee of Fidelity Investments. Previously, Mr. Coffey served as Vice President and Associate General Counsel of FMR LLC (2005-2009). |
Holly C. Laurent (57) |
| Year of Election or Appointment: 2008 Anti-Money Laundering (AML) Officer of the Fidelity funds. Ms. Laurent also serves as AML Officer of The North Carolina Capital Management Trust: Cash and Term Portfolios (2008-present) and is an employee of Fidelity Investments. Previously, Ms. Laurent was Senior Vice President and Head of Legal for Fidelity Business Services India Pvt. Ltd. (2006-2008), and Senior Vice President, Deputy General Counsel and Group Head for FMR LLC (2005-2006). |
Christine Reynolds (53) |
| Year of Election or Appointment: 2008 Chief Financial Officer of the Fidelity funds. Ms. Reynolds became President of Fidelity Pricing and Cash Management Services (FPCMS) in August 2008. Ms. Reynolds served as Chief Operating Officer of FPCMS (2007-2008). Previously, Ms. Reynolds served as President, Treasurer, and Anti-Money Laundering officer of the Fidelity funds (2004-2007). |
Kenneth A. Rathgeber (64) |
| Year of Election or Appointment: 2004 Chief Compliance Officer of Fidelity's Equity and High Income Funds. Mr. Rathgeber is Chief Compliance Officer of Fidelity Management & Research (Hong Kong) Limited (2008-present), Fidelity Management & Research (Japan) Inc. (2008-present), FMR (2005-present), FMR Co., Inc. (2005-present), Fidelity Management & Research (U.K.) Inc. (2005-present), Fidelity Research & Analysis Company (2005-present), Fidelity Investments Money Management, Inc. (2005-present), Pyramis Global Advisors, LLC (2005-present), and Strategic Advisers, Inc. (2005-present). |
Jeffrey S. Christian (50) |
| Year of Election or Appointment: 2009 Deputy Treasurer of the Fidelity funds. Mr. Christian is an employee of Fidelity Investments. Previously, Mr. Christian served as Chief Financial Officer (2008-2009) of certain Fidelity funds and Senior Vice President of Fidelity Pricing and Cash Management Services (FPCMS) (2004-2009). |
Joseph F. Zambello (54) |
| Year of Election or Appointment: 2011 Deputy Treasurer of the Fidelity funds. Mr. Zambello is an employee of Fidelity Investments. Previously, Mr. Zambello served as Vice President of FMR's Program Management Group (2009-2011) and Vice President of the Transfer Agent Oversight Group (2005-2009). |
Adrien E. Deberghes (44) |
| Year of Election or Appointment: 2008 Deputy Treasurer of Fidelity's Equity and High Income Funds. Mr. Deberghes also serves as Vice President and Assistant Treasurer of Fidelity Rutland Square Trust II and Fidelity Commonwealth Trust II (2011-present), Assistant Treasurer of other Fidelity funds (2010-present), and is an employee of Fidelity Investments (2008-present). Previously, Mr. Deberghes served as Senior Vice President of Mutual Fund Administration at State Street Corporation (2007-2008), Senior Director of Mutual Fund Administration at Investors Bank & Trust (2005-2007), and Director of Finance for Dunkin' Brands (2000-2005). |
Stephanie J. Dorsey (42) |
| Year of Election or Appointment: 2010 Assistant Treasurer of Fidelity's Equity and High Income Funds. Ms. Dorsey also serves as Deputy Treasurer of other Fidelity funds (2008-present) and is an employee of Fidelity Investments (2008-present). Previously, Ms. Dorsey served as Treasurer (2004-2008) of the JPMorgan Mutual Funds and Vice President (2004-2008) of JPMorgan Chase Bank. |
John R. Hebble (53) |
| Year of Election or Appointment: 2009 Assistant Treasurer of Fidelity's Equity and High Income Funds. Mr. Hebble also serves as President (2011-present), Treasurer, and Chief Financial Officer of The North Carolina Capital Management Trust: Cash and Term Portfolios (2008-present), President and Treasurer of other Fidelity funds (2008-present) and is an employee of Fidelity Investments. |
Gary W. Ryan (53) |
| Year of Election or Appointment: 2005 Assistant Treasurer of the Fidelity funds. Mr. Ryan is an employee of Fidelity Investments. Previously, Mr. Ryan served as Vice President of Fund Reporting in Fidelity Pricing and Cash Management Services (FPCMS) (1999-2005). |
Jonathan Davis (43) |
| Year of Election or Appointment: 2010 Assistant Treasurer of the Fidelity funds. Mr. Davis is also Assistant Treasurer of Fidelity Rutland Square Trust II and Fidelity Commonwealth Trust II. Mr. Davis is an employee of Fidelity Investments. Previously, Mr. Davis served as Vice President and Associate General Counsel of FMR LLC (2003-2010). |
Annual Report
Board Approval of Investment Advisory Contracts and Management Fees
Fidelity Advisor Growth Strategies Fund
Each year, the Board of Trustees, including the Independent Trustees (together, the Board), votes on the renewal of the management contract and sub-advisory agreements (together, the Advisory Contracts) for the fund. The Board, assisted by the advice of fund counsel and Independent Trustees' counsel, requests and considers a broad range of information relevant to the renewal of the Advisory Contracts throughout the year.
The Board meets regularly and considers at each of its meetings factors that are relevant to its annual consideration of the renewal of the fund's Advisory Contracts, including the services and support provided to the fund and its shareholders. The Board has established various standing committees, each composed of Independent Trustees with varying backgrounds, to which the Board has assigned specific subject matter responsibilities in order to enhance effective decision-making by the Board. The Board, acting directly and through its Committees, requests and receives information concerning the annual consideration of the renewal of the fund's Advisory Contracts. The Board also meets as needed to consider matters specifically related to the Board's annual consideration of the renewal of Advisory Contracts. Members of the Board may also meet with trustees of other Fidelity funds through ad hoc joint committees to discuss certain matters relevant to the Fidelity funds.
At its July 2011 meeting, the Board of Trustees, including the Independent Trustees, unanimously determined to renew the fund's Advisory Contracts. In reaching its determination, the Board considered all factors it believed relevant, including (i) the nature, extent, and quality of the services to be provided to the fund and its shareholders (including the investment performance of the fund); (ii) the competitiveness of the fund's management fee and total expense ratio; (iii) the total costs of the services to be provided by and the profits to be realized by Fidelity from its relationship with the fund; (iv) the extent to which economies of scale would be realized as the fund grows; and (v) whether fee levels reflect these economies of scale, if any, for the benefit of fund shareholders.
In considering whether to renew the Advisory Contracts for the fund, the Board reached a determination, with the assistance of fund counsel and Independent Trustees' counsel and through the exercise of its business judgment, that the renewal of the Advisory Contracts is in the best interests of the fund and its shareholders and that the compensation payable under the Advisory Contracts is fair and reasonable. The Board's decision to renew the Advisory Contracts was not based on any single factor, but rather was based on a comprehensive consideration of all the information provided to the Board at its meetings throughout the year. The Board, in reaching its determination to renew the Advisory Contracts, is aware that shareholders in the fund have a broad range of investment choices available to them, including a wide choice among mutual funds offered by Fidelity's competitors, and that the fund's shareholders, who have the opportunity to review and weigh the disclosure provided by the fund in its prospectus and other public disclosures, have chosen to invest in this fund, managed by Fidelity.
Annual Report
Board Approval of Investment Advisory Contracts and
Management Fees - continued
Nature, Extent, and Quality of Services Provided. The Board considered the staffing within the investment adviser, FMR, and the sub-advisers (together, the Investment Advisers), including the backgrounds of the fund's investment personnel and the fund's investment objective and discipline. The Independent Trustees also had discussions with senior management of Fidelity's investment operations and investment groups. The Board considered the structure of the portfolio manager compensation program and whether this structure provides appropriate incentives to act in the best interests of the fund.
Resources Dedicated to Investment Management and Support Services. The Board and the Fund Oversight and Research Committees reviewed the general qualifications and capabilities of the Investment Advisers' investment staff, including its size, education, experience, and resources, as well as the Investment Advisers' approach to recruiting, training, managing, and compensating investment personnel. The Board also noted that FMR has devoted increased resources to non-U.S. offices. The Board noted that Fidelity's analysts have extensive resources, tools and capabilities which allow them to conduct sophisticated quantitative and fundamental analysis, as well as credit analysis of issuers, counterparties and enhancers. The Board also believes that Fidelity's investment professionals have sufficient access to global information and data so as to provide competitive investment results over time, and that those professionals also have access to sophisticated tools which permit them to assess portfolio construction and risk and performance attribution characteristics continuously, as well as to transmit new information and research conclusions rapidly around the world. Additionally, in their deliberations, the Board considered the Investment Advisers' trading capabilities and resources which are an integral part of the investment management process.
Shareholder and Administrative Services. The Board considered (i) the nature, extent, quality, and cost of advisory, administrative, and shareholder services performed by the Investment Advisers and their affiliates under the Advisory Contracts and under separate agreements covering transfer agency, pricing and bookkeeping, and securities lending services for the fund; (ii) the nature and extent of the investment adviser's supervision of third party service providers, principally custodians and subcustodians; and (iii) the resources devoted to, and the record of compliance with, the fund's compliance policies and procedures. The Board also reviewed the allocation of fund brokerage, including allocations to brokers affiliated with the Investment Advisers, the use of brokerage commissions to pay fund expenses, and the use of "soft" commission dollars to pay for research services.
The Board noted that the growth of fund assets over time across the complex allows Fidelity to reinvest in the development of services designed to enhance the value or convenience of the Fidelity funds as investment vehicles. These services include 24-hour access to account information and market information through telephone representatives and over the Internet, investor education materials and asset allocation tools, and the expanded availability of Fidelity Investor Centers, with 35 new branches opening since 2010.
Annual Report
Investment in a Large Fund Family. The Board considered the benefits to shareholders of investing in a Fidelity fund, including the benefits of investing in a fund that is part of a large family of funds offering a variety of investment disciplines and providing a large variety of mutual fund investor services. The Board noted that Fidelity had taken, or had made recommendations that resulted in the Fidelity funds taking, a number of actions over the previous year that benefited particular funds, including (i) continuing to dedicate additional resources to investment research and support of the senior management team that oversees asset management; (ii) rationalizing product lines through the mergers of six funds into other funds; (iii) continuing to migrate the Freedom Funds to dedicated lower cost underlying funds; (iv) obtaining shareholder approval to broaden the investment strategies for Fidelity Consumer Finance Portfolio, Fidelity Emerging Asia Fund, and Fidelity Environment and Alternative Energy Portfolio; (v) contractually agreeing to reduce the management fees and impose other expense limitations on Spartan 500 Index Fund and U.S. Bond Index Fund in connection with launching new institutional classes of these funds; (vi) changing the name, primary and supplemental benchmarks, and investment policies of Fidelity Global Strategies Fund to support the fund's flexible investment mandate and global orientation; and (vii) reducing the transfer agency account fee rates on certain accounts.
Investment Performance. The Board considered whether the fund has operated in accordance with its investment objective, as well as its record of compliance with its investment restrictions. It also reviewed the fund's absolute investment performance for each class, as well as the fund's relative investment performance for each class measured over multiple periods against (i) a broad-based securities market index, and (ii) a peer group of mutual funds deemed appropriate by Fidelity and reviewed by the Board. The following charts considered by the Board show, over the one-, three-, and five-year periods ended December 31, 2010, the cumulative total returns of Institutional Class (Class I) and Class B of the fund, the cumulative total returns of a broad-based securities market index ("benchmark"), and a range of cumulative total returns of a peer group of mutual funds identified by Morningstar, Inc. as having an investment style similar to that of the fund based on underlying portfolio holdings. The returns of Institutional Class (Class I) and Class B show the performance of the highest and lowest performing classes, respectively (based on five-year performance). The box within each chart shows the 25th percentile return (bottom of box) and the 75th percentile return (top of box) of the peer group. Returns shown above the box are in the first quartile and returns shown below the box are in the fourth quartile. The percentage beaten numbers noted below each chart correspond to the percentile box and represent the percentage of funds in the peer group whose performance was equal to or lower than that of the class indicated.
Annual Report
Board Approval of Investment Advisory Contracts and
Management Fees - continued
Fidelity Advisor Growth Strategies Fund

The Board reviewed the fund's relative investment performance against its peer group and noted that the performance of Institutional Class (Class I) of the fund was in the third quartile for the one-year period and the fourth quartile for the three- and five-year periods. The Board also noted that the investment performance of the fund was lower than its benchmark for all the periods shown. The Board considered that the variations in performance among the fund's classes reflect the variations in class expenses, which result in lower performance for higher expense classes. The Board discussed with FMR actions that have been taken by FMR to improve the fund's disappointing performance relative to its peer group and benchmark. The Board noted that this fund had underperformed in 2009 and discussed with FMR its disappointment with the continued underperformance of the fund. The Board also reviewed the fund's performance since inception as well as performance in the current year. The Board will continue to closely monitor the performance of the fund in the coming year and discuss with FMR other appropriate actions to address the performance of the fund.
The Board also considered that the fund's management fee is subject to upward or downward adjustment depending upon whether, and to what extent, the fund's investment performance for the performance period exceeds, or is exceeded by, the record (over the same period) of a Board-approved performance adjustment index. The Board noted that the performance adjustment provides FMR with a strong economic incentive to seek to achieve superior performance for the fund's shareholders and helps to more closely align the interests of FMR and the fund's shareholders.
Annual Report
Based on its review, the Board concluded that the nature, extent, and quality of services provided to the fund under the Advisory Contracts should benefit the fund's shareholders.
Competitiveness of Management Fee and Total Expense Ratio. The Board considered the fund's management fee and total expense ratio compared to "mapped groups" of competitive funds and classes. Fidelity creates "mapped groups" by combining similar Lipper investment objective categories that have comparable management fee characteristics. Combining Lipper investment objective categories aids the Board's management fee and total expense ratio comparisons by broadening the competitive group used for comparison and by reducing the number of universes to which various Fidelity funds are compared.
Management Fee. The Board considered two proprietary management fee comparisons for the 12-month periods shown in the chart below. The group of Lipper funds used by the Board for management fee comparisons is referred to below as the "Total Mapped Group." The Total Mapped Group comparison focuses on a fund's standing relative to the total universe of comparable funds available to investors in terms of gross management fees before expense reimbursements or caps, and without giving effect to the fund's performance adjustment. "TMG %" represents the percentage of funds in the Total Mapped Group that had management fees that were lower than the fund's. For example, a TMG % of 17% means that 83% of the funds in the Total Mapped Group had higher management fees than the fund. The "Asset-Size Peer Group" (ASPG) comparison focuses on a fund's standing relative to non-Fidelity funds similar in size to the fund within the Total Mapped Group. The ASPG represents at least 15% of the funds in the Total Mapped Group with comparable asset size and management fee characteristics, subject to a minimum of 50 funds (or all funds in the Total Mapped Group if fewer than 50). Additional information, such as the ASPG quartile in which the fund's management fee ranked and the impact of the fund's performance adjustment, is also included in the chart and considered by the Board.
Annual Report
Board Approval of Investment Advisory Contracts and
Management Fees - continued
Fidelity Advisor Growth Strategies Fund
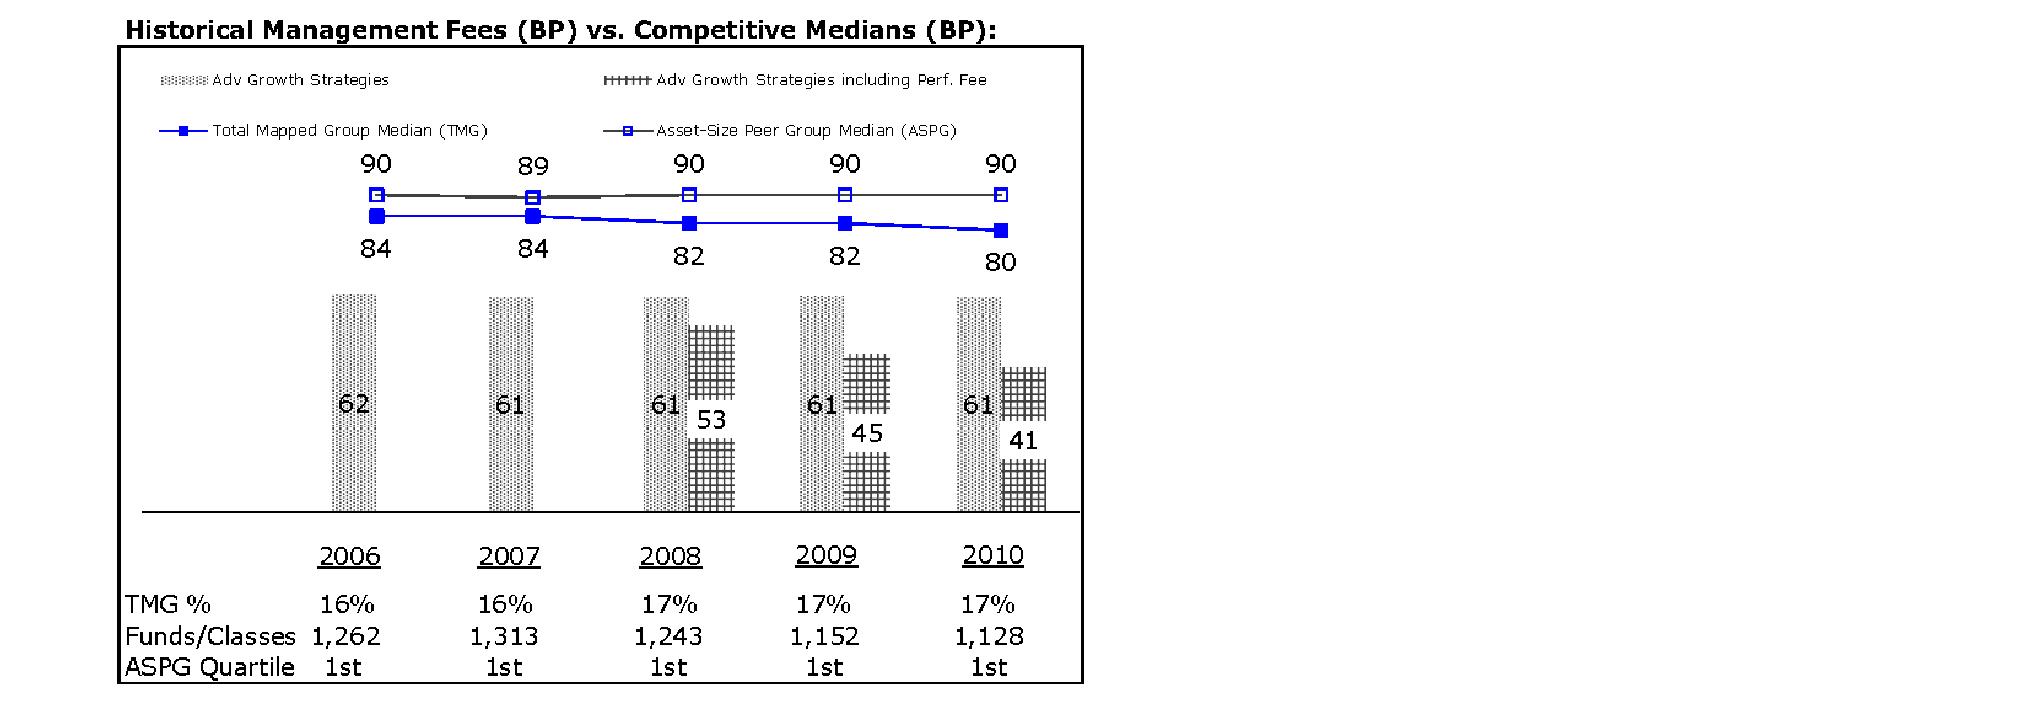
The Board noted that the fund's management fee ranked below the median of its Total Mapped Group and below the median of its ASPG for 2010. The Board also noted the effect of the fund's negative performance adjustment on the fund's management fee ranking. The Board noted that the performance adjustment for each year represents calculations for performance periods that differ from the periods shown in the performance charts above.
Based on its review, the Board concluded that the fund's management fee is fair and reasonable in light of the services that the fund receives and the other factors considered.
Total Expense Ratio. In its review of each class's total expense ratio, the Board considered the fund's management fee as well as other fund or class expenses, as applicable, such as transfer agent fees, pricing and bookkeeping fees, fund-paid 12b-1 fees, and custodial, legal, and audit fees. The Board also noted the effects of any waivers and reimbursements on fees and expenses, as well as the impact of the fund's performance adjustment. As part of its review, the Board also considered the current and historical total expense ratios of each class of the fund compared to competitive fund median expenses. Each class of the fund is compared to those funds and classes in the Total Mapped Group (used by the Board for management fee comparisons) that have a similar sales load structure.
The Board noted that the total expense ratio of each of Class A and Class B ranked below its competitive median for 2010, the total expense ratio of each of Class C and Institutional Class ranked equal to its competitive median for 2010, and the total expense ratio of Class T ranked above its competitive median for 2010. The Board considered that various factors, including 12b-1 fees, positive or negative performance adjustments, and relatively higher other expenses in the case of small fund size, can affect total expense ratios. The Board noted that the total expense ratio of Class T was above the competitive median primarily because of higher 12b-1 fees on Class T. Class T has a higher 12b-1 fee, but a lower front-end sales charge, than traditionally priced front-end sales charge classes. The Board noted that the fund offers multiple classes, each of which has a different sales load and 12b-1 fee structure, and that the multiple structures are intended to offer a range of pricing options for the intermediary market. The Board also noted that the total expense ratios of the classes vary primarily by the level of their 12b-1 fees, although differences in transfer agent fees may also cause expenses to vary from class to class.
Annual Report
Fees Charged to Other Fidelity Clients. The Board also considered Fidelity fee structures and other information with respect to clients of FMR and its affiliates, such as other mutual funds advised or subadvised by FMR or its affiliates, pension plan clients, and other institutional clients. In March 2010, the Board created an ad hoc joint committee with the board of other Fidelity funds (the Committee) to review and compare Fidelity's institutional investment advisory business with its business of providing services to the Fidelity funds, including the differences in services provided, fees charged, and costs incurred, as well as competition in their respective marketplaces.
Based on its review of total expense ratios and fees charged to other Fidelity clients, the Board concluded that the total expense ratio of each class of the fund was reasonable, although Class T was above the median of the universe presented for comparison, in light of the services that the fund and its shareholders receive and the other factors considered, including the findings of the Committee.
Costs of the Services and Profitability. The Board considered the revenues earned and the expenses incurred by Fidelity in conducting the business of developing, marketing, distributing, managing, administering and servicing the fund and its shareholders. The Board also considered the level of Fidelity's profits in respect of all the Fidelity funds.
On an annual basis, FMR presents to the Board Fidelity's profitability for the fund. Fidelity calculates the profitability for each fund, as well as aggregate profitability for groups of Fidelity funds and all Fidelity funds, using a series of detailed revenue and cost allocation methodologies which originate with the books and records of Fidelity on which Fidelity's audited financial statements are based. The Audit Committee of the Board reviews any significant changes from the prior year's methodologies.
PricewaterhouseCoopers LLP (PwC), independent registered public accounting firm and auditor to Fidelity and certain Fidelity funds, has been engaged annually by the Board as part of the Board's assessment of Fidelity's profitability analysis. PwC's engagement includes the review and assessment of Fidelity's methodologies used in determining the revenues and expenses attributable to Fidelity's mutual fund business, and completion of agreed-upon procedures surrounding the mathematical accuracy of fund profitability and its conformity to allocation methodologies. After considering PwC's reports issued under the engagement and information provided by Fidelity, the Board concluded that while other allocation methods may also be reasonable, Fidelity's profitability methodologies are reasonable in all material respects.
Annual Report
Board Approval of Investment Advisory Contracts and
Management Fees - continued
The Board also reviewed Fidelity's non-fund businesses and fall-out benefits related to the mutual fund business as well as cases where Fidelity's affiliates may benefit from or be related to the fund's business.
The Board considered the costs of the services provided by and the profits realized by Fidelity in connection with the operation of the fund and was satisfied that the profitability was not excessive in the circumstances.
Economies of Scale. The Board considered whether there have been economies of scale in respect of the management of the Fidelity funds, whether the Fidelity funds (including the fund) have appropriately benefited from any such economies of scale, and whether there is potential for realization of any further economies of scale. The Board considered the extent to which the fund will benefit from economies of scale through increased services to the fund, through waivers or reimbursements, or through fee or expense reductions. The Board also noted that in 2009, it and the board of other Fidelity funds created an ad hoc committee (the Economies of Scale Committee) to analyze whether FMR attains economies of scale in respect of the management and servicing of the Fidelity funds, whether the Fidelity funds have appropriately benefited from such economies of scale, and whether there is potential for realization of any further economies of scale.
The Board recognized that the fund's management contract incorporates a "group fee" structure, which provides for lower group fee rates as total fund assets under FMR's management increase, and for higher group fee rates as total fund assets under FMR's management decrease. FMR calculates the group fee rates based on a tiered asset "breakpoint" schedule that varies based on asset class. The Board considered that the group fee is designed to deliver the benefits of economies of scale to fund shareholders when total Fidelity fund assets increase, even if assets of any particular fund are unchanged or have declined, because some portion of Fidelity's costs are attributable to services provided to all Fidelity funds, and all funds benefit if those costs can be allocated among more assets. The Board concluded that, given the group fee structure, fund shareholders will benefit from lower management fees as assets under FMR's management increase at the fund complex level, regardless of whether Fidelity achieves any such economies of scale.
Annual Report
The Board concluded, taking into account the analysis of the Economies of Scale Committee, that any potential economies of scale are being appropriately shared between fund shareholders and Fidelity.
Additional Information Requested by the Board. In order to develop fully the factual basis for consideration of the Fidelity funds' Advisory Contracts, the Board requested and received additional information on certain topics, including (i) fund performance trends, actions to be taken by FMR to improve certain funds' overall performance, and Fidelity's long-term strategies for certain funds; (ii) portfolio manager changes that have occurred during the past year and length of portfolio manager tenure for different categories of funds over time; (iii) Fidelity's compensation structure for portfolio managers and other key personnel and strategies for attracting and retaining non-investment personnel; (iv) the amount of the investment that each portfolio manager has made in the Fidelity fund(s) that he or she manages; (v) historical trends in Fidelity's realization of fall-out benefits; (vi) Fidelity's group fee structures and the rationale for the individual fee rates of certain funds; (vii) fund profitability methodology and the impact of certain factors on fund profitability results; (viii) trends regarding industry use of performance fee structures and Fidelity's compliance practices with respect to performance adjustment calculations; (ix) the fee structures in place for certain other Fidelity clients; and (x) explanations regarding the relative total expense ratios of certain funds and classes, total expense competitive trends, and actions that might be taken by FMR to reduce total expense ratios for certain funds and classes.
Based on its evaluation of all of the conclusions noted above, and after considering all factors it believed relevant, the Board ultimately concluded that the advisory fee structures are fair and reasonable, and that the fund's Advisory Contracts should be renewed.
Annual Report
Investment Adviser
Fidelity Management & Research Company
Boston, MA
Investment Sub-Advisers
FMR Co., Inc.
Fidelity Management & Research
(U.K.) Inc.
Fidelity Management & Research (Hong Kong) Limited
Fidelity Management & Research (Japan) Inc.
General Distributor
Fidelity Distributors Corporation
Boston, MA
Transfer and Service Agents
Fidelity Investments Institutional
Operations Company, Inc.
Boston, MA
Fidelity Service Company, Inc.
Boston, MA
Custodian
State Street Bank and Trust Company
Quincy, MA
AAGI-UANN-0112
1.786670.108
(Fidelity Investment logo)(registered trademark)
Fidelity Advisor®
Growth Strategies
Fund - Class A, Class T, Class B
and Class C
Annual Report
November 30, 2011
Contents
Chairman's Message | (Click Here) | The Chairman's message to shareholders. |
Performance | (Click Here) | How the fund has done over time. |
Management's Discussion of Fund Performance | (Click Here) | The Portfolio Manager's review of fund performance and strategy. |
Shareholder Expense Example | (Click Here) | An example of shareholder expenses. |
Investment Changes | (Click Here) | A summary of major shifts in the fund's investments over the past six months. |
Investments | (Click Here) | A complete list of the fund's investments with their market values. |
Financial Statements | (Click Here) | Statements of assets and liabilities, operations, and changes in net assets, as well as financial highlights. |
Notes | (Click Here) | Notes to the financial statements. |
Report of Independent Registered Public Accounting Firm | (Click Here) | |
Trustees and Officers | (Click Here) | |
Board Approval of Investment Advisory Contracts and Management Fees | (Click Here) | |
To view a fund's proxy voting guidelines and proxy voting record for the 12-month period ended June 30, visit http://www.fidelity.com/proxyvotingresults or visit the Securities and Exchange Commission's (SEC) web site at http://www.sec.gov. You may also call 1-877-208-0098 to request a free copy of the proxy voting guidelines.
Standard & Poor's, S&P and S&P 500 are registered service marks of The McGraw-Hill Companies, Inc. and have been licensed for use by Fidelity Distributors Corporation.
Other third party marks appearing herein are the property of their respective owners.
All other marks appearing herein are registered or unregistered trademarks or service marks of FMR LLC or an affiliated company.
Annual Report
This report and the financial statements contained herein are submitted for the general information of the shareholders of the fund. This report is not authorized for distribution to prospective investors in the fund unless preceded or accompanied by an effective prospectus.
A fund files its complete schedule of portfolio holdings with the SEC for the first and third quarters of each fiscal year on Form N-Q. Forms N-Q are available on the SEC's web site at http://www.sec.gov. A fund's Forms N-Q may be reviewed and copied at the SEC's Public Reference Room in Washington, DC. Information regarding the operation of the SEC's Public Reference Room may be obtained by calling 1-800-SEC-0330. For a complete list of a fund's portfolio holdings, view the most recent holdings listing, semiannual report, or annual report on Fidelity's web site at http://www.fidelity.com, http://www.advisor.fidelity.com, or http://www.401k.com, as applicable.
NOT FDIC INSURED • MAY LOSE VALUE • NO BANK GUARANTEE
Neither the fund nor Fidelity Distributors Corporation is a bank.
Annual Report
(Acting chairman's photo appears here)
Dear Shareholder:
The unusually high level of volatility that global equity markets have experienced since early August continued through the end of November. Most major indexes were unable to gain much traction during this time frame, as concern about the sovereign debt crisis in Europe continued to overshadow strong corporate earnings and better-than-expected economic news. High-grade bonds, meanwhile, fared slightly better amid periodic flights to quality. Financial markets are difficult to predict, of course, but you can help put the odds in your favor by following these time-tested investment principles.
One of the basic tenets is to invest according to your time horizon. For long-term investors, riding out the markets' inevitable ups and downs has proven much more effective than making decisions based on short-term developments. If your goal is approaching, you can also benefit from patience and restraint, rather than attempting to time the market. No matter your time horizon, missing only a few of the markets' best days can significantly diminish returns. Patience also affords the benefits of compounding - earning interest on additional income or reinvested dividends and capital gains. While staying the course doesn't eliminate risk, it can considerably lessen the negative impact of short-term downturns.
Asset allocation is another principle to manage risk. As you spread your portfolio among the asset classes, be sure to consider your time horizon, risk tolerance and investment objectives. Younger investors may be better served by emphasizing equities, which historically have been the best-performing asset class over time. Investors who are nearing a specific goal, such as retirement or sending a child to college, may choose to favor bonds and other investments that have tended to be more stable. Studies indicate that asset allocation is the single most important determinant of a portfolio's long-term success. After deciding on a suitable allocation strategy, make sure your portfolio is adequately diversified, with exposure to stocks of small-, mid- and large-cap companies in a range of sectors, for example. And today, more than ever, geographic diversification should be taken into account.
Lastly, investing a certain amount of money on a regular basis - a principle known as dollar-cost averaging - can help lower the average cost of your purchases, while also giving you the discipline to avoid selling weak performers just prior to an upswing, or chasing a hot performer just before a correction.
We invite you to learn more by visiting us on the Internet, dropping by one of our Investor Centers or calling us by phone. It is our privilege to provide the resources you need to choose investments that are right for you.
Sincerely,
(Acting chairman's signature appears here)
James C. Curvey
Acting Chairman
Annual Report
Average annual total return reflects the change in the value of an investment, assuming reinvestment of the class' distributions from dividend income and capital gains (the profits earned upon the sale of securities that have grown in value, if any) and assuming a constant rate of performance each year. The $10,000 table and the fund's returns do not reflect the deduction of taxes that a shareholder would pay on fund distributions or the redemption of fund shares. During periods of reimbursement by Fidelity, a fund's total return will be greater than it would be had the reimbursement not occurred. How a fund did yesterday is no guarantee of how it will do tomorrow. Returns reflect the conversion of Class B shares to Class A shares after a maximum of seven years.
Average Annual Total Returns
Periods ended November 30, 2011 | | Past 1
year | Past 5
years | Past 10
years |
Class A (incl. 5.75% sales charge) | | -5.86% | -2.45% | 1.42% |
Class T (incl. 3.50% sales charge) | | -3.84% | -2.22% | 1.40% |
Class B (incl. contingent deferred sales charge) A | | -5.81% | -2.36% | 1.47% |
Class C (incl. contingent deferred sales charge) B | | -1.84% | -2.02% | 1.26% |
A Class B shares' contingent deferred sales charges included in the past one year, past five years, and past 10 years total return figures are 5%, 2%, and 0%, respectively.
B Class C shares' contingent deferred sales charges included in the past one year, past five years, and past 10 years total return figures are 1%, 0%, and 0%, respectively.
Annual Report
Performance - continued
$10,000 Over 10 Years
Let's say hypothetically that $10,000 was invested in Fidelity Advisor® Growth Strategies Fund - Class A on November 30, 2001, and the current 5.75% sales charge was paid. The chart shows how the value of your investment would have changed, and also shows how the Russell Midcap® Growth Index performed over the same period.
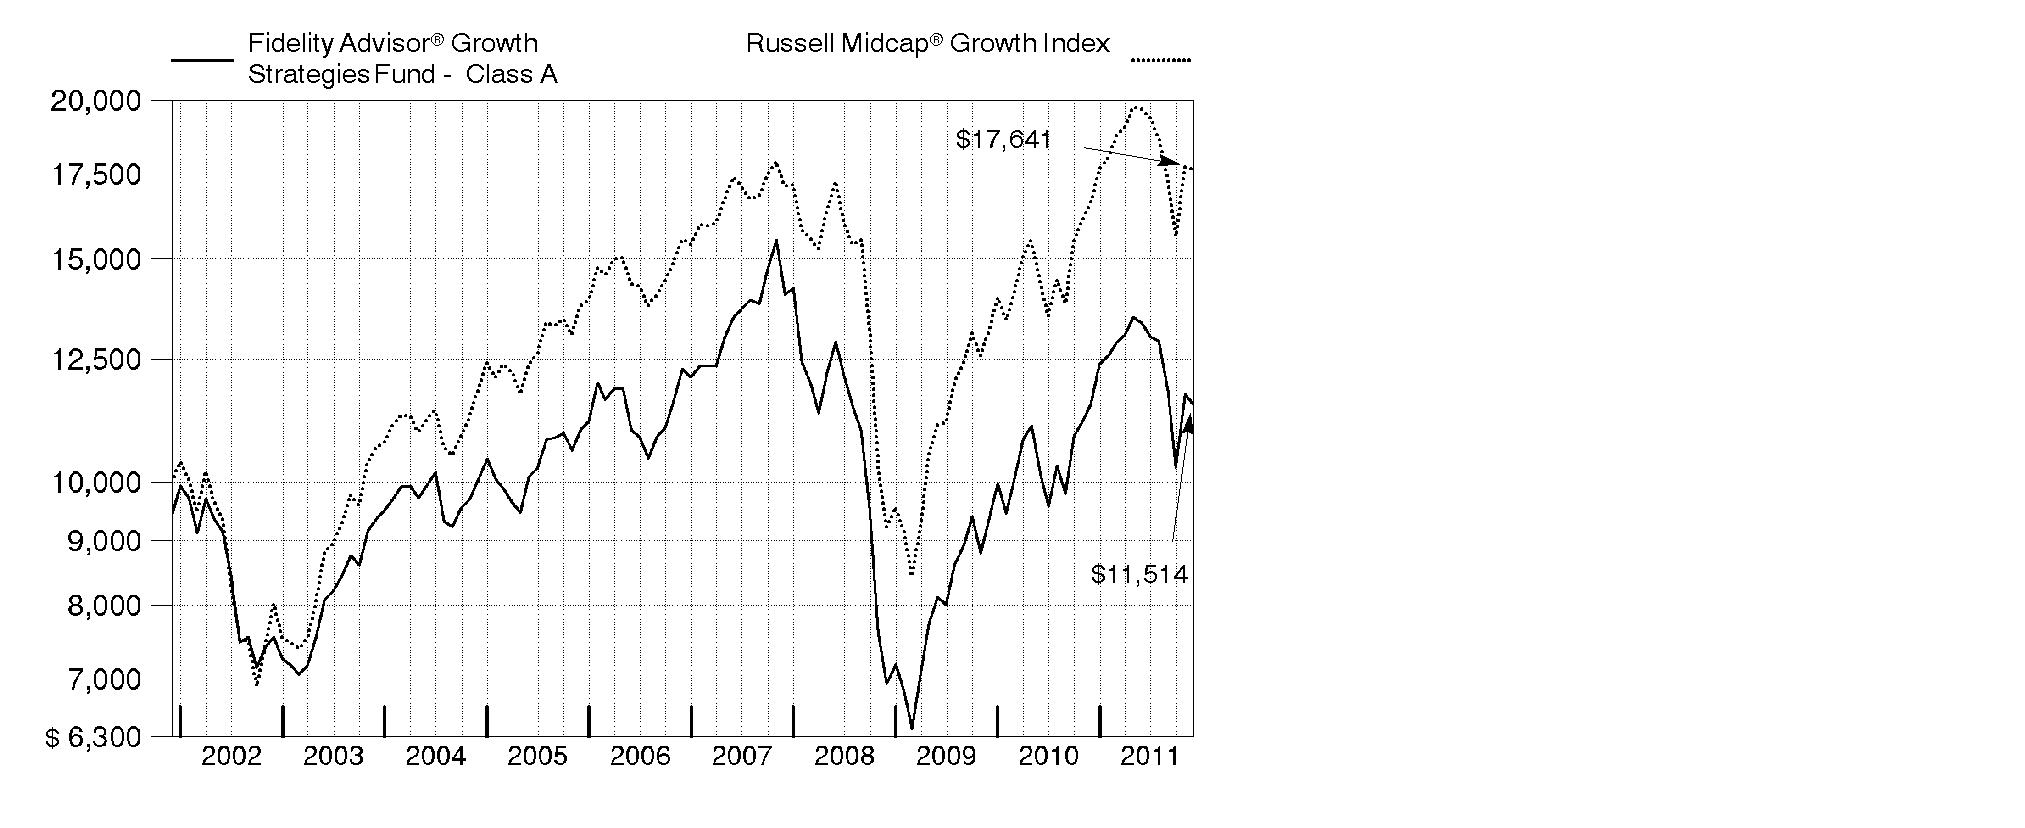
Annual Report
Market Recap: U.S. stocks overcame a sharp summer drop to post solid gains for the year ending November 30, 2011. Bullishness in the first half of the period gave way to a sudden reversal in July and August, as debate over the U.S. debt ceiling, a downgrade of the country's long-term sovereign credit rating and more debt woes in Europe led the S&P 500® Index to its worst calendar-quarter finish in almost three years. However, in October, a possible solution to the eurozone debt crisis and encouraging U.S. economic data fueled a rally that pushed the broad-based index up roughly 11%, its highest monthly return since December 1991. Although a Congressional stalemate over deficit reductions kept volatility alive in November, the S&P 500® finished the year up 7.83%, while the blue-chip Dow Jones Industrial AverageSM added 12.39% and the technology-heavy Nasdaq Composite® Index rose 5.93%. Within the S&P 500®, sector performance was mixed, with financials (-10%) struggling, while the defensive utilities (+20%) and consumer staples (+16%) segments fared best. Small and mid-sized stocks posted more-modest gains than their large-cap counterparts, with the Russell 2000® and Russell Midcap® indexes adding 2.75% and 5.39%, respectively. Uncertainty in Europe hurt foreign developed-markets stocks, as the MSCI® EAFE® (Europe, Australasia, Far East) Index fell 4.01%.
Comments from Steven Calhoun, Portfolio Manager of Fidelity Advisor® Growth Strategies Fund: During the year, the fund's Class A, Class T, Class B and Class C shares returned -0.11%, -0.35%, -0.85% and -0.85%, respectively (excluding sales charges), significantly trailing the 6.07% gain of the Russell Midcap® Growth Index. Versus the index, the biggest head wind was weak stock picking in the consumer discretionary sector. My picks in energy, financials and industrials also detracted. Biotechnology firm Human Genome Sciences was the largest individual detractor. The company's launch of its lupus drug, BENLYSTA®, failed to meet the market's expectations. Other detractors included untimely ownership of online travel site Expedia, which I sold, and positions in China-based seed supplier Origin Agritech and Ultrapetrol (Bahamas), a marine transportation provider. Conversely, positioning in information technology and consumer staples bolstered performance the most. U.K.-based Autonomy - a maker of information management software - was the largest relative contributor, boosted in August by a lucrative takeover bid from Hewlett-Packard. I sold the stock before the deal closed in October. Also lifting our results were biopharmaceutical firm Inhibitex and Heckmann, which transports and remediates waste water created when natural gas is extracted from shale beds. Most of the stocks I've mentioned were not part of the benchmark.
The views expressed above reflect those of the portfolio manager(s) only through the end of the period as stated on the cover of this report and do not necessarily represent the views of Fidelity or any other person in the Fidelity organization. Any such views are subject to change at any time based upon market or other conditions and Fidelity disclaims any responsibility to update such views. These views may not be relied on as investment advice and, because investment decisions for a Fidelity fund are based on numerous factors, may not be relied on as an indication of trading intent on behalf of any Fidelity fund.
Annual Report
Shareholder Expense Example
As a shareholder of the Fund, you incur two types of costs: (1) transaction costs, including sales charges (loads) on purchase payments or redemption proceeds, and (2) ongoing costs, including management fees, distribution and/or service (12b-1) fees and other Fund expenses. This Example is intended to help you understand your ongoing costs (in dollars) of investing in the Fund and to compare these costs with the ongoing costs of investing in other mutual funds.
The Example is based on an investment of $1,000 invested at the beginning of the period and held for the entire period (June 1, 2011 to November 30, 2011).
Actual Expenses
The first line of the accompanying table for each class of the Fund provides information about actual account values and actual expenses. You may use the information in this line, together with the amount you invested, to estimate the expenses that you paid over the period. Simply divide your account value by $1,000.00 (for example, an $8,600 account value divided by $1,000.00 = 8.6), then multiply the result by the number in the first line for a class of the Fund under the heading entitled "Expenses Paid During Period" to estimate the expenses you paid on your account during this period. In addition, the Fund, as a shareholder in the underlying Fidelity Central Funds, will indirectly bear its pro-rata share of the fees and expenses incurred by the underlying Fidelity Central Funds. These fees and expenses are not included in the Fund's annualized expense ratio used to calculate the expense estimate in the table below.
Hypothetical Example for Comparison Purposes
The second line of the accompanying table for each class of the Fund provides information about hypothetical account values and hypothetical expenses based on a Class' actual expense ratio and an assumed rate of return of 5% per year before expenses, which is not the Class' actual return. The hypothetical account values and expenses may not be used to estimate the actual ending account balance or expenses you paid for the period. You may use this information to compare the ongoing costs of investing in the Fund and other funds. To do so, compare this 5% hypothetical example with the 5% hypothetical examples that appear in the shareholder reports of the other funds. In addition, the Fund, as a shareholder in the underlying Fidelity Central Funds, will indirectly bear its pro-rata share of the fees and expenses incurred by the underlying Fidelity Central Funds. These fees and expenses are not included in the Fund's annualized expense ratio used to calculate the expense estimate in the table below.
Please note that the expenses shown in the table are meant to highlight your ongoing costs only and do not reflect any transaction costs. Therefore, the second line of the table is useful in comparing ongoing costs only, and will not help you determine the relative total costs of owning different funds. In addition, if these transactional costs were included, your costs would have been higher.
Annual Report
| Annualized
Expense Ratio | Beginning
Account Value
June 1, 2011 | Ending
Account Value
November 30, 2011 | Expenses Paid
During Period*
June 1, 2011 to
November 30, 2011 |
Class A | 1.25% | | | |
Actual | | $ 1,000.00 | $ 863.10 | $ 5.84 |
HypotheticalA | | $ 1,000.00 | $ 1,018.80 | $ 6.33 |
Class T | 1.50% | | | |
Actual | | $ 1,000.00 | $ 861.60 | $ 7.00 |
HypotheticalA | | $ 1,000.00 | $ 1,017.55 | $ 7.59 |
Class B | 2.00% | | | |
Actual | | $ 1,000.00 | $ 859.90 | $ 9.32 |
HypotheticalA | | $ 1,000.00 | $ 1,015.04 | $ 10.10 |
Class C | 2.00% | | | |
Actual | | $ 1,000.00 | $ 859.90 | $ 9.32 |
HypotheticalA | | $ 1,000.00 | $ 1,015.04 | $ 10.10 |
Institutional Class | 1.00% | | | |
Actual | | $ 1,000.00 | $ 864.30 | $ 4.67 |
HypotheticalA | | $ 1,000.00 | $ 1,020.05 | $ 5.06 |
A 5% return per year before expenses
* Expenses are equal to each Class' annualized expense ratio, multiplied by the average account value over the period, multiplied by 183/365 (to reflect the one-half year period).
Annual Report
Investment Changes (Unaudited)
Top Ten Stocks as of November 30, 2011 |
| % of fund's
net assets | % of fund's net assets
6 months ago |
Walter Energy, Inc. | 2.1 | 0.0 |
Cyberonics, Inc. | 2.1 | 1.0 |
Alpha Natural Resources, Inc. | 2.0 | 0.0 |
Heckmann Corp. | 2.0 | 1.3 |
ArthroCare Corp. | 2.0 | 1.1 |
Citrix Systems, Inc. | 1.8 | 0.0 |
CNH Global NV | 1.7 | 1.0 |
Bumi PLC | 1.7 | 1.6 |
Ingersoll-Rand Co. Ltd. | 1.6 | 1.0 |
CVR Partners LP | 1.5 | 1.1 |
| 18.5 | |
Top Five Market Sectors as of November 30, 2011 |
| % of fund's
net assets | % of fund's net assets
6 months ago |
Information Technology | 22.1 | 19.0 |
Consumer Discretionary | 17.5 | 21.0 |
Health Care | 15.1 | 12.5 |
Energy | 14.1 | 12.5 |
Industrials | 12.6 | 12.5 |
Asset Allocation (% of fund's net assets) |
As of November 30, 2011 * | As of May 31, 2011 ** |
 | Stocks 97.9% | | | Stocks 99.5% | |
 | Short-Term
Investments and
Net Other Assets 2.1% | | | Short-Term
Investments and
Net Other Assets 0.5% | |
* Foreign investments | 10.7% | | ** Foreign investments | 20.5% | |

Annual Report
Investments November 30, 2011
Showing Percentage of Net Assets
Common Stocks - 97.9% |
| Shares | | Value |
CONSUMER DISCRETIONARY - 17.5% |
Automobiles - 0.8% |
Tesla Motors, Inc. (a) | 8,219 | | $ 269,090 |
Diversified Consumer Services - 1.0% |
Weight Watchers International, Inc. | 5,419 | | 318,475 |
Hotels, Restaurants & Leisure - 2.1% |
BJ's Restaurants, Inc. (a) | 3,489 | | 167,751 |
Buffalo Wild Wings, Inc. (a) | 2,700 | | 174,096 |
Panera Bread Co. Class A (a) | 1,529 | | 219,228 |
Texas Roadhouse, Inc. Class A | 11,300 | | 151,307 |
| | 712,382 |
Media - 1.0% |
Discovery Communications, Inc. (a) | 7,987 | | 335,294 |
Multiline Retail - 1.1% |
Dollar Tree, Inc. (a) | 4,424 | | 360,512 |
Specialty Retail - 5.7% |
Abercrombie & Fitch Co. Class A | 4,773 | | 228,674 |
Body Central Corp. (a) | 8,111 | | 173,413 |
Limited Brands, Inc. | 9,835 | | 416,316 |
Tiffany & Co., Inc. | 6,986 | | 468,341 |
Tractor Supply Co. | 5,438 | | 392,787 |
Ulta Salon, Cosmetics & Fragrance, Inc. (a) | 2,800 | | 194,964 |
| | 1,874,495 |
Textiles, Apparel & Luxury Goods - 5.8% |
Liz Claiborne, Inc. (a)(d) | 44,767 | | 370,223 |
PVH Corp. | 5,448 | | 369,865 |
Ralph Lauren Corp. | 3,294 | | 467,287 |
Under Armour, Inc. Class A (sub. vtg.) (a) | 4,524 | | 367,937 |
Warnaco Group, Inc. (a) | 6,700 | | 339,623 |
| | 1,914,935 |
TOTAL CONSUMER DISCRETIONARY | | 5,785,183 |
CONSUMER STAPLES - 4.8% |
Beverages - 0.5% |
Hansen Natural Corp. (a) | 1,917 | | 176,747 |
Food & Staples Retailing - 1.4% |
Whole Foods Market, Inc. | 7,000 | | 476,700 |
Common Stocks - continued |
| Shares | | Value |
CONSUMER STAPLES - continued |
Food Products - 2.4% |
Green Mountain Coffee Roasters, Inc. (a)(d) | 6,081 | | $ 318,827 |
Mead Johnson Nutrition Co. Class A | 4,553 | | 343,114 |
Origin Agritech Ltd. (a) | 43,886 | | 113,226 |
| | 775,167 |
Tobacco - 0.5% |
Lorillard, Inc. | 1,531 | | 170,890 |
TOTAL CONSUMER STAPLES | | 1,599,504 |
ENERGY - 14.1% |
Energy Equipment & Services - 3.3% |
Cameron International Corp. (a) | 6,700 | | 361,733 |
Dresser-Rand Group, Inc. (a) | 7,453 | | 388,078 |
Rowan Companies, Inc. (a) | 10,100 | | 342,491 |
| | 1,092,302 |
Oil, Gas & Consumable Fuels - 10.8% |
Alpha Natural Resources, Inc. (a) | 27,434 | | 658,416 |
Amyris, Inc. (a)(d) | 10,264 | | 115,675 |
Bumi PLC | 39,947 | | 549,816 |
Cabot Oil & Gas Corp. | 4,800 | | 425,232 |
EV Energy Partners LP | 4,738 | | 323,369 |
EXCO Resources, Inc. (d) | 32,486 | | 386,908 |
Oasis Petroleum, Inc. (a)(d) | 10,666 | | 324,993 |
QEP Resources, Inc. | 9,600 | | 313,440 |
Range Resources Corp. | 4,800 | | 344,208 |
Solazyme, Inc. (d) | 10,000 | | 116,700 |
| | 3,558,757 |
TOTAL ENERGY | | 4,651,059 |
FINANCIALS - 1.1% |
Real Estate Investment Trusts - 1.0% |
SL Green Realty Corp. | 4,873 | | 320,838 |
Real Estate Management & Development - 0.1% |
Altisource Portfolio Solutions SA (a) | 700 | | 33,327 |
TOTAL FINANCIALS | | 354,165 |
Common Stocks - continued |
| Shares | | Value |
HEALTH CARE - 15.1% |
Biotechnology - 6.5% |
Alexion Pharmaceuticals, Inc. (a) | 4,749 | | $ 326,066 |
Human Genome Sciences, Inc. (a) | 29,638 | | 227,323 |
Idenix Pharmaceuticals, Inc. (a) | 49,945 | | 379,582 |
Inhibitex, Inc. (a) | 26,246 | | 383,192 |
Theravance, Inc. (a) | 8,300 | | 193,722 |
United Therapeutics Corp. (a) | 7,800 | | 319,098 |
Vertex Pharmaceuticals, Inc. (a) | 11,300 | | 327,587 |
| | 2,156,570 |
Health Care Equipment & Supplies - 7.8% |
ArthroCare Corp. (a) | 21,730 | | 647,771 |
Cyberonics, Inc. (a) | 23,073 | | 699,804 |
Insulet Corp. (a) | 9,488 | | 176,287 |
NuVasive, Inc. (a) | 30,343 | | 418,733 |
Volcano Corp. (a) | 6,558 | | 161,786 |
Zeltiq Aesthetics, Inc. | 5,349 | | 76,491 |
Zoll Medical Corp. (a) | 8,502 | | 391,347 |
| | 2,572,219 |
Health Care Technology - 0.8% |
Merge Healthcare, Inc. (a) | 49,572 | | 268,185 |
TOTAL HEALTH CARE | | 4,996,974 |
INDUSTRIALS - 12.6% |
Aerospace & Defense - 1.1% |
BE Aerospace, Inc. (a) | 9,400 | | 366,130 |
Building Products - 2.5% |
Lennox International, Inc. | 12,080 | | 400,210 |
Owens Corning (a) | 14,400 | | 413,280 |
| | 813,490 |
Construction & Engineering - 1.0% |
Fluor Corp. | 6,200 | | 339,884 |
Electrical Equipment - 2.4% |
Cooper Industries PLC Class A | 7,400 | | 410,922 |
Roper Industries, Inc. | 4,700 | | 400,393 |
| | 811,315 |
Machinery - 5.2% |
CNH Global NV (a) | 14,326 | | 569,029 |
IDEX Corp. | 5,900 | | 215,114 |
Common Stocks - continued |
| Shares | | Value |
INDUSTRIALS - continued |
Machinery - continued |
Ingersoll-Rand PLC | 16,475 | | $ 545,652 |
WABCO Holdings, Inc. (a) | 8,490 | | 399,115 |
| | 1,728,910 |
Marine - 0.4% |
Ultrapetrol (Bahamas) Ltd. (a) | 45,157 | | 122,375 |
TOTAL INDUSTRIALS | | 4,182,104 |
INFORMATION TECHNOLOGY - 22.1% |
Communications Equipment - 1.6% |
Polycom, Inc. (a) | 22,475 | | 379,828 |
Riverbed Technology, Inc. (a) | 5,100 | | 132,600 |
| | 512,428 |
Computers & Peripherals - 0.9% |
SanDisk Corp. (a) | 5,800 | | 285,998 |
Electronic Equipment & Components - 1.0% |
Maxwell Technologies, Inc. (a) | 18,874 | | 320,292 |
Internet Software & Services - 2.7% |
Blinkx PLC (a) | 74,691 | | 87,915 |
Rackspace Hosting, Inc. (a) | 7,948 | | 344,784 |
Velti PLC (a) | 12,443 | | 92,078 |
VeriSign, Inc. | 10,900 | | 366,022 |
| | 890,799 |
IT Services - 1.1% |
Cognizant Technology Solutions Corp. Class A (a) | 5,361 | | 361,063 |
Semiconductors & Semiconductor Equipment - 5.0% |
ASML Holding NV | 4,200 | | 166,026 |
Ceva, Inc. (a) | 10,638 | | 306,481 |
Freescale Semiconductor Holdings I Ltd. | 10,200 | | 129,234 |
KLA-Tencor Corp. | 5,900 | | 271,990 |
Lam Research Corp. (a) | 6,100 | | 248,697 |
NVIDIA Corp. (a) | 24,600 | | 384,498 |
NXP Semiconductors NV (a) | 9,600 | | 162,240 |
| | 1,669,166 |
Software - 9.8% |
ANSYS, Inc. (a) | 7,229 | | 447,981 |
Ariba, Inc. (a) | 6,500 | | 197,275 |
Autodesk, Inc. (a) | 11,200 | | 381,584 |
Citrix Systems, Inc. (a) | 8,535 | | 609,314 |
Common Stocks - continued |
| Shares | | Value |
INFORMATION TECHNOLOGY - continued |
Software - continued |
Informatica Corp. (a) | 7,903 | | $ 355,279 |
Intuit, Inc. | 8,200 | | 436,568 |
Magma Design Automation, Inc. (a) | 79,157 | | 452,778 |
Nuance Communications, Inc. (a) | 6,814 | | 167,488 |
Rovi Corp. (a) | 7,456 | | 206,904 |
| | 3,255,171 |
TOTAL INFORMATION TECHNOLOGY | | 7,294,917 |
MATERIALS - 8.6% |
Chemicals - 4.9% |
CF Industries Holdings, Inc. | 2,157 | | 301,549 |
CVR Partners LP | 21,673 | | 496,312 |
Monsanto Co. | 4,400 | | 323,180 |
Rentech Nitrogen Partners LP | 8,500 | | 161,500 |
The Mosaic Co. | 6,200 | | 327,112 |
| | 1,609,653 |
Metals & Mining - 3.7% |
First Quantum Minerals Ltd. | 11,900 | | 240,345 |
Genel Energy PLC | 5,500 | | 75,959 |
Ivanhoe Mines Ltd. (a) | 10,400 | | 224,325 |
Walter Energy, Inc. (d) | 9,800 | | 702,661 |
| | 1,243,290 |
TOTAL MATERIALS | | 2,852,943 |
UTILITIES - 2.0% |
Water utilities - 2.0% |
Heckmann Corp. (a)(d) | 111,797 | | 654,012 |
TOTAL COMMON STOCKS (Cost $34,527,195) |
32,370,861
|
Money Market Funds - 10.4% |
| Shares | | Value |
Fidelity Cash Central Fund, 0.11% (b) | 920,565 | | $ 920,565 |
Fidelity Securities Lending Cash Central Fund, 0.11% (b)(c) | 2,510,847 | | 2,510,847 |
TOTAL MONEY MARKET FUNDS (Cost $3,431,412) |
3,431,412
|
TOTAL INVESTMENT PORTFOLIO - 108.3% (Cost $37,958,607) | | 35,802,273 |
NET OTHER ASSETS (LIABILITIES) - (8.3)% | | (2,728,867) |
NET ASSETS - 100% | $ 33,073,406 |
Legend |
(a) Non-income producing |
(b) Affiliated fund that is available only to investment companies and other accounts managed by Fidelity Investments. The rate quoted is the annualized seven-day yield of the fund at period end. A complete unaudited listing of the fund's holdings as of its most recent quarter end is available upon request. In addition, each Fidelity Central Fund's financial statements, which are not covered by the Fund's Report of Independent Registered Public Accounting Firm, are available on the SEC's website or upon request. |
(c) Investment made with cash collateral received from securities on loan. |
(d) Security or a portion of the security is on loan at period end. |
Affiliated Central Funds |
Information regarding fiscal year to date income earned by the Fund from investments in Fidelity Central Funds is as follows: |
Fund | Income earned |
Fidelity Cash Central Fund | $ 892 |
Fidelity Securities Lending Cash Central Fund | 6,036 |
Total | $ 6,928 |
Other Information |
All investments are categorized as Level 1 under the Fair Value Hierarchy. The inputs or methodology used for valuing securities may not be an indication of the risk associated with investing in those securities. For more information on valuation inputs, please refer to the Security Valuation section in the accompanying Notes to Financial Statements. |
The following is a reconciliation of Investments in Securities for which Level 3 inputs were used in determining value: |
Investments in Securities: | |
Beginning Balance | $ 157,298 |
Total Realized Gain (Loss) | - |
Total Unrealized Gain (Loss) | - |
Cost of Purchases | - |
Proceeds of Sales | (157,298) |
Amortization/Accretion | - |
Transfers in to Level 3 | - |
Transfers out of Level 3 | - |
Ending Balance | $ - |
The change in unrealized gain (loss) for the period attributable to Level 3 securities held at November 30, 2011 | $ - |
The information used in the above reconciliation represents fiscal year to date activity for any Investments in Securities identified as using Level 3 inputs at either the beginning or the end of the current fiscal period. Transfers in or out of Level 3 represent the beginning value of any Security or Instrument where a change in the pricing level occurred from the beginning to the end of the period. The cost of purchases and the proceeds of sales may include securities received or delivered through corporate actions or exchanges. Realized and unrealized gains (losses) disclosed in the reconciliation are included in Net Gain (Loss) on the Fund's Statement of Operations. |
Distribution of investments by country of issue, as a percentage of total net assets, is as follows: (Unaudited) |
United States of America | 89.3% |
Ireland | 2.8% |
Netherlands | 2.7% |
United Kingdom | 2.2% |
Canada | 1.4% |
Others (Individually Less Than 1%) | 1.6% |
| 100.0% |
Income Tax Information |
At November 30, 2011, the Fund had a capital loss carryforward of approximately $3,661,318 of which $3,410,913 and $250,405 will expire in fiscal 2016 and 2017, respectively. Capital loss carryforwards are only available to offset future capital gains of the Fund to the extent provided by regulations and may be limited. |
See accompanying notes which are an integral part of the financial statements.
Annual Report
Statement of Assets and Liabilities
| November 30, 2011 |
| | |
Assets | | |
Investment in securities, at value (including securities loaned of $2,591,651) - See accompanying schedule: Unaffiliated issuers (cost $34,527,195) | $ 32,370,861 | |
Fidelity Central Funds (cost $3,431,412) | 3,431,412 | |
Total Investments (cost $37,958,607) | | $ 35,802,273 |
Receivable for investments sold | | 452,172 |
Receivable for fund shares sold | | 33,094 |
Dividends receivable | | 13,342 |
Distributions receivable from Fidelity Central Funds | | 1,386 |
Prepaid expenses | | 123 |
Other receivables | | 1,129 |
Total assets | | 36,303,519 |
| | |
Liabilities | | |
Payable for investments purchased | $ 496,387 | |
Payable for fund shares redeemed | 139,987 | |
Accrued management fee | 13,421 | |
Distribution and service plan fees payable | 14,118 | |
Other affiliated payables | 8,961 | |
Other payables and accrued expenses | 46,392 | |
Collateral on securities loaned, at value | 2,510,847 | |
Total liabilities | | 3,230,113 |
| | |
Net Assets | | $ 33,073,406 |
Net Assets consist of: | | |
Paid in capital | | $ 39,180,057 |
Accumulated net investment loss | | (13) |
Accumulated undistributed net realized gain (loss) on investments and foreign currency transactions | | (3,950,217) |
Net unrealized appreciation (depreciation) on investments and assets and liabilities in foreign currencies | | (2,156,421) |
Net Assets | | $ 33,073,406 |
See accompanying notes which are an integral part of the financial statements.
Annual Report
Financial Statements - continued
Statement of Assets and Liabilities - continued
| November 30, 2011 |
| | |
Calculation of Maximum Offering Price Class A:
Net Asset Value and redemption price per share ($10,792,025 ÷ 1,221,790 shares) | | $ 8.83 |
| | |
Maximum offering price per share (100/94.25 of $8.83) | | $ 9.37 |
Class T:
Net Asset Value and redemption price per share ($14,670,819 ÷ 1,707,516 shares) | | $ 8.59 |
| | |
Maximum offering price per share (100/96.50 of $8.59) | | $ 8.90 |
Class B:
Net Asset Value and offering price per share ($2,120,392 ÷ 259,823 shares)A | | $ 8.16 |
| | |
Class C:
Net Asset Value and offering price per share ($4,869,544 ÷ 596,486 shares)A | | $ 8.16 |
| | |
Institutional Class:
Net Asset Value, offering price and redemption price per share ($620,626 ÷ 68,142 shares) | | $ 9.11 |
A Redemption price per share is equal to net asset value less any applicable contingent deferred sales charge.
See accompanying notes which are an integral part of the financial statements.
Annual Report
Statement of Operations
| Year ended November 30, 2011 |
| | |
Investment Income | | |
Dividends | | $ 196,708 |
Interest | | 1 |
Income from Fidelity Central Funds | | 6,928 |
Total income | | 203,637 |
| | |
Expenses | | |
Management fee
Basic fee | $ 220,305 | |
Performance adjustment | (58,076) | |
Transfer agent fees | 117,754 | |
Distribution and service plan fees | 191,543 | |
Accounting and security lending fees | 14,308 | |
Custodian fees and expenses | 24,148 | |
Independent trustees' compensation | 202 | |
Registration fees | 59,208 | |
Audit | 62,247 | |
Legal | 233 | |
Miscellaneous | 332 | |
Total expenses before reductions | 632,204 | |
Expense reductions | (83,665) | 548,539 |
Net investment income (loss) | | (344,902) |
Realized and Unrealized Gain (Loss) Net realized gain (loss) on: | | |
Investment securities: | | |
Unaffiliated issuers | 5,072,861 | |
Foreign currency transactions | 1,784 | |
Total net realized gain (loss) | | 5,074,645 |
Change in net unrealized appreciation (depreciation) on: Investment securities | (4,750,746) | |
Assets and liabilities in foreign currencies | (88) | |
Total change in net unrealized appreciation (depreciation) | | (4,750,834) |
Net gain (loss) | | 323,811 |
Net increase (decrease) in net assets resulting from operations | | $ (21,091) |
See accompanying notes which are an integral part of the financial statements.
Annual Report
Financial Statements - continued
Statement of Changes in Net Assets
| Year ended
November 30,
2011 | Year ended
November 30,
2010 |
Increase (Decrease) in Net Assets | | |
Operations | | |
Net investment income (loss) | $ (344,902) | $ (348,051) |
Net realized gain (loss) | 5,074,645 | 4,572,068 |
Change in net unrealized appreciation (depreciation) | (4,750,834) | 2,310,518 |
Net increase (decrease) in net assets resulting
from operations | (21,091) | 6,534,535 |
Share transactions - net increase (decrease) | (1,727,692) | (1,781,693) |
Total increase (decrease) in net assets | (1,748,783) | 4,752,842 |
| | |
Net Assets | | |
Beginning of period | 34,822,189 | 30,069,347 |
End of period (including accumulated net investment loss of $13 and $0, respectively) | $ 33,073,406 | $ 34,822,189 |
See accompanying notes which are an integral part of the financial statements.
Annual Report
Financial Highlights - Class A
Years ended November 30, | 2011 | 2010 | 2009 | 2008 | 2007 |
Selected Per-Share Data | | | | |
Net asset value, beginning of period | $ 8.84 | $ 7.18 | $ 5.32 | $ 12.05 | $ 10.53 |
Income from Investment Operations | | | | | |
Net investment income (loss) C | (.06) | (.06) | (.04) F | (.02) G | (.10) |
Net realized and unrealized gain (loss) | .05 | 1.72 | 1.90 | (5.44) | 1.62 |
Total from investment operations | (.01) | 1.66 | 1.86 | (5.46) | 1.52 |
Distributions from net realized gain | - | - | - | (1.27) | - |
Net asset value, end of period | $ 8.83 | $ 8.84 | $ 7.18 | $ 5.32 | $ 12.05 |
Total Return A, B | (.11)% | 23.12% | 34.96% | (50.65)% | 14.43% |
Ratios to Average Net Assets D, H | | | | |
Expenses before reductions | 1.45% | 1.43% | 1.68% | 1.63% | 1.53% |
Expenses net of fee waivers, if any | 1.25% | 1.30% | 1.30% | 1.30% | 1.30% |
Expenses net of all reductions | 1.24% | 1.29% | 1.28% | 1.28% | 1.29% |
Net investment income (loss) | (.67)% | (.77)% | (.58)% F | (.21)% G | (.85)% |
Supplemental Data | | | | |
Net assets, end of period (000 omitted) | $ 10,792 | $ 10,971 | $ 9,369 | $ 6,492 | $ 12,665 |
Portfolio turnover rate E | 176% | 123% | 301% | 276% | 177% |
A Total returns would have been lower if certain expenses had not been reduced during the applicable periods shown.
B Total returns do not include the effect of the sales charges.
C Calculated based on average shares outstanding during the period.
D Fees and expenses of any underlying Fidelity Central Funds are not included in the Fund's expense ratio. The Fund indirectly bears its proportionate share of the expenses of any underlying Fidelity Central Funds.
E Amount does not include the portfolio activity of any underlying Fidelity Central Funds.
F Investment income per share reflects a special dividend which amounted to $.01 per share. Excluding the special dividend, the ratio of net investment income (loss) to average net assets would have been (.66)%.
G Investment income per share reflects a special dividend which amounted to $.01 per share. Excluding the special dividend, the ratio of net investment income (loss) to average net assets would have been (.34)%.
H Expense ratios reflect operating expenses of the class. Expenses before reductions do not reflect amounts reimbursed by the investment adviser or reductions from brokerage service arrangements or reductions from other expense offset arrangements and do not represent the amount paid by the class during periods when reimbursements or reductions occur. Expenses net of fee waivers reflect expenses after reimbursement by the investment adviser but prior to reductions from brokerage service arrangements or other expense offset arrangements. Expenses net of all reductions represent the net expenses paid by the class.
See accompanying notes which are an integral part of the financial statements.
Annual Report
Financial Highlights - Class T
Years ended November 30, | 2011 | 2010 | 2009 | 2008 | 2007 |
Selected Per-Share Data | | | | |
Net asset value, beginning of period | $ 8.62 | $ 7.02 | $ 5.21 | $ 11.83 | $ 10.36 |
Income from Investment Operations | | | | | |
Net investment income (loss) C | (.08) | (.08) | (.05) F | (.04) G | (.12) |
Net realized and unrealized gain (loss) | .05 | 1.68 | 1.86 | (5.34) | 1.59 |
Total from investment operations | (.03) | 1.60 | 1.81 | (5.38) | 1.47 |
Distributions from net realized gain | - | - | - | (1.24) | - |
Net asset value, end of period | $ 8.59 | $ 8.62 | $ 7.02 | $ 5.21 | $ 11.83 |
Total Return A, B | (.35)% | 22.79% | 34.74% | (50.81)% | 14.19% |
Ratios to Average Net Assets D, H | | | | |
Expenses before reductions | 1.75% | 1.73% | 2.04% | 1.94% | 1.88% |
Expenses net of fee waivers, if any | 1.50% | 1.55% | 1.55% | 1.55% | 1.55% |
Expenses net of all reductions | 1.49% | 1.54% | 1.53% | 1.53% | 1.54% |
Net investment income (loss) | (.92)% | (1.02)% | (.83)% F | (.46)% G | (1.10)% |
Supplemental Data | | | | |
Net assets, end of period (000 omitted) | $ 14,671 | $ 14,612 | $ 12,462 | $ 9,388 | $ 19,144 |
Portfolio turnover rate E | 176% | 123% | 301% | 276% | 177% |
A Total returns would have been lower if certain expenses had not been reduced during the applicable periods shown.
B Total returns do not include the effect of the sales charges.
C Calculated based on average shares outstanding during the period.
D Fees and expenses of any underlying Fidelity Central Funds are not included in the Fund's expense ratio. The Fund indirectly bears its proportionate share of the expenses of any underlying Fidelity Central Funds.
E Amount does not include the portfolio activity of any underlying Fidelity Central Funds.
F Investment income per share reflects a special dividend which amounted to $.01 per share. Excluding the special dividend, the ratio of net investment income (loss) to average net assets would have been (.91)%.
G Investment income per share reflects a special dividend which amounted to $.01 per share. Excluding the special dividend, the ratio of net investment income (loss) to average net assets would have been (.59)%.
H Expense ratios reflect operating expenses of the class. Expenses before reductions do not reflect amounts reimbursed by the investment adviser or reductions from brokerage service arrangements or reductions from other expense offset arrangements and do not represent the amount paid by the class during periods when reimbursements or reductions occur. Expenses net of fee waivers reflect expenses after reimbursement by the investment adviser but prior to reductions from brokerage service arrangements or other expense offset arrangements. Expenses net of all reductions represent the net expenses paid by the class.
See accompanying notes which are an integral part of the financial statements.
Annual Report
Financial Highlights - Class B
Years ended November 30, | 2011 | 2010 | 2009 | 2008 | 2007 |
Selected Per-Share Data | | | | |
Net asset value, beginning of period | $ 8.23 | $ 6.74 | $ 5.02 | $ 11.44 | $ 10.06 |
Income from Investment Operations | | | | | |
Net investment income (loss) C | (.13) | (.11) | (.08) F | (.08) G | (.17) |
Net realized and unrealized gain (loss) | .06 | 1.60 | 1.80 | (5.17) | 1.55 |
Total from investment operations | (.07) | 1.49 | 1.72 | (5.25) | 1.38 |
Distributions from net realized gain | - | - | - | (1.17) | - |
Net asset value, end of period | $ 8.16 | $ 8.23 | $ 6.74 | $ 5.02 | $ 11.44 |
Total Return A, B | (.85)% | 22.11% | 34.26% | (51.11)% | 13.72% |
Ratios to Average Net Assets D, H | | | | |
Expenses before reductions | 2.20% | 2.18% | 2.47% | 2.39% | 2.28% |
Expenses net of fee waivers, if any | 2.00% | 2.05% | 2.05% | 2.05% | 2.05% |
Expenses net of all reductions | 1.99% | 2.04% | 2.03% | 2.04% | 2.04% |
Net investment income (loss) | (1.42)% | (1.52)% | (1.33)% F | (.96)% G | (1.60)% |
Supplemental Data | | | | |
Net assets, end of period (000 omitted) | $ 2,120 | $ 3,095 | $ 3,272 | $ 3,203 | $ 9,082 |
Portfolio turnover rate E | 176% | 123% | 301% | 276% | 177% |
A Total returns would have been lower if certain expenses had not been reduced during the applicable periods shown.
B Total returns do not include the effect of the contingent deferred sales charge.
C Calculated based on average shares outstanding during the period.
D Fees and expenses of any underlying Fidelity Central Funds are not included in the Fund's expense ratio. The Fund indirectly bears its proportionate share of the expenses of any underlying Fidelity Central Funds.
E Amount does not include the portfolio activity of any underlying Fidelity Central Funds.
F Investment income per share reflects a special dividend which amounted to $.01 per share. Excluding the special dividend, the ratio of net investment income (loss) to average net assets would have been (1.41)%.
G Investment income per share reflects a special dividend which amounted to $.01 per share. Excluding the special dividend, the ratio of net investment income (loss) to average net assets would have been (1.09)%.
H Expense ratios reflect operating expenses of the class. Expenses before reductions do not reflect amounts reimbursed by the investment adviser or reductions from brokerage service arrangements or reductions from other expense offset arrangements and do not represent the amount paid by the class during periods when reimbursements or reductions occur. Expenses net of fee waivers reflect expenses after reimbursement by the investment adviser but prior to reductions from brokerage service arrangements or other expense offset arrangements. Expenses net of all reductions represent the net expenses paid by the class.
See accompanying notes which are an integral part of the financial statements.
Annual Report
Financial Highlights - Class C
Years ended November 30, | 2011 | 2010 | 2009 | 2008 | 2007 |
Selected Per-Share Data | | | | |
Net asset value, beginning of period | $ 8.23 | $ 6.74 | $ 5.03 | $ 11.45 | $ 10.08 |
Income from Investment Operations | | | | | |
Net investment income (loss) C | (.12) | (.11) | (.08) F | (.08) G | (.18) |
Net realized and unrealized gain (loss) | .05 | 1.60 | 1.79 | (5.15) | 1.55 |
Total from investment operations | (.07) | 1.49 | 1.71 | (5.23) | 1.37 |
Distributions from net realized gain | - | - | - | (1.19) | - |
Net asset value, end of period | $ 8.16 | $ 8.23 | $ 6.74 | $ 5.03 | $ 11.45 |
Total Return A, B | (.85)% | 22.11% | 34.00% | (50.99)% | 13.59% |
Ratios to Average Net Assets D, H | | | | |
Expenses before reductions | 2.20% | 2.18% | 2.47% | 2.38% | 2.28% |
Expenses net of fee waivers, if any | 2.00% | 2.05% | 2.05% | 2.05% | 2.05% |
Expenses net of all reductions | 1.99% | 2.04% | 2.03% | 2.04% | 2.04% |
Net investment income (loss) | (1.42)% | (1.52)% | (1.33)% F | (.96)% G | (1.60)% |
Supplemental Data | | | | |
Net assets, end of period (000 omitted) | $ 4,870 | $ 5,604 | $ 4,603 | $ 3,703 | $ 8,270 |
Portfolio turnover rate E | 176% | 123% | 301% | 276% | 177% |
A Total returns would have been lower if certain expenses had not been reduced during the applicable periods shown.
B Total returns do not include the effect of the contingent deferred sales charge.
C Calculated based on average shares outstanding during the period.
D Fees and expenses of any underlying Fidelity Central Funds are not included in the Fund's expense ratio. The Fund indirectly bears its proportionate share of the expenses of any underlying Fidelity Central Funds.
E Amount does not include the portfolio activity of any underlying Fidelity Central Funds.
F Investment income per share reflects a special dividend which amounted to $.01 per share. Excluding the special dividend, the ratio of net investment income (loss) to average net assets would have been (1.41)%.
G Investment income per share reflects a special dividend which amounted to $.01 per share. Excluding the special dividend, the ratio of net investment income (loss) to average net assets would have been (1.09)%.
H Expense ratios reflect operating expenses of the class. Expenses before reductions do not reflect amounts reimbursed by the investment adviser or reductions from brokerage service arrangements or reductions from other expense offset arrangements and do not represent the amount paid by the class during periods when reimbursements or reductions occur. Expenses net of fee waivers reflect expenses after reimbursement by the investment adviser but prior to reductions from brokerage service arrangements or other expense offset arrangements. Expenses net of all reductions represent the net expenses paid by the class.
See accompanying notes which are an integral part of the financial statements.
Annual Report
Financial Highlights - Institutional Class
Years ended November 30, | 2011 | 2010 | 2009 | 2008 | 2007 |
Selected Per-Share Data | | | | |
Net asset value, beginning of period | $ 9.10 | $ 7.37 | $ 5.44 | $ 12.31 | $ 10.72 |
Income from Investment Operations | | | | | |
Net investment income (loss) B | (.04) | (.04) | (.02) E | - F, H | (.07) |
Net realized and unrealized gain (loss) | .05 | 1.77 | 1.95 | (5.57) | 1.66 |
Total from investment operations | .01 | 1.73 | 1.93 | (5.57) | 1.59 |
Distributions from net realized gain | - | - | - | (1.30) | - |
Net asset value, end of period | $ 9.11 | $ 9.10 | $ 7.37 | $ 5.44 | $ 12.31 |
Total Return A | .11% | 23.47% | 35.48% | (50.59)% | 14.83% |
Ratios to Average Net Assets C, G | | | | |
Expenses before reductions | 1.09% | 1.10% | 1.43% | 1.33% | 1.20% |
Expenses net of fee waivers, if any | 1.00% | 1.05% | 1.05% | 1.05% | 1.05% |
Expenses net of all reductions | .99% | 1.04% | 1.03% | 1.03% | 1.04% |
Net investment income (loss) | (.42)% | (.53)% | (.33)% E | .04% F | (.60)% |
Supplemental Data | | | | |
Net assets, end of period (000 omitted) | $ 621 | $ 542 | $ 362 | $ 338 | $ 959 |
Portfolio turnover rate D | 176% | 123% | 301% | 276% | 177% |
A Total returns would have been lower if certain expenses had not been reduced during the applicable periods shown.
B Calculated based on average shares outstanding during the period.
C Fees and expenses of any underlying Fidelity Central Funds are not included in the Fund's expense ratio. The Fund indirectly bears its proportionate share of the expenses of any underlying Fidelity Central Funds.
D Amount does not include the portfolio activity of any underlying Fidelity Central Funds.
E Investment income per share reflects a special dividend which amounted to $.01 per share. Excluding the special dividend, the ratio of net investment income (loss) to average net assets would have been (.42)%.
F Investment income per share reflects a special dividend which amounted to $.01 per share. Excluding the special dividend, the ratio of net investment income (loss) to average net assets would have been (.09)%.
G Expense ratios reflect operating expenses of the class. Expenses before reductions do not reflect amounts reimbursed by the investment adviser or reductions from brokerage service arrangements or reductions from other expense offset arrangements and do not represent the amount paid by the class during periods when reimbursements or reductions occur. Expenses net of fee waivers reflect expenses after reimbursement by the investment adviser but prior to reductions from brokerage service arrangements or other expense offset arrangements. Expenses net of all reductions represent the net expenses paid by the class.
H Amount represents less than $.01 per share.
See accompanying notes which are an integral part of the financial statements.
Annual Report
Notes to Financial Statements
For the period ended November 30, 2011
1. Organization.
Fidelity Advisor® Growth Strategies Fund (the Fund) is a fund of Fidelity Securities Fund (the Trust) and is authorized to issue an unlimited number of shares. The Trust is registered under the Investment Company Act of 1940, as amended (the 1940 Act), as an open-end management investment company organized as a Massachusetts business trust. The Fund offers Class A, Class T, Class C, and Institutional Class shares, each of which, along with Class B shares, has equal rights as to assets and voting privileges. Effective after the close of business on September 1, 2010, Class B shares were closed to new accounts and additional purchases, except for exchanges and reinvestments by existing shareholders. Each class has exclusive voting rights with respect to matters that affect that class. Class B shares will automatically convert to Class A shares after a holding period of seven years from the initial date of purchase. Investment income, realized and unrealized capital gains and losses, the common expenses of the Fund, and certain fund-level expense reductions, if any, are allocated on a pro-rata basis to each class based on the relative net assets of each class to the total net assets of the Fund. Each class differs with respect to transfer agent and distribution and service plan fees incurred. Certain expense reductions may also differ by class. The Fund's investments in emerging markets can be subject to social, economic, regulatory, and political uncertainties and can be extremely volatile.
2. Investments in Fidelity Central Funds.
The Fund invests in Fidelity Central Funds, which are open-end investment companies available only to other investment companies and accounts managed by Fidelity Management & Research Company (FMR) and its affiliates. The Fund's Schedule of Investments lists each of the Fidelity Central Funds held as of period end, if any, as an investment of the Fund, but does not include the underlying holdings of each Fidelity Central Fund. As an Investing Fund, the Fund indirectly bears its proportionate share of the expenses of the underlying Fidelity Central Funds.
The Money Market Central Funds seek preservation of capital and current income and are managed by Fidelity Investments Money Management, Inc. (FIMM), an affiliate of FMR.
A complete unaudited list of holdings for each Fidelity Central Fund is available upon request or at the Securities and Exchange Commission (the SEC) web site at www.sec.gov. In addition, the financial statements of the Fidelity Central Funds, which are not covered by the Fund's Report of Independent Registered Public Accounting Firm, are available on the SEC web site or upon request.
Annual Report
Notes to Financial Statements - continued
3. Significant Accounting Policies.
The financial statements have been prepared in conformity with accounting principles generally accepted in the United States of America (GAAP), which require management to make certain estimates and assumptions at the date of the financial statements. Actual results could differ from those estimates. Subsequent events, if any, through the date that the financial statements were issued have been evaluated in the preparation of the financial statements. The following summarizes the significant accounting policies of the Fund:
Security Valuation. Investments are valued as of 4:00 p.m. Eastern time on the last calendar day of the period. The Fund uses independent pricing services approved by the Board of Trustees to value its investments. When current market prices or quotations are not readily available or reliable, valuations may be determined in good faith in accordance with procedures adopted by the Board of Trustees. Factors used in determining value may include market or security specific events. The frequency with which these procedures are used cannot be predicted and they may be utilized to a significant extent. The value used for net asset value (NAV) calculation under these procedures may differ from published prices for the same securities.
The Fund categorizes the inputs to valuation techniques used to value its investments into a disclosure hierarchy consisting of three levels as shown below:
Level 1 - quoted prices in active markets for identical investments
Level 2 - other significant observable inputs (including quoted prices for similar investments, interest rates, prepayment speeds, etc.)
Level 3 - unobservable inputs (including the Fund's own assumptions based on the best information available)
Changes in valuation techniques may result in transfers in or out of an assigned level within the disclosure hierarchy. The aggregate value of investments by input level, as of November 30, 2011, as well as a roll forward of Level 3 securities, is included at the end of the Fund's Schedule of Investments. Valuation techniques used to value the Fund's investments by major category are as follows:
Equity securities, including restricted securities, for which market quotations are readily available, are valued at the last reported sale price or official closing price as reported by an independent pricing service on the primary market or exchange on which they are traded and are categorized as Level 1 in the hierarchy. In the event there were no sales during the day or closing prices are not available, securities are valued at the last quoted bid price or may be valued using the last available price and are generally categorized as Level 2 in the hierarchy. For foreign equity securities, when significant market or security specific events arise, comparisons to the valuation of American Depositary Receipts
Annual Report
3. Significant Accounting Policies - continued
Security Valuation - continued
(ADRs), futures contracts, Exchange-traded funds (ETFs) and certain indexes as well as quoted prices for similar securities are used and are categorized as Level 2 in the hierarchy in these circumstances. Utilizing these techniques may result in transfers between Level 1 and Level 2. For restricted equity securities and private placements where observable inputs are limited, assumptions about market activity and risk are used and are categorized as Level 3 in the hierarchy.
Investments in open-end mutual funds, including the Fidelity Central Funds, are valued at their closing net asset value each business day and are categorized as Level 1 in the hierarchy.
Foreign Currency. The Fund may use foreign currency contracts to facilitate transactions in foreign-denominated securities. Gains and losses from these transactions may arise from changes in the value of the foreign currency or if the counterparties do not perform under the contracts' terms.
Foreign-denominated assets, including investment securities, and liabilities are translated into U.S. dollars at the exchange rate at period end. Purchases and sales of investment securities, income and dividends received and expenses denominated in foreign currencies are translated into U.S. dollars at the exchange rate in effect on the transaction date.
The effects of exchange rate fluctuations on investments are included with the net realized and unrealized gain (loss) on investment securities. Other foreign currency transactions resulting in realized and unrealized gain (loss) are disclosed separately.
Investment Transactions and Income. For financial reporting purposes, the Fund's investment holdings and NAV include trades executed through the end of the last business day of the period. The NAV per share for processing shareholder transactions is calculated as of the close of business of the New York Stock Exchange (NYSE), normally 4:00 p.m. Eastern time and includes trades executed through the end of the prior business day. Gains and losses on securities sold are determined on the basis of identified cost and may include proceeds received from litigation. Dividend income is recorded on the ex-dividend date, except for certain dividends from foreign securities where the ex-dividend date may have passed, which are recorded as soon as the Fund is informed of the ex-dividend date. Non-cash dividends included in dividend income, if any, are recorded at the fair market value of the securities received. Distributions received on securities that represent a return of capital or capital gain are recorded as a reduction of cost of investments and/or as a realized gain. The Fund estimates the components of distributions received that may be considered return of capital distributions or capital gain distributions. Interest income and distributions from the Fidelity Central Funds are
Annual Report
Notes to Financial Statements - continued
3. Significant Accounting Policies - continued
Investment Transactions and Income - continued
accrued as earned. Interest income includes coupon interest and amortization of premium and accretion of discount on debt securities. Investment income is recorded net of foreign taxes withheld where recovery of such taxes is uncertain.
Expenses. Expenses directly attributable to a fund are charged to that fund. Expenses attributable to more than one fund are allocated among the respective funds on the basis of relative net assets or other appropriate methods. Expense estimates are accrued in the period to which they relate and adjustments are made when actual amounts are known.
Income Tax Information and Distributions to Shareholders. Each year, the Fund intends to qualify as a regulated investment company, including distributing substantially all of its taxable income and realized gains under Subchapter M of the Internal Revenue Code and filing its U.S. federal tax return. As a result, no provision for income taxes is required. As of November 30, 2011, the Fund did not have any unrecognized tax benefits in the financial statements. A fund's federal tax return is subject to examination by the Internal Revenue Service (IRS) for a period of three years. Foreign taxes are provided for based on the Fund's understanding of the tax rules and rates that exist in the foreign markets in which it invests.
Distributions are declared and recorded on the ex-dividend date. Income dividends and capital gain distributions are declared separately for each class. Income and capital gain distributions are determined in accordance with income tax regulations, which may differ from GAAP.
Capital accounts within the financial statements are adjusted for permanent book-tax differences. These adjustments have no impact on net assets or the results of operations. Temporary book-tax differences will reverse in a subsequent period.
Book-tax differences are primarily due to foreign currency transactions, passive foreign investment companies (PFIC), partnerships, net operating losses, capital loss carryforwards and losses deferred due to wash sales and excise tax regulations.
The federal tax cost of investment securities and unrealized appreciation (depreciation) as of period end on an unconsolidated basis were as follows:
Gross unrealized appreciation | $ 2,524,587 |
Gross unrealized depreciation | (4,969,860) |
Net unrealized appreciation (depreciation) on securities and other investments | $ (2,445,273) |
| |
Tax Cost | $ 38,247,546 |
Annual Report
3. Significant Accounting Policies - continued
Income Tax Information and Distributions to Shareholders - continued
The tax-based components of distributable earnings as of period end were as follows:
Capital loss carryforward | $ (3,661,318) |
Net unrealized appreciation (depreciation) | $ (2,445,360) |
Under the recently enacted Regulated Investment Company Modernization Act of 2010 (the Act), the Fund will be permitted to carry forward capital losses incurred in taxable years beginning after December 22, 2010 for an unlimited period. However, any losses incurred during those future taxable years will be required to be utilized prior to any losses incurred in pre-enactment taxable years, which generally expire after eight years from when they are incurred. Additionally, post-enactment capital losses that are carried forward will retain their character as either short-term or long-term capital losses rather than being considered all short-term as under previous law. The Fund's first fiscal year end subject to the Act will be November, 30, 2012.
New Accounting Pronouncement. In May 2011, the Financial Accounting Standards Board issued Accounting Standard Update No. 2011-04, Fair Value Measurement (Topic 820) - Amendments to Achieve Common Fair Value Measurement and Disclosure Requirements in U.S. GAAP and IFRSs. The update changes the wording used to describe the requirements in GAAP for measuring fair value and for disclosing information about fair value measurements. The update is effective during interim and annual periods beginning after December 15, 2011. Management is currently evaluating the impact of the update's adoption on the Fund's financial statement disclosures.
In December 2011, the Financial Accounting Standards Board issued Accounting Standard Update No. 2011-11, Disclosures about Offsetting Assets and Liabilities. The update creates new disclosure requirements requiring entities to disclose both gross and net information for derivatives and other financial instruments that are either offset in the Statement of Assets and Liabilities or subject to an enforceable master netting arrangement or similar agreement. The disclosure requirements are effective for annual reporting periods beginning on or after January 1, 2013. Management is currently evaluating the impact of the update's adoption on the Fund's financial statement disclosures.
4. Purchases and Sales of Investments.
Purchases and sales of securities, other than short-term securities, aggregated $62,910,516 and $65,196,525, respectively.
Annual Report
Notes to Financial Statements - continued
5. Fees and Other Transactions with Affiliates.
Management Fee. FMR and its affiliates provide the Fund with investment management related services for which the Fund pays a monthly management fee. The management fee is the sum of an individual fund fee rate that is based on an annual rate of .35% of the Fund's average net assets and an annualized group fee rate that averaged .26% during the period. The group fee rate is based upon the average net assets of all the mutual funds advised by FMR. The group fee rate decreases as assets under management increase and increases as assets under management decrease. In addition, the management fee is subject to a performance adjustment (up to a maximum of ± .20% of the Fund's average net assets over a 36 month performance period). The upward or downward adjustment to the management fee is based on the relative investment performance of the Institutional Class of the Fund as compared to an appropriate benchmark index. For the period, the total annual management fee rate, including the performance adjustment, was .45% of the Fund's average net assets.
Distribution and Service Plan Fees. In accordance with Rule 12b-1 of the 1940 Act, the Fund has adopted separate Distribution and Service Plans for each class of shares. Certain classes pay Fidelity Distributors Corporation (FDC), an affiliate of FMR, separate Distribution and Service Fees, each of which is based on an annual percentage of each class' average net assets. In addition, FDC may pay financial intermediaries for selling shares of the Fund and providing shareholder support services. For the period, the Distribution and Service Fee rates, total fees and amounts retained by FDC were as follows:
| Distribution
Fee | Service
Fee | Total Fees | Retained
by FDC |
Class A | -% | .25% | $ 29,255 | $ 427 |
Class T | .25% | .25% | 77,402 | 235 |
Class B | .75% | .25% | 27,578 | 20,792 |
Class C | .75% | .25% | 57,308 | 5,313 |
| | | $ 191,543 | $ 26,767 |
Sales Load. FDC may receive a front-end sales charge of up to 5.75% for selling Class A shares, and 3.50% for selling Class T shares, some of which is paid to financial intermediaries for selling shares of the Fund. Depending on the holding period, FDC may receive contingent deferred sales charges levied on Class A, Class T, Class B, and Class C redemptions. The deferred sales charges range from 5.00% to 1.00% for Class B, 1.00% for Class C, 1.00% for certain purchases of Class A shares and .25% for certain purchases of Class T shares.
Annual Report
5. Fees and Other Transactions with Affiliates - continued
Sales Load - continued
For the period, sales charge amounts retained by FDC were as follows:
| Retained
by FDC |
Class A | $ 5,039 |
Class T | 8,166 |
Class B* | 4,002 |
Class C* | 487 |
| $ 17,694 |
* When Class B and Class C shares are initially sold, FDC pays commissions from its own resources to financial intermediaries through which the sales are made.
Transfer Agent Fees. Fidelity Investments Institutional Operations Company, Inc. (FIIOC), an affiliate of FMR, is the transfer, dividend disbursing and shareholder servicing agent for each class of the Fund. FIIOC receives account fees and asset-based fees that vary according to the account size and type of account of the shareholders of the respective classes of the Fund. FIIOC pays for typesetting, printing and mailing of shareholder reports, except proxy statements. For the period, transfer agent fees for each class were as follows:
| Amount | % of
Average
Net Assets |
Class A | $ 35,833 | .31 |
Class T | 54,701 | .35 |
Class B | 8,409 | .31 |
Class C | 17,591 | .31 |
Institutional Class | 1,220 | .20 |
| $ 117,754 | |
Accounting and Security Lending Fees. Fidelity Service Company, Inc. (FSC), an affiliate of FMR, maintains the Fund's accounting records. The accounting fee is based on the level of average net assets for the month. Under a separate contract, FSC administers the security lending program. The security lending fee is based on the number and duration of lending transactions.
Brokerage Commissions. The Fund placed a portion of its portfolio transactions with brokerage firms which are affiliates of the investment adviser. The commissions paid to these affiliated firms were $1,233 for the period.
Annual Report
Notes to Financial Statements - continued
6. Committed Line of Credit.
The Fund participates with other funds managed by FMR or an affiliate in a $4.0 billion credit facility (the "line of credit") to be utilized for temporary or emergency purposes to fund shareholder redemptions or for other short-term liquidity purposes. The Fund has agreed to pay commitment fees on its pro-rata portion of the line of credit, which amounted to $112 and is reflected in Miscellaneous expenses on the Statement of Operations. During the period, there were no borrowings on this line of credit.
7. Security Lending.
The Fund lends portfolio securities through a lending agent from time to time in order to earn additional income. For equity securities, a lending agent is used and may loan securities to certain qualified borrowers, including Fidelity Capital Markets (FCM), a broker-dealer affiliated with the Fund. On the settlement date of the loan, the Fund receives collateral (in the form of U.S. Treasury obligations, letters of credit and/or cash) against the loaned securities and maintains collateral in an amount not less than 100% of the market value of the loaned securities during the period of the loan. The market value of the loaned securities is determined at the close of business of the Fund and any additional required collateral is delivered to the Fund on the next business day. If the borrower defaults on its obligation to return the securities loaned because of insolvency or other reasons, a fund could experience delays and costs in recovering the securities loaned or in gaining access to the collateral. Any cash collateral received is invested in the Fidelity Securities Lending Cash Central Fund. The value of loaned securities and cash collateral at period end are disclosed on the Fund's Statement of Assets and Liabilities. Security lending income represents the income earned on investing cash collateral, less rebates paid to borrowers and any lending agent fees associated with the loan, plus any premium payments received for lending certain types of securities. Security lending income is presented in the Statement of Operations as a component of income from Fidelity Central Funds. Total security lending income during the period amounted to $6,036. During the period, there were no securities loaned to FCM.
8. Expense Reductions.
FMR voluntarily agreed to reimburse each class to the extent annual operating expenses exceeded certain levels of average net assets as noted in the table below. Some expenses, for example interest expense, including commitment fees, are excluded from this reimbursement.
Annual Report
8. Expense Reductions - continued
The following classes were in reimbursement during the period:
| Expense
Limitations | Reimbursement
from adviser |
Class A | 1.25% | $ 23,064 |
Class T | 1.50% | 37,945 |
Class B | 2.00% | 5,509 |
Class C | 2.00% | 11,444 |
Institutional Class | 1.00% | 570 |
| | $ 78,532 |
Many of the brokers with whom FMR places trades on behalf of the Fund provided services to the Fund in addition to trade execution. These services included payments of certain expenses on behalf of the Fund totaling $5,133 for the period.
9. Share Transactions.
Transactions for each class of shares were as follows:
| Shares | Dollars |
Years ended November 30, | 2011 | 2010 | 2011 | 2010 |
Class A | | | | |
Shares sold | 348,616 | 271,600 | $ 3,339,944 | $ 2,194,435 |
Shares redeemed | (367,362) | (335,188) | (3,463,746) | (2,660,697) |
Net increase (decrease) | (18,746) | (63,588) | $ (123,802) | $ (466,262) |
Class T | | | | |
Shares sold | 284,211 | 310,978 | $ 2,574,964 | $ 2,432,697 |
Shares redeemed | (271,058) | (391,038) | (2,505,414) | (3,005,864) |
Net increase (decrease) | 13,153 | (80,060) | $ 69,550 | $ (573,167) |
Class B | | | | |
Shares sold | 12,134 | 47,922 | $ 107,027 | $ 358,845 |
Shares redeemed | (128,257) | (157,596) | (1,130,647) | (1,183,324) |
Net increase (decrease) | (116,123) | (109,674) | $ (1,023,620) | $ (824,479) |
Class C | | | | |
Shares sold | 115,363 | 123,170 | $ 1,024,037 | $ 931,941 |
Shares redeemed | (199,330) | (125,697) | (1,750,739) | (940,262) |
Net increase (decrease) | (83,967) | (2,527) | $ (726,702) | $ (8,321) |
Institutional Class | | | | |
Shares sold | 26,322 | 29,114 | $ 252,318 | $ 243,469 |
Shares redeemed | (17,715) | (18,741) | (175,436) | (152,933) |
Net increase (decrease) | 8,607 | 10,373 | $ 76,882 | $ 90,536 |
Annual Report
Notes to Financial Statements - continued
10. Other.
The Fund's organizational documents provide former and current trustees and officers with a limited indemnification against liabilities arising in connection with the performance of their duties to the Fund. In the normal course of business, the Fund may also enter into contracts that provide general indemnifications. The Fund's maximum exposure under these arrangements is unknown as this would be dependent on future claims that may be made against the Fund. The risk of material loss from such claims is considered remote.
Annual Report
To the Trustees of Fidelity Securities Fund and the Shareholders of Fidelity Advisor Growth Strategies Fund:
In our opinion, the accompanying statement of assets and liabilities, including the schedule of investments, and the related statements of operations and of changes in net assets and the financial highlights present fairly, in all material respects, the financial position of Fidelity Advisor Growth Strategies Fund (a fund of Fidelity Securities Fund) at November 30, 2011, the results of its operations for the year then ended, the changes in its net assets for each of the two years in the period then ended and the financial highlights for each of the five years in the period then ended, in conformity with accounting principles generally accepted in the United States of America. These financial statements and financial highlights (hereafter referred to as "financial statements") are the responsibility of the Fidelity Advisor Growth Strategies Fund's management. Our responsibility is to express an opinion on these financial statements based on our audits. We conducted our audits of these financial statements in accordance with the standards of the Public Company Accounting Oversight Board (United States). Those standards require that we plan and perform the audit to obtain reasonable assurance about whether the financial statements are free of material misstatement. An audit includes examining, on a test basis, evidence supporting the amounts and disclosures in the financial statements, assessing the accounting principles used and significant estimates made by management, and evaluating the overall financial statement presentation. We believe that our audits, which included confirmation of securities at November 30, 2011 by correspondence with the custodian and brokers, provide a reasonable basis for our opinion.
PricewaterhouseCoopers LLP
Boston, Massachusetts
January 12, 2012
Annual Report
The Trustees, Members of the Advisory Board, and executive officers of the trust and fund, as applicable, are listed below. The Board of Trustees governs the fund and is responsible for protecting the interests of shareholders. The Trustees are experienced executives who meet periodically throughout the year to oversee the fund's activities, review contractual arrangements with companies that provide services to the fund, oversee management of the risks associated with such activities and contractual arrangements, and review the fund's performance. Except for James C. Curvey, each of the Trustees oversees 226 funds advised by FMR or an affiliate. Mr. Curvey oversees 429 funds advised by FMR or an affiliate.
The Trustees hold office without limit in time except that (a) any Trustee may resign; (b) any Trustee may be removed by written instrument, signed by at least two-thirds of the number of Trustees prior to such removal; (c) any Trustee who requests to be retired or who has become incapacitated by illness or injury may be retired by written instrument signed by a majority of the other Trustees; and (d) any Trustee may be removed at any special meeting of shareholders by a two-thirds vote of the outstanding voting securities of the trust. Each Trustee who is not an interested person (as defined in the 1940 Act) (Independent Trustee), shall retire not later than the last day of the calendar year in which his or her 75th birthday occurs. The Independent Trustees may waive this mandatory retirement age policy with respect to individual Trustees. The executive officers and Advisory Board Members hold office without limit in time, except that any officer and Advisory Board Member may resign or may be removed by a vote of a majority of the Trustees at any regular meeting or any special meeting of the Trustees. Except as indicated, each individual has held the office shown or other offices in the same company for the past five years.
Experience, Skills, Attributes, and Qualifications of the Fund's Trustees. The Governance and Nominating Committee has adopted a statement of policy that describes the experience, qualifications, attributes, and skills that are necessary and desirable for potential Independent Trustee candidates (Statement of Policy). The Board believes that each Trustee satisfied at the time he or she was initially elected or appointed a Trustee, and continues to satisfy, the standards contemplated by the Statement of Policy. The Governance and Nominating Committee also engages professional search firms to help identify potential Independent Trustee candidates who have the experience, qualifications, attributes, and skills consistent with the Statement of Policy. From time to time, additional criteria based on the composition and skills of the current Independent Trustees, as well as experience or skills that may be appropriate in light of future changes to board composition, business conditions, and regulatory or other developments, have also been considered by the professional search firms and the Governance and Nominating Committee. In addition, the Board takes into account the Trustees' commitment and participation in Board and committee meetings, as well as their leadership of standing and ad hoc committees throughout their tenure.
In determining that a particular Trustee was and continues to be qualified to serve as a Trustee, the Board has considered a variety of criteria, none of which, in isolation, was controlling. The Board believes that, collectively, the Trustees have balanced and diverse experience, qualifications, attributes, and skills, which allow the Board to operate effectively in governing the fund and protecting the interests of shareholders. Information about the specific experience, skills, attributes, and qualifications of each Trustee, which in each case led to the Board's conclusion that the Trustee should serve (or continue to serve) as a trustee of the fund, is provided below.
Annual Report
Board Structure and Oversight Function. James C. Curvey is an interested person (as defined in the 1940 Act) and currently serves as Acting Chairman. The Trustees have determined that an interested Chairman is appropriate and benefits shareholders because an interested Chairman has a personal and professional stake in the quality and continuity of services provided to the fund. Independent Trustees exercise their informed business judgment to appoint an individual of their choosing to serve as Chairman, regardless of whether the Trustee happens to be independent or a member of management. The Independent Trustees have determined that they can act independently and effectively without having an Independent Trustee serve as Chairman and that a key structural component for assuring that they are in a position to do so is for the Independent Trustees to constitute a substantial majority for the Board. The Independent Trustees also regularly meet in executive session. Ned C. Lautenbach serves as Chairman of the Independent Trustees and as such (i) acts as a liaison between the Independent Trustees and management with respect to matters important to the Independent Trustees and (ii) with management prepares agendas for Board meetings.
Fidelity funds are overseen by different Boards of Trustees. The fund's Board oversees Fidelity's equity and high income funds and another Board oversees Fidelity's investment-grade bond, money market, and asset allocation funds. The asset allocation funds may invest in Fidelity funds overseen by the fund's Board. The use of separate Boards, each with its own committee structure, allows the Trustees of each group of Fidelity funds to focus on the unique issues of the funds they oversee, including common research, investment, and operational issues. On occasion, the separate Boards establish joint committees to address issues of overlapping consequences for the Fidelity funds overseen by each Board.
The Trustees operate using a system of committees to facilitate the timely and efficient consideration of all matters of importance to the Trustees, the fund, and fund shareholders and to facilitate compliance with legal and regulatory requirements and oversight of the fund's activities and associated risks. The Board, acting through its committees, has charged FMR and its affiliates with (i) identifying events or circumstances the occurrence of which could have demonstrably adverse effects on the fund's business and/or reputation; (ii) implementing processes and controls to lessen the possibility that such events or circumstances occur or to mitigate the effects of such events or circumstances if they do occur; and (iii) creating and maintaining a system designed to evaluate continuously business and market conditions in order to facilitate the identification and implementation processes described in (i) and (ii) above. Because the day-to-day operations and activities of the fund are carried out by or through FMR, its affiliates and other service providers, the fund's exposure to risks is mitigated but not eliminated by the processes overseen by the Trustees. While each of the Board's committees has responsibility for overseeing different aspects of the fund's activities, oversight is exercised primarily through the Operations, Audit, and Compliance Committees. In addition, the Independent Trustees have worked with FMR to enhance the Board's oversight of investment and financial risks, legal and regulatory risks, technology risks, and operational risks, including the development of additional risk reporting to the Board. For example, a working group comprised of Independent Trustees and FMR has worked and continues to work to review the Fidelity funds' valuation-related activities, reporting and risk management. Appropriate personnel, including but not limited to the fund's Chief Compliance Officer (CCO), FMR's internal auditor, the independent accountants, the fund's Treasurer and portfolio management personnel, make periodic reports to the Board's committees, as appropriate, including an annual review of FMR's risk management program for the Fidelity funds. The responsibilities of each standing committee, including their oversight responsibilities, are described further under "Standing Committees of the Fund's Trustees."
Annual Report
Trustees and Officers - continued
The fund's Statement of Additional Information (SAI) includes more information about the Trustees. To request a free copy, call Fidelity at 1-877-208-0098.
Interested Trustees*:
Correspondence intended for each Trustee who is an interested person may be sent to Fidelity Investments, 82 Devonshire Street, Boston, Massachusetts 02109.
Name, Age; Principal Occupations and Other Relevant Experience+ |
James C. Curvey (76) |
| Year of Election or Appointment: 2007 Mr. Curvey is Trustee and Acting Chairman of the Board of Trustees of certain Trusts. Mr. Curvey also serves as Trustee (2007-present) of other investment companies advised by FMR. Mr. Curvey is a Director of Fidelity Investments Money Management, Inc. (2009-present), Director of Fidelity Research & Analysis Co. (2009-present) and Director of FMR and FMR Co., Inc. (2007-present). Mr. Curvey is also Vice Chairman (2007-present) and Director of FMR LLC. In addition, Mr. Curvey serves as an Overseer for the Boston Symphony Orchestra and a member of the Trustees of Villanova University. Previously, Mr. Curvey was the Vice Chairman (2006-2007) and Director (2000-2007) of FMR Corp. |
Ronald P. O'Hanley (54) |
| Year of Election or Appointment: 2011 Mr. O'Hanley is Director of FMR Co., Inc. (2010-present), Director of Fidelity Investments Money Management, Inc. (2010-present), Director of Fidelity Research & Analysis Company (2010-present), President of Fidelity Asset Management and Corporate Services and a member of Fidelity's Executive Committee (2010-present). Previously, Mr. O'Hanley served as President and Chief Executive Officer of BNY Mellon Asset Management (2007-2010). Mr. O'Hanley also served as Vice Chairman of Bank New York Mellon Corp. and a member of that firm's Executive Committee. Prior to the 2007 merger of The Bank of New York and Mellon Financial Corporation, he was Vice Chairman of Mellon Financial Corporation and President and Chief Executive Officer of Mellon Asset Management. He joined Mellon in February 1997. Mr. O'Hanley currently serves as Chairman of the Boston Public Library Foundation Board of Directors and sits on the Board of Directors of Beth Israel Deaconess Medical Center, the Board of Trustees of the Marine Biological Laboratory and the Advisory Board of the Maxwell School of Citizenship and Public Administration at Syracuse University. Mr. O'Hanley also chairs the Council on Asset Management for the Financial Services Roundtable and is a member of the Board of Directors of Institutional Investor's U.S. Institute. |
* Trustees have been determined to be "Interested Trustees" by virtue of, among other things, their affiliation with the trust or various entities under common control with FMR.
+ The information above includes each Trustee's principal occupation during the last five years and other information relating to the experience, attributes, and skills relevant to each Trustee's qualifications to serve as a Trustee, which led to the conclusion that each Trustee should serve as a Trustee for the fund.
Annual Report
Trustees and Officers - continued
Independent Trustees:
Correspondence intended for each Independent Trustee (that is, the Trustees other than the Interested Trustees) may be sent to Fidelity Investments, P.O. Box 55235, Boston, Massachusetts 02205-5235.
Name, Age; Principal Occupations and Other Relevant Experience+ |
Dennis J. Dirks (63) |
| Year of Election or Appointment: 2005 Prior to his retirement in May 2003, Mr. Dirks was Chief Operating Officer and a member of the Board of The Depository Trust & Clearing Corporation (DTCC). He also served as President, Chief Operating Officer, and Board member of The Depository Trust Company (DTC) and President and Board member of the National Securities Clearing Corporation (NSCC). In addition, Mr. Dirks served as Chief Executive Officer and Board member of the Government Securities Clearing Corporation, Chief Executive Officer and Board member of the Mortgage-Backed Securities Clearing Corporation, as a Trustee and a member of the Finance Committee of Manhattan College (2005-2008), and as a Trustee and a member of the Finance Committee of AHRC of Nassau County (2006-2008). Mr. Dirks is a member of the Independent Directors Council (IDC) Governing Council (2010-present) and Board of Directors for The Brookville Center for Children's Services, Inc. (2009-present). |
Alan J. Lacy (58) |
| Year of Election or Appointment: 2008 Mr. Lacy serves as Senior Adviser (2007-present) of Oak Hill Capital Partners, L.P. (private equity). Mr. Lacy also served as Chief Executive Officer (2000-2005) and Vice Chairman (2005-2006) of Sears Holdings Corporation and Sears, Roebuck and Co. (retail). In addition, Mr. Lacy serves as a member of the Board of Directors of Dave & Buster's, Inc. (restaurant and entertainment complexes, 2010-present), The Hillman Companies, Inc. (hardware wholesalers, 2010-present), and Bristol-Myers Squibb Company (global pharmaceuticals, 2007-present). Mr. Lacy is a member of the Board of Trustees of The National Parks Conservation Association (2006-present). Previously, Mr. Lacy served as Chairman of the Board of Trustees of the National Parks Conservation Association (2008-2011) and as a member of the Board of Directors for the Western Union Company (global money transfer, 2006-2011). |
Ned C. Lautenbach (67) |
| Year of Election or Appointment: 2000 Mr. Lautenbach is Chairman of the Independent Trustees of the Equity and High Income Funds (2006-present). Mr. Lautenbach currently serves as the Lead Director of the Eaton Corporation Board of Directors (diversified industrial, 1997-present). Mr. Lautenbach is also a member of the Board of Directors of the Philharmonic Center for the Arts in Naples, Florida (1999-present); a member of the Board of Trustees of Fairfield University (2005-present); and a member of the Council on Foreign Relations (1994-present). Previously, Mr. Lautenbach was a Partner/Advisory Partner at Clayton, Dubilier & Rice, LLC (private equity investment, 1998-2010), as well as a Director of Sony Corporation (2006-2007). |
Joseph Mauriello (67) |
| Year of Election or Appointment: 2008 Prior to his retirement in January 2006, Mr. Mauriello served in numerous senior management positions including Deputy Chairman and Chief Operating Officer (2004-2005), and Vice Chairman of Financial Services (2002-2004) of KPMG LLP US (professional services, 1965-2005). Mr. Mauriello currently serves as a member of the Board of Directors of XL Group plc. (global insurance and re-insurance, 2006-present) and of Arcadia Resources Inc. (health care services and products, 2007-present). Previously, Mr. Mauriello served as a Director of the Hamilton Funds of the Bank of New York (2006-2007). |
Robert W. Selander (61) |
| Year of Election or Appointment: 2011 Previously, Mr. Selander served as a Member of the Advisory Board of Fidelity's Equity and High Income Funds (2011), Executive Vice Chairman (2010), Chief Executive Officer (2009-2010), and President and Chief Executive Officer (1997-2009) of Mastercard, Inc. |
Cornelia M. Small (67) |
| Year of Election or Appointment: 2005 Ms. Small is a member of the Board of Directors of the Teagle Foundation (2009-present). Ms. Small is also a member of the Investment Committee, and Chair (2008-present) and a member of the Board of Trustees of Smith College. In addition, Ms. Small serves on the Investment Committee of the Berkshire Taconic Community Foundation (2008-present). Previously, Ms. Small served as Chairperson of the Investment Committee (2002-2008) of Smith College. In addition, Ms. Small served as Chief Investment Officer, Director of Global Equity Investments, and a member of the Board of Directors of Scudder, Stevens & Clark and Scudder Kemper Investments. |
William S. Stavropoulos (72) |
| Year of Election or Appointment: 2002 Mr. Stavropoulos is Vice Chairman of the Independent Trustees of the Equity and High Income Funds (2006-present). Mr. Stavropoulos serves as President and Founder of the Michigan Baseball Foundation, the Great Lakes Loons (2007-present). Mr. Stavropoulos is Chairman Emeritus of the Board of Directors of The Dow Chemical Company, where he previously served in numerous senior management positions, including President, CEO (1995-2000; 2002-2004), Chairman of the Executive Committee (2000-2006), and as a member of the Board of Directors (1990-2006). Currently, Mr. Stavropoulos is Chairman of Univar (global distributor of commodity and specialty chemicals, 2010-present), a Director of Teradata Corporation (data warehousing and technology solutions, 2008-present), Chemical Financial Corporation, Maersk Inc. (industrial conglomerate), Tyco International, Inc. (multinational manufacturing and services, 2007-present), and a member of the Advisory Board for Metalmark Capital (private equity investment, 2005-present). Mr. Stavropoulos is a special advisor to Clayton, Dubilier & Rice, LLC (private equity investment). In addition, Mr. Stavropoulos is a member of the University of Notre Dame Advisory Council for the College of Science. |
David M. Thomas (62) |
| Year of Election or Appointment: 2008 Previously, Mr. Thomas served as Executive Chairman (2005-2006) and Chairman and Chief Executive Officer (2000-2005) of IMS Health, Inc. (pharmaceutical and healthcare information solutions). In addition, Mr. Thomas serves as a member of the Board of Directors of Fortune Brands, Inc. (consumer products), and Interpublic Group of Companies, Inc. (marketing communication, 2004-present). |
Michael E. Wiley (61) |
| Year of Election or Appointment: 2008 Mr. Wiley also serves as a Director of Asia Pacific Exploration Consolidated (international oil and gas exploration and production, 2008-present). Mr. Wiley serves as a Director of Tesoro Corporation (independent oil refiner and marketer, 2005-present), and a Director of Bill Barrett Corporation (exploration and production, 2005-present). In addition, Mr. Wiley also serves as a Director of Post Oak Bank (privately-held bank, 2004-present). Previously, Mr. Wiley served as a member of the Board of Trustees of the University of Tulsa (2000-2006; 2007-2010), as a Senior Energy Advisor of Katzenbach Partners, LLC (consulting, 2006-2007), as an Advisory Director of Riverstone Holdings (private investment), Chairman, President, and CEO of Baker Hughes, Inc. (oilfield services, 2000-2004), and as Director of Spinnaker Exploration Company (exploration and production, 2001-2005). |
Annual Report
+ The information above includes each Trustee's principal occupation during the last five years and other information relating to the experience, attributes, and skills relevant to each Trustee's qualifications to serve as a Trustee, which led to the conclusion that each Trustee should serve as a Trustee for the fund.
Advisory Board Members and Executive Officers:
Correspondence intended for each executive officer, Edward C. Johnson 3d, and Peter S. Lynch may be sent to Fidelity Investments, 82 Devonshire Street, Boston, Massachusetts 02109.
Name, Age; Principal Occupation |
Edward C. Johnson 3d (81) |
| Year of Election or Appointment: 2011 Member of the Advisory Board of Fidelity's Equity and High Income Funds. Mr. Johnson serves as Chief Executive Officer, Chairman, and a Director of FMR LLC, and also serves as Chairman and Director of FIL Limited. Previously, Mr. Johnson served as a Trustee and Chairman of the Board of certain Fidelity Trusts, Chairman and a Director of FMR, Chairman and a Director of FMR Co., Inc., and President of FMR LLC (2006-2007). |
Peter S. Lynch (67) |
| Year of Election or Appointment: 2003 Member of the Advisory Board of Fidelity's Equity and High Income Funds. Mr. Lynch is Vice Chairman and a Director of FMR and FMR Co., Inc. In addition, Mr. Lynch serves as a Trustee of Boston College and as the Chairman of the Inner-City Scholarship Fund. Previously, Mr. Lynch served on the Special Olympics International Board of Directors (1997-2006). |
Kenneth B. Robins (42) |
| Year of Election or Appointment: 2008 President and Treasurer of Fidelity's Equity and High Income Funds. Mr. Robins also serves as President and Treasurer (2010-present) and Assistant Treasurer (2009-present) of other Fidelity funds and is an employee of Fidelity Investments (2004-present). Previously, Mr. Robins served as Deputy Treasurer of the Fidelity funds (2005-2008) and Treasurer and Chief Financial Officer of The North Carolina Capital Management Trust: Cash and Term Portfolios (2006-2008). |
Brian B. Hogan (47) |
| Year of Election or Appointment: 2009 Vice President of Equity and High Income Funds. Mr. Hogan also serves as President of FMR's Equity Division (2009-present). Previously, Mr. Hogan served as Senior Vice President, Equity Research of FMR (2006-2009) and as a portfolio manager. |
Bruce T. Herring (46) |
| Year of Election or Appointment: 2006 Vice President of certain Equity Funds. Mr. Herring also serves as Chief Investment Officer and Director of Fidelity Management & Research (U.K.) Inc. (2010-present) and Group Chief Investments Officer of FMR. Previously, Mr. Herring served as Vice President (2005-2006) and Senior Vice President (2006-2007) of Fidelity Management & Research Company, Vice President of FMR Co., Inc. (2001-2007) and as a portfolio manager for Fidelity U.S. Equity Funds. |
Scott C. Goebel (43) |
| Year of Election or Appointment: 2008 Secretary and Chief Legal Officer (CLO) of the Fidelity funds. Mr. Goebel also serves as Secretary of Fidelity Investments Money Management, Inc. (FIMM) (2010-present) and Fidelity Research and Analysis Company (FRAC) (2010-present); Secretary and CLO of The North Carolina Capital Management Trust: Cash and Term Portfolios (2008-present); General Counsel, Secretary, and Senior Vice President of FMR (2008-present) and FMR Co., Inc. (2008-present); employed by FMR LLC or an affiliate (2001-present); Chief Legal Officer of Fidelity Management & Research (Hong Kong) Limited (2008-present) and Assistant Secretary of Fidelity Management & Research (Japan) Inc. (2008-present), and Fidelity Management & Research (U.K.) Inc. (2008-present). Previously, Mr. Goebel served as Assistant Secretary of FIMM (2008-2010), FRAC (2008-2010), and the Funds (2007-2008) and as Vice President and Secretary of Fidelity Distributors Corporation (FDC) (2005-2007). |
William C. Coffey (42) |
| Year of Election or Appointment: 2009 Assistant Secretary of Fidelity's Equity and High Income Funds. Mr. Coffey also serves as Senior Vice President and Deputy General Counsel of FMR LLC (2010-present), and is an employee of Fidelity Investments. Previously, Mr. Coffey served as Vice President and Associate General Counsel of FMR LLC (2005-2009). |
Holly C. Laurent (57) |
| Year of Election or Appointment: 2008 Anti-Money Laundering (AML) Officer of the Fidelity funds. Ms. Laurent also serves as AML Officer of The North Carolina Capital Management Trust: Cash and Term Portfolios (2008-present) and is an employee of Fidelity Investments. Previously, Ms. Laurent was Senior Vice President and Head of Legal for Fidelity Business Services India Pvt. Ltd. (2006-2008), and Senior Vice President, Deputy General Counsel and Group Head for FMR LLC (2005-2006). |
Christine Reynolds (53) |
| Year of Election or Appointment: 2008 Chief Financial Officer of the Fidelity funds. Ms. Reynolds became President of Fidelity Pricing and Cash Management Services (FPCMS) in August 2008. Ms. Reynolds served as Chief Operating Officer of FPCMS (2007-2008). Previously, Ms. Reynolds served as President, Treasurer, and Anti-Money Laundering officer of the Fidelity funds (2004-2007). |
Kenneth A. Rathgeber (64) |
| Year of Election or Appointment: 2004 Chief Compliance Officer of Fidelity's Equity and High Income Funds. Mr. Rathgeber is Chief Compliance Officer of Fidelity Management & Research (Hong Kong) Limited (2008-present), Fidelity Management & Research (Japan) Inc. (2008-present), FMR (2005-present), FMR Co., Inc. (2005-present), Fidelity Management & Research (U.K.) Inc. (2005-present), Fidelity Research & Analysis Company (2005-present), Fidelity Investments Money Management, Inc. (2005-present), Pyramis Global Advisors, LLC (2005-present), and Strategic Advisers, Inc. (2005-present). |
Jeffrey S. Christian (50) |
| Year of Election or Appointment: 2009 Deputy Treasurer of the Fidelity funds. Mr. Christian is an employee of Fidelity Investments. Previously, Mr. Christian served as Chief Financial Officer (2008-2009) of certain Fidelity funds and Senior Vice President of Fidelity Pricing and Cash Management Services (FPCMS) (2004-2009). |
Joseph F. Zambello (54) |
| Year of Election or Appointment: 2011 Deputy Treasurer of the Fidelity funds. Mr. Zambello is an employee of Fidelity Investments. Previously, Mr. Zambello served as Vice President of FMR's Program Management Group (2009-2011) and Vice President of the Transfer Agent Oversight Group (2005-2009). |
Adrien E. Deberghes (44) |
| Year of Election or Appointment: 2008 Deputy Treasurer of Fidelity's Equity and High Income Funds. Mr. Deberghes also serves as Vice President and Assistant Treasurer of Fidelity Rutland Square Trust II and Fidelity Commonwealth Trust II (2011-present), Assistant Treasurer of other Fidelity funds (2010-present), and is an employee of Fidelity Investments (2008-present). Previously, Mr. Deberghes served as Senior Vice President of Mutual Fund Administration at State Street Corporation (2007-2008), Senior Director of Mutual Fund Administration at Investors Bank & Trust (2005-2007), and Director of Finance for Dunkin' Brands (2000-2005). |
Stephanie J. Dorsey (42) |
| Year of Election or Appointment: 2010 Assistant Treasurer of Fidelity's Equity and High Income Funds. Ms. Dorsey also serves as Deputy Treasurer of other Fidelity funds (2008-present) and is an employee of Fidelity Investments (2008-present). Previously, Ms. Dorsey served as Treasurer (2004-2008) of the JPMorgan Mutual Funds and Vice President (2004-2008) of JPMorgan Chase Bank. |
John R. Hebble (53) |
| Year of Election or Appointment: 2009 Assistant Treasurer of Fidelity's Equity and High Income Funds. Mr. Hebble also serves as President (2011-present), Treasurer, and Chief Financial Officer of The North Carolina Capital Management Trust: Cash and Term Portfolios (2008-present), President and Treasurer of other Fidelity funds (2008-present) and is an employee of Fidelity Investments. |
Gary W. Ryan (53) |
| Year of Election or Appointment: 2005 Assistant Treasurer of the Fidelity funds. Mr. Ryan is an employee of Fidelity Investments. Previously, Mr. Ryan served as Vice President of Fund Reporting in Fidelity Pricing and Cash Management Services (FPCMS) (1999-2005). |
Jonathan Davis (43) |
| Year of Election or Appointment: 2010 Assistant Treasurer of the Fidelity funds. Mr. Davis is also Assistant Treasurer of Fidelity Rutland Square Trust II and Fidelity Commonwealth Trust II. Mr. Davis is an employee of Fidelity Investments. Previously, Mr. Davis served as Vice President and Associate General Counsel of FMR LLC (2003-2010). |
Annual Report
Board Approval of Investment Advisory Contracts and Management Fees
Fidelity Advisor Growth Strategies Fund
Each year, the Board of Trustees, including the Independent Trustees (together, the Board), votes on the renewal of the management contract and sub-advisory agreements (together, the Advisory Contracts) for the fund. The Board, assisted by the advice of fund counsel and Independent Trustees' counsel, requests and considers a broad range of information relevant to the renewal of the Advisory Contracts throughout the year.
The Board meets regularly and considers at each of its meetings factors that are relevant to its annual consideration of the renewal of the fund's Advisory Contracts, including the services and support provided to the fund and its shareholders. The Board has established various standing committees, each composed of Independent Trustees with varying backgrounds, to which the Board has assigned specific subject matter responsibilities in order to enhance effective decision-making by the Board. The Board, acting directly and through its Committees, requests and receives information concerning the annual consideration of the renewal of the fund's Advisory Contracts. The Board also meets as needed to consider matters specifically related to the Board's annual consideration of the renewal of Advisory Contracts. Members of the Board may also meet with trustees of other Fidelity funds through ad hoc joint committees to discuss certain matters relevant to the Fidelity funds.
At its July 2011 meeting, the Board of Trustees, including the Independent Trustees, unanimously determined to renew the fund's Advisory Contracts. In reaching its determination, the Board considered all factors it believed relevant, including (i) the nature, extent, and quality of the services to be provided to the fund and its shareholders (including the investment performance of the fund); (ii) the competitiveness of the fund's management fee and total expense ratio; (iii) the total costs of the services to be provided by and the profits to be realized by Fidelity from its relationship with the fund; (iv) the extent to which economies of scale would be realized as the fund grows; and (v) whether fee levels reflect these economies of scale, if any, for the benefit of fund shareholders.
In considering whether to renew the Advisory Contracts for the fund, the Board reached a determination, with the assistance of fund counsel and Independent Trustees' counsel and through the exercise of its business judgment, that the renewal of the Advisory Contracts is in the best interests of the fund and its shareholders and that the compensation payable under the Advisory Contracts is fair and reasonable. The Board's decision to renew the Advisory Contracts was not based on any single factor, but rather was based on a comprehensive consideration of all the information provided to the Board at its meetings throughout the year. The Board, in reaching its determination to renew the Advisory Contracts, is aware that shareholders in the fund have a broad range of investment choices available to them, including a wide choice among mutual funds offered by Fidelity's competitors, and that the fund's shareholders, who have the opportunity to review and weigh the disclosure provided by the fund in its prospectus and other public disclosures, have chosen to invest in this fund, managed by Fidelity.
Annual Report
Board Approval of Investment Advisory Contracts and
Management Fees - continued
Nature, Extent, and Quality of Services Provided. The Board considered the staffing within the investment adviser, FMR, and the sub-advisers (together, the Investment Advisers), including the backgrounds of the fund's investment personnel and the fund's investment objective and discipline. The Independent Trustees also had discussions with senior management of Fidelity's investment operations and investment groups. The Board considered the structure of the portfolio manager compensation program and whether this structure provides appropriate incentives to act in the best interests of the fund.
Resources Dedicated to Investment Management and Support Services. The Board and the Fund Oversight and Research Committees reviewed the general qualifications and capabilities of the Investment Advisers' investment staff, including its size, education, experience, and resources, as well as the Investment Advisers' approach to recruiting, training, managing, and compensating investment personnel. The Board also noted that FMR has devoted increased resources to non-U.S. offices. The Board noted that Fidelity's analysts have extensive resources, tools and capabilities which allow them to conduct sophisticated quantitative and fundamental analysis, as well as credit analysis of issuers, counterparties and enhancers. The Board also believes that Fidelity's investment professionals have sufficient access to global information and data so as to provide competitive investment results over time, and that those professionals also have access to sophisticated tools which permit them to assess portfolio construction and risk and performance attribution characteristics continuously, as well as to transmit new information and research conclusions rapidly around the world. Additionally, in their deliberations, the Board considered the Investment Advisers' trading capabilities and resources which are an integral part of the investment management process.
Shareholder and Administrative Services. The Board considered (i) the nature, extent, quality, and cost of advisory, administrative, and shareholder services performed by the Investment Advisers and their affiliates under the Advisory Contracts and under separate agreements covering transfer agency, pricing and bookkeeping, and securities lending services for the fund; (ii) the nature and extent of the investment adviser's supervision of third party service providers, principally custodians and subcustodians; and (iii) the resources devoted to, and the record of compliance with, the fund's compliance policies and procedures. The Board also reviewed the allocation of fund brokerage, including allocations to brokers affiliated with the Investment Advisers, the use of brokerage commissions to pay fund expenses, and the use of "soft" commission dollars to pay for research services.
The Board noted that the growth of fund assets over time across the complex allows Fidelity to reinvest in the development of services designed to enhance the value or convenience of the Fidelity funds as investment vehicles. These services include 24-hour access to account information and market information through telephone representatives and over the Internet, investor education materials and asset allocation tools, and the expanded availability of Fidelity Investor Centers, with 35 new branches opening since 2010.
Annual Report
Investment in a Large Fund Family. The Board considered the benefits to shareholders of investing in a Fidelity fund, including the benefits of investing in a fund that is part of a large family of funds offering a variety of investment disciplines and providing a large variety of mutual fund investor services. The Board noted that Fidelity had taken, or had made recommendations that resulted in the Fidelity funds taking, a number of actions over the previous year that benefited particular funds, including (i) continuing to dedicate additional resources to investment research and support of the senior management team that oversees asset management; (ii) rationalizing product lines through the mergers of six funds into other funds; (iii) continuing to migrate the Freedom Funds to dedicated lower cost underlying funds; (iv) obtaining shareholder approval to broaden the investment strategies for Fidelity Consumer Finance Portfolio, Fidelity Emerging Asia Fund, and Fidelity Environment and Alternative Energy Portfolio; (v) contractually agreeing to reduce the management fees and impose other expense limitations on Spartan 500 Index Fund and U.S. Bond Index Fund in connection with launching new institutional classes of these funds; (vi) changing the name, primary and supplemental benchmarks, and investment policies of Fidelity Global Strategies Fund to support the fund's flexible investment mandate and global orientation; and (vii) reducing the transfer agency account fee rates on certain accounts.
Investment Performance. The Board considered whether the fund has operated in accordance with its investment objective, as well as its record of compliance with its investment restrictions. It also reviewed the fund's absolute investment performance for each class, as well as the fund's relative investment performance for each class measured over multiple periods against (i) a broad-based securities market index, and (ii) a peer group of mutual funds deemed appropriate by Fidelity and reviewed by the Board. The following charts considered by the Board show, over the one-, three-, and five-year periods ended December 31, 2010, the cumulative total returns of Institutional Class (Class I) and Class B of the fund, the cumulative total returns of a broad-based securities market index ("benchmark"), and a range of cumulative total returns of a peer group of mutual funds identified by Morningstar, Inc. as having an investment style similar to that of the fund based on underlying portfolio holdings. The returns of Institutional Class (Class I) and Class B show the performance of the highest and lowest performing classes, respectively (based on five-year performance). The box within each chart shows the 25th percentile return (bottom of box) and the 75th percentile return (top of box) of the peer group. Returns shown above the box are in the first quartile and returns shown below the box are in the fourth quartile. The percentage beaten numbers noted below each chart correspond to the percentile box and represent the percentage of funds in the peer group whose performance was equal to or lower than that of the class indicated.
Annual Report
Board Approval of Investment Advisory Contracts and
Management Fees - continued
Fidelity Advisor Growth Strategies Fund
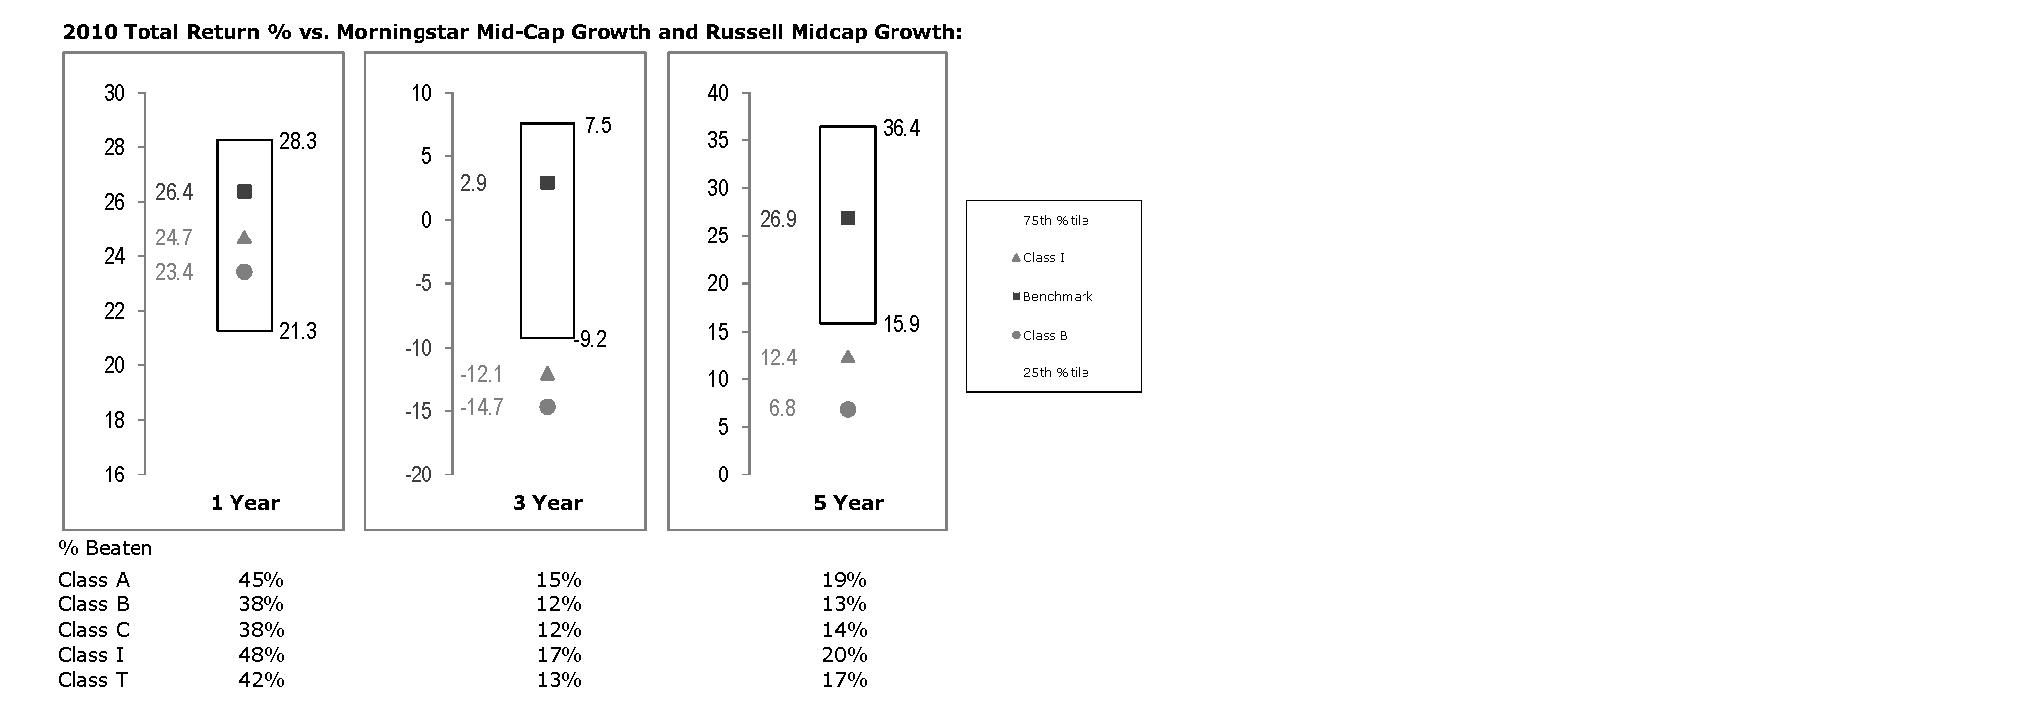
The Board reviewed the fund's relative investment performance against its peer group and noted that the performance of Institutional Class (Class I) of the fund was in the third quartile for the one-year period and the fourth quartile for the three- and five-year periods. The Board also noted that the investment performance of the fund was lower than its benchmark for all the periods shown. The Board considered that the variations in performance among the fund's classes reflect the variations in class expenses, which result in lower performance for higher expense classes. The Board discussed with FMR actions that have been taken by FMR to improve the fund's disappointing performance relative to its peer group and benchmark. The Board noted that this fund had underperformed in 2009 and discussed with FMR its disappointment with the continued underperformance of the fund. The Board also reviewed the fund's performance since inception as well as performance in the current year. The Board will continue to closely monitor the performance of the fund in the coming year and discuss with FMR other appropriate actions to address the performance of the fund.
The Board also considered that the fund's management fee is subject to upward or downward adjustment depending upon whether, and to what extent, the fund's investment performance for the performance period exceeds, or is exceeded by, the record (over the same period) of a Board-approved performance adjustment index. The Board noted that the performance adjustment provides FMR with a strong economic incentive to seek to achieve superior performance for the fund's shareholders and helps to more closely align the interests of FMR and the fund's shareholders.
Annual Report
Based on its review, the Board concluded that the nature, extent, and quality of services provided to the fund under the Advisory Contracts should benefit the fund's shareholders.
Competitiveness of Management Fee and Total Expense Ratio. The Board considered the fund's management fee and total expense ratio compared to "mapped groups" of competitive funds and classes. Fidelity creates "mapped groups" by combining similar Lipper investment objective categories that have comparable management fee characteristics. Combining Lipper investment objective categories aids the Board's management fee and total expense ratio comparisons by broadening the competitive group used for comparison and by reducing the number of universes to which various Fidelity funds are compared.
Management Fee. The Board considered two proprietary management fee comparisons for the 12-month periods shown in the chart below. The group of Lipper funds used by the Board for management fee comparisons is referred to below as the "Total Mapped Group." The Total Mapped Group comparison focuses on a fund's standing relative to the total universe of comparable funds available to investors in terms of gross management fees before expense reimbursements or caps, and without giving effect to the fund's performance adjustment. "TMG %" represents the percentage of funds in the Total Mapped Group that had management fees that were lower than the fund's. For example, a TMG % of 17% means that 83% of the funds in the Total Mapped Group had higher management fees than the fund. The "Asset-Size Peer Group" (ASPG) comparison focuses on a fund's standing relative to non-Fidelity funds similar in size to the fund within the Total Mapped Group. The ASPG represents at least 15% of the funds in the Total Mapped Group with comparable asset size and management fee characteristics, subject to a minimum of 50 funds (or all funds in the Total Mapped Group if fewer than 50). Additional information, such as the ASPG quartile in which the fund's management fee ranked and the impact of the fund's performance adjustment, is also included in the chart and considered by the Board.
Annual Report
Board Approval of Investment Advisory Contracts and
Management Fees - continued
Fidelity Advisor Growth Strategies Fund

The Board noted that the fund's management fee ranked below the median of its Total Mapped Group and below the median of its ASPG for 2010. The Board also noted the effect of the fund's negative performance adjustment on the fund's management fee ranking. The Board noted that the performance adjustment for each year represents calculations for performance periods that differ from the periods shown in the performance charts above.
Based on its review, the Board concluded that the fund's management fee is fair and reasonable in light of the services that the fund receives and the other factors considered.
Total Expense Ratio. In its review of each class's total expense ratio, the Board considered the fund's management fee as well as other fund or class expenses, as applicable, such as transfer agent fees, pricing and bookkeeping fees, fund-paid 12b-1 fees, and custodial, legal, and audit fees. The Board also noted the effects of any waivers and reimbursements on fees and expenses, as well as the impact of the fund's performance adjustment. As part of its review, the Board also considered the current and historical total expense ratios of each class of the fund compared to competitive fund median expenses. Each class of the fund is compared to those funds and classes in the Total Mapped Group (used by the Board for management fee comparisons) that have a similar sales load structure.
The Board noted that the total expense ratio of each of Class A and Class B ranked below its competitive median for 2010, the total expense ratio of each of Class C and Institutional Class ranked equal to its competitive median for 2010, and the total expense ratio of Class T ranked above its competitive median for 2010. The Board considered that various factors, including 12b-1 fees, positive or negative performance adjustments, and relatively higher other expenses in the case of small fund size, can affect total expense ratios. The Board noted that the total expense ratio of Class T was above the competitive median primarily because of higher 12b-1 fees on Class T. Class T has a higher 12b-1 fee, but a lower front-end sales charge, than traditionally priced front-end sales charge classes. The Board noted that the fund offers multiple classes, each of which has a different sales load and 12b-1 fee structure, and that the multiple structures are intended to offer a range of pricing options for the intermediary market. The Board also noted that the total expense ratios of the classes vary primarily by the level of their 12b-1 fees, although differences in transfer agent fees may also cause expenses to vary from class to class.
Annual Report
Fees Charged to Other Fidelity Clients. The Board also considered Fidelity fee structures and other information with respect to clients of FMR and its affiliates, such as other mutual funds advised or subadvised by FMR or its affiliates, pension plan clients, and other institutional clients. In March 2010, the Board created an ad hoc joint committee with the board of other Fidelity funds (the Committee) to review and compare Fidelity's institutional investment advisory business with its business of providing services to the Fidelity funds, including the differences in services provided, fees charged, and costs incurred, as well as competition in their respective marketplaces.
Based on its review of total expense ratios and fees charged to other Fidelity clients, the Board concluded that the total expense ratio of each class of the fund was reasonable, although Class T was above the median of the universe presented for comparison, in light of the services that the fund and its shareholders receive and the other factors considered, including the findings of the Committee.
Costs of the Services and Profitability. The Board considered the revenues earned and the expenses incurred by Fidelity in conducting the business of developing, marketing, distributing, managing, administering and servicing the fund and its shareholders. The Board also considered the level of Fidelity's profits in respect of all the Fidelity funds.
On an annual basis, FMR presents to the Board Fidelity's profitability for the fund. Fidelity calculates the profitability for each fund, as well as aggregate profitability for groups of Fidelity funds and all Fidelity funds, using a series of detailed revenue and cost allocation methodologies which originate with the books and records of Fidelity on which Fidelity's audited financial statements are based. The Audit Committee of the Board reviews any significant changes from the prior year's methodologies.
PricewaterhouseCoopers LLP (PwC), independent registered public accounting firm and auditor to Fidelity and certain Fidelity funds, has been engaged annually by the Board as part of the Board's assessment of Fidelity's profitability analysis. PwC's engagement includes the review and assessment of Fidelity's methodologies used in determining the revenues and expenses attributable to Fidelity's mutual fund business, and completion of agreed-upon procedures surrounding the mathematical accuracy of fund profitability and its conformity to allocation methodologies. After considering PwC's reports issued under the engagement and information provided by Fidelity, the Board concluded that while other allocation methods may also be reasonable, Fidelity's profitability methodologies are reasonable in all material respects.
Annual Report
Board Approval of Investment Advisory Contracts and
Management Fees - continued
The Board also reviewed Fidelity's non-fund businesses and fall-out benefits related to the mutual fund business as well as cases where Fidelity's affiliates may benefit from or be related to the fund's business.
The Board considered the costs of the services provided by and the profits realized by Fidelity in connection with the operation of the fund and was satisfied that the profitability was not excessive in the circumstances.
Economies of Scale. The Board considered whether there have been economies of scale in respect of the management of the Fidelity funds, whether the Fidelity funds (including the fund) have appropriately benefited from any such economies of scale, and whether there is potential for realization of any further economies of scale. The Board considered the extent to which the fund will benefit from economies of scale through increased services to the fund, through waivers or reimbursements, or through fee or expense reductions. The Board also noted that in 2009, it and the board of other Fidelity funds created an ad hoc committee (the Economies of Scale Committee) to analyze whether FMR attains economies of scale in respect of the management and servicing of the Fidelity funds, whether the Fidelity funds have appropriately benefited from such economies of scale, and whether there is potential for realization of any further economies of scale.
The Board recognized that the fund's management contract incorporates a "group fee" structure, which provides for lower group fee rates as total fund assets under FMR's management increase, and for higher group fee rates as total fund assets under FMR's management decrease. FMR calculates the group fee rates based on a tiered asset "breakpoint" schedule that varies based on asset class. The Board considered that the group fee is designed to deliver the benefits of economies of scale to fund shareholders when total Fidelity fund assets increase, even if assets of any particular fund are unchanged or have declined, because some portion of Fidelity's costs are attributable to services provided to all Fidelity funds, and all funds benefit if those costs can be allocated among more assets. The Board concluded that, given the group fee structure, fund shareholders will benefit from lower management fees as assets under FMR's management increase at the fund complex level, regardless of whether Fidelity achieves any such economies of scale.
Annual Report
The Board concluded, taking into account the analysis of the Economies of Scale Committee, that any potential economies of scale are being appropriately shared between fund shareholders and Fidelity.
Additional Information Requested by the Board. In order to develop fully the factual basis for consideration of the Fidelity funds' Advisory Contracts, the Board requested and received additional information on certain topics, including (i) fund performance trends, actions to be taken by FMR to improve certain funds' overall performance, and Fidelity's long-term strategies for certain funds; (ii) portfolio manager changes that have occurred during the past year and length of portfolio manager tenure for different categories of funds over time; (iii) Fidelity's compensation structure for portfolio managers and other key personnel and strategies for attracting and retaining non-investment personnel; (iv) the amount of the investment that each portfolio manager has made in the Fidelity fund(s) that he or she manages; (v) historical trends in Fidelity's realization of fall-out benefits; (vi) Fidelity's group fee structures and the rationale for the individual fee rates of certain funds; (vii) fund profitability methodology and the impact of certain factors on fund profitability results; (viii) trends regarding industry use of performance fee structures and Fidelity's compliance practices with respect to performance adjustment calculations; (ix) the fee structures in place for certain other Fidelity clients; and (x) explanations regarding the relative total expense ratios of certain funds and classes, total expense competitive trends, and actions that might be taken by FMR to reduce total expense ratios for certain funds and classes.
Based on its evaluation of all of the conclusions noted above, and after considering all factors it believed relevant, the Board ultimately concluded that the advisory fee structures are fair and reasonable, and that the fund's Advisory Contracts should be renewed.
Annual Report
Investment Adviser
Fidelity Management & Research Company
Boston, MA
Investment Sub-Advisers
FMR Co., Inc.
Fidelity Management & Research
(U.K.) Inc.
Fidelity Management & Research (Hong Kong) Limited
Fidelity Management & Research (Japan) Inc.
General Distributor
Fidelity Distributors Corporation
Boston, MA
Transfer and Service Agents
Fidelity Investments Institutional
Operations Company, Inc.
Boston, MA
Fidelity Service Company, Inc.
Boston, MA
Custodian
State Street Bank and Trust Company
Quincy, MA

AAG-UANN-0112
1.786669.108
Item 2. Code of Ethics
As of the end of the period, November 30, 2011, Fidelity Securities Fund (the trust) has adopted a code of ethics, as defined in Item 2 of Form N-CSR, that applies to its President and Treasurer and its Chief Financial Officer. A copy of the code of ethics is filed as an exhibit to this Form N-CSR.
Item 3. Audit Committee Financial Expert
The Board of Trustees of the trust has determined that Joseph Mauriello is an audit committee financial expert, as defined in Item 3 of Form N-CSR. Mr. Mauriello is independent for purposes of Item 3 of Form N-CSR.
Item 4. Principal Accountant Fees and Services
Fees and Services
The following table presents fees billed by PricewaterhouseCoopers LLP ("PwC") in each of the last two fiscal years for services rendered to Fidelity Advisor Growth Strategies Fund (the "Fund"):
Services Billed by PwC
November 30, 2011 FeesA
| Audit Fees | Audit-Related Fees | Tax Fees | All Other Fees |
Fidelity Advisor Growth Strategies Fund | $48,000 | $- | $3,300 | $1,700 |
November 30, 2010 FeesA
| Audit Fees | Audit-Related Fees | Tax Fees | All Other Fees |
Fidelity Advisor Growth Strategies Fund | $47,000 | $- | $3,200 | $1,800 |
A Amounts may reflect rounding.
The following table presents fees billed by PwC that were required to be approved by the Audit Committee for services that relate directly to the operations and financial reporting of the Fund and that are rendered on behalf of Fidelity Management & Research Company ("FMR") and entities controlling, controlled by, or under common control with FMR (not including any sub-adviser whose role is primarily portfolio management and is subcontracted with or overseen by another investment adviser) that provide ongoing services to the Fund ("Fund Service Providers"):
Services Billed by PwC
| November 30, 2011A | November 30, 2010A |
Audit-Related Fees | $3,505,000 | $2,605,000 |
Tax Fees | $- | $- |
All Other Fees | $- | $510,000 |
A Amounts may reflect rounding.
"Audit-Related Fees" represent fees billed for assurance and related services that are reasonably related to the performance of the fund audit or the review of the fund's financial statements and that are not reported under Audit Fees.
"Tax Fees" represent fees billed for tax compliance, tax advice or tax planning that relate directly to the operations and financial reporting of the fund.
"All Other Fees" represent fees billed for services provided to the fund or Fund Service Provider, a significant portion of which are assurance related, that relate directly to the operations and financial reporting of the fund, excluding those services that are reported under Audit Fees, Audit-Related Fees or Tax Fees.
Assurance services must be performed by an independent public accountant.
* * *
The aggregate non-audit fees billed by PwC for services rendered to the Fund, FMR (not including any sub-adviser whose role is primarily portfolio management and is subcontracted with or overseen by another investment adviser), and any Fund Service Provider for each of the last two fiscal years of the Fund are as follows:
Billed By | November 30, 2011 A | November 30, 2010 A |
PwC | $5,250,000 | $4,710,000 |
A Amounts may reflect rounding.
The trust's Audit Committee has considered non-audit services that were not pre-approved that were provided by PwC to Fund Service Providers to be compatible with maintaining the independence of PwC in its audit of the Fund, taking into account representations from PwC, in accordance with Public Company Accounting Oversight Board rules, regarding its independence from the Fund and its related entities and FMR's review of the appropriateness and permissibility under applicable law of such non-audit services prior to their provision to the Fund Service Providers.
Audit Committee Pre-Approval Policies and Procedures
The trust's Audit Committee must pre-approve all audit and non-audit services provided by a fund's independent registered public accounting firm relating to the operations or financial reporting of the fund. Prior to the commencement of any audit or non-audit services to a fund, the Audit Committee reviews the services to determine whether they are appropriate and permissible under applicable law.
The Audit Committee has adopted policies and procedures to, among other purposes, provide a framework for the Committee's consideration of non-audit services by the audit firms that audit the Fidelity funds. The policies and procedures require that any non-audit service provided by a fund audit firm to a Fidelity fund and any non-audit service provided by a fund auditor to a Fund Service Provider that relates directly to the operations and financial reporting of a Fidelity fund ("Covered Service") are subject to approval by the Audit Committee before such service is provided.
All Covered Services must be approved in advance of provision of the service either: (i) by formal resolution of the Audit Committee, or (ii) by oral or written approval of the service by the Chair of the Audit Committee (or if the Chair is unavailable, such other member of the Audit Committee as may be designated by the Chair to act in the Chair's absence). The approval contemplated by (ii) above is permitted where the Treasurer determines that action on such an engagement is necessary before the next meeting of the Audit Committee.
Non-audit services provided by a fund audit firm to a Fund Service Provider that do not relate directly to the operations and financial reporting of a Fidelity fund are reported to the Audit Committee on a periodic basis.
Non-Audit Services Approved Pursuant to Rule 2-01(c)(7)(i)(C) and (ii) of Regulation S-X ("De Minimis Exception")
There were no non-audit services approved or required to be approved by the Audit Committee pursuant to the De Minimis Exception during the Fund's last two fiscal years relating to services provided to (i) the Fund or (ii) any Fund Service Provider that relate directly to the operations and financial reporting of the Fund.
Item 5. Audit Committee of Listed Registrants
Not applicable.
Item 6. Investments
(a) Not applicable.
(b) Not applicable
Item 7. Disclosure of Proxy Voting Policies and Procedures for Closed-End Management Investment Companies
Not applicable.
Item 8. Portfolio Managers of Closed-End Management Investment Companies
Not applicable.
Item 9. Purchase of Equity Securities by Closed-End Management Investment Company and Affiliated Purchasers
Not applicable.
Item 10. Submission of Matters to a Vote of Security Holders
There were no material changes to the procedures by which shareholders may recommend nominees to the trust's Board of Trustees.
Item 11. Controls and Procedures
(a)(i) The President and Treasurer and the Chief Financial Officer have concluded that the trust's disclosure controls and procedures (as defined in Rule 30a-3(c) under the Investment Company Act) provide reasonable assurances that material information relating to the trust is made known to them by the appropriate persons, based on their evaluation of these controls and procedures as of a date within 90 days of the filing date of this report.
(a)(ii) There was no change in the trust's internal control over financial reporting (as defined in Rule 30a-3(d) under the Investment Company Act) that occurred during the second fiscal quarter of the period covered by this report that has materially affected, or is reasonably likely to materially affect, the trust's internal control over financial reporting.
Item 12. Exhibits
(a) | (1) | Code of Ethics pursuant to Item 2 of Form N-CSR is filed and attached hereto as EX-99.CODE ETH. |
(a) | (2) | Certification pursuant to Rule 30a-2(a) under the Investment Company Act of 1940 (17 CFR 270.30a-2(a)) is filed and attached hereto as Exhibit 99.CERT. |
(a) | (3) | Not applicable. |
(b) | | Certification pursuant to Rule 30a-2(b) under the Investment Company Act of 1940 (17 CFR 270.30a-2(b)) is furnished and attached hereto as Exhibit 99.906CERT. |
SIGNATURES
Pursuant to the requirements of the Securities Exchange Act of 1934 and the Investment Company Act of 1940, the registrant has duly caused this report to be signed on its behalf by the undersigned, thereunto duly authorized.
Fidelity Securities Fund
By: | /s/Kenneth B. Robins |
| Kenneth B. Robins |
| President and Treasurer |
| |
Date: | January 25, 2012 |
Pursuant to the requirements of the Securities Exchange Act of 1934 and the Investment Company Act of 1940, this report has been signed below by the following persons on behalf of the registrant and in the capacities and on the dates indicated.
By: | /s/Kenneth B. Robins |
| Kenneth B. Robins |
| President and Treasurer |
| |
Date: | January 25, 2012 |
By: | /s/Christine Reynolds |
| Christine Reynolds |
| Chief Financial Officer |
| |
Date: | January 25, 2012 |