UNITED STATES
SECURITIES AND EXCHANGE COMMISSION
Washington, D.C. 20549
FORM N-CSR
CERTIFIED SHAREHOLDER REPORT OF REGISTERED
MANAGEMENT INVESTMENT COMPANIES
Investment Company Act file number 811-4118
Fidelity Securities Fund
(Exact name of registrant as specified in charter)
82 Devonshire St., Boston, Massachusetts 02109
(Address of principal executive offices) (Zip code)
Scott C. Goebel, Secretary
82 Devonshire St.
Boston, Massachusetts 02109
(Name and address of agent for service)
Registrant's telephone number, including area code: 617-563-7000
Date of fiscal year end: | July 31 |
| |
Date of reporting period: | July 31, 2012 |
Item 1. Reports to Stockholders
Fidelity®
Blue Chip Value
Fund
Annual Report
July 31, 2012
(Fidelity Cover Art)
Contents
Performance | (Click Here) | How the fund has done over time. |
Management's Discussion of Fund Performance | (Click Here) | The Portfolio Manager's review of fund performance and strategy. |
Shareholder Expense Example | (Click Here) | An example of shareholder expenses. |
Investment Changes | (Click Here) | A summary of major shifts in the fund's investments over the past 6 months. |
Investments | (Click Here) | A complete list of the fund's investments with their market values. |
Financial Statements | (Click Here) | Statements of assets and liabilities, operations, and changes in net assets, as well as financial highlights. |
Notes | (Click Here) | Notes to the financial statements. |
Report of Independent Registered Public Accounting Firm | (Click Here) | |
Trustees and Officers | (Click Here) | |
Distributions | (Click Here) | |
Board Approval of Investment Advisory Contracts and Management Fees | (Click Here) | |
To view a fund's proxy voting guidelines and proxy voting record for the 12-month period ended June 30, visit http://www.fidelity.com/proxyvotingresults or visit the Securities and Exchange Commission's (SEC) web site at http://www.sec.gov. You may also call 1-800-544-8544 to request a free copy of the proxy voting guidelines.
Standard & Poor's, S&P and S&P 500 are registered service marks of The McGraw-Hill Companies, Inc. and have been licensed for use by Fidelity Distributors Corporation.
Other third party marks appearing herein are the property of their respective owners.
All other marks appearing herein are registered or unregistered trademarks or service marks of FMR LLC or an affiliated company. © 2012 FMR LLC. All rights reserved.
Annual Report
This report and the financial statements contained herein are submitted for the general information of the shareholders of the fund. This report is not authorized for distribution to prospective investors in the fund unless preceded or accompanied by an effective prospectus.
A fund files its complete schedule of portfolio holdings with the SEC for the first and third quarters of each fiscal year on Form N-Q. Forms N-Q are available on the SEC's web site at http://www.sec.gov. A fund's Forms N-Q may be reviewed and copied at the SEC's Public Reference Room in Washington, DC. Information regarding the operation of the SEC's Public Reference Room may be obtained by calling 1-800-SEC-0330. For a complete list of a fund's portfolio holdings, view the most recent holdings listing, semiannual report, or annual report on Fidelity's web site at http://www.fidelity.com, http://www.advisor.fidelity.com, or http://www.401k.com, as applicable.
NOT FDIC INSURED • MAY LOSE VALUE • NO BANK GUARANTEE
Neither the fund nor Fidelity Distributors Corporation is a bank.
Annual Report
Average annual total return reflects the change in the value of an investment, assuming reinvestment of the fund's distributions from dividend income and capital gains (the profits earned upon the sale of securities that have grown in value, if any) and assuming a constant rate of performance each year. The $10,000 table and the fund's returns do not reflect the deduction of taxes that a shareholder would pay on fund distributions or the redemption of fund shares. During periods of reimbursement by Fidelity, a fund's total return will be greater than it would be had the reimbursement not occurred. How a fund did yesterday is no guarantee of how it will do tomorrow.
Average Annual Total Returns
Periods ended July 31, 2012 | Past 1
year | Past 5
years | Life of
fund A |
Fidelity® Blue Chip Value Fund | -3.95% | -5.64% | 2.65% |
A From June 17, 2003.
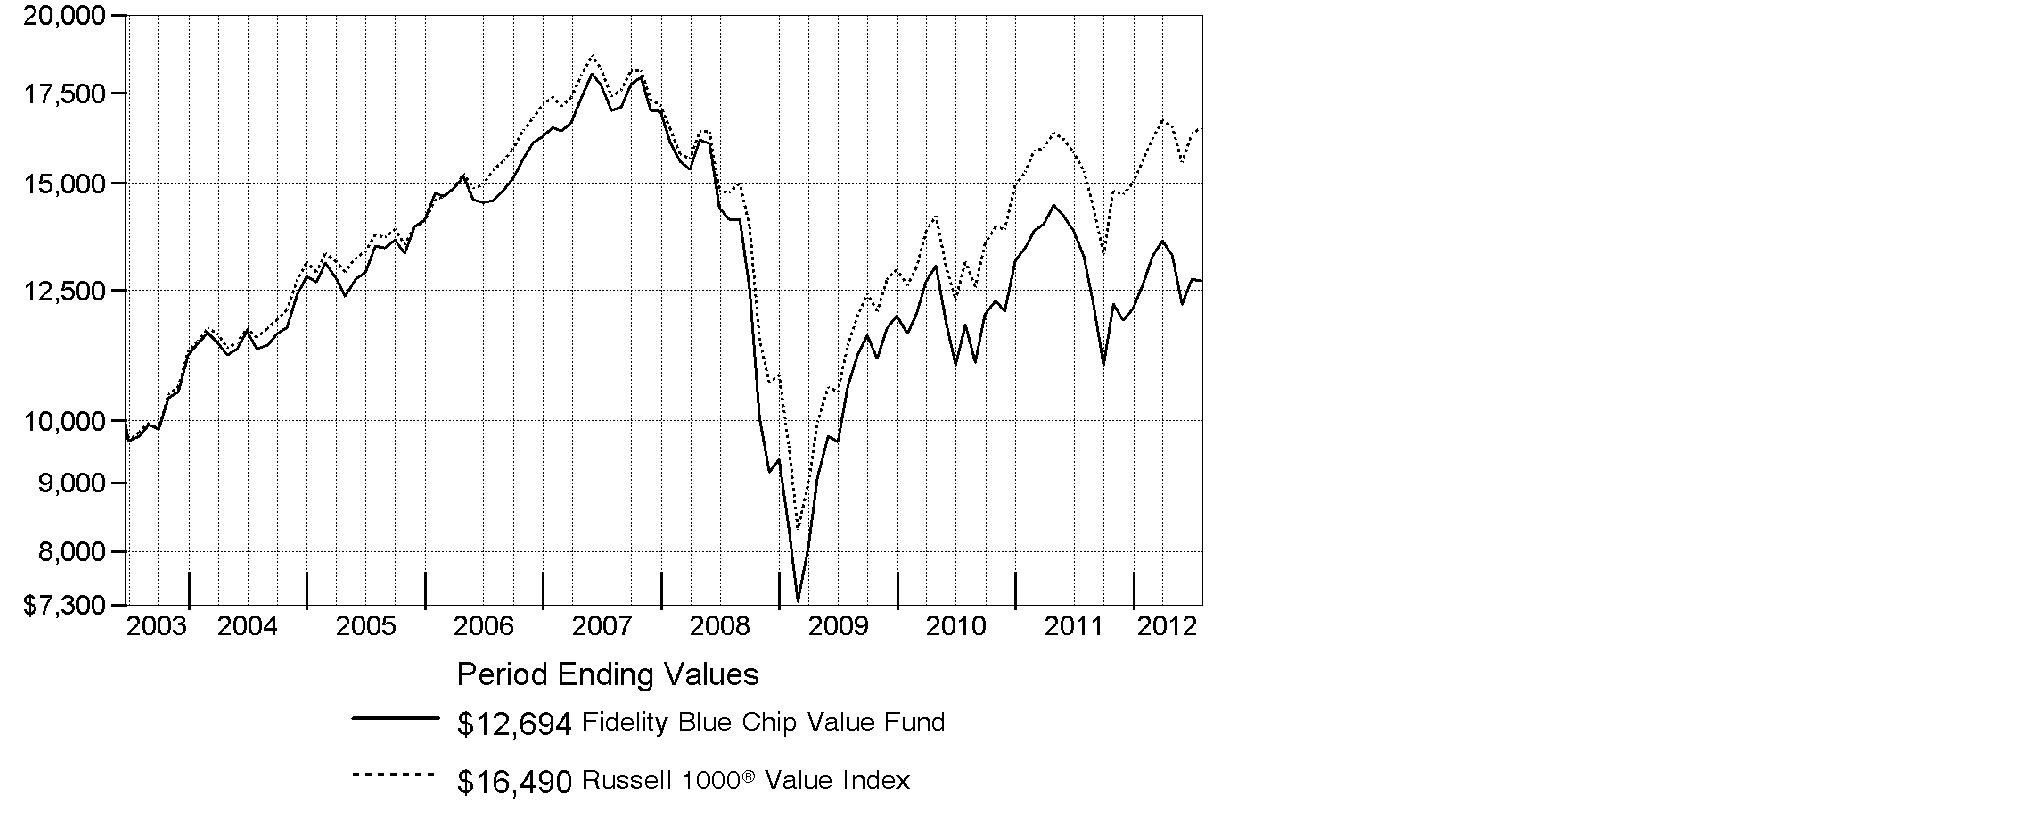
$10,000 Over Life of Fund
Let's say hypothetically that $10,000 was invested in Fidelity® Blue Chip Value Fund on June 17, 2003, when the fund started. The chart shows how the value of your investment would have changed, and also shows how the Russell 1000® Value Index performed over the same period.
Annual Report
Market Recap: Major U.S. equity benchmarks posted solid gains for the year ending July 31, 2012, amid an uncertain investment environment. The broad-based S&P 500® Index returned 9.13%, while the blue-chip-laden Dow Jones Industrial AverageSM and technology-heavy Nasdaq Composite® Index gained 10.12% and 7.83%, respectively. Volatility spiked during the period's first half, as equities plummeted late last summer on Europe's debt woes, political wrangling over the U.S. debt ceiling, and the sovereign credit-rating downgrade that followed. By October, a seemingly improved U.S. economy rejuvenated stocks, paving the way for major equity benchmarks to post their best first-quarter performance since 1998. However, more eurozone trouble, signs that the U.S. economy had turned sluggish and a slowdown in China caused stocks to slip in May, before a new wave of optimism took hold in June and July. Within the S&P 500®, more-defensive sectors such as telecommunication services (+30%) and consumer staples (+20%) fared best, while materials and energy significantly underperformed, returning -5%. Small- and mid-cap stocks trailed their less-volatile large-cap counterparts, with the Russell 2000® Index adding 0.19% and the Russell Midcap® Index rising 2.28%. Given turmoil and local currency weakness in Europe, foreign developed-markets stocks lost ground, with the MSCI® EAFE® Index returning -11.32%.
Comments from Michael Chren, Portfolio Manager of Fidelity® Blue Chip Value Fund: For the year, the fund returned -3.95%, significantly trailing the benchmark Russell 1000® Value Index, which gained 7.64%. By far, the biggest underperformance came from stock picking in information technology, including communications software company Comverse Technology, semiconductor maker Advanced Micro Devices and, especially, Alcatel-Lucent, a French maker of network communications equipment that struggled during the period. I sold the stock in the second quarter of 2012. Another negative was the diversified financials industry, in which both poor security selection - led by Citigroup - and an unproductive overweighting hurt. Our foreign holdings detracted overall, due in part to a stronger U.S. dollar. The story was mixed in consumer discretionary, where, despite helpful positioning among durables/apparel names, my choices within retailing and media disappointed, more than offsetting any gain. Global positioning device manufacturer Garmin was the strongest performer in this sector overall, while retailer J.C. Penney stood out on the downside. Elsewhere, other individual positives were Mexican brewer Grupo Modelo and two large pharmaceutical companies, Merck and Pfizer. Several stocks I've mentioned were not in the benchmark.
The views expressed above reflect those of the portfolio manager(s) only through the end of the period as stated on the cover of this report and do not necessarily represent the views of Fidelity or any other person in the Fidelity organization. Any such views are subject to change at any time based upon market or other conditions and Fidelity disclaims any responsibility to update such views. These views may not be relied on as investment advice and, because investment decisions for a Fidelity fund are based on numerous factors, may not be relied on as an indication of trading intent on behalf of any Fidelity fund.
Annual Report
Shareholder Expense Example
As a shareholder of the Fund, you incur two types of costs: (1) transaction costs, and (2) ongoing costs, including management fees and other Fund expenses. This Example is intended to help you understand your ongoing costs (in dollars) of investing in the Fund and to compare these costs with the ongoing costs of investing in other mutual funds.
The Example is based on an investment of $1,000 invested at the beginning of the period and held for the entire period (February 1, 2012 to July 31, 2012).
Actual Expenses
The first line of the accompanying table provides information about actual account values and actual expenses. You may use the information in this line, together with the amount you invested, to estimate the expenses that you paid over the period. Simply divide your account value by $1,000.00 (for example, an $8,600 account value divided by $1,000.00 = 8.6), then multiply the result by the number in the first line under the heading entitled "Expenses Paid During Period" to estimate the expenses you paid on your account during this period. A small balance maintenance fee of $12.00 that is charged once a year may apply for certain accounts with a value of less than $2,000. This fee is not included in the table below. If it was, the estimate of expenses you paid during the period would be higher, and your ending account value lower, by this amount. In addition, the Fund, as a shareholder in the underlying Fidelity Central Funds, will indirectly bear its pro-rata share of the fees and expenses incurred by the underlying Fidelity Central Funds. These fees and expenses are not included in the Fund's annualized expense ratio used to calculate the expense estimate in the table below.
Hypothetical Example for Comparison Purposes
The second line of the accompanying table provides information about hypothetical account values and hypothetical expenses based on the Fund's actual expense ratio and an assumed rate of return of 5% per year before expenses, which is not the Fund's actual return. The hypothetical account values and expenses may not be used to estimate the actual ending account balance or expenses you paid for the period. You may use this information to compare the ongoing costs of investing in the Fund and other funds. To do so, compare this 5% hypothetical example with the 5% hypothetical examples that appear in the shareholder reports of the other funds. A small balance maintenance fee of $12.00 that is charged once a year may apply for certain accounts with a value of less than $2,000. This fee is not included in the table below. If it was, the estimate of expenses you paid during the period would be higher, and your ending account value lower, by this amount. In addition, the Fund, as a shareholder in the underlying Fidelity Central Funds, will indirectly bear its pro-rata share of the fees and expenses incurred by the underlying Fidelity Central Funds. These fees and expenses are not included in the Fund's annualized expense ratio used to calculate the expense estimate in the table below.
Please note that the expenses shown in the table are meant to highlight your ongoing costs only and do not reflect any transaction costs. Therefore, the second line of the table is useful in comparing ongoing costs only, and will not help you determine the relative total costs of owning different funds.
Annual Report
Shareholder Expense Example - continued
| Annualized
Expense Ratio | Beginning
Account Value
February 1, 2012 | Ending
Account Value
July 31, 2012 | Expenses Paid
During Period*
February 1, 2012
to July 31, 2012 |
Actual | .74% | $ 1,000.00 | $ 1,005.90 | $ 3.69 |
Hypothetical (5% return per year before expenses) | | $ 1,000.00 | $ 1,021.18 | $ 3.72 |
* Expenses are equal to the Fund's annualized expense ratio, multiplied by the average account value over the period, multiplied by 182/366 (to reflect the one-half year period).
Annual Report
Investment Changes (Unaudited)
Top Ten Stocks as of July 31, 2012 |
| % of fund's
net assets | % of fund's net assets
6 months ago |
Pfizer, Inc. | 4.4 | 4.0 |
Exxon Mobil Corp. | 4.3 | 0.0 |
General Electric Co. | 4.0 | 3.1 |
Merck & Co., Inc. | 3.5 | 3.5 |
Chevron Corp. | 3.3 | 3.0 |
Citigroup, Inc. | 2.7 | 4.4 |
Comverse Technology, Inc. | 2.7 | 2.0 |
Aozora Bank Ltd. | 2.6 | 2.4 |
Anadarko Petroleum Corp. | 2.4 | 1.2 |
Wells Fargo & Co. | 2.3 | 2.4 |
| 32.2 | |
Top Five Market Sectors as of July 31, 2012 |
| % of fund's
net assets | % of fund's net assets
6 months ago |
Financials | 24.3 | 24.8 |
Energy | 15.7 | 9.0 |
Health Care | 15.2 | 15.8 |
Information Technology | 9.8 | 11.5 |
Consumer Discretionary | 7.8 | 8.9 |
Asset Allocation (% of fund's net assets) |
As of July 31, 2012 * | As of January 31, 2012 ** |
 | Stocks 96.6% | | | Stocks 94.8% | |
 | Short-Term
Investments and
Net Other Assets (Liabilities) 3.4% | | | Short-Term
Investments and
Net Other Assets (Liabilities) 5.2% | |
* Foreign investments | 9.3% | | ** Foreign investments | 22.7% | |

Annual Report
Investments July 31, 2012
Showing Percentage of Net Assets
Common Stocks - 96.6% |
| Shares | | Value |
CONSUMER DISCRETIONARY - 7.8% |
Diversified Consumer Services - 1.0% |
DeVry, Inc. | 127,763 | | $ 2,507,988 |
Household Durables - 1.6% |
Garmin Ltd. (d) | 96,656 | | 3,731,888 |
Media - 2.9% |
DISH Network Corp. Class A | 109,256 | | 3,360,715 |
Time Warner, Inc. | 13,154 | | 514,584 |
Washington Post Co. Class B (d) | 9,073 | | 3,071,211 |
| | 6,946,510 |
Multiline Retail - 2.3% |
JCPenney Co., Inc. (d) | 238,367 | | 5,365,641 |
TOTAL CONSUMER DISCRETIONARY | | 18,552,027 |
CONSUMER STAPLES - 6.7% |
Beverages - 1.3% |
Grupo Modelo SAB de CV Series C | 364,239 | | 3,284,546 |
Food & Staples Retailing - 2.0% |
CVS Caremark Corp. | 45,656 | | 2,065,934 |
Wal-Mart Stores, Inc. | 35,581 | | 2,648,294 |
| | 4,714,228 |
Food Products - 2.2% |
Kraft Foods, Inc. Class A | 131,101 | | 5,206,021 |
Household Products - 1.2% |
Procter & Gamble Co. | 43,787 | | 2,826,013 |
TOTAL CONSUMER STAPLES | | 16,030,808 |
ENERGY - 15.7% |
Energy Equipment & Services - 1.9% |
Cameron International Corp. (a) | 62,559 | | 3,144,841 |
Halliburton Co. | 41,300 | | 1,368,269 |
| | 4,513,110 |
Oil, Gas & Consumable Fuels - 13.8% |
Anadarko Petroleum Corp. | 80,734 | | 5,606,169 |
Apache Corp. | 8,600 | | 740,632 |
Chevron Corp. | 70,933 | | 7,772,838 |
Exxon Mobil Corp. | 117,975 | | 10,246,129 |
Hess Corp. | 14,133 | | 666,512 |
Marathon Petroleum Corp. | 11,227 | | 531,037 |
Common Stocks - continued |
| Shares | | Value |
ENERGY - continued |
Oil, Gas & Consumable Fuels - continued |
Occidental Petroleum Corp. | 37,516 | | $ 3,265,017 |
Williams Companies, Inc. | 122,583 | | 3,896,914 |
| | 32,725,248 |
TOTAL ENERGY | | 37,238,358 |
FINANCIALS - 24.3% |
Capital Markets - 3.7% |
Ameriprise Financial, Inc. | 9,600 | | 496,512 |
Bank of New York Mellon Corp. | 66,200 | | 1,408,736 |
E*TRADE Financial Corp. (a) | 568,409 | | 4,336,961 |
Goldman Sachs Group, Inc. | 7,847 | | 791,762 |
State Street Corp. | 42,070 | | 1,698,787 |
| | 8,732,758 |
Commercial Banks - 9.2% |
Aozora Bank Ltd. | 2,658,000 | | 6,089,898 |
Fifth Third Bancorp | 150,600 | | 2,081,292 |
KeyCorp | 552,759 | | 4,411,017 |
U.S. Bancorp | 68,998 | | 2,311,433 |
Wells Fargo & Co. | 164,298 | | 5,554,915 |
Zions Bancorporation | 76,937 | | 1,400,253 |
| | 21,848,808 |
Consumer Finance - 0.6% |
Capital One Financial Corp. | 26,700 | | 1,508,283 |
Diversified Financial Services - 4.9% |
Bank of America Corp. | 198,435 | | 1,456,513 |
Citigroup, Inc. | 235,387 | | 6,386,049 |
JPMorgan Chase & Co. | 104,216 | | 3,751,776 |
| | 11,594,338 |
Insurance - 4.6% |
Allstate Corp. | 32,000 | | 1,097,600 |
Assurant, Inc. | 43,186 | | 1,563,765 |
Berkshire Hathaway, Inc. Class B (a) | 17,821 | | 1,511,934 |
MetLife, Inc. | 46,755 | | 1,438,651 |
RenaissanceRe Holdings Ltd. | 15,852 | | 1,172,889 |
The Chubb Corp. | 20,416 | | 1,484,039 |
XL Group PLC Class A | 129,126 | | 2,666,452 |
| | 10,935,330 |
Common Stocks - continued |
| Shares | | Value |
FINANCIALS - continued |
Real Estate Investment Trusts - 0.8% |
Weyerhaeuser Co. | 81,884 | | $ 1,911,991 |
Thrifts & Mortgage Finance - 0.5% |
Radian Group, Inc. (d) | 479,299 | | 1,342,037 |
TOTAL FINANCIALS | | 57,873,545 |
HEALTH CARE - 15.2% |
Health Care Equipment & Supplies - 0.2% |
CareFusion Corp. (a) | 15,305 | | 373,595 |
Health Care Providers & Services - 0.8% |
HCA Holdings, Inc. | 73,389 | | 1,943,341 |
Pharmaceuticals - 14.2% |
Bristol-Myers Squibb Co. | 51,741 | | 1,841,980 |
Eli Lilly & Co. | 59,849 | | 2,635,151 |
Johnson & Johnson | 78,002 | | 5,399,298 |
Merck & Co., Inc. | 188,195 | | 8,312,573 |
Pfizer, Inc. | 436,253 | | 10,487,523 |
Sanofi SA sponsored ADR | 129,136 | | 5,248,087 |
| | 33,924,612 |
TOTAL HEALTH CARE | | 36,241,548 |
INDUSTRIALS - 6.9% |
Aerospace & Defense - 1.9% |
Textron, Inc. | 172,321 | | 4,488,962 |
Construction & Engineering - 1.0% |
Jacobs Engineering Group, Inc. (a) | 58,025 | | 2,238,024 |
Industrial Conglomerates - 4.0% |
General Electric Co. | 462,031 | | 9,587,143 |
TOTAL INDUSTRIALS | | 16,314,129 |
INFORMATION TECHNOLOGY - 9.8% |
Communications Equipment - 0.9% |
Cisco Systems, Inc. | 129,000 | | 2,057,550 |
Computers & Peripherals - 1.8% |
Hewlett-Packard Co. | 240,837 | | 4,392,867 |
Electronic Equipment & Components - 1.1% |
Corning, Inc. | 220,999 | | 2,521,599 |
Common Stocks - continued |
| Shares | | Value |
INFORMATION TECHNOLOGY - continued |
Office Electronics - 1.0% |
Xerox Corp. | 362,875 | | $ 2,514,724 |
Semiconductors & Semiconductor Equipment - 1.6% |
Advanced Micro Devices, Inc. (a) | 913,218 | | 3,707,665 |
Software - 3.4% |
Comverse Technology, Inc. (a) | 1,170,627 | | 6,356,505 |
Microsoft Corp. | 34,158 | | 1,006,636 |
Symantec Corp. (a) | 54,301 | | 855,241 |
| | 8,218,382 |
TOTAL INFORMATION TECHNOLOGY | | 23,412,787 |
MATERIALS - 1.6% |
Metals & Mining - 1.6% |
Newmont Mining Corp. | 85,388 | | 3,797,204 |
TELECOMMUNICATION SERVICES - 2.5% |
Diversified Telecommunication Services - 2.2% |
AT&T, Inc. | 114,662 | | 4,347,983 |
CenturyLink, Inc. | 21,200 | | 880,648 |
| | 5,228,631 |
Wireless Telecommunication Services - 0.3% |
Sprint Nextel Corp. (a) | 173,900 | | 758,204 |
TOTAL TELECOMMUNICATION SERVICES | | 5,986,835 |
UTILITIES - 6.1% |
Electric Utilities - 5.3% |
Duke Energy Corp. | 23,961 | | 1,624,077 |
Edison International | 40,416 | | 1,866,411 |
Exelon Corp. | 67,359 | | 2,635,084 |
FirstEnergy Corp. | 61,057 | | 3,066,283 |
NextEra Energy, Inc. | 47,565 | | 3,372,359 |
| | 12,564,214 |
Multi-Utilities - 0.8% |
Sempra Energy | 27,900 | | 1,964,439 |
TOTAL UTILITIES | | 14,528,653 |
TOTAL COMMON STOCKS (Cost $253,611,540) |
229,975,894
|
U.S. Treasury Obligations - 0.0% |
| Principal Amount | | Value |
U.S. Treasury Bills, yield at date of purchase 0.07% 8/23/12
(Cost $99,996) | | $ 100,000 | | $ 99,997 |
Money Market Funds - 8.5% |
| Shares | | |
Fidelity Cash Central Fund, 0.17% (b) | 9,955,067 | | 9,955,067 |
Fidelity Securities Lending Cash Central Fund, 0.18% (b)(c) | 10,217,787 | | 10,217,787 |
TOTAL MONEY MARKET FUNDS (Cost $20,172,854) |
20,172,854
|
TOTAL INVESTMENT PORTFOLIO - 105.1% (Cost $273,884,390) | | 250,248,745 |
NET OTHER ASSETS (LIABILITIES) - (5.1)% | | (12,116,653) |
NET ASSETS - 100% | $ 238,132,092 |
Legend |
(a) Non-income producing |
(b) Affiliated fund that is available only to investment companies and other accounts managed by Fidelity Investments. The rate quoted is the annualized seven-day yield of the fund at period end. A complete unaudited listing of the fund's holdings as of its most recent quarter end is available upon request. In addition, each Fidelity Central Fund's financial statements, which are not covered by the Fund's Report of Independent Registered Public Accounting Firm, are available on the SEC's website or upon request. |
(c) Investment made with cash collateral received from securities on loan. |
(d) Security or a portion of the security is on loan at period end. |
Affiliated Central Funds |
Information regarding fiscal year to date income earned by the Fund from investments in Fidelity Central Funds is as follows: |
Fund | Income earned |
Fidelity Cash Central Fund | $ 17,310 |
Fidelity Securities Lending Cash Central Fund | 173,140 |
Total | $ 190,450 |
Other Information |
The following is a summary of the inputs used, as of July 31, 2012, involving the Fund's assets and liabilities carried at fair value. The inputs or methodology used for valuing securities may not be an indication of the risk associated with investing in those securities. For more information on valuation inputs, and their aggregation into the levels used in the tables below, please refer to the Security Valuation section in the accompanying Notes to Financial Statements. |
Valuation Inputs at Reporting Date: |
Description | Total | Level 1 | Level 2 | Level 3 |
Investments in Securities: | | | | |
Equities: | | | | |
Consumer Discretionary | $ 18,552,027 | $ 18,552,027 | $ - | $ - |
Consumer Staples | 16,030,808 | 16,030,808 | - | - |
Energy | 37,238,358 | 37,238,358 | - | - |
Financials | 57,873,545 | 51,783,647 | 6,089,898 | - |
Health Care | 36,241,548 | 36,241,548 | - | - |
Industrials | 16,314,129 | 16,314,129 | - | - |
Information Technology | 23,412,787 | 23,412,787 | - | - |
Materials | 3,797,204 | 3,797,204 | - | - |
Telecommunication Services | 5,986,835 | 5,986,835 | - | - |
Utilities | 14,528,653 | 14,528,653 | - | - |
U.S. Government and Government Agency Obligations | 99,997 | - | 99,997 | - |
Money Market Funds | 20,172,854 | 20,172,854 | - | - |
Total Investments in Securities: | $ 250,248,745 | $ 244,058,850 | $ 6,189,895 | $ - |
The following is a summary of transfers between Level 1 and Level 2 for the period ended July 31, 2012. Transfers are assumed to have occurred at the beginning of the period, and are primarily attributable to the valuation techniques used for foreign equity securities, as discussed in the accompanying Notes to Financial Statements: |
Transfers | Total |
Level 1 to Level 2 | $ 4,465,199 |
Level 2 to Level 1 | $ 0 |
See accompanying notes which are an integral part of the financial statements.
Annual Report
Statement of Assets and Liabilities
| July 31, 2012 |
| | |
Assets | | |
Investment in securities, at value (including securities loaned of $10,015,065) - See accompanying schedule: Unaffiliated issuers (cost $253,711,536) | $ 230,075,891 | |
Fidelity Central Funds (cost $20,172,854) | 20,172,854 | |
Total Investments (cost $273,884,390) | | $ 250,248,745 |
Cash | | 826 |
Receivable for investments sold | | 1,367,274 |
Receivable for fund shares sold | | 169,801 |
Dividends receivable | | 166,001 |
Distributions receivable from Fidelity Central Funds | | 5,591 |
Other receivables | | 10,982 |
Total assets | | 251,969,220 |
| | |
Liabilities | | |
Payable for investments purchased | $ 3,104,970 | |
Payable for fund shares redeemed | 345,071 | |
Accrued management fee | 50,782 | |
Other affiliated payables | 66,451 | |
Other payables and accrued expenses | 52,067 | |
Collateral on securities loaned, at value | 10,217,787 | |
Total liabilities | | 13,837,128 |
| | |
Net Assets | | $ 238,132,092 |
Net Assets consist of: | | |
Paid in capital | | $ 428,659,625 |
Undistributed net investment income | | 2,888,150 |
Accumulated undistributed net realized gain (loss) on investments and foreign currency transactions | | (169,780,036) |
Net unrealized appreciation (depreciation) on investments and assets and liabilities in foreign currencies | | (23,635,647) |
Net Assets, for 23,201,318 shares outstanding | | $ 238,132,092 |
Net Asset Value, offering price and redemption price per share ($238,132,092 ÷ 23,201,318 shares) | | $ 10.26 |
See accompanying notes which are an integral part of the financial statements.
Annual Report
Statement of Operations
| Year ended July 31, 2012 |
| | |
Investment Income | | |
Dividends | | $ 8,241,146 |
Interest | | 96 |
Income from Fidelity Central Funds | | 190,450 |
Total income | | 8,431,692 |
| | |
Expenses | | |
Management fee
Basic fee | $ 1,866,714 | |
Performance adjustment | (668,963) | |
Transfer agent fees | 995,759 | |
Accounting and security lending fees | 134,935 | |
Custodian fees and expenses | 162,060 | |
Independent trustees' compensation | 2,291 | |
Registration fees | 24,264 | |
Audit | 54,369 | |
Legal | 2,317 | |
Interest | 245 | |
Miscellaneous | 3,701 | |
Total expenses before reductions | 2,577,692 | |
Expense reductions | (26,195) | 2,551,497 |
Net investment income (loss) | | 5,880,195 |
Realized and Unrealized Gain (Loss) Net realized gain (loss) on: | | |
Investment securities: | | |
Unaffiliated issuers | (30,416,727) | |
Foreign currency transactions | (72,828) | |
Futures contracts | 435,688 | |
Total net realized gain (loss) | | (30,053,867) |
Change in net unrealized appreciation (depreciation) on: Investment securities | 4,530,260 | |
Assets and liabilities in foreign currencies | 1,609 | |
Total change in net unrealized appreciation (depreciation) | | 4,531,869 |
Net gain (loss) | | (25,521,998) |
Net increase (decrease) in net assets resulting from operations | | $ (19,641,803) |
See accompanying notes which are an integral part of the financial statements.
Annual Report
Financial Statements - continued
Statement of Changes in Net Assets
| Year ended
July 31,
2012 | Year ended
July 31,
2011 |
Increase (Decrease) in Net Assets | | |
Operations | | |
Net investment income (loss) | $ 5,880,195 | $ 5,151,642 |
Net realized gain (loss) | (30,053,867) | 39,541,706 |
Change in net unrealized appreciation (depreciation) | 4,531,869 | (11,263,482) |
Net increase (decrease) in net assets resulting
from operations | (19,641,803) | 33,429,866 |
Distributions to shareholders from net investment income | (6,210,896) | (4,255,614) |
Distributions to shareholders from net realized gain | - | (151,971) |
Total distributions | (6,210,896) | (4,407,585) |
Share transactions
Proceeds from sales of shares | 50,616,788 | 201,830,415 |
Reinvestment of distributions | 6,061,422 | 4,272,411 |
Cost of shares redeemed | (225,740,112) | (126,991,551) |
Net increase (decrease) in net assets resulting from share transactions | (169,061,902) | 79,111,275 |
Total increase (decrease) in net assets | (194,914,601) | 108,133,556 |
| | |
Net Assets | | |
Beginning of period | 433,046,693 | 324,913,137 |
End of period (including undistributed net investment income of $2,888,150 and undistributed net investment income of $3,294,783, respectively) | $ 238,132,092 | $ 433,046,693 |
Other Information Shares | | |
Sold | 5,083,409 | 18,133,138 |
Issued in reinvestment of distributions | 639,450 | 426,327 |
Redeemed | (22,414,922) | (11,763,946) |
Net increase (decrease) | (16,692,063) | 6,795,519 |
See accompanying notes which are an integral part of the financial statements.
Annual Report
Financial Highlights
Years ended July 31, | 2012 | 2011 | 2010 | 2009 | 2008 |
Selected Per-Share Data | | | | | |
Net asset value, beginning of period | $ 10.86 | $ 9.82 | $ 8.95 | $ 12.15 | $ 15.46 |
Income from Investment Operations | | | | | |
Net investment income (loss) B | .18 | .14 | .10 | .16 | .21 |
Net realized and unrealized gain (loss) | (.62) | 1.04 | .90 | (3.17) | (2.68) |
Total from investment operations | (.44) | 1.18 | 1.00 | (3.01) | (2.47) |
Distributions from net investment income | (.16) | (.14) | (.13) | (.18) | (.16) |
Distributions from net realized gain | - | (.01) | - | (.01) | (.68) |
Total distributions | (.16) | (.14) F | (.13) | (.19) | (.84) |
Net asset value, end of period | $ 10.26 | $ 10.86 | $ 9.82 | $ 8.95 | $ 12.15 |
Total Return A | (3.95)% | 12.14% | 11.20% | (24.89)% | (16.86)% |
Ratios to Average Net Assets C, E | | | | |
Expenses before reductions | .77% | .75% | .87% | .77% | .92% |
Expenses net of fee waivers, if any | .77% | .75% | .87% | .77% | .92% |
Expenses net of all reductions | .76% | .74% | .86% | .77% | .91% |
Net investment income (loss) | 1.76% | 1.31% | 1.05% | 1.87% | 1.46% |
Supplemental Data | | | | | |
Net assets, end of period (000 omitted) | $ 238,132 | $ 433,047 | $ 324,913 | $ 332,765 | $ 517,730 |
Portfolio turnover rate D | 102% | 141% | 59% | 69% | 61% |
A Total returns would have been lower if certain expenses had not been reduced during the applicable periods shown.
B Calculated based on average shares outstanding during the period.
C Fees and expenses of any underlying Fidelity Central Funds are not included in the Fund's expense ratio. The Fund indirectly bears its proportionate share of the expenses of any underlying Fidelity Central Funds.
D Amount does not include the portfolio activity of any underlying Fidelity Central Funds.
E Expense ratios reflect operating expenses of the Fund. Expenses before reductions do not reflect amounts reimbursed by the investment adviser or reductions from brokerage service arrangements or reductions from other expense offset arrangements and do not represent the amount paid by the Fund during periods when reimbursements or reductions occur. Expenses net of fee waivers reflect expenses after reimbursement by the investment adviser but prior to reductions from brokerage service arrangements or other expense offset arrangements. Expenses net of all reductions represent the net expenses paid by the Fund.
F Total distributions of $.14 per share is comprised of distributions from net investment income of $.135 and distributions from net realized gain of $.005 per share.
See accompanying notes which are an integral part of the financial statements.
Annual Report
Notes to Financial Statements
For the period ended July 31, 2012
1. Organization.
Fidelity Blue Chip Value Fund (the Fund) is a fund of Fidelity Securities Fund (the Trust) and is authorized to issue an unlimited number of shares. The Trust is registered under the Investment Company Act of 1940, as amended (the 1940 Act), as an open-end management investment company organized as a Massachusetts business trust.
2. Investments in Fidelity Central Funds.
The Fund invests in Fidelity Central Funds, which are open-end investment companies available only to other investment companies and accounts managed by Fidelity Management & Research Company (FMR) and its affiliates. The Fund's Schedule of Investments lists each of the Fidelity Central Funds held as of period end, if any, as an investment of the Fund, but does not include the underlying holdings of each Fidelity Central Fund. As an Investing Fund, the Fund indirectly bears its proportionate share of the expenses of the underlying Fidelity Central Funds.
The Money Market Central Funds seek preservation of capital and current income and are managed by Fidelity Investments Money Management, Inc. (FIMM), an affiliate of FMR.
A complete unaudited list of holdings for each Fidelity Central Fund is available upon request or at the Securities and Exchange Commission (the SEC) web site at www.sec.gov. In addition, the financial statements of the Fidelity Central Funds, which are not covered by the Fund's Report of Independent Registered Public Accounting Firm, are available on the SEC web site or upon request.
3. Significant Accounting Policies.
The financial statements have been prepared in conformity with accounting principles generally accepted in the United States of America (GAAP), which require management to make certain estimates and assumptions at the date of the financial statements. Actual results could differ from those estimates. Subsequent events, if any, through the date that the financial statements were issued have been evaluated in the preparation of the financial statements. The following summarizes the significant accounting policies of the Fund:
Security Valuation. Investments are valued as of 4:00 p.m. Eastern time on the last calendar day of the period. In accordance with valuation policies and procedures approved by the Board of Trustees (the Board), the Fund attempts to obtain prices from one or more third party pricing vendor or broker to value its investments. When current market prices, quotations or rates are not readily available or reliable, securities will be fair valued in good faith by the FMR Fair Value Committee (the Committee), in accordance with procedures adopted by the Fund's Board. Factors used in determining fair
Annual Report
Notes to Financial Statements - continued
3. Significant Accounting Policies - continued
Security Valuation - continued
value vary by security type and may include market or security specific events, changes in interest rates and credit quality. The frequency with which these procedures are used cannot be predicted and they may be utilized to a significant extent. The Committee oversees the Fund's valuation policies and procedures and is responsible for approving and reporting to the Board all fair value determinations.
The Fund categorizes the inputs to valuation techniques used to value its investments into a disclosure hierarchy consisting of three levels as shown below:
Level 1 - quoted prices in active markets for identical investments
Level 2 - other significant observable inputs (including quoted prices for similar investments, interest rates, prepayment speeds, etc.)
Level 3 - unobservable inputs (including the Fund's own assumptions based on the best information available)
Valuation techniques used to value the Fund's investments by major category are as follows:
Equity securities, including restricted securities, for which market quotations are readily available, are valued at the last reported sale price or official closing price as reported by a third party pricing vendor on the primary market or exchange on which they are traded and are categorized as Level 1 in the hierarchy. In the event there were no sales during the day or closing prices are not available, securities are valued at the last quoted bid price or may be valued using the last available price and are generally categorized as Level 2 in the hierarchy. For foreign equity securities, when significant market or security specific events arise, comparisons to the valuation of American Depositary Receipts (ADRs), futures contracts, Exchange-Traded Funds (ETFs)and certain indexes as well as quoted prices for similar securities are used and are categorized as Level 2 in the hierarchy. Utilizing these techniques may result in transfers between Level 1 and Level 2.
Debt securities, including restricted securities, are valued based on evaluated prices received from third party pricing vendors or from brokers who make markets in such securities. For U.S. government and government agency obligations, pricing vendors utilize matrix pricing which considers yield or price of bonds of comparable quality, coupon, maturity and type as well as broker-supplied prices and are generally categorized as Level 2 in the hierarchy. When independent prices are unavailable or unreliable, debt securities may be valued utilizing pricing methodologies which consider similar factors that would be used by third party pricing vendors. These are generally categorized as Level 2 in the hierarchy but may be Level 3 depending on the circumstances.
Annual Report
3. Significant Accounting Policies - continued
Security Valuation - continued
Investments in open-end mutual funds, including the Fidelity Central Funds, are valued at their closing net asset value each business day and are categorized as Level 1 in the hierarchy.
Changes in valuation techniques may result in transfers in or out of an assigned level within the disclosure hierarchy. The aggregate value of investments by input level, as of July 31, 2012, including information on transfers between Levels 1 and 2, is included at the end of the Fund's Schedule of Investments.
Foreign Currency Translation. The Fund may use foreign currency contracts to facilitate transactions in foreign-denominated securities. Gains and losses from these transactions may arise from changes in the value of the foreign currency or if the counterparties do not perform under the contracts' terms.
Foreign-denominated assets, including investment securities, and liabilities are translated into U.S. dollars at the exchange rates at period end. Purchases and sales of investment securities, income and dividends received and expenses denominated in foreign currencies are translated into U.S. dollars at the exchange rate in effect on the transaction date.
The effects of exchange rate fluctuations on investments are included with the net realized and unrealized gain (loss) on investment securities. Other foreign currency transactions resulting in realized and unrealized gain (loss) are disclosed separately.
Investment Transactions and Income. For financial reporting purposes, the Fund's investment holdings and NAV include trades executed through the end of the last business day of the period. The NAV per share for processing shareholder transactions is calculated as of the close of business of the New York Stock Exchange (NYSE), normally 4:00 p.m. Eastern time and includes trades executed through the end of the prior business day. Gains and losses on securities sold are determined on the basis of identified cost and may include proceeds received from litigation. Dividend income is recorded on the ex-dividend date, except for certain dividends from foreign securities where the ex-dividend date may have passed, which are recorded as soon as the Fund is informed of the ex-dividend date. Non-cash dividends included in dividend income, if any, are recorded at the fair market value of the securities received. Distributions received on securities that represent a return of capital or capital gain are recorded as a reduction of cost of investments and/or as a realized gain. The Fund estimates the components of distributions received that may be considered return of capital distributions or capital gain distributions. Interest income and distributions from the Fidelity Central Funds are accrued as earned. Interest income includes coupon interest and amortization of
Annual Report
Notes to Financial Statements - continued
3. Significant Accounting Policies - continued
Investment Transactions and Income - continued
premium and accretion of discount on debt securities. Investment income is recorded net of foreign taxes withheld where recovery of such taxes is uncertain.
Expenses. Expenses directly attributable to a fund are charged to that fund. Expenses attributable to more than one fund are allocated among the respective funds on the basis of relative net assets or other appropriate methods. Expense estimates are accrued in the period to which they relate and adjustments are made when actual amounts are known.
Income Tax Information and Distributions to Shareholders. Each year, the Fund intends to qualify as a regulated investment company under Subchapter M of the Internal Revenue Code, including distributing substantially all of its taxable income and realized gains. As a result, no provision for income taxes is required. As of July 31, 2012, the Fund did not have any unrecognized tax benefits in the financial statements; nor is the Fund aware of any tax positions for which it is reasonably possible that the total amounts of unrecognized tax benefits will significantly change in the next twelve months. The Fund files a U.S. federal tax return, in addition to state and local tax returns as required. A fund's federal income tax returns are subject to examination by the Internal Revenue Service (IRS) for a period of three fiscal years after they are filed. State and local tax returns may be subject to examination for an additional fiscal year depending on the jurisdiction. Foreign taxes are provided for based on the Fund's understanding of the tax rules and rates that exist in the foreign markets in which it invests.
Distributions are declared and recorded on the ex-dividend date. Income and capital gain distributions are determined in accordance with income tax regulations, which may differ from GAAP.
Capital accounts within the financial statements are adjusted for permanent book-tax differences. These adjustments have no impact on net assets or the results of operations. Temporary book-tax differences will reverse in a subsequent period.
Book-tax differences are primarily due to futures transactions, foreign currency transactions, partnerships, capital loss carryforwards and losses deferred due to wash sales and excise tax regulations.
The federal tax cost of investment securities and unrealized appreciation (depreciation) as of period end were as follows:
Gross unrealized appreciation | $ 13,009,931 |
Gross unrealized depreciation | (43,231,224) |
Net unrealized appreciation (depreciation) on securities and other investments | $ (30,221,293) |
| |
Tax Cost | $ 280,470,038 |
Annual Report
3. Significant Accounting Policies - continued
Income Tax Information and Distributions to Shareholders - continued
The tax-based components of distributable earnings as of period end were as follows:
Undistributed ordinary income | $ 2,888,150 |
Capital loss carryforward | $ (151,409,344) |
Net unrealized appreciation (depreciation) | $ (30,221,295) |
Capital loss carryforwards are only available to offset future capital gains of the Fund to the extent provided by regulations and may be limited. Under the Regulated Investment Company Modernization Act of 2010 (the Act), the Fund is permitted to carry forward capital losses incurred in taxable years beginning after December 22, 2010 for an unlimited period and such capital losses are required to be used prior to any losses that expire. Capital loss carryforwards were as follows:
Fiscal year of expiration | |
2017 | $ (76,906,749) |
2018 | (55,500,128) |
Total with expiration | (132,406,877) |
No expiration | |
Short-term | (15,176,947) |
Long-term | (3,825,520) |
Total no expiration | (19,002,467) |
Total capital loss carryforward | $ (151,409,344) |
The Fund intends to elect to defer to its fiscal year ending July 31, 2013 approximately $11,785,043 of capital losses recognized during the period November 1, 2011 to July 31, 2012.
The tax character of distributions paid was as follows:
| July 31, 2012 | July 31, 2011 |
Ordinary Income | $ 6,210,896 | $ 4,407,585 |
New Accounting Pronouncement. In December 2011, the Financial Accounting Standards Board issued Accounting Standard Update No. 2011-11, Disclosures about Offsetting Assets and Liabilities. The update creates new disclosure requirements requiring entities to disclose both gross and net information for derivatives and other financial instruments that are either offset in the Statement of Assets and Liabilities or subject to an enforceable master netting arrangement or similar agreement. The disclosure requirements are effective for interim and annual reporting periods beginning on or after January 1, 2013. Management is currently evaluating the impact of the update's adoption on the Fund's financial statement disclosures.
Annual Report
Notes to Financial Statements - continued
4. Derivative Instruments.
Risk Exposures and the Use of Derivative Instruments. The Fund's investment objectives allow the Fund to enter into various types of derivative contracts, including futures contracts. Derivatives are investments whose value is derived from underlying assets, indices or reference rates and may be transacted on an exchange or over-the-counter (OTC). Derivatives may involve a future commitment to buy or sell a specified instrument based on specified terms, or to exchange future cash flows at periodic intervals based on a notional principal amount. The Fund used derivatives to increase returns and to manage exposure to certain risks as defined below. The success of any strategy involving derivatives depends on analysis of numerous economic factors, and if the strategies for investment do not work as intended, the Fund may not achieve its objectives.
The Fund's use of derivatives increased or decreased its exposure to the following risk:
Equity Risk | Equity risk relates to the fluctuations in the value of financial instruments as a result of changes in market prices (other than those arising from interest rate risk or foreign exchange risk), whether caused by factors specific to an individual investment, its issuer, or all factors affecting all instruments traded in a market or market segment. |
The Fund is also exposed to additional risks from investing in derivatives, such as liquidity risk and counterparty credit risk. Liquidity risk is the risk that the Fund will be unable to close out the derivative in the open market in a timely manner. Counterparty credit risk is the risk that the counterparty will not be able to fulfill its obligation to the Fund. Counterparty credit risk related to exchange-traded futures contracts is minimal because of the protection provided by the exchange on which they trade. Investing in derivatives may involve greater risks than investing in the underlying assets directly and, to varying degrees, involves risk of loss in excess of the initial investment, if any, collateral received and amounts recognized in the Statement of Assets and Liabilities. In addition, for futures contracts, there is the risk that the change in value of the derivative contract may not correspond to the change in value of the underlying instrument.
Futures Contracts. A futures contract is an agreement between two parties to buy or sell a specified underlying instrument for a fixed price at a specified future date. The Fund used futures contracts to manage its exposure to the stock market.
Upon entering into a futures contract, a fund is required to deposit either cash or securities (initial margin) with a clearing broker in an amount equal to a certain percentage of the face value of the contract. Futures contracts are marked-to-market daily and subsequent payments (variation margin) are made or received by a fund depending on the daily fluctuations in the value of the futures contracts and are recorded as unrealized appreciation or (depreciation). This receivable and/or payable is included in daily
Annual Report
4. Derivative Instruments - continued
Futures Contracts - continued
variation margin on futures contracts in the Statement of Assets and Liabilities. Realized gain or (loss) is recorded upon the expiration or closing of a futures contract.
Any open futures contracts at period end are shown in the Schedule of Investments under the caption "Futures Contracts." The underlying face amount at value reflects each contract's exposure to the underlying instrument at period end.
During the period the Fund recognized net realized gain (loss) of $435,688 related to its investment in futures contracts. This amount is included in the Statement of Operations.
5. Purchases and Sales of Investments.
Purchases and sales of securities, other than short-term securities, aggregated $329,105,711 and $497,954,038, respectively.
6. Fees and Other Transactions with Affiliates.
Management Fee. FMR and its affiliates provide the Fund with investment management related services for which the Fund pays a monthly management fee. The management fee is the sum of an individual fund fee rate that is based on an annual rate of .30% of the Fund's average net assets and an annualized group fee rate that averaged .26% during the period. The group fee rate is based upon the average net assets of all the mutual funds advised by FMR. The group fee rate decreases as assets under management increase and increases as assets under management decrease. In addition, the management fee is subject to a performance adjustment (up to a maximum of ± .20% of the Fund's average net assets over a 36 month performance period). The upward or downward adjustment to the management fee is based on the Fund's relative investment performance as compared to an appropriate benchmark index. For the period, the total annual management fee rate, including the performance adjustment, was .36% of the Fund's average net assets.
Transfer Agent Fees. Fidelity Investments Institutional Operations Company, Inc. (FIIOC), an affiliate of FMR, is the Fund's transfer, dividend disbursing and shareholder servicing agent. FIIOC receives account fees and asset-based fees that vary according to account size and type of account. FIIOC pays for typesetting, printing and mailing of shareholder reports, except proxy statements. For the period, the transfer agent fees were equivalent to an annual rate of .30% of average net assets.
Annual Report
Notes to Financial Statements - continued
6. Fees and Other Transactions with Affiliates - continued
Accounting and Security Lending Fees. Fidelity Service Company, Inc. (FSC), an affiliate of FMR, maintains the Fund's accounting records. The accounting fee is based on the level of average net assets for each month. Under a separate contract, FSC administers the security lending program. The security lending fee is based on the number and duration of lending transactions.
Brokerage Commissions. The Fund placed a portion of its portfolio transactions with brokerage firms which are affiliates of the investment adviser. The commissions paid to these affiliated firms were $24,889 for the period.
Interfund Lending Program. Pursuant to an Exemptive Order issued by the SEC, the Fund, along with other registered investment companies having management contracts with FMR, may participate in an interfund lending program. This program provides an alternative credit facility allowing the funds to borrow from, or lend money to, other participating affiliated funds. At period end, there were no interfund loans outstanding. The Fund's activity in this program during the period for which loans were outstanding was as follows:
Borrower or Lender | Average Loan
Balance | Weighted Average
Interest Rate | Interest
Expense |
Borrower | $ 7,009,000 | .32% | $ 245 |
7. Committed Line of Credit.
The Fund participates with other funds managed by FMR or an affiliate in a $4.25 billion credit facility (the "line of credit") to be utilized for temporary or emergency purposes to fund shareholder redemptions or for other short-term liquidity purposes. The Fund has agreed to pay commitment fees on its pro-rata portion of the line of credit, which amounted to $1,003 and is reflected in Miscellaneous expenses on the Statement of Operations. During the period, there were no borrowings on this line of credit.
8. Security Lending.
The Fund lends portfolio securities through a lending agent from time to time in order to earn additional income. For equity securities, a lending agent is used and may loan securities to certain qualified borrowers, including Fidelity Capital Markets (FCM), a broker-dealer affiliated with the Fund. On the settlement date of the loan, the Fund receives collateral (in the form of U.S. Treasury obligations, letters of credit and/or cash) against the loaned securities and maintains collateral in an amount not less than 100% of the market value of the loaned securities during the period of the loan. The market value of the loaned securities is determined at the close of business of the Fund and any
Annual Report
8. Security Lending - continued
additional required collateral is delivered to the Fund on the next business day. If the borrower defaults on its obligation to return the securities loaned because of insolvency or other reasons, a fund could experience delays and costs in recovering the securities loaned or in gaining access to the collateral. Any cash collateral received is invested in the Fidelity Securities Lending Cash Central Fund. The value of loaned securities and cash collateral at period end are disclosed on the Fund's Statement of Assets and Liabilities. The value of securities loaned to FCM at period end was $694,980. Security lending income represents the income earned on investing cash collateral, less rebates paid to borrowers and any lending agent fees associated with the loan, plus any premium payments received for lending certain types of securities. Security lending income is presented in the Statement of Operations as a component of income from Fidelity Central Funds. Total security lending income during the period amounted to $173,140, including $598 from securities loaned to FCM.
9. Expense Reductions.
Many of the brokers with whom FMR places trades on behalf of the Fund provided services to the Fund in addition to trade execution. These services included payments of certain expenses on behalf of the Fund totaling $26,195 for the period.
10. Other.
The Fund's organizational documents provide former and current trustees and officers with a limited indemnification against liabilities arising in connection with the performance of their duties to the Fund. In the normal course of business, the Fund may also enter into contracts that provide general indemnifications. The Fund's maximum exposure under these arrangements is unknown as this would be dependent on future claims that may be made against the Fund. The risk of material loss from such claims is considered remote.
Annual Report
To the Trustees of Fidelity Securities Fund and the Shareholders of Fidelity Blue Chip Value Fund:
In our opinion, the accompanying statement of assets and liabilities, including the schedule of investments, and the related statements of operations and of changes in net assets and the financial highlights present fairly, in all material respects, the financial position of Fidelity Blue Chip Value Fund (a fund of Fidelity Securities Fund) at July 31, 2012, the results of its operations for the year then ended, the changes in its net assets for each of the two years in the period then ended and the financial highlights for each of the five years in the period then ended, in conformity with accounting principles generally accepted in the United States of America. These financial statements and financial highlights (hereafter referred to as "financial statements") are the responsibility of the Fidelity Blue Chip Value Fund's management. Our responsibility is to express an opinion on these financial statements based on our audits. We conducted our audits of these financial statements in accordance with the standards of the Public Company Accounting Oversight Board (United States). Those standards require that we plan and perform the audit to obtain reasonable assurance about whether the financial statements are free of material misstatement. An audit includes examining, on a test basis, evidence supporting the amounts and disclosures in the financial statements, assessing the accounting principles used and significant estimates made by management, and evaluating the overall financial statement presentation. We believe that our audits, which included confirmation of securities at July 31, 2012 by correspondence with the custodian and brokers, provide a reasonable basis for our opinion.
PricewaterhouseCoopers LLP
Boston, Massachusetts
September 10, 2012
Annual Report
The Trustees, Members of the Advisory Board, and executive officers of the trust and fund, as applicable, are listed below. The Board of Trustees governs the fund and is responsible for protecting the interests of shareholders. The Trustees are experienced executives who meet periodically throughout the year to oversee the fund's activities, review contractual arrangements with companies that provide services to the fund, oversee management of the risks associated with such activities and contractual arrangements, and review the fund's performance. Except for James C. Curvey, each of the Trustees oversees 228 funds advised by FMR or an affiliate. Mr. Curvey oversees 435 funds advised by FMR or an affiliate.
The Trustees hold office without limit in time except that (a) any Trustee may resign; (b) any Trustee may be removed by written instrument, signed by at least two-thirds of the number of Trustees prior to such removal; (c) any Trustee who requests to be retired or who has become incapacitated by illness or injury may be retired by written instrument signed by a majority of the other Trustees; and (d) any Trustee may be removed at any special meeting of shareholders by a two-thirds vote of the outstanding voting securities of the trust. Each Trustee who is not an interested person (as defined in the 1940 Act) (Independent Trustee), shall retire not later than the last day of the calendar year in which his or her 75th birthday occurs. The Independent Trustees may waive this mandatory retirement age policy with respect to individual Trustees. The executive officers and Advisory Board Members hold office without limit in time, except that any officer and Advisory Board Member may resign or may be removed by a vote of a majority of the Trustees at any regular meeting or any special meeting of the Trustees. Except as indicated, each individual has held the office shown or other offices in the same company for the past five years.
Experience, Skills, Attributes, and Qualifications of the Fund's Trustees. The Governance and Nominating Committee has adopted a statement of policy that describes the experience, qualifications, attributes, and skills that are necessary and desirable for potential Independent Trustee candidates (Statement of Policy). The Board believes that each Trustee satisfied at the time he or she was initially elected or appointed a Trustee, and continues to satisfy, the standards contemplated by the Statement of Policy. The Governance and Nominating Committee also engages professional search firms to help identify potential Independent Trustee candidates who have the experience, qualifications, attributes, and skills consistent with the Statement of Policy. From time to time, additional criteria based on the composition and skills of the current Independent Trustees, as well as experience or skills that may be appropriate in light of future changes to board composition, business conditions, and regulatory or other developments, have also been considered by the professional search firms and the Governance and Nominating Committee. In addition, the Board takes into account the Trustees' commitment and participation in Board and committee meetings, as well as their leadership of standing and ad hoc committees throughout their tenure.
In determining that a particular Trustee was and continues to be qualified to serve as a Trustee, the Board has considered a variety of criteria, none of which, in isolation, was controlling. The Board believes that, collectively, the Trustees have balanced and diverse experience, qualifications, attributes, and skills, which allow the Board to operate effectively in governing the fund and protecting the interests of shareholders. Information about the specific experience, skills, attributes, and qualifications of each Trustee, which in each case led to the Board's conclusion that the Trustee should serve (or continue to serve) as a trustee of the fund, is provided below.
Annual Report
Board Structure and Oversight Function. James C. Curvey is an interested person (as defined in the 1940 Act) and currently serves as Chairman. The Trustees have determined that an interested Chairman is appropriate and benefits shareholders because an interested Chairman has a personal and professional stake in the quality and continuity of services provided to the fund. Independent Trustees exercise their informed business judgment to appoint an individual of their choosing to serve as Chairman, regardless of whether the Trustee happens to be independent or a member of management. The Independent Trustees have determined that they can act independently and effectively without having an Independent Trustee serve as Chairman and that a key structural component for assuring that they are in a position to do so is for the Independent Trustees to constitute a substantial majority for the Board. The Independent Trustees also regularly meet in executive session. Ned C. Lautenbach serves as Chairman of the Independent Trustees and as such (i) acts as a liaison between the Independent Trustees and management with respect to matters important to the Independent Trustees and (ii) with management prepares agendas for Board meetings.
Fidelity funds are overseen by different Boards of Trustees. The fund's Board oversees Fidelity's equity and high income funds and another Board oversees Fidelity's investment-grade bond, money market, and asset allocation funds. The asset allocation funds may invest in Fidelity funds overseen by the fund's Board. The use of separate Boards, each with its own committee structure, allows the Trustees of each group of Fidelity funds to focus on the unique issues of the funds they oversee, including common research, investment, and operational issues. On occasion, the separate Boards establish joint committees to address issues of overlapping consequences for the Fidelity funds overseen by each Board.
The Trustees operate using a system of committees to facilitate the timely and efficient consideration of all matters of importance to the Trustees, the fund, and fund shareholders and to facilitate compliance with legal and regulatory requirements and oversight of the fund's activities and associated risks. The Board, acting through its committees, has charged FMR and its affiliates with (i) identifying events or circumstances the occurrence of which could have demonstrably adverse effects on the fund's business and/or reputation; (ii) implementing processes and controls to lessen the possibility that such events or circumstances occur or to mitigate the effects of such events or circumstances if they do occur; and (iii) creating and maintaining a system designed to evaluate continuously business and market conditions in order to facilitate the identification and implementation processes described in (i) and (ii) above. Because the day-to-day operations and activities of the fund are carried out by or through FMR, its affiliates and other service providers, the fund's exposure to risks is mitigated but not eliminated by the processes overseen by the Trustees. While each of the Board's committees has responsibility for overseeing different aspects of the fund's activities, oversight is exercised primarily through the Operations, Audit, and Compliance Committees. In addition, the Independent Trustees have worked with FMR to enhance the Board's oversight of investment and financial risks, legal and regulatory risks, technology risks, and operational risks, including the development of additional risk reporting to the Board. For example, a working group comprised of Independent Trustees and FMR has worked and continues to work to review the Fidelity funds' valuation-related activities, reporting and risk management. Appropriate personnel, including but not limited to the fund's Chief Compliance Officer (CCO), FMR's internal auditor, the independent accountants, the fund's Treasurer and portfolio management personnel, make periodic reports to the Board's committees, as appropriate, including an annual review of FMR's risk management program for the Fidelity funds. The responsibilities of each standing committee, including their oversight responsibilities, are described further under "Standing Committees of the Fund's Trustees."
Annual Report
Trustees and Officers - continued
The fund's Statement of Additional Information (SAI) includes more information about the Trustees. To request a free copy, call Fidelity at 1-800-544-8544.
Interested Trustees*:
Correspondence intended for each Trustee who is an interested person may be sent to Fidelity Investments, 82 Devonshire Street, Boston, Massachusetts 02109.
Name, Age; Principal Occupations and Other Relevant Experience+ |
James C. Curvey (77) |
| Year of Election or Appointment: 2007 Mr. Curvey is Trustee and Chairman of the Board of Trustees of certain Trusts. Mr. Curvey also serves as Trustee (2007-present) of other investment companies advised by FMR. Mr. Curvey is a Director of Fidelity Investments Money Management, Inc. (2009-present), Director of Fidelity Research & Analysis Co. (2009-present) and Director of FMR and FMR Co., Inc. (2007-present). Mr. Curvey is also Vice Chairman (2007-present) and Director of FMR LLC. In addition, Mr. Curvey serves as an Overseer for the Boston Symphony Orchestra and a member of the Trustees of Villanova University. Previously, Mr. Curvey was the Vice Chairman (2006-2007) and Director (2000-2007) of FMR Corp. |
Ronald P. O'Hanley (55) |
| Year of Election or Appointment: 2011 Mr. O'Hanley is Director of FMR Co., Inc. (2010-present), Director of Fidelity Investments Money Management, Inc. (2010-present), Director of Fidelity Research & Analysis Company (2010-present), President of Fidelity Asset Management and Corporate Services and a member of Fidelity's Executive Committee (2010-present). Previously, Mr. O'Hanley served as President and Chief Executive Officer of BNY Mellon Asset Management (2007-2010). Mr. O'Hanley also served as Vice Chairman of Bank New York Mellon Corp. and a member of that firm's Executive Committee. Prior to the 2007 merger of The Bank of New York and Mellon Financial Corporation, he was Vice Chairman of Mellon Financial Corporation and President and Chief Executive Officer of Mellon Asset Management. He joined Mellon in February 1997. Mr. O'Hanley currently serves as Chairman of the Boston Public Library Foundation Board of Directors and sits on the Board of Directors of Beth Israel Deaconess Medical Center, the Board of Trustees of the Marine Biological Laboratory and the Advisory Board of the Maxwell School of Citizenship and Public Administration at Syracuse University. Mr. O'Hanley also chairs the Council on Asset Management for the Financial Services Roundtable and is a member of the Board of Directors of Institutional Investor's U.S. Institute. |
* Trustees have been determined to be "Interested Trustees" by virtue of, among other things, their affiliation with the trust or various entities under common control with FMR.
+ The information above includes each Trustee's principal occupation during the last five years and other information relating to the experience, attributes, and skills relevant to each Trustee's qualifications to serve as a Trustee, which led to the conclusion that each Trustee should serve as a Trustee for the fund.
Annual Report
Trustees and Officers - continued
Independent Trustees:
Correspondence intended for each Independent Trustee (that is, the Trustees other than the Interested Trustees) may be sent to Fidelity Investments, P.O. Box 55235, Boston, Massachusetts 02205-5235.
Name, Age; Principal Occupations and Other Relevant Experience+ |
Dennis J. Dirks (64) |
| Year of Election or Appointment: 2005 Prior to his retirement in May 2003, Mr. Dirks was Chief Operating Officer and a member of the Board of The Depository Trust & Clearing Corporation (DTCC). He also served as President, Chief Operating Officer, and Board member of The Depository Trust Company (DTC) and President and Board member of the National Securities Clearing Corporation (NSCC). In addition, Mr. Dirks served as Chief Executive Officer and Board member of the Government Securities Clearing Corporation, Chief Executive Officer and Board member of the Mortgage-Backed Securities Clearing Corporation, as a Trustee and a member of the Finance Committee of Manhattan College (2005-2008), and as a Trustee and a member of the Finance Committee of AHRC of Nassau County (2006-2008). Mr. Dirks is a member of the Independent Directors Council (IDC) Governing Council (2010-present) and Board of Directors for The Brookville Center for Children's Services, Inc. (2009-present). |
Alan J. Lacy (58) |
| Year of Election or Appointment: 2008 Mr. Lacy serves as Senior Adviser (2007-present) of Oak Hill Capital Partners, L.P. (private equity). Mr. Lacy also served as Chief Executive Officer (2000-2005) and Vice Chairman (2005-2006) of Sears Holdings Corporation and Sears, Roebuck and Co. (retail). In addition, Mr. Lacy serves as a member of the Board of Directors of Dave & Buster's Entertainment, Inc. (restaurant and entertainment complexes, 2010-present), Earth Fare, Inc. (retail grocery, 2012-present), The Hillman Companies, Inc. (hardware wholesalers, 2010-present), and Bristol-Myers Squibb Company (global pharmaceuticals, 2007-present). Mr. Lacy is a member of the Board of Trustees of The National Parks Conservation Association (2006-present). Previously, Mr. Lacy served as Chairman of the Board of Trustees of the National Parks Conservation Association (2008-2011) and as a member of the Board of Directors for the Western Union Company (global money transfer, 2006-2011). |
Ned C. Lautenbach (68) |
| Year of Election or Appointment: 2000 Mr. Lautenbach is Chairman of the Independent Trustees of the Equity and High Income Funds (2006-present). Mr. Lautenbach currently serves as the Lead Director of the Eaton Corporation Board of Directors (diversified industrial, 1997-present). Mr. Lautenbach is Chairman of the Board of Directors of the Philharmonic Center for the Arts in Naples, Florida (2012-present) and a member of the Council on Foreign Relations (1994-present). Previously, Mr. Lautenbach was a Partner/Advisory Partner at Clayton, Dubilier & Rice, LLC (private equity investment, 1998-2010), as well as a Director of Sony Corporation (2006-2007). |
Joseph Mauriello (67) |
| Year of Election or Appointment: 2008 Prior to his retirement in January 2006, Mr. Mauriello served in numerous senior management positions including Deputy Chairman and Chief Operating Officer (2004-2005), and Vice Chairman of Financial Services (2002-2004) of KPMG LLP US (professional services, 1965-2005). Mr. Mauriello currently serves as a member of the Board of Directors of XL Group plc. (global insurance and re-insurance, 2006-present). Previously, Mr. Mauriello served as a Director of the Hamilton Funds of the Bank of New York (2006-2007) and of Arcadia Resources Inc. (health care services and products, 2007-2012). |
Robert W. Selander (61) |
| Year of Election or Appointment: 2011 Previously, Mr. Selander served as a Member of the Advisory Board of Fidelity's Equity and High Income Funds (2011), Executive Vice Chairman (2010), Chief Executive Officer (2009-2010), and President and Chief Executive Officer (1997-2009) of Mastercard, Inc. |
Cornelia M. Small (68) |
| Year of Election or Appointment: 2005 Ms. Small is a member of the Board of Directors of the Teagle Foundation (2009-present). Ms. Small is also a member of the Investment Committee, and Chair (2008-present) and a member of the Board of Trustees of Smith College. In addition, Ms. Small serves on the Investment Committee of the Berkshire Taconic Community Foundation (2008-present). Previously, Ms. Small served as Chairperson of the Investment Committee (2002-2008) of Smith College. In addition, Ms. Small served as Chief Investment Officer, Director of Global Equity Investments, and a member of the Board of Directors of Scudder, Stevens & Clark and Scudder Kemper Investments. |
William S. Stavropoulos (73) |
| Year of Election or Appointment: 2002 Mr. Stavropoulos is Vice Chairman of the Independent Trustees of the Equity and High Income Funds (2006-present). Mr. Stavropoulos serves as President and Founder of the Michigan Baseball Foundation, the Great Lakes Loons (2007-present). Mr. Stavropoulos is Chairman Emeritus of the Board of Directors of The Dow Chemical Company, where he previously served in numerous senior management positions, including President, CEO (1995-2000; 2002-2004), Chairman of the Executive Committee (2000-2006), and as a member of the Board of Directors (1990-2006). Currently, Mr. Stavropoulos is Chairman of Univar (global distributor of commodity and specialty chemicals, 2010-present), a Director of Teradata Corporation (data warehousing and technology solutions, 2008-present), Chemical Financial Corporation, Maersk Inc. (industrial conglomerate), Tyco International, Inc. (multinational manufacturing and services, 2007-present), and a member of the Advisory Board for Metalmark Capital (private equity investment, 2005-present). Mr. Stavropoulos is a special advisor to Clayton, Dubilier & Rice, LLC (private equity investment). In addition, Mr. Stavropoulos is a member of the University of Notre Dame Advisory Council for the College of Science. |
David M. Thomas (63) |
| Year of Election or Appointment: 2008 Previously, Mr. Thomas served as Executive Chairman (2005-2006) and Chairman and Chief Executive Officer (2000-2005) of IMS Health, Inc. (pharmaceutical and healthcare information solutions). In addition, Mr. Thomas serves as a member of the Board of Directors of Fortune Brands, Inc. (consumer products), and Interpublic Group of Companies, Inc. (marketing communication, 2004-present). |
Michael E. Wiley (61) |
| Year of Election or Appointment: 2008 Mr. Wiley also serves as a Director of Asia Pacific Exploration Consolidated (international oil and gas exploration and production, 2008-present). Mr. Wiley serves as a Director of Tesoro Corporation (independent oil refiner and marketer, 2005-present), and a Director of Bill Barrett Corporation (exploration and production, 2005-present). In addition, Mr. Wiley also serves as a Director of Post Oak Bank (privately-held bank, 2004-present). Previously, Mr. Wiley served as a member of the Board of Trustees of the University of Tulsa (2000-2006; 2007-2010), as a Senior Energy Advisor of Katzenbach Partners, LLC (consulting, 2006-2007), as an Advisory Director of Riverstone Holdings (private investment), Chairman, President, and CEO of Baker Hughes, Inc. (oilfield services, 2000-2004), and as Director of Spinnaker Exploration Company (exploration and production, 2001-2005). |
Annual Report
+ The information above includes each Trustee's principal occupation during the last five years and other information relating to the experience, attributes, and skills relevant to each Trustee's qualifications to serve as a Trustee, which led to the conclusion that each Trustee should serve as a Trustee for the fund.
Advisory Board Members and Executive Officers:
Correspondence intended for David A. Rosow and Garnett A. Smith may be sent to Fidelity Investments, P.O. Box 55235, Boston, Massachusetts 02205-5235. Correspondence intended for each executive officer, Edward C. Johnson 3d, and Peter S. Lynch may be sent to Fidelity Investments, 82 Devonshire Street, Boston, Massachusetts 02109.
Name, Age; Principal Occupation |
Edward C. Johnson 3d (82) |
| Year of Election or Appointment: 2011 Member of the Advisory Board of Fidelity's Equity and High Income Funds. Mr. Johnson serves as Chief Executive Officer, Chairman, and a Director of FMR LLC, and also serves as Chairman and Director of FIL Limited. Previously, Mr. Johnson served as a Trustee and Chairman of the Board of certain Fidelity Trusts, Chairman and a Director of FMR, Chairman and a Director of FMR Co., Inc., and President of FMR LLC (2006-2007). |
Peter S. Lynch (68) |
| Year of Election or Appointment: 2003 Member of the Advisory Board of Fidelity's Equity and High Income Funds. Mr. Lynch is Vice Chairman and a Director of FMR and FMR Co., Inc. In addition, Mr. Lynch serves as a Trustee of Boston College and as the Chairman of the Inner-City Scholarship Fund. Previously, Mr. Lynch served on the Special Olympics International Board of Directors (1997-2006). |
David A. Rosow (69) |
| Year of Election or Appointment: 2012 Member of the Advisory Board of Fidelity's Equity and High Income Funds. Chairman and Chief Executive Officer of International Golf Group, Inc. (golf course development, 1990-present). Previously, Mr. Rosow served as Chairman and Chief Executive Officer of Rosow & Company, Inc. (private investment company, 1989-2011), a Lead Director of Hudson United Bancorp (2001-2006) and as a Director of TD Banknorth (1996-2006). In addition, Mr. Rosow is a member (2008-present) and President (2009-present) of the Town Council of Palm Beach, Florida. |
Garnett A. Smith (64) |
| Year of Election or Appointment: 2012 Member of the Advisory Board of Fidelity's Equity and High Income Funds. Prior to Mr. Smith's retirement, he served as Chairman and Chief Executive Officer of Inbrand Corp. (manufacturer of personal absorbent products, 1990-1997). He also served as President (1986-1990) of Inbrand Corp. Prior to his employment with Inbrand Corp., he was employed by a retail fabric chain and North Carolina National Bank. In addition, Mr. Smith is a board member of the Jackson Hole Land Trust (2009-present). |
Kenneth B. Robins (42) |
| Year of Election or Appointment: 2008 President and Treasurer of Fidelity's Equity and High Income Funds. Mr. Robins also serves as President and Treasurer (2010-present) and Assistant Treasurer (2009-present) of other Fidelity funds and is an employee of Fidelity Investments (2004-present). Previously, Mr. Robins served as Deputy Treasurer of the Fidelity funds (2005-2008) and Treasurer and Chief Financial Officer of The North Carolina Capital Management Trust: Cash and Term Portfolios (2006-2008). |
Bruce T. Herring (46) |
| Year of Election or Appointment: 2006 Vice President of certain Equity Funds. Mr. Herring also serves as President of Fidelity Research & Analysis Company (2010-present), Chief Investment Officer and Director of Fidelity Management & Research (U.K.) Inc. (2010-present) and Group Chief Investment Officer of FMR. Previously, Mr. Herring served as Vice President (2005-2006) and Senior Vice President (2006-2007) of Fidelity Management & Research Company, Vice President of FMR Co., Inc. (2001-2007) and as a portfolio manager for Fidelity U.S. Equity Funds. |
Brian B. Hogan (47) |
| Year of Election or Appointment: 2009 Vice President of Equity and High Income Funds. Mr. Hogan also serves as President of FMR's Equity Division (2009-present). Previously, Mr. Hogan served as Senior Vice President, Equity Research of FMR (2006-2009) and as a portfolio manager. |
Scott C. Goebel (44) |
| Year of Election or Appointment: 2008 Secretary and Chief Legal Officer (CLO) of the Fidelity funds. Mr. Goebel also serves as Secretary of Fidelity Investments Money Management, Inc. (FIMM) (2010-present) and Fidelity Research and Analysis Company (FRAC) (2010-present); Secretary and CLO of The North Carolina Capital Management Trust: Cash and Term Portfolios (2008-present); General Counsel, Secretary, and Senior Vice President of FMR (2008-present) and FMR Co., Inc. (2008-present); employed by FMR LLC or an affiliate (2001-present); Chief Legal Officer of Fidelity Management & Research (Hong Kong) Limited (2008-present) and Assistant Secretary of Fidelity Management & Research (Japan) Inc. (2008-present), and Fidelity Management & Research (U.K.) Inc. (2008-present). Previously, Mr. Goebel served as Assistant Secretary of FIMM (2008-2010), FRAC (2008-2010), and the Funds (2007-2008) and as Vice President and Secretary of Fidelity Distributors Corporation (FDC) (2005-2007). |
William C. Coffey (43) |
| Year of Election or Appointment: 2009 Assistant Secretary of Fidelity's Equity and High Income Funds. Mr. Coffey also serves as Senior Vice President and Deputy General Counsel of FMR LLC (2010-present), and is an employee of Fidelity Investments. Previously, Mr. Coffey served as Vice President and Associate General Counsel of FMR LLC (2005-2009). |
Elizabeth Paige Baumann (44) |
| Year of Election or Appointment: 2012 Anti-Money Laundering (AML) Officer of the Fidelity funds. Ms. Baumann also serves as AML Officer of The North Carolina Capital Management Trust: Cash and Term Portfolios (2012-present), Chief AML Officer of FMR LLC (2012-present), and is an employee of Fidelity Investments. Previously, Ms. Baumann served as Vice President and Deputy Anti-Money Laundering Officer (2007-2012). |
Christine Reynolds (53) |
| Year of Election or Appointment: 2008 Chief Financial Officer of the Fidelity funds. Ms. Reynolds became President of Fidelity Pricing and Cash Management Services (FPCMS) in August 2008. Ms. Reynolds served as Chief Operating Officer of FPCMS (2007-2008). Previously, Ms. Reynolds served as President, Treasurer, and Anti-Money Laundering officer of the Fidelity funds (2004-2007). |
Joseph A. Hanlon (44) |
| Year of Election or Appointment: 2012 Chief Compliance Officer of Fidelity's Equity and High Income Funds. Mr. Hanlon serves as Compliance Officer of FMR, FMR Co., Inc., Fidelity Investments Money Management, Inc. (FIMM), Fidelity Research and Analysis Company (FRAC), Fidelity Management & Research (Japan) Inc., Fidelity Management & Research (U.K.) Inc., Fidelity Management & Research (Hong Kong), and Strategic Advisers, Inc. (2009-present), as Senior Vice President of the Fidelity Asset Management Division (2009-present), and is an employee of Fidelity Investments. |
Joseph F. Zambello (55) |
| Year of Election or Appointment: 2011 Deputy Treasurer of the Fidelity funds. Mr. Zambello is an employee of Fidelity Investments. Previously, Mr. Zambello served as Vice President of FMR's Program Management Group (2009-2011) and Vice President of the Transfer Agent Oversight Group (2005-2009). |
Adrien E. Deberghes (44) |
| Year of Election or Appointment: 2008 Deputy Treasurer of Fidelity's Equity and High Income Funds. Mr. Deberghes also serves as Vice President (2011-present) and Assistant Treasurer (2010-present) of other Fidelity funds, and is an employee of Fidelity Investments (2008-present). Previously, Mr. Deberghes served as Senior Vice President of Mutual Fund Administration at State Street Corporation (2007-2008), Senior Director of Mutual Fund Administration at Investors Bank & Trust (2005-2007), and Director of Finance for Dunkin' Brands (2000-2005). |
Stephanie J. Dorsey (43) |
| Year of Election or Appointment: 2010 Assistant Treasurer of Fidelity's Equity and High Income Funds. Ms. Dorsey also serves as Deputy Treasurer of other Fidelity funds (2008-present) and is an employee of Fidelity Investments (2008-present). Previously, Ms. Dorsey served as Treasurer (2004-2008) of the JPMorgan Mutual Funds and Vice President (2004-2008) of JPMorgan Chase Bank. |
John R. Hebble (54) |
| Year of Election or Appointment: 2009 Assistant Treasurer of Fidelity's Equity and High Income Funds. Mr. Hebble also serves as President (2011-present), Treasurer, and Chief Financial Officer of The North Carolina Capital Management Trust: Cash and Term Portfolios (2008-present), President and Treasurer of other Fidelity funds (2008-present) and is an employee of Fidelity Investments. |
Gary W. Ryan (54) |
| Year of Election or Appointment: 2005 Assistant Treasurer of the Fidelity funds. Mr. Ryan is an employee of Fidelity Investments. Previously, Mr. Ryan served as Vice President of Fund Reporting in Fidelity Pricing and Cash Management Services (FPCMS) (1999-2005). |
Jonathan Davis (44) |
| Year of Election or Appointment: 2010 Assistant Treasurer of the Fidelity funds. Mr. Davis is also Assistant Treasurer of Fidelity Rutland Square Trust II and Fidelity Commonwealth Trust II. Mr. Davis is an employee of Fidelity Investments. Previously, Mr. Davis served as Vice President and Associate General Counsel of FMR LLC (2003-2010). |
Annual Report
The fund designates 100% of the dividends distributed during the fiscal year as qualifying for the dividends-received deduction for corporate shareholders.
The fund designates 100% of the dividends distributed during the fiscal year as amounts which may be taken into account as a dividend for the purposes of the maximum rate under section 1(h)(11) of the Internal Revenue Code.
The fund will notify shareholders in January 2013 of amounts for use in preparing 2012 income tax returns.
Annual Report
Board Approval of Investment Advisory Contracts and Management Fees
Fidelity Blue Chip Value Fund
Each year, the Board of Trustees, including the Independent Trustees (together, the Board), votes on the renewal of the management contract and sub-advisory agreements (together, the Advisory Contracts) for the fund. The Board, assisted by the advice of fund counsel and Independent Trustees' counsel, requests and considers a broad range of information relevant to the renewal of the Advisory Contracts throughout the year.
The Board meets regularly and, at each of its meetings, considers factors that are relevant to its annual consideration of the renewal of the fund's Advisory Contracts, including the services and support provided to the fund and its shareholders. The Board has established various standing committees, each composed of and chaired by Independent Trustees with varying backgrounds, to which the Board has assigned specific subject matter responsibilities in order to enhance effective decision-making by the Board. The Board, acting directly and through its Committees, requests and receives information concerning the annual consideration of the renewal of the fund's Advisory Contracts. The Board also meets as needed to consider matters specifically related to the Board's annual consideration of the renewal of Advisory Contracts. Members of the Board may also meet with trustees of other Fidelity funds through ad hoc joint committees to discuss certain matters relevant to the Fidelity funds.
At its July 2012 meeting, the Board of Trustees, including the Independent Trustees, unanimously determined to renew the fund's Advisory Contracts. In reaching its determination, the Board considered all factors it believed relevant, including (i) the nature, extent, and quality of the services to be provided to the fund and its shareholders (including the investment performance of the fund); (ii) the competitiveness of the fund's management fee and total expense ratio relative to peer funds; (iii) the total costs of the services to be provided by and the profits to be realized by Fidelity from its relationship with the fund; (iv) the extent to which economies of scale exist and would be realized as the fund grows; and (v) whether fee levels reflect these economies of scale, if any, for the benefit of fund shareholders.
In considering whether to renew the Advisory Contracts for the fund, the Board reached a determination, with the assistance of fund counsel and Independent Trustees' counsel and through the exercise of its business judgment, that the renewal of the Advisory Contracts is in the best interests of the fund and its shareholders and that the compensation payable under the Advisory Contracts is fair and reasonable. The Board's decision to renew the Advisory Contracts was not based on any single factor, but rather was based on a comprehensive consideration of all the information provided to the Board at its meetings throughout the year. The Board, in reaching its determination to renew the Advisory Contracts, is aware that shareholders in the fund have a broad range of investment choices available to them, including a wide choice among mutual funds offered by Fidelity's competitors, and that the fund's shareholders, who have the opportunity to review and weigh the disclosure provided by the fund in its prospectus and other public disclosures, have chosen to invest in this fund, managed by Fidelity.
Annual Report
Board Approval of Investment Advisory Contracts and
Management Fees - continued
Nature, Extent, and Quality of Services Provided. The Board considered the staffing within the investment adviser, FMR, and the sub-advisers (together, the Investment Advisers), including the backgrounds of the fund's investment personnel, and also considered the fund's investment objective, strategies, and related investment philosophy. The Independent Trustees also had discussions with senior management of Fidelity's investment operations and investment groups. The Board considered the structure of the portfolio manager compensation program and whether this structure provides appropriate incentives to act in the best interests of the fund.
Resources Dedicated to Investment Management and Support Services. The Board and the Fund Oversight and Research Committees reviewed the general qualifications and capabilities of the Investment Advisers' investment staff, including its size, education, experience, and resources, as well as the Investment Advisers' approach to recruiting, training, managing, and compensating investment personnel. The Board also noted that FMR has continued to increase the resources devoted to non-U.S. offices, including expansion of Fidelity's global investment organization. The Board noted that Fidelity's analysts have extensive resources, tools and capabilities that allow them to conduct sophisticated quantitative and fundamental analysis, as well as credit analysis of issuers, counterparties and guarantors. The Board also believes that Fidelity's investment professionals have sufficient access to global information and data so as to provide competitive investment results over time, and that those professionals also have access to sophisticated tools that permit them to assess portfolio construction and risk and performance attribution characteristics continuously, as well as to transmit new information and research conclusions rapidly around the world. Additionally, in its deliberations, the Board considered the Investment Advisers' trading and risk management capabilities and resources, which are an integral part of the investment management process.
Shareholder and Administrative Services. The Board considered (i) the nature, extent, quality, and cost of advisory, administrative, and shareholder services performed by the Investment Advisers and their affiliates under the Advisory Contracts and under separate agreements covering transfer agency, pricing and bookkeeping, and securities lending services for the fund; (ii) the nature and extent of the supervision of third party service providers, principally custodians and subcustodians; and (iii) the resources devoted to, and the record of compliance with, the fund's compliance policies and procedures. The Board also reviewed the allocation of fund brokerage, including allocations to brokers affiliated with the Investment Advisers, the use of brokerage commissions to pay fund expenses, and the use of "soft" commission dollars to pay for research services.
Annual Report
The Board noted that the growth of fund assets over time across the complex allows Fidelity to reinvest in the development of services designed to enhance the value or convenience of the Fidelity funds as investment vehicles. These services include 24-hour access to account information and market information through telephone representatives and over the Internet, investor education materials and asset allocation tools, and the expanded availability of Fidelity Investor Centers.
Investment in a Large Fund Family. The Board considered the benefits to shareholders of investing in a Fidelity fund, including the benefits of investing in a fund that is part of a large family of funds offering a variety of investment disciplines and providing a large variety of mutual fund investor services. The Board noted that Fidelity had taken, or had made recommendations that resulted in the Fidelity funds taking, a number of actions over the previous year that benefited particular funds, including (i) continuing to dedicate additional resources to investment research and support of the senior management team that oversees asset management; (ii) persisting in efforts to enhance Fidelity's research capabilities, in particular, international research; (iii) launching new funds and making other enhancements to meet client needs for global and income-oriented solutions; (iv) continuing to launch dedicated lower cost underlying funds to meet investment management's portfolio construction needs related to expanding underlying fund options, specifically for the Freedom Fund product lines; (v) adopting a "Stock Selector" sector neutral investment approach and employing a team of portfolio managers who are sector specialists to manage certain funds; (vi) rationalizing product lines and gaining increased efficiencies through the mergers of several funds into other funds; (vii) strengthening the Spartan Index Fund product line by adding new funds and/or new low-cost institutional share classes, restructuring fund expenses to accommodate new classes, and reducing investment minimums for certain classes of shares; (viii) modifying the eligibility criteria for Institutional Class shares to increase their appeal to government entities and charitable investors; and (ix) reducing certain transfer agent fee rates.
Investment Performance. The Board considered whether the fund has operated in accordance with its investment objective, as well as its record of compliance with its investment restrictions. It also reviewed the fund's absolute investment performance, as well as the fund's relative investment performance measured over multiple periods against (i) a broad-based securities market index, and (ii) a peer group of mutual funds deemed appropriate by Fidelity and reviewed by the Board. The following charts considered by the Board show, over the one-, three-, and five-year periods ended December 31, 2011, the fund's cumulative total returns, the cumulative total returns of a broad-based securities market index ("benchmark"), and a range of cumulative total returns of a peer group of mutual funds identified by Morningstar, Inc. as having an investment style similar to that of the fund based on underlying portfolio holdings. The box within each chart shows the 25th percentile return (top of box) and the 75th percentile return (bottom of box) of the peer group. Returns shown above the box are in the first quartile and returns shown below the box are in the fourth quartile. The percentage beaten number noted below each chart corresponds to the percentile box and represents the percentage of funds in the peer group whose performance was equal to or lower than that of the fund.
Annual Report
Board Approval of Investment Advisory Contracts and
Management Fees - continued
Fidelity Blue Chip Value Fund
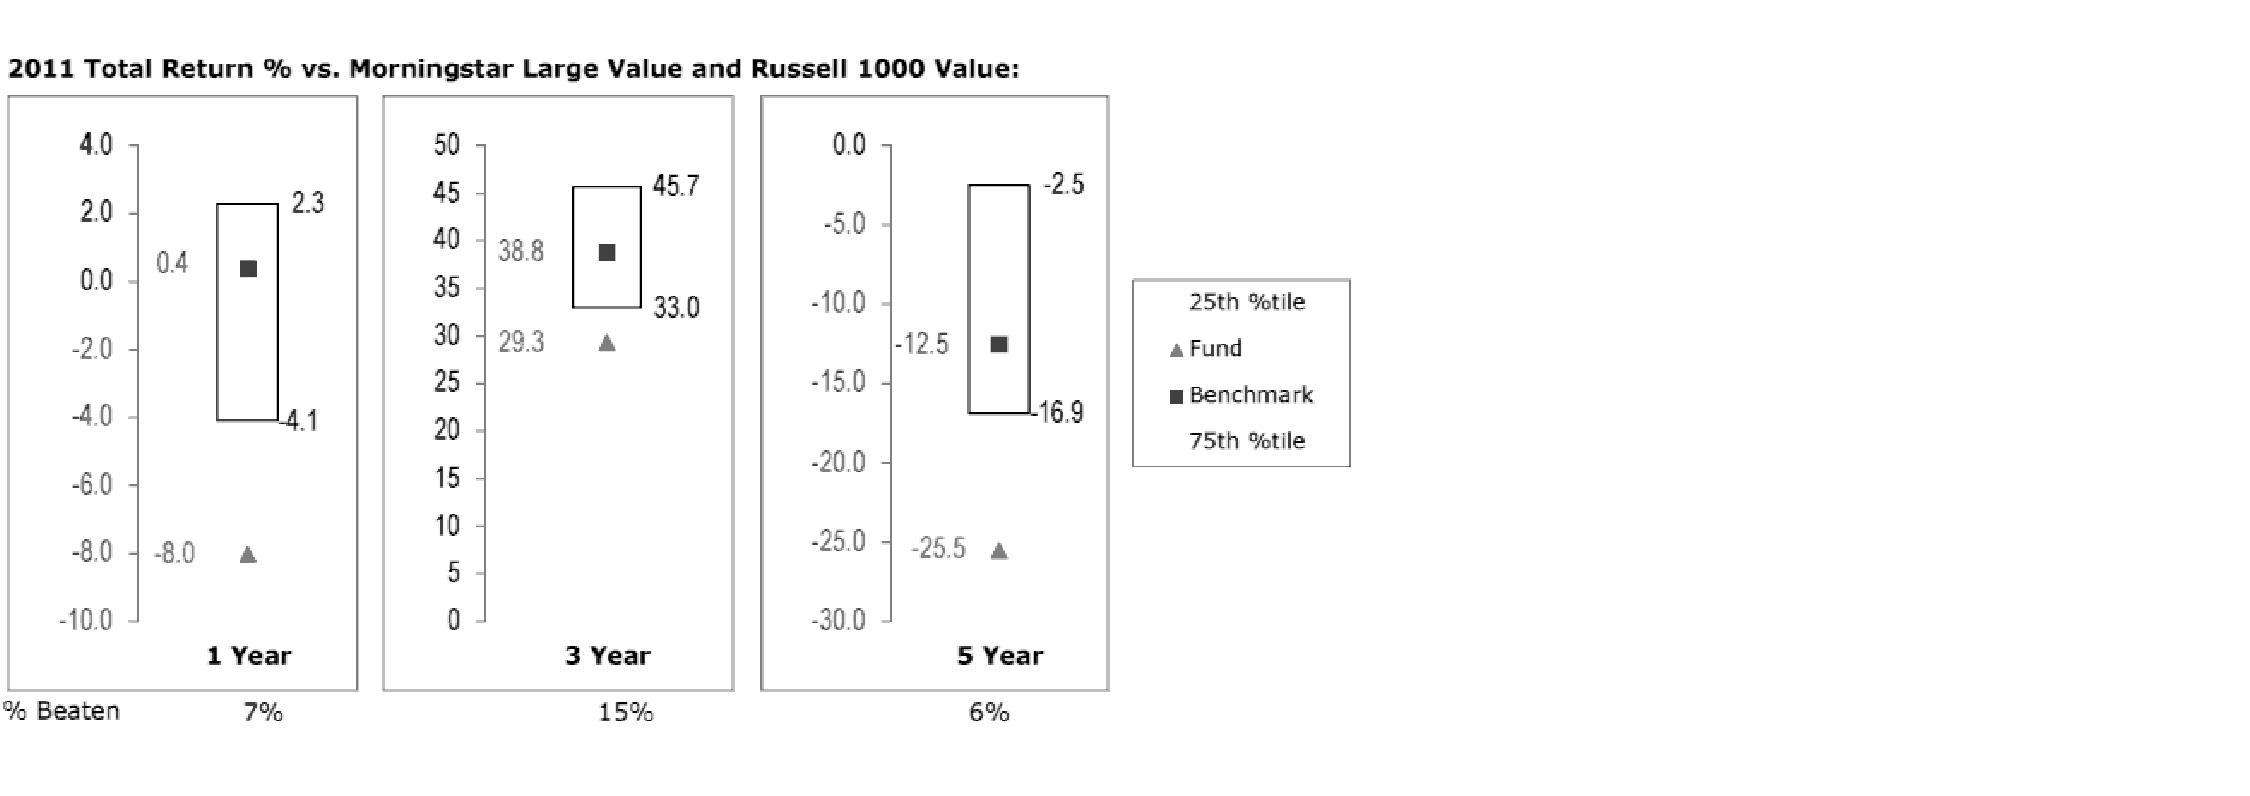
The Board reviewed the fund's relative investment performance against its peer group and noted that the performance of the fund was in the fourth quartile for all the periods shown. The Board also noted that the investment performance of the fund was lower than its benchmark for all the periods shown. The Board discussed with FMR actions to improve the fund's disappointing performance relative to its peer group and benchmark. The Board noted that this fund had underperformed in the past and discussed with FMR its disappointment with the continued underperformance of the fund. The Board also reviewed the fund's performance since inception as well as performance in the current year. The Board will continue to closely monitor the performance of the fund in the coming year and discuss with FMR other appropriate actions to address the performance of the fund.
The Board also considered that the fund's management fee is subject to upward or downward adjustment depending upon whether, and to what extent, the fund's investment performance for the performance period exceeds, or is exceeded by, the record (over the same period) of a Board-approved performance adjustment index. The Board noted that the performance adjustment provides FMR with a strong economic incentive to seek to achieve superior performance for the fund's shareholders and helps to more closely align the interests of FMR and the fund's shareholders.
Annual Report
Based on its review, the Board concluded that the nature, extent, and quality of services provided to the fund under the Advisory Contracts should benefit the fund's shareholders.
Competitiveness of Management Fee and Total Expense Ratio. The Board considered the fund's management fee and total expense ratio compared to "mapped groups" of competitive funds and classes. Fidelity creates "mapped groups" by combining similar Lipper investment objective categories that have comparable management fee characteristics. Combining Lipper investment objective categories aids the Board's management fee and total expense ratio comparisons by broadening the competitive group used for comparison and by reducing the number of universes to which various Fidelity funds are compared.
Management Fee. The Board considered two proprietary management fee comparisons for the 12-month periods shown in the chart below. The group of Lipper funds used by the Board for management fee comparisons is referred to below as the "Total Mapped Group." The Total Mapped Group comparison focuses on a fund's standing relative to the total universe of comparable funds available to investors in terms of gross management fees before expense reimbursements or caps, and without giving effect to the fund's performance adjustment. "TMG %" represents the percentage of funds in the Total Mapped Group that had management fees that were lower than the fund's. For example, a TMG % of 10% means that 90% of the funds in the Total Mapped Group had higher management fees than the fund. The "Asset-Size Peer Group" (ASPG) comparison focuses on a fund's standing relative to non-Fidelity funds similar in size to the fund within the Total Mapped Group. The ASPG represents at least 15% of the funds in the Total Mapped Group with comparable asset size and management fee characteristics, subject to a minimum of 50 funds (or all funds in the Total Mapped Group if fewer than 50). Additional information, such as the ASPG quartile in which the fund's management fee ranked and the impact of the fund's performance adjustment, is also included in the chart and considered by the Board.
Annual Report
Board Approval of Investment Advisory Contracts and
Management Fees - continued
Fidelity Blue Chip Value Fund
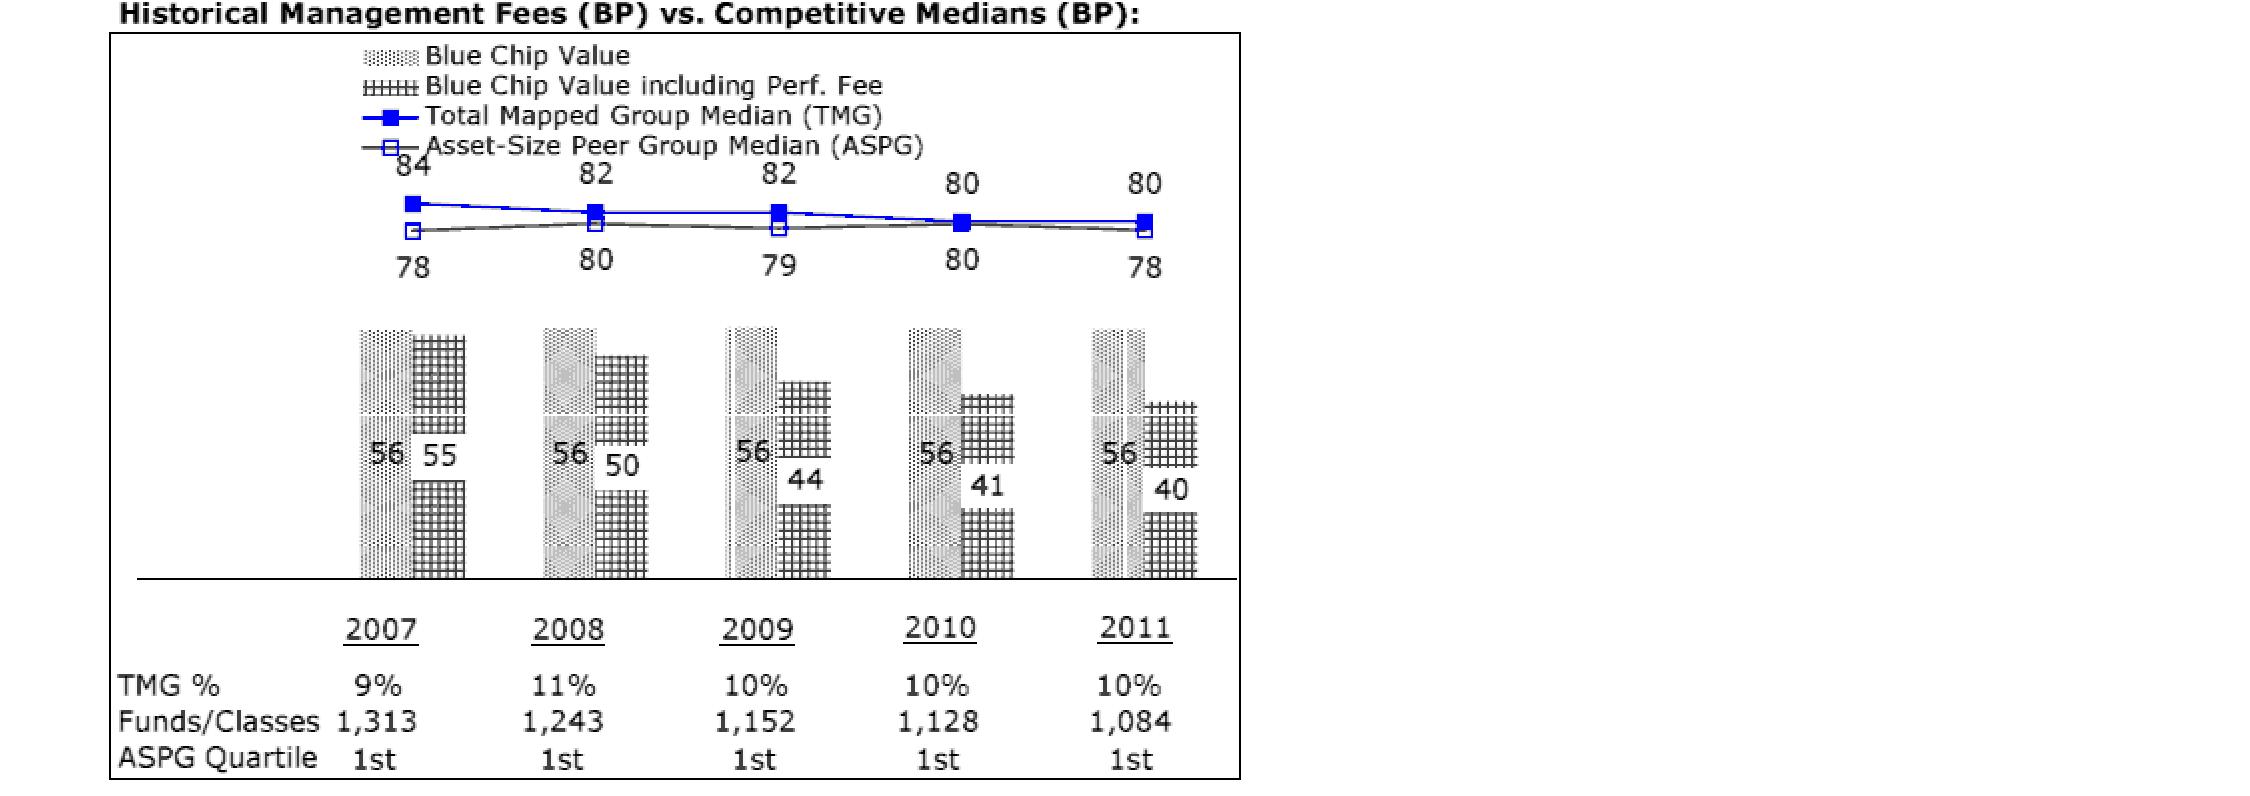
The Board noted that the fund's management fee ranked below the median of its Total Mapped Group and below the median of its ASPG for 2011. The Board also noted the effect of the fund's negative performance adjustment on the fund's management fee ranking. The Board noted that the performance adjustment for each year represents calculations for performance periods that differ from the periods shown in the performance charts above.
Based on its review, the Board concluded that the fund's management fee is fair and reasonable in light of the services that the fund receives and the other factors considered.
Total Expense Ratio. In its review of the fund's total expense ratio, the Board considered the fund's management fee as well as other fund expenses, such as transfer agent fees, pricing and bookkeeping fees, and custodial, legal, and audit fees. The Board also noted the effects of any waivers and reimbursements on fees and expenses, as well as the impact of the fund's performance adjustment. As part of its review, the Board also considered the current and historical total expense ratios of the fund compared to competitive fund median expenses. The fund is compared to those funds and classes in the Total Mapped Group (used by the Board for management fee comparisons) that have a similar sales load structure.
The Board noted that the fund's total expense ratio ranked below its competitive median for 2011.
Annual Report
Fees Charged to Other Fidelity Clients. The Board also considered Fidelity fee structures and other information with respect to clients of FMR and its affiliates, such as other mutual funds advised or subadvised by FMR or its affiliates, pension plan clients, and other institutional clients. The Board noted the findings of the 2010 ad hoc joint committee (created with the board of other Fidelity funds), which reviewed and compared Fidelity's institutional investment advisory business with its business of providing services to the Fidelity funds, including the differences in services provided, fees charged, and costs incurred, as well as competition in their respective marketplaces.
Based on its review of total expense ratios and fees charged to other Fidelity clients, the Board concluded that the fund's total expense ratio was reasonable in light of the services that the fund and its shareholders receive and the other factors considered.
Costs of the Services and Profitability. The Board considered the revenues earned and the expenses incurred by Fidelity in conducting the business of developing, marketing, distributing, managing, administering and servicing the fund and its shareholders. The Board also considered the level of Fidelity's profits in respect of all the Fidelity funds.
On an annual basis, FMR presents to the Board Fidelity's profitability for the fund. Fidelity calculates the profitability for each fund, as well as aggregate profitability for groups of Fidelity funds and all Fidelity funds, using a series of detailed revenue and cost allocation methodologies which originate with the books and records of Fidelity on which Fidelity's audited financial statements are based. The Audit Committee of the Board reviews any significant changes from the prior year's methodologies.
PricewaterhouseCoopers LLP (PwC), independent registered public accounting firm and auditor to Fidelity and certain Fidelity funds, has been engaged annually by the Board as part of the Board's assessment of Fidelity's profitability analysis. PwC's engagement includes the review and assessment of Fidelity's methodologies used in determining the revenues and expenses attributable to Fidelity's mutual fund business, and completion of agreed-upon procedures surrounding the mathematical accuracy of fund profitability and its conformity to allocation methodologies. After considering PwC's reports issued under the engagement and information provided by Fidelity, the Board concluded that while other allocation methods may also be reasonable, Fidelity's profitability methodologies are reasonable in all material respects.
The Board also reviewed Fidelity's non-fund businesses and fall-out benefits related to the mutual fund business as well as cases where Fidelity's affiliates may benefit from or be related to the fund's business.
The Board considered the costs of the services provided by and the profits realized by Fidelity in connection with the operation of the fund and was satisfied that the profitability was not excessive in the circumstances.
Annual Report
Board Approval of Investment Advisory Contracts and
Management Fees - continued
Economies of Scale. The Board considered whether there have been economies of scale in respect of the management of the Fidelity funds, whether the Fidelity funds (including the fund) have appropriately benefited from any such economies of scale, and whether there is potential for realization of any further economies of scale. The Board considered the extent to which the fund will benefit from economies of scale through increased services to the fund, through waivers or reimbursements, or through fee or expense reductions. The Board also noted that in 2009, it and the board of other Fidelity funds created an ad hoc committee (the Economies of Scale Committee) to analyze whether FMR attains economies of scale in respect of the management and servicing of the Fidelity funds, whether the Fidelity funds have appropriately benefited from such economies of scale, and whether there is potential for realization of any further economies of scale.
The Board recognized that the fund's management contract incorporates a "group fee" structure, which provides for lower group fee rates as total fund assets under FMR's management increase, and for higher group fee rates as total fund assets under FMR's management decrease. FMR calculates the group fee rates based on a tiered asset "breakpoint" schedule that varies based on asset class. The Board considered that the group fee is designed to deliver the benefits of economies of scale to fund shareholders when total Fidelity fund assets increase, even if assets of any particular fund are unchanged or have declined, because some portion of Fidelity's costs are attributable to services provided to all Fidelity funds, and all funds benefit if those costs can be allocated among more assets. The Board concluded that, given the group fee structure, fund shareholders will benefit from lower management fees as assets under FMR's management increase at the fund complex level, regardless of whether Fidelity achieves any such economies of scale.
The Board concluded, taking into account the analysis of the Economies of Scale Committee, that economies of scale, if any, are being appropriately shared between fund shareholders and Fidelity.
Additional Information Requested by the Board. In order to develop fully the factual basis for consideration of the Fidelity funds' Advisory Contracts, the Board requested and received additional information on certain topics, including (i) fund performance trends, actions to be taken by FMR to improve certain funds' overall performance, and Fidelity's long-term strategies for certain funds; (ii) the potential to further rationalize the Fidelity fund lineup with the possibility of achieving savings for the funds and Fidelity; (iii) Fidelity's compensation structure for portfolio managers and other key investment personnel; (iv) the amount of the investment that each portfolio manager has made in the Fidelity fund(s) that he or she manages; (v) the realization of fall-out benefits in certain Fidelity business units; (vi) Fidelity's group fee structures, the potential impact of regulatory changes on such structures, and the rationale for the individual fee rates of certain funds; (vii) fund profitability methodology, including Fidelity's cost allocation methodology, and the impact of certain factors on fund profitability results; (viii) trends regarding industry use of performance fee structures and the possibility of implementing performance fee structures for additional funds; and (ix) the impact of net redemptions from the Fidelity funds.
Annual Report
Based on its evaluation of all of the conclusions noted above, and after considering all factors it believed relevant, the Board ultimately concluded that the advisory fee structures are fair and reasonable, and that the fund's Advisory Contracts should be renewed.
Annual Report
Investment Adviser
Fidelity Management & Research Company
Boston, MA
Investment Sub-Advisers
FMR Co., Inc.
Fidelity Management & Research
(U.K.) Inc.
Fidelity Management & Research
(Japan) Inc.
Fidelity Management & Research
(Hong Kong) Limited
General Distributor
Fidelity Distributors Corporation
Smithfield, RI
Transfer and Service Agents
Fidelity Investments Institutional
Operations Company, Inc.
Boston, MA
Fidelity Service Company, Inc.
Boston, MA
Custodian
Brown Brothers Harriman & Co.
Boston, MA
The Fidelity Telephone Connection
Mutual Fund 24-Hour Service
Exchanges/Redemptions
and Account Assistance 1-800-544-6666
Product Information 1-800-544-6666
Retirement Accounts 1-800-544-4774
(8 a.m. - 9 p.m.)
TDD Service 1-800-544-0118
for the deaf and hearing impaired
(9 a.m. - 9 p.m. Eastern time)
Fidelity Automated Service
Telephone (FAST®)
1-800-544-5555
Automated line for quickest service
(Fidelity Investment logo)(registered trademark)
Corporate Headquarters
82 Devonshire St., Boston, MA 02109
www.fidelity.com
BCV-UANN-0912
1.789709.109
Fidelity®
Growth & Income
Portfolio -
Class K
Annual Report
July 31, 2012
(Fidelity Cover Art)
Contents
Performance | (Click Here) | How the fund has done over time. |
Management's Discussion of Fund Performance | (Click Here) | The Portfolio Manager's review of fund performance and strategy. |
Shareholder Expense Example | (Click Here) | An example of shareholder expenses. |
Investment Changes | (Click Here) | A summary of major shifts in the fund's investments over the past six months. |
Investments | (Click Here) | A complete list of the fund's investments with their market values. |
Financial Statements | (Click Here) | Statements of assets and liabilities, operations, and changes in net assets, as well as financial highlights. |
Notes | (Click Here) | Notes to the financial statements. |
Report of Independent Registered Public Accounting Firm | (Click Here) | |
Trustees and Officers | (Click Here) | |
Distributions | (Click Here) | |
Board Approval of Investment Advisory Contracts and Management Fees | (Click Here) | |
To view a fund's proxy voting guidelines and proxy voting record for the 12-month period ended June 30, visit http://www.fidelity.com/proxyvotingresults or visit the Securities and Exchange Commission's (SEC) web site at http://www.sec.gov. You may also call 1-800-835-5092 to request a free copy of the proxy voting guidelines.
Standard & Poor's, S&P and S&P 500 are registered service marks of The McGraw-Hill Companies, Inc. and have been licensed for use by Fidelity Distributors Corporation.
Other third party marks appearing herein are the property of their respective owners.
All other marks appearing herein are registered or unregistered trademarks or service marks of FMR LLC or an affiliated company. © 2012 FMR LLC. All rights reserved.
Annual Report
This report and the financial statements contained herein are submitted for the general information of the shareholders of the fund. This report is not authorized for distribution to prospective investors in the fund unless preceded or accompanied by an effective prospectus.
A fund files its complete schedule of portfolio holdings with the SEC for the first and third quarters of each fiscal year on Form N-Q. Forms N-Q are available on the SEC's web site at http://www.sec.gov. A fund's Forms N-Q may be reviewed and copied at the SEC's Public Reference Room in Washington, DC. Information regarding the operation of the SEC's Public Reference Room may be obtained by calling 1-800-SEC-0330. For a complete list of a fund's portfolio holdings, view the most recent holdings listing, semiannual report, or annual report on Fidelity's web site at http://www.fidelity.com, http://www.advisor.fidelity.com, or http://www.401k.com, as applicable.
NOT FDIC INSURED • MAY LOSE VALUE • NO BANK GUARANTEE
Neither the fund nor Fidelity Distributors Corporation is a bank.
Annual Report
Average annual total return reflects the change in the value of an investment, assuming reinvestment of the class' distributions from dividend income and capital gains (the profits earned upon the sale of securities that have grown in value, if any) and assuming a constant rate of performance each year. The $10,000 table and the fund's returns do not reflect the deduction of taxes that a shareholder would pay on fund distributions or the redemption of fund shares. During periods of reimbursement by Fidelity, a fund's total return will be greater than it would be had the reimbursement not occurred. How a fund did yesterday is no guarantee of how it will do tomorrow.
Average Annual Total Returns
Periods ended July 31, 2012 | Past 1
year | Past 5
years | Past 10
years |
Class K A | 10.66% | -5.05% | 1.32% |
A The initial offering of Class K shares took place on May 9, 2008. Returns prior to May 9, 2008, are those of Fidelity® Growth & Income Portfolio,
the original class of the fund.
$10,000 Over 10 Years
Let's say hypothetically that $10,000 was invested in Fidelity® Growth & Income Portfolio - Class K on July 31, 2002. The chart shows how the value of your investment would have changed, and also shows how the S&P 500® Index performed over the same period. The initial offering of Class K took place on May 9, 2008. See above for additional information regarding the performance of Class K.
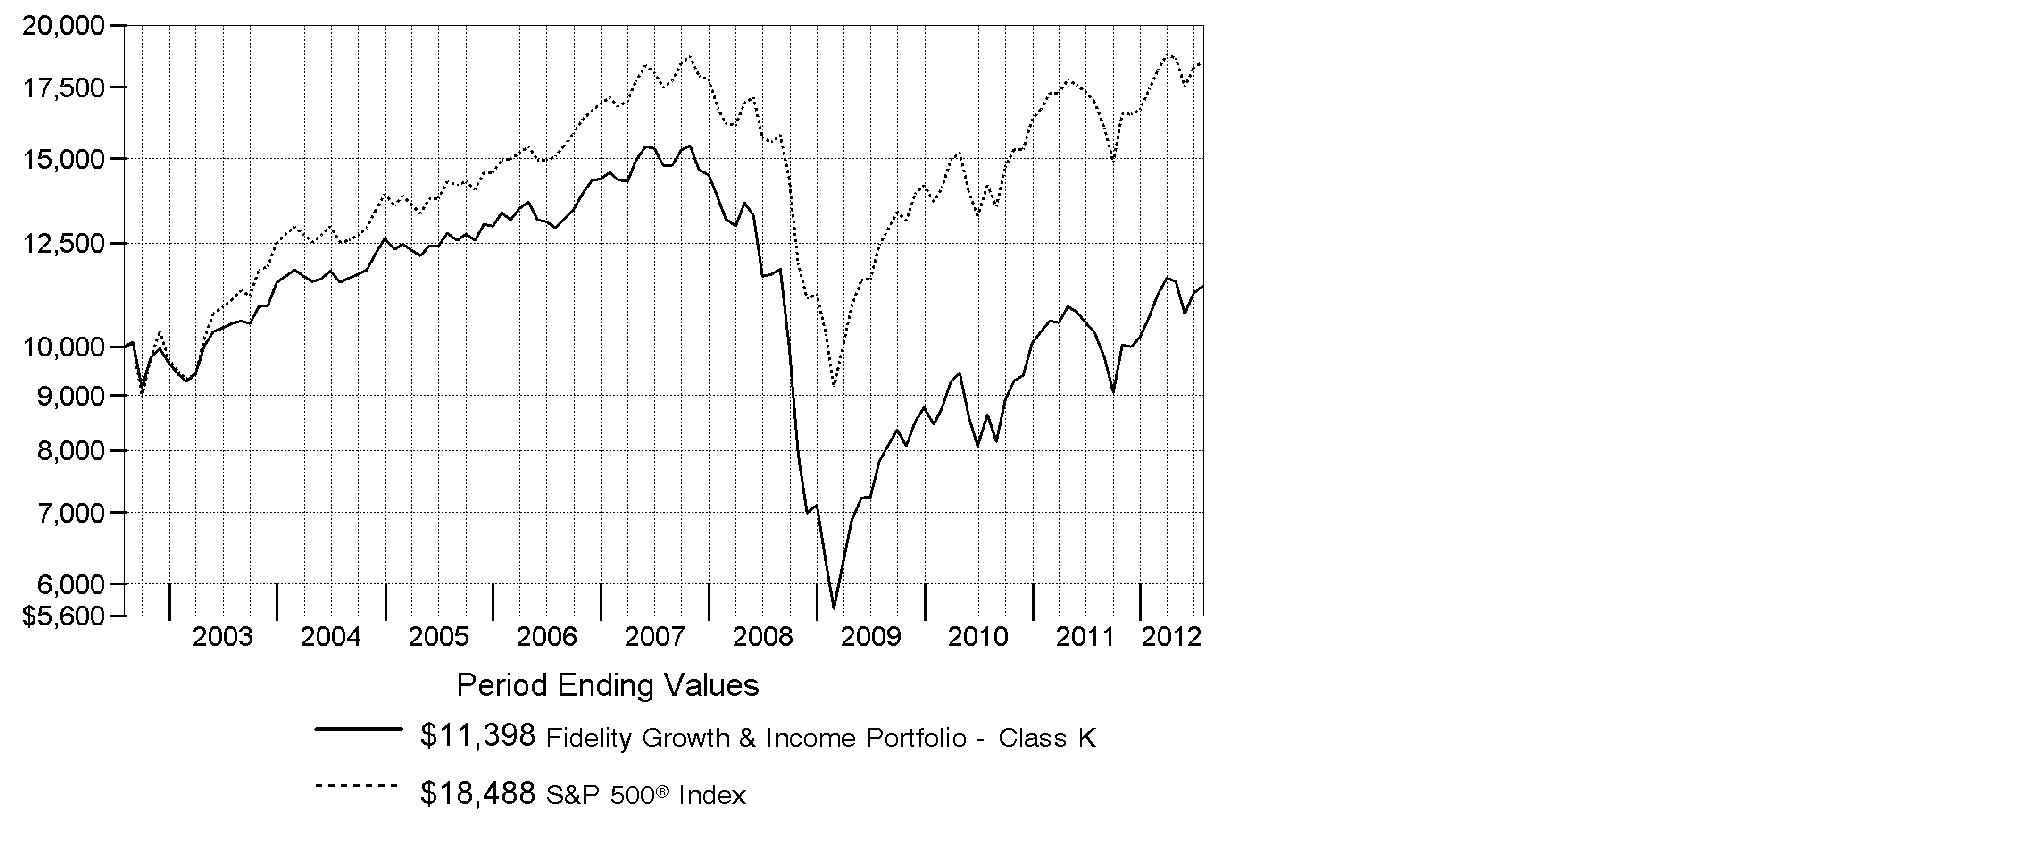
Annual Report
Market Recap: Major U.S. equity benchmarks posted solid gains for the year ending July 31, 2012, amid an uncertain investment environment. The broad-based S&P 500® Index returned 9.13%, while the blue-chip-laden Dow Jones Industrial AverageSM and technology-heavy Nasdaq Composite® Index gained 10.12% and 7.83%, respectively. Volatility spiked during the period's first half, as equities plummeted late last summer on Europe's debt woes, political wrangling over the U.S. debt ceiling and the sovereign credit-rating downgrade that followed. By October, a seemingly improved U.S. economy rejuvenated stocks, paving the way for major equity benchmarks to post their best first-quarter performance since 1998. However, more eurozone trouble, signs that the U.S. economy had turned sluggish and a slowdown in China caused stocks to slip in May, before a new wave of optimism took hold in June and July. Within the S&P 500®, more-defensive sectors such as telecommunication services (+30%) and consumer staples (+20%) fared best, while materials and energy significantly underperformed, returning -5%. Small- and mid-cap stocks trailed their less-volatile large-cap counterparts, with the Russell 2000® Index adding 0.19% and the Russell Midcap® Index rising 2.28%. Given turmoil and local currency weakness in Europe, foreign developed-markets stocks lost ground, with the MSCI® EAFE® Index returning -11.32%.
Comments from Matthew Fruhan, Portfolio Manager of Fidelity® Growth & Income Portfolio: For the year, the fund's Class K shares gained 10.66%, ahead of the S&P 500®. Positioning in information tech was a bright spot, especially software/services names. Investments in consumer discretionary were beneficial, especially picks in the consumer durables and apparel group. Positioning in energy and materials helped as well. Conversely, the fund was hurt by underweight positions in telecommunication services and utilities, and the health care and industrials stocks I owned did not fare well. The fund's foreign holdings weighed on performance, hampered in part by a stronger U.S. dollar. The top contributor was U.K.-based Autonomy, an enterprise software maker. The non-index stock rose sharply in August on a takeover bid from Hewlett-Packard, and I sold it after the announcement. Mortgage lender Wells Fargo was helpful, as its stock was lifted by revised earnings estimates. An overweight in MasterCard boosted performance because earnings estimates for the card-processing company increased. Conversely, my decision to not own telecom giant and index component AT&T detracted, as the stock performed well, given its high dividend yield and payout ratio. In financials, JPMorgan Chase underperformed during the period, due in part to new capital standards for financial firms.
The views expressed above reflect those of the portfolio manager(s) only through the end of the period as stated on the cover of this report and do not necessarily represent the views of Fidelity or any other person in the Fidelity organization. Any such views are subject to change at any time based upon market or other conditions and Fidelity disclaims any responsibility to update such views. These views may not be relied on as investment advice and, because investment decisions for a Fidelity fund are based on numerous factors, may not be relied on as an indication of trading intent on behalf of any Fidelity fund.
Annual Report
Shareholder Expense Example
As a shareholder of the Fund, you incur two types of costs: (1) transaction costs, and (2) ongoing costs, including management fees and other Fund expenses. This Example is intended to help you understand your ongoing costs (in dollars) of investing in the Fund and to compare these costs with the ongoing costs of investing in other mutual funds.
The Example is based on an investment of $1,000 invested at the beginning of the period and held for the entire period (February 1, 2012 to July 31, 2012).
Actual Expenses
The first line of the accompanying table for each class of the Fund provides information about actual account values and actual expenses. You may use the information in this line, together with the amount you invested, to estimate the expenses that you paid over the period. Simply divide your account value by $1,000.00 (for example, an $8,600 account value divided by $1,000.00 = 8.6), then multiply the result by the number in the first line for a class of the Fund under the heading entitled "Expenses Paid During Period" to estimate the expenses you paid on your account during this period. A small balance maintenance fee of $12.00 that is charged once a year may apply for certain accounts with a value of less than $2,000. This fee is not included in the table below. If it was, the estimate of expenses you paid during the period would be higher, and your ending account value lower, by this amount. In addition, the Fund, as a shareholder in the underlying Fidelity Central Funds, will indirectly bear its pro-rata share of the fees and expenses incurred by the underlying Fidelity Central Funds. These fees and expenses are not included in the Fund's annualized expense ratio used to calculate the expense estimate in the table below.
Hypothetical Example for Comparison Purposes
The second line of the accompanying table for each class of the Fund provides information about hypothetical account values and hypothetical expenses based on a Class' actual expense ratio and an assumed rate of return of 5% per year before expenses, which is not the Class' actual return. The hypothetical account values and expenses may not be used to estimate the actual ending account balance or expenses you paid for the period. You may use this information to compare the ongoing costs of investing in the Fund and other funds. To do so, compare this 5% hypothetical example with the 5% hypothetical examples that appear in the shareholder reports of the other funds. A small balance maintenance fee of $12.00 that is charged once a year may apply for certain accounts with a value of less than $2,000. This fee is not included in the table below. If it was, the estimate of expenses you paid during the period would be higher, and your ending account value lower, by this amount. In addition, the Fund, as a shareholder in the underlying Fidelity Central Funds, will indirectly bear its pro-rata share of the fees and expenses incurred by the underlying Fidelity Central Funds. These fees and expenses are not included in the Fund's annualized expense ratio used to calculate the expense estimate in the table below.
Please note that the expenses shown in the table are meant to highlight your ongoing costs only and do not reflect any transaction costs. Therefore, the second line of the table is useful in comparing ongoing costs only, and will not help you determine the relative total costs of owning different funds.
Annual Report
| Annualized Expense Ratio | Beginning
Account Value
February 1, 2012 | Ending
Account Value
July 31, 2012 | Expenses Paid
During Period*
February 1, 2012
to July 31, 2012 |
Growth & Income | .70% | | | |
Actual | | $ 1,000.00 | $ 1,068.80 | $ 3.60 |
HypotheticalA | | $ 1,000.00 | $ 1,021.38 | $ 3.52 |
Class K | .54% | | | |
Actual | | $ 1,000.00 | $ 1,069.80 | $ 2.78 |
HypotheticalA | | $ 1,000.00 | $ 1,022.18 | $ 2.72 |
A 5% return per year before expenses
* Expenses are equal to each Class' annualized expense ratio, multiplied by the average account value over the period, multiplied by 182/366 (to reflect the one-half year period).
Annual Report
Investment Changes (Unaudited)
Top Ten Stocks as of July 31, 2012 |
| % of fund's
net assets | % of fund's net assets
6 months ago |
Apple, Inc. | 5.2 | 4.1 |
Wells Fargo & Co. | 3.6 | 3.5 |
JPMorgan Chase & Co. | 3.6 | 3.6 |
Chevron Corp. | 3.5 | 3.5 |
General Electric Co. | 2.5 | 2.2 |
Exxon Mobil Corp. | 2.5 | 3.2 |
Procter & Gamble Co. | 2.1 | 1.7 |
Comcast Corp. Class A | 2.1 | 1.6 |
Merck & Co., Inc. | 2.0 | 1.8 |
Microsoft Corp. | 1.9 | 1.7 |
| 29.0 | |
Top Five Market Sectors as of July 31, 2012 |
| % of fund's
net assets | % of fund's net assets
6 months ago |
Information Technology | 17.5 | 17.6 |
Financials | 16.8 | 18.5 |
Industrials | 12.8 | 13.6 |
Consumer Discretionary | 12.7 | 13.7 |
Energy | 12.4 | 11.6 |
Asset Allocation (% of fund's net assets) |
As of July 31, 2012 * | As of January 31, 2012 ** |
 | Stocks 98.4% | | | Stocks 98.7% | |
 | Bonds 0.2% | | | Bonds 0.1% | |
 | Convertible
Securities 0.8% | | | Convertible
Securities 1.0% | |
 | Short-Term Investments and Net Other Assets (Liabilities) 0.6% | | | Short-Term Investments and Net Other Assets (Liabilities) 0.2% | |
* Foreign investments | 11.8% | | ** Foreign investments | 13.4% | |

Annual Report
Investments July 31, 2012
Showing Percentage of Net Assets
Common Stocks - 97.9% |
| Shares | | Value (000s) |
CONSUMER DISCRETIONARY - 12.2% |
Auto Components - 0.5% |
Gentex Corp. | 867,302 | | $ 13,886 |
Johnson Controls, Inc. | 466,265 | | 11,493 |
| | 25,379 |
Automobiles - 0.3% |
Bayerische Motoren Werke AG (BMW) | 234,137 | | 17,507 |
Distributors - 0.2% |
Genuine Parts Co. | 26,500 | | 1,697 |
Li & Fung Ltd. | 1,452,000 | | 2,869 |
LKQ Corp. (a) | 160,850 | | 5,683 |
| | 10,249 |
Diversified Consumer Services - 0.1% |
Strayer Education, Inc. (d) | 95,560 | | 6,943 |
Hotels, Restaurants & Leisure - 1.3% |
McDonald's Corp. | 668,936 | | 59,776 |
Yum! Brands, Inc. | 186,812 | | 12,113 |
| | 71,889 |
Household Durables - 1.2% |
D.R. Horton, Inc. | 412,009 | | 7,264 |
Ryland Group, Inc. | 1,231,662 | | 29,412 |
Toll Brothers, Inc. (a) | 1,080,307 | | 31,513 |
| | 68,189 |
Leisure Equipment & Products - 0.4% |
Hasbro, Inc. (d) | 686,238 | | 24,581 |
Media - 5.1% |
Comcast Corp. Class A | 3,549,300 | | 115,530 |
The Walt Disney Co. | 583,023 | | 28,650 |
Thomson Reuters Corp. (d) | 501,000 | | 14,208 |
Time Warner Cable, Inc. | 194,624 | | 16,529 |
Time Warner, Inc. | 2,353,299 | | 92,061 |
Viacom, Inc. Class B (non-vtg.) | 371,218 | | 17,340 |
| | 284,318 |
Multiline Retail - 1.5% |
Target Corp. | 1,421,881 | | 86,237 |
Common Stocks - continued |
| Shares | | Value (000s) |
CONSUMER DISCRETIONARY - continued |
Specialty Retail - 1.6% |
Lowe's Companies, Inc. | 3,227,683 | | $ 81,886 |
Staples, Inc. | 715,370 | | 9,114 |
| | 91,000 |
TOTAL CONSUMER DISCRETIONARY | | 686,292 |
CONSUMER STAPLES - 11.8% |
Beverages - 3.7% |
Britvic PLC | 259,200 | | 1,223 |
Dr Pepper Snapple Group, Inc. | 917,035 | | 41,798 |
Molson Coors Brewing Co. Class B | 67,100 | | 2,840 |
PepsiCo, Inc. | 1,016,780 | | 73,950 |
The Coca-Cola Co. | 1,110,034 | | 89,691 |
| | 209,502 |
Food & Staples Retailing - 1.6% |
CVS Caremark Corp. | 690,304 | | 31,236 |
Safeway, Inc. | 408,196 | | 6,347 |
Walgreen Co. | 1,448,473 | | 52,666 |
| | 90,249 |
Food Products - 0.5% |
Kellogg Co. | 624,036 | | 29,767 |
Household Products - 3.9% |
Colgate-Palmolive Co. | 295,456 | | 31,720 |
Kimberly-Clark Corp. | 767,867 | | 66,735 |
Procter & Gamble Co. | 1,863,502 | | 120,270 |
| | 218,725 |
Tobacco - 2.1% |
British American Tobacco PLC sponsored ADR | 693,359 | | 73,503 |
Lorillard, Inc. | 333,994 | | 42,965 |
| | 116,468 |
TOTAL CONSUMER STAPLES | | 664,711 |
ENERGY - 12.3% |
Energy Equipment & Services - 1.6% |
Exterran Partners LP | 372,307 | | 8,191 |
Fugro NV (Certificaten Van Aandelen) unit | 23,289 | | 1,526 |
Common Stocks - continued |
| Shares | | Value (000s) |
ENERGY - continued |
Energy Equipment & Services - continued |
Halliburton Co. | 1,475,762 | | $ 48,892 |
Schlumberger Ltd. | 400,855 | | 28,565 |
| | 87,174 |
Oil, Gas & Consumable Fuels - 10.7% |
Apache Corp. | 136,471 | | 11,753 |
ARC Resources Ltd. (d) | 467,300 | | 11,663 |
Atlas Pipeline Partners, LP | 362,492 | | 12,053 |
Bonavista Energy Corp. (d) | 151,200 | | 2,749 |
Bonavista Energy Corp. (e) | 220,600 | | 4,010 |
BP PLC sponsored ADR | 613,463 | | 24,477 |
Chevron Corp. | 1,803,216 | | 197,596 |
Exxon Mobil Corp. | 1,611,336 | | 139,945 |
Holly Energy Partners LP | 30,000 | | 1,978 |
Legacy Reserves LP | 98,030 | | 2,591 |
Markwest Energy Partners LP | 189,416 | | 9,958 |
Occidental Petroleum Corp. | 376,100 | | 32,732 |
Penn West Petroleum Ltd. | 784,600 | | 10,703 |
Royal Dutch Shell PLC Class A (United Kingdom) | 2,111,992 | | 71,772 |
Suncor Energy, Inc. | 1,459,500 | | 44,621 |
Williams Companies, Inc. | 734,880 | | 23,362 |
| | 601,963 |
TOTAL ENERGY | | 689,137 |
FINANCIALS - 16.6% |
Capital Markets - 3.3% |
Apollo Investment Corp. | 252,430 | | 1,939 |
Ashmore Group PLC | 652,300 | | 3,311 |
BlackRock, Inc. Class A | 85,300 | | 14,523 |
Charles Schwab Corp. | 3,600,390 | | 45,473 |
Greenhill & Co., Inc. (d) | 354,300 | | 14,073 |
ICAP PLC | 1,233,400 | | 6,157 |
KKR & Co. LP | 1,839,620 | | 25,736 |
Morgan Stanley | 1,910,151 | | 26,093 |
Northern Trust Corp. | 685,951 | | 31,142 |
TD Ameritrade Holding Corp. | 140,000 | | 2,229 |
The Blackstone Group LP | 1,131,217 | | 15,667 |
| | 186,343 |
Commercial Banks - 6.2% |
BB&T Corp. | 770,416 | | 24,168 |
Common Stocks - continued |
| Shares | | Value (000s) |
FINANCIALS - continued |
Commercial Banks - continued |
City National Corp. | 157,789 | | $ 7,776 |
Comerica, Inc. | 176,743 | | 5,339 |
First Niagara Financial Group, Inc. | 389,465 | | 2,952 |
Standard Chartered PLC (United Kingdom) | 203,256 | | 4,667 |
SunTrust Banks, Inc. | 1,466,338 | | 34,679 |
U.S. Bancorp | 1,986,112 | | 66,535 |
Wells Fargo & Co. | 5,912,286 | | 199,894 |
| | 346,010 |
Diversified Financial Services - 5.7% |
Citigroup, Inc. | 2,118,848 | | 57,484 |
CME Group, Inc. | 565,345 | | 29,460 |
JPMorgan Chase & Co. | 5,518,380 | | 198,662 |
KKR Financial Holdings LLC | 3,603,418 | | 32,863 |
| | 318,469 |
Insurance - 0.8% |
MetLife, Inc. | 765,266 | | 23,547 |
MetLife, Inc. unit (a) | 324,700 | | 20,320 |
| | 43,867 |
Real Estate Investment Trusts - 0.5% |
Digital Realty Trust, Inc. | 124,900 | | 9,751 |
Sun Communities, Inc. | 221,301 | | 10,310 |
Two Harbors Investment Corp. | 678,900 | | 7,787 |
| | 27,848 |
Real Estate Management & Development - 0.0% |
Beazer Pre-Owned Rental Homes, Inc. (f) | 144,300 | | 2,886 |
Thrifts & Mortgage Finance - 0.1% |
MGIC Investment Corp. (a) | 175,288 | | 422 |
Radian Group, Inc. | 1,357,637 | | 3,801 |
| | 4,223 |
TOTAL FINANCIALS | | 929,646 |
HEALTH CARE - 11.1% |
Biotechnology - 1.0% |
Amgen, Inc. | 656,004 | | 54,186 |
ARIAD Pharmaceuticals, Inc. (a) | 145,281 | | 2,779 |
| | 56,965 |
Common Stocks - continued |
| Shares | | Value (000s) |
HEALTH CARE - continued |
Health Care Equipment & Supplies - 0.2% |
Baxter International, Inc. | 153,700 | | $ 8,993 |
St. Jude Medical, Inc. | 143,509 | | 5,361 |
| | 14,354 |
Health Care Providers & Services - 2.1% |
Aetna, Inc. | 528,073 | | 19,042 |
McKesson Corp. | 563,764 | | 51,150 |
WellPoint, Inc. | 864,990 | | 46,095 |
| | 116,287 |
Health Care Technology - 0.2% |
Quality Systems, Inc. | 705,651 | | 11,403 |
Life Sciences Tools & Services - 0.2% |
QIAGEN NV (a) | 591,083 | | 10,409 |
Pharmaceuticals - 7.4% |
Abbott Laboratories | 653,427 | | 43,329 |
AstraZeneca PLC sponsored ADR | 163,600 | | 7,658 |
Cardiome Pharma Corp. (a) | 935,300 | | 299 |
Eli Lilly & Co. | 507,427 | | 22,342 |
GlaxoSmithKline PLC sponsored ADR | 661,354 | | 30,422 |
Johnson & Johnson | 1,407,352 | | 97,417 |
Merck & Co., Inc. | 2,521,679 | | 111,383 |
Novartis AG sponsored ADR | 189,800 | | 11,126 |
Pfizer, Inc. | 3,009,854 | | 72,357 |
Sanofi SA | 145,647 | | 11,883 |
Teva Pharmaceutical Industries Ltd. sponsored ADR | 181,095 | | 7,405 |
| | 415,621 |
TOTAL HEALTH CARE | | 625,039 |
INDUSTRIALS - 12.7% |
Aerospace & Defense - 3.0% |
Honeywell International, Inc. | 360,657 | | 20,936 |
Raytheon Co. | 495,812 | | 27,508 |
Rockwell Collins, Inc. | 755,874 | | 38,225 |
The Boeing Co. | 497,668 | | 36,783 |
United Technologies Corp. | 599,200 | | 44,604 |
| | 168,056 |
Common Stocks - continued |
| Shares | | Value (000s) |
INDUSTRIALS - continued |
Air Freight & Logistics - 1.1% |
C.H. Robinson Worldwide, Inc. | 344,739 | | $ 18,219 |
United Parcel Service, Inc. Class B | 547,528 | | 41,399 |
| | 59,618 |
Building Products - 0.5% |
Compagnie de St. Gobain | 96,200 | | 2,907 |
Owens Corning (a) | 1,037,013 | | 27,854 |
| | 30,761 |
Commercial Services & Supplies - 0.8% |
Aggreko PLC | 42,400 | | 1,357 |
Healthcare Services Group, Inc. | 26,048 | | 565 |
Interface, Inc. | 839,009 | | 11,125 |
Republic Services, Inc. | 1,075,076 | | 31,102 |
| | 44,149 |
Electrical Equipment - 0.4% |
Emerson Electric Co. | 468,219 | | 22,367 |
Industrial Conglomerates - 3.7% |
Danaher Corp. | 627,000 | | 33,112 |
DCC PLC (Ireland) | 125,300 | | 3,113 |
General Electric Co. | 6,777,032 | | 140,623 |
Koninklijke Philips Electronics NV (depositary receipt) (NY Reg.) | 1,290,997 | | 28,415 |
Siemens AG sponsored ADR | 37,713 | | 3,194 |
| | 208,457 |
Machinery - 1.7% |
Cummins, Inc. | 32,134 | | 3,082 |
Douglas Dynamics, Inc. | 959,138 | | 12,824 |
Illinois Tool Works, Inc. | 135,986 | | 7,389 |
Ingersoll-Rand PLC | 766,475 | | 32,506 |
Lincoln Electric Holdings, Inc. | 99,834 | | 3,981 |
Schindler Holding AG (participation certificate) | 66,193 | | 7,750 |
Stanley Black & Decker, Inc. | 403,899 | | 27,017 |
| | 94,549 |
Marine - 0.2% |
Irish Continental Group PLC unit | 121,800 | | 2,239 |
Kuehne & Nagel International AG | 98,220 | | 11,197 |
| | 13,436 |
Professional Services - 0.7% |
Amadeus Fire AG | 67,931 | | 2,878 |
Common Stocks - continued |
| Shares | | Value (000s) |
INDUSTRIALS - continued |
Professional Services - continued |
Bureau Veritas SA | 186,295 | | $ 16,476 |
Michael Page International PLC | 3,238,548 | | 18,660 |
| | 38,014 |
Road & Rail - 0.1% |
J.B. Hunt Transport Services, Inc. | 52,784 | | 2,904 |
Kansas City Southern | 68,200 | | 4,965 |
| | 7,869 |
Trading Companies & Distributors - 0.5% |
Aircastle Ltd. | 2,800 | | 33 |
W.W. Grainger, Inc. | 61,072 | | 12,509 |
Watsco, Inc. | 196,915 | | 13,378 |
| | 25,920 |
TOTAL INDUSTRIALS | | 713,196 |
INFORMATION TECHNOLOGY - 17.5% |
Communications Equipment - 1.3% |
Cisco Systems, Inc. | 2,500,308 | | 39,880 |
Juniper Networks, Inc. (a) | 382,678 | | 6,708 |
QUALCOMM, Inc. | 465,904 | | 27,805 |
| | 74,393 |
Computers & Peripherals - 6.0% |
Apple, Inc. | 479,931 | | 293,125 |
EMC Corp. (a) | 1,065,500 | | 27,927 |
Hewlett-Packard Co. | 785,395 | | 14,326 |
| | 335,378 |
Internet Software & Services - 1.7% |
Google, Inc. Class A (a) | 151,563 | | 95,935 |
IT Services - 5.8% |
Cognizant Technology Solutions Corp. Class A (a) | 392,775 | | 22,298 |
Fidelity National Information Services, Inc. | 958,037 | | 30,121 |
IBM Corp. | 143,050 | | 28,035 |
MasterCard, Inc. Class A | 148,950 | | 65,027 |
Paychex, Inc. | 2,810,699 | | 91,882 |
The Western Union Co. | 2,099,659 | | 36,597 |
Total System Services, Inc. | 75,900 | | 1,795 |
Visa, Inc. Class A | 394,113 | | 50,868 |
| | 326,623 |
Common Stocks - continued |
| Shares | | Value (000s) |
INFORMATION TECHNOLOGY - continued |
Semiconductors & Semiconductor Equipment - 0.2% |
Analog Devices, Inc. | 260,665 | | $ 10,187 |
Software - 2.5% |
Microsoft Corp. | 3,672,239 | | 108,221 |
Oracle Corp. | 729,890 | | 22,043 |
Royalblue Group PLC | 466,036 | | 10,244 |
| | 140,508 |
TOTAL INFORMATION TECHNOLOGY | | 983,024 |
MATERIALS - 0.5% |
Chemicals - 0.5% |
Air Products & Chemicals, Inc. | 88,397 | | 7,110 |
E.I. du Pont de Nemours & Co. | 184,883 | | 9,189 |
Syngenta AG (Switzerland) | 37,390 | | 12,749 |
| | 29,048 |
Metals & Mining - 0.0% |
Reliance Steel & Aluminum Co. | 32,815 | | 1,689 |
TOTAL MATERIALS | | 30,737 |
TELECOMMUNICATION SERVICES - 0.8% |
Diversified Telecommunication Services - 0.0% |
Cogent Communications Group, Inc. (a) | 17,630 | | 326 |
Koninklijke KPN NV | 1 | | 0* |
| | 326 |
Wireless Telecommunication Services - 0.8% |
Vodafone Group PLC sponsored ADR | 1,463,120 | | 42,065 |
TOTAL TELECOMMUNICATION SERVICES | | 42,391 |
UTILITIES - 2.4% |
Electric Utilities - 1.0% |
American Electric Power Co., Inc. | 193,162 | | 8,159 |
Duke Energy Corp. | 47,200 | | 3,199 |
Edison International | 56,700 | | 2,618 |
FirstEnergy Corp. | 437,958 | | 21,994 |
NextEra Energy, Inc. | 157,270 | | 11,150 |
PPL Corp. | 368,353 | | 10,645 |
| | 57,765 |
Common Stocks - continued |
| Shares | | Value (000s) |
UTILITIES - continued |
Gas Utilities - 0.2% |
National Fuel Gas Co. | 157,115 | | $ 7,689 |
Multi-Utilities - 1.2% |
National Grid PLC | 3,278,374 | | 34,006 |
PG&E Corp. | 287,716 | | 13,281 |
Sempra Energy | 173,809 | | 12,238 |
TECO Energy, Inc. | 444,748 | | 8,090 |
| | 67,615 |
TOTAL UTILITIES | | 133,069 |
TOTAL COMMON STOCKS (Cost $5,087,503) |
5,497,242
|
Preferred Stocks - 1.2% |
| | | |
Convertible Preferred Stocks - 0.7% |
HEALTH CARE - 0.5% |
Health Care Equipment & Supplies - 0.5% |
Alere, Inc. 3.00% | 138,159 | | 28,937 |
INDUSTRIALS - 0.1% |
Aerospace & Defense - 0.1% |
United Technologies Corp. 7.50% | 110,600 | | 5,834 |
UTILITIES - 0.1% |
Electric Utilities - 0.1% |
PPL Corp. 8.75% | 104,300 | | 5,662 |
TOTAL CONVERTIBLE PREFERRED STOCKS | | 40,433 |
Nonconvertible Preferred Stocks - 0.5% |
CONSUMER DISCRETIONARY - 0.5% |
Automobiles - 0.5% |
Volkswagen AG | 142,275 | | 24,333 |
TOTAL PREFERRED STOCKS (Cost $70,721) |
64,766
|
Corporate Bonds - 0.3% |
| Principal Amount (000s) | | Value (000s) |
Convertible Bonds - 0.1% |
ENERGY - 0.1% |
Oil, Gas & Consumable Fuels - 0.1% |
Amyris, Inc. 3% 2/27/17 (f) | | $ 5,615 | | $ 4,435 |
Nonconvertible Bonds - 0.2% |
FINANCIALS - 0.2% |
Thrifts & Mortgage Finance - 0.2% |
Radian Group, Inc.: | | | | |
5.375% 6/15/15 | | 4,050 | | 2,946 |
5.625% 2/15/13 | | 8,060 | | 7,879 |
| | 10,825 |
TOTAL CORPORATE BONDS (Cost $15,351) |
15,260
|
Money Market Funds - 1.1% |
| Shares | | |
Fidelity Cash Central Fund, 0.17% (b) | 28,150,691 | | 28,151 |
Fidelity Securities Lending Cash Central Fund, 0.18% (b)(c) | 35,402,415 | | 35,402 |
TOTAL MONEY MARKET FUNDS (Cost $63,553) |
63,553
|
TOTAL INVESTMENT PORTFOLIO - 100.5% (Cost $5,237,128) | | 5,640,821 |
NET OTHER ASSETS (LIABILITIES) - (0.5)% | | (26,212) |
NET ASSETS - 100% | $ 5,614,609 |
Legend |
(a) Non-income producing |
(b) Affiliated fund that is available only to investment companies and other accounts managed by Fidelity Investments. The rate quoted is the annualized seven-day yield of the fund at period end. A complete unaudited listing of the fund's holdings as of its most recent quarter end is available upon request. In addition, each Fidelity Central Fund's financial statements, which are not covered by the Fund's Report of Independent Registered Public Accounting Firm, are available on the SEC's website or upon request. |
(c) Investment made with cash collateral received from securities on loan. |
(d) Security or a portion of the security is on loan at period end. |
(e) Security exempt from registration under Rule 144A of the Securities Act of 1933. These securities may be resold in transactions exempt from registration, normally to qualified institutional buyers. At the end of the period, the value of these securities amounted to $4,010,000 or 0.1% of net assets. |
(f) Restricted securities - Investment in securities not registered under the Securities Act of 1933 (excluding 144A issues). At the end of the period, the value of restricted securities (excluding 144A issues) amounted to $7,321,000 or 0.1% of net assets. |
Additional information on each restricted holding is as follows: |
Security | Acquisition Date | Acquisition Cost (000s) |
Amyris, Inc. 3% 2/27/17 | 2/27/12 | $ 5,615 |
Beazer Pre-Owned Rental Homes, Inc. | 5/3/12 | $ 2,886 |
* Amount represents less than $1,000 |
Affiliated Central Funds |
Information regarding fiscal year to date income earned by the Fund from investments in Fidelity Central Funds is as follows: |
Fund | Income earned
(Amounts in thousands) |
Fidelity Cash Central Fund | $ 21 |
Fidelity Securities Lending Cash Central Fund | 553 |
Total | $ 574 |
Other Information |
The following is a summary of the inputs used, as of July 31, 2012, involving the Fund's assets and liabilities carried at fair value. The inputs or methodology used for valuing securities may not be an indication of the risk associated with investing in those securities. For more information on valuation inputs, and their aggregation into the levels used in the table below, please refer to the Security Valuation section in the accompanying Notes to Financial Statements. |
Valuation Inputs at Reporting Date: |
Description
(Amounts in thousands) | Total | Level 1 | Level 2 | Level 3 |
Investments in Securities: | | | | |
Equities: | | | | |
Consumer Discretionary | $ 710,625 | $ 710,625 | $ - | $ - |
Consumer Staples | 664,711 | 664,711 | - | - |
Energy | 689,137 | 617,365 | 71,772 | - |
Financials | 929,646 | 906,440 | 20,320 | 2,886 |
Health Care | 653,976 | 642,093 | 11,883 | - |
Industrials | 719,030 | 719,030 | - | - |
Information Technology | 983,024 | 983,024 | - | - |
Materials | 30,737 | 17,988 | 12,749 | - |
Telecommunication Services | 42,391 | 42,391 | - | - |
Utilities | 138,731 | 99,063 | 39,668 | - |
Corporate Bonds | 15,260 | - | 15,260 | - |
Money Market Funds | 63,553 | 63,553 | - | - |
Total Investments in Securities: | $ 5,640,821 | $ 5,466,283 | $ 171,652 | $ 2,886 |
Distribution of investments by country or territory of incorporation, as a percentage of total net assets, is as follows. (Unaudited) |
United States of America | 88.2% |
United Kingdom | 5.9% |
Canada | 1.7% |
Germany | 1.0% |
Others (Individually Less Than 1%) | 3.2% |
| 100.0% |
See accompanying notes which are an integral part of the financial statements.
Annual Report
Statement of Assets and Liabilities
Amounts in thousands (except per-share amounts) | July 31, 2012 |
| | |
Assets | | |
Investment in securities, at value (including securities loaned of $33,450) - See accompanying schedule: Unaffiliated issuers (cost $5,173,575) | $ 5,577,268 | |
Fidelity Central Funds (cost $63,553) | 63,553 | |
Total Investments (cost $5,237,128) | | $ 5,640,821 |
Receivable for investments sold | | 29,033 |
Receivable for fund shares sold | | 3,787 |
Dividends receivable | | 7,969 |
Interest receivable | | 309 |
Distributions receivable from Fidelity Central Funds | | 46 |
Other receivables | | 667 |
Total assets | | 5,682,632 |
| | |
Liabilities | | |
Payable for investments purchased | $ 22,209 | |
Payable for fund shares redeemed | 6,599 | |
Accrued management fee | 2,115 | |
Other affiliated payables | 964 | |
Other payables and accrued expenses | 734 | |
Collateral on securities loaned, at value | 35,402 | |
Total liabilities | | 68,023 |
| | |
Net Assets | | $ 5,614,609 |
Net Assets consist of: | | |
Paid in capital | | $ 9,963,713 |
Undistributed net investment income | | 5,432 |
Accumulated undistributed net realized gain (loss) on investments and foreign currency transactions | | (4,758,226) |
Net unrealized appreciation (depreciation) on investments and assets and liabilities in foreign currencies | | 403,690 |
Net Assets | | $ 5,614,609 |
| | |
Growth & Income:
Net Asset Value, offering price and redemption price per share ($4,862,841 ÷ 241,523 shares) | | $ 20.13 |
| | |
Class K:
Net Asset Value, offering price and redemption price per share ($751,768 ÷ 37,366 shares) | | $ 20.12 |
See accompanying notes which are an integral part of the financial statements.
Annual Report
Financial Statements - continued
Statement of Operations
Amounts in thousands | Year ended July 31, 2012 |
| | |
Investment Income | | |
Dividends | | $ 136,721 |
Interest | | 2,031 |
Income from Fidelity Central Funds | | 574 |
Total income | | 139,326 |
| | |
Expenses | | |
Management fee | $ 23,959 | |
Transfer agent fees | 10,806 | |
Accounting and security lending fees | 1,097 | |
Custodian fees and expenses | 236 | |
Independent trustees' compensation | 37 | |
Registration fees | 103 | |
Audit | 86 | |
Legal | 56 | |
Interest | 2 | |
Miscellaneous | 55 | |
Total expenses before reductions | 36,437 | |
Expense reductions | (57) | 36,380 |
Net investment income (loss) | | 102,946 |
Realized and Unrealized Gain (Loss) Net realized gain (loss) on: | | |
Investment securities: | | |
Unaffiliated issuers | 104,413 | |
Foreign currency transactions | (219) | |
Futures contracts | 7 | |
Total net realized gain (loss) | | 104,201 |
Change in net unrealized appreciation (depreciation) on: Investment securities | 318,254 | |
Assets and liabilities in foreign currencies | (127) | |
Total change in net unrealized appreciation (depreciation) | | 318,127 |
Net gain (loss) | | 422,328 |
Net increase (decrease) in net assets resulting from operations | | $ 525,274 |
See accompanying notes which are an integral part of the financial statements.
Annual Report
Statement of Changes in Net Assets
Amounts in thousands | Year ended
July 31,
2012 | Year ended
July 31,
2011 |
Increase (Decrease) in Net Assets | | |
Operations | | |
Net investment income (loss) | $ 102,946 | $ 66,618 |
Net realized gain (loss) | 104,201 | 1,411,621 |
Change in net unrealized appreciation (depreciation) | 318,127 | (422,767) |
Net increase (decrease) in net assets resulting
from operations | 525,274 | 1,055,472 |
Distributions to shareholders from net investment income | (98,353) | (61,849) |
Distributions to shareholders from net realized gain | (2,799) | - |
Total distributions | (101,152) | (61,849) |
Share transactions - net increase (decrease) | (265,023) | (1,247,529) |
Total increase (decrease) in net assets | 159,099 | (253,906) |
| | |
Net Assets | | |
Beginning of period | 5,455,510 | 5,709,416 |
End of period (including undistributed net investment income of $5,432 and undistributed net investment income of $3,860, respectively) | $ 5,614,609 | $ 5,455,510 |
See accompanying notes which are an integral part of the financial statements.
Annual Report
Financial Highlights - Growth & Income
Years ended July 31, | 2012 | 2011 | 2010 | 2009 | 2008 |
Selected Per-Share Data | | | | | |
Net asset value, beginning of period | $ 18.58 | $ 15.75 | $ 14.38 | $ 21.88 | $ 31.92 |
Income from Investment Operations | | | | | |
Net investment income (loss) B | .36 | .20 | .10 | .15 | .35 |
Net realized and unrealized gain (loss) | 1.55 | 2.82 | 1.37 | (7.43) | (6.25) |
Total from investment operations | 1.91 | 3.02 | 1.47 | (7.28) | (5.90) |
Distributions from net investment income | (.35) | (.19) | (.10) | (.19) | (.33) |
Distributions from net realized gain | (.01) | - | (.01) | (.03) | (3.81) |
Total distributions | (.36) | (.19) | (.10) F | (.22) | (4.14) |
Net asset value, end of period | $ 20.13 | $ 18.58 | $ 15.75 | $ 14.38 | $ 21.88 |
Total Return A | 10.45% | 19.16% | 10.25% | (33.32)% | (20.91)% |
Ratios to Average Net Assets C,E | | | | |
Expenses before reductions | .71% | .72% | .75% | .78% | .68% |
Expenses net of fee waivers, if any | .71% | .72% | .75% | .78% | .68% |
Expenses net of all reductions | .71% | .71% | .74% | .78% | .67% |
Net investment income (loss) | 1.95% | 1.09% | .63% | 1.07% | 1.29% |
Supplemental Data | | | | | |
Net assets, end of period (in millions) | $ 4,863 | $ 5,052 | $ 5,417 | $ 5,993 | $ 12,552 |
Portfolio turnover rate D | 62% | 129% | 98% | 122% | 52% |
A Total returns would have been lower if certain expenses had not been reduced during the applicable periods shown.
B Calculated based on average shares outstanding during the period.
C Fees and expenses of any underlying Fidelity Central Funds are not included in the Fund's expense ratio. The Fund indirectly bears its proportionate share of the expenses of any underlying Fidelity Central Funds.
D Amount does not include the portfolio activity of any underlying Fidelity Central Funds.
E Expense ratios reflect operating expenses of the class. Expenses before reductions do not reflect amounts reimbursed by the investment adviser or reductions from brokerage service arrangements or reductions from other expense offset arrangements and do not represent the amount paid by the class during periods when reimbursements or reductions occur. Expenses net of fee waivers reflect expenses after reimbursement by the investment adviser but prior to reductions from brokerage service arrangements or other expense offset arrangements. Expenses net of all reductions represent the net expenses paid by the class.
F Total distributions of $.10 per share is comprised of distributions from net investment income of $.095 and distributions from net realized gain of $.008 per share.
See accompanying notes which are an integral part of the financial statements.
Annual Report
Financial Highlights - Class K
Years ended July 31, | 2012 | 2011 | 2010 | 2009 | 2008 G |
Selected Per-Share Data | | | | | |
Net asset value, beginning of period | $ 18.57 | $ 15.74 | $ 14.38 | $ 21.88 | $ 25.34 |
Income from Investment Operations | | | | | |
Net investment income (loss) D | .40 | .23 | .13 | .16 | .09 |
Net realized and unrealized gain (loss) | 1.54 | 2.82 | 1.37 | (7.40) | (3.45) |
Total from investment operations | 1.94 | 3.05 | 1.50 | (7.24) | (3.36) |
Distributions from net investment income | (.38) | (.22) | (.13) | (.23) | (.10) |
Distributions from net realized gain | (.01) | - | (.01) | (.03) | - |
Total distributions | (.39) | (.22) | (.14) I | (.26) | (.10) |
Net asset value, end of period | $ 20.12 | $ 18.57 | $ 15.74 | $ 14.38 | $ 21.88 |
Total Return B,C | 10.66% | 19.40% | 10.41% | (33.12)% | (13.22)% |
Ratios to Average Net Assets E,H | | | | | |
Expenses before reductions | .54% | .54% | .54% | .56% | .55% A |
Expenses net of fee waivers, if any | .54% | .54% | .54% | .56% | .55% A |
Expenses net of all reductions | .54% | .53% | .53% | .55% | .55% A |
Net investment income (loss) | 2.13% | 1.27% | .84% | 1.29% | 1.73% A |
Supplemental Data | | | | | |
Net assets, end of period (000 omitted) | $ 751,768 | $ 403,452 | $ 292,021 | $ 349,324 | $ 87 |
Portfolio turnover rate F | 62% | 129% | 98% | 122% | 52% |
A Annualized
B Total returns for periods of less than one year are not annualized.
C Total returns would have been lower if certain expenses had not been reduced during the applicable periods shown.
D Calculated based on average shares outstanding during the period.
E Fees and expenses of any underlying Fidelity Central Funds are not included in the Fund's expense ratio. The Fund indirectly bears its proportionate share of the expenses of any underlying Fidelity Central Funds.
F Amount does not include the portfolio activity of any underlying Fidelity Central Funds.
G For the period May 9, 2008 (commencement of sale of shares) to July 31, 2008.
H Expense ratios reflect operating expenses of the class. Expenses before reductions do not reflect amounts reimbursed by the investment adviser or reductions from brokerage service arrangements or reductions from other expense offset arrangements and do not represent the amount paid by the class during periods when reimbursements or reductions occur. Expense ratios before reductions for start-up periods may not be representative of longer-term operating periods. Expenses net of fee waivers reflect expenses after reimbursement by the investment adviser but prior to reductions from brokerage service arrangements or other expense offset arrangements. Expenses net of all reductions represent the net expenses paid by the class.
I Total distributions of $.14 per share is comprised of distributions from net investment income of $.129 and distributions from net realized gain of $.008 per share.
See accompanying notes which are an integral part of the financial statements.
Annual Report
Notes to Financial Statements
For the period ended July 31, 2012
(Amounts in thousands except percentages)
1. Organization.
Fidelity Growth & Income Portfolio (the Fund) is a fund of Fidelity Securities Fund (the Trust) and is authorized to issue an unlimited number of shares. The Trust is registered under the Investment Company Act of 1940, as amended (the 1940 Act), as an open-end management investment company organized as a Massachusetts business trust. The Fund offers Growth & Income and Class K shares, each of which has equal rights as to assets and voting privileges. Each class has exclusive voting rights with respect to matters that affect that class. Investment income, realized and unrealized capital gains and losses, the common expenses of the Fund, and certain fund-level expense reductions, if any, are allocated on a pro-rata basis to each class based on the relative net assets of each class to the total net assets of the Fund. Each class differs with respect to transfer agent fees incurred. Certain expense reductions may also differ by class.
2. Investments in Fidelity Central Funds.
The Fund invests in Fidelity Central Funds, which are open-end investment companies available only to other investment companies and accounts managed by Fidelity Management & Research Company (FMR) and its affiliates. The Fund's Schedule of Investments lists each of the Fidelity Central Funds held as of period end, if any, as an investment of the Fund, but does not include the underlying holdings of each Fidelity Central Fund. As an Investing Fund, the Fund indirectly bears its proportionate share of the expenses of the underlying Fidelity Central Funds.
The Money Market Central Funds seek preservation of capital and current income and are managed by Fidelity Investments Money Management, Inc. (FIMM), an affiliate of FMR.
A complete unaudited list of holdings for each Fidelity Central Fund is available upon request or at the Securities and Exchange Commission (the SEC) web site at www.sec.gov. In addition, the financial statements of the Fidelity Central Funds, which are not covered by the Fund's Report of Independent Registered Public Accounting Firm, are available on the SEC web site or upon request.
3. Significant Accounting Policies.
The financial statements have been prepared in conformity with accounting principles generally accepted in the United States of America (GAAP), which require management to make certain estimates and assumptions at the date of the financial statements. Actual results could differ from those estimates. Subsequent events, if any, through the date that the financial statements were issued have been evaluated in the preparation of the financial statements. The following summarizes the significant accounting policies of the Fund:
Annual Report
Notes to Financial Statements - continued
(Amounts in thousands except percentages)
3. Significant Accounting Policies - continued
Security Valuation. Investments are valued as of 4:00 p.m. Eastern time on the last calendar day of the period. In accordance with valuation policies and procedures approved by the Board of Trustees (the Board), the Fund attempts to obtain prices from one or more third party pricing vendor or broker to value its investments. When current market prices, quotations or rates are not readily available or reliable, securities will be fair valued in good faith by the FMR Fair Value Committee (the Committee), in accordance with procedures adopted by the Fund's Board. Factors used in determining fair value vary by security type and may include market or security specific events, changes in interest rates and credit quality. The frequency with which these procedures are used cannot be predicted and they may be utilized to a significant extent. The Committee oversees the Fund's valuation policies and procedures and is responsible for approving and reporting to the Board all fair value determinations.
The Fund categorizes the inputs to valuation techniques used to value its investments into a disclosure hierarchy consisting of three levels as shown below:
Level 1 - quoted prices in active markets for identical investments
Level 2 - other significant observable inputs (including quoted prices for similar investments, interest rates, prepayment speeds, etc.)
Level 3 - unobservable inputs (including the Fund's own assumptions based on the best information available)
Valuation techniques used to value the Fund's investments by major category are as follows:
Equity securities, including restricted securities, for which market quotations are readily available, are valued at the last reported sale price or official closing price as reported by a third party pricing vendor on the primary market or exchange on which they are traded and are categorized as Level 1 in the hierarchy. In the event there were no sales during the day or closing prices are not available, securities are valued at the last quoted bid price or may be valued using the last available price and are generally categorized as Level 2 in the hierarchy. For foreign equity securities, when significant market or security specific events arise, comparisons to the valuation of American Depositary Receipts (ADRs), futures contracts, Exchange-Traded Funds (ETFs) and certain indexes as well as quoted prices for similar securities are used and are categorized as Level 2 in the hierarchy. Utilizing these techniques may result in transfers between Level 1 and Level 2. For restricted equity securities and private placements where observable inputs are limited, assumptions about market activity and risk are used and these securities are categorized as Level 3 in the hierarchy.
Annual Report
3. Significant Accounting Policies - continued
Security Valuation - continued
Debt securities, including restricted securities, are valued based on evaluated prices received from third party pricing vendors or from brokers who make markets in such securities. For corporate bonds, pricing vendors utilize matrix pricing which considers yield or price of bonds of comparable quality, coupon, maturity and type as well as broker-supplied prices and are generally categorized as Level 2 in the hierarchy. When independent prices are unavailable or unreliable, debt securities may be valued utilizing pricing methodologies which consider similar factors that would be used by third party pricing vendors. These are generally categorized as Level 2 in the hierarchy but may be Level 3 depending on the circumstances.
Investments in open-end mutual funds, including the Fidelity Central Funds, are valued at their closing net asset value each business day and are categorized as Level 1 in the hierarchy.
Changes in valuation techniques may result in transfers in or out of an assigned level within the disclosure hierarchy. The aggregate value of investments by input level, as of July 31, 2012, is included at the end of the Fund's Schedule of Investments.
Foreign Currency Translation. The Fund may use foreign currency contracts to facilitate transactions in foreign-denominated securities. Gains and losses from these transactions may arise from changes in the value of the foreign currency or if the counterparties do not perform under the contracts' terms.
Foreign-denominated assets, including investment securities, and liabilities are translated into U.S. dollars at the exchange rates at period end. Purchases and sales of investment securities, income and dividends received and expenses denominated in foreign currencies are translated into U.S. dollars at the exchange rate in effect on the transaction date.
The effects of exchange rate fluctuations on investments are included with the net realized and unrealized gain (loss) on investment securities. Other foreign currency transactions resulting in realized and unrealized gain (loss) are disclosed separately.
Investment Transactions and Income. For financial reporting purposes, the Fund's investment holdings and NAV include trades executed through the end of the last business day of the period. The NAV per share for processing shareholder transactions is calculated as of the close of business of the New York Stock Exchange (NYSE), normally 4:00 p.m. Eastern time and includes trades executed through the end of the prior business day. Gains and losses on securities sold are determined on the basis of identified cost and may include proceeds received from litigation. Dividend income is recorded on the ex-dividend date, except for certain dividends from foreign securities where the
Annual Report
Notes to Financial Statements - continued
(Amounts in thousands except percentages)
3. Significant Accounting Policies - continued
Investment Transactions and Income - continued
ex-dividend date may have passed, which are recorded as soon as the Fund is informed of the ex-dividend date. Non-cash dividends included in dividend income, if any, are recorded at the fair market value of the securities received. Distributions received on securities that represent a return of capital or capital gain are recorded as a reduction of cost of investments and/or as a realized gain. The Fund estimates the components of distributions received that may be considered return of capital distributions or capital gain distributions. Interest income and distributions from the Fidelity Central Funds are accrued as earned. Interest income includes coupon interest and amortization of premium and accretion of discount on debt securities. Investment income is recorded net of foreign taxes withheld where recovery of such taxes is uncertain.
Expenses. Expenses directly attributable to a fund are charged to that fund. Expenses attributable to more than one fund are allocated among the respective funds on the basis of relative net assets or other appropriate methods. Expense estimates are accrued in the period to which they relate and adjustments are made when actual amounts are known.
Deferred Trustee Compensation. Under a Deferred Compensation Plan (the Plan), independent Trustees may elect to defer receipt of a portion of their annual compensation. Deferred amounts are invested in a cross-section of Fidelity funds, are marked-to-market and remain in the Fund until distributed in accordance with the Plan. The investment of deferred amounts and the offsetting payable to the Trustees are included in the accompanying Statement of Assets and Liabilities.
Income Tax Information and Distributions to Shareholders. Each year, the Fund intends to qualify as a regulated investment company under Subchapter M of the Internal Revenue Code, including distributing substantially all of its taxable income and realized gains. As a result, no provision for income taxes is required. As of July 31, 2012, the Fund did not have any unrecognized tax benefits in the financial statements; nor is the Fund aware of any tax positions for which it is reasonably possible that the total amounts of unrecognized tax benefits will significantly change in the next twelve months. The Fund files a U.S. federal tax return, in addition to state and local tax returns as required. A fund's federal income tax returns are subject to examination by the Internal Revenue Service (IRS) for a period of three fiscal years after they are filed. State and local tax returns may be subject to examination for an additional fiscal year depending on the jurisdiction. Foreign taxes are provided for based on the Fund's understanding of the tax rules and rates that exist in the foreign markets in which it invests.
Distributions are declared and recorded on the ex-dividend date. Income dividends and capital gain distributions are declared separately for each class. Income and capital gain distributions are determined in accordance with income tax regulations, which may differ from GAAP.
Annual Report
3. Significant Accounting Policies - continued
Income Tax Information and Distributions to Shareholders - continued
Capital accounts within the financial statements are adjusted for permanent book-tax differences. These adjustments have no impact on net assets or the results of operations. Temporary book-tax differences will reverse in a subsequent period.
Book-tax differences are primarily due to futures transactions, foreign currency transactions, market discount, partnerships, equity-debt classifications, deferred trustees compensation, capital loss carryforwards and losses deferred due to wash sales.
The federal tax cost of investment securities and unrealized appreciation (depreciation) as of period end were as follows:
Gross unrealized appreciation | $ 691,271 |
Gross unrealized depreciation | (318,187) |
Net unrealized appreciation (depreciation) on securities and other investments | $ 373,084 |
| |
Tax Cost | $ 5,267,737 |
The tax-based components of distributable earnings as of period end were as follows:
Undistributed ordinary income | $ 7,158 |
Capital loss carryforward | $ (4,728,474) |
Net unrealized appreciation (depreciation) | $ 373,080 |
Capital loss carryforwards are only available to offset future capital gains of the Fund to the extent provided by regulations and may be limited. Under the Regulated Investment Company Modernization Act of 2010 (the Act), the Fund is permitted to carry forward capital losses incurred in taxable years beginning after December 22, 2010 for an unlimited period and such capital losses are required to be used prior to any losses that expire. Capital loss carryforwards were as follows:
Fiscal year of expiration | |
2017 | $ (1,560,133) |
2018 | (3,168,341) |
Total capital loss carryforward | $ (4,728,474) |
The tax character of distributions paid was as follows:
| July 31, 2012 | July 31, 2011 |
Ordinary Income | $ 101,152 | $ 61,849 |
Annual Report
Notes to Financial Statements - continued
(Amounts in thousands except percentages)
3. Significant Accounting Policies - continued
New Accounting Pronouncement. In December 2011, the Financial Accounting Standards Board issued Accounting Standard Update No. 2011-11, Disclosures about Offsetting Assets and Liabilities. The update creates new disclosure requirements requiring entities to disclose both gross and net information for derivatives and other financial instruments that are either offset in the Statement of Assets and Liabilities or subject to an enforceable master netting arrangement or similar agreement. The disclosure requirements are effective for interim and annual reporting periods beginning on or after January 1, 2013. Management is currently evaluating the impact of the update's adoption on the Fund's financial statement disclosures.
4. Operating Policies.
Restricted Securities. The Fund may invest in securities that are subject to legal or contractual restrictions on resale. These securities generally may be resold in transactions exempt from registration or to the public if the securities are registered. Disposal of these securities may involve time-consuming negotiations and expense, and prompt sale at an acceptable price may be difficult. Information regarding restricted securities is included at the end of the Fund's Schedule of Investments.
5. Derivative Instruments.
Risk Exposures and the Use of Derivative Instruments. The Fund's investment objectives allow the Fund to enter into various types of derivative contracts, including futures contracts. Derivatives are investments whose value is derived from underlying assets, indices or reference rates and may be transacted on an exchange or over-the-counter (OTC). Derivatives may involve a future commitment to buy or sell a specified instrument based on specified terms, or to exchange future cash flows at periodic intervals based on a notional principal amount. The Fund used derivatives to increase returns and to manage exposure to certain risks as defined below. The success of any strategy involving derivatives depends on analysis of numerous economic factors, and if the strategies for investment do not work as intended, the Fund may not achieve its objectives.
The Fund's use of derivatives increased or decreased its exposure to the following risk:
Equity Risk | Equity risk relates to the fluctuations in the value of financial instruments as a result of changes in market prices (other than those arising from interest rate risk or foreign exchange risk), whether caused by factors specific to an individual investment, its issuer, or all factors affecting all instruments traded in a market or market segment. |
Annual Report
5. Derivative Instruments - continued
Risk Exposures and the Use of Derivative Instruments - continued
The Fund is also exposed to additional risks from investing in derivatives, such as liquidity risk and counterparty credit risk. Liquidity risk is the risk that the Fund will be unable to close out the derivative in the open market in a timely manner. Counterparty credit risk is the risk that the counterparty will not be able to fulfill its obligation to the Fund. Counterparty credit risk related to exchange-traded futures contracts is minimal because of the protection provided by the exchange on which they trade. Investing in derivatives may involve greater risks than investing in the underlying assets directly and, to varying degrees, involves risk of loss in excess of the initial investment, if any, collateral received and amounts recognized in the Statement of Assets and Liabilities. In addition, for futures contracts, there is the risk that the change in value of the derivative contract may not correspond to the change in value of the underlying instrument.
Futures Contracts. A futures contract is an agreement between two parties to buy or sell a specified underlying instrument for a fixed price at a specified future date. The Fund used futures contracts to manage its exposure to the stock market.
Upon entering into a futures contract, a fund is required to deposit either cash or securities (initial margin) with a clearing broker in an amount equal to a certain percentage of the face value of the contract. Futures contracts are marked-to-market daily and subsequent payments (variation margin) are made or received by a fund depending on the daily fluctuations in the value of the futures contracts and are recorded as unrealized appreciation or (depreciation). This receivable and/or payable is included in daily variation margin on futures contracts in the Statement of Assets and Liabilities. Realized gain or (loss) is recorded upon the expiration or closing of a futures contract.
Any open futures contracts at period end are shown in the Schedule of Investments under the caption "Futures Contracts." The underlying face amount at value reflects each contract's exposure to the underlying instrument at period end.
During the period the Fund recognized net realized gain (loss) of $7 related to its investment in futures contracts. This amount is included in the Statement of Operations.
6. Purchases and Sales of Investments.
Purchases and sales of securities, other than short-term securities, aggregated $3,260,377 and $3,529,590, respectively.
Annual Report
Notes to Financial Statements - continued
(Amounts in thousands except percentages)
7. Fees and Other Transactions with Affiliates.
Management Fee. FMR and its affiliates provide the Fund with investment management related services for which the Fund pays a monthly management fee. The management fee is the sum of an individual fund fee rate that is based on an annual rate of .20% of the Fund's average net assets and an annualized group fee rate that averaged .26% during the period. The group fee rate is based upon the average net assets of all the mutual funds advised by FMR. The group fee rate decreases as assets under management increase and increases as assets under management decrease. For the period, the total annual management fee rate was .46% of the Fund's average net assets.
Transfer Agent Fees. Fidelity Investments Institutional Operations Company, Inc. (FIIOC), an affiliate of FMR, is the transfer, dividend disbursing and shareholder servicing agent for each class of the Fund. FIIOC receives account fees and asset-based fees that vary according to the account size and type of account of the shareholders of Growth and Income. FIIOC receives an asset-based fee of Class K's average net assets. FIIOC pays for typesetting, printing and mailing of shareholder reports, except proxy statements. For the period, transfer agent fees for each class were as follows:
| Amount | % of
Average
Net Assets |
Growth & Income | $ 10,547 | .22 |
Class K | 259 | .05 |
| $ 10,806 | |
Accounting and Security Lending Fees. Fidelity Service Company, Inc. (FSC), an affiliate of FMR, maintains the Fund's accounting records. The accounting fee is based on the level of average net assets for each month. Under a separate contract, FSC administers the security lending program. The security lending fee is based on the number and duration of lending transactions.
Brokerage Commissions. The Fund placed a portion of its portfolio transactions with brokerage firms which are affiliates of the investment adviser. The commissions paid to these affiliated firms were $105 for the period.
Interfund Lending Program. Pursuant to an Exemptive Order issued by the SEC, the Fund, along with other registered investment companies having management contracts with FMR, may participate in an interfund lending program. This program provides an alternative credit facility allowing the funds to borrow from, or lend money to, other participating affiliated funds. The Fund's activity in this program during the period for which loans were outstanding was as follows:
Borrower or Lender | Average Loan
Balance | Weighted Average Interest Rate | Interest
Expense |
Borrower | $ 6,200 | .37% | $ 2 |
Annual Report
8. Committed Line of Credit.
The Fund participates with other funds managed by FMR or an affiliate in a $4.25 billion credit facility (the "line of credit") to be utilized for temporary or emergency purposes to fund shareholder redemptions or for other short-term liquidity purposes. The Fund has agreed to pay commitment fees on its pro-rata portion of the line of credit, which amounted to $15 and is reflected in Miscellaneous expenses on the Statement of Operations. During the period, there were no borrowings on this line of credit.
9. Security Lending.
The Fund lends portfolio securities through a lending agent from time to time in order to earn additional income. For equity securities, a lending agent is used and may loan securities to certain qualified borrowers, including Fidelity Capital Markets (FCM), a broker-dealer affiliated with the Fund. On the settlement date of the loan, the Fund receives collateral (in the form of U.S. Treasury obligations, letters of credit and/or cash) against the loaned securities and maintains collateral in an amount not less than 100% of the market value of the loaned securities during the period of the loan. The market value of the loaned securities is determined at the close of business of the Fund and any additional required collateral is delivered to the Fund on the next business day. If the borrower defaults on its obligation to return the securities loaned because of insolvency or other reasons, a fund could experience delays and costs in recovering the securities loaned or in gaining access to the collateral. Any cash collateral received is invested in the Fidelity Securities Lending Cash Central Fund. The value of loaned securities and cash collateral at period end are disclosed on the Fund's Statement of Assets and Liabilities. At period end, there were no security loans outstanding with FCM. Security lending income represents the income earned on investing cash collateral, less rebates paid to borrowers and any lending agent fees associated with the loan, plus any premium payments received for lending certain types of securities. Security lending income is presented in the Statement of Operations as a component of income from Fidelity Central Funds. Total security lending income during the period amounted to $553, including $3 from securities loaned to FCM.
10. Expense Reductions.
Many of the brokers with whom FMR places trades on behalf of the Fund provided services to the Fund in addition to trade execution. These services included payments of certain expenses on behalf of the Fund totaling $57 for the period.
Annual Report
Notes to Financial Statements - continued
(Amounts in thousands except percentages)
11. Distributions to Shareholders.
Distributions to shareholders of each class were as follows:
Years ended July 31, | 2012 | 2011 |
From net investment income | | |
Growth & Income | $ 87,366 | $ 54,597 |
Class K | 10,987 | 7,252 |
Total | $ 98,353 | $ 61,849 |
From net realized gain | | |
Growth & Income | $ 2,563 | $ - |
Class K | 236 | - |
Total | $ 2,799 | $ - |
12. Share Transactions.
Transactions for each class of shares were as follows:
| Shares | Dollars |
Years ended July 31, | 2012 | 2011 | 2012 | 2011 |
Growth & Income | | | | |
Shares sold | 21,066 | 10,892 | $ 402,515 | $ 196,623 |
Reinvestment of distributions | 4,651 | 2,827 | 86,309 | 52,490 |
Shares redeemed | (56,062) | (85,823) | (1,053,524) | (1,509,810) |
Net increase (decrease) | (30,345) | (72,104) | $ (564,700) | $ (1,260,697) |
Class K | | | | |
Shares sold | 20,227 | 26,831 | $ 386,187 | $ 447,073 |
Reinvestment of distributions | 596 | 390 | 11,223 | 7,252 |
Shares redeemed | (5,182) | (24,047) | (97,733) | (441,157) |
Net increase (decrease) | 15,641 | 3,174 | $ 299,677 | $ 13,168 |
13. Other.
The Fund's organizational documents provide former and current trustees and officers with a limited indemnification against liabilities arising in connection with the performance of their duties to the Fund. In the normal course of business, the Fund may also enter into contracts that provide general indemnifications. The Fund's maximum exposure under these arrangements is unknown as this would be dependent on future claims that may be made against the Fund. The risk of material loss from such claims is considered remote.
Annual Report
To the Trustees of Fidelity Securities Fund and the Shareholders of Fidelity Growth & Income Portfolio:
In our opinion, the accompanying statement of assets and liabilities, including the schedule of investments, and the related statements of operations and of changes in net assets and the financial highlights present fairly, in all material respects, the financial position of Fidelity Growth & Income Portfolio (a fund of Fidelity Securities Fund) at July 31, 2012, the results of its operations for the year then ended, the changes in its net assets for each of the two years in the period then ended and the financial highlights for each of the periods indicated, in conformity with accounting principles generally accepted in the United States of America. These financial statements and financial highlights (hereafter referred to as "financial statements") are the responsibility of the Fidelity Growth & Income Portfolio's management. Our responsibility is to express an opinion on these financial statements based on our audits. We conducted our audits of these financial statements in accordance with the standards of the Public Company Accounting Oversight Board (United States). Those standards require that we plan and perform the audit to obtain reasonable assurance about whether the financial statements are free of material misstatement. An audit includes examining, on a test basis, evidence supporting the amounts and disclosures in the financial statements, assessing the accounting principles used and significant estimates made by management, and evaluating the overall financial statement presentation. We believe that our audits, which included confirmation of securities at July 31, 2012 by correspondence with the custodian, brokers and transfer agent, provide a reasonable basis for our opinion.
PricewaterhouseCoopers LLP
Boston, Massachusetts
September 12, 2012
Annual Report
The Trustees, Members of the Advisory Board, and executive officers of the trust and fund, as applicable, are listed below. The Board of Trustees governs the fund and is responsible for protecting the interests of shareholders. The Trustees are experienced executives who meet periodically throughout the year to oversee the fund's activities, review contractual arrangements with companies that provide services to the fund, oversee management of the risks associated with such activities and contractual arrangements, and review the fund's performance. Except for James C. Curvey, each of the Trustees oversees 228 funds advised by FMR or an affiliate. Mr. Curvey oversees 435 funds advised by FMR or an affiliate.
The Trustees hold office without limit in time except that (a) any Trustee may resign; (b) any Trustee may be removed by written instrument, signed by at least two-thirds of the number of Trustees prior to such removal; (c) any Trustee who requests to be retired or who has become incapacitated by illness or injury may be retired by written instrument signed by a majority of the other Trustees; and (d) any Trustee may be removed at any special meeting of shareholders by a two-thirds vote of the outstanding voting securities of the trust. Each Trustee who is not an interested person (as defined in the 1940 Act) (Independent Trustee), shall retire not later than the last day of the calendar year in which his or her 75th birthday occurs. The Independent Trustees may waive this mandatory retirement age policy with respect to individual Trustees. The executive officers and Advisory Board Members hold office without limit in time, except that any officer and Advisory Board Member may resign or may be removed by a vote of a majority of the Trustees at any regular meeting or any special meeting of the Trustees. Except as indicated, each individual has held the office shown or other offices in the same company for the past five years.
Experience, Skills, Attributes, and Qualifications of the Fund's Trustees. The Governance and Nominating Committee has adopted a statement of policy that describes the experience, qualifications, attributes, and skills that are necessary and desirable for potential Independent Trustee candidates (Statement of Policy). The Board believes that each Trustee satisfied at the time he or she was initially elected or appointed a Trustee, and continues to satisfy, the standards contemplated by the Statement of Policy. The Governance and Nominating Committee also engages professional search firms to help identify potential Independent Trustee candidates who have the experience, qualifications, attributes, and skills consistent with the Statement of Policy. From time to time, additional criteria based on the composition and skills of the current Independent Trustees, as well as experience or skills that may be appropriate in light of future changes to board composition, business conditions, and regulatory or other developments, have also been considered by the professional search firms and the Governance and Nominating Committee. In addition, the Board takes into account the Trustees' commitment and participation in Board and committee meetings, as well as their leadership of standing and ad hoc committees throughout their tenure.
In determining that a particular Trustee was and continues to be qualified to serve as a Trustee, the Board has considered a variety of criteria, none of which, in isolation, was controlling. The Board believes that, collectively, the Trustees have balanced and diverse experience, qualifications, attributes, and skills, which allow the Board to operate effectively in governing the fund and protecting the interests of shareholders. Information about the specific experience, skills, attributes, and qualifications of each Trustee, which in each case led to the Board's conclusion that the Trustee should serve (or continue to serve) as a trustee of the fund, is provided below.
Annual Report
Board Structure and Oversight Function. James C. Curvey is an interested person (as defined in the 1940 Act) and currently serves as Chairman. The Trustees have determined that an interested Chairman is appropriate and benefits shareholders because an interested Chairman has a personal and professional stake in the quality and continuity of services provided to the fund. Independent Trustees exercise their informed business judgment to appoint an individual of their choosing to serve as Chairman, regardless of whether the Trustee happens to be independent or a member of management. The Independent Trustees have determined that they can act independently and effectively without having an Independent Trustee serve as Chairman and that a key structural component for assuring that they are in a position to do so is for the Independent Trustees to constitute a substantial majority for the Board. The Independent Trustees also regularly meet in executive session. Ned C. Lautenbach serves as Chairman of the Independent Trustees and as such (i) acts as a liaison between the Independent Trustees and management with respect to matters important to the Independent Trustees and (ii) with management prepares agendas for Board meetings.
Fidelity funds are overseen by different Boards of Trustees. The fund's Board oversees Fidelity's equity and high income funds and another Board oversees Fidelity's investment-grade bond, money market, and asset allocation funds. The asset allocation funds may invest in Fidelity funds overseen by the fund's Board. The use of separate Boards, each with its own committee structure, allows the Trustees of each group of Fidelity funds to focus on the unique issues of the funds they oversee, including common research, investment, and operational issues. On occasion, the separate Boards establish joint committees to address issues of overlapping consequences for the Fidelity funds overseen by each Board.
The Trustees operate using a system of committees to facilitate the timely and efficient consideration of all matters of importance to the Trustees, the fund, and fund shareholders and to facilitate compliance with legal and regulatory requirements and oversight of the fund's activities and associated risks. The Board, acting through its committees, has charged FMR and its affiliates with (i) identifying events or circumstances the occurrence of which could have demonstrably adverse effects on the fund's business and/or reputation; (ii) implementing processes and controls to lessen the possibility that such events or circumstances occur or to mitigate the effects of such events or circumstances if they do occur; and (iii) creating and maintaining a system designed to evaluate continuously business and market conditions in order to facilitate the identification and implementation processes described in (i) and (ii) above. Because the day-to-day operations and activities of the fund are carried out by or through FMR, its affiliates and other service providers, the fund's exposure to risks is mitigated but not eliminated by the processes overseen by the Trustees. While each of the Board's committees has responsibility for overseeing different aspects of the fund's activities, oversight is exercised primarily through the Operations, Audit, and Compliance Committees. In addition, the Independent Trustees have worked with FMR to enhance the Board's oversight of investment and financial risks, legal and regulatory risks, technology risks, and operational risks, including the development of additional risk reporting to the Board. For example, a working group comprised of Independent Trustees and FMR has worked and continues to work to review the Fidelity funds' valuation-related activities, reporting and risk management. Appropriate personnel, including but not limited to the fund's Chief Compliance Officer (CCO), FMR's internal auditor, the independent accountants, the fund's Treasurer and portfolio management personnel, make periodic reports to the Board's committees, as appropriate, including an annual review of FMR's risk management program for the Fidelity funds. The responsibilities of each standing committee, including their oversight responsibilities, are described further under "Standing Committees of the Fund's Trustees."
Annual Report
Trustees and Officers - continued
The fund's Statement of Additional Information (SAI) includes more information about the Trustees. To request a free copy, call Fidelity at 1-800-835-5092.
Interested Trustees*:
Correspondence intended for each Trustee who is an interested person may be sent to Fidelity Investments, 82 Devonshire Street, Boston, Massachusetts 02109.
Name, Age; Principal Occupations and Other Relevant Experience+ |
James C. Curvey (77) |
| Year of Election or Appointment: 2007 Mr. Curvey is Trustee and Chairman of the Board of Trustees of certain Trusts. Mr. Curvey also serves as Trustee (2007-present) of other investment companies advised by FMR. Mr. Curvey is a Director of Fidelity Investments Money Management, Inc. (2009-present), Director of Fidelity Research & Analysis Co. (2009-present) and Director of FMR and FMR Co., Inc. (2007-present). Mr. Curvey is also Vice Chairman (2007-present) and Director of FMR LLC. In addition, Mr. Curvey serves as an Overseer for the Boston Symphony Orchestra and a member of the Trustees of Villanova University. Previously, Mr. Curvey was the Vice Chairman (2006-2007) and Director (2000-2007) of FMR Corp. |
Ronald P. O'Hanley (55) |
| Year of Election or Appointment: 2011 Mr. O'Hanley is Director of FMR Co., Inc. (2010-present), Director of Fidelity Investments Money Management, Inc. (2010-present), Director of Fidelity Research & Analysis Company (2010-present), President of Fidelity Asset Management and Corporate Services and a member of Fidelity's Executive Committee (2010-present). Previously, Mr. O'Hanley served as President and Chief Executive Officer of BNY Mellon Asset Management (2007-2010). Mr. O'Hanley also served as Vice Chairman of Bank New York Mellon Corp. and a member of that firm's Executive Committee. Prior to the 2007 merger of The Bank of New York and Mellon Financial Corporation, he was Vice Chairman of Mellon Financial Corporation and President and Chief Executive Officer of Mellon Asset Management. He joined Mellon in February 1997. Mr. O'Hanley currently serves as Chairman of the Boston Public Library Foundation Board of Directors and sits on the Board of Directors of Beth Israel Deaconess Medical Center, the Board of Trustees of the Marine Biological Laboratory and the Advisory Board of the Maxwell School of Citizenship and Public Administration at Syracuse University. Mr. O'Hanley also chairs the Council on Asset Management for the Financial Services Roundtable and is a member of the Board of Directors of Institutional Investor's U.S. Institute. |
* Trustees have been determined to be "Interested Trustees" by virtue of, among other things, their affiliation with the trust or various entities under common control with FMR.
+ The information above includes each Trustee's principal occupation during the last five years and other information relating to the experience, attributes, and skills relevant to each Trustee's qualifications to serve as a Trustee, which led to the conclusion that each Trustee should serve as a Trustee for the fund.
Annual Report
Trustees and Officers - continued
Independent Trustees:
Correspondence intended for each Independent Trustee (that is, the Trustees other than the Interested Trustees) may be sent to Fidelity Investments, P.O. Box 55235, Boston, Massachusetts 02205-5235.
Name, Age; Principal Occupations and Other Relevant Experience+ |
Dennis J. Dirks (64) |
| Year of Election or Appointment: 2005 Prior to his retirement in May 2003, Mr. Dirks was Chief Operating Officer and a member of the Board of The Depository Trust & Clearing Corporation (DTCC). He also served as President, Chief Operating Officer, and Board member of The Depository Trust Company (DTC) and President and Board member of the National Securities Clearing Corporation (NSCC). In addition, Mr. Dirks served as Chief Executive Officer and Board member of the Government Securities Clearing Corporation, Chief Executive Officer and Board member of the Mortgage-Backed Securities Clearing Corporation, as a Trustee and a member of the Finance Committee of Manhattan College (2005-2008), and as a Trustee and a member of the Finance Committee of AHRC of Nassau County (2006-2008). Mr. Dirks is a member of the Independent Directors Council (IDC) Governing Council (2010-present) and Board of Directors for The Brookville Center for Children's Services, Inc. (2009-present). |
Alan J. Lacy (58) |
| Year of Election or Appointment: 2008 Mr. Lacy serves as Senior Adviser (2007-present) of Oak Hill Capital Partners, L.P. (private equity). Mr. Lacy also served as Chief Executive Officer (2000-2005) and Vice Chairman (2005-2006) of Sears Holdings Corporation and Sears, Roebuck and Co. (retail). In addition, Mr. Lacy serves as a member of the Board of Directors of Dave & Buster's Entertainment, Inc. (restaurant and entertainment complexes, 2010-present), Earth Fare, Inc. (retail grocery, 2012-present), The Hillman Companies, Inc. (hardware wholesalers, 2010-present), and Bristol-Myers Squibb Company (global pharmaceuticals, 2007-present). Mr. Lacy is a member of the Board of Trustees of The National Parks Conservation Association (2006-present). Previously, Mr. Lacy served as Chairman of the Board of Trustees of the National Parks Conservation Association (2008-2011) and as a member of the Board of Directors for the Western Union Company (global money transfer, 2006-2011). |
Ned C. Lautenbach (68) |
| Year of Election or Appointment: 2000 Mr. Lautenbach is Chairman of the Independent Trustees of the Equity and High Income Funds (2006-present). Mr. Lautenbach currently serves as the Lead Director of the Eaton Corporation Board of Directors (diversified industrial, 1997-present). Mr. Lautenbach is Chairman of the Board of Directors of the Philharmonic Center for the Arts in Naples, Florida (2012-present) and a member of the Council on Foreign Relations (1994-present). Previously, Mr. Lautenbach was a Partner/Advisory Partner at Clayton, Dubilier & Rice, LLC (private equity investment, 1998-2010), as well as a Director of Sony Corporation (2006-2007). |
Joseph Mauriello (67) |
| Year of Election or Appointment: 2008 Prior to his retirement in January 2006, Mr. Mauriello served in numerous senior management positions including Deputy Chairman and Chief Operating Officer (2004-2005), and Vice Chairman of Financial Services (2002-2004) of KPMG LLP US (professional services, 1965-2005). Mr. Mauriello currently serves as a member of the Board of Directors of XL Group plc. (global insurance and re-insurance, 2006-present). Previously, Mr. Mauriello served as a Director of the Hamilton Funds of the Bank of New York (2006-2007) and of Arcadia Resources Inc. (health care services and products, 2007-2012). |
Robert W. Selander (61) |
| Year of Election or Appointment: 2011 Previously, Mr. Selander served as a Member of the Advisory Board of Fidelity's Equity and High Income Funds (2011), Executive Vice Chairman (2010), Chief Executive Officer (2009-2010), and President and Chief Executive Officer (1997-2009) of Mastercard, Inc. |
Cornelia M. Small (68) |
| Year of Election or Appointment: 2005 Ms. Small is a member of the Board of Directors of the Teagle Foundation (2009-present). Ms. Small is also a member of the Investment Committee, and Chair (2008-present) and a member of the Board of Trustees of Smith College. In addition, Ms. Small serves on the Investment Committee of the Berkshire Taconic Community Foundation (2008-present). Previously, Ms. Small served as Chairperson of the Investment Committee (2002-2008) of Smith College. In addition, Ms. Small served as Chief Investment Officer, Director of Global Equity Investments, and a member of the Board of Directors of Scudder, Stevens & Clark and Scudder Kemper Investments. |
William S. Stavropoulos (73) |
| Year of Election or Appointment: 2002 Mr. Stavropoulos is Vice Chairman of the Independent Trustees of the Equity and High Income Funds (2006-present). Mr. Stavropoulos serves as President and Founder of the Michigan Baseball Foundation, the Great Lakes Loons (2007-present). Mr. Stavropoulos is Chairman Emeritus of the Board of Directors of The Dow Chemical Company, where he previously served in numerous senior management positions, including President, CEO (1995-2000; 2002-2004), Chairman of the Executive Committee (2000-2006), and as a member of the Board of Directors (1990-2006). Currently, Mr. Stavropoulos is Chairman of Univar (global distributor of commodity and specialty chemicals, 2010-present), a Director of Teradata Corporation (data warehousing and technology solutions, 2008-present), Chemical Financial Corporation, Maersk Inc. (industrial conglomerate), Tyco International, Inc. (multinational manufacturing and services, 2007-present), and a member of the Advisory Board for Metalmark Capital (private equity investment, 2005-present). Mr. Stavropoulos is a special advisor to Clayton, Dubilier & Rice, LLC (private equity investment). In addition, Mr. Stavropoulos is a member of the University of Notre Dame Advisory Council for the College of Science. |
David M. Thomas (63) |
| Year of Election or Appointment: 2008 Previously, Mr. Thomas served as Executive Chairman (2005-2006) and Chairman and Chief Executive Officer (2000-2005) of IMS Health, Inc. (pharmaceutical and healthcare information solutions). In addition, Mr. Thomas serves as a member of the Board of Directors of Fortune Brands, Inc. (consumer products), and Interpublic Group of Companies, Inc. (marketing communication, 2004-present). |
Michael E. Wiley (61) |
| Year of Election or Appointment: 2008 Mr. Wiley also serves as a Director of Asia Pacific Exploration Consolidated (international oil and gas exploration and production, 2008-present). Mr. Wiley serves as a Director of Tesoro Corporation (independent oil refiner and marketer, 2005-present), and a Director of Bill Barrett Corporation (exploration and production, 2005-present). In addition, Mr. Wiley also serves as a Director of Post Oak Bank (privately-held bank, 2004-present). Previously, Mr. Wiley served as a member of the Board of Trustees of the University of Tulsa (2000-2006; 2007-2010), as a Senior Energy Advisor of Katzenbach Partners, LLC (consulting, 2006-2007), as an Advisory Director of Riverstone Holdings (private investment), Chairman, President, and CEO of Baker Hughes, Inc. (oilfield services, 2000-2004), and as Director of Spinnaker Exploration Company (exploration and production, 2001-2005). |
Annual Report
+ The information above includes each Trustee's principal occupation during the last five years and other information relating to the experience, attributes, and skills relevant to each Trustee's qualifications to serve as a Trustee, which led to the conclusion that each Trustee should serve as a Trustee for the fund.
Advisory Board Members and Executive Officers:
Correspondence intended for David A. Rosow and Garnett A. Smith may be sent to Fidelity Investments, P.O. Box 55235, Boston, Massachusetts 02205-5235. Correspondence intended for each executive officer, Edward C. Johnson 3d, and Peter S. Lynch may be sent to Fidelity Investments, 82 Devonshire Street, Boston, Massachusetts 02109.
Name, Age; Principal Occupation |
Edward C. Johnson 3d (82) |
| Year of Election or Appointment: 2011 Member of the Advisory Board of Fidelity's Equity and High Income Funds. Mr. Johnson serves as Chief Executive Officer, Chairman, and a Director of FMR LLC, and also serves as Chairman and Director of FIL Limited. Previously, Mr. Johnson served as a Trustee and Chairman of the Board of certain Fidelity Trusts, Chairman and a Director of FMR, Chairman and a Director of FMR Co., Inc., and President of FMR LLC (2006-2007). |
Peter S. Lynch (68) |
| Year of Election or Appointment: 2003 Member of the Advisory Board of Fidelity's Equity and High Income Funds. Mr. Lynch is Vice Chairman and a Director of FMR and FMR Co., Inc. In addition, Mr. Lynch serves as a Trustee of Boston College and as the Chairman of the Inner-City Scholarship Fund. Previously, Mr. Lynch served on the Special Olympics International Board of Directors (1997-2006). |
David A. Rosow (69) |
| Year of Election or Appointment: 2012 Member of the Advisory Board of Fidelity's Equity and High Income Funds. Chairman and Chief Executive Officer of International Golf Group, Inc. (golf course development, 1990-present). Previously, Mr. Rosow served as Chairman and Chief Executive Officer of Rosow & Company, Inc. (private investment company, 1989-2011), a Lead Director of Hudson United Bancorp (2001-2006) and as a Director of TD Banknorth (1996-2006). In addition, Mr. Rosow is a member (2008-present) and President (2009-present) of the Town Council of Palm Beach, Florida. |
Garnett A. Smith (64) |
| Year of Election or Appointment: 2012 Member of the Advisory Board of Fidelity's Equity and High Income Funds. Prior to Mr. Smith's retirement, he served as Chairman and Chief Executive Officer of Inbrand Corp. (manufacturer of personal absorbent products, 1990-1997). He also served as President (1986-1990) of Inbrand Corp. Prior to his employment with Inbrand Corp., he was employed by a retail fabric chain and North Carolina National Bank. In addition, Mr. Smith is a board member of the Jackson Hole Land Trust (2009-present). |
Kenneth B. Robins (42) |
| Year of Election or Appointment: 2008 President and Treasurer of Fidelity's Equity and High Income Funds. Mr. Robins also serves as President and Treasurer (2010-present) and Assistant Treasurer (2009-present) of other Fidelity funds and is an employee of Fidelity Investments (2004-present). Previously, Mr. Robins served as Deputy Treasurer of the Fidelity funds (2005-2008) and Treasurer and Chief Financial Officer of The North Carolina Capital Management Trust: Cash and Term Portfolios (2006-2008). |
Bruce T. Herring (46) |
| Year of Election or Appointment: 2006 Vice President of certain Equity Funds. Mr. Herring also serves as President of Fidelity Research & Analysis Company (2010-present), Chief Investment Officer and Director of Fidelity Management & Research (U.K.) Inc. (2010-present) and Group Chief Investment Officer of FMR. Previously, Mr. Herring served as Vice President (2005-2006) and Senior Vice President (2006-2007) of Fidelity Management & Research Company, Vice President of FMR Co., Inc. (2001-2007) and as a portfolio manager for Fidelity U.S. Equity Funds. |
Brian B. Hogan (47) |
| Year of Election or Appointment: 2009 Vice President of Equity and High Income Funds. Mr. Hogan also serves as President of FMR's Equity Division (2009-present). Previously, Mr. Hogan served as Senior Vice President, Equity Research of FMR (2006-2009) and as a portfolio manager. |
Scott C. Goebel (44) |
| Year of Election or Appointment: 2008 Secretary and Chief Legal Officer (CLO) of the Fidelity funds. Mr. Goebel also serves as Secretary of Fidelity Investments Money Management, Inc. (FIMM) (2010-present) and Fidelity Research and Analysis Company (FRAC) (2010-present); Secretary and CLO of The North Carolina Capital Management Trust: Cash and Term Portfolios (2008-present); General Counsel, Secretary, and Senior Vice President of FMR (2008-present) and FMR Co., Inc. (2008-present); employed by FMR LLC or an affiliate (2001-present); Chief Legal Officer of Fidelity Management & Research (Hong Kong) Limited (2008-present) and Assistant Secretary of Fidelity Management & Research (Japan) Inc. (2008-present), and Fidelity Management & Research (U.K.) Inc. (2008-present). Previously, Mr. Goebel served as Assistant Secretary of FIMM (2008-2010), FRAC (2008-2010), and the Funds (2007-2008) and as Vice President and Secretary of Fidelity Distributors Corporation (FDC) (2005-2007). |
William C. Coffey (43) |
| Year of Election or Appointment: 2009 Assistant Secretary of Fidelity's Equity and High Income Funds. Mr. Coffey also serves as Senior Vice President and Deputy General Counsel of FMR LLC (2010-present), and is an employee of Fidelity Investments. Previously, Mr. Coffey served as Vice President and Associate General Counsel of FMR LLC (2005-2009). |
Elizabeth Paige Baumann (44) |
| Year of Election or Appointment: 2012 Anti-Money Laundering (AML) Officer of the Fidelity funds. Ms. Baumann also serves as AML Officer of The North Carolina Capital Management Trust: Cash and Term Portfolios (2012-present), Chief AML Officer of FMR LLC (2012-present), and is an employee of Fidelity Investments. Previously, Ms. Baumann served as Vice President and Deputy Anti-Money Laundering Officer (2007-2012). |
Christine Reynolds (53) |
| Year of Election or Appointment: 2008 Chief Financial Officer of the Fidelity funds. Ms. Reynolds became President of Fidelity Pricing and Cash Management Services (FPCMS) in August 2008. Ms. Reynolds served as Chief Operating Officer of FPCMS (2007-2008). Previously, Ms. Reynolds served as President, Treasurer, and Anti-Money Laundering officer of the Fidelity funds (2004-2007). |
Joseph A. Hanlon (44) |
| Year of Election or Appointment: 2012 Chief Compliance Officer of Fidelity's Equity and High Income Funds. Mr. Hanlon serves as Compliance Officer of FMR, FMR Co., Inc., Fidelity Investments Money Management, Inc. (FIMM), Fidelity Research and Analysis Company (FRAC), Fidelity Management & Research (Japan) Inc., Fidelity Management & Research (U.K.) Inc., Fidelity Management & Research (Hong Kong), and Strategic Advisers, Inc. (2009-present), as Senior Vice President of the Fidelity Asset Management Division (2009-present), and is an employee of Fidelity Investments. |
Joseph F. Zambello (55) |
| Year of Election or Appointment: 2011 Deputy Treasurer of the Fidelity funds. Mr. Zambello is an employee of Fidelity Investments. Previously, Mr. Zambello served as Vice President of FMR's Program Management Group (2009-2011) and Vice President of the Transfer Agent Oversight Group (2005-2009). |
Adrien E. Deberghes (44) |
| Year of Election or Appointment: 2008 Deputy Treasurer of Fidelity's Equity and High Income Funds. Mr. Deberghes also serves as Vice President (2011-present) and Assistant Treasurer (2010-present) of other Fidelity funds, and is an employee of Fidelity Investments (2008-present). Previously, Mr. Deberghes served as Senior Vice President of Mutual Fund Administration at State Street Corporation (2007-2008), Senior Director of Mutual Fund Administration at Investors Bank & Trust (2005-2007), and Director of Finance for Dunkin' Brands (2000-2005). |
Stephanie J. Dorsey (43) |
| Year of Election or Appointment: 2010 Assistant Treasurer of Fidelity's Equity and High Income Funds. Ms. Dorsey also serves as Deputy Treasurer of other Fidelity funds (2008-present) and is an employee of Fidelity Investments (2008-present). Previously, Ms. Dorsey served as Treasurer (2004-2008) of the JPMorgan Mutual Funds and Vice President (2004-2008) of JPMorgan Chase Bank. |
John R. Hebble (54) |
| Year of Election or Appointment: 2009 Assistant Treasurer of Fidelity's Equity and High Income Funds. Mr. Hebble also serves as President (2011-present), Treasurer, and Chief Financial Officer of The North Carolina Capital Management Trust: Cash and Term Portfolios (2008-present), President and Treasurer of other Fidelity funds (2008-present) and is an employee of Fidelity Investments. |
Gary W. Ryan (53) |
| Year of Election or Appointment: 2005 Assistant Treasurer of the Fidelity funds. Mr. Ryan is an employee of Fidelity Investments. Previously, Mr. Ryan served as Vice President of Fund Reporting in Fidelity Pricing and Cash Management Services (FPCMS) (1999-2005). |
Jonathan Davis (44) |
| Year of Election or Appointment: 2010 Assistant Treasurer of the Fidelity funds. Mr. Davis is also Assistant Treasurer of Fidelity Rutland Square Trust II and Fidelity Commonwealth Trust II. Mr. Davis is an employee of Fidelity Investments. Previously, Mr. Davis served as Vice President and Associate General Counsel of FMR LLC (2003-2010). |
Annual Report
The Board of Trustees of Fidelity Growth & Income Portfolio voted to pay to shareholders of record at the opening of business on record date, the following distributions per share derived from capital gains realized from sales of portfolio securities:
| Pay Date | Record Date | Capital Gains |
Class K | 09/10/2012 | 09/07/2012 | $0.009 |
A total of 0.01% of the dividends distributed during the fiscal year was derived from interest on U.S. Government securities which is generally exempt from state income tax.
Class K designates 88%, 88%, 100% and 100% of the dividends distributed in October, December, April and July, respectively during the fiscal year as qualifying for the dividends-received deduction for corporate shareholders.
Class K designates 100% of the dividends distributed during the fiscal year as amounts which may be taken into account as a dividend for the purposes of the maximum rate under section 1(h)(11) of the Internal Revenue Code.
The fund will notify shareholders in January 2013 of amounts for use in preparing 2012 income tax returns.
Annual Report
Board Approval of Investment Advisory Contracts and Management Fees
Fidelity Growth & Income Portfolio
Each year, the Board of Trustees, including the Independent Trustees (together, the Board), votes on the renewal of the management contract and sub-advisory agreements (together, the Advisory Contracts) for the fund. The Board, assisted by the advice of fund counsel and Independent Trustees' counsel, requests and considers a broad range of information relevant to the renewal of the Advisory Contracts throughout the year.
The Board meets regularly and, at each of its meetings, considers factors that are relevant to its annual consideration of the renewal of the fund's Advisory Contracts, including the services and support provided to the fund and its shareholders. The Board has established various standing committees, each composed of and chaired by Independent Trustees with varying backgrounds, to which the Board has assigned specific subject matter responsibilities in order to enhance effective decision-making by the Board. The Board, acting directly and through its Committees, requests and receives information concerning the annual consideration of the renewal of the fund's Advisory Contracts. The Board also meets as needed to consider matters specifically related to the Board's annual consideration of the renewal of Advisory Contracts. Members of the Board may also meet with trustees of other Fidelity funds through ad hoc joint committees to discuss certain matters relevant to the Fidelity funds.
At its July 2012 meeting, the Board of Trustees, including the Independent Trustees, unanimously determined to renew the fund's Advisory Contracts. In reaching its determination, the Board considered all factors it believed relevant, including (i) the nature, extent, and quality of the services to be provided to the fund and its shareholders (including the investment performance of the fund); (ii) the competitiveness of the fund's management fee and total expense ratio relative to peer funds; (iii) the total costs of the services to be provided by and the profits to be realized by Fidelity from its relationship with the fund; (iv) the extent to which economies of scale exist and would be realized as the fund grows; and (v) whether fee levels reflect these economies of scale, if any, for the benefit of fund shareholders.
In considering whether to renew the Advisory Contracts for the fund, the Board reached a determination, with the assistance of fund counsel and Independent Trustees' counsel and through the exercise of its business judgment, that the renewal of the Advisory Contracts is in the best interests of the fund and its shareholders and that the compensation payable under the Advisory Contracts is fair and reasonable. The Board's decision to renew the Advisory Contracts was not based on any single factor, but rather was based on a comprehensive consideration of all the information provided to the Board at its meetings throughout the year. The Board, in reaching its determination to renew the Advisory Contracts, is aware that shareholders in the fund have a broad range of investment choices available to them, including a wide choice among mutual funds offered by Fidelity's competitors, and that the fund's shareholders, who have the opportunity to review and weigh the disclosure provided by the fund in its prospectus and other public disclosures, have chosen to invest in this fund, managed by Fidelity.
Annual Report
Board Approval of Investment Advisory Contracts and
Management Fees - continued
Nature, Extent, and Quality of Services Provided. The Board considered the staffing within the investment adviser, FMR, and the sub-advisers (together, the Investment Advisers), including the backgrounds of the fund's investment personnel, and also considered the fund's investment objective, strategies, and related investment philosophy. The Independent Trustees also had discussions with senior management of Fidelity's investment operations and investment groups. The Board considered the structure of the portfolio manager compensation program and whether this structure provides appropriate incentives to act in the best interests of the fund.
Resources Dedicated to Investment Management and Support Services. The Board and the Fund Oversight and Research Committees reviewed the general qualifications and capabilities of the Investment Advisers' investment staff, including its size, education, experience, and resources, as well as the Investment Advisers' approach to recruiting, training, managing, and compensating investment personnel. The Board also noted that FMR has continued to increase the resources devoted to non-U.S. offices, including expansion of Fidelity's global investment organization. The Board noted that Fidelity's analysts have extensive resources, tools and capabilities that allow them to conduct sophisticated quantitative and fundamental analysis, as well as credit analysis of issuers, counterparties and guarantors. The Board also believes that Fidelity's investment professionals have sufficient access to global information and data so as to provide competitive investment results over time, and that those professionals also have access to sophisticated tools that permit them to assess portfolio construction and risk and performance attribution characteristics continuously, as well as to transmit new information and research conclusions rapidly around the world. Additionally, in its deliberations, the Board considered the Investment Advisers' trading and risk management capabilities and resources, which are an integral part of the investment management process.
Shareholder and Administrative Services. The Board considered (i) the nature, extent, quality, and cost of advisory, administrative, and shareholder services performed by the Investment Advisers and their affiliates under the Advisory Contracts and under separate agreements covering transfer agency, pricing and bookkeeping, and securities lending services for the fund; (ii) the nature and extent of the supervision of third party service providers, principally custodians and subcustodians; and (iii) the resources devoted to, and the record of compliance with, the fund's compliance policies and procedures. The Board also reviewed the allocation of fund brokerage, including allocations to brokers affiliated with the Investment Advisers, the use of brokerage commissions to pay fund expenses, and the use of "soft" commission dollars to pay for research services.
Annual Report
The Board noted that the growth of fund assets over time across the complex allows Fidelity to reinvest in the development of services designed to enhance the value or convenience of the Fidelity funds as investment vehicles. These services include 24-hour access to account information and market information through telephone representatives and over the Internet, investor education materials and asset allocation tools, and the expanded availability of Fidelity Investor Centers.
Investment in a Large Fund Family. The Board considered the benefits to shareholders of investing in a Fidelity fund, including the benefits of investing in a fund that is part of a large family of funds offering a variety of investment disciplines and providing a large variety of mutual fund investor services. The Board noted that Fidelity had taken, or had made recommendations that resulted in the Fidelity funds taking, a number of actions over the previous year that benefited particular funds, including (i) continuing to dedicate additional resources to investment research and support of the senior management team that oversees asset management; (ii) persisting in efforts to enhance Fidelity's research capabilities, in particular, international research; (iii) launching new funds and making other enhancements to meet client needs for global and income-oriented solutions; (iv) continuing to launch dedicated lower cost underlying funds to meet investment management's portfolio construction needs related to expanding underlying fund options, specifically for the Freedom Fund product lines; (v) adopting a "Stock Selector" sector neutral investment approach and employing a team of portfolio managers who are sector specialists to manage certain funds; (vi) rationalizing product lines and gaining increased efficiencies through the mergers of several funds into other funds; (vii) strengthening the Spartan Index Fund product line by adding new funds and/or new low-cost institutional share classes, restructuring fund expenses to accommodate new classes, and reducing investment minimums for certain classes of shares; (viii) modifying the eligibility criteria for Institutional Class shares to increase their appeal to government entities and charitable investors; and (ix) reducing certain transfer agent fee rates.
Investment Performance. The Board considered whether the fund has operated in accordance with its investment objective, as well as its record of compliance with its investment restrictions. It also reviewed the fund's absolute investment performance for each class, as well as the fund's relative investment performance for each class measured over multiple periods against (i) a broad-based securities market index, and (ii) a peer group of mutual funds deemed appropriate by Fidelity and reviewed by the Board. The following charts considered by the Board show, over the one-, three-, and five-year periods ended December 31, 2011, as available, the cumulative total returns of Class K and the retail class of the fund, the cumulative total returns of a broad-based securities market index ("benchmark"), and a range of cumulative total returns of a peer group of mutual funds identified by Morningstar, Inc. as having an investment style similar to that of the fund based on underlying portfolio holdings. The box within each chart shows the 25th percentile return (top of box) and the 75th percentile return (bottom of box) of the peer group. Returns shown above the box are in the first quartile and returns shown below the box are in the fourth quartile. The percentage beaten numbers noted below each chart correspond to the percentile box and represent the percentage of funds in the peer group whose performance was equal to or lower than that of the class indicated.
Annual Report
Board Approval of Investment Advisory Contracts and
Management Fees - continued
Fidelity Growth & Income Portfolio
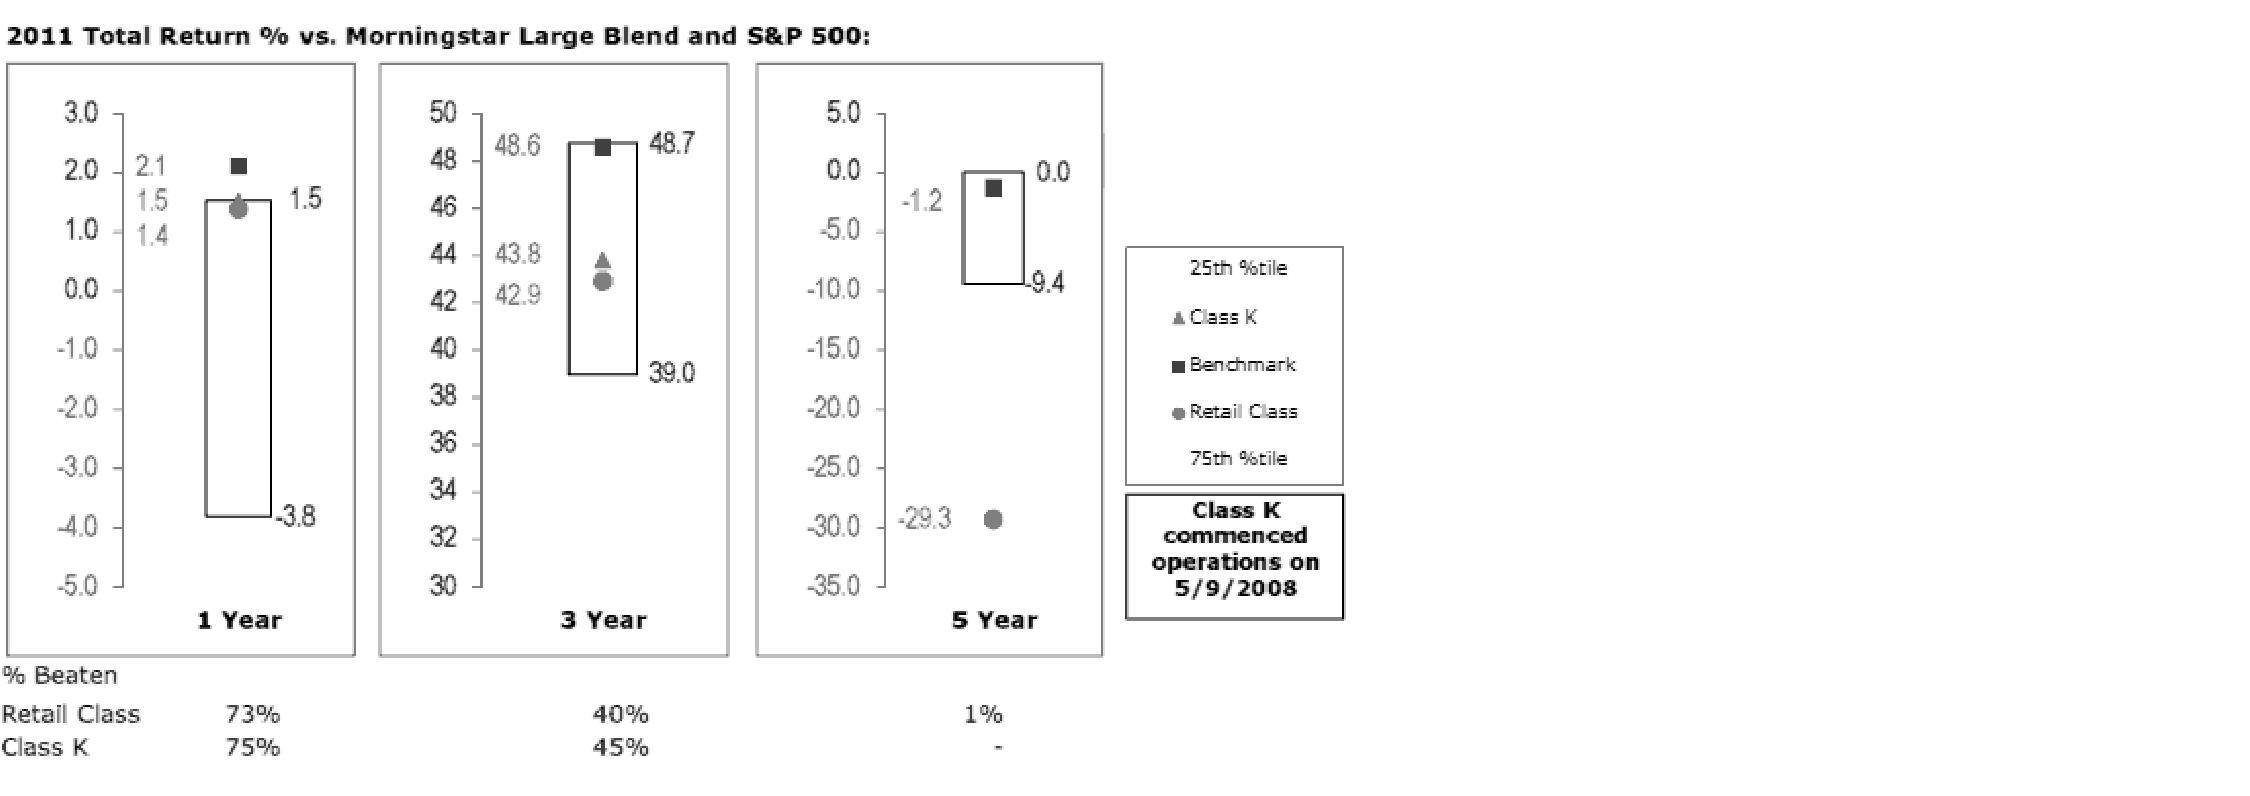
The Board reviewed the fund's relative investment performance against its peer group and noted that the performance of the retail class of the fund (the class with the longer performance record) was in the second quartile for the one-year period, the third quartile for the three-year period, and the fourth quartile for the five-year period. The Board also noted that the investment performance of the fund was lower than its benchmark for all the periods shown. The Board considered that the variations in performance between the fund's classes reflect the variations in class expenses, which result in lower performance for the higher expense class. The Board discussed with FMR the fact that the fund underperformed its benchmark for each period measured. The Board also reviewed the fund's performance since inception as well as performance in the current year. The Board will continue to closely monitor performance of the fund in the coming year and discuss with FMR if other actions to address performance are appropriate.
Based on its review, the Board concluded that the nature, extent, and quality of services provided to the fund under the Advisory Contracts should benefit the fund's shareholders.
Competitiveness of Management Fee and Total Expense Ratio. The Board considered the fund's management fee and total expense ratio compared to "mapped groups" of competitive funds and classes. Fidelity creates "mapped groups" by combining similar Lipper investment objective categories that have comparable management fee characteristics. Combining Lipper investment objective categories aids the Board's management fee and total expense ratio comparisons by broadening the competitive group used for comparison and by reducing the number of universes to which various Fidelity funds are compared.
Annual Report
Management Fee. The Board considered two proprietary management fee comparisons for the 12-month periods shown in the chart below. The group of Lipper funds used by the Board for management fee comparisons is referred to below as the "Total Mapped Group." The Total Mapped Group comparison focuses on a fund's standing relative to the total universe of comparable funds available to investors in terms of gross management fees before expense reimbursements or caps. "TMG %" represents the percentage of funds in the Total Mapped Group that had management fees that were lower than the fund's. For example, a TMG % of 14% means that 86% of the funds in the Total Mapped Group had higher management fees than the fund. The "Asset-Size Peer Group" (ASPG) comparison focuses on a fund's standing relative to non-Fidelity funds similar in size to the fund within the Total Mapped Group. The ASPG represents at least 15% of the funds in the Total Mapped Group with comparable asset size and management fee characteristics, subject to a minimum of 50 funds (or all funds in the Total Mapped Group if fewer than 50). Additional information, such as the ASPG quartile in which the fund's management fee ranked, is also included in the chart and considered by the Board.
Fidelity Growth & Income Portfolio
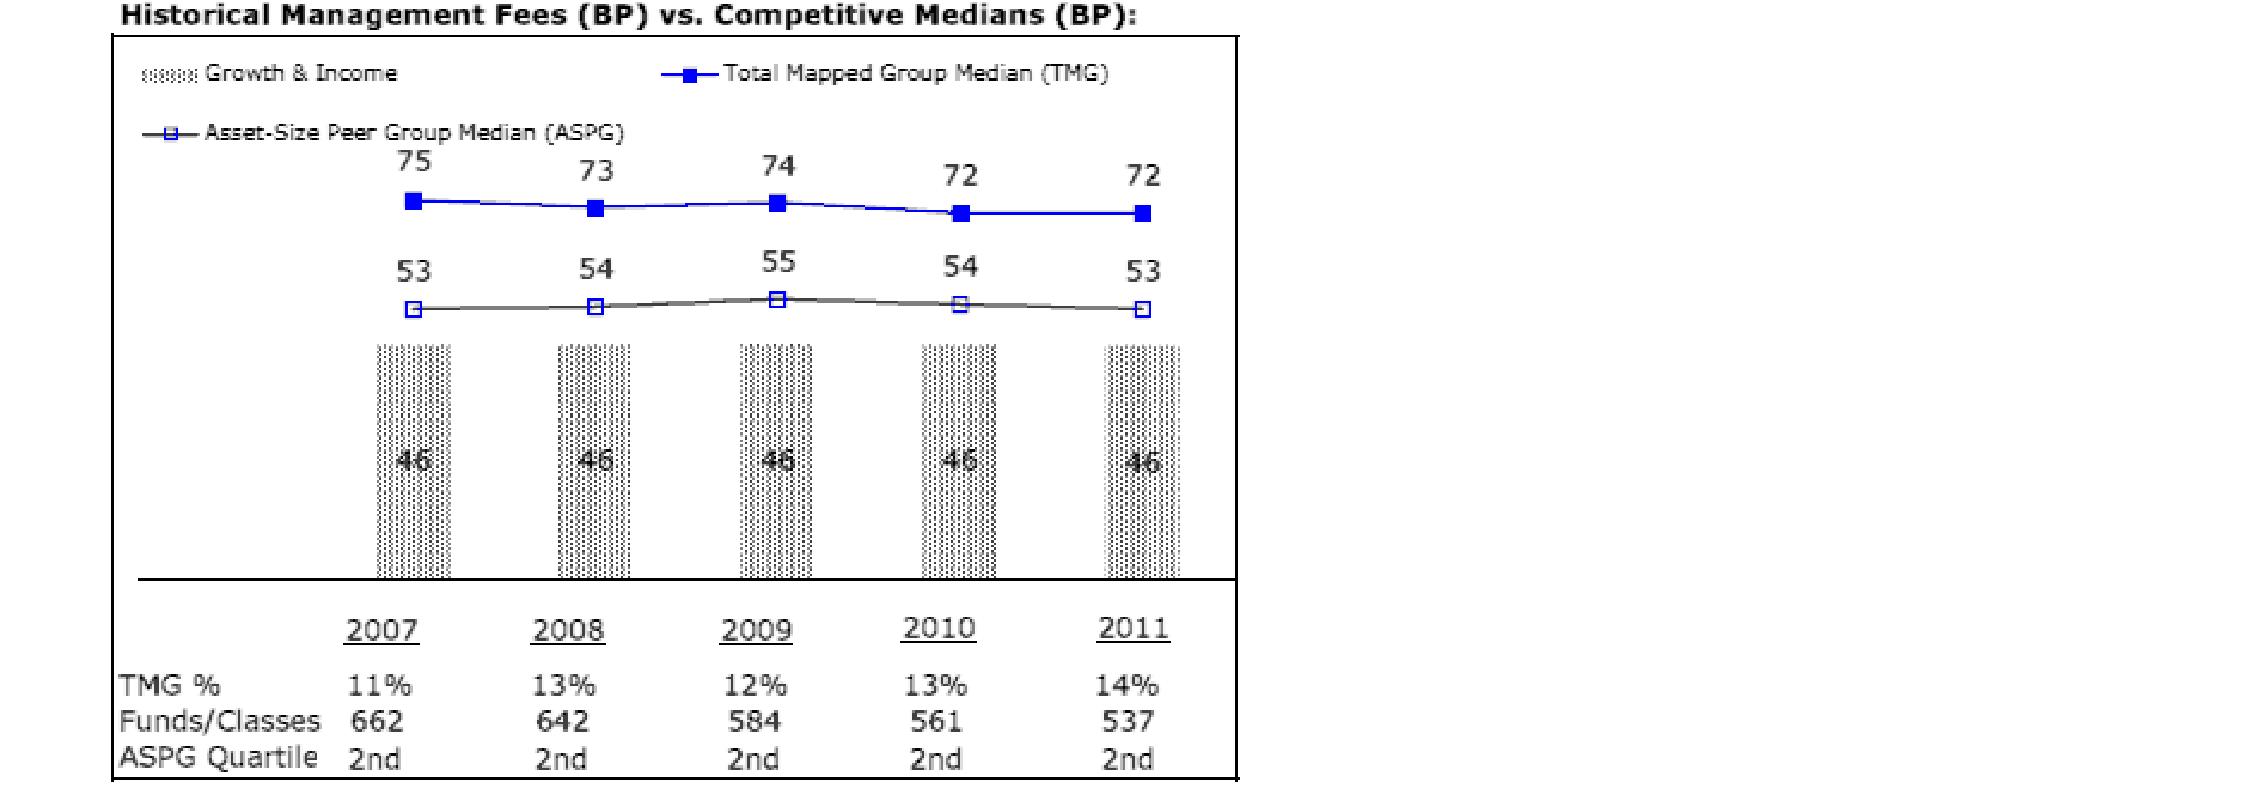
The Board noted that the fund's management fee ranked below the median of its Total Mapped Group and below the median of its ASPG for 2011.
Annual Report
Board Approval of Investment Advisory Contracts and
Management Fees - continued
Based on its review, the Board concluded that the fund's management fee is fair and reasonable in light of the services that the fund receives and the other factors considered.
Total Expense Ratio. In its review of each class's total expense ratio, the Board considered the fund's management fee as well as other fund or class expenses, as applicable, such as transfer agent fees, pricing and bookkeeping fees, and custodial, legal, and audit fees. The Board also noted the effects of any waivers and reimbursements on fees and expenses. As part of its review, the Board also considered the current and historical total expense ratios of each class of the fund compared to competitive fund median expenses. Each class of the fund is compared to those funds and classes in the Total Mapped Group (used by the Board for management fee comparisons) that have a similar sales load structure.
The Board noted that the total expense ratio of each class ranked below its competitive median for 2011.
Fees Charged to Other Fidelity Clients. The Board also considered Fidelity fee structures and other information with respect to clients of FMR and its affiliates, such as other mutual funds advised or subadvised by FMR or its affiliates, pension plan clients, and other institutional clients. The Board noted the findings of the 2010 ad hoc joint committee (created with the board of other Fidelity funds), which reviewed and compared Fidelity's institutional investment advisory business with its business of providing services to the Fidelity funds, including the differences in services provided, fees charged, and costs incurred, as well as competition in their respective marketplaces.
Based on its review of total expense ratios and fees charged to other Fidelity clients, the Board concluded that the total expense ratio of each class of the fund was reasonable in light of the services that the fund and its shareholders receive and the other factors considered.
Costs of the Services and Profitability. The Board considered the revenues earned and the expenses incurred by Fidelity in conducting the business of developing, marketing, distributing, managing, administering and servicing the fund and its shareholders. The Board also considered the level of Fidelity's profits in respect of all the Fidelity funds.
On an annual basis, FMR presents to the Board Fidelity's profitability for the fund. Fidelity calculates the profitability for each fund, as well as aggregate profitability for groups of Fidelity funds and all Fidelity funds, using a series of detailed revenue and cost allocation methodologies which originate with the books and records of Fidelity on which Fidelity's audited financial statements are based. The Audit Committee of the Board reviews any significant changes from the prior year's methodologies.
PricewaterhouseCoopers LLP (PwC), independent registered public accounting firm and auditor to Fidelity and certain Fidelity funds, has been engaged annually by the Board as part of the Board's assessment of Fidelity's profitability analysis. PwC's engagement includes the review and assessment of Fidelity's methodologies used in determining the revenues and expenses attributable to Fidelity's mutual fund business, and completion of agreed-upon procedures surrounding the mathematical accuracy of fund profitability and its conformity to allocation methodologies. After considering PwC's reports issued under the engagement and information provided by Fidelity, the Board concluded that while other allocation methods may also be reasonable, Fidelity's profitability methodologies are reasonable in all material respects.
Annual Report
The Board also reviewed Fidelity's non-fund businesses and fall-out benefits related to the mutual fund business as well as cases where Fidelity's affiliates may benefit from or be related to the fund's business.
The Board considered the costs of the services provided by and the profits realized by Fidelity in connection with the operation of the fund and was satisfied that the profitability was not excessive in the circumstances.
Economies of Scale. The Board considered whether there have been economies of scale in respect of the management of the Fidelity funds, whether the Fidelity funds (including the fund) have appropriately benefited from any such economies of scale, and whether there is potential for realization of any further economies of scale. The Board considered the extent to which the fund will benefit from economies of scale through increased services to the fund, through waivers or reimbursements, or through fee or expense reductions. The Board also noted that in 2009, it and the board of other Fidelity funds created an ad hoc committee (the Economies of Scale Committee) to analyze whether FMR attains economies of scale in respect of the management and servicing of the Fidelity funds, whether the Fidelity funds have appropriately benefited from such economies of scale, and whether there is potential for realization of any further economies of scale.
The Board recognized that the fund's management contract incorporates a "group fee" structure, which provides for lower group fee rates as total fund assets under FMR's management increase, and for higher group fee rates as total fund assets under FMR's management decrease. FMR calculates the group fee rates based on a tiered asset "breakpoint" schedule that varies based on asset class. The Board considered that the group fee is designed to deliver the benefits of economies of scale to fund shareholders when total Fidelity fund assets increase, even if assets of any particular fund are unchanged or have declined, because some portion of Fidelity's costs are attributable to services provided to all Fidelity funds, and all funds benefit if those costs can be allocated among more assets. The Board concluded that, given the group fee structure, fund shareholders will benefit from lower management fees as assets under FMR's management increase at the fund complex level, regardless of whether Fidelity achieves any such economies of scale.
Annual Report
Board Approval of Investment Advisory Contracts and
Management Fees - continued
The Board concluded, taking into account the analysis of the Economies of Scale Committee, that economies of scale, if any, are being appropriately shared between fund shareholders and Fidelity.
Additional Information Requested by the Board. In order to develop fully the factual basis for consideration of the Fidelity funds' Advisory Contracts, the Board requested and received additional information on certain topics, including (i) fund performance trends, actions to be taken by FMR to improve certain funds' overall performance, and Fidelity's long-term strategies for certain funds; (ii) the potential to further rationalize the Fidelity fund lineup with the possibility of achieving savings for the funds and Fidelity; (iii) Fidelity's compensation structure for portfolio managers and other key investment personnel; (iv) the amount of the investment that each portfolio manager has made in the Fidelity fund(s) that he or she manages; (v) the realization of fall-out benefits in certain Fidelity business units; (vi) Fidelity's group fee structures, the potential impact of regulatory changes on such structures, and the rationale for the individual fee rates of certain funds; (vii) fund profitability methodology, including Fidelity's cost allocation methodology, and the impact of certain factors on fund profitability results; (viii) trends regarding industry use of performance fee structures and the possibility of implementing performance fee structures for additional funds; and (ix) the impact of net redemptions from the Fidelity funds.
Based on its evaluation of all of the conclusions noted above, and after considering all factors it believed relevant, the Board ultimately concluded that the advisory fee structures are fair and reasonable, and that the fund's Advisory Contracts should be renewed.
Annual Report
Investment Adviser
Fidelity Management & Research Company
Boston, MA
Investment Sub-Advisers
FMR Co., Inc.
Fidelity Management & Research
(U.K.) Inc.
Fidelity Management & Research
(Japan) Inc.
Fidelity Management & Research
(Hong Kong) Limited
General Distributor
Fidelity Distributors Corporation
Smithfield, RI
Transfer and Service Agents
Fidelity Investments Institutional
Operations Company, Inc.
Boston, MA
Fidelity Service Company, Inc.
Boston, MA
Custodian
Northern Trust Company
Chicago, IL
(Fidelity Investment logo)(registered trademark)
Corporate Headquarters
82 Devonshire St., Boston, MA 02109
www.fidelity.com
GAI-K-UANN-0912
1.863229.103
Fidelity®
Growth & Income
Portfolio
Annual Report
July 31, 2012
(Fidelity Cover Art)
Contents
Performance | (Click Here) | How the fund has done over time. |
Management's Discussion of Fund Performance | (Click Here) | The Portfolio Manager's review of fund performance and strategy. |
Shareholder Expense Example | (Click Here) | An example of shareholder expenses. |
Investment Changes | (Click Here) | A summary of major shifts in the fund's investments over the past six months. |
Investments | (Click Here) | A complete list of the fund's investments with their market values. |
Financial Statements | (Click Here) | Statements of assets and liabilities, operations, and changes in net assets, as well as financial highlights. |
Notes | (Click Here) | Notes to the financial statements. |
Report of Independent Registered Public Accounting Firm | (Click Here) | |
Trustees and Officers | (Click Here) | |
Distributions | (Click Here) | |
Board Approval of Investment Advisory Contracts and Management Fees | (Click Here) | |
To view a fund's proxy voting guidelines and proxy voting record for the 12-month period ended June 30, visit http://www.fidelity.com/proxyvotingresults or visit the Securities and Exchange Commission's (SEC) web site at http://www.sec.gov. You may also call 1-800-544-8544 to request a free copy of the proxy voting guidelines.
Standard & Poor's, S&P and S&P 500 are registered service marks of The McGraw-Hill Companies, Inc. and have been licensed for use by Fidelity Distributors Corporation.
Other third party marks appearing herein are the property of their respective owners.
All other marks appearing herein are registered or unregistered trademarks or service marks of FMR LLC or an affiliated company. © 2012 FMR LLC. All rights reserved.
Annual Report
This report and the financial statements contained herein are submitted for the general information of the shareholders of the fund. This report is not authorized for distribution to prospective investors in the fund unless preceded or accompanied by an effective prospectus.
A fund files its complete schedule of portfolio holdings with the SEC for the first and third quarters of each fiscal year on Form N-Q. Forms N-Q are available on the SEC's web site at http://www.sec.gov. A fund's Forms N-Q may be reviewed and copied at the SEC's Public Reference Room in Washington, DC. Information regarding the operation of the SEC's Public Reference Room may be obtained by calling 1-800-SEC-0330. For a complete list of a fund's portfolio holdings, view the most recent holdings listing, semiannual report, or annual report on Fidelity's web site at http://www.fidelity.com, http://www.advisor.fidelity.com, or http://www.401k.com, as applicable.
NOT FDIC INSURED • MAY LOSE VALUE • NO BANK GUARANTEE
Neither the fund nor Fidelity Distributors Corporation is a bank.
Annual Report
Average annual total return reflects the change in the value of an investment, assuming reinvestment of the class' distributions from dividend income and capital gains (the profits earned upon the sale of securities that have grown in value, if any) and assuming a constant rate of performance each year. The $10,000 table and the fund's returns do not reflect the deduction of taxes that a shareholder would pay on fund distributions or the redemption of fund shares. During periods of reimbursement by Fidelity, a fund's total return will be greater than it would be had the reimbursement not occurred. How a fund did yesterday is no guarantee of how it will do tomorrow.
Average Annual Total Returns
Periods ended July 31, 2012 | Past 1
year | Past 5
years | Past 10
years |
Fidelity® Growth & Income Portfolio | 10.45% | -5.21% | 1.23% |
$10,000 Over 10 Years
Let's say hypothetically that $10,000 was invested in Fidelity® Growth & Income Portfolio, a class of the fund, on July 31, 2002. The chart shows how the value of your investment would have changed, and also shows how the S&P 500® Index performed over the same period.
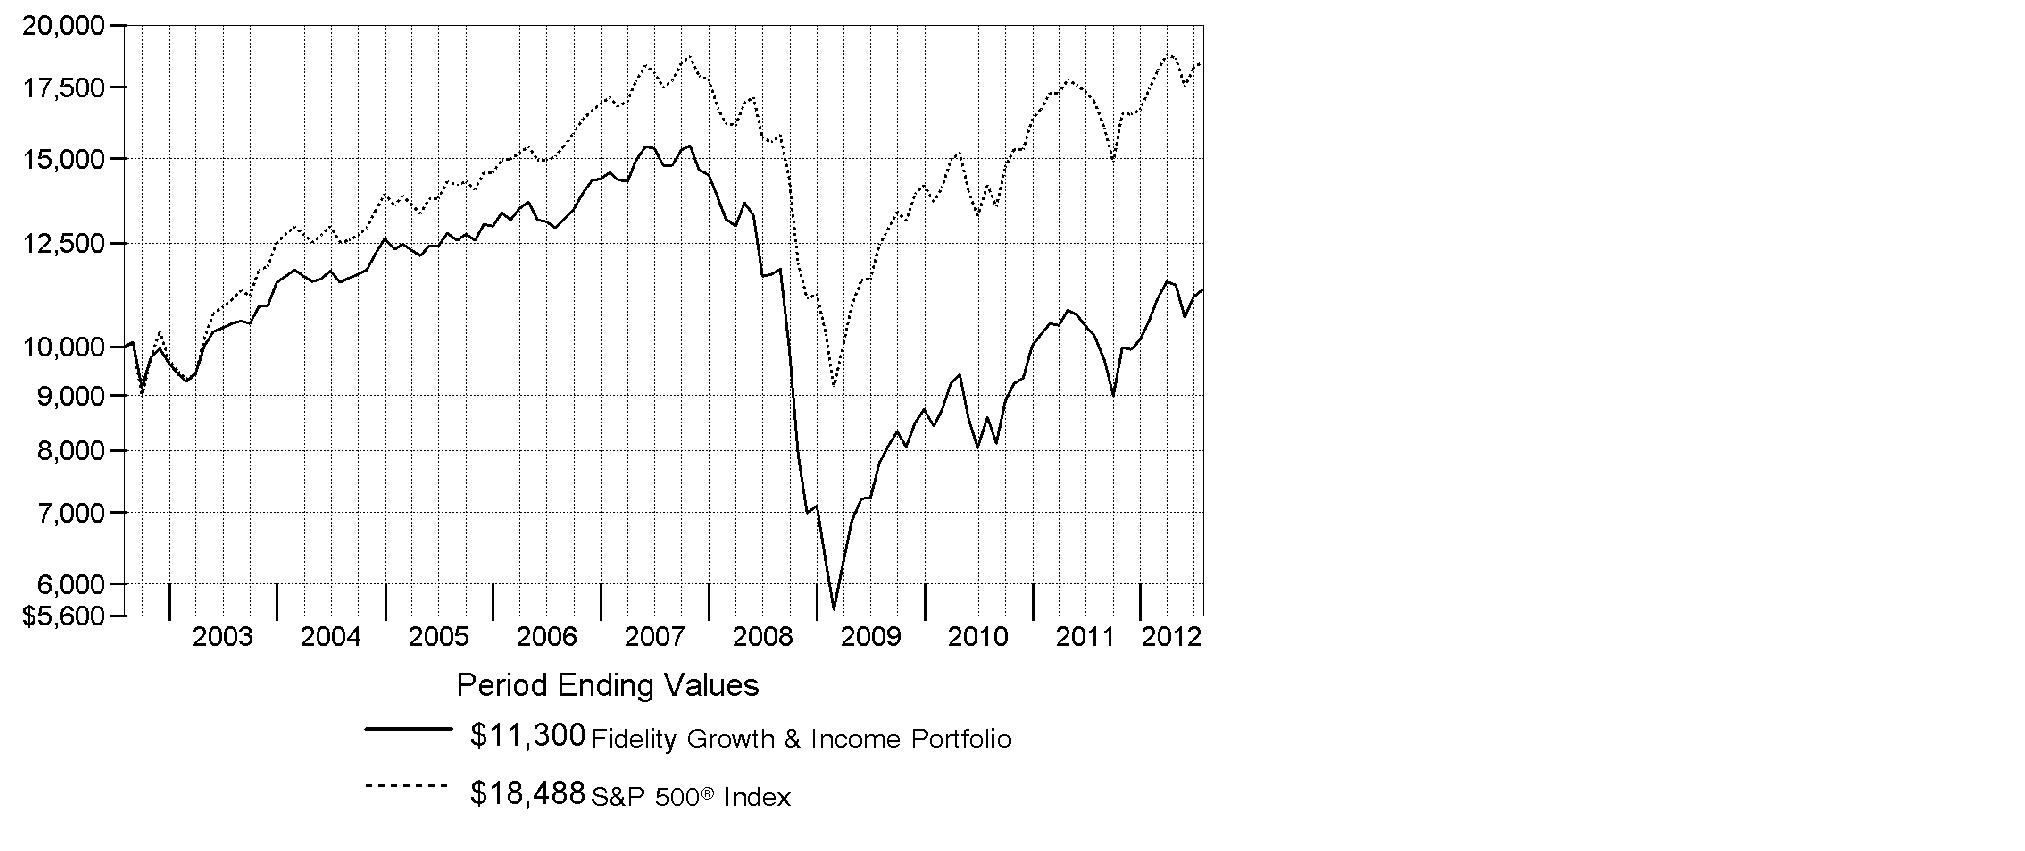
Annual Report
Market Recap: Major U.S. equity benchmarks posted solid gains for the year ending July 31, 2012, amid an uncertain investment environment. The broad-based S&P 500® Index returned 9.13%, while the blue-chip-laden Dow Jones Industrial AverageSM and technology-heavy Nasdaq Composite® Index gained 10.12% and 7.83%, respectively. Volatility spiked during the period's first half, as equities plummeted late last summer on Europe's debt woes, political wrangling over the U.S. debt ceiling and the sovereign credit-rating downgrade that followed. By October, a seemingly improved U.S. economy rejuvenated stocks, paving the way for major equity benchmarks to post their best first-quarter performance since 1998. However, more eurozone trouble, signs that the U.S. economy had turned sluggish and a slowdown in China caused stocks to slip in May, before a new wave of optimism took hold in June and July. Within the S&P 500®, more-defensive sectors such as telecommunication services (+30%) and consumer staples (+20%) fared best, while materials and energy significantly underperformed, returning -5%. Small- and mid-cap stocks trailed their less-volatile large-cap counterparts, with the Russell 2000® Index adding 0.19% and the Russell Midcap® Index rising 2.28%. Given turmoil and local currency weakness in Europe, foreign developed-markets stocks lost ground, with the MSCI® EAFE® Index returning -11.32%.
Comments from Matthew Fruhan, Portfolio Manager of Fidelity® Growth & Income Portfolio: For the year, the fund's Retail Class shares gained 10.45%, ahead of the S&P 500®. Positioning in information tech was a bright spot, especially software/services names. Investments in consumer discretionary were beneficial, especially picks in the consumer durables and apparel group. Positioning in energy and materials helped as well. Conversely, the fund was hurt by underweight positions in telecommunication services and utilities, and the health care and industrials stocks I owned did not fare well. The fund's foreign holdings weighed on performance, hampered in part by a stronger U.S. dollar. The top contributor was U.K.-based Autonomy, an enterprise software maker. The non-index stock rose sharply in August on a takeover bid from Hewlett-Packard, and I sold it after the announcement. Mortgage lender Wells Fargo was helpful, as its stock was lifted by revised earnings estimates. An overweight in MasterCard boosted performance because earnings estimates for the card-processing company increased. Conversely, my decision to not own telecom giant and index component AT&T detracted, as the stock performed well, given its high dividend yield and payout ratio. In financials, JPMorgan Chase underperformed during the period, due in part to new capital standards for financial firms.
The views expressed above reflect those of the portfolio manager(s) only through the end of the period as stated on the cover of this report and do not necessarily represent the views of Fidelity or any other person in the Fidelity organization. Any such views are subject to change at any time based upon market or other conditions and Fidelity disclaims any responsibility to update such views. These views may not be relied on as investment advice and, because investment decisions for a Fidelity fund are based on numerous factors, may not be relied on as an indication of trading intent on behalf of any Fidelity fund.
Annual Report
Shareholder Expense Example
As a shareholder of the Fund, you incur two types of costs: (1) transaction costs, and (2) ongoing costs, including management fees and other Fund expenses. This Example is intended to help you understand your ongoing costs (in dollars) of investing in the Fund and to compare these costs with the ongoing costs of investing in other mutual funds.
The Example is based on an investment of $1,000 invested at the beginning of the period and held for the entire period (February 1, 2012 to July 31, 2012).
Actual Expenses
The first line of the accompanying table for each class of the Fund provides information about actual account values and actual expenses. You may use the information in this line, together with the amount you invested, to estimate the expenses that you paid over the period. Simply divide your account value by $1,000.00 (for example, an $8,600 account value divided by $1,000.00 = 8.6), then multiply the result by the number in the first line for a class of the Fund under the heading entitled "Expenses Paid During Period" to estimate the expenses you paid on your account during this period. A small balance maintenance fee of $12.00 that is charged once a year may apply for certain accounts with a value of less than $2,000. This fee is not included in the table below. If it was, the estimate of expenses you paid during the period would be higher, and your ending account value lower, by this amount. In addition, the Fund, as a shareholder in the underlying Fidelity Central Funds, will indirectly bear its pro-rata share of the fees and expenses incurred by the underlying Fidelity Central Funds. These fees and expenses are not included in the Fund's annualized expense ratio used to calculate the expense estimate in the table below.
Hypothetical Example for Comparison Purposes
The second line of the accompanying table for each class of the Fund provides information about hypothetical account values and hypothetical expenses based on a Class' actual expense ratio and an assumed rate of return of 5% per year before expenses, which is not the Class' actual return. The hypothetical account values and expenses may not be used to estimate the actual ending account balance or expenses you paid for the period. You may use this information to compare the ongoing costs of investing in the Fund and other funds. To do so, compare this 5% hypothetical example with the 5% hypothetical examples that appear in the shareholder reports of the other funds. A small balance maintenance fee of $12.00 that is charged once a year may apply for certain accounts with a value of less than $2,000. This fee is not included in the table below. If it was, the estimate of expenses you paid during the period would be higher, and your ending account value lower, by this amount. In addition, the Fund, as a shareholder in the underlying Fidelity Central Funds, will indirectly bear its pro-rata share of the fees and expenses incurred by the underlying Fidelity Central Funds. These fees and expenses are not included in the Fund's annualized expense ratio used to calculate the expense estimate in the table below.
Please note that the expenses shown in the table are meant to highlight your ongoing costs only and do not reflect any transaction costs. Therefore, the second line of the table is useful in comparing ongoing costs only, and will not help you determine the relative total costs of owning different funds.
Annual Report
Shareholder Expense Example - continued
| Annualized Expense Ratio | Beginning
Account Value
February 1, 2012 | Ending
Account Value
July 31, 2012 | Expenses Paid
During Period*
February 1, 2012
to July 31, 2012 |
Growth & Income | .70% | | | |
Actual | | $ 1,000.00 | $ 1,068.80 | $ 3.60 |
HypotheticalA | | $ 1,000.00 | $ 1,021.38 | $ 3.52 |
Class K | .54% | | | |
Actual | | $ 1,000.00 | $ 1,069.80 | $ 2.78 |
HypotheticalA | | $ 1,000.00 | $ 1,022.18 | $ 2.72 |
A 5% return per year before expenses
* Expenses are equal to each Class' annualized expense ratio, multiplied by the average account value over the period, multiplied by 182/366 (to reflect the one-half year period).
Annual Report
Investment Changes (Unaudited)
Top Ten Stocks as of July 31, 2012 |
| % of fund's
net assets | % of fund's net assets
6 months ago |
Apple, Inc. | 5.2 | 4.1 |
Wells Fargo & Co. | 3.6 | 3.5 |
JPMorgan Chase & Co. | 3.6 | 3.6 |
Chevron Corp. | 3.5 | 3.5 |
General Electric Co. | 2.5 | 2.2 |
Exxon Mobil Corp. | 2.5 | 3.2 |
Procter & Gamble Co. | 2.1 | 1.7 |
Comcast Corp. Class A | 2.1 | 1.6 |
Merck & Co., Inc. | 2.0 | 1.8 |
Microsoft Corp. | 1.9 | 1.7 |
| 29.0 | |
Top Five Market Sectors as of July 31, 2012 |
| % of fund's
net assets | % of fund's net assets
6 months ago |
Information Technology | 17.5 | 17.6 |
Financials | 16.8 | 18.5 |
Industrials | 12.8 | 13.6 |
Consumer Discretionary | 12.7 | 13.7 |
Energy | 12.4 | 11.6 |
Asset Allocation (% of fund's net assets) |
As of July 31, 2012 * | As of January 31, 2012 ** |
 | Stocks 98.4% | | | Stocks 98.7% | |
 | Bonds 0.2% | | | Bonds 0.1% | |
 | Convertible
Securities 0.8% | | | Convertible
Securities 1.0% | |
 | Short-Term Investments and Net Other Assets (Liabilities) 0.6% | | | Short-Term Investments and Net Other Assets (Liabilities) 0.2% | |
* Foreign investments | 11.8% | | ** Foreign investments | 13.4% | |

Annual Report
Investments July 31, 2012
Showing Percentage of Net Assets
Common Stocks - 97.9% |
| Shares | | Value (000s) |
CONSUMER DISCRETIONARY - 12.2% |
Auto Components - 0.5% |
Gentex Corp. | 867,302 | | $ 13,886 |
Johnson Controls, Inc. | 466,265 | | 11,493 |
| | 25,379 |
Automobiles - 0.3% |
Bayerische Motoren Werke AG (BMW) | 234,137 | | 17,507 |
Distributors - 0.2% |
Genuine Parts Co. | 26,500 | | 1,697 |
Li & Fung Ltd. | 1,452,000 | | 2,869 |
LKQ Corp. (a) | 160,850 | | 5,683 |
| | 10,249 |
Diversified Consumer Services - 0.1% |
Strayer Education, Inc. (d) | 95,560 | | 6,943 |
Hotels, Restaurants & Leisure - 1.3% |
McDonald's Corp. | 668,936 | | 59,776 |
Yum! Brands, Inc. | 186,812 | | 12,113 |
| | 71,889 |
Household Durables - 1.2% |
D.R. Horton, Inc. | 412,009 | | 7,264 |
Ryland Group, Inc. | 1,231,662 | | 29,412 |
Toll Brothers, Inc. (a) | 1,080,307 | | 31,513 |
| | 68,189 |
Leisure Equipment & Products - 0.4% |
Hasbro, Inc. (d) | 686,238 | | 24,581 |
Media - 5.1% |
Comcast Corp. Class A | 3,549,300 | | 115,530 |
The Walt Disney Co. | 583,023 | | 28,650 |
Thomson Reuters Corp. (d) | 501,000 | | 14,208 |
Time Warner Cable, Inc. | 194,624 | | 16,529 |
Time Warner, Inc. | 2,353,299 | | 92,061 |
Viacom, Inc. Class B (non-vtg.) | 371,218 | | 17,340 |
| | 284,318 |
Multiline Retail - 1.5% |
Target Corp. | 1,421,881 | | 86,237 |
Common Stocks - continued |
| Shares | | Value (000s) |
CONSUMER DISCRETIONARY - continued |
Specialty Retail - 1.6% |
Lowe's Companies, Inc. | 3,227,683 | | $ 81,886 |
Staples, Inc. | 715,370 | | 9,114 |
| | 91,000 |
TOTAL CONSUMER DISCRETIONARY | | 686,292 |
CONSUMER STAPLES - 11.8% |
Beverages - 3.7% |
Britvic PLC | 259,200 | | 1,223 |
Dr Pepper Snapple Group, Inc. | 917,035 | | 41,798 |
Molson Coors Brewing Co. Class B | 67,100 | | 2,840 |
PepsiCo, Inc. | 1,016,780 | | 73,950 |
The Coca-Cola Co. | 1,110,034 | | 89,691 |
| | 209,502 |
Food & Staples Retailing - 1.6% |
CVS Caremark Corp. | 690,304 | | 31,236 |
Safeway, Inc. | 408,196 | | 6,347 |
Walgreen Co. | 1,448,473 | | 52,666 |
| | 90,249 |
Food Products - 0.5% |
Kellogg Co. | 624,036 | | 29,767 |
Household Products - 3.9% |
Colgate-Palmolive Co. | 295,456 | | 31,720 |
Kimberly-Clark Corp. | 767,867 | | 66,735 |
Procter & Gamble Co. | 1,863,502 | | 120,270 |
| | 218,725 |
Tobacco - 2.1% |
British American Tobacco PLC sponsored ADR | 693,359 | | 73,503 |
Lorillard, Inc. | 333,994 | | 42,965 |
| | 116,468 |
TOTAL CONSUMER STAPLES | | 664,711 |
ENERGY - 12.3% |
Energy Equipment & Services - 1.6% |
Exterran Partners LP | 372,307 | | 8,191 |
Fugro NV (Certificaten Van Aandelen) unit | 23,289 | | 1,526 |
Common Stocks - continued |
| Shares | | Value (000s) |
ENERGY - continued |
Energy Equipment & Services - continued |
Halliburton Co. | 1,475,762 | | $ 48,892 |
Schlumberger Ltd. | 400,855 | | 28,565 |
| | 87,174 |
Oil, Gas & Consumable Fuels - 10.7% |
Apache Corp. | 136,471 | | 11,753 |
ARC Resources Ltd. (d) | 467,300 | | 11,663 |
Atlas Pipeline Partners, LP | 362,492 | | 12,053 |
Bonavista Energy Corp. (d) | 151,200 | | 2,749 |
Bonavista Energy Corp. (e) | 220,600 | | 4,010 |
BP PLC sponsored ADR | 613,463 | | 24,477 |
Chevron Corp. | 1,803,216 | | 197,596 |
Exxon Mobil Corp. | 1,611,336 | | 139,945 |
Holly Energy Partners LP | 30,000 | | 1,978 |
Legacy Reserves LP | 98,030 | | 2,591 |
Markwest Energy Partners LP | 189,416 | | 9,958 |
Occidental Petroleum Corp. | 376,100 | | 32,732 |
Penn West Petroleum Ltd. | 784,600 | | 10,703 |
Royal Dutch Shell PLC Class A (United Kingdom) | 2,111,992 | | 71,772 |
Suncor Energy, Inc. | 1,459,500 | | 44,621 |
Williams Companies, Inc. | 734,880 | | 23,362 |
| | 601,963 |
TOTAL ENERGY | | 689,137 |
FINANCIALS - 16.6% |
Capital Markets - 3.3% |
Apollo Investment Corp. | 252,430 | | 1,939 |
Ashmore Group PLC | 652,300 | | 3,311 |
BlackRock, Inc. Class A | 85,300 | | 14,523 |
Charles Schwab Corp. | 3,600,390 | | 45,473 |
Greenhill & Co., Inc. (d) | 354,300 | | 14,073 |
ICAP PLC | 1,233,400 | | 6,157 |
KKR & Co. LP | 1,839,620 | | 25,736 |
Morgan Stanley | 1,910,151 | | 26,093 |
Northern Trust Corp. | 685,951 | | 31,142 |
TD Ameritrade Holding Corp. | 140,000 | | 2,229 |
The Blackstone Group LP | 1,131,217 | | 15,667 |
| | 186,343 |
Commercial Banks - 6.2% |
BB&T Corp. | 770,416 | | 24,168 |
Common Stocks - continued |
| Shares | | Value (000s) |
FINANCIALS - continued |
Commercial Banks - continued |
City National Corp. | 157,789 | | $ 7,776 |
Comerica, Inc. | 176,743 | | 5,339 |
First Niagara Financial Group, Inc. | 389,465 | | 2,952 |
Standard Chartered PLC (United Kingdom) | 203,256 | | 4,667 |
SunTrust Banks, Inc. | 1,466,338 | | 34,679 |
U.S. Bancorp | 1,986,112 | | 66,535 |
Wells Fargo & Co. | 5,912,286 | | 199,894 |
| | 346,010 |
Diversified Financial Services - 5.7% |
Citigroup, Inc. | 2,118,848 | | 57,484 |
CME Group, Inc. | 565,345 | | 29,460 |
JPMorgan Chase & Co. | 5,518,380 | | 198,662 |
KKR Financial Holdings LLC | 3,603,418 | | 32,863 |
| | 318,469 |
Insurance - 0.8% |
MetLife, Inc. | 765,266 | | 23,547 |
MetLife, Inc. unit (a) | 324,700 | | 20,320 |
| | 43,867 |
Real Estate Investment Trusts - 0.5% |
Digital Realty Trust, Inc. | 124,900 | | 9,751 |
Sun Communities, Inc. | 221,301 | | 10,310 |
Two Harbors Investment Corp. | 678,900 | | 7,787 |
| | 27,848 |
Real Estate Management & Development - 0.0% |
Beazer Pre-Owned Rental Homes, Inc. (f) | 144,300 | | 2,886 |
Thrifts & Mortgage Finance - 0.1% |
MGIC Investment Corp. (a) | 175,288 | | 422 |
Radian Group, Inc. | 1,357,637 | | 3,801 |
| | 4,223 |
TOTAL FINANCIALS | | 929,646 |
HEALTH CARE - 11.1% |
Biotechnology - 1.0% |
Amgen, Inc. | 656,004 | | 54,186 |
ARIAD Pharmaceuticals, Inc. (a) | 145,281 | | 2,779 |
| | 56,965 |
Common Stocks - continued |
| Shares | | Value (000s) |
HEALTH CARE - continued |
Health Care Equipment & Supplies - 0.2% |
Baxter International, Inc. | 153,700 | | $ 8,993 |
St. Jude Medical, Inc. | 143,509 | | 5,361 |
| | 14,354 |
Health Care Providers & Services - 2.1% |
Aetna, Inc. | 528,073 | | 19,042 |
McKesson Corp. | 563,764 | | 51,150 |
WellPoint, Inc. | 864,990 | | 46,095 |
| | 116,287 |
Health Care Technology - 0.2% |
Quality Systems, Inc. | 705,651 | | 11,403 |
Life Sciences Tools & Services - 0.2% |
QIAGEN NV (a) | 591,083 | | 10,409 |
Pharmaceuticals - 7.4% |
Abbott Laboratories | 653,427 | | 43,329 |
AstraZeneca PLC sponsored ADR | 163,600 | | 7,658 |
Cardiome Pharma Corp. (a) | 935,300 | | 299 |
Eli Lilly & Co. | 507,427 | | 22,342 |
GlaxoSmithKline PLC sponsored ADR | 661,354 | | 30,422 |
Johnson & Johnson | 1,407,352 | | 97,417 |
Merck & Co., Inc. | 2,521,679 | | 111,383 |
Novartis AG sponsored ADR | 189,800 | | 11,126 |
Pfizer, Inc. | 3,009,854 | | 72,357 |
Sanofi SA | 145,647 | | 11,883 |
Teva Pharmaceutical Industries Ltd. sponsored ADR | 181,095 | | 7,405 |
| | 415,621 |
TOTAL HEALTH CARE | | 625,039 |
INDUSTRIALS - 12.7% |
Aerospace & Defense - 3.0% |
Honeywell International, Inc. | 360,657 | | 20,936 |
Raytheon Co. | 495,812 | | 27,508 |
Rockwell Collins, Inc. | 755,874 | | 38,225 |
The Boeing Co. | 497,668 | | 36,783 |
United Technologies Corp. | 599,200 | | 44,604 |
| | 168,056 |
Common Stocks - continued |
| Shares | | Value (000s) |
INDUSTRIALS - continued |
Air Freight & Logistics - 1.1% |
C.H. Robinson Worldwide, Inc. | 344,739 | | $ 18,219 |
United Parcel Service, Inc. Class B | 547,528 | | 41,399 |
| | 59,618 |
Building Products - 0.5% |
Compagnie de St. Gobain | 96,200 | | 2,907 |
Owens Corning (a) | 1,037,013 | | 27,854 |
| | 30,761 |
Commercial Services & Supplies - 0.8% |
Aggreko PLC | 42,400 | | 1,357 |
Healthcare Services Group, Inc. | 26,048 | | 565 |
Interface, Inc. | 839,009 | | 11,125 |
Republic Services, Inc. | 1,075,076 | | 31,102 |
| | 44,149 |
Electrical Equipment - 0.4% |
Emerson Electric Co. | 468,219 | | 22,367 |
Industrial Conglomerates - 3.7% |
Danaher Corp. | 627,000 | | 33,112 |
DCC PLC (Ireland) | 125,300 | | 3,113 |
General Electric Co. | 6,777,032 | | 140,623 |
Koninklijke Philips Electronics NV (depositary receipt) (NY Reg.) | 1,290,997 | | 28,415 |
Siemens AG sponsored ADR | 37,713 | | 3,194 |
| | 208,457 |
Machinery - 1.7% |
Cummins, Inc. | 32,134 | | 3,082 |
Douglas Dynamics, Inc. | 959,138 | | 12,824 |
Illinois Tool Works, Inc. | 135,986 | | 7,389 |
Ingersoll-Rand PLC | 766,475 | | 32,506 |
Lincoln Electric Holdings, Inc. | 99,834 | | 3,981 |
Schindler Holding AG (participation certificate) | 66,193 | | 7,750 |
Stanley Black & Decker, Inc. | 403,899 | | 27,017 |
| | 94,549 |
Marine - 0.2% |
Irish Continental Group PLC unit | 121,800 | | 2,239 |
Kuehne & Nagel International AG | 98,220 | | 11,197 |
| | 13,436 |
Professional Services - 0.7% |
Amadeus Fire AG | 67,931 | | 2,878 |
Common Stocks - continued |
| Shares | | Value (000s) |
INDUSTRIALS - continued |
Professional Services - continued |
Bureau Veritas SA | 186,295 | | $ 16,476 |
Michael Page International PLC | 3,238,548 | | 18,660 |
| | 38,014 |
Road & Rail - 0.1% |
J.B. Hunt Transport Services, Inc. | 52,784 | | 2,904 |
Kansas City Southern | 68,200 | | 4,965 |
| | 7,869 |
Trading Companies & Distributors - 0.5% |
Aircastle Ltd. | 2,800 | | 33 |
W.W. Grainger, Inc. | 61,072 | | 12,509 |
Watsco, Inc. | 196,915 | | 13,378 |
| | 25,920 |
TOTAL INDUSTRIALS | | 713,196 |
INFORMATION TECHNOLOGY - 17.5% |
Communications Equipment - 1.3% |
Cisco Systems, Inc. | 2,500,308 | | 39,880 |
Juniper Networks, Inc. (a) | 382,678 | | 6,708 |
QUALCOMM, Inc. | 465,904 | | 27,805 |
| | 74,393 |
Computers & Peripherals - 6.0% |
Apple, Inc. | 479,931 | | 293,125 |
EMC Corp. (a) | 1,065,500 | | 27,927 |
Hewlett-Packard Co. | 785,395 | | 14,326 |
| | 335,378 |
Internet Software & Services - 1.7% |
Google, Inc. Class A (a) | 151,563 | | 95,935 |
IT Services - 5.8% |
Cognizant Technology Solutions Corp. Class A (a) | 392,775 | | 22,298 |
Fidelity National Information Services, Inc. | 958,037 | | 30,121 |
IBM Corp. | 143,050 | | 28,035 |
MasterCard, Inc. Class A | 148,950 | | 65,027 |
Paychex, Inc. | 2,810,699 | | 91,882 |
The Western Union Co. | 2,099,659 | | 36,597 |
Total System Services, Inc. | 75,900 | | 1,795 |
Visa, Inc. Class A | 394,113 | | 50,868 |
| | 326,623 |
Common Stocks - continued |
| Shares | | Value (000s) |
INFORMATION TECHNOLOGY - continued |
Semiconductors & Semiconductor Equipment - 0.2% |
Analog Devices, Inc. | 260,665 | | $ 10,187 |
Software - 2.5% |
Microsoft Corp. | 3,672,239 | | 108,221 |
Oracle Corp. | 729,890 | | 22,043 |
Royalblue Group PLC | 466,036 | | 10,244 |
| | 140,508 |
TOTAL INFORMATION TECHNOLOGY | | 983,024 |
MATERIALS - 0.5% |
Chemicals - 0.5% |
Air Products & Chemicals, Inc. | 88,397 | | 7,110 |
E.I. du Pont de Nemours & Co. | 184,883 | | 9,189 |
Syngenta AG (Switzerland) | 37,390 | | 12,749 |
| | 29,048 |
Metals & Mining - 0.0% |
Reliance Steel & Aluminum Co. | 32,815 | | 1,689 |
TOTAL MATERIALS | | 30,737 |
TELECOMMUNICATION SERVICES - 0.8% |
Diversified Telecommunication Services - 0.0% |
Cogent Communications Group, Inc. (a) | 17,630 | | 326 |
Koninklijke KPN NV | 1 | | 0* |
| | 326 |
Wireless Telecommunication Services - 0.8% |
Vodafone Group PLC sponsored ADR | 1,463,120 | | 42,065 |
TOTAL TELECOMMUNICATION SERVICES | | 42,391 |
UTILITIES - 2.4% |
Electric Utilities - 1.0% |
American Electric Power Co., Inc. | 193,162 | | 8,159 |
Duke Energy Corp. | 47,200 | | 3,199 |
Edison International | 56,700 | | 2,618 |
FirstEnergy Corp. | 437,958 | | 21,994 |
NextEra Energy, Inc. | 157,270 | | 11,150 |
PPL Corp. | 368,353 | | 10,645 |
| | 57,765 |
Common Stocks - continued |
| Shares | | Value (000s) |
UTILITIES - continued |
Gas Utilities - 0.2% |
National Fuel Gas Co. | 157,115 | | $ 7,689 |
Multi-Utilities - 1.2% |
National Grid PLC | 3,278,374 | | 34,006 |
PG&E Corp. | 287,716 | | 13,281 |
Sempra Energy | 173,809 | | 12,238 |
TECO Energy, Inc. | 444,748 | | 8,090 |
| | 67,615 |
TOTAL UTILITIES | | 133,069 |
TOTAL COMMON STOCKS (Cost $5,087,503) |
5,497,242
|
Preferred Stocks - 1.2% |
| | | |
Convertible Preferred Stocks - 0.7% |
HEALTH CARE - 0.5% |
Health Care Equipment & Supplies - 0.5% |
Alere, Inc. 3.00% | 138,159 | | 28,937 |
INDUSTRIALS - 0.1% |
Aerospace & Defense - 0.1% |
United Technologies Corp. 7.50% | 110,600 | | 5,834 |
UTILITIES - 0.1% |
Electric Utilities - 0.1% |
PPL Corp. 8.75% | 104,300 | | 5,662 |
TOTAL CONVERTIBLE PREFERRED STOCKS | | 40,433 |
Nonconvertible Preferred Stocks - 0.5% |
CONSUMER DISCRETIONARY - 0.5% |
Automobiles - 0.5% |
Volkswagen AG | 142,275 | | 24,333 |
TOTAL PREFERRED STOCKS (Cost $70,721) |
64,766
|
Corporate Bonds - 0.3% |
| Principal Amount (000s) | | Value (000s) |
Convertible Bonds - 0.1% |
ENERGY - 0.1% |
Oil, Gas & Consumable Fuels - 0.1% |
Amyris, Inc. 3% 2/27/17 (f) | | $ 5,615 | | $ 4,435 |
Nonconvertible Bonds - 0.2% |
FINANCIALS - 0.2% |
Thrifts & Mortgage Finance - 0.2% |
Radian Group, Inc.: | | | | |
5.375% 6/15/15 | | 4,050 | | 2,946 |
5.625% 2/15/13 | | 8,060 | | 7,879 |
| | 10,825 |
TOTAL CORPORATE BONDS (Cost $15,351) |
15,260
|
Money Market Funds - 1.1% |
| Shares | | |
Fidelity Cash Central Fund, 0.17% (b) | 28,150,691 | | 28,151 |
Fidelity Securities Lending Cash Central Fund, 0.18% (b)(c) | 35,402,415 | | 35,402 |
TOTAL MONEY MARKET FUNDS (Cost $63,553) |
63,553
|
TOTAL INVESTMENT PORTFOLIO - 100.5% (Cost $5,237,128) | | 5,640,821 |
NET OTHER ASSETS (LIABILITIES) - (0.5)% | | (26,212) |
NET ASSETS - 100% | $ 5,614,609 |
Legend |
(a) Non-income producing |
(b) Affiliated fund that is available only to investment companies and other accounts managed by Fidelity Investments. The rate quoted is the annualized seven-day yield of the fund at period end. A complete unaudited listing of the fund's holdings as of its most recent quarter end is available upon request. In addition, each Fidelity Central Fund's financial statements, which are not covered by the Fund's Report of Independent Registered Public Accounting Firm, are available on the SEC's website or upon request. |
(c) Investment made with cash collateral received from securities on loan. |
(d) Security or a portion of the security is on loan at period end. |
(e) Security exempt from registration under Rule 144A of the Securities Act of 1933. These securities may be resold in transactions exempt from registration, normally to qualified institutional buyers. At the end of the period, the value of these securities amounted to $4,010,000 or 0.1% of net assets. |
(f) Restricted securities - Investment in securities not registered under the Securities Act of 1933 (excluding 144A issues). At the end of the period, the value of restricted securities (excluding 144A issues) amounted to $7,321,000 or 0.1% of net assets. |
Additional information on each restricted holding is as follows: |
Security | Acquisition Date | Acquisition Cost (000s) |
Amyris, Inc. 3% 2/27/17 | 2/27/12 | $ 5,615 |
Beazer Pre-Owned Rental Homes, Inc. | 5/3/12 | $ 2,886 |
* Amount represents less than $1,000 |
Affiliated Central Funds |
Information regarding fiscal year to date income earned by the Fund from investments in Fidelity Central Funds is as follows: |
Fund | Income earned
(Amounts in thousands) |
Fidelity Cash Central Fund | $ 21 |
Fidelity Securities Lending Cash Central Fund | 553 |
Total | $ 574 |
Other Information |
The following is a summary of the inputs used, as of July 31, 2012, involving the Fund's assets and liabilities carried at fair value. The inputs or methodology used for valuing securities may not be an indication of the risk associated with investing in those securities. For more information on valuation inputs, and their aggregation into the levels used in the table below, please refer to the Security Valuation section in the accompanying Notes to Financial Statements. |
Valuation Inputs at Reporting Date: |
Description
(Amounts in thousands) | Total | Level 1 | Level 2 | Level 3 |
Investments in Securities: | | | | |
Equities: | | | | |
Consumer Discretionary | $ 710,625 | $ 710,625 | $ - | $ - |
Consumer Staples | 664,711 | 664,711 | - | - |
Energy | 689,137 | 617,365 | 71,772 | - |
Financials | 929,646 | 906,440 | 20,320 | 2,886 |
Health Care | 653,976 | 642,093 | 11,883 | - |
Industrials | 719,030 | 719,030 | - | - |
Information Technology | 983,024 | 983,024 | - | - |
Materials | 30,737 | 17,988 | 12,749 | - |
Telecommunication Services | 42,391 | 42,391 | - | - |
Utilities | 138,731 | 99,063 | 39,668 | - |
Corporate Bonds | 15,260 | - | 15,260 | - |
Money Market Funds | 63,553 | 63,553 | - | - |
Total Investments in Securities: | $ 5,640,821 | $ 5,466,283 | $ 171,652 | $ 2,886 |
Distribution of investments by country or territory of incorporation, as a percentage of total net assets, is as follows. (Unaudited) |
United States of America | 88.2% |
United Kingdom | 5.9% |
Canada | 1.7% |
Germany | 1.0% |
Others (Individually Less Than 1%) | 3.2% |
| 100.0% |
See accompanying notes which are an integral part of the financial statements.
Annual Report
Statement of Assets and Liabilities
Amounts in thousands (except per-share amounts) | July 31, 2012 |
| | |
Assets | | |
Investment in securities, at value (including securities loaned of $33,450) - See accompanying schedule: Unaffiliated issuers (cost $5,173,575) | $ 5,577,268 | |
Fidelity Central Funds (cost $63,553) | 63,553 | |
Total Investments (cost $5,237,128) | | $ 5,640,821 |
Receivable for investments sold | | 29,033 |
Receivable for fund shares sold | | 3,787 |
Dividends receivable | | 7,969 |
Interest receivable | | 309 |
Distributions receivable from Fidelity Central Funds | | 46 |
Other receivables | | 667 |
Total assets | | 5,682,632 |
| | |
Liabilities | | |
Payable for investments purchased | $ 22,209 | |
Payable for fund shares redeemed | 6,599 | |
Accrued management fee | 2,115 | |
Other affiliated payables | 964 | |
Other payables and accrued expenses | 734 | |
Collateral on securities loaned, at value | 35,402 | |
Total liabilities | | 68,023 |
| | |
Net Assets | | $ 5,614,609 |
Net Assets consist of: | | |
Paid in capital | | $ 9,963,713 |
Undistributed net investment income | | 5,432 |
Accumulated undistributed net realized gain (loss) on investments and foreign currency transactions | | (4,758,226) |
Net unrealized appreciation (depreciation) on investments and assets and liabilities in foreign currencies | | 403,690 |
Net Assets | | $ 5,614,609 |
| | |
Growth & Income:
Net Asset Value, offering price and redemption price per share ($4,862,841 ÷ 241,523 shares) | | $ 20.13 |
| | |
Class K:
Net Asset Value, offering price and redemption price per share ($751,768 ÷ 37,366 shares) | | $ 20.12 |
See accompanying notes which are an integral part of the financial statements.
Annual Report
Statement of Operations
Amounts in thousands | Year ended July 31, 2012 |
| | |
Investment Income | | |
Dividends | | $ 136,721 |
Interest | | 2,031 |
Income from Fidelity Central Funds | | 574 |
Total income | | 139,326 |
| | |
Expenses | | |
Management fee | $ 23,959 | |
Transfer agent fees | 10,806 | |
Accounting and security lending fees | 1,097 | |
Custodian fees and expenses | 236 | |
Independent trustees' compensation | 37 | |
Registration fees | 103 | |
Audit | 86 | |
Legal | 56 | |
Interest | 2 | |
Miscellaneous | 55 | |
Total expenses before reductions | 36,437 | |
Expense reductions | (57) | 36,380 |
Net investment income (loss) | | 102,946 |
Realized and Unrealized Gain (Loss) Net realized gain (loss) on: | | |
Investment securities: | | |
Unaffiliated issuers | 104,413 | |
Foreign currency transactions | (219) | |
Futures contracts | 7 | |
Total net realized gain (loss) | | 104,201 |
Change in net unrealized appreciation (depreciation) on: Investment securities | 318,254 | |
Assets and liabilities in foreign currencies | (127) | |
Total change in net unrealized appreciation (depreciation) | | 318,127 |
Net gain (loss) | | 422,328 |
Net increase (decrease) in net assets resulting from operations | | $ 525,274 |
See accompanying notes which are an integral part of the financial statements.
Annual Report
Financial Statements - continued
Statement of Changes in Net Assets
Amounts in thousands | Year ended
July 31,
2012 | Year ended
July 31,
2011 |
Increase (Decrease) in Net Assets | | |
Operations | | |
Net investment income (loss) | $ 102,946 | $ 66,618 |
Net realized gain (loss) | 104,201 | 1,411,621 |
Change in net unrealized appreciation (depreciation) | 318,127 | (422,767) |
Net increase (decrease) in net assets resulting
from operations | 525,274 | 1,055,472 |
Distributions to shareholders from net investment income | (98,353) | (61,849) |
Distributions to shareholders from net realized gain | (2,799) | - |
Total distributions | (101,152) | (61,849) |
Share transactions - net increase (decrease) | (265,023) | (1,247,529) |
Total increase (decrease) in net assets | 159,099 | (253,906) |
| | |
Net Assets | | |
Beginning of period | 5,455,510 | 5,709,416 |
End of period (including undistributed net investment income of $5,432 and undistributed net investment income of $3,860, respectively) | $ 5,614,609 | $ 5,455,510 |
See accompanying notes which are an integral part of the financial statements.
Annual Report
Financial Highlights - Growth & Income
Years ended July 31, | 2012 | 2011 | 2010 | 2009 | 2008 |
Selected Per-Share Data | | | | | |
Net asset value, beginning of period | $ 18.58 | $ 15.75 | $ 14.38 | $ 21.88 | $ 31.92 |
Income from Investment Operations | | | | | |
Net investment income (loss) B | .36 | .20 | .10 | .15 | .35 |
Net realized and unrealized gain (loss) | 1.55 | 2.82 | 1.37 | (7.43) | (6.25) |
Total from investment operations | 1.91 | 3.02 | 1.47 | (7.28) | (5.90) |
Distributions from net investment income | (.35) | (.19) | (.10) | (.19) | (.33) |
Distributions from net realized gain | (.01) | - | (.01) | (.03) | (3.81) |
Total distributions | (.36) | (.19) | (.10) F | (.22) | (4.14) |
Net asset value, end of period | $ 20.13 | $ 18.58 | $ 15.75 | $ 14.38 | $ 21.88 |
Total Return A | 10.45% | 19.16% | 10.25% | (33.32)% | (20.91)% |
Ratios to Average Net Assets C,E | | | | |
Expenses before reductions | .71% | .72% | .75% | .78% | .68% |
Expenses net of fee waivers, if any | .71% | .72% | .75% | .78% | .68% |
Expenses net of all reductions | .71% | .71% | .74% | .78% | .67% |
Net investment income (loss) | 1.95% | 1.09% | .63% | 1.07% | 1.29% |
Supplemental Data | | | | | |
Net assets, end of period (in millions) | $ 4,863 | $ 5,052 | $ 5,417 | $ 5,993 | $ 12,552 |
Portfolio turnover rate D | 62% | 129% | 98% | 122% | 52% |
A Total returns would have been lower if certain expenses had not been reduced during the applicable periods shown.
B Calculated based on average shares outstanding during the period.
C Fees and expenses of any underlying Fidelity Central Funds are not included in the Fund's expense ratio. The Fund indirectly bears its proportionate share of the expenses of any underlying Fidelity Central Funds.
D Amount does not include the portfolio activity of any underlying Fidelity Central Funds.
E Expense ratios reflect operating expenses of the class. Expenses before reductions do not reflect amounts reimbursed by the investment adviser or reductions from brokerage service arrangements or reductions from other expense offset arrangements and do not represent the amount paid by the class during periods when reimbursements or reductions occur. Expenses net of fee waivers reflect expenses after reimbursement by the investment adviser but prior to reductions from brokerage service arrangements or other expense offset arrangements. Expenses net of all reductions represent the net expenses paid by the class.
F Total distributions of $.10 per share is comprised of distributions from net investment income of $.095 and distributions from net realized gain of $.008 per share.
See accompanying notes which are an integral part of the financial statements.
Annual Report
Financial Highlights - Class K
Years ended July 31, | 2012 | 2011 | 2010 | 2009 | 2008 G |
Selected Per-Share Data | | | | | |
Net asset value, beginning of period | $ 18.57 | $ 15.74 | $ 14.38 | $ 21.88 | $ 25.34 |
Income from Investment Operations | | | | | |
Net investment income (loss) D | .40 | .23 | .13 | .16 | .09 |
Net realized and unrealized gain (loss) | 1.54 | 2.82 | 1.37 | (7.40) | (3.45) |
Total from investment operations | 1.94 | 3.05 | 1.50 | (7.24) | (3.36) |
Distributions from net investment income | (.38) | (.22) | (.13) | (.23) | (.10) |
Distributions from net realized gain | (.01) | - | (.01) | (.03) | - |
Total distributions | (.39) | (.22) | (.14) I | (.26) | (.10) |
Net asset value, end of period | $ 20.12 | $ 18.57 | $ 15.74 | $ 14.38 | $ 21.88 |
Total Return B,C | 10.66% | 19.40% | 10.41% | (33.12)% | (13.22)% |
Ratios to Average Net Assets E,H | | | | | |
Expenses before reductions | .54% | .54% | .54% | .56% | .55% A |
Expenses net of fee waivers, if any | .54% | .54% | .54% | .56% | .55% A |
Expenses net of all reductions | .54% | .53% | .53% | .55% | .55% A |
Net investment income (loss) | 2.13% | 1.27% | .84% | 1.29% | 1.73% A |
Supplemental Data | | | | | |
Net assets, end of period (000 omitted) | $ 751,768 | $ 403,452 | $ 292,021 | $ 349,324 | $ 87 |
Portfolio turnover rate F | 62% | 129% | 98% | 122% | 52% |
A Annualized
B Total returns for periods of less than one year are not annualized.
C Total returns would have been lower if certain expenses had not been reduced during the applicable periods shown.
D Calculated based on average shares outstanding during the period.
E Fees and expenses of any underlying Fidelity Central Funds are not included in the Fund's expense ratio. The Fund indirectly bears its proportionate share of the expenses of any underlying Fidelity Central Funds.
F Amount does not include the portfolio activity of any underlying Fidelity Central Funds.
G For the period May 9, 2008 (commencement of sale of shares) to July 31, 2008.
H Expense ratios reflect operating expenses of the class. Expenses before reductions do not reflect amounts reimbursed by the investment adviser or reductions from brokerage service arrangements or reductions from other expense offset arrangements and do not represent the amount paid by the class during periods when reimbursements or reductions occur. Expense ratios before reductions for start-up periods may not be representative of longer-term operating periods. Expenses net of fee waivers reflect expenses after reimbursement by the investment adviser but prior to reductions from brokerage service arrangements or other expense offset arrangements. Expenses net of all reductions represent the net expenses paid by the class.
I Total distributions of $.14 per share is comprised of distributions from net investment income of $.129 and distributions from net realized gain of $.008 per share.
See accompanying notes which are an integral part of the financial statements.
Annual Report
Notes to Financial Statements
For the period ended July 31, 2012
(Amounts in thousands except percentages)
1. Organization.
Fidelity Growth & Income Portfolio (the Fund) is a fund of Fidelity Securities Fund (the Trust) and is authorized to issue an unlimited number of shares. The Trust is registered under the Investment Company Act of 1940, as amended (the 1940 Act), as an open-end management investment company organized as a Massachusetts business trust. The Fund offers Growth & Income and Class K shares, each of which has equal rights as to assets and voting privileges. Each class has exclusive voting rights with respect to matters that affect that class. Investment income, realized and unrealized capital gains and losses, the common expenses of the Fund, and certain fund-level expense reductions, if any, are allocated on a pro-rata basis to each class based on the relative net assets of each class to the total net assets of the Fund. Each class differs with respect to transfer agent fees incurred. Certain expense reductions may also differ by class.
2. Investments in Fidelity Central Funds.
The Fund invests in Fidelity Central Funds, which are open-end investment companies available only to other investment companies and accounts managed by Fidelity Management & Research Company (FMR) and its affiliates. The Fund's Schedule of Investments lists each of the Fidelity Central Funds held as of period end, if any, as an investment of the Fund, but does not include the underlying holdings of each Fidelity Central Fund. As an Investing Fund, the Fund indirectly bears its proportionate share of the expenses of the underlying Fidelity Central Funds.
The Money Market Central Funds seek preservation of capital and current income and are managed by Fidelity Investments Money Management, Inc. (FIMM), an affiliate of FMR.
A complete unaudited list of holdings for each Fidelity Central Fund is available upon request or at the Securities and Exchange Commission (the SEC) web site at www.sec.gov. In addition, the financial statements of the Fidelity Central Funds, which are not covered by the Fund's Report of Independent Registered Public Accounting Firm, are available on the SEC web site or upon request.
3. Significant Accounting Policies.
The financial statements have been prepared in conformity with accounting principles generally accepted in the United States of America (GAAP), which require management to make certain estimates and assumptions at the date of the financial statements. Actual results could differ from those estimates. Subsequent events, if any, through the date that the financial statements were issued have been evaluated in the preparation of the financial statements. The following summarizes the significant accounting policies of the Fund:
Annual Report
3. Significant Accounting Policies - continued
Security Valuation. Investments are valued as of 4:00 p.m. Eastern time on the last calendar day of the period. In accordance with valuation policies and procedures approved by the Board of Trustees (the Board), the Fund attempts to obtain prices from one or more third party pricing vendor or broker to value its investments. When current market prices, quotations or rates are not readily available or reliable, securities will be fair valued in good faith by the FMR Fair Value Committee (the Committee), in accordance with procedures adopted by the Fund's Board. Factors used in determining fair value vary by security type and may include market or security specific events, changes in interest rates and credit quality. The frequency with which these procedures are used cannot be predicted and they may be utilized to a significant extent. The Committee oversees the Fund's valuation policies and procedures and is responsible for approving and reporting to the Board all fair value determinations.
The Fund categorizes the inputs to valuation techniques used to value its investments into a disclosure hierarchy consisting of three levels as shown below:
Level 1 - quoted prices in active markets for identical investments
Level 2 - other significant observable inputs (including quoted prices for similar investments, interest rates, prepayment speeds, etc.)
Level 3 - unobservable inputs (including the Fund's own assumptions based on the best information available)
Valuation techniques used to value the Fund's investments by major category are as follows:
Equity securities, including restricted securities, for which market quotations are readily available, are valued at the last reported sale price or official closing price as reported by a third party pricing vendor on the primary market or exchange on which they are traded and are categorized as Level 1 in the hierarchy. In the event there were no sales during the day or closing prices are not available, securities are valued at the last quoted bid price or may be valued using the last available price and are generally categorized as Level 2 in the hierarchy. For foreign equity securities, when significant market or security specific events arise, comparisons to the valuation of American Depositary Receipts (ADRs), futures contracts, Exchange-Traded Funds (ETFs) and certain indexes as well as quoted prices for similar securities are used and are categorized as Level 2 in the hierarchy. Utilizing these techniques may result in transfers between Level 1 and Level 2. For restricted equity securities and private placements where observable inputs are limited, assumptions about market activity and risk are used and these securities are categorized as Level 3 in the hierarchy.
Annual Report
Notes to Financial Statements - continued
(Amounts in thousands except percentages)
3. Significant Accounting Policies - continued
Security Valuation - continued
Debt securities, including restricted securities, are valued based on evaluated prices received from third party pricing vendors or from brokers who make markets in such securities. For corporate bonds, pricing vendors utilize matrix pricing which considers yield or price of bonds of comparable quality, coupon, maturity and type as well as broker-supplied prices and are generally categorized as Level 2 in the hierarchy. When independent prices are unavailable or unreliable, debt securities may be valued utilizing pricing methodologies which consider similar factors that would be used by third party pricing vendors. These are generally categorized as Level 2 in the hierarchy but may be Level 3 depending on the circumstances.
Investments in open-end mutual funds, including the Fidelity Central Funds, are valued at their closing net asset value each business day and are categorized as Level 1 in the hierarchy.
Changes in valuation techniques may result in transfers in or out of an assigned level within the disclosure hierarchy. The aggregate value of investments by input level, as of July 31, 2012, is included at the end of the Fund's Schedule of Investments.
Foreign Currency Translation. The Fund may use foreign currency contracts to facilitate transactions in foreign-denominated securities. Gains and losses from these transactions may arise from changes in the value of the foreign currency or if the counterparties do not perform under the contracts' terms.
Foreign-denominated assets, including investment securities, and liabilities are translated into U.S. dollars at the exchange rates at period end. Purchases and sales of investment securities, income and dividends received and expenses denominated in foreign currencies are translated into U.S. dollars at the exchange rate in effect on the transaction date.
The effects of exchange rate fluctuations on investments are included with the net realized and unrealized gain (loss) on investment securities. Other foreign currency transactions resulting in realized and unrealized gain (loss) are disclosed separately.
Investment Transactions and Income. For financial reporting purposes, the Fund's investment holdings and NAV include trades executed through the end of the last business day of the period. The NAV per share for processing shareholder transactions is calculated as of the close of business of the New York Stock Exchange (NYSE), normally 4:00 p.m. Eastern time and includes trades executed through the end of the prior business day. Gains and losses on securities sold are determined on the basis of identified cost and may include proceeds received from litigation. Dividend income is recorded on the ex-dividend date, except for certain dividends from foreign securities where the
Annual Report
3. Significant Accounting Policies - continued
Investment Transactions and Income - continued
ex-dividend date may have passed, which are recorded as soon as the Fund is informed of the ex-dividend date. Non-cash dividends included in dividend income, if any, are recorded at the fair market value of the securities received. Distributions received on securities that represent a return of capital or capital gain are recorded as a reduction of cost of investments and/or as a realized gain. The Fund estimates the components of distributions received that may be considered return of capital distributions or capital gain distributions. Interest income and distributions from the Fidelity Central Funds are accrued as earned. Interest income includes coupon interest and amortization of premium and accretion of discount on debt securities. Investment income is recorded net of foreign taxes withheld where recovery of such taxes is uncertain.
Expenses. Expenses directly attributable to a fund are charged to that fund. Expenses attributable to more than one fund are allocated among the respective funds on the basis of relative net assets or other appropriate methods. Expense estimates are accrued in the period to which they relate and adjustments are made when actual amounts are known.
Deferred Trustee Compensation. Under a Deferred Compensation Plan (the Plan), independent Trustees may elect to defer receipt of a portion of their annual compensation. Deferred amounts are invested in a cross-section of Fidelity funds, are marked-to-market and remain in the Fund until distributed in accordance with the Plan. The investment of deferred amounts and the offsetting payable to the Trustees are included in the accompanying Statement of Assets and Liabilities.
Income Tax Information and Distributions to Shareholders. Each year, the Fund intends to qualify as a regulated investment company under Subchapter M of the Internal Revenue Code, including distributing substantially all of its taxable income and realized gains. As a result, no provision for income taxes is required. As of July 31, 2012, the Fund did not have any unrecognized tax benefits in the financial statements; nor is the Fund aware of any tax positions for which it is reasonably possible that the total amounts of unrecognized tax benefits will significantly change in the next twelve months. The Fund files a U.S. federal tax return, in addition to state and local tax returns as required. A fund's federal income tax returns are subject to examination by the Internal Revenue Service (IRS) for a period of three fiscal years after they are filed. State and local tax returns may be subject to examination for an additional fiscal year depending on the jurisdiction. Foreign taxes are provided for based on the Fund's understanding of the tax rules and rates that exist in the foreign markets in which it invests.
Distributions are declared and recorded on the ex-dividend date. Income dividends and capital gain distributions are declared separately for each class. Income and capital gain distributions are determined in accordance with income tax regulations, which may differ from GAAP.
Annual Report
Notes to Financial Statements - continued
(Amounts in thousands except percentages)
3. Significant Accounting Policies - continued
Income Tax Information and Distributions to Shareholders - continued
Capital accounts within the financial statements are adjusted for permanent book-tax differences. These adjustments have no impact on net assets or the results of operations. Temporary book-tax differences will reverse in a subsequent period.
Book-tax differences are primarily due to futures transactions, foreign currency transactions, market discount, partnerships, equity-debt classifications, deferred trustees compensation, capital loss carryforwards and losses deferred due to wash sales.
The federal tax cost of investment securities and unrealized appreciation (depreciation) as of period end were as follows:
Gross unrealized appreciation | $ 691,271 |
Gross unrealized depreciation | (318,187) |
Net unrealized appreciation (depreciation) on securities and other investments | $ 373,084 |
| |
Tax Cost | $ 5,267,737 |
The tax-based components of distributable earnings as of period end were as follows:
Undistributed ordinary income | $ 7,158 |
Capital loss carryforward | $ (4,728,474) |
Net unrealized appreciation (depreciation) | $ 373,080 |
Capital loss carryforwards are only available to offset future capital gains of the Fund to the extent provided by regulations and may be limited. Under the Regulated Investment Company Modernization Act of 2010 (the Act), the Fund is permitted to carry forward capital losses incurred in taxable years beginning after December 22, 2010 for an unlimited period and such capital losses are required to be used prior to any losses that expire. Capital loss carryforwards were as follows:
Fiscal year of expiration | |
2017 | $ (1,560,133) |
2018 | (3,168,341) |
Total capital loss carryforward | $ (4,728,474) |
The tax character of distributions paid was as follows:
| July 31, 2012 | July 31, 2011 |
Ordinary Income | $ 101,152 | $ 61,849 |
Annual Report
3. Significant Accounting Policies - continued
New Accounting Pronouncement. In December 2011, the Financial Accounting Standards Board issued Accounting Standard Update No. 2011-11, Disclosures about Offsetting Assets and Liabilities. The update creates new disclosure requirements requiring entities to disclose both gross and net information for derivatives and other financial instruments that are either offset in the Statement of Assets and Liabilities or subject to an enforceable master netting arrangement or similar agreement. The disclosure requirements are effective for interim and annual reporting periods beginning on or after January 1, 2013. Management is currently evaluating the impact of the update's adoption on the Fund's financial statement disclosures.
4. Operating Policies.
Restricted Securities. The Fund may invest in securities that are subject to legal or contractual restrictions on resale. These securities generally may be resold in transactions exempt from registration or to the public if the securities are registered. Disposal of these securities may involve time-consuming negotiations and expense, and prompt sale at an acceptable price may be difficult. Information regarding restricted securities is included at the end of the Fund's Schedule of Investments.
5. Derivative Instruments.
Risk Exposures and the Use of Derivative Instruments. The Fund's investment objectives allow the Fund to enter into various types of derivative contracts, including futures contracts. Derivatives are investments whose value is derived from underlying assets, indices or reference rates and may be transacted on an exchange or over-the-counter (OTC). Derivatives may involve a future commitment to buy or sell a specified instrument based on specified terms, or to exchange future cash flows at periodic intervals based on a notional principal amount. The Fund used derivatives to increase returns and to manage exposure to certain risks as defined below. The success of any strategy involving derivatives depends on analysis of numerous economic factors, and if the strategies for investment do not work as intended, the Fund may not achieve its objectives.
The Fund's use of derivatives increased or decreased its exposure to the following risk:
Equity Risk | Equity risk relates to the fluctuations in the value of financial instruments as a result of changes in market prices (other than those arising from interest rate risk or foreign exchange risk), whether caused by factors specific to an individual investment, its issuer, or all factors affecting all instruments traded in a market or market segment. |
Annual Report
Notes to Financial Statements - continued
(Amounts in thousands except percentages)
5. Derivative Instruments - continued
Risk Exposures and the Use of Derivative Instruments - continued
The Fund is also exposed to additional risks from investing in derivatives, such as liquidity risk and counterparty credit risk. Liquidity risk is the risk that the Fund will be unable to close out the derivative in the open market in a timely manner. Counterparty credit risk is the risk that the counterparty will not be able to fulfill its obligation to the Fund. Counterparty credit risk related to exchange-traded futures contracts is minimal because of the protection provided by the exchange on which they trade. Investing in derivatives may involve greater risks than investing in the underlying assets directly and, to varying degrees, involves risk of loss in excess of the initial investment, if any, collateral received and amounts recognized in the Statement of Assets and Liabilities. In addition, for futures contracts, there is the risk that the change in value of the derivative contract may not correspond to the change in value of the underlying instrument.
Futures Contracts. A futures contract is an agreement between two parties to buy or sell a specified underlying instrument for a fixed price at a specified future date. The Fund used futures contracts to manage its exposure to the stock market.
Upon entering into a futures contract, a fund is required to deposit either cash or securities (initial margin) with a clearing broker in an amount equal to a certain percentage of the face value of the contract. Futures contracts are marked-to-market daily and subsequent payments (variation margin) are made or received by a fund depending on the daily fluctuations in the value of the futures contracts and are recorded as unrealized appreciation or (depreciation). This receivable and/or payable is included in daily variation margin on futures contracts in the Statement of Assets and Liabilities. Realized gain or (loss) is recorded upon the expiration or closing of a futures contract.
Any open futures contracts at period end are shown in the Schedule of Investments under the caption "Futures Contracts." The underlying face amount at value reflects each contract's exposure to the underlying instrument at period end.
During the period the Fund recognized net realized gain (loss) of $7 related to its investment in futures contracts. This amount is included in the Statement of Operations.
6. Purchases and Sales of Investments.
Purchases and sales of securities, other than short-term securities, aggregated $3,260,377 and $3,529,590, respectively.
Annual Report
7. Fees and Other Transactions with Affiliates.
Management Fee. FMR and its affiliates provide the Fund with investment management related services for which the Fund pays a monthly management fee. The management fee is the sum of an individual fund fee rate that is based on an annual rate of .20% of the Fund's average net assets and an annualized group fee rate that averaged .26% during the period. The group fee rate is based upon the average net assets of all the mutual funds advised by FMR. The group fee rate decreases as assets under management increase and increases as assets under management decrease. For the period, the total annual management fee rate was .46% of the Fund's average net assets.
Transfer Agent Fees. Fidelity Investments Institutional Operations Company, Inc. (FIIOC), an affiliate of FMR, is the transfer, dividend disbursing and shareholder servicing agent for each class of the Fund. FIIOC receives account fees and asset-based fees that vary according to the account size and type of account of the shareholders of Growth and Income. FIIOC receives an asset-based fee of Class K's average net assets. FIIOC pays for typesetting, printing and mailing of shareholder reports, except proxy statements. For the period, transfer agent fees for each class were as follows:
| Amount | % of
Average
Net Assets |
Growth & Income | $ 10,547 | .22 |
Class K | 259 | .05 |
| $ 10,806 | |
Accounting and Security Lending Fees. Fidelity Service Company, Inc. (FSC), an affiliate of FMR, maintains the Fund's accounting records. The accounting fee is based on the level of average net assets for each month. Under a separate contract, FSC administers the security lending program. The security lending fee is based on the number and duration of lending transactions.
Brokerage Commissions. The Fund placed a portion of its portfolio transactions with brokerage firms which are affiliates of the investment adviser. The commissions paid to these affiliated firms were $105 for the period.
Interfund Lending Program. Pursuant to an Exemptive Order issued by the SEC, the Fund, along with other registered investment companies having management contracts with FMR, may participate in an interfund lending program. This program provides an alternative credit facility allowing the funds to borrow from, or lend money to, other participating affiliated funds. The Fund's activity in this program during the period for which loans were outstanding was as follows:
Borrower or Lender | Average Loan
Balance | Weighted Average Interest Rate | Interest
Expense |
Borrower | $ 6,200 | .37% | $ 2 |
Annual Report
Notes to Financial Statements - continued
(Amounts in thousands except percentages)
8. Committed Line of Credit.
The Fund participates with other funds managed by FMR or an affiliate in a $4.25 billion credit facility (the "line of credit") to be utilized for temporary or emergency purposes to fund shareholder redemptions or for other short-term liquidity purposes. The Fund has agreed to pay commitment fees on its pro-rata portion of the line of credit, which amounted to $15 and is reflected in Miscellaneous expenses on the Statement of Operations. During the period, there were no borrowings on this line of credit.
9. Security Lending.
The Fund lends portfolio securities through a lending agent from time to time in order to earn additional income. For equity securities, a lending agent is used and may loan securities to certain qualified borrowers, including Fidelity Capital Markets (FCM), a broker-dealer affiliated with the Fund. On the settlement date of the loan, the Fund receives collateral (in the form of U.S. Treasury obligations, letters of credit and/or cash) against the loaned securities and maintains collateral in an amount not less than 100% of the market value of the loaned securities during the period of the loan. The market value of the loaned securities is determined at the close of business of the Fund and any additional required collateral is delivered to the Fund on the next business day. If the borrower defaults on its obligation to return the securities loaned because of insolvency or other reasons, a fund could experience delays and costs in recovering the securities loaned or in gaining access to the collateral. Any cash collateral received is invested in the Fidelity Securities Lending Cash Central Fund. The value of loaned securities and cash collateral at period end are disclosed on the Fund's Statement of Assets and Liabilities. At period end, there were no security loans outstanding with FCM. Security lending income represents the income earned on investing cash collateral, less rebates paid to borrowers and any lending agent fees associated with the loan, plus any premium payments received for lending certain types of securities. Security lending income is presented in the Statement of Operations as a component of income from Fidelity Central Funds. Total security lending income during the period amounted to $553, including $3 from securities loaned to FCM.
10. Expense Reductions.
Many of the brokers with whom FMR places trades on behalf of the Fund provided services to the Fund in addition to trade execution. These services included payments of certain expenses on behalf of the Fund totaling $57 for the period.
Annual Report
11. Distributions to Shareholders.
Distributions to shareholders of each class were as follows:
Years ended July 31, | 2012 | 2011 |
From net investment income | | |
Growth & Income | $ 87,366 | $ 54,597 |
Class K | 10,987 | 7,252 |
Total | $ 98,353 | $ 61,849 |
From net realized gain | | |
Growth & Income | $ 2,563 | $ - |
Class K | 236 | - |
Total | $ 2,799 | $ - |
12. Share Transactions.
Transactions for each class of shares were as follows:
| Shares | Dollars |
Years ended July 31, | 2012 | 2011 | 2012 | 2011 |
Growth & Income | | | | |
Shares sold | 21,066 | 10,892 | $ 402,515 | $ 196,623 |
Reinvestment of distributions | 4,651 | 2,827 | 86,309 | 52,490 |
Shares redeemed | (56,062) | (85,823) | (1,053,524) | (1,509,810) |
Net increase (decrease) | (30,345) | (72,104) | $ (564,700) | $ (1,260,697) |
Class K | | | | |
Shares sold | 20,227 | 26,831 | $ 386,187 | $ 447,073 |
Reinvestment of distributions | 596 | 390 | 11,223 | 7,252 |
Shares redeemed | (5,182) | (24,047) | (97,733) | (441,157) |
Net increase (decrease) | 15,641 | 3,174 | $ 299,677 | $ 13,168 |
13. Other.
The Fund's organizational documents provide former and current trustees and officers with a limited indemnification against liabilities arising in connection with the performance of their duties to the Fund. In the normal course of business, the Fund may also enter into contracts that provide general indemnifications. The Fund's maximum exposure under these arrangements is unknown as this would be dependent on future claims that may be made against the Fund. The risk of material loss from such claims is considered remote.
Annual Report
To the Trustees of Fidelity Securities Fund and the Shareholders of Fidelity Growth & Income Portfolio:
In our opinion, the accompanying statement of assets and liabilities, including the schedule of investments, and the related statements of operations and of changes in net assets and the financial highlights present fairly, in all material respects, the financial position of Fidelity Growth & Income Portfolio (a fund of Fidelity Securities Fund) at July 31, 2012, the results of its operations for the year then ended, the changes in its net assets for each of the two years in the period then ended and the financial highlights for each of the periods indicated, in conformity with accounting principles generally accepted in the United States of America. These financial statements and financial highlights (hereafter referred to as "financial statements") are the responsibility of the Fidelity Growth & Income Portfolio's management. Our responsibility is to express an opinion on these financial statements based on our audits. We conducted our audits of these financial statements in accordance with the standards of the Public Company Accounting Oversight Board (United States). Those standards require that we plan and perform the audit to obtain reasonable assurance about whether the financial statements are free of material misstatement. An audit includes examining, on a test basis, evidence supporting the amounts and disclosures in the financial statements, assessing the accounting principles used and significant estimates made by management, and evaluating the overall financial statement presentation. We believe that our audits, which included confirmation of securities at July 31, 2012 by correspondence with the custodian, brokers and transfer agent, provide a reasonable basis for our opinion.
PricewaterhouseCoopers LLP
Boston, Massachusetts
September 12, 2012
Annual Report
The Trustees, Members of the Advisory Board, and executive officers of the trust and fund, as applicable, are listed below. The Board of Trustees governs the fund and is responsible for protecting the interests of shareholders. The Trustees are experienced executives who meet periodically throughout the year to oversee the fund's activities, review contractual arrangements with companies that provide services to the fund, oversee management of the risks associated with such activities and contractual arrangements, and review the fund's performance. Except for James C. Curvey, each of the Trustees oversees 228 funds advised by FMR or an affiliate. Mr. Curvey oversees 435 funds advised by FMR or an affiliate.
The Trustees hold office without limit in time except that (a) any Trustee may resign; (b) any Trustee may be removed by written instrument, signed by at least two-thirds of the number of Trustees prior to such removal; (c) any Trustee who requests to be retired or who has become incapacitated by illness or injury may be retired by written instrument signed by a majority of the other Trustees; and (d) any Trustee may be removed at any special meeting of shareholders by a two-thirds vote of the outstanding voting securities of the trust. Each Trustee who is not an interested person (as defined in the 1940 Act) (Independent Trustee), shall retire not later than the last day of the calendar year in which his or her 75th birthday occurs. The Independent Trustees may waive this mandatory retirement age policy with respect to individual Trustees. The executive officers and Advisory Board Members hold office without limit in time, except that any officer and Advisory Board Member may resign or may be removed by a vote of a majority of the Trustees at any regular meeting or any special meeting of the Trustees. Except as indicated, each individual has held the office shown or other offices in the same company for the past five years.
Experience, Skills, Attributes, and Qualifications of the Fund's Trustees. The Governance and Nominating Committee has adopted a statement of policy that describes the experience, qualifications, attributes, and skills that are necessary and desirable for potential Independent Trustee candidates (Statement of Policy). The Board believes that each Trustee satisfied at the time he or she was initially elected or appointed a Trustee, and continues to satisfy, the standards contemplated by the Statement of Policy. The Governance and Nominating Committee also engages professional search firms to help identify potential Independent Trustee candidates who have the experience, qualifications, attributes, and skills consistent with the Statement of Policy. From time to time, additional criteria based on the composition and skills of the current Independent Trustees, as well as experience or skills that may be appropriate in light of future changes to board composition, business conditions, and regulatory or other developments, have also been considered by the professional search firms and the Governance and Nominating Committee. In addition, the Board takes into account the Trustees' commitment and participation in Board and committee meetings, as well as their leadership of standing and ad hoc committees throughout their tenure.
In determining that a particular Trustee was and continues to be qualified to serve as a Trustee, the Board has considered a variety of criteria, none of which, in isolation, was controlling. The Board believes that, collectively, the Trustees have balanced and diverse experience, qualifications, attributes, and skills, which allow the Board to operate effectively in governing the fund and protecting the interests of shareholders. Information about the specific experience, skills, attributes, and qualifications of each Trustee, which in each case led to the Board's conclusion that the Trustee should serve (or continue to serve) as a trustee of the fund, is provided below.
Annual Report
Trustees and Officers - continued
Board Structure and Oversight Function. James C. Curvey is an interested person (as defined in the 1940 Act) and currently serves as Chairman. The Trustees have determined that an interested Chairman is appropriate and benefits shareholders because an interested Chairman has a personal and professional stake in the quality and continuity of services provided to the fund. Independent Trustees exercise their informed business judgment to appoint an individual of their choosing to serve as Chairman, regardless of whether the Trustee happens to be independent or a member of management. The Independent Trustees have determined that they can act independently and effectively without having an Independent Trustee serve as Chairman and that a key structural component for assuring that they are in a position to do so is for the Independent Trustees to constitute a substantial majority for the Board. The Independent Trustees also regularly meet in executive session. Ned C. Lautenbach serves as Chairman of the Independent Trustees and as such (i) acts as a liaison between the Independent Trustees and management with respect to matters important to the Independent Trustees and (ii) with management prepares agendas for Board meetings.
Fidelity funds are overseen by different Boards of Trustees. The fund's Board oversees Fidelity's equity and high income funds and another Board oversees Fidelity's investment-grade bond, money market, and asset allocation funds. The asset allocation funds may invest in Fidelity funds overseen by the fund's Board. The use of separate Boards, each with its own committee structure, allows the Trustees of each group of Fidelity funds to focus on the unique issues of the funds they oversee, including common research, investment, and operational issues. On occasion, the separate Boards establish joint committees to address issues of overlapping consequences for the Fidelity funds overseen by each Board.
The Trustees operate using a system of committees to facilitate the timely and efficient consideration of all matters of importance to the Trustees, the fund, and fund shareholders and to facilitate compliance with legal and regulatory requirements and oversight of the fund's activities and associated risks. The Board, acting through its committees, has charged FMR and its affiliates with (i) identifying events or circumstances the occurrence of which could have demonstrably adverse effects on the fund's business and/or reputation; (ii) implementing processes and controls to lessen the possibility that such events or circumstances occur or to mitigate the effects of such events or circumstances if they do occur; and (iii) creating and maintaining a system designed to evaluate continuously business and market conditions in order to facilitate the identification and implementation processes described in (i) and (ii) above. Because the day-to-day operations and activities of the fund are carried out by or through FMR, its affiliates and other service providers, the fund's exposure to risks is mitigated but not eliminated by the processes overseen by the Trustees. While each of the Board's committees has responsibility for overseeing different aspects of the fund's activities, oversight is exercised primarily through the Operations, Audit, and Compliance Committees. In addition, the Independent Trustees have worked with FMR to enhance the Board's oversight of investment and financial risks, legal and regulatory risks, technology risks, and operational risks, including the development of additional risk reporting to the Board. For example, a working group comprised of Independent Trustees and FMR has worked and continues to work to review the Fidelity funds' valuation-related activities, reporting and risk management. Appropriate personnel, including but not limited to the fund's Chief Compliance Officer (CCO), FMR's internal auditor, the independent accountants, the fund's Treasurer and portfolio management personnel, make periodic reports to the Board's committees, as appropriate, including an annual review of FMR's risk management program for the Fidelity funds. The responsibilities of each standing committee, including their oversight responsibilities, are described further under "Standing Committees of the Fund's Trustees."
Annual Report
The fund's Statement of Additional Information (SAI) includes more information about the Trustees. To request a free copy, call Fidelity at 1-800-544-8544.
Interested Trustees*:
Correspondence intended for each Trustee who is an interested person may be sent to Fidelity Investments, 82 Devonshire Street, Boston, Massachusetts 02109.
Name, Age; Principal Occupations and Other Relevant Experience+ |
James C. Curvey (77) |
| Year of Election or Appointment: 2007 Mr. Curvey is Trustee and Chairman of the Board of Trustees of certain Trusts. Mr. Curvey also serves as Trustee (2007-present) of other investment companies advised by FMR. Mr. Curvey is a Director of Fidelity Investments Money Management, Inc. (2009-present), Director of Fidelity Research & Analysis Co. (2009-present) and Director of FMR and FMR Co., Inc. (2007-present). Mr. Curvey is also Vice Chairman (2007-present) and Director of FMR LLC. In addition, Mr. Curvey serves as an Overseer for the Boston Symphony Orchestra and a member of the Trustees of Villanova University. Previously, Mr. Curvey was the Vice Chairman (2006-2007) and Director (2000-2007) of FMR Corp. |
Ronald P. O'Hanley (55) |
| Year of Election or Appointment: 2011 Mr. O'Hanley is Director of FMR Co., Inc. (2010-present), Director of Fidelity Investments Money Management, Inc. (2010-present), Director of Fidelity Research & Analysis Company (2010-present), President of Fidelity Asset Management and Corporate Services and a member of Fidelity's Executive Committee (2010-present). Previously, Mr. O'Hanley served as President and Chief Executive Officer of BNY Mellon Asset Management (2007-2010). Mr. O'Hanley also served as Vice Chairman of Bank New York Mellon Corp. and a member of that firm's Executive Committee. Prior to the 2007 merger of The Bank of New York and Mellon Financial Corporation, he was Vice Chairman of Mellon Financial Corporation and President and Chief Executive Officer of Mellon Asset Management. He joined Mellon in February 1997. Mr. O'Hanley currently serves as Chairman of the Boston Public Library Foundation Board of Directors and sits on the Board of Directors of Beth Israel Deaconess Medical Center, the Board of Trustees of the Marine Biological Laboratory and the Advisory Board of the Maxwell School of Citizenship and Public Administration at Syracuse University. Mr. O'Hanley also chairs the Council on Asset Management for the Financial Services Roundtable and is a member of the Board of Directors of Institutional Investor's U.S. Institute. |
* Trustees have been determined to be "Interested Trustees" by virtue of, among other things, their affiliation with the trust or various entities under common control with FMR.
+ The information above includes each Trustee's principal occupation during the last five years and other information relating to the experience, attributes, and skills relevant to each Trustee's qualifications to serve as a Trustee, which led to the conclusion that each Trustee should serve as a Trustee for the fund.
Annual Report
Independent Trustees:
Correspondence intended for each Independent Trustee (that is, the Trustees other than the Interested Trustees) may be sent to Fidelity Investments, P.O. Box 55235, Boston, Massachusetts 02205-5235.
Name, Age; Principal Occupations and Other Relevant Experience+ |
Dennis J. Dirks (64) |
| Year of Election or Appointment: 2005 Prior to his retirement in May 2003, Mr. Dirks was Chief Operating Officer and a member of the Board of The Depository Trust & Clearing Corporation (DTCC). He also served as President, Chief Operating Officer, and Board member of The Depository Trust Company (DTC) and President and Board member of the National Securities Clearing Corporation (NSCC). In addition, Mr. Dirks served as Chief Executive Officer and Board member of the Government Securities Clearing Corporation, Chief Executive Officer and Board member of the Mortgage-Backed Securities Clearing Corporation, as a Trustee and a member of the Finance Committee of Manhattan College (2005-2008), and as a Trustee and a member of the Finance Committee of AHRC of Nassau County (2006-2008). Mr. Dirks is a member of the Independent Directors Council (IDC) Governing Council (2010-present) and Board of Directors for The Brookville Center for Children's Services, Inc. (2009-present). |
Alan J. Lacy (58) |
| Year of Election or Appointment: 2008 Mr. Lacy serves as Senior Adviser (2007-present) of Oak Hill Capital Partners, L.P. (private equity). Mr. Lacy also served as Chief Executive Officer (2000-2005) and Vice Chairman (2005-2006) of Sears Holdings Corporation and Sears, Roebuck and Co. (retail). In addition, Mr. Lacy serves as a member of the Board of Directors of Dave & Buster's Entertainment, Inc. (restaurant and entertainment complexes, 2010-present), Earth Fare, Inc. (retail grocery, 2012-present), The Hillman Companies, Inc. (hardware wholesalers, 2010-present), and Bristol-Myers Squibb Company (global pharmaceuticals, 2007-present). Mr. Lacy is a member of the Board of Trustees of The National Parks Conservation Association (2006-present). Previously, Mr. Lacy served as Chairman of the Board of Trustees of the National Parks Conservation Association (2008-2011) and as a member of the Board of Directors for the Western Union Company (global money transfer, 2006-2011). |
Ned C. Lautenbach (68) |
| Year of Election or Appointment: 2000 Mr. Lautenbach is Chairman of the Independent Trustees of the Equity and High Income Funds (2006-present). Mr. Lautenbach currently serves as the Lead Director of the Eaton Corporation Board of Directors (diversified industrial, 1997-present). Mr. Lautenbach is Chairman of the Board of Directors of the Philharmonic Center for the Arts in Naples, Florida (2012-present) and a member of the Council on Foreign Relations (1994-present). Previously, Mr. Lautenbach was a Partner/Advisory Partner at Clayton, Dubilier & Rice, LLC (private equity investment, 1998-2010), as well as a Director of Sony Corporation (2006-2007). |
Joseph Mauriello (67) |
| Year of Election or Appointment: 2008 Prior to his retirement in January 2006, Mr. Mauriello served in numerous senior management positions including Deputy Chairman and Chief Operating Officer (2004-2005), and Vice Chairman of Financial Services (2002-2004) of KPMG LLP US (professional services, 1965-2005). Mr. Mauriello currently serves as a member of the Board of Directors of XL Group plc. (global insurance and re-insurance, 2006-present). Previously, Mr. Mauriello served as a Director of the Hamilton Funds of the Bank of New York (2006-2007) and of Arcadia Resources Inc. (health care services and products, 2007-2012). |
Robert W. Selander (61) |
| Year of Election or Appointment: 2011 Previously, Mr. Selander served as a Member of the Advisory Board of Fidelity's Equity and High Income Funds (2011), Executive Vice Chairman (2010), Chief Executive Officer (2009-2010), and President and Chief Executive Officer (1997-2009) of Mastercard, Inc. |
Cornelia M. Small (68) |
| Year of Election or Appointment: 2005 Ms. Small is a member of the Board of Directors of the Teagle Foundation (2009-present). Ms. Small is also a member of the Investment Committee, and Chair (2008-present) and a member of the Board of Trustees of Smith College. In addition, Ms. Small serves on the Investment Committee of the Berkshire Taconic Community Foundation (2008-present). Previously, Ms. Small served as Chairperson of the Investment Committee (2002-2008) of Smith College. In addition, Ms. Small served as Chief Investment Officer, Director of Global Equity Investments, and a member of the Board of Directors of Scudder, Stevens & Clark and Scudder Kemper Investments. |
William S. Stavropoulos (73) |
| Year of Election or Appointment: 2002 Mr. Stavropoulos is Vice Chairman of the Independent Trustees of the Equity and High Income Funds (2006-present). Mr. Stavropoulos serves as President and Founder of the Michigan Baseball Foundation, the Great Lakes Loons (2007-present). Mr. Stavropoulos is Chairman Emeritus of the Board of Directors of The Dow Chemical Company, where he previously served in numerous senior management positions, including President, CEO (1995-2000; 2002-2004), Chairman of the Executive Committee (2000-2006), and as a member of the Board of Directors (1990-2006). Currently, Mr. Stavropoulos is Chairman of Univar (global distributor of commodity and specialty chemicals, 2010-present), a Director of Teradata Corporation (data warehousing and technology solutions, 2008-present), Chemical Financial Corporation, Maersk Inc. (industrial conglomerate), Tyco International, Inc. (multinational manufacturing and services, 2007-present), and a member of the Advisory Board for Metalmark Capital (private equity investment, 2005-present). Mr. Stavropoulos is a special advisor to Clayton, Dubilier & Rice, LLC (private equity investment). In addition, Mr. Stavropoulos is a member of the University of Notre Dame Advisory Council for the College of Science. |
David M. Thomas (63) |
| Year of Election or Appointment: 2008 Previously, Mr. Thomas served as Executive Chairman (2005-2006) and Chairman and Chief Executive Officer (2000-2005) of IMS Health, Inc. (pharmaceutical and healthcare information solutions). In addition, Mr. Thomas serves as a member of the Board of Directors of Fortune Brands, Inc. (consumer products), and Interpublic Group of Companies, Inc. (marketing communication, 2004-present). |
Michael E. Wiley (61) |
| Year of Election or Appointment: 2008 Mr. Wiley also serves as a Director of Asia Pacific Exploration Consolidated (international oil and gas exploration and production, 2008-present). Mr. Wiley serves as a Director of Tesoro Corporation (independent oil refiner and marketer, 2005-present), and a Director of Bill Barrett Corporation (exploration and production, 2005-present). In addition, Mr. Wiley also serves as a Director of Post Oak Bank (privately-held bank, 2004-present). Previously, Mr. Wiley served as a member of the Board of Trustees of the University of Tulsa (2000-2006; 2007-2010), as a Senior Energy Advisor of Katzenbach Partners, LLC (consulting, 2006-2007), as an Advisory Director of Riverstone Holdings (private investment), Chairman, President, and CEO of Baker Hughes, Inc. (oilfield services, 2000-2004), and as Director of Spinnaker Exploration Company (exploration and production, 2001-2005). |
Annual Report
Trustees and Officers - continued
+ The information above includes each Trustee's principal occupation during the last five years and other information relating to the experience, attributes, and skills relevant to each Trustee's qualifications to serve as a Trustee, which led to the conclusion that each Trustee should serve as a Trustee for the fund.
Advisory Board Members and Executive Officers:
Correspondence intended for David A. Rosow and Garnett A. Smith may be sent to Fidelity Investments, P.O. Box 55235, Boston, Massachusetts 02205-5235. Correspondence intended for each executive officer, Edward C. Johnson 3d, and Peter S. Lynch may be sent to Fidelity Investments, 82 Devonshire Street, Boston, Massachusetts 02109.
Name, Age; Principal Occupation |
Edward C. Johnson 3d (82) |
| Year of Election or Appointment: 2011 Member of the Advisory Board of Fidelity's Equity and High Income Funds. Mr. Johnson serves as Chief Executive Officer, Chairman, and a Director of FMR LLC, and also serves as Chairman and Director of FIL Limited. Previously, Mr. Johnson served as a Trustee and Chairman of the Board of certain Fidelity Trusts, Chairman and a Director of FMR, Chairman and a Director of FMR Co., Inc., and President of FMR LLC (2006-2007). |
Peter S. Lynch (68) |
| Year of Election or Appointment: 2003 Member of the Advisory Board of Fidelity's Equity and High Income Funds. Mr. Lynch is Vice Chairman and a Director of FMR and FMR Co., Inc. In addition, Mr. Lynch serves as a Trustee of Boston College and as the Chairman of the Inner-City Scholarship Fund. Previously, Mr. Lynch served on the Special Olympics International Board of Directors (1997-2006). |
David A. Rosow (69) |
| Year of Election or Appointment: 2012 Member of the Advisory Board of Fidelity's Equity and High Income Funds. Chairman and Chief Executive Officer of International Golf Group, Inc. (golf course development, 1990-present). Previously, Mr. Rosow served as Chairman and Chief Executive Officer of Rosow & Company, Inc. (private investment company, 1989-2011), a Lead Director of Hudson United Bancorp (2001-2006) and as a Director of TD Banknorth (1996-2006). In addition, Mr. Rosow is a member (2008-present) and President (2009-present) of the Town Council of Palm Beach, Florida. |
Garnett A. Smith (64) |
| Year of Election or Appointment: 2012 Member of the Advisory Board of Fidelity's Equity and High Income Funds. Prior to Mr. Smith's retirement, he served as Chairman and Chief Executive Officer of Inbrand Corp. (manufacturer of personal absorbent products, 1990-1997). He also served as President (1986-1990) of Inbrand Corp. Prior to his employment with Inbrand Corp., he was employed by a retail fabric chain and North Carolina National Bank. In addition, Mr. Smith is a board member of the Jackson Hole Land Trust (2009-present). |
Kenneth B. Robins (42) |
| Year of Election or Appointment: 2008 President and Treasurer of Fidelity's Equity and High Income Funds. Mr. Robins also serves as President and Treasurer (2010-present) and Assistant Treasurer (2009-present) of other Fidelity funds and is an employee of Fidelity Investments (2004-present). Previously, Mr. Robins served as Deputy Treasurer of the Fidelity funds (2005-2008) and Treasurer and Chief Financial Officer of The North Carolina Capital Management Trust: Cash and Term Portfolios (2006-2008). |
Bruce T. Herring (46) |
| Year of Election or Appointment: 2006 Vice President of certain Equity Funds. Mr. Herring also serves as President of Fidelity Research & Analysis Company (2010-present), Chief Investment Officer and Director of Fidelity Management & Research (U.K.) Inc. (2010-present) and Group Chief Investment Officer of FMR. Previously, Mr. Herring served as Vice President (2005-2006) and Senior Vice President (2006-2007) of Fidelity Management & Research Company, Vice President of FMR Co., Inc. (2001-2007) and as a portfolio manager for Fidelity U.S. Equity Funds. |
Brian B. Hogan (47) |
| Year of Election or Appointment: 2009 Vice President of Equity and High Income Funds. Mr. Hogan also serves as President of FMR's Equity Division (2009-present). Previously, Mr. Hogan served as Senior Vice President, Equity Research of FMR (2006-2009) and as a portfolio manager. |
Scott C. Goebel (44) |
| Year of Election or Appointment: 2008 Secretary and Chief Legal Officer (CLO) of the Fidelity funds. Mr. Goebel also serves as Secretary of Fidelity Investments Money Management, Inc. (FIMM) (2010-present) and Fidelity Research and Analysis Company (FRAC) (2010-present); Secretary and CLO of The North Carolina Capital Management Trust: Cash and Term Portfolios (2008-present); General Counsel, Secretary, and Senior Vice President of FMR (2008-present) and FMR Co., Inc. (2008-present); employed by FMR LLC or an affiliate (2001-present); Chief Legal Officer of Fidelity Management & Research (Hong Kong) Limited (2008-present) and Assistant Secretary of Fidelity Management & Research (Japan) Inc. (2008-present), and Fidelity Management & Research (U.K.) Inc. (2008-present). Previously, Mr. Goebel served as Assistant Secretary of FIMM (2008-2010), FRAC (2008-2010), and the Funds (2007-2008) and as Vice President and Secretary of Fidelity Distributors Corporation (FDC) (2005-2007). |
William C. Coffey (43) |
| Year of Election or Appointment: 2009 Assistant Secretary of Fidelity's Equity and High Income Funds. Mr. Coffey also serves as Senior Vice President and Deputy General Counsel of FMR LLC (2010-present), and is an employee of Fidelity Investments. Previously, Mr. Coffey served as Vice President and Associate General Counsel of FMR LLC (2005-2009). |
Elizabeth Paige Baumann (44) |
| Year of Election or Appointment: 2012 Anti-Money Laundering (AML) Officer of the Fidelity funds. Ms. Baumann also serves as AML Officer of The North Carolina Capital Management Trust: Cash and Term Portfolios (2012-present), Chief AML Officer of FMR LLC (2012-present), and is an employee of Fidelity Investments. Previously, Ms. Baumann served as Vice President and Deputy Anti-Money Laundering Officer (2007-2012). |
Christine Reynolds (53) |
| Year of Election or Appointment: 2008 Chief Financial Officer of the Fidelity funds. Ms. Reynolds became President of Fidelity Pricing and Cash Management Services (FPCMS) in August 2008. Ms. Reynolds served as Chief Operating Officer of FPCMS (2007-2008). Previously, Ms. Reynolds served as President, Treasurer, and Anti-Money Laundering officer of the Fidelity funds (2004-2007). |
Joseph A. Hanlon (44) |
| Year of Election or Appointment: 2012 Chief Compliance Officer of Fidelity's Equity and High Income Funds. Mr. Hanlon serves as Compliance Officer of FMR, FMR Co., Inc., Fidelity Investments Money Management, Inc. (FIMM), Fidelity Research and Analysis Company (FRAC), Fidelity Management & Research (Japan) Inc., Fidelity Management & Research (U.K.) Inc., Fidelity Management & Research (Hong Kong), and Strategic Advisers, Inc. (2009-present), as Senior Vice President of the Fidelity Asset Management Division (2009-present), and is an employee of Fidelity Investments. |
Joseph F. Zambello (55) |
| Year of Election or Appointment: 2011 Deputy Treasurer of the Fidelity funds. Mr. Zambello is an employee of Fidelity Investments. Previously, Mr. Zambello served as Vice President of FMR's Program Management Group (2009-2011) and Vice President of the Transfer Agent Oversight Group (2005-2009). |
Adrien E. Deberghes (44) |
| Year of Election or Appointment: 2008 Deputy Treasurer of Fidelity's Equity and High Income Funds. Mr. Deberghes also serves as Vice President (2011-present) and Assistant Treasurer (2010-present) of other Fidelity funds, and is an employee of Fidelity Investments (2008-present). Previously, Mr. Deberghes served as Senior Vice President of Mutual Fund Administration at State Street Corporation (2007-2008), Senior Director of Mutual Fund Administration at Investors Bank & Trust (2005-2007), and Director of Finance for Dunkin' Brands (2000-2005). |
Stephanie J. Dorsey (43) |
| Year of Election or Appointment: 2010 Assistant Treasurer of Fidelity's Equity and High Income Funds. Ms. Dorsey also serves as Deputy Treasurer of other Fidelity funds (2008-present) and is an employee of Fidelity Investments (2008-present). Previously, Ms. Dorsey served as Treasurer (2004-2008) of the JPMorgan Mutual Funds and Vice President (2004-2008) of JPMorgan Chase Bank. |
John R. Hebble (54) |
| Year of Election or Appointment: 2009 Assistant Treasurer of Fidelity's Equity and High Income Funds. Mr. Hebble also serves as President (2011-present), Treasurer, and Chief Financial Officer of The North Carolina Capital Management Trust: Cash and Term Portfolios (2008-present), President and Treasurer of other Fidelity funds (2008-present) and is an employee of Fidelity Investments. |
Gary W. Ryan (53) |
| Year of Election or Appointment: 2005 Assistant Treasurer of the Fidelity funds. Mr. Ryan is an employee of Fidelity Investments. Previously, Mr. Ryan served as Vice President of Fund Reporting in Fidelity Pricing and Cash Management Services (FPCMS) (1999-2005). |
Jonathan Davis (44) |
| Year of Election or Appointment: 2010 Assistant Treasurer of the Fidelity funds. Mr. Davis is also Assistant Treasurer of Fidelity Rutland Square Trust II and Fidelity Commonwealth Trust II. Mr. Davis is an employee of Fidelity Investments. Previously, Mr. Davis served as Vice President and Associate General Counsel of FMR LLC (2003-2010). |
Annual Report
The Board of Trustees of Fidelity Growth & Income Portfolio voted to pay to shareholders of record at the opening of business on record date, the following distributions per share derived from capital gains realized from sales of portfolio securities:
| Pay Date | Record Date | Capital Gains |
Growth & Income | 09/10/2012 | 09/07/2012 | $0.009 |
A total of 0.01% of the dividends distributed during the fiscal year was derived from interest on U.S. Government securities which is generally exempt from state income tax.
Growth & Income designates 97%, 96%, 100% and 100% of the dividends distributed in October, December, April and July, respectively during the fiscal year as qualifying for the dividends-received deduction for corporate shareholders.
Growth & Income designates 100% of the dividends distributed during the fiscal year as amounts which may be taken into account as a dividend for the purposes of the maximum rate under section 1(h)(11) of the Internal Revenue Code.
The fund will notify shareholders in January 2013 of amounts for use in preparing 2012 income tax returns.
Annual Report
Board Approval of Investment Advisory Contracts and Management Fees
Fidelity Growth & Income Portfolio
Each year, the Board of Trustees, including the Independent Trustees (together, the Board), votes on the renewal of the management contract and sub-advisory agreements (together, the Advisory Contracts) for the fund. The Board, assisted by the advice of fund counsel and Independent Trustees' counsel, requests and considers a broad range of information relevant to the renewal of the Advisory Contracts throughout the year.
The Board meets regularly and, at each of its meetings, considers factors that are relevant to its annual consideration of the renewal of the fund's Advisory Contracts, including the services and support provided to the fund and its shareholders. The Board has established various standing committees, each composed of and chaired by Independent Trustees with varying backgrounds, to which the Board has assigned specific subject matter responsibilities in order to enhance effective decision-making by the Board. The Board, acting directly and through its Committees, requests and receives information concerning the annual consideration of the renewal of the fund's Advisory Contracts. The Board also meets as needed to consider matters specifically related to the Board's annual consideration of the renewal of Advisory Contracts. Members of the Board may also meet with trustees of other Fidelity funds through ad hoc joint committees to discuss certain matters relevant to the Fidelity funds.
At its July 2012 meeting, the Board of Trustees, including the Independent Trustees, unanimously determined to renew the fund's Advisory Contracts. In reaching its determination, the Board considered all factors it believed relevant, including (i) the nature, extent, and quality of the services to be provided to the fund and its shareholders (including the investment performance of the fund); (ii) the competitiveness of the fund's management fee and total expense ratio relative to peer funds; (iii) the total costs of the services to be provided by and the profits to be realized by Fidelity from its relationship with the fund; (iv) the extent to which economies of scale exist and would be realized as the fund grows; and (v) whether fee levels reflect these economies of scale, if any, for the benefit of fund shareholders.
In considering whether to renew the Advisory Contracts for the fund, the Board reached a determination, with the assistance of fund counsel and Independent Trustees' counsel and through the exercise of its business judgment, that the renewal of the Advisory Contracts is in the best interests of the fund and its shareholders and that the compensation payable under the Advisory Contracts is fair and reasonable. The Board's decision to renew the Advisory Contracts was not based on any single factor, but rather was based on a comprehensive consideration of all the information provided to the Board at its meetings throughout the year. The Board, in reaching its determination to renew the Advisory Contracts, is aware that shareholders in the fund have a broad range of investment choices available to them, including a wide choice among mutual funds offered by Fidelity's competitors, and that the fund's shareholders, who have the opportunity to review and weigh the disclosure provided by the fund in its prospectus and other public disclosures, have chosen to invest in this fund, managed by Fidelity.
Annual Report
Nature, Extent, and Quality of Services Provided. The Board considered the staffing within the investment adviser, FMR, and the sub-advisers (together, the Investment Advisers), including the backgrounds of the fund's investment personnel, and also considered the fund's investment objective, strategies, and related investment philosophy. The Independent Trustees also had discussions with senior management of Fidelity's investment operations and investment groups. The Board considered the structure of the portfolio manager compensation program and whether this structure provides appropriate incentives to act in the best interests of the fund.
Resources Dedicated to Investment Management and Support Services. The Board and the Fund Oversight and Research Committees reviewed the general qualifications and capabilities of the Investment Advisers' investment staff, including its size, education, experience, and resources, as well as the Investment Advisers' approach to recruiting, training, managing, and compensating investment personnel. The Board also noted that FMR has continued to increase the resources devoted to non-U.S. offices, including expansion of Fidelity's global investment organization. The Board noted that Fidelity's analysts have extensive resources, tools and capabilities that allow them to conduct sophisticated quantitative and fundamental analysis, as well as credit analysis of issuers, counterparties and guarantors. The Board also believes that Fidelity's investment professionals have sufficient access to global information and data so as to provide competitive investment results over time, and that those professionals also have access to sophisticated tools that permit them to assess portfolio construction and risk and performance attribution characteristics continuously, as well as to transmit new information and research conclusions rapidly around the world. Additionally, in its deliberations, the Board considered the Investment Advisers' trading and risk management capabilities and resources, which are an integral part of the investment management process.
Shareholder and Administrative Services. The Board considered (i) the nature, extent, quality, and cost of advisory, administrative, and shareholder services performed by the Investment Advisers and their affiliates under the Advisory Contracts and under separate agreements covering transfer agency, pricing and bookkeeping, and securities lending services for the fund; (ii) the nature and extent of the supervision of third party service providers, principally custodians and subcustodians; and (iii) the resources devoted to, and the record of compliance with, the fund's compliance policies and procedures. The Board also reviewed the allocation of fund brokerage, including allocations to brokers affiliated with the Investment Advisers, the use of brokerage commissions to pay fund expenses, and the use of "soft" commission dollars to pay for research services.
Annual Report
Board Approval of Investment Advisory Contracts and
Management Fees - continued
The Board noted that the growth of fund assets over time across the complex allows Fidelity to reinvest in the development of services designed to enhance the value or convenience of the Fidelity funds as investment vehicles. These services include 24-hour access to account information and market information through telephone representatives and over the Internet, investor education materials and asset allocation tools, and the expanded availability of Fidelity Investor Centers.
Investment in a Large Fund Family. The Board considered the benefits to shareholders of investing in a Fidelity fund, including the benefits of investing in a fund that is part of a large family of funds offering a variety of investment disciplines and providing a large variety of mutual fund investor services. The Board noted that Fidelity had taken, or had made recommendations that resulted in the Fidelity funds taking, a number of actions over the previous year that benefited particular funds, including (i) continuing to dedicate additional resources to investment research and support of the senior management team that oversees asset management; (ii) persisting in efforts to enhance Fidelity's research capabilities, in particular, international research; (iii) launching new funds and making other enhancements to meet client needs for global and income-oriented solutions; (iv) continuing to launch dedicated lower cost underlying funds to meet investment management's portfolio construction needs related to expanding underlying fund options, specifically for the Freedom Fund product lines; (v) adopting a "Stock Selector" sector neutral investment approach and employing a team of portfolio managers who are sector specialists to manage certain funds; (vi) rationalizing product lines and gaining increased efficiencies through the mergers of several funds into other funds; (vii) strengthening the Spartan Index Fund product line by adding new funds and/or new low-cost institutional share classes, restructuring fund expenses to accommodate new classes, and reducing investment minimums for certain classes of shares; (viii) modifying the eligibility criteria for Institutional Class shares to increase their appeal to government entities and charitable investors; and (ix) reducing certain transfer agent fee rates.
Investment Performance. The Board considered whether the fund has operated in accordance with its investment objective, as well as its record of compliance with its investment restrictions. It also reviewed the fund's absolute investment performance for each class, as well as the fund's relative investment performance for each class measured over multiple periods against (i) a broad-based securities market index, and (ii) a peer group of mutual funds deemed appropriate by Fidelity and reviewed by the Board. The following charts considered by the Board show, over the one-, three-, and five-year periods ended December 31, 2011, as available, the cumulative total returns of Class K and the retail class of the fund, the cumulative total returns of a broad-based securities market index ("benchmark"), and a range of cumulative total returns of a peer group of mutual funds identified by Morningstar, Inc. as having an investment style similar to that of the fund based on underlying portfolio holdings. The box within each chart shows the 25th percentile return (top of box) and the 75th percentile return (bottom of box) of the peer group. Returns shown above the box are in the first quartile and returns shown below the box are in the fourth quartile. The percentage beaten numbers noted below each chart correspond to the percentile box and represent the percentage of funds in the peer group whose performance was equal to or lower than that of the class indicated.
Annual Report
Fidelity Growth & Income Portfolio

The Board reviewed the fund's relative investment performance against its peer group and noted that the performance of the retail class of the fund (the class with the longer performance record) was in the second quartile for the one-year period, the third quartile for the three-year period, and the fourth quartile for the five-year period. The Board also noted that the investment performance of the fund was lower than its benchmark for all the periods shown. The Board considered that the variations in performance between the fund's classes reflect the variations in class expenses, which result in lower performance for the higher expense class. The Board discussed with FMR the fact that the fund underperformed its benchmark for each period measured. The Board also reviewed the fund's performance since inception as well as performance in the current year. The Board will continue to closely monitor performance of the fund in the coming year and discuss with FMR if other actions to address performance are appropriate.
Based on its review, the Board concluded that the nature, extent, and quality of services provided to the fund under the Advisory Contracts should benefit the fund's shareholders.
Competitiveness of Management Fee and Total Expense Ratio. The Board considered the fund's management fee and total expense ratio compared to "mapped groups" of competitive funds and classes. Fidelity creates "mapped groups" by combining similar Lipper investment objective categories that have comparable management fee characteristics. Combining Lipper investment objective categories aids the Board's management fee and total expense ratio comparisons by broadening the competitive group used for comparison and by reducing the number of universes to which various Fidelity funds are compared.
Annual Report
Board Approval of Investment Advisory Contracts and
Management Fees - continued
Management Fee. The Board considered two proprietary management fee comparisons for the 12-month periods shown in the chart below. The group of Lipper funds used by the Board for management fee comparisons is referred to below as the "Total Mapped Group." The Total Mapped Group comparison focuses on a fund's standing relative to the total universe of comparable funds available to investors in terms of gross management fees before expense reimbursements or caps. "TMG %" represents the percentage of funds in the Total Mapped Group that had management fees that were lower than the fund's. For example, a TMG % of 14% means that 86% of the funds in the Total Mapped Group had higher management fees than the fund. The "Asset-Size Peer Group" (ASPG) comparison focuses on a fund's standing relative to non-Fidelity funds similar in size to the fund within the Total Mapped Group. The ASPG represents at least 15% of the funds in the Total Mapped Group with comparable asset size and management fee characteristics, subject to a minimum of 50 funds (or all funds in the Total Mapped Group if fewer than 50). Additional information, such as the ASPG quartile in which the fund's management fee ranked, is also included in the chart and considered by the Board.
Fidelity Growth & Income Portfolio

The Board noted that the fund's management fee ranked below the median of its Total Mapped Group and below the median of its ASPG for 2011.
Annual Report
Based on its review, the Board concluded that the fund's management fee is fair and reasonable in light of the services that the fund receives and the other factors considered.
Total Expense Ratio. In its review of each class's total expense ratio, the Board considered the fund's management fee as well as other fund or class expenses, as applicable, such as transfer agent fees, pricing and bookkeeping fees, and custodial, legal, and audit fees. The Board also noted the effects of any waivers and reimbursements on fees and expenses. As part of its review, the Board also considered the current and historical total expense ratios of each class of the fund compared to competitive fund median expenses. Each class of the fund is compared to those funds and classes in the Total Mapped Group (used by the Board for management fee comparisons) that have a similar sales load structure.
The Board noted that the total expense ratio of each class ranked below its competitive median for 2011.
Fees Charged to Other Fidelity Clients. The Board also considered Fidelity fee structures and other information with respect to clients of FMR and its affiliates, such as other mutual funds advised or subadvised by FMR or its affiliates, pension plan clients, and other institutional clients. The Board noted the findings of the 2010 ad hoc joint committee (created with the board of other Fidelity funds), which reviewed and compared Fidelity's institutional investment advisory business with its business of providing services to the Fidelity funds, including the differences in services provided, fees charged, and costs incurred, as well as competition in their respective marketplaces.
Based on its review of total expense ratios and fees charged to other Fidelity clients, the Board concluded that the total expense ratio of each class of the fund was reasonable in light of the services that the fund and its shareholders receive and the other factors considered.
Costs of the Services and Profitability. The Board considered the revenues earned and the expenses incurred by Fidelity in conducting the business of developing, marketing, distributing, managing, administering and servicing the fund and its shareholders. The Board also considered the level of Fidelity's profits in respect of all the Fidelity funds.
On an annual basis, FMR presents to the Board Fidelity's profitability for the fund. Fidelity calculates the profitability for each fund, as well as aggregate profitability for groups of Fidelity funds and all Fidelity funds, using a series of detailed revenue and cost allocation methodologies which originate with the books and records of Fidelity on which Fidelity's audited financial statements are based. The Audit Committee of the Board reviews any significant changes from the prior year's methodologies.
PricewaterhouseCoopers LLP (PwC), independent registered public accounting firm and auditor to Fidelity and certain Fidelity funds, has been engaged annually by the Board as part of the Board's assessment of Fidelity's profitability analysis. PwC's engagement includes the review and assessment of Fidelity's methodologies used in determining the revenues and expenses attributable to Fidelity's mutual fund business, and completion of agreed-upon procedures surrounding the mathematical accuracy of fund profitability and its conformity to allocation methodologies. After considering PwC's reports issued under the engagement and information provided by Fidelity, the Board concluded that while other allocation methods may also be reasonable, Fidelity's profitability methodologies are reasonable in all material respects.
Annual Report
Board Approval of Investment Advisory Contracts and
Management Fees - continued
The Board also reviewed Fidelity's non-fund businesses and fall-out benefits related to the mutual fund business as well as cases where Fidelity's affiliates may benefit from or be related to the fund's business.
The Board considered the costs of the services provided by and the profits realized by Fidelity in connection with the operation of the fund and was satisfied that the profitability was not excessive in the circumstances.
Economies of Scale. The Board considered whether there have been economies of scale in respect of the management of the Fidelity funds, whether the Fidelity funds (including the fund) have appropriately benefited from any such economies of scale, and whether there is potential for realization of any further economies of scale. The Board considered the extent to which the fund will benefit from economies of scale through increased services to the fund, through waivers or reimbursements, or through fee or expense reductions. The Board also noted that in 2009, it and the board of other Fidelity funds created an ad hoc committee (the Economies of Scale Committee) to analyze whether FMR attains economies of scale in respect of the management and servicing of the Fidelity funds, whether the Fidelity funds have appropriately benefited from such economies of scale, and whether there is potential for realization of any further economies of scale.
The Board recognized that the fund's management contract incorporates a "group fee" structure, which provides for lower group fee rates as total fund assets under FMR's management increase, and for higher group fee rates as total fund assets under FMR's management decrease. FMR calculates the group fee rates based on a tiered asset "breakpoint" schedule that varies based on asset class. The Board considered that the group fee is designed to deliver the benefits of economies of scale to fund shareholders when total Fidelity fund assets increase, even if assets of any particular fund are unchanged or have declined, because some portion of Fidelity's costs are attributable to services provided to all Fidelity funds, and all funds benefit if those costs can be allocated among more assets. The Board concluded that, given the group fee structure, fund shareholders will benefit from lower management fees as assets under FMR's management increase at the fund complex level, regardless of whether Fidelity achieves any such economies of scale.
Annual Report
The Board concluded, taking into account the analysis of the Economies of Scale Committee, that economies of scale, if any, are being appropriately shared between fund shareholders and Fidelity.
Additional Information Requested by the Board. In order to develop fully the factual basis for consideration of the Fidelity funds' Advisory Contracts, the Board requested and received additional information on certain topics, including (i) fund performance trends, actions to be taken by FMR to improve certain funds' overall performance, and Fidelity's long-term strategies for certain funds; (ii) the potential to further rationalize the Fidelity fund lineup with the possibility of achieving savings for the funds and Fidelity; (iii) Fidelity's compensation structure for portfolio managers and other key investment personnel; (iv) the amount of the investment that each portfolio manager has made in the Fidelity fund(s) that he or she manages; (v) the realization of fall-out benefits in certain Fidelity business units; (vi) Fidelity's group fee structures, the potential impact of regulatory changes on such structures, and the rationale for the individual fee rates of certain funds; (vii) fund profitability methodology, including Fidelity's cost allocation methodology, and the impact of certain factors on fund profitability results; (viii) trends regarding industry use of performance fee structures and the possibility of implementing performance fee structures for additional funds; and (ix) the impact of net redemptions from the Fidelity funds.
Based on its evaluation of all of the conclusions noted above, and after considering all factors it believed relevant, the Board ultimately concluded that the advisory fee structures are fair and reasonable, and that the fund's Advisory Contracts should be renewed.
Annual Report
Investment Adviser
Fidelity Management & Research Company
Boston, MA
Investment Sub-Advisers
FMR Co., Inc.
Fidelity Management & Research
(U.K.) Inc.
Fidelity Management & Research
(Japan) Inc.
Fidelity Management & Research
(Hong Kong) Limited
General Distributor
Fidelity Distributors Corporation
Smithfield, RI
Transfer and Service Agents
Fidelity Investments Institutional
Operations Company, Inc.
Boston, MA
Fidelity Service Company, Inc.
Boston, MA
Custodian
Northern Trust Company
Chicago, IL
The Fidelity Telephone Connection
Mutual Fund 24-Hour Service
Exchanges/Redemptions
and Account Assistance 1-800-544-6666
Product Information 1-800-544-6666
Retirement Accounts 1-800-544-4774
(8 a.m. - 9 p.m.)
TDD Service 1-800-544-0118
for the deaf and hearing impaired
(9 a.m. - 9 p.m. Eastern time)
Fidelity Automated Service
Telephone (FAST ®)
1-800-544-8544

Automated line for quickest service
(Fidelity Investment logo)(registered trademark)
Corporate Headquarters
82 Devonshire St., Boston, MA 02109
www.fidelity.com
GAI-UANN-0912
1.874515.104
Fidelity®
International Real Estate
Fund
Annual Report
July 31, 2012
(Fidelity Cover Art)
Contents
Performance | (Click Here) | How the fund has done over time. |
Management's Discussion of Fund Performance | (Click Here) | The Portfolio Manager's review of fund performance and strategy. |
Shareholder Expense Example | (Click Here) | An example of shareholder expenses. |
Investment Changes | (Click Here) | A summary of major shifts in the fund's investments over the past six months. |
Investments | (Click Here) | A complete list of the fund's investments with their market values. |
Financial Statements | (Click Here) | Statements of assets and liabilities, operations, and changes in net assets,
as well as financial highlights. |
Notes | (Click Here) | Notes to the financial statements. |
Report of Independent Registered Public Accounting Firm | (Click Here) | |
Trustees and Officers | (Click Here) | |
Distributions | (Click Here) | |
Board Approval of Investment Advisory Contracts and Management Fees | (Click Here) | |
To view a fund's proxy voting guidelines and proxy voting record for the 12-month period ended June 30, visit http://www.fidelity.com/proxyvotingresults or visit the Securities and Exchange Commission's (SEC) web site at http://www.sec.gov. You may also call 1-800-544-8544 to request a free copy of the proxy voting guidelines.
Standard & Poor's, S&P and S&P 500 are registered service marks of The McGraw-Hill Companies, Inc. and have been licensed for use by Fidelity Distributors Corporation.
Other third party marks appearing herein are the property of their respective owners.
All other marks appearing herein are registered or unregistered trademarks or service marks of FMR LLC or an affiliated company. © 2012 FMR LLC. All rights reserved.
Annual Report
This report and the financial statements contained herein are submitted for the general information of the shareholders of the fund. This report is not authorized for distribution to prospective investors in the fund unless preceded or accompanied by an effective prospectus.
A fund files its complete schedule of portfolio holdings with the SEC for the first and third quarters of each fiscal year on Form N-Q. Forms N-Q are available on the SEC's web site at http://www.sec.gov. A fund's Forms N-Q may be reviewed and copied at the SEC's Public Reference Room in Washington, DC. Information regarding the operation of the SEC's Public Reference Room may be obtained by calling 1-800-SEC-0330. For a complete list of a fund's portfolio holdings, view the most recent holdings listing, semiannual report, or annual report on Fidelity's web site at http://www.fidelity.com, http://www.advisor.fidelity.com, or http://www.401k.com, as applicable.
NOT FDIC INSURED • MAY LOSE VALUE • NO BANK GUARANTEE
Neither the fund nor Fidelity Distributors Corporation is a bank.
Annual Report
Average annual total return reflects the change in the value of an investment, assuming reinvestment of the class' distributions from dividend income and capital gains (the profits earned upon the sale of securities that have grown in value, if any) and assuming a constant rate of performance each year. The $10,000 table and the fund's returns do not reflect the deduction of taxes that a shareholder would pay on fund distributions or the redemption of fund shares. During periods of reimbursement by Fidelity, a fund's total return will be greater than it would be had the reimbursement not occurred. How a fund did yesterday is no guarantee of how it will do tomorrow.
Average Annual Total Returns
Periods ended July 31, 2012 | Past 1
year | Past 5
years | Life of fund A |
Fidelity® International Real Estate Fund | -4.76% | -6.82% | 3.37% |
A From September 8, 2004.
$10,000 Over Life of Fund
Let's say hypothetically that $10,000 was invested in Fidelity® International Real Estate Fund, a class of the fund, on September 8, 2004, when the fund started. The chart shows how the value of your investment would have changed, and also shows how the MSCI® EAFE® Index performed over the same period.
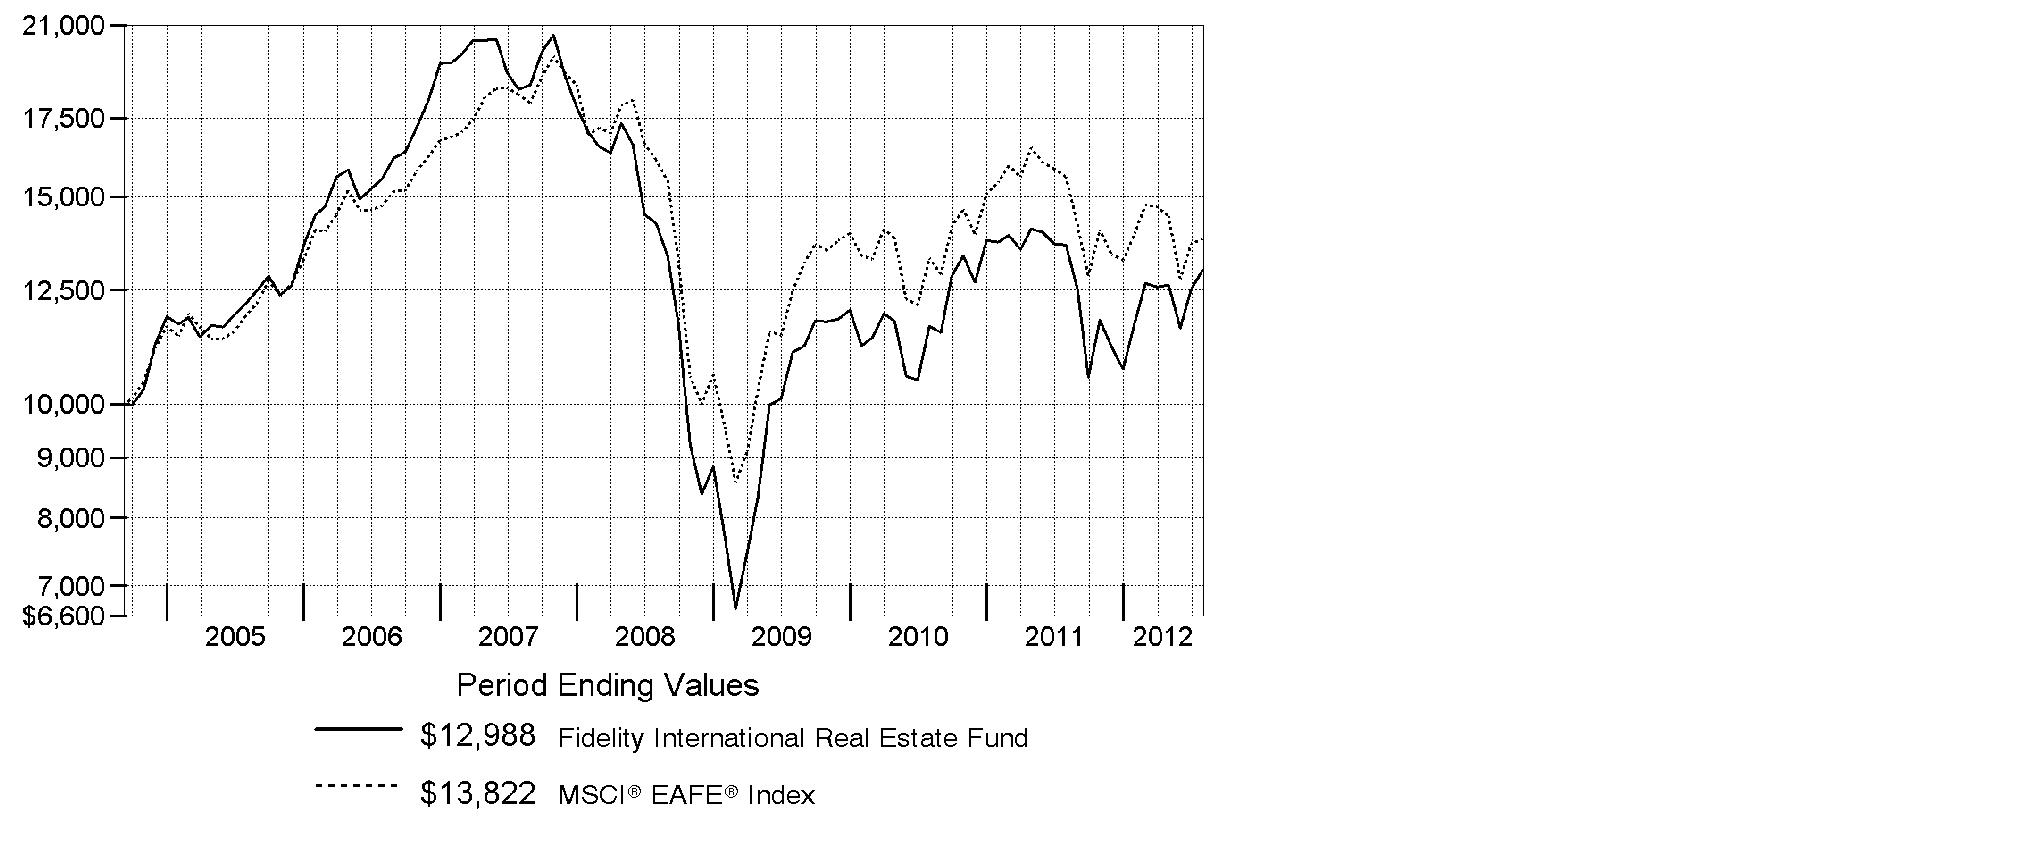
Annual Report
Market Recap: The 12-month period ending July 31, 2012, was highly volatile for overseas property stocks, which lost ground as investors endured abrupt shifts between intervals of "risk on" and "risk off." A variety of factors drove the periodic changes in sentiment, especially the ongoing sovereign debt crisis in Europe. Concern about a slowdown in the Chinese economy and questions about the prospect of additional economic stimulus from the country's policymakers also influenced the market's behavior during the period. Given the limited supply of inflation-adjusted income-generating equity or fixed-income alternatives, larger-cap real estate investment trusts (REITs) toting relatively high yields and solid business fundamentals were among the biggest beneficiaries of new investment activity. Against this backdrop, overseas property stocks, as measured by the FTSE® EPRASM/NAREIT® Developed ex North America Index, returned -1.89%. Hampered in part by currency movements, this result significantly lagged the 12.88% gain of the U.S. REIT market, as reflected in the Dow Jones U.S. Select Real Estate Securities IndexSM. Meanwhile, the broad international equity market, as measured by the MSCI® EAFE® Index, returned -11.32%, while the S&P 500® Index, a popular measure of the performance of U.S. stocks, rose 9.13%.
Comments from Guillermo de las Casas, Portfolio Manager of Fidelity® International Real Estate Fund: For the year, the fund's Retail Class shares returned -4.76%, lagging the FTSE® EPRASM/NAREIT® index but beating the MSCI® EAFE®. The fund's emphasis of attractively valued small- and mid-cap stocks hurt because these did not fare as well as certain large-cap, high-dividend-yielding investments, which I tended not to own. Also, the fund's growth-oriented stocks in Hong Kong, Singapore and Australia hurt, while below-benchmark exposure to Australia and an overweighting in poor-performing Italy also detracted. However, the fund benefited from limited exposure to the Netherlands and from favorable currency movements. In individual terms, avoiding Hong Kong-based Link Real Estate Investment Trust, an outperforming property company, hurt, as the fund was underweighted in this stock for nearly the entire period. This stock was not held at period end. Also detracting was Westfield Retail Trust, an outperforming index component that the fund didn't own, while an overweighting in Italy's Beni Stabili also detracted. On the positive side, an underweighting in Hong Kong-listed China Resources Land and an overweighting in Australian mall giant Westfield Group were significant positives.
The views expressed above reflect those of the portfolio manager(s) only through the end of the period as stated on the cover of this report and do not necessarily represent the views of Fidelity or any other person in the Fidelity organization. Any such views are subject to change at any time based upon market or other conditions and Fidelity disclaims any responsibility to update such views. These views may not be relied on as investment advice and, because investment decisions for a Fidelity fund are based on numerous factors, may not be relied on as an indication of trading intent on behalf of any Fidelity fund.
Annual Report
Shareholder Expense Example
As a shareholder of the Fund, you incur two types of costs: (1) transaction costs, including sales charges (loads) on purchase payments or redemption proceeds, redemption fees and (2) ongoing costs, including management fees, distribution and/or service (12b-1) fees and other Fund expenses. This Example is intended to help you understand your ongoing costs (in dollars) of investing in the Fund and to compare these costs with the ongoing costs of investing in other mutual funds.
The Example is based on an investment of $1,000 invested at the beginning of the period and held for the entire period (February 1, 2012 to July 31, 2012).
Actual Expenses
The first line of the accompanying table for each class of the Fund provides information about actual account values and actual expenses. You may use the information in this line, together with the amount you invested, to estimate the expenses that you paid over the period. Simply divide your account value by $1,000.00 (for example, an $8,600 account value divided by $1,000.00 = 8.6), then multiply the result by the number in the first line for a class of the Fund under the heading entitled "Expenses Paid During Period" to estimate the expenses you paid on your account during this period. A small balance maintenance fee of $12.00 that is charged once a year may apply for certain accounts with a value of less than $2,000. This fee is not included in the table below. If it was, the estimate of expenses you paid during the period would be higher, and your ending account value lower, by this amount. In addition, the Fund, as a shareholder in the underlying Fidelity Central Funds, will indirectly bear its pro-rata share of the fees and expenses incurred by the underlying Fidelity Central Funds. These fees and expenses are not included in the Fund's annualized expense ratio used to calculate the expense estimate in the table below.
Hypothetical Example for Comparison Purposes
The second line of the accompanying table for each class of the Fund provides information about hypothetical account values and hypothetical expenses based on a Class' actual expense ratio and an assumed rate of return of 5% per year before expenses, which is not the Class' actual return. The hypothetical account values and expenses may not be used to estimate the actual ending account balance or expenses you paid for the period. You may use this information to compare the ongoing costs of investing in the Fund and other funds. To do so, compare this 5% hypothetical example with the 5% hypothetical examples that appear in the shareholder reports of the other funds. A small balance maintenance fee of $12.00 that is charged once a year may apply for certain accounts with a value of less than $2,000. This fee is not included in the table below. If it was, the estimate of expenses you paid during the period would be higher, and your ending account value lower, by this amount. In addition, the Fund, as a shareholder in the underlying Fidelity Central Funds, will indirectly bear its pro-rata share of the fees and expenses incurred by the underlying Fidelity Central Funds. These fees and expenses are not included in the Fund's annualized expense ratio used to calculate the expense estimate in the table below.
Annual Report
Please note that the expenses shown in the table are meant to highlight your ongoing costs only and do not reflect any transaction costs. Therefore, the second line of the table is useful in comparing ongoing costs only, and will not help you determine the relative total costs of owning different funds. In addition, if these transactional costs were included, your costs would have been higher.
| Annualized Expense Ratio | Beginning
Account Value
February 1, 2012 | Ending
Account Value
July 31, 2012 | Expenses Paid
During Period*
February 1, 2012
to July 31, 2012 |
Class A | 1.44% | | | |
Actual | | $ 1,000.00 | $ 1,108.60 | $ 7.55 |
HypotheticalA | | $ 1,000.00 | $ 1,017.70 | $ 7.22 |
Class T | 1.70% | | | |
Actual | | $ 1,000.00 | $ 1,106.40 | $ 8.90 |
HypotheticalA | | $ 1,000.00 | $ 1,016.41 | $ 8.52 |
Class B | 2.19% | | | |
Actual | | $ 1,000.00 | $ 1,103.10 | $ 11.45 |
HypotheticalA | | $ 1,000.00 | $ 1,013.97 | $ 10.97 |
Class C | 2.19% | | | |
Actual | | $ 1,000.00 | $ 1,103.50 | $ 11.45 |
HypotheticalA | | $ 1,000.00 | $ 1,013.97 | $ 10.97 |
International Real Estate | 1.19% | | | |
Actual | | $ 1,000.00 | $ 1,109.10 | $ 6.24 |
HypotheticalA | | $ 1,000.00 | $ 1,018.95 | $ 5.97 |
Institutional Class | 1.19% | | | |
Actual | | $ 1,000.00 | $ 1,109.40 | $ 6.24 |
HypotheticalA | | $ 1,000.00 | $ 1,018.95 | $ 5.97 |
A 5% return per year before expenses
* Expenses are equal to each Class' annualized expense ratio, multiplied by the average account value over the period, multiplied by 182/366 (to reflect the one-half year period).
Annual Report
Investment Changes (Unaudited)
Top Ten Stocks as of July 31, 2012 |
| % of fund's
net assets | % of fund's net assets
6 months ago |
Westfield Group unit | 8.2 | 7.8 |
Mitsui Fudosan Co. Ltd. | 5.9 | 5.7 |
Sun Hung Kai Properties Ltd. | 5.7 | 8.3 |
Sumitomo Realty & Development Co. Ltd. | 4.7 | 4.4 |
Unibail-Rodamco | 4.1 | 3.9 |
Mirvac Group unit | 3.6 | 2.3 |
Global Logistic Properties Ltd. | 2.9 | 2.6 |
Kerry Properties Ltd. | 2.8 | 1.7 |
Nomura Real Estate Holdings, Inc. | 2.3 | 1.7 |
Big Yellow Group PLC | 2.2 | 2.5 |
| 42.4 | |
Top Five Countries as of July 31, 2012 |
(excluding cash equivalents) | % of fund's
net assets | % of fund's net assets
6 months ago |
Japan | 19.9 | 16.1 |
Australia | 16.5 | 16.0 |
United Kingdom | 12.9 | 12.8 |
Hong Kong | 11.6 | 15.0 |
Singapore | 10.0 | 7.5 |
Percentages are adjusted for the effect of open futures contracts, if applicable. |
Top Five REIT Sectors as of July 31, 2012 |
| % of fund's
net assets | % of fund's net assets
6 months ago |
REITs - Management/Investment | 24.2 | 25.7 |
REITs - Office Buildings | 5.5 | 6.9 |
REITs - Industrial Buildings | 4.6 | 3.1 |
REITs - Shopping Centers | 4.4 | 3.3 |
REITs - Health Care Facilities | 2.0 | 0.5 |
Asset Allocation (% of fund's net assets) |
As of July 31, 2012* | As of January 31, 2012** |
 | Stocks 95.5% | |  | Stocks 94.1% | |
 | Short-Term
Investments and
Net Other Assets (Liabilities) 4.5% | |  | Short-Term
Investments and
Net Other Assets (Liabilities) 5.9% | |
* Foreign investments | 95.5% | | ** Foreign investments | 94.1% | |

Annual Report
Investments July 31, 2012
Showing Percentage of Net Assets
Common Stocks - 95.5% |
| Shares | | Value |
Australia - 16.5% |
Abacus Property Group unit | 1,525,637 | | $ 3,182,535 |
ALE Property Group | 1,201,339 | | 2,638,598 |
Charter Hall Group unit | 1,090,003 | | 2,943,894 |
FKP Property Group unit (d) | 2,565,000 | | 1,010,834 |
Goodman Group unit | 660,608 | | 2,610,316 |
Mirvac Group unit | 6,636,138 | | 9,554,267 |
Westfield Group unit | 2,091,349 | | 21,977,989 |
TOTAL AUSTRALIA | | 43,918,433 |
Bailiwick of Jersey - 1.4% |
Atrium European Real Estate Ltd. | 838,372 | | 3,739,307 |
Belgium - 1.1% |
Warehouses de Pauw | 57,385 | | 2,894,867 |
Bermuda - 5.0% |
Csi Properties Ltd. | 32,517,682 | | 1,488,617 |
Great Eagle Holdings Ltd. | 1,247,088 | | 3,161,663 |
K Wah International Holdings Ltd. | 22,071 | | 8,083 |
Kerry Properties Ltd. | 1,601,000 | | 7,360,136 |
Soundwill Holdings Ltd. | 987,000 | | 1,458,602 |
TOTAL BERMUDA | | 13,477,101 |
Brazil - 0.8% |
Companhia Brasileira de Desenvolvimento Imobiliario Turistico SA (a) | 43,700 | | 413,926 |
Even Construtora e Incorporadora SA | 313,300 | | 1,001,423 |
Multiplan Empreendimentos Imobiliarios SA | 26,400 | | 667,601 |
TOTAL BRAZIL | | 2,082,950 |
Cayman Islands - 2.0% |
China Resources Land Ltd. | 350,000 | | 710,408 |
KWG Property Holding Ltd. | 2,022,000 | | 1,121,204 |
SOHO China Ltd. | 4,014,000 | | 2,986,676 |
SouFun Holdings Ltd. ADR (d) | 49,688 | | 589,300 |
TOTAL CAYMAN ISLANDS | | 5,407,588 |
Chile - 0.5% |
Parque Arauco SA | 657,471 | | 1,246,165 |
France - 6.3% |
Altarea | 10,800 | | 1,594,598 |
Societe de la Tour Eiffel | 25,127 | | 1,347,949 |
Common Stocks - continued |
| Shares | | Value |
France - continued |
Societe Fonciere Lyonnaise SA | 70,586 | | $ 2,809,566 |
Unibail-Rodamco | 56,857 | | 10,941,252 |
TOTAL FRANCE | | 16,693,365 |
Germany - 2.3% |
alstria office REIT-AG | 162,500 | | 1,808,857 |
Deutsche EuroShop AG | 49,075 | | 1,804,512 |
GSW Immobilien AG | 32,669 | | 1,203,868 |
IVG Immobilien AG (a) | 45,000 | | 104,590 |
Patrizia Immobilien AG (a) | 211,916 | | 1,299,796 |
TOTAL GERMANY | | 6,221,623 |
Hong Kong - 11.6% |
Hang Lung Properties Ltd. | 1,196,500 | | 4,258,501 |
Henderson Land Development Co. Ltd. | 984,000 | | 5,735,464 |
Hysan Development Co. Ltd. | 828,500 | | 3,504,301 |
Magnificent Estates Ltd. | 27,344,000 | | 1,022,575 |
Sun Hung Kai Properties Ltd. | 1,219,226 | | 15,242,880 |
Wheelock and Co. Ltd. | 313,000 | | 1,229,042 |
TOTAL HONG KONG | | 30,992,763 |
India - 0.5% |
Phoenix Mills Ltd. | 424,550 | | 1,405,997 |
Italy - 1.1% |
Beni Stabili SpA SIIQ | 5,246,133 | | 2,400,556 |
Immobiliare Grande Distribuzione SpA | 434,050 | | 411,222 |
TOTAL ITALY | | 2,811,778 |
Japan - 19.9% |
BLife Investment Corp. | 517 | | 3,612,670 |
Goldcrest Co. Ltd. | 199,340 | | 3,068,862 |
Japan Retail Fund Investment Corp. | 3,185 | | 5,326,889 |
Kenedix, Inc. (a)(d) | 11,063 | | 1,452,499 |
Mitsui Fudosan Co. Ltd. | 817,000 | | 15,741,416 |
Nomura Real Estate Holdings, Inc. | 332,700 | | 6,144,085 |
Sumitomo Realty & Development Co. Ltd. | 509,000 | | 12,665,728 |
United Urban Investment Corp. | 4,600 | | 4,990,855 |
TOTAL JAPAN | | 53,003,004 |
Mexico - 0.6% |
Corporacion Inmobiliaria Vesta SAB de CV | 1,039,303 | | 1,484,886 |
Common Stocks - continued |
| Shares | | Value |
Russia - 0.3% |
LSR Group OJSC GDR (Reg. S) | 192,400 | | $ 860,028 |
Singapore - 10.0% |
Global Logistic Properties Ltd. | 4,304,000 | | 7,782,064 |
Mapletree Industrial (REIT) | 3,355,000 | | 3,504,902 |
Parkway Life REIT | 3,409,000 | | 5,369,367 |
UOL Group Ltd. | 1,355,000 | | 5,640,389 |
Wing Tai Holdings Ltd. | 3,962,181 | | 4,489,453 |
TOTAL SINGAPORE | | 26,786,175 |
Sweden - 2.7% |
Castellum AB | 198,400 | | 2,665,016 |
Hufvudstaden AB Series A | 200,000 | | 2,435,061 |
Wihlborgs Fastigheter AB | 139,900 | | 2,031,442 |
TOTAL SWEDEN | | 7,131,519 |
United Kingdom - 12.9% |
Big Yellow Group PLC | 1,196,400 | | 5,852,420 |
British Land Co. PLC | 547,589 | | 4,588,882 |
Derwent London PLC | 149,600 | | 4,571,386 |
Hammerson PLC | 795,029 | | 5,772,478 |
Helical Bar PLC | 1,758,827 | | 5,432,426 |
Metric Property Investments PLC | 1,447,700 | | 1,929,310 |
Quintain Estates & Development PLC (a) | 1,937,100 | | 1,510,948 |
Safestore Holdings PLC | 1,315,000 | | 2,082,340 |
St. Modwen Properties PLC | 1,011,300 | | 2,806,453 |
TOTAL UNITED KINGDOM | | 34,546,643 |
TOTAL COMMON STOCKS (Cost $281,982,482) |
254,704,192
|
Money Market Funds - 4.6% |
| Shares | | Value |
Fidelity Cash Central Fund, 0.17% (b) | 11,441,650 | | $ 11,441,650 |
Fidelity Securities Lending Cash Central Fund, 0.18% (b)(c) | 870,644 | | 870,644 |
TOTAL MONEY MARKET FUNDS (Cost $12,312,294) |
12,312,294
|
TOTAL INVESTMENT PORTFOLIO - 100.1% (Cost $294,294,776) | | 267,016,486 |
NET OTHER ASSETS (LIABILITIES) - (0.1)% | | (218,547) |
NET ASSETS - 100% | $ 266,797,939 |
Legend |
(a) Non-income producing |
(b) Affiliated fund that is available only to investment companies and other accounts managed by Fidelity Investments. The rate quoted is the annualized seven-day yield of the fund at period end. A complete unaudited listing of the fund's holdings as of its most recent quarter end is available upon request. In addition, each Fidelity Central Fund's financial statements, which are not covered by the Fund's Report of Independent Registered Public Accounting Firm, are available on the SEC's website or upon request. |
(c) Investment made with cash collateral received from securities on loan. |
(d) Security or a portion of the security is on loan at period end. |
Affiliated Central Funds |
Information regarding fiscal year to date income earned by the Fund from investments in Fidelity Central Funds is as follows: |
Fund | Income earned |
Fidelity Cash Central Fund | $ 17,037 |
Fidelity Securities Lending Cash Central Fund | 77,977 |
Total | $ 95,014 |
Other Information |
Categorizations in the Schedule of Investments are based on country or territory of incorporation. |
The following is a summary of the inputs used, as of July 31, 2012, involving the Fund's assets and liabilities carried at fair value. The inputs or methodology used for valuing securities may not be an indication of the risk associated with investing in those securities. For more information on valuation inputs, and their aggregation into the levels used in the tables below, please refer to the Security Valuation section in the accompanying Notes to Financial Statements. |
Valuation Inputs at Reporting Date: |
Description | Total | Level 1 | Level 2 | Level 3 |
Investments in Securities: | | | | |
Equities: | | | | |
Consumer Discretionary | $ 2,023,998 | $ 2,023,998 | $ - | $ - |
Financials | 252,090,894 | 199,087,890 | 53,003,004 | - |
Information Technology | 589,300 | 589,300 | - | - |
Money Market Funds | 12,312,294 | 12,312,294 | - | - |
Total Investments in Securities: | $ 267,016,486 | $ 214,013,482 | $ 53,003,004 | $ - |
The following is a summary of transfers between Level 1 and Level 2 for the period ended July 31, 2012. Transfers are assumed to have occurred at the beginning of the period, and are primarily attributable to the valuation techniques used for foreign equity securities, as discussed in the accompanying Notes to Financial Statements: |
Transfers | Total |
Level 1 to Level 2 | $ 51,041,465 |
Level 2 to Level 1 | $ - |
See accompanying notes which are an integral part of the financial statements.
Annual Report
Statement of Assets and Liabilities
| July 31, 2012 |
| | |
Assets | | |
Investment in securities, at value (including securities loaned of $814,031) - See accompanying schedule: Unaffiliated issuers (cost $281,982,482) | $ 254,704,192 | |
Fidelity Central Funds (cost $12,312,294) | 12,312,294 | |
Total Investments (cost $294,294,776) | | $ 267,016,486 |
Foreign currency held at value (cost $413,341) | | 413,469 |
Receivable for investments sold | | 644,637 |
Receivable for fund shares sold | | 343,465 |
Dividends receivable | | 569,418 |
Distributions receivable from Fidelity Central Funds | | 3,238 |
Other receivables | | 92,780 |
Total assets | | 269,083,493 |
| | |
Liabilities | | |
Payable for investments purchased | $ 757,448 | |
Payable for fund shares redeemed | 252,652 | |
Accrued management fee | 153,109 | |
Distribution and service plan fees payable | 5,321 | |
Other affiliated payables | 72,468 | |
Other payables and accrued expenses | 173,912 | |
Collateral on securities loaned, at value | 870,644 | |
Total liabilities | | 2,285,554 |
| | |
Net Assets | | $ 266,797,939 |
Net Assets consist of: | | |
Paid in capital | | $ 611,378,296 |
Undistributed net investment income | | 4,308,924 |
Accumulated undistributed net realized gain (loss) on investments and foreign currency transactions | | (321,581,509) |
Net unrealized appreciation (depreciation) on investments and assets and liabilities in foreign currencies | | (27,307,772) |
Net Assets | | $ 266,797,939 |
See accompanying notes which are an integral part of the financial statements.
Annual Report
Financial Statements - continued
Statement of Assets and Liabilities - continued
| July 31, 2012 |
| | |
Calculation of Maximum Offering Price Class A:
Net Asset Value and redemption price per share ($7,116,550 ÷ 850,744 shares) | | $ 8.37 |
| | |
Maximum offering price per share (100/94.25 of $8.37) | | $ 8.88 |
Class T:
Net Asset Value and redemption price per share ($2,570,309 ÷ 309,041 shares) | | $ 8.32 |
| | |
Maximum offering price per share (100/96.50 of $8.32) | | $ 8.62 |
Class B:
Net Asset Value and offering price per share ($457,408 ÷ 55,542 shares)A | | $ 8.24 |
| | |
Class C:
Net Asset Value and offering price per share ($3,164,071 ÷ 385,508 shares)A | | $ 8.21 |
| | |
| | |
International Real Estate:
Net Asset Value, offering price and redemption price per share ($251,542,978 ÷ 29,803,415 shares) | | $ 8.44 |
| | |
Institutional Class:
Net Asset Value, offering price and redemption price per share ($1,946,623 ÷ 231,246 shares) | | $ 8.42 |
A Redemption price per share is equal to net asset value less any applicable contingent deferred sales charge.
See accompanying notes which are an integral part of the financial statements.
Annual Report
Statement of Operations
| Year ended July 31, 2012 |
| | |
Investment Income | | |
Dividends | | $ 9,616,226 |
Interest | | 122 |
Income from Fidelity Central Funds | | 95,014 |
Income before foreign taxes withheld | | 9,711,362 |
Less foreign taxes withheld | | (550,765) |
Total income | | 9,160,597 |
| | |
Expenses | | |
Management fee | $ 1,872,547 | |
Transfer agent fees | 790,564 | |
Distribution and service plan fees | 57,410 | |
Accounting and security lending fees | 137,396 | |
Custodian fees and expenses | 184,232 | |
Independent trustees' compensation | 1,771 | |
Registration fees | 80,907 | |
Audit | 77,170 | |
Legal | 1,045 | |
Miscellaneous | 4,049 | |
Total expenses before reductions | 3,207,091 | |
Expense reductions | (182,590) | 3,024,501 |
Net investment income (loss) | | 6,136,096 |
Realized and Unrealized Gain (Loss) Net realized gain (loss) on: | | |
Investment securities: | | |
Unaffiliated issuers | (26,508,546) | |
Foreign currency transactions | (257,489) | |
Total net realized gain (loss) | | (26,766,035) |
Change in net unrealized appreciation (depreciation) on: Investment securities | (20,196) | |
Assets and liabilities in foreign currencies | (18,559) | |
Total change in net unrealized appreciation (depreciation) | | (38,755) |
Net gain (loss) | | (26,804,790) |
Net increase (decrease) in net assets resulting from operations | | $ (20,668,694) |
See accompanying notes which are an integral part of the financial statements.
Annual Report
Financial Statements - continued
Statement of Changes in Net Assets
| Year ended
July 31,
2012 | Year ended
July 31,
2011 |
Increase (Decrease) in Net Assets | | |
Operations | | |
Net investment income (loss) | $ 6,136,096 | $ 14,085,086 |
Net realized gain (loss) | (26,766,035) | 37,430,925 |
Change in net unrealized appreciation (depreciation) | (38,755) | 3,876,295 |
Net increase (decrease) in net assets resulting
from operations | (20,668,694) | 55,392,306 |
Distributions to shareholders from net investment income | (6,740,519) | (13,892,744) |
Distributions to shareholders from net realized gain | (6,329,734) | (11,440,782) |
Total distributions | (13,070,253) | (25,333,526) |
Share transactions - net increase (decrease) | (36,696,766) | (26,030,265) |
Redemption fees | 82,484 | 74,922 |
Total increase (decrease) in net assets | (70,353,229) | 4,103,437 |
| | |
Net Assets | | |
Beginning of period | 337,151,168 | 333,047,731 |
End of period (including undistributed net investment income of $4,308,924 and undistributed net investment income of $4,912,084, respectively) | $ 266,797,939 | $ 337,151,168 |
See accompanying notes which are an integral part of the financial statements.
Annual Report
Financial Highlights - Class A
Years ended July 31, | 2012 | 2011 | 2010 | 2009 | 2008 |
Selected Per-Share Data | | | | | |
Net asset value, beginning of period | $ 9.21 | $ 8.46 | $ 8.24 | $ 10.63 | $ 15.71 |
Income from Investment Operations | | | | | |
Net investment income (loss) C | .16 | .34 F | .17 | .18 | .20 |
Net realized and unrealized gain (loss) | (.65) | 1.04 | .24 | (2.57) | (3.48) |
Total from investment operations | (.49) | 1.38 | .41 | (2.39) | (3.28) |
Distributions from net investment income | (.17) | (.33) | (.07) | - | (.31) |
Distributions from net realized gain | (.18) | (.29) | (.12) | - | (1.50) |
Total distributions | (.35) | (.63) I | (.19) | - | (1.81) |
Redemption fees added to paid in capital C | - H | - H | - H | - H | .01 |
Net asset value, end of period | $ 8.37 | $ 9.21 | $ 8.46 | $ 8.24 | $ 10.63 |
Total Return A,B | (4.88)% | 16.76% | 4.97% | (22.48)% | (23.20)% |
Ratios to Average Net Assets D,G | | | | | |
Expenses before reductions | 1.44% | 1.42% | 1.44% | 1.45% | 1.38% |
Expenses net of fee waivers, if any | 1.44% | 1.42% | 1.44% | 1.45% | 1.38% |
Expenses net of all reductions | 1.37% | 1.36% | 1.39% | 1.42% | 1.35% |
Net investment income (loss) | 2.09% | 3.67% F | 2.02% | 2.55% | 1.58% |
Supplemental Data | | | | | |
Net assets, end of period (000 omitted) | $ 7,117 | $ 7,047 | $ 7,250 | $ 6,745 | $ 9,976 |
Portfolio turnover rate E | 138% | 131% | 95% | 55% | 63% |
A Total returns would have been lower if certain expenses had not been reduced during the applicable periods shown.
B Total returns do not include the effect of the sales charges.
C Calculated based on average shares outstanding during the period.
D Fees and expenses of any underlying Fidelity Central Funds are not included in the Fund's expense ratio. The Fund indirectly bears its proportionate share of the expenses of any underlying Fidelity Central Funds.
E Amount does not include the portfolio activity of any underlying Fidelity Central Funds.
F Investment income per share reflects large, non-recurring dividends which amounted to $.19 per share. Excluding these non-recurring dividends, the ratio of net investment income (loss) to average net assets would have been 1.64%.
G Expense ratios reflect operating expenses of the class. Expenses before reductions do not reflect amounts reimbursed by the investment adviser or reductions from brokerage service arrangements or reductions from other expense offset arrangements and do not represent the amount paid by the class during periods when reimbursements or reductions occur. Expenses net of fee waivers reflect expenses after reimbursement by the investment adviser but prior to reductions from brokerage service arrangements or other expense offset arrangements. Expenses net of all reductions represent the net expenses paid by the class.
H Amount represents less than $.01 per share.
I Total distributions of $.63 per share is comprised of distributions from net investment income of $.333 and distributions from net realized gain of $.294 per share.
See accompanying notes which are an integral part of the financial statements.
Annual Report
Financial Highlights - Class T
Years ended July 31, | 2012 | 2011 | 2010 | 2009 | 2008 |
Selected Per-Share Data | | | | | |
Net asset value, beginning of period | $ 9.16 | $ 8.41 | $ 8.21 | $ 10.62 | $ 15.70 |
Income from Investment Operations | | | | | |
Net investment income (loss) C | .14 | .31 F | .15 | .17 | .17 |
Net realized and unrealized gain (loss) | (.66) | 1.04 | .23 | (2.58) | (3.48) |
Total from investment operations | (.52) | 1.35 | .38 | (2.41) | (3.31) |
Distributions from net investment income | (.14) | (.31) | (.06) | - | (.28) |
Distributions from net realized gain | (.18) | (.29) | (.12) | - | (1.50) |
Total distributions | (.32) | (.60) | (.18) | - | (1.78) |
Redemption fees added to paid in capital C | - H | - H | - H | - H | .01 |
Net asset value, end of period | $ 8.32 | $ 9.16 | $ 8.41 | $ 8.21 | $ 10.62 |
Total Return A,B | (5.23)% | 16.54% | 4.68% | (22.69)% | (23.39)% |
Ratios to Average Net Assets D,G | | | | | |
Expenses before reductions | 1.72% | 1.69% | 1.70% | 1.71% | 1.64% |
Expenses net of fee waivers, if any | 1.70% | 1.69% | 1.70% | 1.71% | 1.64% |
Expenses net of all reductions | 1.63% | 1.63% | 1.65% | 1.68% | 1.60% |
Net investment income (loss) | 1.83% | 3.41% F | 1.75% | 2.29% | 1.32% |
Supplemental Data | | | | | |
Net assets, end of period (000 omitted) | $ 2,570 | $ 2,496 | $ 2,510 | $ 2,080 | $ 7,566 |
Portfolio turnover rate E | 138% | 131% | 95% | 55% | 63% |
A Total returns would have been lower if certain expenses had not been reduced during the applicable periods shown.
B Total returns do not include the effect of the sales charges.
C Calculated based on average shares outstanding during the period.
D Fees and expenses of any underlying Fidelity Central Funds are not included in the Fund's expense ratio. The Fund indirectly bears its proportionate share of the expenses of any underlying Fidelity Central Funds.
E Amount does not include the portfolio activity of any underlying Fidelity Central Funds.
F Investment income per share reflects large, non-recurring dividends which amounted to $.19 per share. Excluding these non-recurring dividends, the ratio of net investment income (loss) to average net assets would have been 1.38%.
G Expense ratios reflect operating expenses of the class. Expenses before reductions do not reflect amounts reimbursed by the investment adviser or reductions from brokerage service arrangements or reductions from other expense offset arrangements and do not represent the amount paid by the class during periods when reimbursements or reductions occur. Expenses net of fee waivers reflect expenses after reimbursement by the investment adviser but prior to reductions from brokerage service arrangements or other expense offset arrangements. Expenses net of all reductions represent the net expenses paid by the class.
H Amount represents less than $.01 per share.
See accompanying notes which are an integral part of the financial statements.
Annual Report
Financial Highlights - Class B
Years ended July 31, | 2012 | 2011 | 2010 | 2009 | 2008 |
Selected Per-Share Data | | | | | |
Net asset value, beginning of period | $ 9.05 | $ 8.32 | $ 8.14 | $ 10.58 | $ 15.67 |
Income from Investment Operations | | | | | |
Net investment income (loss) C | .10 | .26 F | .11 | .13 | .11 |
Net realized and unrealized gain (loss) | (.64) | 1.03 | .23 | (2.57) | (3.48) |
Total from investment operations | (.54) | 1.29 | .34 | (2.44) | (3.37) |
Distributions from net investment income | (.09) | (.27) | (.04) | - | (.23) |
Distributions from net realized gain | (.18) | (.29) | (.12) | - | (1.50) |
Total distributions | (.27) | (.56) | (.16) | - | (1.73) |
Redemption fees added to paid in capital C | - H | - H | - H | - H | .01 |
Net asset value, end of period | $ 8.24 | $ 9.05 | $ 8.32 | $ 8.14 | $ 10.58 |
Total Return A,B | (5.61)% | 15.90% | 4.20% | (23.06)% | (23.80)% |
Ratios to Average Net Assets D,G | | | | | |
Expenses before reductions | 2.19% | 2.17% | 2.19% | 2.19% | 2.14% |
Expenses net of fee waivers, if any | 2.19% | 2.17% | 2.19% | 2.19% | 2.14% |
Expenses net of all reductions | 2.12% | 2.11% | 2.14% | 2.17% | 2.11% |
Net investment income (loss) | 1.34% | 2.92% F | 1.26% | 1.81% | .82% |
Supplemental Data | | | | | |
Net assets, end of period (000 omitted) | $ 457 | $ 570 | $ 629 | $ 606 | $ 930 |
Portfolio turnover rate E | 138% | 131% | 95% | 55% | 63% |
A Total returns would have been lower if certain expenses had not been reduced during the applicable periods shown.
B Total returns do not include the effect of the contingent deferred sales charge.
C Calculated based on average shares outstanding during the period.
D Fees and expenses of any underlying Fidelity Central Funds are not included in the Fund's expense ratio. The Fund indirectly bears its proportionate share of the expenses of any underlying Fidelity Central Funds.
E Amount does not include the portfolio activity of any underlying Fidelity Central Funds.
F Investment income per share reflects large, non-recurring dividends which amounted to $.18 per share. Excluding these non-recurring dividends, the ratio of net investment income (loss) to average net assets would have been .90%.
G Expense ratios reflect operating expenses of the class. Expenses before reductions do not reflect amounts reimbursed by the investment adviser or reductions from brokerage service arrangements or reductions from other expense offset arrangements and do not represent the amount paid by the class during periods when reimbursements or reductions occur. Expenses net of fee waivers reflect expenses after reimbursement by the investment adviser but prior to reductions from brokerage service arrangements or other expense offset arrangements. Expenses net of all reductions represent the net expenses paid by the class.
H Amount represents less than $.01 per share.
See accompanying notes which are an integral part of the financial statements.
Annual Report
Financial Highlights - Class C
Years ended July 31, | 2012 | 2011 | 2010 | 2009 | 2008 |
Selected Per-Share Data | | | | | |
Net asset value, beginning of period | $ 9.03 | $ 8.30 | $ 8.13 | $ 10.57 | $ 15.67 |
Income from Investment Operations | | | | | |
Net investment income (loss) C | .10 | .26 F | .11 | .13 | .11 |
Net realized and unrealized gain (loss) | (.64) | 1.04 | .22 | (2.57) | (3.48) |
Total from investment operations | (.54) | 1.30 | .33 | (2.44) | (3.37) |
Distributions from net investment income | (.10) | (.28) | (.04) | - | (.24) |
Distributions from net realized gain | (.18) | (.29) | (.12) | - | (1.50) |
Total distributions | (.28) | (.57) | (.16) | - | (1.74) |
Redemption fees added to paid in capital C | - H | - H | - H | - H | .01 |
Net asset value, end of period | $ 8.21 | $ 9.03 | $ 8.30 | $ 8.13 | $ 10.57 |
Total Return A,B | (5.68)% | 16.07% | 4.10% | (23.08)% | (23.78)% |
Ratios to Average Net Assets D,G | | | | | |
Expenses before reductions | 2.19% | 2.17% | 2.18% | 2.19% | 2.14% |
Expenses net of fee waivers, if any | 2.19% | 2.17% | 2.18% | 2.19% | 2.14% |
Expenses net of all reductions | 2.12% | 2.11% | 2.14% | 2.17% | 2.11% |
Net investment income (loss) | 1.34% | 2.92% F | 1.27% | 1.81% | .82% |
Supplemental Data | | | | | |
Net assets, end of period (000 omitted) | $ 3,164 | $ 3,208 | $ 3,201 | $ 2,496 | $ 3,477 |
Portfolio turnover rate E | 138% | 131% | 95% | 55% | 63% |
A Total returns would have been lower if certain expenses had not been reduced during the applicable periods shown.
B Total returns do not include the effect of the contingent deferred sales charge.
C Calculated based on average shares outstanding during the period.
D Fees and expenses of any underlying Fidelity Central Funds are not included in the Fund's expense ratio. The Fund indirectly bears its proportionate share of the expenses of any underlying Fidelity Central Funds.
E Amount does not include the portfolio activity of any underlying Fidelity Central Funds.
F Investment income per share reflects large, non-recurring dividends which amounted to $.18 per share. Excluding these non-recurring dividends, the ratio of net investment income (loss) to average net assets would have been .89%.
G Expense ratios reflect operating expenses of the class. Expenses before reductions do not reflect amounts reimbursed by the investment adviser or reductions from brokerage service arrangements or reductions from other expense offset arrangements and do not represent the amount paid by the class during periods when reimbursements or reductions occur. Expenses net of fee waivers reflect expenses after reimbursement by the investment adviser but prior to reductions from brokerage service arrangements or other expense offset arrangements. Expenses net of all reductions represent the net expenses paid by the class.
H Amount represents less than $.01 per share.
See accompanying notes which are an integral part of the financial statements.
Annual Report
Financial Highlights - International Real Estate
Years ended July 31, | 2012 | 2011 | 2010 | 2009 | 2008 |
Selected Per-Share Data | | | | | |
Net asset value, beginning of period | $ 9.30 | $ 8.53 | $ 8.29 | $ 10.68 | $ 15.73 |
Income from Investment Operations | | | | | |
Net investment income (loss) B | .18 | .36 E | .19 | .20 | .25 |
Net realized and unrealized gain (loss) | (.67) | 1.06 | .25 | (2.59) | (3.50) |
Total from investment operations | (.49) | 1.42 | .44 | (2.39) | (3.25) |
Distributions from net investment income | (.19) | (.35) | (.08) | - | (.31) |
Distributions from net realized gain | (.18) | (.29) | (.12) | - | (1.50) |
Total distributions | (.37) | (.65) H | (.20) | - | (1.81) |
Redemption fees added to paid in capital B | - G | - G | - G | - G | .01 |
Net asset value, end of period | $ 8.44 | $ 9.30 | $ 8.53 | $ 8.29 | $ 10.68 |
Total Return A | (4.76)% | 17.15% | 5.29% | (22.38)% | (22.97)% |
Ratios to Average Net Assets C,F | | | | | |
Expenses before reductions | 1.19% | 1.17% | 1.19% | 1.19% | 1.11% |
Expenses net of fee waivers, if any | 1.19% | 1.17% | 1.19% | 1.19% | 1.10% |
Expenses net of all reductions | 1.12% | 1.11% | 1.14% | 1.16% | 1.07% |
Net investment income (loss) | 2.34% | 3.92% E | 2.27% | 2.81% | 1.86% |
Supplemental Data | | | | | |
Net assets, end of period (000 omitted) | $ 251,543 | $ 322,045 | $ 318,032 | $ 336,126 | $ 572,985 |
Portfolio turnover rate D | 138% | 131% | 95% | 55% | 63% |
A Total returns would have been lower if certain expenses had not been reduced during the applicable periods shown.
B Calculated based on average shares outstanding during the period.
C Fees and expenses of any underlying Fidelity Central Funds are not included in the Fund's expense ratio. The Fund indirectly bears its proportionate share of the expenses of any underlying Fidelity Central Funds.
D Amount does not include the portfolio activity of any underlying Fidelity Central Funds.
E Investment income per share reflects large, non-recurring dividends which amounted to $.19 per share. Excluding these non-recurring dividends, the ratio of net investment income (loss) to average net assets would have been 1.90%.
F Expense ratios reflect operating expenses of the class. Expenses before reductions do not reflect amounts reimbursed by the investment adviser or reductions from brokerage service arrangements or reductions from other expense offset arrangements and do not represent the amount paid by the class during periods when reimbursements or reductions occur. Expenses net of fee waivers reflect expenses after reimbursement by the investment adviser but prior to reductions from brokerage service arrangements or other expense offset arrangements. Expenses net of all reductions represent the net expenses paid by the class.
G Amount represents less than $.01 per share.
H Total distributions of $.65 per share is comprised of distributions from net investment income of $.354 and distributions from net realized gain of $.294 per share.
See accompanying notes which are an integral part of the financial statements.
Annual Report
Financial Highlights - Institutional Class
Years ended July 31, | 2012 | 2011 | 2010 | 2009 | 2008 |
Selected Per-Share Data | | | | | |
Net asset value, beginning of period | $ 9.28 | $ 8.51 | $ 8.28 | $ 10.66 | $ 15.73 |
Income from Investment Operations | | | | | |
Net investment income (loss) B | .18 | .36 E | .19 | .20 | .24 |
Net realized and unrealized gain (loss) | (.67) | 1.06 | .24 | (2.58) | (3.49) |
Total from investment operations | (.49) | 1.42 | .43 | (2.38) | (3.25) |
Distributions from net investment income | (.20) | (.35) | (.08) | - | (.33) |
Distributions from net realized gain | (.18) | (.29) | (.12) | - | (1.50) |
Total distributions | (.37) H | (.65) I | (.20) | - | (1.83) |
Redemption fees added to paid in capital B | - G | - G | - G | - G | .01 |
Net asset value, end of period | $ 8.42 | $ 9.28 | $ 8.51 | $ 8.28 | $ 10.66 |
Total Return A | (4.73)% | 17.18% | 5.18% | (22.33)% | (22.98)% |
Ratios to Average Net Assets C,F | | | | | |
Expenses before reductions | 1.19% | 1.17% | 1.18% | 1.19% | 1.13% |
Expenses net of fee waivers, if any | 1.19% | 1.17% | 1.18% | 1.19% | 1.13% |
Expenses net of all reductions | 1.12% | 1.11% | 1.14% | 1.17% | 1.10% |
Net investment income (loss) | 2.34% | 3.92% E | 2.27% | 2.81% | 1.83% |
Supplemental Data | | | | | |
Net assets, end of period (000 omitted) | $ 1,947 | $ 1,785 | $ 1,425 | $ 1,600 | $ 3,289 |
Portfolio turnover rate D | 138% | 131% | 95% | 55% | 63% |
A Total returns would have been lower if certain expenses had not been reduced during the applicable periods shown.
B Calculated based on average shares outstanding during the period.
C Fees and expenses of any underlying Fidelity Central Funds are not included in the Fund's expense ratio. The Fund indirectly bears its proportionate share of the expenses of any underlying Fidelity Central Funds.
D Amount does not include the portfolio activity of any underlying Fidelity Central Funds.
E Investment income per share reflects large, non-recurring dividends which amounted to $.19 per share. Excluding these non-recurring dividends, the ratio of net investment income (loss) to average net assets would have been 1.90%.
F Expense ratios reflect operating expenses of the class. Expenses before reductions do not reflect amounts reimbursed by the investment adviser or reductions from brokerage service arrangements or reductions from other expense offset arrangements and do not represent the amount paid by the class during periods when reimbursements or reductions occur. Expenses net of fee waivers reflect expenses after reimbursement by the investment adviser but prior to reductions from brokerage service arrangements or other expense offset arrangements. Expenses net of all reductions represent the net expenses paid by the class.
G Amount represents less than $.01 per share.
H Total distributions of $.37 per share is comprised of distributions from net investment income of $.195 and distributions from net realized gain of $.178 per share.
I Total distributions of $.65 per share is comprised of distributions from net investment income of $.354 and distributions from net realized gain of $.294 per share.
See accompanying notes which are an integral part of the financial statements.
Annual Report
Notes to Financial Statements
For the period ended July 31, 2012
1. Organization.
Fidelity International Real Estate Fund (the Fund) is a non-diversified fund of Fidelity Securities Fund (the Trust) and is authorized to issue an unlimited number of shares. The Trust is registered under the Investment Company Act of 1940, as amended (the 1940 Act), as an open-end management investment company organized as a Massachusetts business trust. The Fund offers Class A, Class T, Class C, International Real Estate and Institutional Class shares, each of which, along with Class B shares, has equal rights as to assets and voting privileges. Effective after the close of business on September 1, 2010, Class B shares were closed to new accounts and additional purchases, except for exchanges and reinvestments. Each class has exclusive voting rights with respect to matters that affect that class. Class B shares will automatically convert to Class A shares after a holding period of seven years from the initial date of purchase. Investment income, realized and unrealized capital gains and losses, the common expenses of the Fund, and certain fund-level expense reductions, if any, are allocated on a pro-rata basis to each class based on the relative net assets of each class to the total net assets of the Fund. Each class differs with respect to transfer agent and distribution and service plan fees incurred. Certain expense reductions may also differ by class. The Fund's investments in emerging markets can be subject to social, economic, regulatory, and political uncertainties and can be extremely volatile.
2. Investments in Fidelity Central Funds.
The Fund invests in Fidelity Central Funds, which are open-end investment companies available only to other investment companies and accounts managed by Fidelity Management & Research Company (FMR) and its affiliates. The Fund's Schedule of Investments lists each of the Fidelity Central Funds held as of period end, if any, as an investment of the Fund, but does not include the underlying holdings of each Fidelity Central Fund. As an Investing Fund, the Fund indirectly bears its proportionate share of the expenses of the underlying Fidelity Central Funds.
The Money Market Central Funds seek preservation of capital and current income and are managed by Fidelity Investments Money Management, Inc. (FIMM), an affiliate of FMR.
A complete unaudited list of holdings for each Fidelity Central Fund is available upon request or at the Securities and Exchange Commission (the SEC) web site at www.sec.gov. In addition, the financial statements of the Fidelity Central Funds, which are not covered by the Fund's Report of Independent Registered Public Accounting Firm, are available on the SEC web site or upon request.
Annual Report
Notes to Financial Statements - continued
3. Significant Accounting Policies.
The financial statements have been prepared in conformity with accounting principles generally accepted in the United States of America (GAAP), which require management to make certain estimates and assumptions at the date of the financial statements. Actual results could differ from those estimates. Subsequent events, if any, through the date that the financial statements were issued have been evaluated in the preparation of the financial statements. The following summarizes the significant accounting policies of the Fund:
Security Valuation. Investments are valued as of 4:00 p.m. Eastern time on the last calendar day of the period. In accordance with valuation policies and procedures approved by the Board of Trustees (the Board), the Fund attempts to obtain prices from one or more third party pricing vendor or broker to value its investments. When current market prices, quotations or rates are not readily available or reliable, securities will be fair valued in good faith by the FMR Fair Value Committee (the Committee), in accordance with procedures adopted by the Fund's Board. Factors used in determining fair value vary by security type and may include market or security specific events. The frequency with which these procedures are used cannot be predicted and they may be utilized to a significant extent. The Committee oversees the Fund's valuation policies and procedures and is responsible for approving and reporting to the Board all fair value determinations.
The Fund categorizes the inputs to valuation techniques used to value its investments into a disclosure hierarchy consisting of three levels as shown below:
Level 1 - quoted prices in active markets for identical investments
Level 2 - other significant observable inputs (including quoted prices for similar investments, interest rates, prepayment speeds, etc.)
Level 3 - unobservable inputs (including the Fund's own assumptions based on the best information available)
Valuation techniques used to value the Fund's investments by major category are as follows:
Equity securities, including restricted securities, for which market quotations are readily available, are valued at the last reported sale price or official closing price as reported by a third party pricing vendor on the primary market or exchange on which they are traded and are categorized as Level 1 in the hierarchy. In the event there were no sales during the day or closing prices are not available, securities are valued at the last quoted bid price or may be valued using the last available price and are generally categorized as Level 2 in the hierarchy. For foreign equity securities, when significant market or security specific events arise, comparisons to the valuation of American Depositary Receipts
Annual Report
3. Significant Accounting Policies - continued
Security Valuation - continued
(ADRs), futures contracts, Exchange-Traded Funds (ETFs) and certain indexes as well as quoted prices for similar securities are used and are categorized as Level 2 in the hierarchy. Utilizing these techniques may result in transfers between Level 1 and Level 2.
Investments in open-end mutual funds, including the Fidelity Central Funds, are valued at their closing net asset value each business day and are categorized as Level 1 in the hierarchy.
Changes in valuation techniques may result in transfers in or out of an assigned level within the disclosure hierarchy. The aggregate value of investments by input level, as of July 31, 2012, including information on transfers between Levels 1 and 2, is included at the end of the Fund's Schedule of Investments.
Foreign Currency Translation. The Fund may use foreign currency contracts to facilitate transactions in foreign-denominated securities. Gains and losses from these transactions may arise from changes in the value of the foreign currency or if the counterparties do not perform under the contracts' terms.
Foreign-denominated assets, including investment securities, and liabilities are translated into U.S. dollars at the exchange rates at period end. Purchases and sales of investment securities, income and dividends received and expenses denominated in foreign currencies are translated into U.S. dollars at the exchange rate in effect on the transaction date.
The effects of exchange rate fluctuations on investments are included with the net realized and unrealized gain (loss) on investment securities. Other foreign currency transactions resulting in realized and unrealized gain (loss) are disclosed separately.
Investment Transactions and Income. For financial reporting purposes, the Fund's investment holdings and NAV include trades executed through the end of the last business day of the period. The NAV per share for processing shareholder transactions is calculated as of the close of business of the New York Stock Exchange (NYSE), normally 4:00 p.m. Eastern time and includes trades executed through the end of the prior business day. Gains and losses on securities sold are determined on the basis of identified cost. Dividend income is recorded on the ex-dividend date, except for certain dividends from foreign securities where the ex-dividend date may have passed, which are recorded as soon as the Fund is informed of the ex-dividend date. Non-cash dividends included in dividend income, if any, are recorded at the fair market value of the securities received. Interest income and distributions from the Fidelity Central Funds are accrued as earned. Interest income includes coupon interest and amortization of premium and accretion of discount on debt securities. Investment income is recorded net of foreign taxes withheld where recovery of such taxes is uncertain.
Annual Report
Notes to Financial Statements - continued
3. Significant Accounting Policies - continued
Expenses. Expenses directly attributable to a fund are charged to that fund. Expenses attributable to more than one fund are allocated among the respective funds on the basis of relative net assets or other appropriate methods. Expense estimates are accrued in the period to which they relate and adjustments are made when actual amounts are known.
Income Tax Information and Distributions to Shareholders. Each year, the Fund intends to qualify as a regulated investment company under Subchapter M of the Internal Revenue Code, including distributing substantially all of its taxable income and realized gains. As a result, no provision for income taxes is required. As of July 31, 2012, the Fund did not have any unrecognized tax benefits in the financial statements; nor is the Fund aware of any tax positions for which it is reasonably possible that the total amounts of unrecognized tax benefits will significantly change in the next twelve months. The Fund files a U.S. federal tax return, in addition to state and local tax returns as required. A fund's federal income tax returns are subject to examination by the Internal Revenue Service (IRS) for a period of three fiscal years after they are filed. State and local tax returns may be subject to examination for an additional fiscal year depending on the jurisdiction. Foreign taxes are provided for based on the Fund's understanding of the tax rules and rates that exist in the foreign markets in which it invests.
Distributions are declared and recorded on the ex-dividend date. Income dividends and capital gain distributions are declared separately for each class. Income and capital gain distributions are determined in accordance with income tax regulations, which may differ from GAAP.
Capital accounts within the financial statements are adjusted for permanent book-tax differences. These adjustments have no impact on net assets or the results of operations. Temporary book-tax differences will reverse in a subsequent period.
Book-tax differences are primarily due to foreign currency transactions, passive foreign investments companies (PFIC), capital loss carryforwards and losses deferred due to wash sales and excise tax regulations.
The federal tax cost of investment securities and unrealized appreciation (depreciation) as of period end were as follows:
Gross unrealized appreciation | $ 8,210,797 |
Gross unrealized depreciation | (42,520,691) |
Net unrealized appreciation (depreciation) on securities and other investments | $ (34,309,894) |
| |
Tax Cost | $ 301,326,380 |
Annual Report
3. Significant Accounting Policies - continued
Income Tax Information and Distributions to Shareholders - continued
The tax-based components of distributable earnings as of period end were as follows:
Undistributed ordinary income | $ 8,146,350 |
Capital loss carryforward | $ (305,203,415) |
Net unrealized appreciation (depreciation) | $ (34,346,659) |
Capital loss carryforwards are only available to offset future capital gains of the Fund to the extent provided by regulations and may be limited. Under the Regulated Investment Company Modernization Act of 2010 (the Act), the Fund is permitted to carry forward capital losses incurred in taxable years beginning after December 22, 2010 for an unlimited period and such capital losses are required to be used prior to any losses that expire. Capital loss carryforwards were as follows:
Fiscal year of expiration | |
2017 | $ (153,317,175) |
2018 | (136,599,532) |
Total with expiration | $ (289,916,707) |
No expiration | |
Short-term | $ (13,155,668) |
Long-term | (2,131,040) |
Total no expiration | (15,286,708) |
Total capital loss carryforward | $ (305,203,415) |
The Fund intends to elect to defer to its fiscal year ending July 31, 2013 approximately $13,183,916 of capital losses recognized during the period November 1, 2011 to July 31, 2012.
The tax character of distributions paid was as follows:
| July 31, 2012 | July 31, 2011 |
Ordinary Income | $ 13,070,253 | $ 25,333,526 |
Short-Term Trading (Redemption) Fees. Shares held by investors in the Fund less than 90 days are subject to a redemption fee equal to 1.50% of the net asset value of shares redeemed. All redemption fees, which reduce the proceeds of the shareholder redemption, are retained by the Fund and accounted for as an addition to paid in capital.
Annual Report
Notes to Financial Statements - continued
3. Significant Accounting Policies - continued
New Accounting Pronouncement. In December 2011, the Financial Accounting Standards Board issued Accounting Standard Update No. 2011-11, Disclosures about Offsetting Assets and Liabilities. The update creates new disclosure requirements requiring entities to disclose both gross and net information for derivatives and other financial instruments that are either offset in the Statement of Assets and Liabilities or subject to an enforceable master netting arrangement or similar agreement. The disclosure requirements are effective for interim and annual reporting periods beginning on or after January 1, 2013. Management is currently evaluating the impact of the update's adoption on the Fund's financial statement disclosures.
4. Purchases and Sales of Investments.
Purchases and sales of securities, other than short-term securities, aggregated $357,419,840 and $405,089,100, respectively.
5. Fees and Other Transactions with Affiliates.
Management Fee. FMR and its affiliates provide the Fund with investment management related services for which the Fund pays a monthly management fee. The management fee is the sum of an individual fund fee rate that is based on an annual rate of .45% of the Fund's average net assets and an annualized group fee rate that averaged .26% during the period. The group fee rate is based upon the average net assets of all the mutual funds advised by FMR. The group fee rate decreases as assets under management increase and increases as assets under management decrease. For the period, the total annual management fee rate was .71% of the Fund's average net assets.
Distribution and Service Plan Fees. In accordance with Rule 12b-1 of the 1940 Act, the Fund has adopted separate Distribution and Service Plans for each class of shares. Certain classes pay Fidelity Distributors Corporation (FDC), an affiliate of FMR, separate Distribution and Service Fees, each of which is based on an annual percentage of each class' average net assets. In addition, FDC may pay financial intermediaries for selling shares of the Fund and providing shareholder support services. For the period, the Distribution and Service Fee rates, total fees and amounts retained by FDC were as follows:
| Distribution
Fee | Service
Fee | Total Fees | Retained
by FDC |
Class A | -% | .25% | $ 15,646 | $ 39 |
Class T | .25% | .25% | 10,228 | - |
Class B | .75% | .25% | 4,466 | 3,349 |
Class C | .75% | .25% | 27,070 | 3,373 |
| | | $ 57,410 | $ 6,761 |
Annual Report
5. Fees and Other Transactions with Affiliates - continued
Sales Load. FDC may receive a front-end sales charge of up to 5.75% for selling Class A shares and 3.50% for selling Class T shares, some of which is paid to financial intermediaries for selling shares of the Fund. Depending on the holding period, FDC may receive contingent deferred sales charges levied on Class A, Class T, Class B, and Class C redemptions. The deferred sales charges range from 5.00% to 1.00% for Class B shares, 1.00% for Class C shares, 1.00% for certain purchases of Class A shares and .25% for certain purchases of Class T shares.
For the period, sales charge amounts retained by FDC were as follows:
| Retained
by FDC |
Class A | $ 6,375 |
Class T | 1,412 |
Class B* | 1,293 |
Class C* | 136 |
| $ 9,216 |
* When Class B and Class C shares are initially sold, FDC pays commissions from its own resources to financial intermediaries through which the sales are made.
Transfer Agent Fees. Fidelity Investments Institutional Operations Company, Inc. (FIIOC), an affiliate of FMR, is the transfer, dividend disbursing and shareholder servicing agent for each class of the Fund. FIIOC receives account fees and asset-based fees that vary according to the account size and type of account of the shareholders of the respective classes of the Fund. FIIOC pays for typesetting, printing and mailing of shareholder reports, except proxy statements. For the period, transfer agent fees for each class were as follows:
| Amount | % of
Average
Net Assets |
Class A | $ 18,681 | .30 |
Class T | 6,690 | .33 |
Class B | 1,338 | .30 |
Class C | 8,040 | .30 |
International Real Estate | 750,777 | .30 |
Institutional Class | 5,038 | .30 |
| $ 790,564 | |
Annual Report
Notes to Financial Statements - continued
5. Fees and Other Transactions with Affiliates - continued
Accounting and Security Lending Fees. Fidelity Service Company, Inc. (FSC), an affiliate of FMR, maintains the Fund's accounting records. The accounting fee is based on the level of average net assets for each month. Under a separate contract, FSC administers the security lending program. The security lending fee is based on the number and duration of lending transactions.
Brokerage Commissions. The Fund placed a portion of its portfolio transactions with brokerage firms which are affiliates of the investment adviser. The commissions paid to these affiliated firms were $12 for the period.
6. Committed Line of Credit.
The Fund participates with other funds managed by FMR or an affiliate in a $4.25 billion credit facility (the "line of credit") to be utilized for temporary or emergency purposes to fund shareholder redemptions or for other short-term liquidity purposes. The Fund has agreed to pay commitment fees on its pro-rata portion of the line of credit, which amounted to $766 and is reflected in Miscellaneous expenses on the Statement of Operations. During the period, there were no borrowings on this line of credit.
7. Security Lending.
The Fund lends portfolio securities through a lending agent from time to time in order to earn additional income. For equity securities, a lending agent is used and may loan securities to certain qualified borrowers, including Fidelity Capital Markets (FCM), a broker-dealer affiliated with the Fund. On the settlement date of the loan, the Fund receives collateral (in the form of U.S. Treasury obligations, letters of credit and/or cash) against the loaned securities and maintains collateral in an amount not less than 100% of the market value of the loaned securities during the period of the loan. The market value of the loaned securities is determined at the close of business of the Fund and any additional required collateral is delivered to the Fund on the next business day. If the borrower defaults on its obligation to return the securities loaned because of insolvency or other reasons, a fund could experience delays and costs in recovering the securities loaned or in gaining access to the collateral. Any cash collateral received is invested in the Fidelity Securities Lending Cash Central Fund. The value of loaned securities and cash collateral at period end are disclosed on the Fund's Statement of Assets and Liabilities. Security lending income represents the income earned on investing cash collateral, less rebates paid to borrowers and any lending agent fees associated with the loan, plus any premium payments received for lending certain types of securities. Security lending income is presented in the Statement of Operations as a component of income from Fidelity Central Funds. Total security lending income during the period amounted to $77,977. During the period, there were no securities loaned to FCM.
Annual Report
8. Expense Reductions.
FMR voluntarily agreed to reimburse each class to the extent annual operating expenses exceeded certain levels of average net assets as noted in the table below. Some expenses, for example interest expense, including commitment fees, are excluded from this reimbursement.
The following classes were in reimbursement during the period:
| Expense
Limitations | Reimbursement
from adviser |
Class T | 1.70% | $ 378 |
Many of the brokers with whom FMR places trades on behalf of the Fund provided services to the Fund in addition to trade execution. These services included payments of certain expenses on behalf of the Fund totaling $182,189 for the period. In addition, through arrangements with the Fund's custodian, credits realized as a result of uninvested cash balances were used to reduce the Fund's expenses. During the period, these credits reduced the Fund's custody expenses by $23.
9. Distributions to Shareholders.
Distributions to shareholders of each class were as follows:
Years ended July 31, | 2012 | 2011 |
From net investment income | | |
Class A | $ 129,790 | $ 287,564 |
Class T | 38,723 | 96,278 |
Class B | 5,465 | 19,520 |
Class C | 34,224 | 109,655 |
International Real Estate | 6,491,807 | 13,319,427 |
Institutional Class | 40,510 | 60,300 |
Total | $ 6,740,519 | $ 13,892,744 |
From net realized gain | | |
Class A | $ 132,606 | $ 250,090 |
Class T | 47,658 | 89,657 |
Class B | 10,422 | 21,506 |
Class C | 62,457 | 114,914 |
International Real Estate | 6,040,035 | 10,916,536 |
Institutional Class | 36,556 | 48,079 |
Total | $ 6,329,734 | $ 11,440,782 |
Annual Report
Notes to Financial Statements - continued
10. Share Transactions.
Transactions for each class of shares were as follows:
| Shares | Dollars |
Years ended July 31, | 2012 | 2011 | 2012 | 2011 |
Class A | | | | |
Shares sold | 561,131 | 213,763 | $ 4,326,130 | $ 1,964,473 |
Reinvestment of distributions | 30,139 | 50,966 | 225,090 | 451,020 |
Shares redeemed | (505,235) | (357,321) | (3,930,366) | (3,278,956) |
Net increase (decrease) | 86,035 | (92,592) | $ 620,854 | $ (863,463) |
Class T | | | | |
Shares sold | 121,127 | 73,470 | $ 960,744 | $ 668,265 |
Reinvestment of distributions | 11,086 | 20,063 | 82,612 | 176,852 |
Shares redeemed | (95,807) | (119,466) | (730,690) | (1,082,947) |
Net increase (decrease) | 36,406 | (25,933) | $ 312,666 | $ (237,830) |
Class B | | | | |
Shares sold | 10,309 | 4,563 | $ 80,691 | $ 41,321 |
Reinvestment of distributions | 2,053 | 4,289 | 15,253 | 37,454 |
Shares redeemed | (19,799) | (21,555) | (151,766) | (195,000) |
Net increase (decrease) | (7,437) | (12,703) | $ (55,822) | $ (116,225) |
Class C | | | | |
Shares sold | 126,213 | 111,487 | $ 1,000,819 | $ 1,002,010 |
Reinvestment of distributions | 11,099 | 21,061 | 82,243 | 183,176 |
Shares redeemed | (107,140) | (162,778) | (798,655) | (1,467,063) |
Net increase (decrease) | 30,172 | (30,230) | $ 284,407 | $ (281,877) |
International Real Estate | | | | |
Shares sold | 6,073,777 | 7,219,780 | $ 47,017,817 | $ 67,747,351 |
Reinvestment of distributions | 1,561,125 | 2,559,870 | 11,751,117 | 22,802,021 |
Shares redeemed | (12,463,432) | (12,440,980) | (96,926,190) | (115,315,484) |
Net increase (decrease) | (4,828,530) | (2,661,330) | $ (38,157,256) | $ (24,766,112) |
Institutional Class | | | | |
Shares sold | 125,764 | 99,324 | $ 977,184 | $ 925,861 |
Reinvestment of distributions | 8,633 | 10,892 | 64,775 | 96,908 |
Shares redeemed | (95,484) | (85,350) | (743,574) | (787,527) |
Net increase (decrease) | 38,913 | 24,866 | $ 298,385 | $ 235,242 |
Annual Report
11. Other.
The Fund's organizational documents provide former and current trustees and officers with a limited indemnification against liabilities arising in connection with the performance of their duties to the Fund. In the normal course of business, the Fund may also enter into contracts that provide general indemnifications. The Fund's maximum exposure under these arrangements is unknown as this would be dependent on future claims that may be made against the Fund. The risk of material loss from such claims is considered remote.
At the end of the period, FMR or its affiliates were the owners of record of approximately 12% of the outstanding shares of the fund.
Annual Report
To the Trustees of Fidelity Securities Fund and the Shareholders of Fidelity International Real Estate Fund:
In our opinion, the accompanying statement of assets and liabilities, including the schedule of investments, and the related statements of operations and of changes in net assets and the financial highlights present fairly, in all material respects, the financial position of Fidelity International Real Estate Fund (a fund of Fidelity Securities Fund) at July 31, 2012, the results of its operations for the year then ended, the changes in its net assets for each of the two years in the period then ended and the financial highlights for each of the five years in the period then ended, in conformity with accounting principles generally accepted in the United States of America. These financial statements and financial highlights (hereafter referred to as "financial statements") are the responsibility of the Fidelity International Real Estate Fund's management. Our responsibility is to express an opinion on these financial statements based on our audits. We conducted our audits of these financial statements in accordance with the standards of the Public Company Accounting Oversight Board (United States). Those standards require that we plan and perform the audit to obtain reasonable assurance about whether the financial statements are free of material misstatement. An audit includes examining, on a test basis, evidence supporting the amounts and disclosures in the financial statements, assessing the accounting principles used and significant estimates made by management, and evaluating the overall financial statement presentation. We believe that our audits, which included confirmation of securities at July 31, 2012 by correspondence with the custodian and brokers, provide a reasonable basis for our opinion.
PricewaterhouseCoopers LLP
Boston, Massachusetts
September 13, 2012
Annual Report
The Trustees, Members of the Advisory Board, and executive officers of the trust and fund, as applicable, are listed below. The Board of Trustees governs the fund and is responsible for protecting the interests of shareholders. The Trustees are experienced executives who meet periodically throughout the year to oversee the fund's activities, review contractual arrangements with companies that provide services to the fund, oversee management of the risks associated with such activities and contractual arrangements, and review the fund's performance. Except for James C. Curvey, each of the Trustees oversees 228 funds advised by FMR or an affiliate. Mr. Curvey oversees 435 funds advised by FMR or an affiliate.
The Trustees hold office without limit in time except that (a) any Trustee may resign; (b) any Trustee may be removed by written instrument, signed by at least two-thirds of the number of Trustees prior to such removal; (c) any Trustee who requests to be retired or who has become incapacitated by illness or injury may be retired by written instrument signed by a majority of the other Trustees; and (d) any Trustee may be removed at any special meeting of shareholders by a two-thirds vote of the outstanding voting securities of the trust. Each Trustee who is not an interested person (as defined in the 1940 Act) (Independent Trustee), shall retire not later than the last day of the calendar year in which his or her 75th birthday occurs. The Independent Trustees may waive this mandatory retirement age policy with respect to individual Trustees. The executive officers and Advisory Board Members hold office without limit in time, except that any officer and Advisory Board Member may resign or may be removed by a vote of a majority of the Trustees at any regular meeting or any special meeting of the Trustees. Except as indicated, each individual has held the office shown or other offices in the same company for the past five years.
Experience, Skills, Attributes, and Qualifications of the Fund's Trustees. The Governance and Nominating Committee has adopted a statement of policy that describes the experience, qualifications, attributes, and skills that are necessary and desirable for potential Independent Trustee candidates (Statement of Policy). The Board believes that each Trustee satisfied at the time he or she was initially elected or appointed a Trustee, and continues to satisfy, the standards contemplated by the Statement of Policy. The Governance and Nominating Committee also engages professional search firms to help identify potential Independent Trustee candidates who have the experience, qualifications, attributes, and skills consistent with the Statement of Policy. From time to time, additional criteria based on the composition and skills of the current Independent Trustees, as well as experience or skills that may be appropriate in light of future changes to board composition, business conditions, and regulatory or other developments, have also been considered by the professional search firms and the Governance and Nominating Committee. In addition, the Board takes into account the Trustees' commitment and participation in Board and committee meetings, as well as their leadership of standing and ad hoc committees throughout their tenure.
In determining that a particular Trustee was and continues to be qualified to serve as a Trustee, the Board has considered a variety of criteria, none of which, in isolation, was controlling. The Board believes that, collectively, the Trustees have balanced and diverse experience, qualifications, attributes, and skills, which allow the Board to operate effectively in governing the fund and protecting the interests of shareholders. Information about the specific experience, skills, attributes, and qualifications of each Trustee, which in each case led to the Board's conclusion that the Trustee should serve (or continue to serve) as a trustee of the fund, is provided below.
Annual Report
Board Structure and Oversight Function. James C. Curvey is an interested person (as defined in the 1940 Act) and currently serves as Chairman. The Trustees have determined that an interested Chairman is appropriate and benefits shareholders because an interested Chairman has a personal and professional stake in the quality and continuity of services provided to the fund. Independent Trustees exercise their informed business judgment to appoint an individual of their choosing to serve as Chairman, regardless of whether the Trustee happens to be independent or a member of management. The Independent Trustees have determined that they can act independently and effectively without having an Independent Trustee serve as Chairman and that a key structural component for assuring that they are in a position to do so is for the Independent Trustees to constitute a substantial majority for the Board. The Independent Trustees also regularly meet in executive session. Ned C. Lautenbach serves as Chairman of the Independent Trustees and as such (i) acts as a liaison between the Independent Trustees and management with respect to matters important to the Independent Trustees and (ii) with management prepares agendas for Board meetings.
Fidelity funds are overseen by different Boards of Trustees. The fund's Board oversees Fidelity's equity and high income funds and another Board oversees Fidelity's investment-grade bond, money market, and asset allocation funds. The asset allocation funds may invest in Fidelity funds overseen by the fund's Board. The use of separate Boards, each with its own committee structure, allows the Trustees of each group of Fidelity funds to focus on the unique issues of the funds they oversee, including common research, investment, and operational issues. On occasion, the separate Boards establish joint committees to address issues of overlapping consequences for the Fidelity funds overseen by each Board.
The Trustees operate using a system of committees to facilitate the timely and efficient consideration of all matters of importance to the Trustees, the fund, and fund shareholders and to facilitate compliance with legal and regulatory requirements and oversight of the fund's activities and associated risks. The Board, acting through its committees, has charged FMR and its affiliates with (i) identifying events or circumstances the occurrence of which could have demonstrably adverse effects on the fund's business and/or reputation; (ii) implementing processes and controls to lessen the possibility that such events or circumstances occur or to mitigate the effects of such events or circumstances if they do occur; and (iii) creating and maintaining a system designed to evaluate continuously business and market conditions in order to facilitate the identification and implementation processes described in (i) and (ii) above. Because the day-to-day operations and activities of the fund are carried out by or through FMR, its affiliates and other service providers, the fund's exposure to risks is mitigated but not eliminated by the processes overseen by the Trustees. While each of the Board's committees has responsibility for overseeing different aspects of the fund's activities, oversight is exercised primarily through the Operations, Audit, and Compliance Committees. In addition, the Independent Trustees have worked with FMR to enhance the Board's oversight of investment and financial risks, legal and regulatory risks, technology risks, and operational risks, including the development of additional risk reporting to the Board. For example, a working group comprised of Independent Trustees and FMR has worked and continues to work to review the Fidelity funds' valuation-related activities, reporting and risk management. Appropriate personnel, including but not limited to the fund's Chief Compliance Officer (CCO), FMR's internal auditor, the independent accountants, the fund's Treasurer and portfolio management personnel, make periodic reports to the Board's committees, as appropriate, including an annual review of FMR's risk management program for the Fidelity funds. The responsibilities of each standing committee, including their oversight responsibilities, are described further under "Standing Committees of the Fund's Trustees."
Annual Report
Trustees and Officers - continued
The fund's Statement of Additional Information (SAI) includes more information about the Trustees. To request a free copy, call Fidelity at 1-800-544-8544.
Interested Trustees*:
Correspondence intended for each Trustee who is an interested person may be sent to Fidelity Investments, 82 Devonshire Street, Boston, Massachusetts 02109.
Name, Age; Principal Occupations and Other Relevant Experience+ |
James C. Curvey (77) |
| Year of Election or Appointment: 2007 Mr. Curvey is Trustee and Chairman of the Board of Trustees of certain Trusts. Mr. Curvey also serves as Trustee (2007-present) of other investment companies advised by FMR. Mr. Curvey is a Director of Fidelity Investments Money Management, Inc. (2009-present), Director of Fidelity Research & Analysis Co. (2009-present) and Director of FMR and FMR Co., Inc. (2007-present). Mr. Curvey is also Vice Chairman (2007-present) and Director of FMR LLC. In addition, Mr. Curvey serves as an Overseer for the Boston Symphony Orchestra and a member of the Trustees of Villanova University. Previously, Mr. Curvey was the Vice Chairman (2006-2007) and Director (2000-2007) of FMR Corp. |
Ronald P. O'Hanley (55) |
| Year of Election or Appointment: 2011 Mr. O'Hanley is Director of FMR Co., Inc. (2010-present), Director of Fidelity Investments Money Management, Inc. (2010-present), Director of Fidelity Research & Analysis Company (2010-present), President of Fidelity Asset Management and Corporate Services and a member of Fidelity's Executive Committee (2010-present). Previously, Mr. O'Hanley served as President and Chief Executive Officer of BNY Mellon Asset Management (2007-2010). Mr. O'Hanley also served as Vice Chairman of Bank New York Mellon Corp. and a member of that firm's Executive Committee. Prior to the 2007 merger of The Bank of New York and Mellon Financial Corporation, he was Vice Chairman of Mellon Financial Corporation and President and Chief Executive Officer of Mellon Asset Management. He joined Mellon in February 1997. Mr. O'Hanley currently serves as Chairman of the Boston Public Library Foundation Board of Directors and sits on the Board of Directors of Beth Israel Deaconess Medical Center, the Board of Trustees of the Marine Biological Laboratory and the Advisory Board of the Maxwell School of Citizenship and Public Administration at Syracuse University. Mr. O'Hanley also chairs the Council on Asset Management for the Financial Services Roundtable and is a member of the Board of Directors of Institutional Investor's U.S. Institute. |
* Trustees have been determined to be "Interested Trustees" by virtue of, among other things, their affiliation with the trust or various entities under common control with FMR.
+ The information above includes each Trustee's principal occupation during the last five years and other information relating to the experience, attributes, and skills relevant to each Trustee's qualifications to serve as a Trustee, which led to the conclusion that each Trustee should serve as a Trustee for the fund.
Annual Report
Trustees and Officers - continued
Independent Trustees:
Correspondence intended for each Independent Trustee (that is, the Trustees other than the Interested Trustees) may be sent to Fidelity Investments, P.O. Box 55235, Boston, Massachusetts 02205-5235.
Name, Age; Principal Occupations and Other Relevant Experience+ |
Dennis J. Dirks (64) |
| Year of Election or Appointment: 2005 Prior to his retirement in May 2003, Mr. Dirks was Chief Operating Officer and a member of the Board of The Depository Trust & Clearing Corporation (DTCC). He also served as President, Chief Operating Officer, and Board member of The Depository Trust Company (DTC) and President and Board member of the National Securities Clearing Corporation (NSCC). In addition, Mr. Dirks served as Chief Executive Officer and Board member of the Government Securities Clearing Corporation, Chief Executive Officer and Board member of the Mortgage-Backed Securities Clearing Corporation, as a Trustee and a member of the Finance Committee of Manhattan College (2005-2008), and as a Trustee and a member of the Finance Committee of AHRC of Nassau County (2006-2008). Mr. Dirks is a member of the Independent Directors Council (IDC) Governing Council (2010-present) and Board of Directors for The Brookville Center for Children's Services, Inc. (2009-present). |
Alan J. Lacy (58) |
| Year of Election or Appointment: 2008 Mr. Lacy serves as Senior Adviser (2007-present) of Oak Hill Capital Partners, L.P. (private equity). Mr. Lacy also served as Chief Executive Officer (2000-2005) and Vice Chairman (2005-2006) of Sears Holdings Corporation and Sears, Roebuck and Co. (retail). In addition, Mr. Lacy serves as a member of the Board of Directors of Dave & Buster's Entertainment, Inc. (restaurant and entertainment complexes, 2010-present), Earth Fare, Inc. (retail grocery, 2012-present), The Hillman Companies, Inc. (hardware wholesalers, 2010-present), and Bristol-Myers Squibb Company (global pharmaceuticals, 2007-present). Mr. Lacy is a member of the Board of Trustees of The National Parks Conservation Association (2006-present). Previously, Mr. Lacy served as Chairman of the Board of Trustees of the National Parks Conservation Association (2008-2011) and as a member of the Board of Directors for the Western Union Company (global money transfer, 2006-2011). |
Ned C. Lautenbach (68) |
| Year of Election or Appointment: 2000 Mr. Lautenbach is Chairman of the Independent Trustees of the Equity and High Income Funds (2006-present). Mr. Lautenbach currently serves as the Lead Director of the Eaton Corporation Board of Directors (diversified industrial, 1997-present). Mr. Lautenbach is Chairman of the Board of Directors of the Philharmonic Center for the Arts in Naples, Florida (2012-present) and a member of the Council on Foreign Relations (1994-present). Previously, Mr. Lautenbach was a Partner/Advisory Partner at Clayton, Dubilier & Rice, LLC (private equity investment, 1998-2010), as well as a Director of Sony Corporation (2006-2007). |
Joseph Mauriello (67) |
| Year of Election or Appointment: 2008 Prior to his retirement in January 2006, Mr. Mauriello served in numerous senior management positions including Deputy Chairman and Chief Operating Officer (2004-2005), and Vice Chairman of Financial Services (2002-2004) of KPMG LLP US (professional services, 1965-2005). Mr. Mauriello currently serves as a member of the Board of Directors of XL Group plc. (global insurance and re-insurance, 2006-present). Previously, Mr. Mauriello served as a Director of the Hamilton Funds of the Bank of New York (2006-2007) and of Arcadia Resources Inc. (health care services and products, 2007-2012). |
Robert W. Selander (61) |
| Year of Election or Appointment: 2011 Previously, Mr. Selander served as a Member of the Advisory Board of Fidelity's Equity and High Income Funds (2011), Executive Vice Chairman (2010), Chief Executive Officer (2009-2010), and President and Chief Executive Officer (1997-2009) of Mastercard, Inc. |
Cornelia M. Small (68) |
| Year of Election or Appointment: 2005 Ms. Small is a member of the Board of Directors of the Teagle Foundation (2009-present). Ms. Small is also a member of the Investment Committee, and Chair (2008-present) and a member of the Board of Trustees of Smith College. In addition, Ms. Small serves on the Investment Committee of the Berkshire Taconic Community Foundation (2008-present). Previously, Ms. Small served as Chairperson of the Investment Committee (2002-2008) of Smith College. In addition, Ms. Small served as Chief Investment Officer, Director of Global Equity Investments, and a member of the Board of Directors of Scudder, Stevens & Clark and Scudder Kemper Investments. |
William S. Stavropoulos (73) |
| Year of Election or Appointment: 2002 Mr. Stavropoulos is Vice Chairman of the Independent Trustees of the Equity and High Income Funds (2006-present). Mr. Stavropoulos serves as President and Founder of the Michigan Baseball Foundation, the Great Lakes Loons (2007-present). Mr. Stavropoulos is Chairman Emeritus of the Board of Directors of The Dow Chemical Company, where he previously served in numerous senior management positions, including President, CEO (1995-2000; 2002-2004), Chairman of the Executive Committee (2000-2006), and as a member of the Board of Directors (1990-2006). Currently, Mr. Stavropoulos is Chairman of Univar (global distributor of commodity and specialty chemicals, 2010-present), a Director of Teradata Corporation (data warehousing and technology solutions, 2008-present), Chemical Financial Corporation, Maersk Inc. (industrial conglomerate), Tyco International, Inc. (multinational manufacturing and services, 2007-present), and a member of the Advisory Board for Metalmark Capital (private equity investment, 2005-present). Mr. Stavropoulos is a special advisor to Clayton, Dubilier & Rice, LLC (private equity investment). In addition, Mr. Stavropoulos is a member of the University of Notre Dame Advisory Council for the College of Science. |
David M. Thomas (63) |
| Year of Election or Appointment: 2008 Previously, Mr. Thomas served as Executive Chairman (2005-2006) and Chairman and Chief Executive Officer (2000-2005) of IMS Health, Inc. (pharmaceutical and healthcare information solutions). In addition, Mr. Thomas serves as a member of the Board of Directors of Fortune Brands, Inc. (consumer products), and Interpublic Group of Companies, Inc. (marketing communication, 2004-present). |
Michael E. Wiley (61) |
| Year of Election or Appointment: 2008 Mr. Wiley also serves as a Director of Asia Pacific Exploration Consolidated (international oil and gas exploration and production, 2008-present). Mr. Wiley serves as a Director of Tesoro Corporation (independent oil refiner and marketer, 2005-present), and a Director of Bill Barrett Corporation (exploration and production, 2005-present). In addition, Mr. Wiley also serves as a Director of Post Oak Bank (privately-held bank, 2004-present). Previously, Mr. Wiley served as a member of the Board of Trustees of the University of Tulsa (2000-2006; 2007-2010), as a Senior Energy Advisor of Katzenbach Partners, LLC (consulting, 2006-2007), as an Advisory Director of Riverstone Holdings (private investment), Chairman, President, and CEO of Baker Hughes, Inc. (oilfield services, 2000-2004), and as Director of Spinnaker Exploration Company (exploration and production, 2001-2005). |
Annual Report
+ The information above includes each Trustee's principal occupation during the last five years and other information relating to the experience, attributes, and skills relevant to each Trustee's qualifications to serve as a Trustee, which led to the conclusion that each Trustee should serve as a Trustee for the fund.
Advisory Board Members and Executive Officers:
Correspondence intended for David A. Rosow and Garnett A. Smith may be sent to Fidelity Investments, P.O. Box 55235, Boston, Massachusetts 02205-5235. Correspondence intended for each executive officer, Edward C. Johnson 3d, and Peter S. Lynch may be sent to Fidelity Investments, 82 Devonshire Street, Boston, Massachusetts 02109.
Name, Age; Principal Occupation |
Edward C. Johnson 3d (82) |
| Year of Election or Appointment: 2011 Member of the Advisory Board of Fidelity's Equity and High Income Funds. Mr. Johnson serves as Chief Executive Officer, Chairman, and a Director of FMR LLC, and also serves as Chairman and Director of FIL Limited. Previously, Mr. Johnson served as a Trustee and Chairman of the Board of certain Fidelity Trusts, Chairman and a Director of FMR, Chairman and a Director of FMR Co., Inc., and President of FMR LLC (2006-2007). |
Peter S. Lynch (68) |
| Year of Election or Appointment: 2003 Member of the Advisory Board of Fidelity's Equity and High Income Funds. Mr. Lynch is Vice Chairman and a Director of FMR and FMR Co., Inc. In addition, Mr. Lynch serves as a Trustee of Boston College and as the Chairman of the Inner-City Scholarship Fund. Previously, Mr. Lynch served on the Special Olympics International Board of Directors (1997-2006). |
David A. Rosow (69) |
| Year of Election or Appointment: 2012 Member of the Advisory Board of Fidelity's Equity and High Income Funds. Chairman and Chief Executive Officer of International Golf Group, Inc. (golf course development, 1990-present). Previously, Mr. Rosow served as Chairman and Chief Executive Officer of Rosow & Company, Inc. (private investment company, 1989-2011), a Lead Director of Hudson United Bancorp (2001-2006) and as a Director of TD Banknorth (1996-2006). In addition, Mr. Rosow is a member (2008-present) and President (2009-present) of the Town Council of Palm Beach, Florida. |
Garnett A. Smith (64) |
| Year of Election or Appointment: 2012 Member of the Advisory Board of Fidelity's Equity and High Income Funds. Prior to Mr. Smith's retirement, he served as Chairman and Chief Executive Officer of Inbrand Corp. (manufacturer of personal absorbent products, 1990-1997). He also served as President (1986-1990) of Inbrand Corp. Prior to his employment with Inbrand Corp., he was employed by a retail fabric chain and North Carolina National Bank. In addition, Mr. Smith is a board member of the Jackson Hole Land Trust (2009-present). |
Kenneth B. Robins (42) |
| Year of Election or Appointment: 2008 President and Treasurer of Fidelity's Equity and High Income Funds. Mr. Robins also serves as President and Treasurer (2010-present) and Assistant Treasurer (2009-present) of other Fidelity funds and is an employee of Fidelity Investments (2004-present). Previously, Mr. Robins served as Deputy Treasurer of the Fidelity funds (2005-2008) and Treasurer and Chief Financial Officer of The North Carolina Capital Management Trust: Cash and Term Portfolios (2006-2008). |
Brian B. Hogan (47) |
| Year of Election or Appointment: 2009 Vice President of Equity and High Income Funds. Mr. Hogan also serves as President of FMR's Equity Division (2009-present). Previously, Mr. Hogan served as Senior Vice President, Equity Research of FMR (2006-2009) and as a portfolio manager. |
Christopher S. Bartel (40) |
| Year of Election or Appointment: 2009 Vice President of Fidelity's Sector and Real Estate Equity Funds. Mr. Bartel also serves as a Director, President, and Chief Executive Officer of Fidelity Management & Research (Japan) Inc. (2012-present), a Director of Fidelity Management & Research (Hong Kong) (2012-present), and Senior Vice President of Global Equity Research (2010-present). Previously, Mr. Bartel served as Senior Vice President of Equity Research (2009-2010), Managing Director of Research (2006-2009), and an analyst and portfolio manager (2000-2006). |
Scott C. Goebel (44) |
| Year of Election or Appointment: 2008 Secretary and Chief Legal Officer (CLO) of the Fidelity funds. Mr. Goebel also serves as Secretary of Fidelity Investments Money Management, Inc. (FIMM) (2010-present) and Fidelity Research and Analysis Company (FRAC) (2010-present); Secretary and CLO of The North Carolina Capital Management Trust: Cash and Term Portfolios (2008-present); General Counsel, Secretary, and Senior Vice President of FMR (2008-present) and FMR Co., Inc. (2008-present); employed by FMR LLC or an affiliate (2001-present); Chief Legal Officer of Fidelity Management & Research (Hong Kong) Limited (2008-present) and Assistant Secretary of Fidelity Management & Research (Japan) Inc. (2008-present), and Fidelity Management & Research (U.K.) Inc. (2008-present). Previously, Mr. Goebel served as Assistant Secretary of FIMM (2008-2010), FRAC (2008-2010), and the Funds (2007-2008) and as Vice President and Secretary of Fidelity Distributors Corporation (FDC) (2005-2007). |
William C. Coffey (43) |
| Year of Election or Appointment: 2009 Assistant Secretary of Fidelity's Equity and High Income Funds. Mr. Coffey also serves as Senior Vice President and Deputy General Counsel of FMR LLC (2010-present), and is an employee of Fidelity Investments. Previously, Mr. Coffey served as Vice President and Associate General Counsel of FMR LLC (2005-2009). |
Elizabeth Paige Baumann (44) |
| Year of Election or Appointment: 2012 Anti-Money Laundering (AML) Officer of the Fidelity funds. Ms. Baumann also serves as AML Officer of The North Carolina Capital Management Trust: Cash and Term Portfolios (2012-present), Chief AML Officer of FMR LLC (2012-present), and is an employee of Fidelity Investments. Previously, Ms. Baumann served as Vice President and Deputy Anti-Money Laundering Officer (2007-2012). |
Christine Reynolds (53) |
| Year of Election or Appointment: 2008 Chief Financial Officer of the Fidelity funds. Ms. Reynolds became President of Fidelity Pricing and Cash Management Services (FPCMS) in August 2008. Ms. Reynolds served as Chief Operating Officer of FPCMS (2007-2008). Previously, Ms. Reynolds served as President, Treasurer, and Anti-Money Laundering officer of the Fidelity funds (2004-2007). |
Joseph A. Hanlon (44) |
| Year of Election or Appointment: 2012 Chief Compliance Officer of Fidelity's Equity and High Income Funds. Mr. Hanlon serves as Compliance Officer of FMR, FMR Co., Inc., Fidelity Investments Money Management, Inc. (FIMM), Fidelity Research and Analysis Company (FRAC), Fidelity Management & Research (Japan) Inc., Fidelity Management & Research (U.K.) Inc., Fidelity Management & Research (Hong Kong), and Strategic Advisers, Inc. (2009-present), as Senior Vice President of the Fidelity Asset Management Division (2009-present), and is an employee of Fidelity Investments. |
Joseph F. Zambello (55) |
| Year of Election or Appointment: 2011 Deputy Treasurer of the Fidelity funds. Mr. Zambello is an employee of Fidelity Investments. Previously, Mr. Zambello served as Vice President of FMR's Program Management Group (2009-2011) and Vice President of the Transfer Agent Oversight Group (2005-2009). |
Adrien E. Deberghes (44) |
| Year of Election or Appointment: 2008 Deputy Treasurer of Fidelity's Equity and High Income Funds. Mr. Deberghes also serves as Vice President (2011-present) and Assistant Treasurer (2010-present) of other Fidelity funds, and is an employee of Fidelity Investments (2008-present). Previously, Mr. Deberghes served as Senior Vice President of Mutual Fund Administration at State Street Corporation (2007-2008), Senior Director of Mutual Fund Administration at Investors Bank & Trust (2005-2007), and Director of Finance for Dunkin' Brands (2000-2005). |
Stephanie J. Dorsey (43) |
| Year of Election or Appointment: 2010 Assistant Treasurer of Fidelity's Equity and High Income Funds. Ms. Dorsey also serves as Deputy Treasurer of other Fidelity funds (2008-present) and is an employee of Fidelity Investments (2008-present). Previously, Ms. Dorsey served as Treasurer (2004-2008) of the JPMorgan Mutual Funds and Vice President (2004-2008) of JPMorgan Chase Bank. |
John R. Hebble (54) |
| Year of Election or Appointment: 2009 Assistant Treasurer of Fidelity's Equity and High Income Funds. Mr. Hebble also serves as President (2011-present), Treasurer, and Chief Financial Officer of The North Carolina Capital Management Trust: Cash and Term Portfolios (2008-present), President and Treasurer of other Fidelity funds (2008-present) and is an employee of Fidelity Investments. |
Gary W. Ryan (53) |
| Year of Election or Appointment: 2005 Assistant Treasurer of the Fidelity funds. Mr. Ryan is an employee of Fidelity Investments. Previously, Mr. Ryan served as Vice President of Fund Reporting in Fidelity Pricing and Cash Management Services (FPCMS) (1999-2005). |
Jonathan Davis (44) |
| Year of Election or Appointment: 2010 Assistant Treasurer of the Fidelity funds. Mr. Davis is also Assistant Treasurer of Fidelity Rutland Square Trust II and Fidelity Commonwealth Trust II. Mr. Davis is an employee of Fidelity Investments. Previously, Mr. Davis served as Vice President and Associate General Counsel of FMR LLC (2003-2010). |
Annual Report
The Board of Trustees of Fidelity International Real Estate Fund voted to pay on September 10, 2012, to shareholders of record at the opening of business on September 7, 2012, a distribution of $0.113 per share derived from capital gains realized from sales of portfolio securities, and a dividend of $0.126 per share from net investment income.
International Real Estate designates 18% and 32% of the dividends distributed in September and December, respectively during the fiscal year as amounts which may be taken into account as a dividend for the purposes of the maximum rate under section 1(h)(11) of the Internal Revenue Code.
The amounts per share which represent income derived from sources within, and taxes paid to, foreign countries or possessions of the United States are as follows:
Pay Date | Income | Taxes |
09/09/11 | $.321 | $.0089 |
12/16/11 | $.056 | $.0030 |
The fund will notify shareholders in January 2013 of amounts for use in preparing 2012 income tax returns.
Annual Report
Board Approval of Investment Advisory Contracts and Management Fees
Fidelity International Real Estate Fund
Each year, the Board of Trustees, including the Independent Trustees (together, the Board), votes on the renewal of the management contract and sub-advisory agreements (together, the Advisory Contracts) for the fund. The Board, assisted by the advice of fund counsel and Independent Trustees' counsel, requests and considers a broad range of information relevant to the renewal of the Advisory Contracts throughout the year.
The Board meets regularly and, at each of its meetings, considers factors that are relevant to its annual consideration of the renewal of the fund's Advisory Contracts, including the services and support provided to the fund and its shareholders. The Board has established various standing committees, each composed of and chaired by Independent Trustees with varying backgrounds, to which the Board has assigned specific subject matter responsibilities in order to enhance effective decision-making by the Board. The Board, acting directly and through its Committees, requests and receives information concerning the annual consideration of the renewal of the fund's Advisory Contracts. The Board also meets as needed to consider matters specifically related to the Board's annual consideration of the renewal of Advisory Contracts. Members of the Board may also meet with trustees of other Fidelity funds through ad hoc joint committees to discuss certain matters relevant to the Fidelity funds.
At its July 2012 meeting, the Board of Trustees, including the Independent Trustees, unanimously determined to renew the fund's Advisory Contracts. In reaching its determination, the Board considered all factors it believed relevant, including (i) the nature, extent, and quality of the services to be provided to the fund and its shareholders (including the investment performance of the fund); (ii) the competitiveness of the fund's management fee and total expense ratio relative to peer funds; (iii) the total costs of the services to be provided by and the profits to be realized by Fidelity from its relationship with the fund; (iv) the extent to which economies of scale exist and would be realized as the fund grows; and (v) whether fee levels reflect these economies of scale, if any, for the benefit of fund shareholders.
In considering whether to renew the Advisory Contracts for the fund, the Board reached a determination, with the assistance of fund counsel and Independent Trustees' counsel and through the exercise of its business judgment, that the renewal of the Advisory Contracts is in the best interests of the fund and its shareholders and that the compensation payable under the Advisory Contracts is fair and reasonable. The Board's decision to renew the Advisory Contracts was not based on any single factor, but rather was based on a comprehensive consideration of all the information provided to the Board at its meetings throughout the year. The Board, in reaching its determination to renew the Advisory Contracts, is aware that shareholders in the fund have a broad range of investment choices available to them, including a wide choice among mutual funds offered by Fidelity's competitors, and that the fund's shareholders, who have the opportunity to review and weigh the disclosure provided by the fund in its prospectus and other public disclosures, have chosen to invest in this fund, managed by Fidelity.
Annual Report
Board Approval of Investment Advisory Contracts and
Management Fees - continued
Nature, Extent, and Quality of Services Provided. The Board considered the staffing within the investment adviser, FMR, and the sub-advisers (together, the Investment Advisers), including the backgrounds of the fund's investment personnel, and also considered the fund's investment objective, strategies, and related investment philosophy. The Independent Trustees also had discussions with senior management of Fidelity's investment operations and investment groups. The Board considered the structure of the portfolio manager compensation program and whether this structure provides appropriate incentives to act in the best interests of the fund.
Resources Dedicated to Investment Management and Support Services. The Board and the Fund Oversight and Research Committees reviewed the general qualifications and capabilities of the Investment Advisers' investment staff, including its size, education, experience, and resources, as well as the Investment Advisers' approach to recruiting, training, managing, and compensating investment personnel. The Board also noted that FMR has continued to increase the resources devoted to non-U.S. offices, including expansion of Fidelity's global investment organization. The Board noted that Fidelity's analysts have extensive resources, tools and capabilities that allow them to conduct sophisticated quantitative and fundamental analysis, as well as credit analysis of issuers, counterparties and guarantors. The Board also believes that Fidelity's investment professionals have sufficient access to global information and data so as to provide competitive investment results over time, and that those professionals also have access to sophisticated tools that permit them to assess portfolio construction and risk and performance attribution characteristics continuously, as well as to transmit new information and research conclusions rapidly around the world. Additionally, in its deliberations, the Board considered the Investment Advisers' trading and risk management capabilities and resources, which are an integral part of the investment management process.
Shareholder and Administrative Services. The Board considered (i) the nature, extent, quality, and cost of advisory, administrative, and shareholder services performed by the Investment Advisers and their affiliates under the Advisory Contracts and under separate agreements covering transfer agency, pricing and bookkeeping, and securities lending services for the fund; (ii) the nature and extent of the supervision of third party service providers, principally custodians and subcustodians; and (iii) the resources devoted to, and the record of compliance with, the fund's compliance policies and procedures. The Board also reviewed the allocation of fund brokerage, including allocations to brokers affiliated with the Investment Advisers, the use of brokerage commissions to pay fund expenses, and the use of "soft" commission dollars to pay for research services.
Annual Report
The Board noted that the growth of fund assets over time across the complex allows Fidelity to reinvest in the development of services designed to enhance the value or convenience of the Fidelity funds as investment vehicles. These services include 24-hour access to account information and market information through telephone representatives and over the Internet, investor education materials and asset allocation tools, and the expanded availability of Fidelity Investor Centers.
Investment in a Large Fund Family. The Board considered the benefits to shareholders of investing in a Fidelity fund, including the benefits of investing in a fund that is part of a large family of funds offering a variety of investment disciplines and providing a large variety of mutual fund investor services. The Board noted that Fidelity had taken, or had made recommendations that resulted in the Fidelity funds taking, a number of actions over the previous year that benefited particular funds, including (i) continuing to dedicate additional resources to investment research and support of the senior management team that oversees asset management; (ii) persisting in efforts to enhance Fidelity's research capabilities, in particular, international research; (iii) launching new funds and making other enhancements to meet client needs for global and income-oriented solutions; (iv) continuing to launch dedicated lower cost underlying funds to meet investment management's portfolio construction needs related to expanding underlying fund options, specifically for the Freedom Fund product lines; (v) adopting a "Stock Selector" sector neutral investment approach and employing a team of portfolio managers who are sector specialists to manage certain funds; (vi) rationalizing product lines and gaining increased efficiencies through the mergers of several funds into other funds; (vii) strengthening the Spartan Index Fund product line by adding new funds and/or new low-cost institutional share classes, restructuring fund expenses to accommodate new classes, and reducing investment minimums for certain classes of shares; (viii) modifying the eligibility criteria for Institutional Class shares to increase their appeal to government entities and charitable investors; and (ix) reducing certain transfer agent fee rates.
Investment Performance. The Board considered whether the fund has operated in accordance with its investment objective, as well as its record of compliance with its investment restrictions. It also reviewed the fund's absolute investment performance for each class, as well as the fund's relative investment performance for each class measured over multiple periods against a broad-based securities market index. The Board noted that FMR believes that no meaningful peer group exists for the fund principally because most other funds in the fund's third-party peer group focus on different industries or sectors than the fund. The following charts considered by the Board show, over the one-, three-, and five-year periods ended December 31, 2011, as available, the cumulative total returns of the retail class and Class B of the fund and the cumulative total returns of a broad-based securities market index ("benchmark"). The returns of the retail class and Class B show the performance of the highest performing class (based on five-year performance) and the lowest performing class (based on three-year performance), respectively.
Annual Report
Board Approval of Investment Advisory Contracts and
Management Fees - continued
Fidelity International Real Estate Fund

The Board noted that the investment performance of the fund was lower than its benchmark for all the periods shown. The Board considered that the variations in performance among the fund's classes reflect the variations in class expenses, which result in lower performance for higher expense classes. The Board discussed with FMR actions to improve the fund's below-benchmark performance. The Board noted that this fund had underperformed in the past and discussed with FMR its disappointment with the continued underperformance of the fund. The Board also reviewed the fund's performance since inception as well as performance in the current year. The Board will continue to closely monitor the performance of the fund in the coming year and discuss with FMR other appropriate actions to address the performance of the fund.
Based on its review, the Board concluded that the nature, extent, and quality of services provided to the fund under the Advisory Contracts should benefit the fund's shareholders.
Competitiveness of Management Fee and Total Expense Ratio. The Board considered the fund's management fee and total expense ratio compared to "mapped groups" of competitive funds and classes. Fidelity creates "mapped groups" by combining similar Lipper investment objective categories that have comparable management fee characteristics. Combining Lipper investment objective categories aids the Board's management fee and total expense ratio comparisons by broadening the competitive group used for comparison and by reducing the number of universes to which various Fidelity funds are compared.
Annual Report
Management Fee. The Board considered two proprietary management fee comparisons for the 12-month periods shown in the chart below. The group of Lipper funds used by the Board for management fee comparisons is referred to below as the "Total Mapped Group." The Total Mapped Group comparison focuses on a fund's standing relative to the total universe of comparable funds available to investors in terms of gross management fees before expense reimbursements or caps. "TMG %" represents the percentage of funds in the Total Mapped Group that had management fees that were lower than the fund's. For example, a TMG % of 31% means that 69% of the funds in the Total Mapped Group had higher management fees than the fund. The "Asset-Size Peer Group" (ASPG) comparison focuses on a fund's standing relative to non-Fidelity funds similar in size to the fund within the Total Mapped Group. The ASPG represents at least 15% of the funds in the Total Mapped Group with comparable asset size and management fee characteristics, subject to a minimum of 50 funds (or all funds in the Total Mapped Group if fewer than 50). Additional information, such as the ASPG quartile in which the fund's management fee ranked, is also included in the chart and considered by the Board.
Fidelity International Real Estate Fund

The Board noted that the fund's management fee ranked below the median of its Total Mapped Group and below the median of its ASPG for 2011.
Based on its review, the Board concluded that the fund's management fee is fair and reasonable in light of the services that the fund receives and the other factors considered.
Total Expense Ratio. In its review of each class's total expense ratio, the Board considered the fund's management fee as well as other fund or class expenses, as applicable, such as transfer agent fees, pricing and bookkeeping fees, fund-paid 12b-1 fees, and custodial, legal, and audit fees. The Board also noted the effects of any waivers and reimbursements on fees and expenses. As part of its review, the Board also considered the current and historical total expense ratios of each class of the fund compared to competitive fund median expenses. Each class of the fund is compared to those funds and classes in the Total Mapped Group (used by the Board for management fee comparisons) that have a similar sales load structure.
Annual Report
Board Approval of Investment Advisory Contracts and
Management Fees - continued
The Board noted that the total expense ratio of each of Class A and the retail class ranked below its competitive median for 2011 and the total expense ratio of each of Class T, Class B, Class C and Institutional Class ranked above its competitive median for 2011. The Board considered that various factors, including 12b-1 fees, positive or negative performance adjustments, and relatively higher other expenses in the case of small fund size, can affect total expense ratios. The Board noted that the total expense ratio of Class T was above the competitive median primarily because of higher 12b-1 fees on Class T. Class T has a higher 12b-1 fee, but a lower front-end sales charge, than traditionally priced front-end sales charge classes. The Board considered that Class T is primarily sold load-waived in the retirement plan market where its 0.50% 12b-1 fee is comparable to competing no-load, higher 12b-1 fee classes designed specifically for retirement plans. The Board noted that the fund offers multiple classes, each of which has a different sales load and 12b-1 fee structure, and that the multiple structures are intended to offer a range of pricing options for the intermediary market. The Board also noted that the total expense ratios of the classes vary primarily by the level of their 12b-1 fees, although differences in transfer agent fees may also cause expenses to vary from class to class.
Fees Charged to Other Fidelity Clients. The Board also considered Fidelity fee structures and other information with respect to clients of FMR and its affiliates, such as other mutual funds advised or subadvised by FMR or its affiliates, pension plan clients, and other institutional clients. The Board noted the findings of the 2010 ad hoc joint committee (created with the board of other Fidelity funds), which reviewed and compared Fidelity's institutional investment advisory business with its business of providing services to the Fidelity funds, including the differences in services provided, fees charged, and costs incurred, as well as competition in their respective marketplaces.
Based on its review of total expense ratios and fees charged to other Fidelity clients, the Board concluded that the total expense ratio of each class of the fund was reasonable, although in some cases above the median of the universe presented for comparison, in light of the services that the fund and its shareholders receive and the other factors considered.
Costs of the Services and Profitability. The Board considered the revenues earned and the expenses incurred by Fidelity in conducting the business of developing, marketing, distributing, managing, administering and servicing the fund and its shareholders. The Board also considered the level of Fidelity's profits in respect of all the Fidelity funds.
Annual Report
On an annual basis, FMR presents to the Board Fidelity's profitability for the fund. Fidelity calculates the profitability for each fund, as well as aggregate profitability for groups of Fidelity funds and all Fidelity funds, using a series of detailed revenue and cost allocation methodologies which originate with the books and records of Fidelity on which Fidelity's audited financial statements are based. The Audit Committee of the Board reviews any significant changes from the prior year's methodologies.
PricewaterhouseCoopers LLP (PwC), independent registered public accounting firm and auditor to Fidelity and certain Fidelity funds, has been engaged annually by the Board as part of the Board's assessment of Fidelity's profitability analysis. PwC's engagement includes the review and assessment of Fidelity's methodologies used in determining the revenues and expenses attributable to Fidelity's mutual fund business, and completion of agreed-upon procedures surrounding the mathematical accuracy of fund profitability and its conformity to allocation methodologies. After considering PwC's reports issued under the engagement and information provided by Fidelity, the Board concluded that while other allocation methods may also be reasonable, Fidelity's profitability methodologies are reasonable in all material respects.
The Board also reviewed Fidelity's non-fund businesses and fall-out benefits related to the mutual fund business as well as cases where Fidelity's affiliates may benefit from or be related to the fund's business.
The Board considered the costs of the services provided by and the profits realized by Fidelity in connection with the operation of the fund and was satisfied that the profitability was not excessive in the circumstances.
Economies of Scale. The Board considered whether there have been economies of scale in respect of the management of the Fidelity funds, whether the Fidelity funds (including the fund) have appropriately benefited from any such economies of scale, and whether there is potential for realization of any further economies of scale. The Board considered the extent to which the fund will benefit from economies of scale through increased services to the fund, through waivers or reimbursements, or through fee or expense reductions. The Board also noted that in 2009, it and the board of other Fidelity funds created an ad hoc committee (the Economies of Scale Committee) to analyze whether FMR attains economies of scale in respect of the management and servicing of the Fidelity funds, whether the Fidelity funds have appropriately benefited from such economies of scale, and whether there is potential for realization of any further economies of scale.
The Board recognized that the fund's management contract incorporates a "group fee" structure, which provides for lower group fee rates as total fund assets under FMR's management increase, and for higher group fee rates as total fund assets under FMR's management decrease. FMR calculates the group fee rates based on a tiered asset "breakpoint" schedule that varies based on asset class. The Board considered that the group fee is designed to deliver the benefits of economies of scale to fund shareholders when total Fidelity fund assets increase, even if assets of any particular fund are unchanged or have declined, because some portion of Fidelity's costs are attributable to services provided to all Fidelity funds, and all funds benefit if those costs can be allocated among more assets. The Board concluded that, given the group fee structure, fund shareholders will benefit from lower management fees as assets under FMR's management increase at the fund complex level, regardless of whether Fidelity achieves any such economies of scale.
Annual Report
Board Approval of Investment Advisory Contracts and
Management Fees - continued
The Board concluded, taking into account the analysis of the Economies of Scale Committee, that economies of scale, if any, are being appropriately shared between fund shareholders and Fidelity.
Additional Information Requested by the Board. In order to develop fully the factual basis for consideration of the Fidelity funds' Advisory Contracts, the Board requested and received additional information on certain topics, including (i) fund performance trends, actions to be taken by FMR to improve certain funds' overall performance, and Fidelity's long-term strategies for certain funds; (ii) the potential to further rationalize the Fidelity fund lineup with the possibility of achieving savings for the funds and Fidelity; (iii) Fidelity's compensation structure for portfolio managers and other key investment personnel; (iv) the amount of the investment that each portfolio manager has made in the Fidelity fund(s) that he or she manages; (v) the realization of fall-out benefits in certain Fidelity business units; (vi) Fidelity's group fee structures, the potential impact of regulatory changes on such structures, and the rationale for the individual fee rates of certain funds; (vii) fund profitability methodology, including Fidelity's cost allocation methodology, and the impact of certain factors on fund profitability results; (viii) trends regarding industry use of performance fee structures and the possibility of implementing performance fee structures for additional funds; and (ix) the impact of net redemptions from the Fidelity funds.
Based on its evaluation of all of the conclusions noted above, and after considering all factors it believed relevant, the Board ultimately concluded that the advisory fee structures are fair and reasonable, and that the fund's Advisory Contracts should be renewed.
Annual Report
Investment Adviser
Fidelity Management & Research Company
Boston, MA
Investment Sub-Advisers
FMR Co., Inc.
Fidelity Management & Research
(U.K.) Inc.
Fidelity Management & Research
(Hong Kong) Limited
Fidelity Management & Research
(Japan) Inc.
FIL Investment Advisers
FIL Investment Advisers (UK) Limited
FIL Investment (Japan) Limited
General Distributor
Fidelity Distributors Corporation
Smithfield, RI
Transfer and Service Agents
Fidelity Investments Institutional
Operations Company, Inc.
Boston, MA
Fidelity Service Company, Inc.
Boston, MA
Custodian
The Bank of New York Mellon
New York, NY
The Fidelity Telephone Connection
Mutual Fund 24-Hour Service
Exchanges/Redemptions
and Account Assistance 1-800-544-6666
Product Information 1-800-544-6666
Retirement Accounts 1-800-544-4774
(8 a.m. - 9 p.m.)
TDD Service 1-800-544-0118
for the deaf and hearing impaired
(9 a.m. - 9 p.m. Eastern time)
Fidelity Automated Service
Telephone (FAST®)
1-800-544-5555
Automated line for quickest service
(Fidelity Investment logo)(registered trademark)
Corporate Headquarters
82 Devonshire St., Boston, MA 02109
www.fidelity.com
IRE-UANN-0912
1.801327.107
(Fidelity Investment logo)(registered trademark)
Fidelity Advisor®
International Real Estate
Fund - Class A, Class T,
Class B, and Class C
Annual Report
July 31, 2012
(Fidelity Cover Art)
Class A, Class T, Class B,
and Class C are classes
of Fidelity® International
Real Estate Fund
Contents
Performance | (Click Here) | How the fund has done over time. |
Management's Discussion of Fund Performance | (Click Here) | The Portfolio Manager's review of fund performance and strategy. |
Shareholder Expense Example | (Click Here) | An example of shareholder expenses. |
Investment Changes | (Click Here) | A summary of major shifts in the fund's investments over the past six months. |
Investments | (Click Here) | A complete list of the fund's investments with their market values. |
Financial Statements | (Click Here) | Statements of assets and liabilities, operations, and changes in net assets, as well as financial highlights. |
Notes | (Click Here) | Notes to financial statements. |
Report of Independent Registered Public Accounting Firm | (Click Here) | |
Trustees and Officers | (Click Here) | |
Distributions | (Click Here) | |
Board Approval of Investment Advisory Contracts and Management Fees | (Click Here) | |
To view a fund's proxy voting guidelines and proxy voting record for the 12-month period ended June 30, visit http://www.fidelity.com/proxyvotingresults or visit the Securities and Exchange Commission's (SEC) web site at http://www.sec.gov. You may also call 1-877-208-0098 to request a free copy of the proxy voting guidelines.
Standard & Poor's, S&P and S&P 500 are registered service marks of The McGraw-Hill Companies, Inc. and have been licensed for use by Fidelity Distributors Corporation.
Other third party marks appearing herein are the property of their respective owners.
All other marks appearing herein are registered or unregistered trademarks or service marks of FMR LLC or an affiliated company. © 2012 FMR LLC. All rights reserved.
Annual Report
This report and the financial statements contained herein are submitted for the general information of the shareholders of the fund. This report is not authorized for distribution to prospective investors in the fund unless preceded or accompanied by an effective prospectus.
A fund files its complete schedule of portfolio holdings with the SEC for the first and third quarters of each fiscal year on Form N-Q. Forms N-Q are available on the SEC's web site at http://www.sec.gov. A fund's Forms N-Q may be reviewed and copied at the SEC's Public Reference Room in Washington, DC. Information regarding the operation of the SEC's Public Reference Room may be obtained by calling 1-800-SEC-0330. For a complete list of a fund's portfolio holdings, view the most recent holdings listing, semiannual report, or annual report on Fidelity's web site at http://www.fidelity.com, http://www.advisor.fidelity.com, or http://www.401k.com, as applicable.
NOT FDIC INSURED • MAY LOSE VALUE • NO BANK GUARANTEE
Neither the fund nor Fidelity Distributors Corporation is a bank.
Annual Report
Fidelity Advisor® International Real Estate Fund - Class A, T, B, and C
Average annual total return reflects the change in the value of an investment, assuming reinvestment of the class' distributions from dividend income and capital gains (the profits earned upon the sale of securities that have grown in value, if any) and assuming a constant rate of performance each year. The $10,000 table and the fund's returns do not reflect the deduction of taxes that a shareholder would pay on fund distributions or the redemption of fund shares. During periods of reimbursement by Fidelity, a fund's total return will be greater than it would be had the reimbursement not occurred. How a fund did yesterday is no guarantee of how it will do tomorrow.
Average Annual Total Returns
Periods ended July 31, 2012 | Past 1
year | Past 5
years | Life of fund A |
Class A (incl. 5.75% sales charge) B | -10.35% | -8.14% | 2.42% |
Class T (incl. 3.50% sales charge) C | -8.54% | -7.95% | 2.54% |
Class B (incl. contingent deferred sales charge) D | -10.16% | -8.04% | 2.67% |
Class C (incl. contingent deferred sales charge)E | -6.59% | -7.75% | 2.66% |
A From September 8, 2004.
B Class A shares bear a 0.25% 12b-1 fee. The initial offering of Class A shares took place on April 4, 2007. Returns prior to April 4, 2007 are those of Fidelity® International Real Estate Fund, the original class of the fund, which has no 12b-1 fee. Had Class A's 12b-1 fee been reflected, returns prior to April 4, 2007, would have been lower.
C Class T shares bear a 0.50% 12b-1 fee. The initial offering of Class T shares took place on April 4, 2007. Returns prior to April 4, 2007 are those of Fidelity® International Real Estate Fund, the original class of the fund, which has no 12b-1 fee. Had Class T's 12b-1 fee been reflected, returns prior to April 4, 2007, would have been lower.
D Class B shares bear a 1.00% 12b-1 fee. The initial offering of Class B shares took place on April 4, 2007. Returns prior to April 4, 2007 are those of Fidelity International Real Estate Fund, the original class of the fund, which has no 12b-1 fee. Had Class B's 12b-1 fee been reflected, returns prior to April 4, 2007, would have been lower. Class B shares' contingent deferred sales charges included in the past one year, past five years, and life of fund total return figures are 5%, 2%, and 0%, respectively.
E Class C shares bear a 1.00% 12b-1 fee. The initial offering of Class C shares took place on April 4, 2007. Returns prior to April 4, 2007 are those of Fidelity International Real Estate Fund, the original class of the fund, which has no 12b-1 fee. Had Class C's 12b-1 fee been reflected, returns prior to April 4, 2007, would have been lower. Class C shares' contingent deferred sales charges included in the past one year, past five years, and life of fund total return figures are 1%, 0%, and 0%, respectively.
Annual Report
$10,000 Over Life of Fund
Let's say hypothetically that $10,000 was invested in Fidelity Advisor® International Real Estate Fund - Class A on September 8, 2004, when the fund started, and the current 5.75% sales charge was paid. The chart shows how the value of your investment would have changed, and also shows how the MSCI® EAFE® Index performed over the same period. The initial offering of Class A took place on April 4, 2007. See the previous page for additional information regarding the performance of Class A.
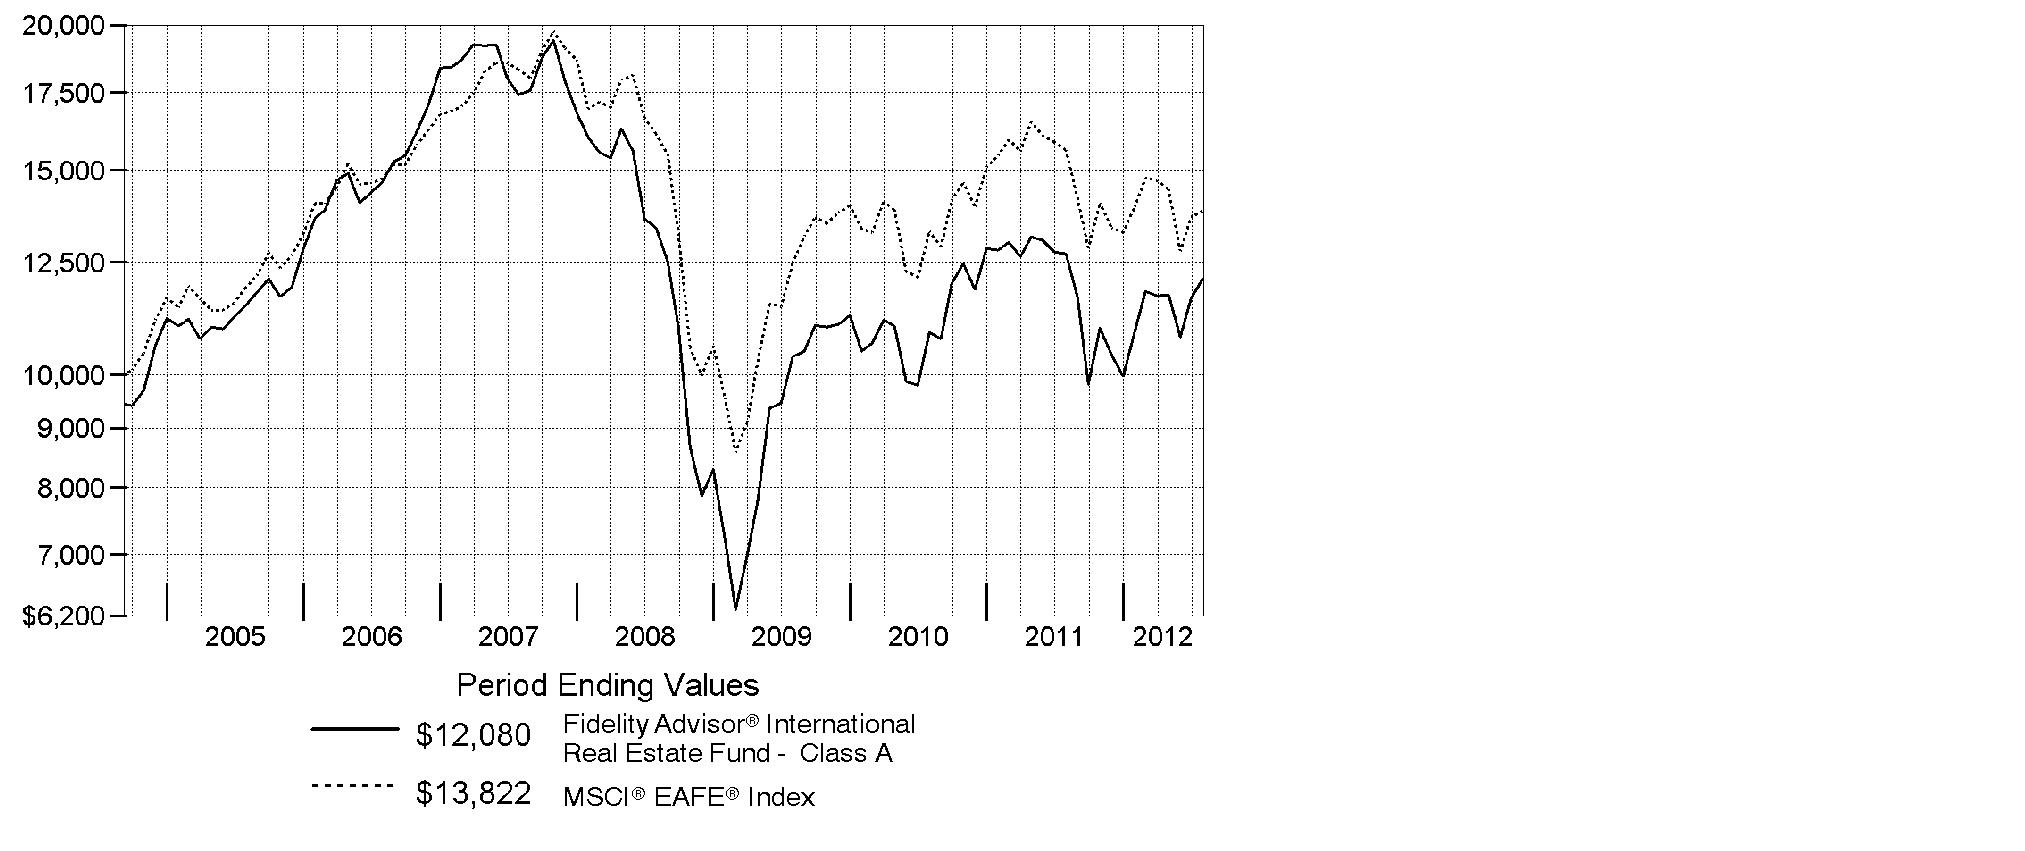
Annual Report
Market Recap: The 12-month period ending July 31, 2012, was highly volatile for overseas property stocks, which lost ground as investors endured abrupt shifts between intervals of "risk on" and "risk off." A variety of factors drove the periodic changes in sentiment, especially the ongoing sovereign debt crisis in Europe. Concern about a slowdown in the Chinese economy and questions about the prospect of additional economic stimulus from the country's policymakers also influenced the market's behavior during the period. Given the limited supply of inflation-adjusted income-generating equity or fixed-income alternatives, larger-cap real estate investment trusts (REITs) toting relatively high yields and solid business fundamentals were among the biggest beneficiaries of new investment activity. Against this backdrop, overseas property stocks, as measured by the FTSE® EPRASM/NAREIT® Developed ex North America Index, returned -1.89%. Hampered in part by currency movements, this result significantly lagged the 12.88% gain of the U.S. REIT market, as reflected in the Dow Jones U.S. Select Real Estate Securities IndexSM. Meanwhile, the broad international equity market, as measured by the MSCI® EAFE® Index, returned -11.32%, while the S&P 500® Index, a popular measure of the performance of U.S. stocks, rose 9.13%.
Comments from Guillermo de las Casas, Portfolio Manager of Fidelity Advisor® International Real Estate Fund: For the year, the fund's Class A, Class T, Class B and Class C shares returned -4.88%, -5.23%, -5.61% and -5.68%, respectively (excluding sales charges), lagging the FTSE® EPRASM/NAREIT® index but beating the MSCI® EAFE®. The fund's emphasis of attractively valued small- and mid-cap stocks hurt because these did not fare as well as certain large-cap, high-dividend-yielding investments, which I tended not to own. Also, the fund's growth-oriented stocks in Hong Kong, Singapore and Australia hurt, while below-benchmark exposure to Australia and an overweighting in poor-performing Italy also detracted. However, the fund benefited from limited exposure to the Netherlands and from favorable currency movements. In individual terms, avoiding Hong Kong-based Link Real Estate Investment Trust, an outperforming property company, hurt, as the fund was underweighted in this stock for nearly the entire period. This stock was not held at period end. Also detracting was Westfield Retail Trust, an outperforming index component that the fund didn't own, while an overweighting in Italy's Beni Stabili also detracted. On the positive side, an underweighting in Hong Kong-listed China Resources Land and an overweighting in Australian mall giant Westfield Group were significant positives.
The views expressed above reflect those of the portfolio manager(s) only through the end of the period as stated on the cover of this report and do not necessarily represent the views of Fidelity or any other person in the Fidelity organization. Any such views are subject to change at any time based upon market or other conditions and Fidelity disclaims any responsibility to update such views. These views may not be relied on as investment advice and, because investment decisions for a Fidelity fund are based on numerous factors, may not be relied on as an indication of trading intent on behalf of any Fidelity fund.
Annual Report
Shareholder Expense Example
As a shareholder of the Fund, you incur two types of costs: (1) transaction costs, including sales charges (loads) on purchase payments or redemption proceeds, redemption fees and (2) ongoing costs, including management fees, distribution and/or service (12b-1) fees and other Fund expenses. This Example is intended to help you understand your ongoing costs (in dollars) of investing in the Fund and to compare these costs with the ongoing costs of investing in other mutual funds.
The Example is based on an investment of $1,000 invested at the beginning of the period and held for the entire period (February 1, 2012 to July 31, 2012).
Actual Expenses
The first line of the accompanying table for each class of the Fund provides information about actual account values and actual expenses. You may use the information in this line, together with the amount you invested, to estimate the expenses that you paid over the period. Simply divide your account value by $1,000.00 (for example, an $8,600 account value divided by $1,000.00 = 8.6), then multiply the result by the number in the first line for a class of the Fund under the heading entitled "Expenses Paid During Period" to estimate the expenses you paid on your account during this period. A small balance maintenance fee of $12.00 that is charged once a year may apply for certain accounts with a value of less than $2,000. This fee is not included in the table below. If it was, the estimate of expenses you paid during the period would be higher, and your ending account value lower, by this amount. In addition, the Fund, as a shareholder in the underlying Fidelity Central Funds, will indirectly bear its pro-rata share of the fees and expenses incurred by the underlying Fidelity Central Funds. These fees and expenses are not included in the Fund's annualized expense ratio used to calculate the expense estimate in the table below.
Hypothetical Example for Comparison Purposes
The second line of the accompanying table for each class of the Fund provides information about hypothetical account values and hypothetical expenses based on a Class' actual expense ratio and an assumed rate of return of 5% per year before expenses, which is not the Class' actual return. The hypothetical account values and expenses may not be used to estimate the actual ending account balance or expenses you paid for the period. You may use this information to compare the ongoing costs of investing in the Fund and other funds. To do so, compare this 5% hypothetical example with the 5% hypothetical examples that appear in the shareholder reports of the other funds. A small balance maintenance fee of $12.00 that is charged once a year may apply for certain accounts with a value of less than $2,000. This fee is not included in the table below. If it was, the estimate of expenses you paid during the period would be higher, and your ending account value lower, by this amount. In addition, the Fund, as a shareholder in the underlying Fidelity Central Funds, will indirectly bear its pro-rata share of the fees and expenses incurred by the underlying Fidelity Central Funds. These fees and expenses are not included in the Fund's annualized expense ratio used to calculate the expense estimate in the table below.
Annual Report
Please note that the expenses shown in the table are meant to highlight your ongoing costs only and do not reflect any transaction costs. Therefore, the second line of the table is useful in comparing ongoing costs only, and will not help you determine the relative total costs of owning different funds. In addition, if these transactional costs were included, your costs would have been higher.
| Annualized Expense Ratio | Beginning
Account Value
February 1, 2012 | Ending
Account Value
July 31, 2012 | Expenses Paid
During Period*
February 1, 2012
to July 31, 2012 |
Class A | 1.44% | | | |
Actual | | $ 1,000.00 | $ 1,108.60 | $ 7.55 |
HypotheticalA | | $ 1,000.00 | $ 1,017.70 | $ 7.22 |
Class T | 1.70% | | | |
Actual | | $ 1,000.00 | $ 1,106.40 | $ 8.90 |
HypotheticalA | | $ 1,000.00 | $ 1,016.41 | $ 8.52 |
Class B | 2.19% | | | |
Actual | | $ 1,000.00 | $ 1,103.10 | $ 11.45 |
HypotheticalA | | $ 1,000.00 | $ 1,013.97 | $ 10.97 |
Class C | 2.19% | | | |
Actual | | $ 1,000.00 | $ 1,103.50 | $ 11.45 |
HypotheticalA | | $ 1,000.00 | $ 1,013.97 | $ 10.97 |
International Real Estate | 1.19% | | | |
Actual | | $ 1,000.00 | $ 1,109.10 | $ 6.24 |
HypotheticalA | | $ 1,000.00 | $ 1,018.95 | $ 5.97 |
Institutional Class | 1.19% | | | |
Actual | | $ 1,000.00 | $ 1,109.40 | $ 6.24 |
HypotheticalA | | $ 1,000.00 | $ 1,018.95 | $ 5.97 |
A 5% return per year before expenses
* Expenses are equal to each Class' annualized expense ratio, multiplied by the average account value over the period, multiplied by 182/366 (to reflect the one-half year period).
Annual Report
Investment Changes (Unaudited)
Top Ten Stocks as of July 31, 2012 |
| % of fund's
net assets | % of fund's net assets
6 months ago |
Westfield Group unit | 8.2 | 7.8 |
Mitsui Fudosan Co. Ltd. | 5.9 | 5.7 |
Sun Hung Kai Properties Ltd. | 5.7 | 8.3 |
Sumitomo Realty & Development Co. Ltd. | 4.7 | 4.4 |
Unibail-Rodamco | 4.1 | 3.9 |
Mirvac Group unit | 3.6 | 2.3 |
Global Logistic Properties Ltd. | 2.9 | 2.6 |
Kerry Properties Ltd. | 2.8 | 1.7 |
Nomura Real Estate Holdings, Inc. | 2.3 | 1.7 |
Big Yellow Group PLC | 2.2 | 2.5 |
| 42.4 | |
Top Five Countries as of July 31, 2012 |
(excluding cash equivalents) | % of fund's
net assets | % of fund's net assets
6 months ago |
Japan | 19.9 | 16.1 |
Australia | 16.5 | 16.0 |
United Kingdom | 12.9 | 12.8 |
Hong Kong | 11.6 | 15.0 |
Singapore | 10.0 | 7.5 |
Percentages are adjusted for the effect of open futures contracts, if applicable. |
Top Five REIT Sectors as of July 31, 2012 |
| % of fund's
net assets | % of fund's net assets
6 months ago |
REITs - Management/Investment | 24.2 | 25.7 |
REITs - Office Buildings | 5.5 | 6.9 |
REITs - Industrial Buildings | 4.6 | 3.1 |
REITs - Shopping Centers | 4.4 | 3.3 |
REITs - Health Care Facilities | 2.0 | 0.5 |
Asset Allocation (% of fund's net assets) |
As of July 31, 2012* | As of January 31, 2012** |
 | Stocks 95.5% | |  | Stocks 94.1% | |
 | Short-Term
Investments and
Net Other Assets (Liabilities) 4.5% | |  | Short-Term
Investments and
Net Other Assets (Liabilities) 5.9% | |
* Foreign investments | 95.5% | | ** Foreign investments | 94.1% | |

Annual Report
Investments July 31, 2012
Showing Percentage of Net Assets
Common Stocks - 95.5% |
| Shares | | Value |
Australia - 16.5% |
Abacus Property Group unit | 1,525,637 | | $ 3,182,535 |
ALE Property Group | 1,201,339 | | 2,638,598 |
Charter Hall Group unit | 1,090,003 | | 2,943,894 |
FKP Property Group unit (d) | 2,565,000 | | 1,010,834 |
Goodman Group unit | 660,608 | | 2,610,316 |
Mirvac Group unit | 6,636,138 | | 9,554,267 |
Westfield Group unit | 2,091,349 | | 21,977,989 |
TOTAL AUSTRALIA | | 43,918,433 |
Bailiwick of Jersey - 1.4% |
Atrium European Real Estate Ltd. | 838,372 | | 3,739,307 |
Belgium - 1.1% |
Warehouses de Pauw | 57,385 | | 2,894,867 |
Bermuda - 5.0% |
Csi Properties Ltd. | 32,517,682 | | 1,488,617 |
Great Eagle Holdings Ltd. | 1,247,088 | | 3,161,663 |
K Wah International Holdings Ltd. | 22,071 | | 8,083 |
Kerry Properties Ltd. | 1,601,000 | | 7,360,136 |
Soundwill Holdings Ltd. | 987,000 | | 1,458,602 |
TOTAL BERMUDA | | 13,477,101 |
Brazil - 0.8% |
Companhia Brasileira de Desenvolvimento Imobiliario Turistico SA (a) | 43,700 | | 413,926 |
Even Construtora e Incorporadora SA | 313,300 | | 1,001,423 |
Multiplan Empreendimentos Imobiliarios SA | 26,400 | | 667,601 |
TOTAL BRAZIL | | 2,082,950 |
Cayman Islands - 2.0% |
China Resources Land Ltd. | 350,000 | | 710,408 |
KWG Property Holding Ltd. | 2,022,000 | | 1,121,204 |
SOHO China Ltd. | 4,014,000 | | 2,986,676 |
SouFun Holdings Ltd. ADR (d) | 49,688 | | 589,300 |
TOTAL CAYMAN ISLANDS | | 5,407,588 |
Chile - 0.5% |
Parque Arauco SA | 657,471 | | 1,246,165 |
France - 6.3% |
Altarea | 10,800 | | 1,594,598 |
Societe de la Tour Eiffel | 25,127 | | 1,347,949 |
Common Stocks - continued |
| Shares | | Value |
France - continued |
Societe Fonciere Lyonnaise SA | 70,586 | | $ 2,809,566 |
Unibail-Rodamco | 56,857 | | 10,941,252 |
TOTAL FRANCE | | 16,693,365 |
Germany - 2.3% |
alstria office REIT-AG | 162,500 | | 1,808,857 |
Deutsche EuroShop AG | 49,075 | | 1,804,512 |
GSW Immobilien AG | 32,669 | | 1,203,868 |
IVG Immobilien AG (a) | 45,000 | | 104,590 |
Patrizia Immobilien AG (a) | 211,916 | | 1,299,796 |
TOTAL GERMANY | | 6,221,623 |
Hong Kong - 11.6% |
Hang Lung Properties Ltd. | 1,196,500 | | 4,258,501 |
Henderson Land Development Co. Ltd. | 984,000 | | 5,735,464 |
Hysan Development Co. Ltd. | 828,500 | | 3,504,301 |
Magnificent Estates Ltd. | 27,344,000 | | 1,022,575 |
Sun Hung Kai Properties Ltd. | 1,219,226 | | 15,242,880 |
Wheelock and Co. Ltd. | 313,000 | | 1,229,042 |
TOTAL HONG KONG | | 30,992,763 |
India - 0.5% |
Phoenix Mills Ltd. | 424,550 | | 1,405,997 |
Italy - 1.1% |
Beni Stabili SpA SIIQ | 5,246,133 | | 2,400,556 |
Immobiliare Grande Distribuzione SpA | 434,050 | | 411,222 |
TOTAL ITALY | | 2,811,778 |
Japan - 19.9% |
BLife Investment Corp. | 517 | | 3,612,670 |
Goldcrest Co. Ltd. | 199,340 | | 3,068,862 |
Japan Retail Fund Investment Corp. | 3,185 | | 5,326,889 |
Kenedix, Inc. (a)(d) | 11,063 | | 1,452,499 |
Mitsui Fudosan Co. Ltd. | 817,000 | | 15,741,416 |
Nomura Real Estate Holdings, Inc. | 332,700 | | 6,144,085 |
Sumitomo Realty & Development Co. Ltd. | 509,000 | | 12,665,728 |
United Urban Investment Corp. | 4,600 | | 4,990,855 |
TOTAL JAPAN | | 53,003,004 |
Mexico - 0.6% |
Corporacion Inmobiliaria Vesta SAB de CV | 1,039,303 | | 1,484,886 |
Common Stocks - continued |
| Shares | | Value |
Russia - 0.3% |
LSR Group OJSC GDR (Reg. S) | 192,400 | | $ 860,028 |
Singapore - 10.0% |
Global Logistic Properties Ltd. | 4,304,000 | | 7,782,064 |
Mapletree Industrial (REIT) | 3,355,000 | | 3,504,902 |
Parkway Life REIT | 3,409,000 | | 5,369,367 |
UOL Group Ltd. | 1,355,000 | | 5,640,389 |
Wing Tai Holdings Ltd. | 3,962,181 | | 4,489,453 |
TOTAL SINGAPORE | | 26,786,175 |
Sweden - 2.7% |
Castellum AB | 198,400 | | 2,665,016 |
Hufvudstaden AB Series A | 200,000 | | 2,435,061 |
Wihlborgs Fastigheter AB | 139,900 | | 2,031,442 |
TOTAL SWEDEN | | 7,131,519 |
United Kingdom - 12.9% |
Big Yellow Group PLC | 1,196,400 | | 5,852,420 |
British Land Co. PLC | 547,589 | | 4,588,882 |
Derwent London PLC | 149,600 | | 4,571,386 |
Hammerson PLC | 795,029 | | 5,772,478 |
Helical Bar PLC | 1,758,827 | | 5,432,426 |
Metric Property Investments PLC | 1,447,700 | | 1,929,310 |
Quintain Estates & Development PLC (a) | 1,937,100 | | 1,510,948 |
Safestore Holdings PLC | 1,315,000 | | 2,082,340 |
St. Modwen Properties PLC | 1,011,300 | | 2,806,453 |
TOTAL UNITED KINGDOM | | 34,546,643 |
TOTAL COMMON STOCKS (Cost $281,982,482) |
254,704,192
|
Money Market Funds - 4.6% |
| Shares | | Value |
Fidelity Cash Central Fund, 0.17% (b) | 11,441,650 | | $ 11,441,650 |
Fidelity Securities Lending Cash Central Fund, 0.18% (b)(c) | 870,644 | | 870,644 |
TOTAL MONEY MARKET FUNDS (Cost $12,312,294) |
12,312,294
|
TOTAL INVESTMENT PORTFOLIO - 100.1% (Cost $294,294,776) | | 267,016,486 |
NET OTHER ASSETS (LIABILITIES) - (0.1)% | | (218,547) |
NET ASSETS - 100% | $ 266,797,939 |
Legend |
(a) Non-income producing |
(b) Affiliated fund that is available only to investment companies and other accounts managed by Fidelity Investments. The rate quoted is the annualized seven-day yield of the fund at period end. A complete unaudited listing of the fund's holdings as of its most recent quarter end is available upon request. In addition, each Fidelity Central Fund's financial statements, which are not covered by the Fund's Report of Independent Registered Public Accounting Firm, are available on the SEC's website or upon request. |
(c) Investment made with cash collateral received from securities on loan. |
(d) Security or a portion of the security is on loan at period end. |
Affiliated Central Funds |
Information regarding fiscal year to date income earned by the Fund from investments in Fidelity Central Funds is as follows: |
Fund | Income earned |
Fidelity Cash Central Fund | $ 17,037 |
Fidelity Securities Lending Cash Central Fund | 77,977 |
Total | $ 95,014 |
Other Information |
Categorizations in the Schedule of Investments are based on country or territory of incorporation. |
The following is a summary of the inputs used, as of July 31, 2012, involving the Fund's assets and liabilities carried at fair value. The inputs or methodology used for valuing securities may not be an indication of the risk associated with investing in those securities. For more information on valuation inputs, and their aggregation into the levels used in the tables below, please refer to the Security Valuation section in the accompanying Notes to Financial Statements. |
Valuation Inputs at Reporting Date: |
Description | Total | Level 1 | Level 2 | Level 3 |
Investments in Securities: | | | | |
Equities: | | | | |
Consumer Discretionary | $ 2,023,998 | $ 2,023,998 | $ - | $ - |
Financials | 252,090,894 | 199,087,890 | 53,003,004 | - |
Information Technology | 589,300 | 589,300 | - | - |
Money Market Funds | 12,312,294 | 12,312,294 | - | - |
Total Investments in Securities: | $ 267,016,486 | $ 214,013,482 | $ 53,003,004 | $ - |
The following is a summary of transfers between Level 1 and Level 2 for the period ended July 31, 2012. Transfers are assumed to have occurred at the beginning of the period, and are primarily attributable to the valuation techniques used for foreign equity securities, as discussed in the accompanying Notes to Financial Statements: |
Transfers | Total |
Level 1 to Level 2 | $ 51,041,465 |
Level 2 to Level 1 | $ - |
See accompanying notes which are an integral part of the financial statements.
Annual Report
Statement of Assets and Liabilities
| July 31, 2012 |
| | |
Assets | | |
Investment in securities, at value (including securities loaned of $814,031) - See accompanying schedule: Unaffiliated issuers (cost $281,982,482) | $ 254,704,192 | |
Fidelity Central Funds (cost $12,312,294) | 12,312,294 | |
Total Investments (cost $294,294,776) | | $ 267,016,486 |
Foreign currency held at value (cost $413,341) | | 413,469 |
Receivable for investments sold | | 644,637 |
Receivable for fund shares sold | | 343,465 |
Dividends receivable | | 569,418 |
Distributions receivable from Fidelity Central Funds | | 3,238 |
Other receivables | | 92,780 |
Total assets | | 269,083,493 |
| | |
Liabilities | | |
Payable for investments purchased | $ 757,448 | |
Payable for fund shares redeemed | 252,652 | |
Accrued management fee | 153,109 | |
Distribution and service plan fees payable | 5,321 | |
Other affiliated payables | 72,468 | |
Other payables and accrued expenses | 173,912 | |
Collateral on securities loaned, at value | 870,644 | |
Total liabilities | | 2,285,554 |
| | |
Net Assets | | $ 266,797,939 |
Net Assets consist of: | | |
Paid in capital | | $ 611,378,296 |
Undistributed net investment income | | 4,308,924 |
Accumulated undistributed net realized gain (loss) on investments and foreign currency transactions | | (321,581,509) |
Net unrealized appreciation (depreciation) on investments and assets and liabilities in foreign currencies | | (27,307,772) |
Net Assets | | $ 266,797,939 |
See accompanying notes which are an integral part of the financial statements.
Annual Report
Financial Statements - continued
Statement of Assets and Liabilities - continued
| July 31, 2012 |
| | |
Calculation of Maximum Offering Price Class A:
Net Asset Value and redemption price per share ($7,116,550 ÷ 850,744 shares) | | $ 8.37 |
| | |
Maximum offering price per share (100/94.25 of $8.37) | | $ 8.88 |
Class T:
Net Asset Value and redemption price per share ($2,570,309 ÷ 309,041 shares) | | $ 8.32 |
| | |
Maximum offering price per share (100/96.50 of $8.32) | | $ 8.62 |
Class B:
Net Asset Value and offering price per share ($457,408 ÷ 55,542 shares)A | | $ 8.24 |
| | |
Class C:
Net Asset Value and offering price per share ($3,164,071 ÷ 385,508 shares)A | | $ 8.21 |
| | |
| | |
International Real Estate:
Net Asset Value, offering price and redemption price per share ($251,542,978 ÷ 29,803,415 shares) | | $ 8.44 |
| | |
Institutional Class:
Net Asset Value, offering price and redemption price per share ($1,946,623 ÷ 231,246 shares) | | $ 8.42 |
A Redemption price per share is equal to net asset value less any applicable contingent deferred sales charge.
See accompanying notes which are an integral part of the financial statements.
Annual Report
Statement of Operations
| Year ended July 31, 2012 |
| | |
Investment Income | | |
Dividends | | $ 9,616,226 |
Interest | | 122 |
Income from Fidelity Central Funds | | 95,014 |
Income before foreign taxes withheld | | 9,711,362 |
Less foreign taxes withheld | | (550,765) |
Total income | | 9,160,597 |
| | |
Expenses | | |
Management fee | $ 1,872,547 | |
Transfer agent fees | 790,564 | |
Distribution and service plan fees | 57,410 | |
Accounting and security lending fees | 137,396 | |
Custodian fees and expenses | 184,232 | |
Independent trustees' compensation | 1,771 | |
Registration fees | 80,907 | |
Audit | 77,170 | |
Legal | 1,045 | |
Miscellaneous | 4,049 | |
Total expenses before reductions | 3,207,091 | |
Expense reductions | (182,590) | 3,024,501 |
Net investment income (loss) | | 6,136,096 |
Realized and Unrealized Gain (Loss) Net realized gain (loss) on: | | |
Investment securities: | | |
Unaffiliated issuers | (26,508,546) | |
Foreign currency transactions | (257,489) | |
Total net realized gain (loss) | | (26,766,035) |
Change in net unrealized appreciation (depreciation) on: Investment securities | (20,196) | |
Assets and liabilities in foreign currencies | (18,559) | |
Total change in net unrealized appreciation (depreciation) | | (38,755) |
Net gain (loss) | | (26,804,790) |
Net increase (decrease) in net assets resulting from operations | | $ (20,668,694) |
See accompanying notes which are an integral part of the financial statements.
Annual Report
Financial Statements - continued
Statement of Changes in Net Assets
| Year ended
July 31,
2012 | Year ended
July 31,
2011 |
Increase (Decrease) in Net Assets | | |
Operations | | |
Net investment income (loss) | $ 6,136,096 | $ 14,085,086 |
Net realized gain (loss) | (26,766,035) | 37,430,925 |
Change in net unrealized appreciation (depreciation) | (38,755) | 3,876,295 |
Net increase (decrease) in net assets resulting
from operations | (20,668,694) | 55,392,306 |
Distributions to shareholders from net investment income | (6,740,519) | (13,892,744) |
Distributions to shareholders from net realized gain | (6,329,734) | (11,440,782) |
Total distributions | (13,070,253) | (25,333,526) |
Share transactions - net increase (decrease) | (36,696,766) | (26,030,265) |
Redemption fees | 82,484 | 74,922 |
Total increase (decrease) in net assets | (70,353,229) | 4,103,437 |
| | |
Net Assets | | |
Beginning of period | 337,151,168 | 333,047,731 |
End of period (including undistributed net investment income of $4,308,924 and undistributed net investment income of $4,912,084, respectively) | $ 266,797,939 | $ 337,151,168 |
See accompanying notes which are an integral part of the financial statements.
Annual Report
Financial Highlights - Class A
Years ended July 31, | 2012 | 2011 | 2010 | 2009 | 2008 |
Selected Per-Share Data | | | | | |
Net asset value, beginning of period | $ 9.21 | $ 8.46 | $ 8.24 | $ 10.63 | $ 15.71 |
Income from Investment Operations | | | | | |
Net investment income (loss) C | .16 | .34 F | .17 | .18 | .20 |
Net realized and unrealized gain (loss) | (.65) | 1.04 | .24 | (2.57) | (3.48) |
Total from investment operations | (.49) | 1.38 | .41 | (2.39) | (3.28) |
Distributions from net investment income | (.17) | (.33) | (.07) | - | (.31) |
Distributions from net realized gain | (.18) | (.29) | (.12) | - | (1.50) |
Total distributions | (.35) | (.63) I | (.19) | - | (1.81) |
Redemption fees added to paid in capital C | - H | - H | - H | - H | .01 |
Net asset value, end of period | $ 8.37 | $ 9.21 | $ 8.46 | $ 8.24 | $ 10.63 |
Total Return A,B | (4.88)% | 16.76% | 4.97% | (22.48)% | (23.20)% |
Ratios to Average Net Assets D,G | | | | | |
Expenses before reductions | 1.44% | 1.42% | 1.44% | 1.45% | 1.38% |
Expenses net of fee waivers, if any | 1.44% | 1.42% | 1.44% | 1.45% | 1.38% |
Expenses net of all reductions | 1.37% | 1.36% | 1.39% | 1.42% | 1.35% |
Net investment income (loss) | 2.09% | 3.67% F | 2.02% | 2.55% | 1.58% |
Supplemental Data | | | | | |
Net assets, end of period (000 omitted) | $ 7,117 | $ 7,047 | $ 7,250 | $ 6,745 | $ 9,976 |
Portfolio turnover rate E | 138% | 131% | 95% | 55% | 63% |
A Total returns would have been lower if certain expenses had not been reduced during the applicable periods shown.
B Total returns do not include the effect of the sales charges.
C Calculated based on average shares outstanding during the period.
D Fees and expenses of any underlying Fidelity Central Funds are not included in the Fund's expense ratio. The Fund indirectly bears its proportionate share of the expenses of any underlying Fidelity Central Funds.
E Amount does not include the portfolio activity of any underlying Fidelity Central Funds.
F Investment income per share reflects large, non-recurring dividends which amounted to $.19 per share. Excluding these non-recurring dividends, the ratio of net investment income (loss) to average net assets would have been 1.64%.
G Expense ratios reflect operating expenses of the class. Expenses before reductions do not reflect amounts reimbursed by the investment adviser or reductions from brokerage service arrangements or reductions from other expense offset arrangements and do not represent the amount paid by the class during periods when reimbursements or reductions occur. Expenses net of fee waivers reflect expenses after reimbursement by the investment adviser but prior to reductions from brokerage service arrangements or other expense offset arrangements. Expenses net of all reductions represent the net expenses paid by the class.
H Amount represents less than $.01 per share.
I Total distributions of $.63 per share is comprised of distributions from net investment income of $.333 and distributions from net realized gain of $.294 per share.
See accompanying notes which are an integral part of the financial statements.
Annual Report
Financial Highlights - Class T
Years ended July 31, | 2012 | 2011 | 2010 | 2009 | 2008 |
Selected Per-Share Data | | | | | |
Net asset value, beginning of period | $ 9.16 | $ 8.41 | $ 8.21 | $ 10.62 | $ 15.70 |
Income from Investment Operations | | | | | |
Net investment income (loss) C | .14 | .31 F | .15 | .17 | .17 |
Net realized and unrealized gain (loss) | (.66) | 1.04 | .23 | (2.58) | (3.48) |
Total from investment operations | (.52) | 1.35 | .38 | (2.41) | (3.31) |
Distributions from net investment income | (.14) | (.31) | (.06) | - | (.28) |
Distributions from net realized gain | (.18) | (.29) | (.12) | - | (1.50) |
Total distributions | (.32) | (.60) | (.18) | - | (1.78) |
Redemption fees added to paid in capital C | - H | - H | - H | - H | .01 |
Net asset value, end of period | $ 8.32 | $ 9.16 | $ 8.41 | $ 8.21 | $ 10.62 |
Total Return A,B | (5.23)% | 16.54% | 4.68% | (22.69)% | (23.39)% |
Ratios to Average Net Assets D,G | | | | | |
Expenses before reductions | 1.72% | 1.69% | 1.70% | 1.71% | 1.64% |
Expenses net of fee waivers, if any | 1.70% | 1.69% | 1.70% | 1.71% | 1.64% |
Expenses net of all reductions | 1.63% | 1.63% | 1.65% | 1.68% | 1.60% |
Net investment income (loss) | 1.83% | 3.41% F | 1.75% | 2.29% | 1.32% |
Supplemental Data | | | | | |
Net assets, end of period (000 omitted) | $ 2,570 | $ 2,496 | $ 2,510 | $ 2,080 | $ 7,566 |
Portfolio turnover rate E | 138% | 131% | 95% | 55% | 63% |
A Total returns would have been lower if certain expenses had not been reduced during the applicable periods shown.
B Total returns do not include the effect of the sales charges.
C Calculated based on average shares outstanding during the period.
D Fees and expenses of any underlying Fidelity Central Funds are not included in the Fund's expense ratio. The Fund indirectly bears its proportionate share of the expenses of any underlying Fidelity Central Funds.
E Amount does not include the portfolio activity of any underlying Fidelity Central Funds.
F Investment income per share reflects large, non-recurring dividends which amounted to $.19 per share. Excluding these non-recurring dividends, the ratio of net investment income (loss) to average net assets would have been 1.38%.
G Expense ratios reflect operating expenses of the class. Expenses before reductions do not reflect amounts reimbursed by the investment adviser or reductions from brokerage service arrangements or reductions from other expense offset arrangements and do not represent the amount paid by the class during periods when reimbursements or reductions occur. Expenses net of fee waivers reflect expenses after reimbursement by the investment adviser but prior to reductions from brokerage service arrangements or other expense offset arrangements. Expenses net of all reductions represent the net expenses paid by the class.
H Amount represents less than $.01 per share.
See accompanying notes which are an integral part of the financial statements.
Annual Report
Financial Highlights - Class B
Years ended July 31, | 2012 | 2011 | 2010 | 2009 | 2008 |
Selected Per-Share Data | | | | | |
Net asset value, beginning of period | $ 9.05 | $ 8.32 | $ 8.14 | $ 10.58 | $ 15.67 |
Income from Investment Operations | | | | | |
Net investment income (loss) C | .10 | .26 F | .11 | .13 | .11 |
Net realized and unrealized gain (loss) | (.64) | 1.03 | .23 | (2.57) | (3.48) |
Total from investment operations | (.54) | 1.29 | .34 | (2.44) | (3.37) |
Distributions from net investment income | (.09) | (.27) | (.04) | - | (.23) |
Distributions from net realized gain | (.18) | (.29) | (.12) | - | (1.50) |
Total distributions | (.27) | (.56) | (.16) | - | (1.73) |
Redemption fees added to paid in capital C | - H | - H | - H | - H | .01 |
Net asset value, end of period | $ 8.24 | $ 9.05 | $ 8.32 | $ 8.14 | $ 10.58 |
Total Return A,B | (5.61)% | 15.90% | 4.20% | (23.06)% | (23.80)% |
Ratios to Average Net Assets D,G | | | | | |
Expenses before reductions | 2.19% | 2.17% | 2.19% | 2.19% | 2.14% |
Expenses net of fee waivers, if any | 2.19% | 2.17% | 2.19% | 2.19% | 2.14% |
Expenses net of all reductions | 2.12% | 2.11% | 2.14% | 2.17% | 2.11% |
Net investment income (loss) | 1.34% | 2.92% F | 1.26% | 1.81% | .82% |
Supplemental Data | | | | | |
Net assets, end of period (000 omitted) | $ 457 | $ 570 | $ 629 | $ 606 | $ 930 |
Portfolio turnover rate E | 138% | 131% | 95% | 55% | 63% |
A Total returns would have been lower if certain expenses had not been reduced during the applicable periods shown.
B Total returns do not include the effect of the contingent deferred sales charge.
C Calculated based on average shares outstanding during the period.
D Fees and expenses of any underlying Fidelity Central Funds are not included in the Fund's expense ratio. The Fund indirectly bears its proportionate share of the expenses of any underlying Fidelity Central Funds.
E Amount does not include the portfolio activity of any underlying Fidelity Central Funds.
F Investment income per share reflects large, non-recurring dividends which amounted to $.18 per share. Excluding these non-recurring dividends, the ratio of net investment income (loss) to average net assets would have been .90%.
G Expense ratios reflect operating expenses of the class. Expenses before reductions do not reflect amounts reimbursed by the investment adviser or reductions from brokerage service arrangements or reductions from other expense offset arrangements and do not represent the amount paid by the class during periods when reimbursements or reductions occur. Expenses net of fee waivers reflect expenses after reimbursement by the investment adviser but prior to reductions from brokerage service arrangements or other expense offset arrangements. Expenses net of all reductions represent the net expenses paid by the class.
H Amount represents less than $.01 per share.
See accompanying notes which are an integral part of the financial statements.
Annual Report
Financial Highlights - Class C
Years ended July 31, | 2012 | 2011 | 2010 | 2009 | 2008 |
Selected Per-Share Data | | | | | |
Net asset value, beginning of period | $ 9.03 | $ 8.30 | $ 8.13 | $ 10.57 | $ 15.67 |
Income from Investment Operations | | | | | |
Net investment income (loss) C | .10 | .26 F | .11 | .13 | .11 |
Net realized and unrealized gain (loss) | (.64) | 1.04 | .22 | (2.57) | (3.48) |
Total from investment operations | (.54) | 1.30 | .33 | (2.44) | (3.37) |
Distributions from net investment income | (.10) | (.28) | (.04) | - | (.24) |
Distributions from net realized gain | (.18) | (.29) | (.12) | - | (1.50) |
Total distributions | (.28) | (.57) | (.16) | - | (1.74) |
Redemption fees added to paid in capital C | - H | - H | - H | - H | .01 |
Net asset value, end of period | $ 8.21 | $ 9.03 | $ 8.30 | $ 8.13 | $ 10.57 |
Total Return A,B | (5.68)% | 16.07% | 4.10% | (23.08)% | (23.78)% |
Ratios to Average Net Assets D,G | | | | | |
Expenses before reductions | 2.19% | 2.17% | 2.18% | 2.19% | 2.14% |
Expenses net of fee waivers, if any | 2.19% | 2.17% | 2.18% | 2.19% | 2.14% |
Expenses net of all reductions | 2.12% | 2.11% | 2.14% | 2.17% | 2.11% |
Net investment income (loss) | 1.34% | 2.92% F | 1.27% | 1.81% | .82% |
Supplemental Data | | | | | |
Net assets, end of period (000 omitted) | $ 3,164 | $ 3,208 | $ 3,201 | $ 2,496 | $ 3,477 |
Portfolio turnover rate E | 138% | 131% | 95% | 55% | 63% |
A Total returns would have been lower if certain expenses had not been reduced during the applicable periods shown.
B Total returns do not include the effect of the contingent deferred sales charge.
C Calculated based on average shares outstanding during the period.
D Fees and expenses of any underlying Fidelity Central Funds are not included in the Fund's expense ratio. The Fund indirectly bears its proportionate share of the expenses of any underlying Fidelity Central Funds.
E Amount does not include the portfolio activity of any underlying Fidelity Central Funds.
F Investment income per share reflects large, non-recurring dividends which amounted to $.18 per share. Excluding these non-recurring dividends, the ratio of net investment income (loss) to average net assets would have been .89%.
G Expense ratios reflect operating expenses of the class. Expenses before reductions do not reflect amounts reimbursed by the investment adviser or reductions from brokerage service arrangements or reductions from other expense offset arrangements and do not represent the amount paid by the class during periods when reimbursements or reductions occur. Expenses net of fee waivers reflect expenses after reimbursement by the investment adviser but prior to reductions from brokerage service arrangements or other expense offset arrangements. Expenses net of all reductions represent the net expenses paid by the class.
H Amount represents less than $.01 per share.
See accompanying notes which are an integral part of the financial statements.
Annual Report
Financial Highlights - International Real Estate
Years ended July 31, | 2012 | 2011 | 2010 | 2009 | 2008 |
Selected Per-Share Data | | | | | |
Net asset value, beginning of period | $ 9.30 | $ 8.53 | $ 8.29 | $ 10.68 | $ 15.73 |
Income from Investment Operations | | | | | |
Net investment income (loss) B | .18 | .36 E | .19 | .20 | .25 |
Net realized and unrealized gain (loss) | (.67) | 1.06 | .25 | (2.59) | (3.50) |
Total from investment operations | (.49) | 1.42 | .44 | (2.39) | (3.25) |
Distributions from net investment income | (.19) | (.35) | (.08) | - | (.31) |
Distributions from net realized gain | (.18) | (.29) | (.12) | - | (1.50) |
Total distributions | (.37) | (.65) H | (.20) | - | (1.81) |
Redemption fees added to paid in capital B | - G | - G | - G | - G | .01 |
Net asset value, end of period | $ 8.44 | $ 9.30 | $ 8.53 | $ 8.29 | $ 10.68 |
Total Return A | (4.76)% | 17.15% | 5.29% | (22.38)% | (22.97)% |
Ratios to Average Net Assets C,F | | | | | |
Expenses before reductions | 1.19% | 1.17% | 1.19% | 1.19% | 1.11% |
Expenses net of fee waivers, if any | 1.19% | 1.17% | 1.19% | 1.19% | 1.10% |
Expenses net of all reductions | 1.12% | 1.11% | 1.14% | 1.16% | 1.07% |
Net investment income (loss) | 2.34% | 3.92% E | 2.27% | 2.81% | 1.86% |
Supplemental Data | | | | | |
Net assets, end of period (000 omitted) | $ 251,543 | $ 322,045 | $ 318,032 | $ 336,126 | $ 572,985 |
Portfolio turnover rate D | 138% | 131% | 95% | 55% | 63% |
A Total returns would have been lower if certain expenses had not been reduced during the applicable periods shown.
B Calculated based on average shares outstanding during the period.
C Fees and expenses of any underlying Fidelity Central Funds are not included in the Fund's expense ratio. The Fund indirectly bears its proportionate share of the expenses of any underlying Fidelity Central Funds.
D Amount does not include the portfolio activity of any underlying Fidelity Central Funds.
E Investment income per share reflects large, non-recurring dividends which amounted to $.19 per share. Excluding these non-recurring dividends, the ratio of net investment income (loss) to average net assets would have been 1.90%.
F Expense ratios reflect operating expenses of the class. Expenses before reductions do not reflect amounts reimbursed by the investment adviser or reductions from brokerage service arrangements or reductions from other expense offset arrangements and do not represent the amount paid by the class during periods when reimbursements or reductions occur. Expenses net of fee waivers reflect expenses after reimbursement by the investment adviser but prior to reductions from brokerage service arrangements or other expense offset arrangements. Expenses net of all reductions represent the net expenses paid by the class.
G Amount represents less than $.01 per share.
H Total distributions of $.65 per share is comprised of distributions from net investment income of $.354 and distributions from net realized gain of $.294 per share.
See accompanying notes which are an integral part of the financial statements.
Annual Report
Financial Highlights - Institutional Class
Years ended July 31, | 2012 | 2011 | 2010 | 2009 | 2008 |
Selected Per-Share Data | | | | | |
Net asset value, beginning of period | $ 9.28 | $ 8.51 | $ 8.28 | $ 10.66 | $ 15.73 |
Income from Investment Operations | | | | | |
Net investment income (loss) B | .18 | .36 E | .19 | .20 | .24 |
Net realized and unrealized gain (loss) | (.67) | 1.06 | .24 | (2.58) | (3.49) |
Total from investment operations | (.49) | 1.42 | .43 | (2.38) | (3.25) |
Distributions from net investment income | (.20) | (.35) | (.08) | - | (.33) |
Distributions from net realized gain | (.18) | (.29) | (.12) | - | (1.50) |
Total distributions | (.37) H | (.65) I | (.20) | - | (1.83) |
Redemption fees added to paid in capital B | - G | - G | - G | - G | .01 |
Net asset value, end of period | $ 8.42 | $ 9.28 | $ 8.51 | $ 8.28 | $ 10.66 |
Total Return A | (4.73)% | 17.18% | 5.18% | (22.33)% | (22.98)% |
Ratios to Average Net Assets C,F | | | | | |
Expenses before reductions | 1.19% | 1.17% | 1.18% | 1.19% | 1.13% |
Expenses net of fee waivers, if any | 1.19% | 1.17% | 1.18% | 1.19% | 1.13% |
Expenses net of all reductions | 1.12% | 1.11% | 1.14% | 1.17% | 1.10% |
Net investment income (loss) | 2.34% | 3.92% E | 2.27% | 2.81% | 1.83% |
Supplemental Data | | | | | |
Net assets, end of period (000 omitted) | $ 1,947 | $ 1,785 | $ 1,425 | $ 1,600 | $ 3,289 |
Portfolio turnover rate D | 138% | 131% | 95% | 55% | 63% |
A Total returns would have been lower if certain expenses had not been reduced during the applicable periods shown.
B Calculated based on average shares outstanding during the period.
C Fees and expenses of any underlying Fidelity Central Funds are not included in the Fund's expense ratio. The Fund indirectly bears its proportionate share of the expenses of any underlying Fidelity Central Funds.
D Amount does not include the portfolio activity of any underlying Fidelity Central Funds.
E Investment income per share reflects large, non-recurring dividends which amounted to $.19 per share. Excluding these non-recurring dividends, the ratio of net investment income (loss) to average net assets would have been 1.90%.
F Expense ratios reflect operating expenses of the class. Expenses before reductions do not reflect amounts reimbursed by the investment adviser or reductions from brokerage service arrangements or reductions from other expense offset arrangements and do not represent the amount paid by the class during periods when reimbursements or reductions occur. Expenses net of fee waivers reflect expenses after reimbursement by the investment adviser but prior to reductions from brokerage service arrangements or other expense offset arrangements. Expenses net of all reductions represent the net expenses paid by the class.
G Amount represents less than $.01 per share.
H Total distributions of $.37 per share is comprised of distributions from net investment income of $.195 and distributions from net realized gain of $.178 per share.
I Total distributions of $.65 per share is comprised of distributions from net investment income of $.354 and distributions from net realized gain of $.294 per share.
See accompanying notes which are an integral part of the financial statements.
Annual Report
Notes to Financial Statements
For the period ended July 31, 2012
1. Organization.
Fidelity International Real Estate Fund (the Fund) is a non-diversified fund of Fidelity Securities Fund (the Trust) and is authorized to issue an unlimited number of shares. The Trust is registered under the Investment Company Act of 1940, as amended (the 1940 Act), as an open-end management investment company organized as a Massachusetts business trust. The Fund offers Class A, Class T, Class C, International Real Estate and Institutional Class shares, each of which, along with Class B shares, has equal rights as to assets and voting privileges. Effective after the close of business on September 1, 2010, Class B shares were closed to new accounts and additional purchases, except for exchanges and reinvestments. Each class has exclusive voting rights with respect to matters that affect that class. Class B shares will automatically convert to Class A shares after a holding period of seven years from the initial date of purchase. Investment income, realized and unrealized capital gains and losses, the common expenses of the Fund, and certain fund-level expense reductions, if any, are allocated on a pro-rata basis to each class based on the relative net assets of each class to the total net assets of the Fund. Each class differs with respect to transfer agent and distribution and service plan fees incurred. Certain expense reductions may also differ by class. The Fund's investments in emerging markets can be subject to social, economic, regulatory, and political uncertainties and can be extremely volatile.
2. Investments in Fidelity Central Funds.
The Fund invests in Fidelity Central Funds, which are open-end investment companies available only to other investment companies and accounts managed by Fidelity Management & Research Company (FMR) and its affiliates. The Fund's Schedule of Investments lists each of the Fidelity Central Funds held as of period end, if any, as an investment of the Fund, but does not include the underlying holdings of each Fidelity Central Fund. As an Investing Fund, the Fund indirectly bears its proportionate share of the expenses of the underlying Fidelity Central Funds.
The Money Market Central Funds seek preservation of capital and current income and are managed by Fidelity Investments Money Management, Inc. (FIMM), an affiliate of FMR.
A complete unaudited list of holdings for each Fidelity Central Fund is available upon request or at the Securities and Exchange Commission (the SEC) web site at www.sec.gov. In addition, the financial statements of the Fidelity Central Funds, which are not covered by the Fund's Report of Independent Registered Public Accounting Firm, are available on the SEC web site or upon request.
Annual Report
Notes to Financial Statements - continued
3. Significant Accounting Policies.
The financial statements have been prepared in conformity with accounting principles generally accepted in the United States of America (GAAP), which require management to make certain estimates and assumptions at the date of the financial statements. Actual results could differ from those estimates. Subsequent events, if any, through the date that the financial statements were issued have been evaluated in the preparation of the financial statements. The following summarizes the significant accounting policies of the Fund:
Security Valuation. Investments are valued as of 4:00 p.m. Eastern time on the last calendar day of the period. In accordance with valuation policies and procedures approved by the Board of Trustees (the Board), the Fund attempts to obtain prices from one or more third party pricing vendor or broker to value its investments. When current market prices, quotations or rates are not readily available or reliable, securities will be fair valued in good faith by the FMR Fair Value Committee (the Committee), in accordance with procedures adopted by the Fund's Board. Factors used in determining fair value vary by security type and may include market or security specific events. The frequency with which these procedures are used cannot be predicted and they may be utilized to a significant extent. The Committee oversees the Fund's valuation policies and procedures and is responsible for approving and reporting to the Board all fair value determinations.
The Fund categorizes the inputs to valuation techniques used to value its investments into a disclosure hierarchy consisting of three levels as shown below:
Level 1 - quoted prices in active markets for identical investments
Level 2 - other significant observable inputs (including quoted prices for similar investments, interest rates, prepayment speeds, etc.)
Level 3 - unobservable inputs (including the Fund's own assumptions based on the best information available)
Valuation techniques used to value the Fund's investments by major category are as follows:
Equity securities, including restricted securities, for which market quotations are readily available, are valued at the last reported sale price or official closing price as reported by a third party pricing vendor on the primary market or exchange on which they are traded and are categorized as Level 1 in the hierarchy. In the event there were no sales during the day or closing prices are not available, securities are valued at the last quoted bid price or may be valued using the last available price and are generally categorized as Level 2 in the hierarchy. For foreign equity securities, when significant market or security specific events arise, comparisons to the valuation of American Depositary Receipts
Annual Report
3. Significant Accounting Policies - continued
Security Valuation - continued
(ADRs), futures contracts, Exchange-Traded Funds (ETFs) and certain indexes as well as quoted prices for similar securities are used and are categorized as Level 2 in the hierarchy. Utilizing these techniques may result in transfers between Level 1 and Level 2.
Investments in open-end mutual funds, including the Fidelity Central Funds, are valued at their closing net asset value each business day and are categorized as Level 1 in the hierarchy.
Changes in valuation techniques may result in transfers in or out of an assigned level within the disclosure hierarchy. The aggregate value of investments by input level, as of July 31, 2012, including information on transfers between Levels 1 and 2, is included at the end of the Fund's Schedule of Investments.
Foreign Currency Translation. The Fund may use foreign currency contracts to facilitate transactions in foreign-denominated securities. Gains and losses from these transactions may arise from changes in the value of the foreign currency or if the counterparties do not perform under the contracts' terms.
Foreign-denominated assets, including investment securities, and liabilities are translated into U.S. dollars at the exchange rates at period end. Purchases and sales of investment securities, income and dividends received and expenses denominated in foreign currencies are translated into U.S. dollars at the exchange rate in effect on the transaction date.
The effects of exchange rate fluctuations on investments are included with the net realized and unrealized gain (loss) on investment securities. Other foreign currency transactions resulting in realized and unrealized gain (loss) are disclosed separately.
Investment Transactions and Income. For financial reporting purposes, the Fund's investment holdings and NAV include trades executed through the end of the last business day of the period. The NAV per share for processing shareholder transactions is calculated as of the close of business of the New York Stock Exchange (NYSE), normally 4:00 p.m. Eastern time and includes trades executed through the end of the prior business day. Gains and losses on securities sold are determined on the basis of identified cost. Dividend income is recorded on the ex-dividend date, except for certain dividends from foreign securities where the ex-dividend date may have passed, which are recorded as soon as the Fund is informed of the ex-dividend date. Non-cash dividends included in dividend income, if any, are recorded at the fair market value of the securities received. Interest income and distributions from the Fidelity Central Funds are accrued as earned. Interest income includes coupon interest and amortization of premium and accretion of discount on debt securities. Investment income is recorded net of foreign taxes withheld where recovery of such taxes is uncertain.
Annual Report
Notes to Financial Statements - continued
3. Significant Accounting Policies - continued
Expenses. Expenses directly attributable to a fund are charged to that fund. Expenses attributable to more than one fund are allocated among the respective funds on the basis of relative net assets or other appropriate methods. Expense estimates are accrued in the period to which they relate and adjustments are made when actual amounts are known.
Income Tax Information and Distributions to Shareholders. Each year, the Fund intends to qualify as a regulated investment company under Subchapter M of the Internal Revenue Code, including distributing substantially all of its taxable income and realized gains. As a result, no provision for income taxes is required. As of July 31, 2012, the Fund did not have any unrecognized tax benefits in the financial statements; nor is the Fund aware of any tax positions for which it is reasonably possible that the total amounts of unrecognized tax benefits will significantly change in the next twelve months. The Fund files a U.S. federal tax return, in addition to state and local tax returns as required. A fund's federal income tax returns are subject to examination by the Internal Revenue Service (IRS) for a period of three fiscal years after they are filed. State and local tax returns may be subject to examination for an additional fiscal year depending on the jurisdiction. Foreign taxes are provided for based on the Fund's understanding of the tax rules and rates that exist in the foreign markets in which it invests.
Distributions are declared and recorded on the ex-dividend date. Income dividends and capital gain distributions are declared separately for each class. Income and capital gain distributions are determined in accordance with income tax regulations, which may differ from GAAP.
Capital accounts within the financial statements are adjusted for permanent book-tax differences. These adjustments have no impact on net assets or the results of operations. Temporary book-tax differences will reverse in a subsequent period.
Book-tax differences are primarily due to foreign currency transactions, passive foreign investments companies (PFIC), capital loss carryforwards and losses deferred due to wash sales and excise tax regulations.
The federal tax cost of investment securities and unrealized appreciation (depreciation) as of period end were as follows:
Gross unrealized appreciation | $ 8,210,797 |
Gross unrealized depreciation | (42,520,691) |
Net unrealized appreciation (depreciation) on securities and other investments | $ (34,309,894) |
| |
Tax Cost | $ 301,326,380 |
Annual Report
3. Significant Accounting Policies - continued
Income Tax Information and Distributions to Shareholders - continued
The tax-based components of distributable earnings as of period end were as follows:
Undistributed ordinary income | $ 8,146,350 |
Capital loss carryforward | $ (305,203,415) |
Net unrealized appreciation (depreciation) | $ (34,346,659) |
Capital loss carryforwards are only available to offset future capital gains of the Fund to the extent provided by regulations and may be limited. Under the Regulated Investment Company Modernization Act of 2010 (the Act), the Fund is permitted to carry forward capital losses incurred in taxable years beginning after December 22, 2010 for an unlimited period and such capital losses are required to be used prior to any losses that expire. Capital loss carryforwards were as follows:
Fiscal year of expiration | |
2017 | $ (153,317,175) |
2018 | (136,599,532) |
Total with expiration | $ (289,916,707) |
No expiration | |
Short-term | $ (13,155,668) |
Long-term | (2,131,040) |
Total no expiration | (15,286,708) |
Total capital loss carryforward | $ (305,203,415) |
The Fund intends to elect to defer to its fiscal year ending July 31, 2013 approximately $13,183,916 of capital losses recognized during the period November 1, 2011 to July 31, 2012.
The tax character of distributions paid was as follows:
| July 31, 2012 | July 31, 2011 |
Ordinary Income | $ 13,070,253 | $ 25,333,526 |
Short-Term Trading (Redemption) Fees. Shares held by investors in the Fund less than 90 days are subject to a redemption fee equal to 1.50% of the net asset value of shares redeemed. All redemption fees, which reduce the proceeds of the shareholder redemption, are retained by the Fund and accounted for as an addition to paid in capital.
Annual Report
Notes to Financial Statements - continued
3. Significant Accounting Policies - continued
New Accounting Pronouncement. In December 2011, the Financial Accounting Standards Board issued Accounting Standard Update No. 2011-11, Disclosures about Offsetting Assets and Liabilities. The update creates new disclosure requirements requiring entities to disclose both gross and net information for derivatives and other financial instruments that are either offset in the Statement of Assets and Liabilities or subject to an enforceable master netting arrangement or similar agreement. The disclosure requirements are effective for interim and annual reporting periods beginning on or after January 1, 2013. Management is currently evaluating the impact of the update's adoption on the Fund's financial statement disclosures.
4. Purchases and Sales of Investments.
Purchases and sales of securities, other than short-term securities, aggregated $357,419,840 and $405,089,100, respectively.
5. Fees and Other Transactions with Affiliates.
Management Fee. FMR and its affiliates provide the Fund with investment management related services for which the Fund pays a monthly management fee. The management fee is the sum of an individual fund fee rate that is based on an annual rate of .45% of the Fund's average net assets and an annualized group fee rate that averaged .26% during the period. The group fee rate is based upon the average net assets of all the mutual funds advised by FMR. The group fee rate decreases as assets under management increase and increases as assets under management decrease. For the period, the total annual management fee rate was .71% of the Fund's average net assets.
Distribution and Service Plan Fees. In accordance with Rule 12b-1 of the 1940 Act, the Fund has adopted separate Distribution and Service Plans for each class of shares. Certain classes pay Fidelity Distributors Corporation (FDC), an affiliate of FMR, separate Distribution and Service Fees, each of which is based on an annual percentage of each class' average net assets. In addition, FDC may pay financial intermediaries for selling shares of the Fund and providing shareholder support services. For the period, the Distribution and Service Fee rates, total fees and amounts retained by FDC were as follows:
| Distribution
Fee | Service
Fee | Total Fees | Retained
by FDC |
Class A | -% | .25% | $ 15,646 | $ 39 |
Class T | .25% | .25% | 10,228 | - |
Class B | .75% | .25% | 4,466 | 3,349 |
Class C | .75% | .25% | 27,070 | 3,373 |
| | | $ 57,410 | $ 6,761 |
Annual Report
5. Fees and Other Transactions with Affiliates - continued
Sales Load. FDC may receive a front-end sales charge of up to 5.75% for selling Class A shares and 3.50% for selling Class T shares, some of which is paid to financial intermediaries for selling shares of the Fund. Depending on the holding period, FDC may receive contingent deferred sales charges levied on Class A, Class T, Class B, and Class C redemptions. The deferred sales charges range from 5.00% to 1.00% for Class B shares, 1.00% for Class C shares, 1.00% for certain purchases of Class A shares and .25% for certain purchases of Class T shares.
For the period, sales charge amounts retained by FDC were as follows:
| Retained
by FDC |
Class A | $ 6,375 |
Class T | 1,412 |
Class B* | 1,293 |
Class C* | 136 |
| $ 9,216 |
* When Class B and Class C shares are initially sold, FDC pays commissions from its own resources to financial intermediaries through which the sales are made.
Transfer Agent Fees. Fidelity Investments Institutional Operations Company, Inc. (FIIOC), an affiliate of FMR, is the transfer, dividend disbursing and shareholder servicing agent for each class of the Fund. FIIOC receives account fees and asset-based fees that vary according to the account size and type of account of the shareholders of the respective classes of the Fund. FIIOC pays for typesetting, printing and mailing of shareholder reports, except proxy statements. For the period, transfer agent fees for each class were as follows:
| Amount | % of
Average
Net Assets |
Class A | $ 18,681 | .30 |
Class T | 6,690 | .33 |
Class B | 1,338 | .30 |
Class C | 8,040 | .30 |
International Real Estate | 750,777 | .30 |
Institutional Class | 5,038 | .30 |
| $ 790,564 | |
Annual Report
Notes to Financial Statements - continued
5. Fees and Other Transactions with Affiliates - continued
Accounting and Security Lending Fees. Fidelity Service Company, Inc. (FSC), an affiliate of FMR, maintains the Fund's accounting records. The accounting fee is based on the level of average net assets for each month. Under a separate contract, FSC administers the security lending program. The security lending fee is based on the number and duration of lending transactions.
Brokerage Commissions. The Fund placed a portion of its portfolio transactions with brokerage firms which are affiliates of the investment adviser. The commissions paid to these affiliated firms were $12 for the period.
6. Committed Line of Credit.
The Fund participates with other funds managed by FMR or an affiliate in a $4.25 billion credit facility (the "line of credit") to be utilized for temporary or emergency purposes to fund shareholder redemptions or for other short-term liquidity purposes. The Fund has agreed to pay commitment fees on its pro-rata portion of the line of credit, which amounted to $766 and is reflected in Miscellaneous expenses on the Statement of Operations. During the period, there were no borrowings on this line of credit.
7. Security Lending.
The Fund lends portfolio securities through a lending agent from time to time in order to earn additional income. For equity securities, a lending agent is used and may loan securities to certain qualified borrowers, including Fidelity Capital Markets (FCM), a broker-dealer affiliated with the Fund. On the settlement date of the loan, the Fund receives collateral (in the form of U.S. Treasury obligations, letters of credit and/or cash) against the loaned securities and maintains collateral in an amount not less than 100% of the market value of the loaned securities during the period of the loan. The market value of the loaned securities is determined at the close of business of the Fund and any additional required collateral is delivered to the Fund on the next business day. If the borrower defaults on its obligation to return the securities loaned because of insolvency or other reasons, a fund could experience delays and costs in recovering the securities loaned or in gaining access to the collateral. Any cash collateral received is invested in the Fidelity Securities Lending Cash Central Fund. The value of loaned securities and cash collateral at period end are disclosed on the Fund's Statement of Assets and Liabilities. Security lending income represents the income earned on investing cash collateral, less rebates paid to borrowers and any lending agent fees associated with the loan, plus any premium payments received for lending certain types of securities. Security lending income is presented in the Statement of Operations as a component of income from Fidelity Central Funds. Total security lending income during the period amounted to $77,977. During the period, there were no securities loaned to FCM.
Annual Report
8. Expense Reductions.
FMR voluntarily agreed to reimburse each class to the extent annual operating expenses exceeded certain levels of average net assets as noted in the table below. Some expenses, for example interest expense, including commitment fees, are excluded from this reimbursement.
The following classes were in reimbursement during the period:
| Expense
Limitations | Reimbursement
from adviser |
Class T | 1.70% | $ 378 |
Many of the brokers with whom FMR places trades on behalf of the Fund provided services to the Fund in addition to trade execution. These services included payments of certain expenses on behalf of the Fund totaling $182,189 for the period. In addition, through arrangements with the Fund's custodian, credits realized as a result of uninvested cash balances were used to reduce the Fund's expenses. During the period, these credits reduced the Fund's custody expenses by $23.
9. Distributions to Shareholders.
Distributions to shareholders of each class were as follows:
Years ended July 31, | 2012 | 2011 |
From net investment income | | |
Class A | $ 129,790 | $ 287,564 |
Class T | 38,723 | 96,278 |
Class B | 5,465 | 19,520 |
Class C | 34,224 | 109,655 |
International Real Estate | 6,491,807 | 13,319,427 |
Institutional Class | 40,510 | 60,300 |
Total | $ 6,740,519 | $ 13,892,744 |
From net realized gain | | |
Class A | $ 132,606 | $ 250,090 |
Class T | 47,658 | 89,657 |
Class B | 10,422 | 21,506 |
Class C | 62,457 | 114,914 |
International Real Estate | 6,040,035 | 10,916,536 |
Institutional Class | 36,556 | 48,079 |
Total | $ 6,329,734 | $ 11,440,782 |
Annual Report
Notes to Financial Statements - continued
10. Share Transactions.
Transactions for each class of shares were as follows:
| Shares | Dollars |
Years ended July 31, | 2012 | 2011 | 2012 | 2011 |
Class A | | | | |
Shares sold | 561,131 | 213,763 | $ 4,326,130 | $ 1,964,473 |
Reinvestment of distributions | 30,139 | 50,966 | 225,090 | 451,020 |
Shares redeemed | (505,235) | (357,321) | (3,930,366) | (3,278,956) |
Net increase (decrease) | 86,035 | (92,592) | $ 620,854 | $ (863,463) |
Class T | | | | |
Shares sold | 121,127 | 73,470 | $ 960,744 | $ 668,265 |
Reinvestment of distributions | 11,086 | 20,063 | 82,612 | 176,852 |
Shares redeemed | (95,807) | (119,466) | (730,690) | (1,082,947) |
Net increase (decrease) | 36,406 | (25,933) | $ 312,666 | $ (237,830) |
Class B | | | | |
Shares sold | 10,309 | 4,563 | $ 80,691 | $ 41,321 |
Reinvestment of distributions | 2,053 | 4,289 | 15,253 | 37,454 |
Shares redeemed | (19,799) | (21,555) | (151,766) | (195,000) |
Net increase (decrease) | (7,437) | (12,703) | $ (55,822) | $ (116,225) |
Class C | | | | |
Shares sold | 126,213 | 111,487 | $ 1,000,819 | $ 1,002,010 |
Reinvestment of distributions | 11,099 | 21,061 | 82,243 | 183,176 |
Shares redeemed | (107,140) | (162,778) | (798,655) | (1,467,063) |
Net increase (decrease) | 30,172 | (30,230) | $ 284,407 | $ (281,877) |
International Real Estate | | | | |
Shares sold | 6,073,777 | 7,219,780 | $ 47,017,817 | $ 67,747,351 |
Reinvestment of distributions | 1,561,125 | 2,559,870 | 11,751,117 | 22,802,021 |
Shares redeemed | (12,463,432) | (12,440,980) | (96,926,190) | (115,315,484) |
Net increase (decrease) | (4,828,530) | (2,661,330) | $ (38,157,256) | $ (24,766,112) |
Institutional Class | | | | |
Shares sold | 125,764 | 99,324 | $ 977,184 | $ 925,861 |
Reinvestment of distributions | 8,633 | 10,892 | 64,775 | 96,908 |
Shares redeemed | (95,484) | (85,350) | (743,574) | (787,527) |
Net increase (decrease) | 38,913 | 24,866 | $ 298,385 | $ 235,242 |
Annual Report
11. Other.
The Fund's organizational documents provide former and current trustees and officers with a limited indemnification against liabilities arising in connection with the performance of their duties to the Fund. In the normal course of business, the Fund may also enter into contracts that provide general indemnifications. The Fund's maximum exposure under these arrangements is unknown as this would be dependent on future claims that may be made against the Fund. The risk of material loss from such claims is considered remote.
At the end of the period, FMR or its affiliates were the owners of record of approximately 12% of the outstanding shares of the fund.
Annual Report
To the Trustees of Fidelity Securities Fund and the Shareholders of Fidelity International Real Estate Fund:
In our opinion, the accompanying statement of assets and liabilities, including the schedule of investments, and the related statements of operations and of changes in net assets and the financial highlights present fairly, in all material respects, the financial position of Fidelity International Real Estate Fund (a fund of Fidelity Securities Fund) at July 31, 2012, the results of its operations for the year then ended, the changes in its net assets for each of the two years in the period then ended and the financial highlights for each of the five years in the period then ended, in conformity with accounting principles generally accepted in the United States of America. These financial statements and financial highlights (hereafter referred to as "financial statements") are the responsibility of the Fidelity International Real Estate Fund's management. Our responsibility is to express an opinion on these financial statements based on our audits. We conducted our audits of these financial statements in accordance with the standards of the Public Company Accounting Oversight Board (United States). Those standards require that we plan and perform the audit to obtain reasonable assurance about whether the financial statements are free of material misstatement. An audit includes examining, on a test basis, evidence supporting the amounts and disclosures in the financial statements, assessing the accounting principles used and significant estimates made by management, and evaluating the overall financial statement presentation. We believe that our audits, which included confirmation of securities at July 31, 2012 by correspondence with the custodian and brokers, provide a reasonable basis for our opinion.
PricewaterhouseCoopers LLP
Boston, Massachusetts
September 13, 2012
Annual Report
The Trustees, Members of the Advisory Board, and executive officers of the trust and fund, as applicable, are listed below. The Board of Trustees governs the fund and is responsible for protecting the interests of shareholders. The Trustees are experienced executives who meet periodically throughout the year to oversee the fund's activities, review contractual arrangements with companies that provide services to the fund, oversee management of the risks associated with such activities and contractual arrangements, and review the fund's performance. Except for James C. Curvey, each of the Trustees oversees 228 funds advised by FMR or an affiliate. Mr. Curvey oversees 435 funds advised by FMR or an affiliate.
The Trustees hold office without limit in time except that (a) any Trustee may resign; (b) any Trustee may be removed by written instrument, signed by at least two-thirds of the number of Trustees prior to such removal; (c) any Trustee who requests to be retired or who has become incapacitated by illness or injury may be retired by written instrument signed by a majority of the other Trustees; and (d) any Trustee may be removed at any special meeting of shareholders by a two-thirds vote of the outstanding voting securities of the trust. Each Trustee who is not an interested person (as defined in the 1940 Act) (Independent Trustee), shall retire not later than the last day of the calendar year in which his or her 75th birthday occurs. The Independent Trustees may waive this mandatory retirement age policy with respect to individual Trustees. The executive officers and Advisory Board Members hold office without limit in time, except that any officer and Advisory Board Member may resign or may be removed by a vote of a majority of the Trustees at any regular meeting or any special meeting of the Trustees. Except as indicated, each individual has held the office shown or other offices in the same company for the past five years.
Experience, Skills, Attributes, and Qualifications of the Fund's Trustees. The Governance and Nominating Committee has adopted a statement of policy that describes the experience, qualifications, attributes, and skills that are necessary and desirable for potential Independent Trustee candidates (Statement of Policy). The Board believes that each Trustee satisfied at the time he or she was initially elected or appointed a Trustee, and continues to satisfy, the standards contemplated by the Statement of Policy. The Governance and Nominating Committee also engages professional search firms to help identify potential Independent Trustee candidates who have the experience, qualifications, attributes, and skills consistent with the Statement of Policy. From time to time, additional criteria based on the composition and skills of the current Independent Trustees, as well as experience or skills that may be appropriate in light of future changes to board composition, business conditions, and regulatory or other developments, have also been considered by the professional search firms and the Governance and Nominating Committee. In addition, the Board takes into account the Trustees' commitment and participation in Board and committee meetings, as well as their leadership of standing and ad hoc committees throughout their tenure.
In determining that a particular Trustee was and continues to be qualified to serve as a Trustee, the Board has considered a variety of criteria, none of which, in isolation, was controlling. The Board believes that, collectively, the Trustees have balanced and diverse experience, qualifications, attributes, and skills, which allow the Board to operate effectively in governing the fund and protecting the interests of shareholders. Information about the specific experience, skills, attributes, and qualifications of each Trustee, which in each case led to the Board's conclusion that the Trustee should serve (or continue to serve) as a trustee of the fund, is provided below.
Annual Report
Board Structure and Oversight Function. James C. Curvey is an interested person (as defined in the 1940 Act) and currently serves as Chairman. The Trustees have determined that an interested Chairman is appropriate and benefits shareholders because an interested Chairman has a personal and professional stake in the quality and continuity of services provided to the fund. Independent Trustees exercise their informed business judgment to appoint an individual of their choosing to serve as Chairman, regardless of whether the Trustee happens to be independent or a member of management. The Independent Trustees have determined that they can act independently and effectively without having an Independent Trustee serve as Chairman and that a key structural component for assuring that they are in a position to do so is for the Independent Trustees to constitute a substantial majority for the Board. The Independent Trustees also regularly meet in executive session. Ned C. Lautenbach serves as Chairman of the Independent Trustees and as such (i) acts as a liaison between the Independent Trustees and management with respect to matters important to the Independent Trustees and (ii) with management prepares agendas for Board meetings.
Fidelity funds are overseen by different Boards of Trustees. The fund's Board oversees Fidelity's equity and high income funds and another Board oversees Fidelity's investment-grade bond, money market, and asset allocation funds. The asset allocation funds may invest in Fidelity funds overseen by the fund's Board. The use of separate Boards, each with its own committee structure, allows the Trustees of each group of Fidelity funds to focus on the unique issues of the funds they oversee, including common research, investment, and operational issues. On occasion, the separate Boards establish joint committees to address issues of overlapping consequences for the Fidelity funds overseen by each Board.
The Trustees operate using a system of committees to facilitate the timely and efficient consideration of all matters of importance to the Trustees, the fund, and fund shareholders and to facilitate compliance with legal and regulatory requirements and oversight of the fund's activities and associated risks. The Board, acting through its committees, has charged FMR and its affiliates with (i) identifying events or circumstances the occurrence of which could have demonstrably adverse effects on the fund's business and/or reputation; (ii) implementing processes and controls to lessen the possibility that such events or circumstances occur or to mitigate the effects of such events or circumstances if they do occur; and (iii) creating and maintaining a system designed to evaluate continuously business and market conditions in order to facilitate the identification and implementation processes described in (i) and (ii) above. Because the day-to-day operations and activities of the fund are carried out by or through FMR, its affiliates and other service providers, the fund's exposure to risks is mitigated but not eliminated by the processes overseen by the Trustees. While each of the Board's committees has responsibility for overseeing different aspects of the fund's activities, oversight is exercised primarily through the Operations, Audit, and Compliance Committees. In addition, the Independent Trustees have worked with FMR to enhance the Board's oversight of investment and financial risks, legal and regulatory risks, technology risks, and operational risks, including the development of additional risk reporting to the Board. For example, a working group comprised of Independent Trustees and FMR has worked and continues to work to review the Fidelity funds' valuation-related activities, reporting and risk management. Appropriate personnel, including but not limited to the fund's Chief Compliance Officer (CCO), FMR's internal auditor, the independent accountants, the fund's Treasurer and portfolio management personnel, make periodic reports to the Board's committees, as appropriate, including an annual review of FMR's risk management program for the Fidelity funds. The responsibilities of each standing committee, including their oversight responsibilities, are described further under "Standing Committees of the Fund's Trustees."
Annual Report
Trustees and Officers - continued
The fund's Statement of Additional Information (SAI) includes more information about the Trustees. To request a free copy, call Fidelity at 1-877-208-0098.
Interested Trustees*:
Correspondence intended for each Trustee who is an interested person may be sent to Fidelity Investments, 82 Devonshire Street, Boston, Massachusetts 02109.
Name, Age; Principal Occupations and Other Relevant Experience+ |
James C. Curvey (77) |
| Year of Election or Appointment: 2007 Mr. Curvey is Trustee and Chairman of the Board of Trustees of certain Trusts. Mr. Curvey also serves as Trustee (2007-present) of other investment companies advised by FMR. Mr. Curvey is a Director of Fidelity Investments Money Management, Inc. (2009-present), Director of Fidelity Research & Analysis Co. (2009-present) and Director of FMR and FMR Co., Inc. (2007-present). Mr. Curvey is also Vice Chairman (2007-present) and Director of FMR LLC. In addition, Mr. Curvey serves as an Overseer for the Boston Symphony Orchestra and a member of the Trustees of Villanova University. Previously, Mr. Curvey was the Vice Chairman (2006-2007) and Director (2000-2007) of FMR Corp. |
Ronald P. O'Hanley (55) |
| Year of Election or Appointment: 2011 Mr. O'Hanley is Director of FMR Co., Inc. (2010-present), Director of Fidelity Investments Money Management, Inc. (2010-present), Director of Fidelity Research & Analysis Company (2010-present), President of Fidelity Asset Management and Corporate Services and a member of Fidelity's Executive Committee (2010-present). Previously, Mr. O'Hanley served as President and Chief Executive Officer of BNY Mellon Asset Management (2007-2010). Mr. O'Hanley also served as Vice Chairman of Bank New York Mellon Corp. and a member of that firm's Executive Committee. Prior to the 2007 merger of The Bank of New York and Mellon Financial Corporation, he was Vice Chairman of Mellon Financial Corporation and President and Chief Executive Officer of Mellon Asset Management. He joined Mellon in February 1997. Mr. O'Hanley currently serves as Chairman of the Boston Public Library Foundation Board of Directors and sits on the Board of Directors of Beth Israel Deaconess Medical Center, the Board of Trustees of the Marine Biological Laboratory and the Advisory Board of the Maxwell School of Citizenship and Public Administration at Syracuse University. Mr. O'Hanley also chairs the Council on Asset Management for the Financial Services Roundtable and is a member of the Board of Directors of Institutional Investor's U.S. Institute. |
* Trustees have been determined to be "Interested Trustees" by virtue of, among other things, their affiliation with the trust or various entities under common control with FMR.
+ The information above includes each Trustee's principal occupation during the last five years and other information relating to the experience, attributes, and skills relevant to each Trustee's qualifications to serve as a Trustee, which led to the conclusion that each Trustee should serve as a Trustee for the fund.
Annual Report
Trustees and Officers - continued
Independent Trustees:
Correspondence intended for each Independent Trustee (that is, the Trustees other than the Interested Trustees) may be sent to Fidelity Investments, P.O. Box 55235, Boston, Massachusetts 02205-5235.
Name, Age; Principal Occupations and Other Relevant Experience+ |
Dennis J. Dirks (64) |
| Year of Election or Appointment: 2005 Prior to his retirement in May 2003, Mr. Dirks was Chief Operating Officer and a member of the Board of The Depository Trust & Clearing Corporation (DTCC). He also served as President, Chief Operating Officer, and Board member of The Depository Trust Company (DTC) and President and Board member of the National Securities Clearing Corporation (NSCC). In addition, Mr. Dirks served as Chief Executive Officer and Board member of the Government Securities Clearing Corporation, Chief Executive Officer and Board member of the Mortgage-Backed Securities Clearing Corporation, as a Trustee and a member of the Finance Committee of Manhattan College (2005-2008), and as a Trustee and a member of the Finance Committee of AHRC of Nassau County (2006-2008). Mr. Dirks is a member of the Independent Directors Council (IDC) Governing Council (2010-present) and Board of Directors for The Brookville Center for Children's Services, Inc. (2009-present). |
Alan J. Lacy (58) |
| Year of Election or Appointment: 2008 Mr. Lacy serves as Senior Adviser (2007-present) of Oak Hill Capital Partners, L.P. (private equity). Mr. Lacy also served as Chief Executive Officer (2000-2005) and Vice Chairman (2005-2006) of Sears Holdings Corporation and Sears, Roebuck and Co. (retail). In addition, Mr. Lacy serves as a member of the Board of Directors of Dave & Buster's Entertainment, Inc. (restaurant and entertainment complexes, 2010- present), Earth Fare, Inc. (retail grocery, 2012-present), The Hillman Companies, Inc. (hardware wholesalers, 2010-present), and Bristol-Myers Squibb Company (global pharmaceuticals, 2007-present). Mr. Lacy is a member of the Board of Trustees of The National Parks Conservation Association (2006-present). Previously, Mr. Lacy served as Chairman of the Board of Trustees of the National Parks Conservation Association (2008-2011) and as a member of the Board of Directors for the Western Union Company (global money transfer, 2006-2011). |
Ned C. Lautenbach (68) |
| Year of Election or Appointment: 2000 Mr. Lautenbach is Chairman of the Independent Trustees of the Equity and High Income Funds (2006-present). Mr. Lautenbach currently serves as the Lead Director of the Eaton Corporation Board of Directors (diversified industrial, 1997-present). Mr. Lautenbach is Chairman of the Board of Directors of the Philharmonic Center for the Arts in Naples, Florida (2012-present) and a member of the Council on Foreign Relations (1994-present). Previously, Mr. Lautenbach was a Partner/Advisory Partner at Clayton, Dubilier & Rice, LLC (private equity investment, 1998-2010), as well as a Director of Sony Corporation (2006-2007). |
Joseph Mauriello (67) |
| Year of Election or Appointment: 2008 Prior to his retirement in January 2006, Mr. Mauriello served in numerous senior management positions including Deputy Chairman and Chief Operating Officer (2004-2005), and Vice Chairman of Financial Services (2002-2004) of KPMG LLP US (professional services, 1965-2005). Mr. Mauriello currently serves as a member of the Board of Directors of XL Group plc. (global insurance and re-insurance, 2006-present). Previously, Mr. Mauriello served as a Director of the Hamilton Funds of the Bank of New York (2006-2007) and of Arcadia Resources Inc. (health care services and products, 2007-2012). |
Robert W. Selander (61) |
| Year of Election or Appointment: 2011 Previously, Mr. Selander served as a Member of the Advisory Board of Fidelity's Equity and High Income Funds (2011), Executive Vice Chairman (2010), Chief Executive Officer (2009-2010), and President and Chief Executive Officer (1997-2009) of Mastercard, Inc. |
Cornelia M. Small (68) |
| Year of Election or Appointment: 2005 Ms. Small is a member of the Board of Directors of the Teagle Foundation (2009-present). Ms. Small is also a member of the Investment Committee, and Chair (2008-present) and a member of the Board of Trustees of Smith College. In addition, Ms. Small serves on the Investment Committee of the Berkshire Taconic Community Foundation (2008-present). Previously, Ms. Small served as Chairperson of the Investment Committee (2002-2008) of Smith College. In addition, Ms. Small served as Chief Investment Officer, Director of Global Equity Investments, and a member of the Board of Directors of Scudder, Stevens & Clark and Scudder Kemper Investments. |
William S. Stavropoulos (73) |
| Year of Election or Appointment: 2002 Mr. Stavropoulos is Vice Chairman of the Independent Trustees of the Equity and High Income Funds (2006-present). Mr. Stavropoulos serves as President and Founder of the Michigan Baseball Foundation, the Great Lakes Loons (2007-present). Mr. Stavropoulos is Chairman Emeritus of the Board of Directors of The Dow Chemical Company, where he previously served in numerous senior management positions, including President, CEO (1995-2000; 2002-2004), Chairman of the Executive Committee (2000-2006), and as a member of the Board of Directors (1990-2006). Currently, Mr. Stavropoulos is Chairman of Univar (global distributor of commodity and specialty chemicals, 2010-present), a Director of Teradata Corporation (data warehousing and technology solutions, 2008-present), Chemical Financial Corporation, Maersk Inc. (industrial conglomerate), Tyco International, Inc. (multinational manufacturing and services, 2007-present), and a member of the Advisory Board for Metalmark Capital (private equity investment, 2005-present). Mr. Stavropoulos is a special advisor to Clayton, Dubilier & Rice, LLC (private equity investment). In addition, Mr. Stavropoulos is a member of the University of Notre Dame Advisory Council for the College of Science. |
David M. Thomas (63) |
| Year of Election or Appointment: 2008 Previously, Mr. Thomas served as Executive Chairman (2005-2006) and Chairman and Chief Executive Officer (2000-2005) of IMS Health, Inc. (pharmaceutical and healthcare information solutions). In addition, Mr. Thomas serves as a member of the Board of Directors of Fortune Brands, Inc. (consumer products), and Interpublic Group of Companies, Inc. (marketing communication, 2004-present). |
Michael E. Wiley (61) |
| Year of Election or Appointment: 2008 Mr. Wiley also serves as a Director of Asia Pacific Exploration Consolidated (international oil and gas exploration and production, 2008-present). Mr. Wiley serves as a Director of Tesoro Corporation (independent oil refiner and marketer, 2005-present), and a Director of Bill Barrett Corporation (exploration and production, 2005-present). In addition, Mr. Wiley also serves as a Director of Post Oak Bank (privately-held bank, 2004-present). Previously, Mr. Wiley served as a member of the Board of Trustees of the University of Tulsa (2000-2006; 2007-2010), as a Senior Energy Advisor of Katzenbach Partners, LLC (consulting, 2006-2007), as an Advisory Director of Riverstone Holdings (private investment), Chairman, President, and CEO of Baker Hughes, Inc. (oilfield services, 2000-2004), and as Director of Spinnaker Exploration Company (exploration and production, 2001-2005). |
Annual Report
+ The information above includes each Trustee's principal occupation during the last five years and other information relating to the experience, attributes, and skills relevant to each Trustee's qualifications to serve as a Trustee, which led to the conclusion that each Trustee should serve as a Trustee for the fund.
Advisory Board Members and Executive Officers:
Correspondence intended for David A. Rosow and Garnett A. Smith may be sent to Fidelity Investments, P.O. Box 55235, Boston, Massachusetts 02205-5235. Correspondence intended for each executive officer, Edward C. Johnson 3d, and Peter S. Lynch may be sent to Fidelity Investments, 82 Devonshire Street, Boston, Massachusetts 02109.
Name, Age; Principal Occupation |
Edward C. Johnson 3d (82) |
| Year of Election or Appointment: 2011 Member of the Advisory Board of Fidelity's Equity and High Income Funds. Mr. Johnson serves as Chief Executive Officer, Chairman, and a Director of FMR LLC, and also serves as Chairman and Director of FIL Limited. Previously, Mr. Johnson served as a Trustee and Chairman of the Board of certain Fidelity Trusts, Chairman and a Director of FMR, Chairman and a Director of FMR Co., Inc., and President of FMR LLC (2006-2007). |
Peter S. Lynch (68) |
| Year of Election or Appointment: 2003 Member of the Advisory Board of Fidelity's Equity and High Income Funds. Mr. Lynch is Vice Chairman and a Director of FMR and FMR Co., Inc. In addition, Mr. Lynch serves as a Trustee of Boston College and as the Chairman of the Inner-City Scholarship Fund. Previously, Mr. Lynch served on the Special Olympics International Board of Directors (1997-2006). |
David A. Rosow (69) |
| Year of Election or Appointment: 2012 Member of the Advisory Board of Fidelity's Equity and High Income Funds. Chairman and Chief Executive Officer of International Golf Group, Inc. (golf course development, 1990-present). Previously, Mr. Rosow served as Chairman and Chief Executive Officer of Rosow & Company, Inc. (private investment company, 1989-2011), a Lead Director of Hudson United Bancorp (2001-2006) and as a Director of TD Banknorth (1996-2006). In addition, Mr. Rosow is a member (2008-present) and President (2009-present) of the Town Council of Palm Beach, Florida. |
Garnett A. Smith (64) |
| Year of Election or Appointment: 2012 Member of the Advisory Board of Fidelity's Equity and High Income Funds. Prior to Mr. Smith's retirement, he served as Chairman and Chief Executive Officer of Inbrand Corp. (manufacturer of personal absorbent products, 1990-1997). He also served as President (1986-1990) of Inbrand Corp. Prior to his employment with Inbrand Corp., he was employed by a retail fabric chain and North Carolina National Bank. In addition, Mr. Smith is a board member of the Jackson Hole Land Trust (2009-present). |
Kenneth B. Robins (42) |
| Year of Election or Appointment: 2008 President and Treasurer of Fidelity's Equity and High Income Funds. Mr. Robins also serves as President and Treasurer (2010-present) and Assistant Treasurer (2009-present) of other Fidelity funds and is an employee of Fidelity Investments (2004-present). Previously, Mr. Robins served as Deputy Treasurer of the Fidelity funds (2005-2008) and Treasurer and Chief Financial Officer of The North Carolina Capital Management Trust: Cash and Term Portfolios (2006-2008). |
Brian B. Hogan (47) |
| Year of Election or Appointment: 2009 Vice President of Equity and High Income Funds. Mr. Hogan also serves as President of FMR's Equity Division (2009-present). Previously, Mr. Hogan served as Senior Vice President, Equity Research of FMR (2006-2009) and as a portfolio manager. |
Christopher S. Bartel (40) |
| Year of Election or Appointment: 2009 Vice President of Fidelity's Sector and Real Estate Equity Funds. Mr. Bartel also serves as a Director, President, and Chief Executive Officer of Fidelity Management & Research (Japan) Inc. (2012-present), a Director of Fidelity Management & Research (Hong Kong) (2012-present), and Senior Vice President of Global Equity Research (2010-present). Previously, Mr. Bartel served as Senior Vice President of Equity Research (2009-2010), Managing Director of Research (2006-2009), and an analyst and portfolio manager (2000-2006). |
Scott C. Goebel (44) |
| Year of Election or Appointment: 2008 Secretary and Chief Legal Officer (CLO) of the Fidelity funds. Mr. Goebel also serves as Secretary of Fidelity Investments Money Management, Inc. (FIMM) (2010-present) and Fidelity Research and Analysis Company (FRAC) (2010-present); Secretary and CLO of The North Carolina Capital Management Trust: Cash and Term Portfolios (2008-present); General Counsel, Secretary, and Senior Vice President of FMR (2008-present) and FMR Co., Inc. (2008-present); employed by FMR LLC or an affiliate (2001-present); Chief Legal Officer of Fidelity Management & Research (Hong Kong) Limited (2008-present) and Assistant Secretary of Fidelity Management & Research (Japan) Inc. (2008-present), and Fidelity Management & Research (U.K.) Inc. (2008-present). Previously, Mr. Goebel served as Assistant Secretary of FIMM (2008-2010), FRAC (2008-2010), and the Funds (2007-2008) and as Vice President and Secretary of Fidelity Distributors Corporation (FDC) (2005-2007). |
William C. Coffey (43) |
| Year of Election or Appointment: 2009 Assistant Secretary of Fidelity's Equity and High Income Funds. Mr. Coffey also serves as Senior Vice President and Deputy General Counsel of FMR LLC (2010-present), and is an employee of Fidelity Investments. Previously, Mr. Coffey served as Vice President and Associate General Counsel of FMR LLC (2005-2009). |
Elizabeth Paige Baumann (44) |
| Year of Election or Appointment: 2012 Anti-Money Laundering (AML) Officer of the Fidelity funds. Ms. Baumann also serves as AML Officer of The North Carolina Capital Management Trust: Cash and Term Portfolios (2012-present), Chief AML Officer of FMR LLC (2012-present), and is an employee of Fidelity Investments. Previously, Ms. Baumann served as Vice President and Deputy Anti-Money Laundering Officer (2007-2012). |
Christine Reynolds (53) |
| Year of Election or Appointment: 2008 Chief Financial Officer of the Fidelity funds. Ms. Reynolds became President of Fidelity Pricing and Cash Management Services (FPCMS) in August 2008. Ms. Reynolds served as Chief Operating Officer of FPCMS (2007-2008). Previously, Ms. Reynolds served as President, Treasurer, and Anti-Money Laundering officer of the Fidelity funds (2004-2007). |
Joseph A. Hanlon (44) |
| Year of Election or Appointment: 2012 Chief Compliance Officer of Fidelity's Equity and High Income Funds. Mr. Hanlon serves as Compliance Officer of FMR, FMR Co., Inc., Fidelity Investments Money Management, Inc. (FIMM), Fidelity Research and Analysis Company (FRAC), Fidelity Management & Research (Japan) Inc., Fidelity Management & Research (U.K.) Inc., Fidelity Management & Research (Hong Kong), and Strategic Advisers, Inc. (2009-present), as Senior Vice President of the Fidelity Asset Management Division (2009-present), and is an employee of Fidelity Investments. |
Joseph F. Zambello (55) |
| Year of Election or Appointment: 2011 Deputy Treasurer of the Fidelity funds. Mr. Zambello is an employee of Fidelity Investments. Previously, Mr. Zambello served as Vice President of FMR's Program Management Group (2009-2011) and Vice President of the Transfer Agent Oversight Group (2005-2009). |
Adrien E. Deberghes (44) |
| Year of Election or Appointment: 2008 Deputy Treasurer of Fidelity's Equity and High Income Funds. Mr. Deberghes also serves as Vice President (2011-present) and Assistant Treasurer (2010-present) of other Fidelity funds, and is an employee of Fidelity Investments (2008-present). Previously, Mr. Deberghes served as Senior Vice President of Mutual Fund Administration at State Street Corporation (2007-2008), Senior Director of Mutual Fund Administration at Investors Bank & Trust (2005-2007), and Director of Finance for Dunkin' Brands (2000-2005). |
Stephanie J. Dorsey (43) |
| Year of Election or Appointment: 2010 Assistant Treasurer of Fidelity's Equity and High Income Funds. Ms. Dorsey also serves as Deputy Treasurer of other Fidelity funds (2008-present) and is an employee of Fidelity Investments (2008-present). Previously, Ms. Dorsey served as Treasurer (2004-2008) of the JPMorgan Mutual Funds and Vice President (2004-2008) of JPMorgan Chase Bank. |
John R. Hebble (54) |
| Year of Election or Appointment: 2009 Assistant Treasurer of Fidelity's Equity and High Income Funds. Mr. Hebble also serves as President (2011-present), Treasurer, and Chief Financial Officer of The North Carolina Capital Management Trust: Cash and Term Portfolios (2008-present), President and Treasurer of other Fidelity funds (2008-present) and is an employee of Fidelity Investments. |
Gary W. Ryan (53) |
| Year of Election or Appointment: 2005 Assistant Treasurer of the Fidelity funds. Mr. Ryan is an employee of Fidelity Investments. Previously, Mr. Ryan served as Vice President of Fund Reporting in Fidelity Pricing and Cash Management Services (FPCMS) (1999-2005). |
Jonathan Davis (44) |
| Year of Election or Appointment: 2010 Assistant Treasurer of the Fidelity funds. Mr. Davis is also Assistant Treasurer of Fidelity Rutland Square Trust II and Fidelity Commonwealth Trust II. Mr. Davis is an employee of Fidelity Investments. Previously, Mr. Davis served as Vice President and Associate General Counsel of FMR LLC (2003-2010). |
Annual Report
The Board of Trustees of Fidelity Advisor International Real Estate Fund voted to pay to shareholders of record at the opening of business on record date, the following distributions per share derived from capital gains realized from sales of portfolio securities, and dividends derived from net investment income:
| Pay Date | Record Date | Dividends | Capital Gains |
Class A | 09/10/12 | 09/07/12 | $0.115 | $0.113 |
| | | | |
Class T | 09/10/12 | 09/07/12 | $0.108 | $0.113 |
| | | | |
Class B | 09/10/12 | 09/07/12 | $0.078 | $0.113 |
| | | | |
Class C | 09/10/12 | 09/07/12 | $0.089 | $0.113 |
| | | | |
Class A designates 19% and 37%; Class T designates 20% and 40%; Class B designates 23% and 78%; and Class C designates 23% and 75%; of the dividends distributed in September and December respectively during the fiscal year as amounts which may be taken into account as a dividend for purposes of the maximum rate under section 1(h)(11) of the Internal Revenue Code.
The amounts per share which represent income derived from sources within, and taxes paid to, foreign countries or possessions of the United States are as follows:
| Pay Date | Income | Taxes |
Class A | 09/09/11 | $.305 | $.0089 |
| 12/16/11 | $.049 | $.0030 |
Class T | 09/09/11 | $.290 | $.0089 |
| 12/16/11 | $.040 | $.0030 |
Class B | 09/09/11 | $.257 | $.0089 |
| 12/16/11 | $.023 | $.0030 |
Class C | 09/09/11 | $.260 | $.0089 |
| 12/16/11 | $.024 | $.0030 |
The fund will notify shareholders in January 2013 of amounts for use in preparing 2012 income tax returns.
Annual Report
Board Approval of Investment Advisory Contracts and Management Fees
Fidelity International Real Estate Fund
Each year, the Board of Trustees, including the Independent Trustees (together, the Board), votes on the renewal of the management contract and sub-advisory agreements (together, the Advisory Contracts) for the fund. The Board, assisted by the advice of fund counsel and Independent Trustees' counsel, requests and considers a broad range of information relevant to the renewal of the Advisory Contracts throughout the year.
The Board meets regularly and, at each of its meetings, considers factors that are relevant to its annual consideration of the renewal of the fund's Advisory Contracts, including the services and support provided to the fund and its shareholders. The Board has established various standing committees, each composed of and chaired by Independent Trustees with varying backgrounds, to which the Board has assigned specific subject matter responsibilities in order to enhance effective decision-making by the Board. The Board, acting directly and through its Committees, requests and receives information concerning the annual consideration of the renewal of the fund's Advisory Contracts. The Board also meets as needed to consider matters specifically related to the Board's annual consideration of the renewal of Advisory Contracts. Members of the Board may also meet with trustees of other Fidelity funds through ad hoc joint committees to discuss certain matters relevant to the Fidelity funds.
At its July 2012 meeting, the Board of Trustees, including the Independent Trustees, unanimously determined to renew the fund's Advisory Contracts. In reaching its determination, the Board considered all factors it believed relevant, including (i) the nature, extent, and quality of the services to be provided to the fund and its shareholders (including the investment performance of the fund); (ii) the competitiveness of the fund's management fee and total expense ratio relative to peer funds; (iii) the total costs of the services to be provided by and the profits to be realized by Fidelity from its relationship with the fund; (iv) the extent to which economies of scale exist and would be realized as the fund grows; and (v) whether fee levels reflect these economies of scale, if any, for the benefit of fund shareholders.
In considering whether to renew the Advisory Contracts for the fund, the Board reached a determination, with the assistance of fund counsel and Independent Trustees' counsel and through the exercise of its business judgment, that the renewal of the Advisory Contracts is in the best interests of the fund and its shareholders and that the compensation payable under the Advisory Contracts is fair and reasonable. The Board's decision to renew the Advisory Contracts was not based on any single factor, but rather was based on a comprehensive consideration of all the information provided to the Board at its meetings throughout the year. The Board, in reaching its determination to renew the Advisory Contracts, is aware that shareholders in the fund have a broad range of investment choices available to them, including a wide choice among mutual funds offered by Fidelity's competitors, and that the fund's shareholders, who have the opportunity to review and weigh the disclosure provided by the fund in its prospectus and other public disclosures, have chosen to invest in this fund, managed by Fidelity.
Annual Report
Board Approval of Investment Advisory Contracts and
Management Fees - continued
Nature, Extent, and Quality of Services Provided. The Board considered the staffing within the investment adviser, FMR, and the sub-advisers (together, the Investment Advisers), including the backgrounds of the fund's investment personnel, and also considered the fund's investment objective, strategies, and related investment philosophy. The Independent Trustees also had discussions with senior management of Fidelity's investment operations and investment groups. The Board considered the structure of the portfolio manager compensation program and whether this structure provides appropriate incentives to act in the best interests of the fund.
Resources Dedicated to Investment Management and Support Services. The Board and the Fund Oversight and Research Committees reviewed the general qualifications and capabilities of the Investment Advisers' investment staff, including its size, education, experience, and resources, as well as the Investment Advisers' approach to recruiting, training, managing, and compensating investment personnel. The Board also noted that FMR has continued to increase the resources devoted to non-U.S. offices, including expansion of Fidelity's global investment organization. The Board noted that Fidelity's analysts have extensive resources, tools and capabilities that allow them to conduct sophisticated quantitative and fundamental analysis, as well as credit analysis of issuers, counterparties and guarantors. The Board also believes that Fidelity's investment professionals have sufficient access to global information and data so as to provide competitive investment results over time, and that those professionals also have access to sophisticated tools that permit them to assess portfolio construction and risk and performance attribution characteristics continuously, as well as to transmit new information and research conclusions rapidly around the world. Additionally, in its deliberations, the Board considered the Investment Advisers' trading and risk management capabilities and resources, which are an integral part of the investment management process.
Shareholder and Administrative Services. The Board considered (i) the nature, extent, quality, and cost of advisory, administrative, and shareholder services performed by the Investment Advisers and their affiliates under the Advisory Contracts and under separate agreements covering transfer agency, pricing and bookkeeping, and securities lending services for the fund; (ii) the nature and extent of the supervision of third party service providers, principally custodians and subcustodians; and (iii) the resources devoted to, and the record of compliance with, the fund's compliance policies and procedures. The Board also reviewed the allocation of fund brokerage, including allocations to brokers affiliated with the Investment Advisers, the use of brokerage commissions to pay fund expenses, and the use of "soft" commission dollars to pay for research services.
Annual Report
The Board noted that the growth of fund assets over time across the complex allows Fidelity to reinvest in the development of services designed to enhance the value or convenience of the Fidelity funds as investment vehicles. These services include 24-hour access to account information and market information through telephone representatives and over the Internet, investor education materials and asset allocation tools, and the expanded availability of Fidelity Investor Centers.
Investment in a Large Fund Family. The Board considered the benefits to shareholders of investing in a Fidelity fund, including the benefits of investing in a fund that is part of a large family of funds offering a variety of investment disciplines and providing a large variety of mutual fund investor services. The Board noted that Fidelity had taken, or had made recommendations that resulted in the Fidelity funds taking, a number of actions over the previous year that benefited particular funds, including (i) continuing to dedicate additional resources to investment research and support of the senior management team that oversees asset management; (ii) persisting in efforts to enhance Fidelity's research capabilities, in particular, international research; (iii) launching new funds and making other enhancements to meet client needs for global and income-oriented solutions; (iv) continuing to launch dedicated lower cost underlying funds to meet investment management's portfolio construction needs related to expanding underlying fund options, specifically for the Freedom Fund product lines; (v) adopting a "Stock Selector" sector neutral investment approach and employing a team of portfolio managers who are sector specialists to manage certain funds; (vi) rationalizing product lines and gaining increased efficiencies through the mergers of several funds into other funds; (vii) strengthening the Spartan Index Fund product line by adding new funds and/or new low-cost institutional share classes, restructuring fund expenses to accommodate new classes, and reducing investment minimums for certain classes of shares; (viii) modifying the eligibility criteria for Institutional Class shares to increase their appeal to government entities and charitable investors; and (ix) reducing certain transfer agent fee rates.
Investment Performance. The Board considered whether the fund has operated in accordance with its investment objective, as well as its record of compliance with its investment restrictions. It also reviewed the fund's absolute investment performance for each class, as well as the fund's relative investment performance for each class measured over multiple periods against a broad-based securities market index. The Board noted that FMR believes that no meaningful peer group exists for the fund principally because most other funds in the fund's third-party peer group focus on different industries or sectors than the fund. The following charts considered by the Board show, over the one-, three-, and five-year periods ended December 31, 2011, as available, the cumulative total returns of the retail class and Class B of the fund and the cumulative total returns of a broad-based securities market index ("benchmark"). The returns of the retail class and Class B show the performance of the highest performing class (based on five-year performance) and the lowest performing class (based on three-year performance), respectively.
Annual Report
Board Approval of Investment Advisory Contracts and
Management Fees - continued
Fidelity International Real Estate Fund

The Board noted that the investment performance of the fund was lower than its benchmark for all the periods shown. The Board considered that the variations in performance among the fund's classes reflect the variations in class expenses, which result in lower performance for higher expense classes. The Board discussed with FMR actions to improve the fund's below-benchmark performance. The Board noted that this fund had underperformed in the past and discussed with FMR its disappointment with the continued underperformance of the fund. The Board also reviewed the fund's performance since inception as well as performance in the current year. The Board will continue to closely monitor the performance of the fund in the coming year and discuss with FMR other appropriate actions to address the performance of the fund.
Based on its review, the Board concluded that the nature, extent, and quality of services provided to the fund under the Advisory Contracts should benefit the fund's shareholders.
Competitiveness of Management Fee and Total Expense Ratio. The Board considered the fund's management fee and total expense ratio compared to "mapped groups" of competitive funds and classes. Fidelity creates "mapped groups" by combining similar Lipper investment objective categories that have comparable management fee characteristics. Combining Lipper investment objective categories aids the Board's management fee and total expense ratio comparisons by broadening the competitive group used for comparison and by reducing the number of universes to which various Fidelity funds are compared.
Annual Report
Management Fee. The Board considered two proprietary management fee comparisons for the 12-month periods shown in the chart below. The group of Lipper funds used by the Board for management fee comparisons is referred to below as the "Total Mapped Group." The Total Mapped Group comparison focuses on a fund's standing relative to the total universe of comparable funds available to investors in terms of gross management fees before expense reimbursements or caps. "TMG %" represents the percentage of funds in the Total Mapped Group that had management fees that were lower than the fund's. For example, a TMG % of 31% means that 69% of the funds in the Total Mapped Group had higher management fees than the fund. The "Asset-Size Peer Group" (ASPG) comparison focuses on a fund's standing relative to non-Fidelity funds similar in size to the fund within the Total Mapped Group. The ASPG represents at least 15% of the funds in the Total Mapped Group with comparable asset size and management fee characteristics, subject to a minimum of 50 funds (or all funds in the Total Mapped Group if fewer than 50). Additional information, such as the ASPG quartile in which the fund's management fee ranked, is also included in the chart and considered by the Board.
Fidelity International Real Estate Fund
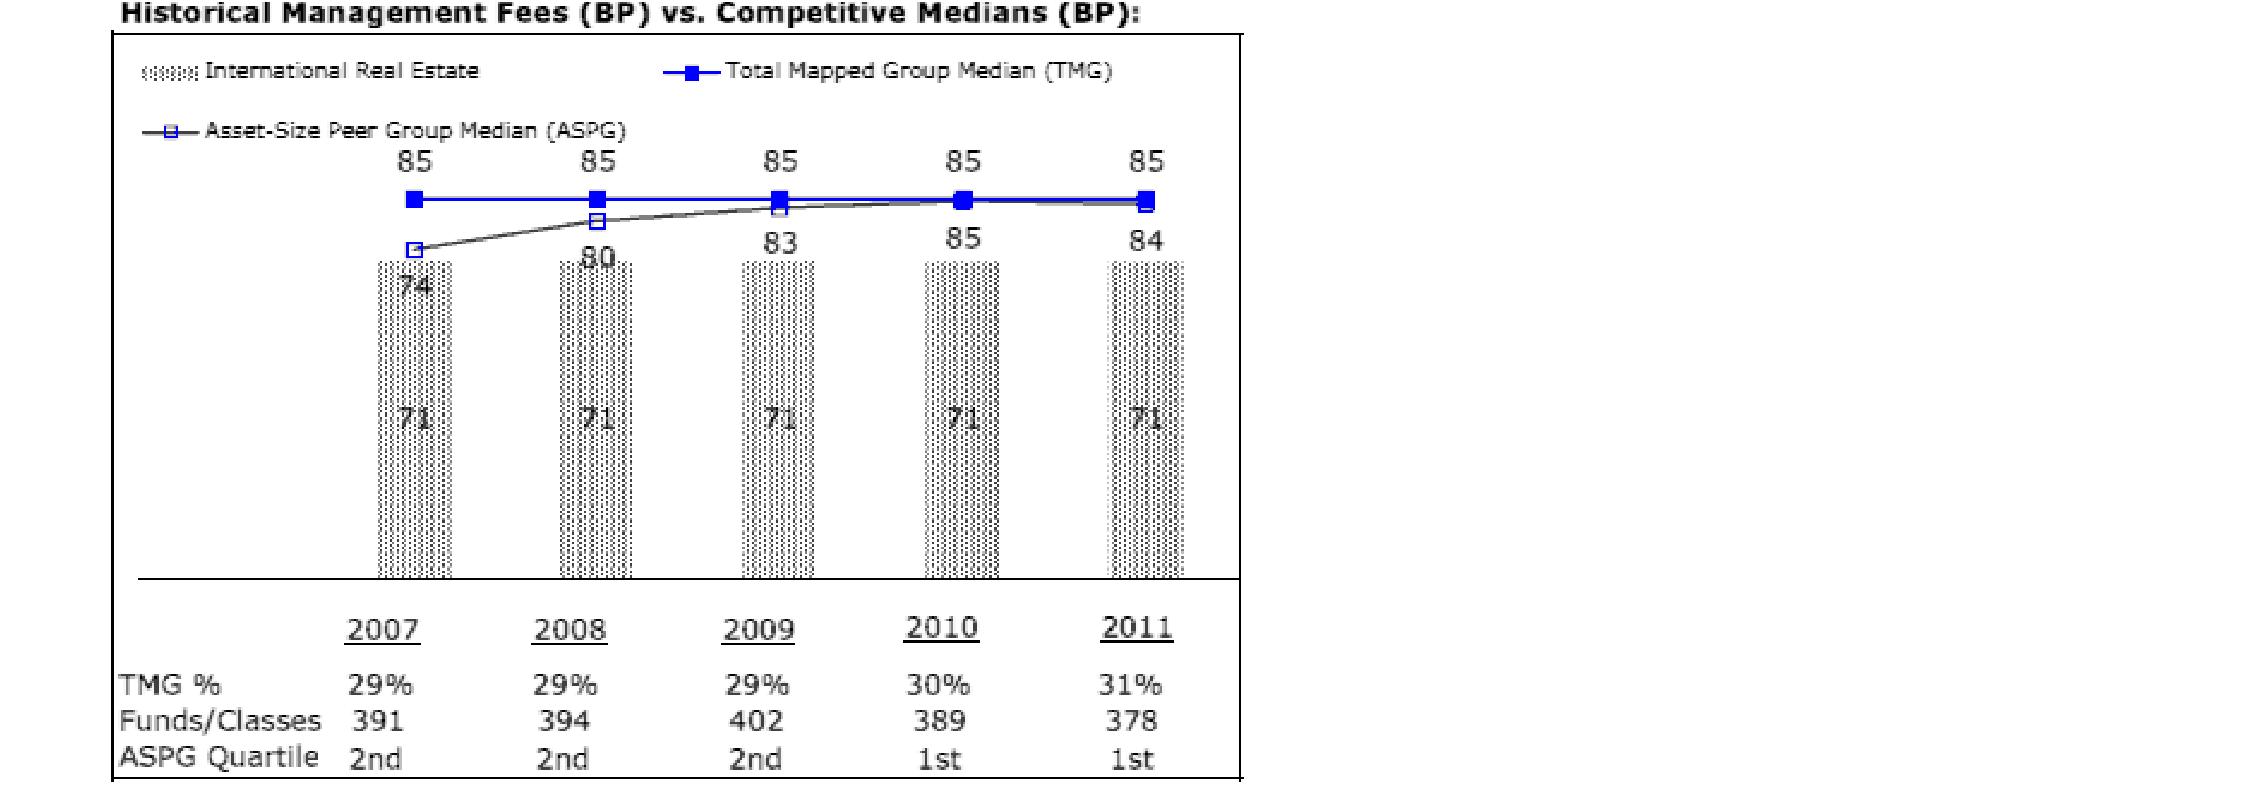
The Board noted that the fund's management fee ranked below the median of its Total Mapped Group and below the median of its ASPG for 2011.
Based on its review, the Board concluded that the fund's management fee is fair and reasonable in light of the services that the fund receives and the other factors considered.
Total Expense Ratio. In its review of each class's total expense ratio, the Board considered the fund's management fee as well as other fund or class expenses, as applicable, such as transfer agent fees, pricing and bookkeeping fees, fund-paid 12b-1 fees, and custodial, legal, and audit fees. The Board also noted the effects of any waivers and reimbursements on fees and expenses. As part of its review, the Board also considered the current and historical total expense ratios of each class of the fund compared to competitive fund median expenses. Each class of the fund is compared to those funds and classes in the Total Mapped Group (used by the Board for management fee comparisons) that have a similar sales load structure.
Annual Report
Board Approval of Investment Advisory Contracts and
Management Fees - continued
The Board noted that the total expense ratio of each of Class A and the retail class ranked below its competitive median for 2011 and the total expense ratio of each of Class T, Class B, Class C and Institutional Class ranked above its competitive median for 2011. The Board considered that various factors, including 12b-1 fees, positive or negative performance adjustments, and relatively higher other expenses in the case of small fund size, can affect total expense ratios. The Board noted that the total expense ratio of Class T was above the competitive median primarily because of higher 12b-1 fees on Class T. Class T has a higher 12b-1 fee, but a lower front-end sales charge, than traditionally priced front-end sales charge classes. The Board considered that Class T is primarily sold load-waived in the retirement plan market where its 0.50% 12b-1 fee is comparable to competing no-load, higher 12b-1 fee classes designed specifically for retirement plans. The Board noted that the fund offers multiple classes, each of which has a different sales load and 12b-1 fee structure, and that the multiple structures are intended to offer a range of pricing options for the intermediary market. The Board also noted that the total expense ratios of the classes vary primarily by the level of their 12b-1 fees, although differences in transfer agent fees may also cause expenses to vary from class to class.
Fees Charged to Other Fidelity Clients. The Board also considered Fidelity fee structures and other information with respect to clients of FMR and its affiliates, such as other mutual funds advised or subadvised by FMR or its affiliates, pension plan clients, and other institutional clients. The Board noted the findings of the 2010 ad hoc joint committee (created with the board of other Fidelity funds), which reviewed and compared Fidelity's institutional investment advisory business with its business of providing services to the Fidelity funds, including the differences in services provided, fees charged, and costs incurred, as well as competition in their respective marketplaces.
Based on its review of total expense ratios and fees charged to other Fidelity clients, the Board concluded that the total expense ratio of each class of the fund was reasonable, although in some cases above the median of the universe presented for comparison, in light of the services that the fund and its shareholders receive and the other factors considered.
Costs of the Services and Profitability. The Board considered the revenues earned and the expenses incurred by Fidelity in conducting the business of developing, marketing, distributing, managing, administering and servicing the fund and its shareholders. The Board also considered the level of Fidelity's profits in respect of all the Fidelity funds.
Annual Report
On an annual basis, FMR presents to the Board Fidelity's profitability for the fund. Fidelity calculates the profitability for each fund, as well as aggregate profitability for groups of Fidelity funds and all Fidelity funds, using a series of detailed revenue and cost allocation methodologies which originate with the books and records of Fidelity on which Fidelity's audited financial statements are based. The Audit Committee of the Board reviews any significant changes from the prior year's methodologies.
PricewaterhouseCoopers LLP (PwC), independent registered public accounting firm and auditor to Fidelity and certain Fidelity funds, has been engaged annually by the Board as part of the Board's assessment of Fidelity's profitability analysis. PwC's engagement includes the review and assessment of Fidelity's methodologies used in determining the revenues and expenses attributable to Fidelity's mutual fund business, and completion of agreed-upon procedures surrounding the mathematical accuracy of fund profitability and its conformity to allocation methodologies. After considering PwC's reports issued under the engagement and information provided by Fidelity, the Board concluded that while other allocation methods may also be reasonable, Fidelity's profitability methodologies are reasonable in all material respects.
The Board also reviewed Fidelity's non-fund businesses and fall-out benefits related to the mutual fund business as well as cases where Fidelity's affiliates may benefit from or be related to the fund's business.
The Board considered the costs of the services provided by and the profits realized by Fidelity in connection with the operation of the fund and was satisfied that the profitability was not excessive in the circumstances.
Economies of Scale. The Board considered whether there have been economies of scale in respect of the management of the Fidelity funds, whether the Fidelity funds (including the fund) have appropriately benefited from any such economies of scale, and whether there is potential for realization of any further economies of scale. The Board considered the extent to which the fund will benefit from economies of scale through increased services to the fund, through waivers or reimbursements, or through fee or expense reductions. The Board also noted that in 2009, it and the board of other Fidelity funds created an ad hoc committee (the Economies of Scale Committee) to analyze whether FMR attains economies of scale in respect of the management and servicing of the Fidelity funds, whether the Fidelity funds have appropriately benefited from such economies of scale, and whether there is potential for realization of any further economies of scale.
The Board recognized that the fund's management contract incorporates a "group fee" structure, which provides for lower group fee rates as total fund assets under FMR's management increase, and for higher group fee rates as total fund assets under FMR's management decrease. FMR calculates the group fee rates based on a tiered asset "breakpoint" schedule that varies based on asset class. The Board considered that the group fee is designed to deliver the benefits of economies of scale to fund shareholders when total Fidelity fund assets increase, even if assets of any particular fund are unchanged or have declined, because some portion of Fidelity's costs are attributable to services provided to all Fidelity funds, and all funds benefit if those costs can be allocated among more assets. The Board concluded that, given the group fee structure, fund shareholders will benefit from lower management fees as assets under FMR's management increase at the fund complex level, regardless of whether Fidelity achieves any such economies of scale.
Annual Report
Board Approval of Investment Advisory Contracts and
Management Fees - continued
The Board concluded, taking into account the analysis of the Economies of Scale Committee, that economies of scale, if any, are being appropriately shared between fund shareholders and Fidelity.
Additional Information Requested by the Board. In order to develop fully the factual basis for consideration of the Fidelity funds' Advisory Contracts, the Board requested and received additional information on certain topics, including (i) fund performance trends, actions to be taken by FMR to improve certain funds' overall performance, and Fidelity's long-term strategies for certain funds; (ii) the potential to further rationalize the Fidelity fund lineup with the possibility of achieving savings for the funds and Fidelity; (iii) Fidelity's compensation structure for portfolio managers and other key investment personnel; (iv) the amount of the investment that each portfolio manager has made in the Fidelity fund(s) that he or she manages; (v) the realization of fall-out benefits in certain Fidelity business units; (vi) Fidelity's group fee structures, the potential impact of regulatory changes on such structures, and the rationale for the individual fee rates of certain funds; (vii) fund profitability methodology, including Fidelity's cost allocation methodology, and the impact of certain factors on fund profitability results; (viii) trends regarding industry use of performance fee structures and the possibility of implementing performance fee structures for additional funds; and (ix) the impact of net redemptions from the Fidelity funds.
Based on its evaluation of all of the conclusions noted above, and after considering all factors it believed relevant, the Board ultimately concluded that the advisory fee structures are fair and reasonable, and that the fund's Advisory Contracts should be renewed.
Annual Report
Investment Adviser
Fidelity Management & Research Company
Boston, MA
Investment Sub-Advisers
FMR Co., Inc.
Fidelity Management & Research
(U.K.) Inc.
FIL Investments (Japan) Limited
FIL Investment Advisers
FIL Investment Advisers (UK) Ltd.
Fidelity Management & Research
(Hong Kong) Limited
Fidelity Management & Research
(Japan) Inc.
General Distributor
Fidelity Distributors Corporation
Smithfield, RI
Transfer and Service Agents
Fidelity Investments Institutional
Operations Company, Inc.
Boston, MA
Fidelity Service Company, Inc.
Boston, MA
Custodian
The Bank of New York Mellon
New York, NY
(Fidelity Investment logo)(registered trademark)
Corporate Headquarters
82 Devonshire St., Boston, MA 02109
www.fidelity.com
AIRE-UANN-0912
1.843178.105
(Fidelity Investment logo)(registered trademark)
Fidelity Advisor®
International Real Estate
Fund - Institutional Class
Annual Report
July 31, 2012
(Fidelity Cover Art)
Institutional Class is a
class of Fidelity®
International Real Estate Fund
Contents
Performance | 4 | How the fund has done over time. |
Management's Discussion of Fund Performance | 5 | The Portfolio Manager's review of fund performance and strategy. |
Shareholder Expense Example | 6 | An example of shareholder expenses. |
Investment Changes | 8 | A summary of major shifts in the fund's investments over the past six months. |
Investments | 9 | A complete list of the fund's investments with their market values. |
Financial Statements | 14 | Statements of assets and liabilities, operations, and changes in net assets,
as well as financial highlights. |
Notes | 24 | Notes to the financial statements. |
Report of Independent Registered Public Accounting Firm | 35 | |
Trustees and Officers | 36 | |
Distributions | 48 | |
Board Approval of Investment Advisory Contracts and Management Fees | 49 | |
To view a fund's proxy voting guidelines and proxy voting record for the 12-month period ended June 30, visit http://www.fidelity.com/proxyvotingresults or visit the Securities and Exchange Commission's (SEC) web site at http://www.sec.gov. You may also call 1-877-208-0098 to request a free copy of the proxy voting guidelines.
Standard & Poor's, S&P and S&P 500 are registered service marks of The McGraw-Hill Companies, Inc. and have been licensed for use by Fidelity Distributors Corporation.
Other third party marks appearing herein are the property of their respective owners.
All other marks appearing herein are registered or unregistered trademarks or service marks of FMR LLC or an affiliated company. © 2012 FMR LLC. All rights reserved.
Annual Report
This report and the financial statements contained herein are submitted for the general information of the shareholders of the fund. This report is not authorized for distribution to prospective investors in the fund unless preceded or accompanied by an effective prospectus.
A fund files its complete schedule of portfolio holdings with the SEC for the first and third quarters of each fiscal year on Form N-Q. Forms N-Q are available on the SEC's web site at http://www.sec.gov. A fund's Forms N-Q may be reviewed and copied at the SEC's Public Reference Room in Washington, DC. Information regarding the operation of the SEC's Public Reference Room may be obtained by calling 1-800-SEC-0330. For a complete list of a fund's portfolio holdings, view the most recent holdings listing, semiannual report, or annual report on Fidelity's web site at http://www.fidelity.com, http://www.advisor.fidelity.com, or http://www.401k.com, as applicable.
NOT FDIC INSURED • MAY LOSE VALUE • NO BANK GUARANTEE
Neither the fund nor Fidelity Distributors Corporation is a bank.
Annual Report
Performance: The Bottom Line
Average annual total return reflects the change in the value of an investment, assuming reinvestment of the class' distributions from dividend income and capital gains (the profits earned upon the sale of securities that have grown in value, if any) and assuming a constant rate of performance each year. The $10,000 table and the fund's returns do not reflect the deduction of taxes that a shareholder would pay on fund distributions or the redemption of fund shares. During periods of reimbursement by Fidelity, a fund's total return will be greater than it would be had the reimbursement not occurred. How a fund did yesterday is no guarantee of how it will do tomorrow.
Average Annual Total Returns
Periods ended July 31, 2012 | Past 1
year | Past 5
years | Life of
fund A |
Institutional Class B | -4.73% | -6.82% | 3.37% |
A From September 8, 2004.
B The initial offering of Institutional Class shares took place on April 4, 2007. Returns prior to April 4, 2007 are those of Fidelity® International Real Estate Fund, the original class of the fund.
$10,000 Over Life of Fund
Let's say hypothetically that $10,000 was invested in Fidelity Advisor® International Real Estate Fund - Institutional Class on September 8, 2004, when the fund started. The chart shows how the value of your investment would have changed, and also shows how the MSCI® EAFE® Index performed over the same period. The initial offering of Institutional Class took place on April 4, 2007. See above for additional information regarding the performance of Institutional Class.
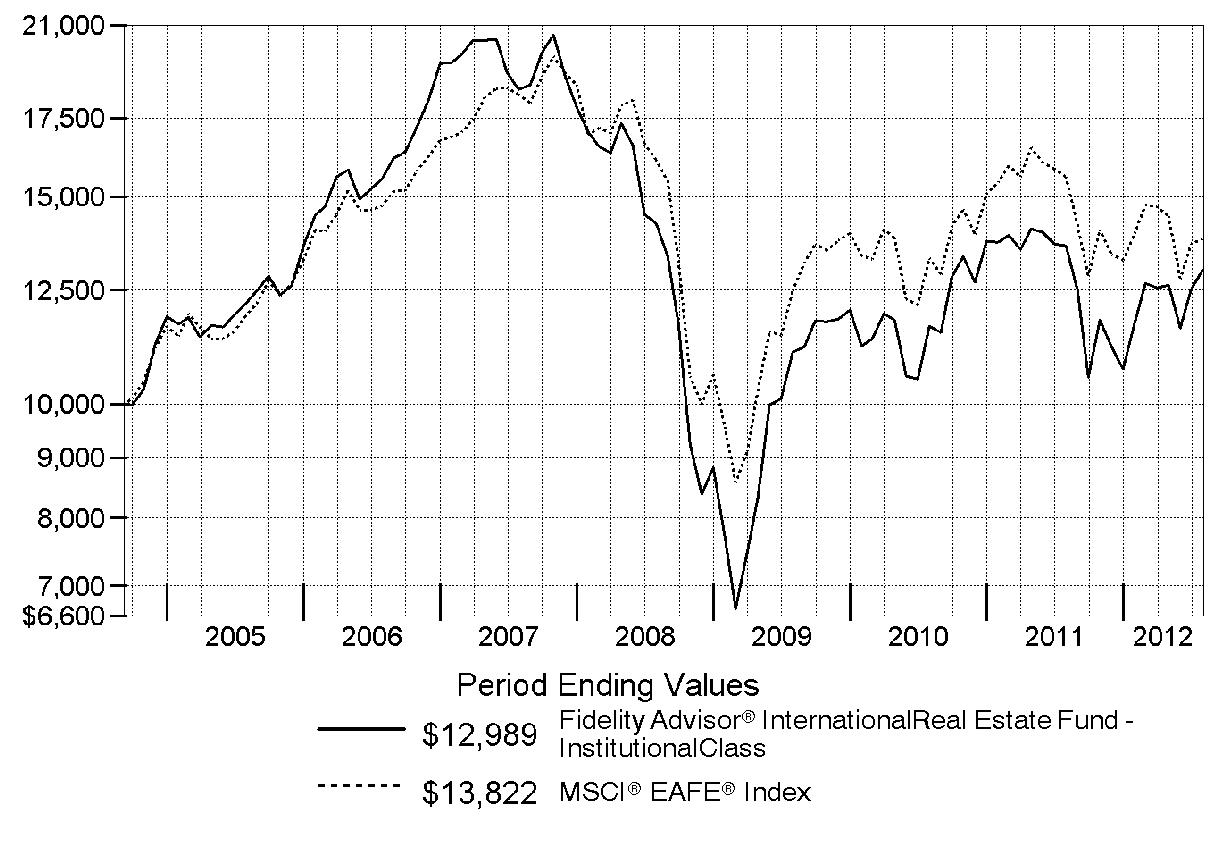
Annual Report
Management's Discussion of Fund Performance
Market Recap: The 12-month period ending July 31, 2012, was highly volatile for overseas property stocks, which lost ground as investors endured abrupt shifts between intervals of "risk on" and "risk off." A variety of factors drove the periodic changes in sentiment, especially the ongoing sovereign debt crisis in Europe. Concern about a slowdown in the Chinese economy and questions about the prospect of additional economic stimulus from the country's policymakers also influenced the market's behavior during the period. Given the limited supply of inflation-adjusted income-generating equity or fixed-income alternatives, larger-cap real estate investment trusts (REITs) toting relatively high yields and solid business fundamentals were among the biggest beneficiaries of new investment activity. Against this backdrop, overseas property stocks, as measured by the FTSE® EPRASM/NAREIT® Developed ex North America Index, returned -1.89%. Hampered in part by currency movements, this result significantly lagged the 12.88% gain of the U.S. REIT market, as reflected in the Dow Jones U.S. Select Real Estate Securities IndexSM. Meanwhile, the broad international equity market, as measured by the MSCI® EAFE® Index, returned -11.32%, while the S&P 500® Index, a popular measure of the performance of U.S. stocks, rose 9.13%.
Comments from Guillermo de las Casas, Portfolio Manager of Fidelity Advisor® International Real Estate Fund: For the year ending, the fund's Institutional Class shares returned -4.73%, lagging the FTSE® EPRASM/NAREIT® index but beating the MSCI® EAFE®. The fund's emphasis of attractively valued small- and mid-cap stocks hurt because these did not fare as well as certain large-cap, high-dividend-yielding investments, which I tended not to own. Also, the fund's growth-oriented stocks underperformed in Hong Kong, Singapore and Australia hurt, while below-benchmark exposure to Australia and an overweighting in poor-performing Italy also detracted. However, the fund benefited from limited exposure to the Netherlands and from favorable currency movements. In individual terms, avoiding Hong Kong-based Link Real Estate Investment Trust, an outperforming property company, hurt, as the fund was underweighted in this stock for nearly the entire period. This stock was not held at period end. Also detracting was Westfield Retail Trust, an outperforming index component that the fund didn't own, while an overweighting in Italy's Beni Stabili also detracted. On the positive side, an underweighting in Hong Kong-listed China Resources Land and an overweighting in Australian mall giant Westfield Group were significant positives.
The views expressed above reflect those of the portfolio manager(s) only through the end of the period as stated on the cover of this report and do not necessarily represent the views of Fidelity or any other person in the Fidelity organization. Any such views are subject to change at any time based upon market or other conditions and Fidelity disclaims any responsibility to update such views. These views may not be relied on as investment advice and, because investment decisions for a Fidelity fund are based on numerous factors, may not be relied on as an indication of trading intent on behalf of any Fidelity fund.
Annual Report
Shareholder Expense Example
As a shareholder of the Fund, you incur two types of costs: (1) transaction costs, including sales charges (loads) on purchase payments or redemption proceeds, redemption fees and (2) ongoing costs, including management fees, distribution and/or service (12b-1) fees and other Fund expenses. This Example is intended to help you understand your ongoing costs (in dollars) of investing in the Fund and to compare these costs with the ongoing costs of investing in other mutual funds.
The Example is based on an investment of $1,000 invested at the beginning of the period and held for the entire period (February 1, 2012 to July 31, 2012).
Actual Expenses
The first line of the accompanying table for each class of the Fund provides information about actual account values and actual expenses. You may use the information in this line, together with the amount you invested, to estimate the expenses that you paid over the period. Simply divide your account value by $1,000.00 (for example, an $8,600 account value divided by $1,000.00 = 8.6), then multiply the result by the number in the first line for a class of the Fund under the heading entitled "Expenses Paid During Period" to estimate the expenses you paid on your account during this period. A small balance maintenance fee of $12.00 that is charged once a year may apply for certain accounts with a value of less than $2,000. This fee is not included in the table below. If it was, the estimate of expenses you paid during the period would be higher, and your ending account value lower, by this amount. In addition, the Fund, as a shareholder in the underlying Fidelity Central Funds, will indirectly bear its pro-rata share of the fees and expenses incurred by the underlying Fidelity Central Funds. These fees and expenses are not included in the Fund's annualized expense ratio used to calculate the expense estimate in the table below.
Hypothetical Example for Comparison Purposes
The second line of the accompanying table for each class of the Fund provides information about hypothetical account values and hypothetical expenses based on a Class' actual expense ratio and an assumed rate of return of 5% per year before expenses, which is not the Class' actual return. The hypothetical account values and expenses may not be used to estimate the actual ending account balance or expenses you paid for the period. You may use this information to compare the ongoing costs of investing in the Fund and other funds. To do so, compare this 5% hypothetical example with the 5% hypothetical examples that appear in the shareholder reports of the other funds. A small balance maintenance fee of $12.00 that is charged once a year may apply for certain accounts with a value of less than $2,000. This fee is not included in the table below. If it was, the estimate of expenses you paid during the period would be higher, and your ending account value lower, by this amount. In addition, the Fund, as a shareholder in the underlying Fidelity Central Funds, will indirectly bear its pro-rata share of the fees and expenses incurred by the underlying Fidelity Central Funds. These fees and expenses are not included in the Fund's annualized expense ratio used to calculate the expense estimate in the table below.
Annual Report
Please note that the expenses shown in the table are meant to highlight your ongoing costs only and do not reflect any transaction costs. Therefore, the second line of the table is useful in comparing ongoing costs only, and will not help you determine the relative total costs of owning different funds. In addition, if these transactional costs were included, your costs would have been higher.
| Annualized Expense Ratio | Beginning
Account Value
February 1, 2012 | Ending
Account Value
July 31, 2012 | Expenses Paid
During Period*
February 1, 2012
to July 31, 2012 |
Class A | 1.44% | | | |
Actual | | $ 1,000.00 | $ 1,108.60 | $ 7.55 |
HypotheticalA | | $ 1,000.00 | $ 1,017.70 | $ 7.22 |
Class T | 1.70% | | | |
Actual | | $ 1,000.00 | $ 1,106.40 | $ 8.90 |
HypotheticalA | | $ 1,000.00 | $ 1,016.41 | $ 8.52 |
Class B | 2.19% | | | |
Actual | | $ 1,000.00 | $ 1,103.10 | $ 11.45 |
HypotheticalA | | $ 1,000.00 | $ 1,013.97 | $ 10.97 |
Class C | 2.19% | | | |
Actual | | $ 1,000.00 | $ 1,103.50 | $ 11.45 |
HypotheticalA | | $ 1,000.00 | $ 1,013.97 | $ 10.97 |
International Real Estate | 1.19% | | | |
Actual | | $ 1,000.00 | $ 1,109.10 | $ 6.24 |
HypotheticalA | | $ 1,000.00 | $ 1,018.95 | $ 5.97 |
Institutional Class | 1.19% | | | |
Actual | | $ 1,000.00 | $ 1,109.40 | $ 6.24 |
HypotheticalA | | $ 1,000.00 | $ 1,018.95 | $ 5.97 |
A 5% return per year before expenses
* Expenses are equal to each Class' annualized expense ratio, multiplied by the average account value over the period, multiplied by 182/366 (to reflect the one-half year period).
Annual Report
Investment Changes (Unaudited)
Top Ten Stocks as of July 31, 2012 |
| % of fund's
net assets | % of fund's net assets
6 months ago |
Westfield Group unit | 8.2 | 7.8 |
Mitsui Fudosan Co. Ltd. | 5.9 | 5.7 |
Sun Hung Kai Properties Ltd. | 5.7 | 8.3 |
Sumitomo Realty & Development Co. Ltd. | 4.7 | 4.4 |
Unibail-Rodamco | 4.1 | 3.9 |
Mirvac Group unit | 3.6 | 2.3 |
Global Logistic Properties Ltd. | 2.9 | 2.6 |
Kerry Properties Ltd. | 2.8 | 1.7 |
Nomura Real Estate Holdings, Inc. | 2.3 | 1.7 |
Big Yellow Group PLC | 2.2 | 2.5 |
| 42.4 | |
Top Five Countries as of July 31, 2012 |
(excluding cash equivalents) | % of fund's
net assets | % of fund's net assets
6 months ago |
Japan | 19.9 | 16.1 |
Australia | 16.5 | 16.0 |
United Kingdom | 12.9 | 12.8 |
Hong Kong | 11.6 | 15.0 |
Singapore | 10.0 | 7.5 |
Percentages are adjusted for the effect of open futures contracts, if applicable. |
Top Five REIT Sectors as of July 31, 2012 |
| % of fund's
net assets | % of fund's net assets
6 months ago |
REITs - Management/Investment | 24.2 | 25.7 |
REITs - Office Buildings | 5.5 | 6.9 |
REITs - Industrial Buildings | 4.6 | 3.1 |
REITs - Shopping Centers | 4.4 | 3.3 |
REITs - Health Care Facilities | 2.0 | 0.5 |
Asset Allocation (% of fund's net assets) |
As of July 31, 2012* | As of January 31, 2012** |
 | Stocks 95.5% | |  | Stocks 94.1% | |
 | Short-Term
Investments and
Net Other Assets (Liabilities) 4.5% | |  | Short-Term
Investments and
Net Other Assets (Liabilities) 5.9% | |
* Foreign investments | 95.5% | | ** Foreign investments | 94.1% | |

Annual Report
Investments July 31, 2012
Showing Percentage of Net Assets
Common Stocks - 95.5% |
| Shares | | Value |
Australia - 16.5% |
Abacus Property Group unit | 1,525,637 | | $ 3,182,535 |
ALE Property Group | 1,201,339 | | 2,638,598 |
Charter Hall Group unit | 1,090,003 | | 2,943,894 |
FKP Property Group unit (d) | 2,565,000 | | 1,010,834 |
Goodman Group unit | 660,608 | | 2,610,316 |
Mirvac Group unit | 6,636,138 | | 9,554,267 |
Westfield Group unit | 2,091,349 | | 21,977,989 |
TOTAL AUSTRALIA | | 43,918,433 |
Bailiwick of Jersey - 1.4% |
Atrium European Real Estate Ltd. | 838,372 | | 3,739,307 |
Belgium - 1.1% |
Warehouses de Pauw | 57,385 | | 2,894,867 |
Bermuda - 5.0% |
Csi Properties Ltd. | 32,517,682 | | 1,488,617 |
Great Eagle Holdings Ltd. | 1,247,088 | | 3,161,663 |
K Wah International Holdings Ltd. | 22,071 | | 8,083 |
Kerry Properties Ltd. | 1,601,000 | | 7,360,136 |
Soundwill Holdings Ltd. | 987,000 | | 1,458,602 |
TOTAL BERMUDA | | 13,477,101 |
Brazil - 0.8% |
Companhia Brasileira de Desenvolvimento Imobiliario Turistico SA (a) | 43,700 | | 413,926 |
Even Construtora e Incorporadora SA | 313,300 | | 1,001,423 |
Multiplan Empreendimentos Imobiliarios SA | 26,400 | | 667,601 |
TOTAL BRAZIL | | 2,082,950 |
Cayman Islands - 2.0% |
China Resources Land Ltd. | 350,000 | | 710,408 |
KWG Property Holding Ltd. | 2,022,000 | | 1,121,204 |
SOHO China Ltd. | 4,014,000 | | 2,986,676 |
SouFun Holdings Ltd. ADR (d) | 49,688 | | 589,300 |
TOTAL CAYMAN ISLANDS | | 5,407,588 |
Chile - 0.5% |
Parque Arauco SA | 657,471 | | 1,246,165 |
France - 6.3% |
Altarea | 10,800 | | 1,594,598 |
Societe de la Tour Eiffel | 25,127 | | 1,347,949 |
Common Stocks - continued |
| Shares | | Value |
France - continued |
Societe Fonciere Lyonnaise SA | 70,586 | | $ 2,809,566 |
Unibail-Rodamco | 56,857 | | 10,941,252 |
TOTAL FRANCE | | 16,693,365 |
Germany - 2.3% |
alstria office REIT-AG | 162,500 | | 1,808,857 |
Deutsche EuroShop AG | 49,075 | | 1,804,512 |
GSW Immobilien AG | 32,669 | | 1,203,868 |
IVG Immobilien AG (a) | 45,000 | | 104,590 |
Patrizia Immobilien AG (a) | 211,916 | | 1,299,796 |
TOTAL GERMANY | | 6,221,623 |
Hong Kong - 11.6% |
Hang Lung Properties Ltd. | 1,196,500 | | 4,258,501 |
Henderson Land Development Co. Ltd. | 984,000 | | 5,735,464 |
Hysan Development Co. Ltd. | 828,500 | | 3,504,301 |
Magnificent Estates Ltd. | 27,344,000 | | 1,022,575 |
Sun Hung Kai Properties Ltd. | 1,219,226 | | 15,242,880 |
Wheelock and Co. Ltd. | 313,000 | | 1,229,042 |
TOTAL HONG KONG | | 30,992,763 |
India - 0.5% |
Phoenix Mills Ltd. | 424,550 | | 1,405,997 |
Italy - 1.1% |
Beni Stabili SpA SIIQ | 5,246,133 | | 2,400,556 |
Immobiliare Grande Distribuzione SpA | 434,050 | | 411,222 |
TOTAL ITALY | | 2,811,778 |
Japan - 19.9% |
BLife Investment Corp. | 517 | | 3,612,670 |
Goldcrest Co. Ltd. | 199,340 | | 3,068,862 |
Japan Retail Fund Investment Corp. | 3,185 | | 5,326,889 |
Kenedix, Inc. (a)(d) | 11,063 | | 1,452,499 |
Mitsui Fudosan Co. Ltd. | 817,000 | | 15,741,416 |
Nomura Real Estate Holdings, Inc. | 332,700 | | 6,144,085 |
Sumitomo Realty & Development Co. Ltd. | 509,000 | | 12,665,728 |
United Urban Investment Corp. | 4,600 | | 4,990,855 |
TOTAL JAPAN | | 53,003,004 |
Mexico - 0.6% |
Corporacion Inmobiliaria Vesta SAB de CV | 1,039,303 | | 1,484,886 |
Common Stocks - continued |
| Shares | | Value |
Russia - 0.3% |
LSR Group OJSC GDR (Reg. S) | 192,400 | | $ 860,028 |
Singapore - 10.0% |
Global Logistic Properties Ltd. | 4,304,000 | | 7,782,064 |
Mapletree Industrial (REIT) | 3,355,000 | | 3,504,902 |
Parkway Life REIT | 3,409,000 | | 5,369,367 |
UOL Group Ltd. | 1,355,000 | | 5,640,389 |
Wing Tai Holdings Ltd. | 3,962,181 | | 4,489,453 |
TOTAL SINGAPORE | | 26,786,175 |
Sweden - 2.7% |
Castellum AB | 198,400 | | 2,665,016 |
Hufvudstaden AB Series A | 200,000 | | 2,435,061 |
Wihlborgs Fastigheter AB | 139,900 | | 2,031,442 |
TOTAL SWEDEN | | 7,131,519 |
United Kingdom - 12.9% |
Big Yellow Group PLC | 1,196,400 | | 5,852,420 |
British Land Co. PLC | 547,589 | | 4,588,882 |
Derwent London PLC | 149,600 | | 4,571,386 |
Hammerson PLC | 795,029 | | 5,772,478 |
Helical Bar PLC | 1,758,827 | | 5,432,426 |
Metric Property Investments PLC | 1,447,700 | | 1,929,310 |
Quintain Estates & Development PLC (a) | 1,937,100 | | 1,510,948 |
Safestore Holdings PLC | 1,315,000 | | 2,082,340 |
St. Modwen Properties PLC | 1,011,300 | | 2,806,453 |
TOTAL UNITED KINGDOM | | 34,546,643 |
TOTAL COMMON STOCKS (Cost $281,982,482) |
254,704,192
|
Money Market Funds - 4.6% |
| Shares | | Value |
Fidelity Cash Central Fund, 0.17% (b) | 11,441,650 | | $ 11,441,650 |
Fidelity Securities Lending Cash Central Fund, 0.18% (b)(c) | 870,644 | | 870,644 |
TOTAL MONEY MARKET FUNDS (Cost $12,312,294) |
12,312,294
|
TOTAL INVESTMENT PORTFOLIO - 100.1% (Cost $294,294,776) | | 267,016,486 |
NET OTHER ASSETS (LIABILITIES) - (0.1)% | | (218,547) |
NET ASSETS - 100% | $ 266,797,939 |
Legend |
(a) Non-income producing |
(b) Affiliated fund that is available only to investment companies and other accounts managed by Fidelity Investments. The rate quoted is the annualized seven-day yield of the fund at period end. A complete unaudited listing of the fund's holdings as of its most recent quarter end is available upon request. In addition, each Fidelity Central Fund's financial statements, which are not covered by the Fund's Report of Independent Registered Public Accounting Firm, are available on the SEC's website or upon request. |
(c) Investment made with cash collateral received from securities on loan. |
(d) Security or a portion of the security is on loan at period end. |
Affiliated Central Funds |
Information regarding fiscal year to date income earned by the Fund from investments in Fidelity Central Funds is as follows: |
Fund | Income earned |
Fidelity Cash Central Fund | $ 17,037 |
Fidelity Securities Lending Cash Central Fund | 77,977 |
Total | $ 95,014 |
Other Information |
Categorizations in the Schedule of Investments are based on country or territory of incorporation. |
The following is a summary of the inputs used, as of July 31, 2012, involving the Fund's assets and liabilities carried at fair value. The inputs or methodology used for valuing securities may not be an indication of the risk associated with investing in those securities. For more information on valuation inputs, and their aggregation into the levels used in the tables below, please refer to the Security Valuation section in the accompanying Notes to Financial Statements. |
Valuation Inputs at Reporting Date: |
Description | Total | Level 1 | Level 2 | Level 3 |
Investments in Securities: | | | | |
Equities: | | | | |
Consumer Discretionary | $ 2,023,998 | $ 2,023,998 | $ - | $ - |
Financials | 252,090,894 | 199,087,890 | 53,003,004 | - |
Information Technology | 589,300 | 589,300 | - | - |
Money Market Funds | 12,312,294 | 12,312,294 | - | - |
Total Investments in Securities: | $ 267,016,486 | $ 214,013,482 | $ 53,003,004 | $ - |
The following is a summary of transfers between Level 1 and Level 2 for the period ended July 31, 2012. Transfers are assumed to have occurred at the beginning of the period, and are primarily attributable to the valuation techniques used for foreign equity securities, as discussed in the accompanying Notes to Financial Statements: |
Transfers | Total |
Level 1 to Level 2 | $ 51,041,465 |
Level 2 to Level 1 | $ - |
See accompanying notes which are an integral part of the financial statements.
Annual Report
Financial Statements
Statement of Assets and Liabilities
| July 31, 2012 |
| | |
Assets | | |
Investment in securities, at value (including securities loaned of $814,031) - See accompanying schedule: Unaffiliated issuers (cost $281,982,482) | $ 254,704,192 | |
Fidelity Central Funds (cost $12,312,294) | 12,312,294 | |
Total Investments (cost $294,294,776) | | $ 267,016,486 |
Foreign currency held at value (cost $413,341) | | 413,469 |
Receivable for investments sold | | 644,637 |
Receivable for fund shares sold | | 343,465 |
Dividends receivable | | 569,418 |
Distributions receivable from Fidelity Central Funds | | 3,238 |
Other receivables | | 92,780 |
Total assets | | 269,083,493 |
| | |
Liabilities | | |
Payable for investments purchased | $ 757,448 | |
Payable for fund shares redeemed | 252,652 | |
Accrued management fee | 153,109 | |
Distribution and service plan fees payable | 5,321 | |
Other affiliated payables | 72,468 | |
Other payables and accrued expenses | 173,912 | |
Collateral on securities loaned, at value | 870,644 | |
Total liabilities | | 2,285,554 |
| | |
Net Assets | | $ 266,797,939 |
Net Assets consist of: | | |
Paid in capital | | $ 611,378,296 |
Undistributed net investment income | | 4,308,924 |
Accumulated undistributed net realized gain (loss) on investments and foreign currency transactions | | (321,581,509) |
Net unrealized appreciation (depreciation) on investments and assets and liabilities in foreign currencies | | (27,307,772) |
Net Assets | | $ 266,797,939 |
See accompanying notes which are an integral part of the financial statements.
Annual Report
Financial Statements - continued
Statement of Assets and Liabilities - continued
| July 31, 2012 |
| | |
Calculation of Maximum Offering Price Class A:
Net Asset Value and redemption price per share ($7,116,550 ÷ 850,744 shares) | | $ 8.37 |
| | |
Maximum offering price per share (100/94.25 of $8.37) | | $ 8.88 |
Class T:
Net Asset Value and redemption price per share ($2,570,309 ÷ 309,041 shares) | | $ 8.32 |
| | |
Maximum offering price per share (100/96.50 of $8.32) | | $ 8.62 |
Class B:
Net Asset Value and offering price per share ($457,408 ÷ 55,542 shares)A | | $ 8.24 |
| | |
Class C:
Net Asset Value and offering price per share ($3,164,071 ÷ 385,508 shares)A | | $ 8.21 |
| | |
| | |
International Real Estate:
Net Asset Value, offering price and redemption price per share ($251,542,978 ÷ 29,803,415 shares) | | $ 8.44 |
| | |
Institutional Class:
Net Asset Value, offering price and redemption price per share ($1,946,623 ÷ 231,246 shares) | | $ 8.42 |
A Redemption price per share is equal to net asset value less any applicable contingent deferred sales charge.
See accompanying notes which are an integral part of the financial statements.
Annual Report
Statement of Operations
| Year ended July 31, 2012 |
| | |
Investment Income | | |
Dividends | | $ 9,616,226 |
Interest | | 122 |
Income from Fidelity Central Funds | | 95,014 |
Income before foreign taxes withheld | | 9,711,362 |
Less foreign taxes withheld | | (550,765) |
Total income | | 9,160,597 |
| | |
Expenses | | |
Management fee | $ 1,872,547 | |
Transfer agent fees | 790,564 | |
Distribution and service plan fees | 57,410 | |
Accounting and security lending fees | 137,396 | |
Custodian fees and expenses | 184,232 | |
Independent trustees' compensation | 1,771 | |
Registration fees | 80,907 | |
Audit | 77,170 | |
Legal | 1,045 | |
Miscellaneous | 4,049 | |
Total expenses before reductions | 3,207,091 | |
Expense reductions | (182,590) | 3,024,501 |
Net investment income (loss) | | 6,136,096 |
Realized and Unrealized Gain (Loss) Net realized gain (loss) on: | | |
Investment securities: | | |
Unaffiliated issuers | (26,508,546) | |
Foreign currency transactions | (257,489) | |
Total net realized gain (loss) | | (26,766,035) |
Change in net unrealized appreciation (depreciation) on: Investment securities | (20,196) | |
Assets and liabilities in foreign currencies | (18,559) | |
Total change in net unrealized appreciation (depreciation) | | (38,755) |
Net gain (loss) | | (26,804,790) |
Net increase (decrease) in net assets resulting from operations | | $ (20,668,694) |
See accompanying notes which are an integral part of the financial statements.
Annual Report
Financial Statements - continued
Statement of Changes in Net Assets
| Year ended
July 31,
2012 | Year ended
July 31,
2011 |
Increase (Decrease) in Net Assets | | |
Operations | | |
Net investment income (loss) | $ 6,136,096 | $ 14,085,086 |
Net realized gain (loss) | (26,766,035) | 37,430,925 |
Change in net unrealized appreciation (depreciation) | (38,755) | 3,876,295 |
Net increase (decrease) in net assets resulting
from operations | (20,668,694) | 55,392,306 |
Distributions to shareholders from net investment income | (6,740,519) | (13,892,744) |
Distributions to shareholders from net realized gain | (6,329,734) | (11,440,782) |
Total distributions | (13,070,253) | (25,333,526) |
Share transactions - net increase (decrease) | (36,696,766) | (26,030,265) |
Redemption fees | 82,484 | 74,922 |
Total increase (decrease) in net assets | (70,353,229) | 4,103,437 |
| | |
Net Assets | | |
Beginning of period | 337,151,168 | 333,047,731 |
End of period (including undistributed net investment income of $4,308,924 and undistributed net investment income of $4,912,084, respectively) | $ 266,797,939 | $ 337,151,168 |
See accompanying notes which are an integral part of the financial statements.
Annual Report
Financial Highlights - Class A
Years ended July 31, | 2012 | 2011 | 2010 | 2009 | 2008 |
Selected Per-Share Data | | | | | |
Net asset value, beginning of period | $ 9.21 | $ 8.46 | $ 8.24 | $ 10.63 | $ 15.71 |
Income from Investment Operations | | | | | |
Net investment income (loss) C | .16 | .34 F | .17 | .18 | .20 |
Net realized and unrealized gain (loss) | (.65) | 1.04 | .24 | (2.57) | (3.48) |
Total from investment operations | (.49) | 1.38 | .41 | (2.39) | (3.28) |
Distributions from net investment income | (.17) | (.33) | (.07) | - | (.31) |
Distributions from net realized gain | (.18) | (.29) | (.12) | - | (1.50) |
Total distributions | (.35) | (.63) I | (.19) | - | (1.81) |
Redemption fees added to paid in capital C | - H | - H | - H | - H | .01 |
Net asset value, end of period | $ 8.37 | $ 9.21 | $ 8.46 | $ 8.24 | $ 10.63 |
Total Return A,B | (4.88)% | 16.76% | 4.97% | (22.48)% | (23.20)% |
Ratios to Average Net Assets D,G | | | | | |
Expenses before reductions | 1.44% | 1.42% | 1.44% | 1.45% | 1.38% |
Expenses net of fee waivers, if any | 1.44% | 1.42% | 1.44% | 1.45% | 1.38% |
Expenses net of all reductions | 1.37% | 1.36% | 1.39% | 1.42% | 1.35% |
Net investment income (loss) | 2.09% | 3.67% F | 2.02% | 2.55% | 1.58% |
Supplemental Data | | | | | |
Net assets, end of period (000 omitted) | $ 7,117 | $ 7,047 | $ 7,250 | $ 6,745 | $ 9,976 |
Portfolio turnover rate E | 138% | 131% | 95% | 55% | 63% |
A Total returns would have been lower if certain expenses had not been reduced during the applicable periods shown.
B Total returns do not include the effect of the sales charges.
C Calculated based on average shares outstanding during the period.
D Fees and expenses of any underlying Fidelity Central Funds are not included in the Fund's expense ratio. The Fund indirectly bears its proportionate share of the expenses of any underlying Fidelity Central Funds.
E Amount does not include the portfolio activity of any underlying Fidelity Central Funds.
F Investment income per share reflects large, non-recurring dividends which amounted to $.19 per share. Excluding these non-recurring dividends, the ratio of net investment income (loss) to average net assets would have been 1.64%.
G Expense ratios reflect operating expenses of the class. Expenses before reductions do not reflect amounts reimbursed by the investment adviser or reductions from brokerage service arrangements or reductions from other expense offset arrangements and do not represent the amount paid by the class during periods when reimbursements or reductions occur. Expenses net of fee waivers reflect expenses after reimbursement by the investment adviser but prior to reductions from brokerage service arrangements or other expense offset arrangements. Expenses net of all reductions represent the net expenses paid by the class.
H Amount represents less than $.01 per share.
I Total distributions of $.63 per share is comprised of distributions from net investment income of $.333 and distributions from net realized gain of $.294 per share.
See accompanying notes which are an integral part of the financial statements.
Annual Report
Financial Highlights - Class T
Years ended July 31, | 2012 | 2011 | 2010 | 2009 | 2008 |
Selected Per-Share Data | | | | | |
Net asset value, beginning of period | $ 9.16 | $ 8.41 | $ 8.21 | $ 10.62 | $ 15.70 |
Income from Investment Operations | | | | | |
Net investment income (loss) C | .14 | .31 F | .15 | .17 | .17 |
Net realized and unrealized gain (loss) | (.66) | 1.04 | .23 | (2.58) | (3.48) |
Total from investment operations | (.52) | 1.35 | .38 | (2.41) | (3.31) |
Distributions from net investment income | (.14) | (.31) | (.06) | - | (.28) |
Distributions from net realized gain | (.18) | (.29) | (.12) | - | (1.50) |
Total distributions | (.32) | (.60) | (.18) | - | (1.78) |
Redemption fees added to paid in capital C | - H | - H | - H | - H | .01 |
Net asset value, end of period | $ 8.32 | $ 9.16 | $ 8.41 | $ 8.21 | $ 10.62 |
Total Return A,B | (5.23)% | 16.54% | 4.68% | (22.69)% | (23.39)% |
Ratios to Average Net Assets D,G | | | | | |
Expenses before reductions | 1.72% | 1.69% | 1.70% | 1.71% | 1.64% |
Expenses net of fee waivers, if any | 1.70% | 1.69% | 1.70% | 1.71% | 1.64% |
Expenses net of all reductions | 1.63% | 1.63% | 1.65% | 1.68% | 1.60% |
Net investment income (loss) | 1.83% | 3.41% F | 1.75% | 2.29% | 1.32% |
Supplemental Data | | | | | |
Net assets, end of period (000 omitted) | $ 2,570 | $ 2,496 | $ 2,510 | $ 2,080 | $ 7,566 |
Portfolio turnover rate E | 138% | 131% | 95% | 55% | 63% |
A Total returns would have been lower if certain expenses had not been reduced during the applicable periods shown.
B Total returns do not include the effect of the sales charges.
C Calculated based on average shares outstanding during the period.
D Fees and expenses of any underlying Fidelity Central Funds are not included in the Fund's expense ratio. The Fund indirectly bears its proportionate share of the expenses of any underlying Fidelity Central Funds.
E Amount does not include the portfolio activity of any underlying Fidelity Central Funds.
F Investment income per share reflects large, non-recurring dividends which amounted to $.19 per share. Excluding these non-recurring dividends, the ratio of net investment income (loss) to average net assets would have been 1.38%.
G Expense ratios reflect operating expenses of the class. Expenses before reductions do not reflect amounts reimbursed by the investment adviser or reductions from brokerage service arrangements or reductions from other expense offset arrangements and do not represent the amount paid by the class during periods when reimbursements or reductions occur. Expenses net of fee waivers reflect expenses after reimbursement by the investment adviser but prior to reductions from brokerage service arrangements or other expense offset arrangements. Expenses net of all reductions represent the net expenses paid by the class.
H Amount represents less than $.01 per share.
See accompanying notes which are an integral part of the financial statements.
Annual Report
Financial Highlights - Class B
Years ended July 31, | 2012 | 2011 | 2010 | 2009 | 2008 |
Selected Per-Share Data | | | | | |
Net asset value, beginning of period | $ 9.05 | $ 8.32 | $ 8.14 | $ 10.58 | $ 15.67 |
Income from Investment Operations | | | | | |
Net investment income (loss) C | .10 | .26 F | .11 | .13 | .11 |
Net realized and unrealized gain (loss) | (.64) | 1.03 | .23 | (2.57) | (3.48) |
Total from investment operations | (.54) | 1.29 | .34 | (2.44) | (3.37) |
Distributions from net investment income | (.09) | (.27) | (.04) | - | (.23) |
Distributions from net realized gain | (.18) | (.29) | (.12) | - | (1.50) |
Total distributions | (.27) | (.56) | (.16) | - | (1.73) |
Redemption fees added to paid in capital C | - H | - H | - H | - H | .01 |
Net asset value, end of period | $ 8.24 | $ 9.05 | $ 8.32 | $ 8.14 | $ 10.58 |
Total Return A,B | (5.61)% | 15.90% | 4.20% | (23.06)% | (23.80)% |
Ratios to Average Net Assets D,G | | | | | |
Expenses before reductions | 2.19% | 2.17% | 2.19% | 2.19% | 2.14% |
Expenses net of fee waivers, if any | 2.19% | 2.17% | 2.19% | 2.19% | 2.14% |
Expenses net of all reductions | 2.12% | 2.11% | 2.14% | 2.17% | 2.11% |
Net investment income (loss) | 1.34% | 2.92% F | 1.26% | 1.81% | .82% |
Supplemental Data | | | | | |
Net assets, end of period (000 omitted) | $ 457 | $ 570 | $ 629 | $ 606 | $ 930 |
Portfolio turnover rate E | 138% | 131% | 95% | 55% | 63% |
A Total returns would have been lower if certain expenses had not been reduced during the applicable periods shown.
B Total returns do not include the effect of the contingent deferred sales charge.
C Calculated based on average shares outstanding during the period.
D Fees and expenses of any underlying Fidelity Central Funds are not included in the Fund's expense ratio. The Fund indirectly bears its proportionate share of the expenses of any underlying Fidelity Central Funds.
E Amount does not include the portfolio activity of any underlying Fidelity Central Funds.
F Investment income per share reflects large, non-recurring dividends which amounted to $.18 per share. Excluding these non-recurring dividends, the ratio of net investment income (loss) to average net assets would have been .90%.
G Expense ratios reflect operating expenses of the class. Expenses before reductions do not reflect amounts reimbursed by the investment adviser or reductions from brokerage service arrangements or reductions from other expense offset arrangements and do not represent the amount paid by the class during periods when reimbursements or reductions occur. Expenses net of fee waivers reflect expenses after reimbursement by the investment adviser but prior to reductions from brokerage service arrangements or other expense offset arrangements. Expenses net of all reductions represent the net expenses paid by the class.
H Amount represents less than $.01 per share.
See accompanying notes which are an integral part of the financial statements.
Annual Report
Financial Highlights - Class C
Years ended July 31, | 2012 | 2011 | 2010 | 2009 | 2008 |
Selected Per-Share Data | | | | | |
Net asset value, beginning of period | $ 9.03 | $ 8.30 | $ 8.13 | $ 10.57 | $ 15.67 |
Income from Investment Operations | | | | | |
Net investment income (loss) C | .10 | .26 F | .11 | .13 | .11 |
Net realized and unrealized gain (loss) | (.64) | 1.04 | .22 | (2.57) | (3.48) |
Total from investment operations | (.54) | 1.30 | .33 | (2.44) | (3.37) |
Distributions from net investment income | (.10) | (.28) | (.04) | - | (.24) |
Distributions from net realized gain | (.18) | (.29) | (.12) | - | (1.50) |
Total distributions | (.28) | (.57) | (.16) | - | (1.74) |
Redemption fees added to paid in capital C | - H | - H | - H | - H | .01 |
Net asset value, end of period | $ 8.21 | $ 9.03 | $ 8.30 | $ 8.13 | $ 10.57 |
Total Return A,B | (5.68)% | 16.07% | 4.10% | (23.08)% | (23.78)% |
Ratios to Average Net Assets D,G | | | | | |
Expenses before reductions | 2.19% | 2.17% | 2.18% | 2.19% | 2.14% |
Expenses net of fee waivers, if any | 2.19% | 2.17% | 2.18% | 2.19% | 2.14% |
Expenses net of all reductions | 2.12% | 2.11% | 2.14% | 2.17% | 2.11% |
Net investment income (loss) | 1.34% | 2.92% F | 1.27% | 1.81% | .82% |
Supplemental Data | | | | | |
Net assets, end of period (000 omitted) | $ 3,164 | $ 3,208 | $ 3,201 | $ 2,496 | $ 3,477 |
Portfolio turnover rate E | 138% | 131% | 95% | 55% | 63% |
A Total returns would have been lower if certain expenses had not been reduced during the applicable periods shown.
B Total returns do not include the effect of the contingent deferred sales charge.
C Calculated based on average shares outstanding during the period.
D Fees and expenses of any underlying Fidelity Central Funds are not included in the Fund's expense ratio. The Fund indirectly bears its proportionate share of the expenses of any underlying Fidelity Central Funds.
E Amount does not include the portfolio activity of any underlying Fidelity Central Funds.
F Investment income per share reflects large, non-recurring dividends which amounted to $.18 per share. Excluding these non-recurring dividends, the ratio of net investment income (loss) to average net assets would have been .89%.
G Expense ratios reflect operating expenses of the class. Expenses before reductions do not reflect amounts reimbursed by the investment adviser or reductions from brokerage service arrangements or reductions from other expense offset arrangements and do not represent the amount paid by the class during periods when reimbursements or reductions occur. Expenses net of fee waivers reflect expenses after reimbursement by the investment adviser but prior to reductions from brokerage service arrangements or other expense offset arrangements. Expenses net of all reductions represent the net expenses paid by the class.
H Amount represents less than $.01 per share.
See accompanying notes which are an integral part of the financial statements.
Annual Report
Financial Highlights - International Real Estate
Years ended July 31, | 2012 | 2011 | 2010 | 2009 | 2008 |
Selected Per-Share Data | | | | | |
Net asset value, beginning of period | $ 9.30 | $ 8.53 | $ 8.29 | $ 10.68 | $ 15.73 |
Income from Investment Operations | | | | | |
Net investment income (loss) B | .18 | .36 E | .19 | .20 | .25 |
Net realized and unrealized gain (loss) | (.67) | 1.06 | .25 | (2.59) | (3.50) |
Total from investment operations | (.49) | 1.42 | .44 | (2.39) | (3.25) |
Distributions from net investment income | (.19) | (.35) | (.08) | - | (.31) |
Distributions from net realized gain | (.18) | (.29) | (.12) | - | (1.50) |
Total distributions | (.37) | (.65) H | (.20) | - | (1.81) |
Redemption fees added to paid in capital B | - G | - G | - G | - G | .01 |
Net asset value, end of period | $ 8.44 | $ 9.30 | $ 8.53 | $ 8.29 | $ 10.68 |
Total Return A | (4.76)% | 17.15% | 5.29% | (22.38)% | (22.97)% |
Ratios to Average Net Assets C,F | | | | | |
Expenses before reductions | 1.19% | 1.17% | 1.19% | 1.19% | 1.11% |
Expenses net of fee waivers, if any | 1.19% | 1.17% | 1.19% | 1.19% | 1.10% |
Expenses net of all reductions | 1.12% | 1.11% | 1.14% | 1.16% | 1.07% |
Net investment income (loss) | 2.34% | 3.92% E | 2.27% | 2.81% | 1.86% |
Supplemental Data | | | | | |
Net assets, end of period (000 omitted) | $ 251,543 | $ 322,045 | $ 318,032 | $ 336,126 | $ 572,985 |
Portfolio turnover rate D | 138% | 131% | 95% | 55% | 63% |
A Total returns would have been lower if certain expenses had not been reduced during the applicable periods shown.
B Calculated based on average shares outstanding during the period.
C Fees and expenses of any underlying Fidelity Central Funds are not included in the Fund's expense ratio. The Fund indirectly bears its proportionate share of the expenses of any underlying Fidelity Central Funds.
D Amount does not include the portfolio activity of any underlying Fidelity Central Funds.
E Investment income per share reflects large, non-recurring dividends which amounted to $.19 per share. Excluding these non-recurring dividends, the ratio of net investment income (loss) to average net assets would have been 1.90%.
F Expense ratios reflect operating expenses of the class. Expenses before reductions do not reflect amounts reimbursed by the investment adviser or reductions from brokerage service arrangements or reductions from other expense offset arrangements and do not represent the amount paid by the class during periods when reimbursements or reductions occur. Expenses net of fee waivers reflect expenses after reimbursement by the investment adviser but prior to reductions from brokerage service arrangements or other expense offset arrangements. Expenses net of all reductions represent the net expenses paid by the class.
G Amount represents less than $.01 per share.
H Total distributions of $.65 per share is comprised of distributions from net investment income of $.354 and distributions from net realized gain of $.294 per share.
See accompanying notes which are an integral part of the financial statements.
Annual Report
Financial Highlights - Institutional Class
Years ended July 31, | 2012 | 2011 | 2010 | 2009 | 2008 |
Selected Per-Share Data | | | | | |
Net asset value, beginning of period | $ 9.28 | $ 8.51 | $ 8.28 | $ 10.66 | $ 15.73 |
Income from Investment Operations | | | | | |
Net investment income (loss) B | .18 | .36 E | .19 | .20 | .24 |
Net realized and unrealized gain (loss) | (.67) | 1.06 | .24 | (2.58) | (3.49) |
Total from investment operations | (.49) | 1.42 | .43 | (2.38) | (3.25) |
Distributions from net investment income | (.20) | (.35) | (.08) | - | (.33) |
Distributions from net realized gain | (.18) | (.29) | (.12) | - | (1.50) |
Total distributions | (.37) H | (.65) I | (.20) | - | (1.83) |
Redemption fees added to paid in capital B | - G | - G | - G | - G | .01 |
Net asset value, end of period | $ 8.42 | $ 9.28 | $ 8.51 | $ 8.28 | $ 10.66 |
Total Return A | (4.73)% | 17.18% | 5.18% | (22.33)% | (22.98)% |
Ratios to Average Net Assets C,F | | | | | |
Expenses before reductions | 1.19% | 1.17% | 1.18% | 1.19% | 1.13% |
Expenses net of fee waivers, if any | 1.19% | 1.17% | 1.18% | 1.19% | 1.13% |
Expenses net of all reductions | 1.12% | 1.11% | 1.14% | 1.17% | 1.10% |
Net investment income (loss) | 2.34% | 3.92% E | 2.27% | 2.81% | 1.83% |
Supplemental Data | | | | | |
Net assets, end of period (000 omitted) | $ 1,947 | $ 1,785 | $ 1,425 | $ 1,600 | $ 3,289 |
Portfolio turnover rate D | 138% | 131% | 95% | 55% | 63% |
A Total returns would have been lower if certain expenses had not been reduced during the applicable periods shown.
B Calculated based on average shares outstanding during the period.
C Fees and expenses of any underlying Fidelity Central Funds are not included in the Fund's expense ratio. The Fund indirectly bears its proportionate share of the expenses of any underlying Fidelity Central Funds.
D Amount does not include the portfolio activity of any underlying Fidelity Central Funds.
E Investment income per share reflects large, non-recurring dividends which amounted to $.19 per share. Excluding these non-recurring dividends, the ratio of net investment income (loss) to average net assets would have been 1.90%.
F Expense ratios reflect operating expenses of the class. Expenses before reductions do not reflect amounts reimbursed by the investment adviser or reductions from brokerage service arrangements or reductions from other expense offset arrangements and do not represent the amount paid by the class during periods when reimbursements or reductions occur. Expenses net of fee waivers reflect expenses after reimbursement by the investment adviser but prior to reductions from brokerage service arrangements or other expense offset arrangements. Expenses net of all reductions represent the net expenses paid by the class.
G Amount represents less than $.01 per share.
H Total distributions of $.37 per share is comprised of distributions from net investment income of $.195 and distributions from net realized gain of $.178 per share.
I Total distributions of $.65 per share is comprised of distributions from net investment income of $.354 and distributions from net realized gain of $.294 per share.
See accompanying notes which are an integral part of the financial statements.
Annual Report
Notes to Financial Statements
For the period ended July 31, 2012
1. Organization.
Fidelity International Real Estate Fund (the Fund) is a non-diversified fund of Fidelity Securities Fund (the Trust) and is authorized to issue an unlimited number of shares. The Trust is registered under the Investment Company Act of 1940, as amended (the 1940 Act), as an open-end management investment company organized as a Massachusetts business trust. The Fund offers Class A, Class T, Class C, International Real Estate and Institutional Class shares, each of which, along with Class B shares, has equal rights as to assets and voting privileges. Effective after the close of business on September 1, 2010, Class B shares were closed to new accounts and additional purchases, except for exchanges and reinvestments. Each class has exclusive voting rights with respect to matters that affect that class. Class B shares will automatically convert to Class A shares after a holding period of seven years from the initial date of purchase. Investment income, realized and unrealized capital gains and losses, the common expenses of the Fund, and certain fund-level expense reductions, if any, are allocated on a pro-rata basis to each class based on the relative net assets of each class to the total net assets of the Fund. Each class differs with respect to transfer agent and distribution and service plan fees incurred. Certain expense reductions may also differ by class. The Fund's investments in emerging markets can be subject to social, economic, regulatory, and political uncertainties and can be extremely volatile.
2. Investments in Fidelity Central Funds.
The Fund invests in Fidelity Central Funds, which are open-end investment companies available only to other investment companies and accounts managed by Fidelity Management & Research Company (FMR) and its affiliates. The Fund's Schedule of Investments lists each of the Fidelity Central Funds held as of period end, if any, as an investment of the Fund, but does not include the underlying holdings of each Fidelity Central Fund. As an Investing Fund, the Fund indirectly bears its proportionate share of the expenses of the underlying Fidelity Central Funds.
The Money Market Central Funds seek preservation of capital and current income and are managed by Fidelity Investments Money Management, Inc. (FIMM), an affiliate of FMR.
A complete unaudited list of holdings for each Fidelity Central Fund is available upon request or at the Securities and Exchange Commission (the SEC) web site at www.sec.gov. In addition, the financial statements of the Fidelity Central Funds, which are not covered by the Fund's Report of Independent Registered Public Accounting Firm, are available on the SEC web site or upon request.
Annual Report
Notes to Financial Statements - continued
3. Significant Accounting Policies.
The financial statements have been prepared in conformity with accounting principles generally accepted in the United States of America (GAAP), which require management to make certain estimates and assumptions at the date of the financial statements. Actual results could differ from those estimates. Subsequent events, if any, through the date that the financial statements were issued have been evaluated in the preparation of the financial statements. The following summarizes the significant accounting policies of the Fund:
Security Valuation. Investments are valued as of 4:00 p.m. Eastern time on the last calendar day of the period. In accordance with valuation policies and procedures approved by the Board of Trustees (the Board), the Fund attempts to obtain prices from one or more third party pricing vendor or broker to value its investments. When current market prices, quotations or rates are not readily available or reliable, securities will be fair valued in good faith by the FMR Fair Value Committee (the Committee), in accordance with procedures adopted by the Fund's Board. Factors used in determining fair value vary by security type and may include market or security specific events. The frequency with which these procedures are used cannot be predicted and they may be utilized to a significant extent. The Committee oversees the Fund's valuation policies and procedures and is responsible for approving and reporting to the Board all fair value determinations.
The Fund categorizes the inputs to valuation techniques used to value its investments into a disclosure hierarchy consisting of three levels as shown below:
Level 1 - quoted prices in active markets for identical investments
Level 2 - other significant observable inputs (including quoted prices for similar investments, interest rates, prepayment speeds, etc.)
Level 3 - unobservable inputs (including the Fund's own assumptions based on the best information available)
Valuation techniques used to value the Fund's investments by major category are as follows:
Equity securities, including restricted securities, for which market quotations are readily available, are valued at the last reported sale price or official closing price as reported by a third party pricing vendor on the primary market or exchange on which they are traded and are categorized as Level 1 in the hierarchy. In the event there were no sales during the day or closing prices are not available, securities are valued at the last quoted bid price or may be valued using the last available price and are generally categorized as Level 2 in the hierarchy. For foreign equity securities, when significant market or security specific events arise, comparisons to the valuation of American Depositary Receipts
Annual Report
3. Significant Accounting Policies - continued
Security Valuation - continued
(ADRs), futures contracts, Exchange-Traded Funds (ETFs) and certain indexes as well as quoted prices for similar securities are used and are categorized as Level 2 in the hierarchy. Utilizing these techniques may result in transfers between Level 1 and Level 2.
Investments in open-end mutual funds, including the Fidelity Central Funds, are valued at their closing net asset value each business day and are categorized as Level 1 in the hierarchy.
Changes in valuation techniques may result in transfers in or out of an assigned level within the disclosure hierarchy. The aggregate value of investments by input level, as of July 31, 2012, including information on transfers between Levels 1 and 2, is included at the end of the Fund's Schedule of Investments.
Foreign Currency Translation. The Fund may use foreign currency contracts to facilitate transactions in foreign-denominated securities. Gains and losses from these transactions may arise from changes in the value of the foreign currency or if the counterparties do not perform under the contracts' terms.
Foreign-denominated assets, including investment securities, and liabilities are translated into U.S. dollars at the exchange rates at period end. Purchases and sales of investment securities, income and dividends received and expenses denominated in foreign currencies are translated into U.S. dollars at the exchange rate in effect on the transaction date.
The effects of exchange rate fluctuations on investments are included with the net realized and unrealized gain (loss) on investment securities. Other foreign currency transactions resulting in realized and unrealized gain (loss) are disclosed separately.
Investment Transactions and Income. For financial reporting purposes, the Fund's investment holdings and NAV include trades executed through the end of the last business day of the period. The NAV per share for processing shareholder transactions is calculated as of the close of business of the New York Stock Exchange (NYSE), normally 4:00 p.m. Eastern time and includes trades executed through the end of the prior business day. Gains and losses on securities sold are determined on the basis of identified cost. Dividend income is recorded on the ex-dividend date, except for certain dividends from foreign securities where the ex-dividend date may have passed, which are recorded as soon as the Fund is informed of the ex-dividend date. Non-cash dividends included in dividend income, if any, are recorded at the fair market value of the securities received. Interest income and distributions from the Fidelity Central Funds are accrued as earned. Interest income includes coupon interest and amortization of premium and accretion of discount on debt securities. Investment income is recorded net of foreign taxes withheld where recovery of such taxes is uncertain.
Annual Report
Notes to Financial Statements - continued
3. Significant Accounting Policies - continued
Expenses. Expenses directly attributable to a fund are charged to that fund. Expenses attributable to more than one fund are allocated among the respective funds on the basis of relative net assets or other appropriate methods. Expense estimates are accrued in the period to which they relate and adjustments are made when actual amounts are known.
Income Tax Information and Distributions to Shareholders. Each year, the Fund intends to qualify as a regulated investment company under Subchapter M of the Internal Revenue Code, including distributing substantially all of its taxable income and realized gains. As a result, no provision for income taxes is required. As of July 31, 2012, the Fund did not have any unrecognized tax benefits in the financial statements; nor is the Fund aware of any tax positions for which it is reasonably possible that the total amounts of unrecognized tax benefits will significantly change in the next twelve months. The Fund files a U.S. federal tax return, in addition to state and local tax returns as required. A fund's federal income tax returns are subject to examination by the Internal Revenue Service (IRS) for a period of three fiscal years after they are filed. State and local tax returns may be subject to examination for an additional fiscal year depending on the jurisdiction. Foreign taxes are provided for based on the Fund's understanding of the tax rules and rates that exist in the foreign markets in which it invests.
Distributions are declared and recorded on the ex-dividend date. Income dividends and capital gain distributions are declared separately for each class. Income and capital gain distributions are determined in accordance with income tax regulations, which may differ from GAAP.
Capital accounts within the financial statements are adjusted for permanent book-tax differences. These adjustments have no impact on net assets or the results of operations. Temporary book-tax differences will reverse in a subsequent period.
Book-tax differences are primarily due to foreign currency transactions, passive foreign investments companies (PFIC), capital loss carryforwards and losses deferred due to wash sales and excise tax regulations.
The federal tax cost of investment securities and unrealized appreciation (depreciation) as of period end were as follows:
Gross unrealized appreciation | $ 8,210,797 |
Gross unrealized depreciation | (42,520,691) |
Net unrealized appreciation (depreciation) on securities and other investments | $ (34,309,894) |
| |
Tax Cost | $ 301,326,380 |
Annual Report
3. Significant Accounting Policies - continued
Income Tax Information and Distributions to Shareholders - continued
The tax-based components of distributable earnings as of period end were as follows:
Undistributed ordinary income | $ 8,146,350 |
Capital loss carryforward | $ (305,203,415) |
Net unrealized appreciation (depreciation) | $ (34,346,659) |
Capital loss carryforwards are only available to offset future capital gains of the Fund to the extent provided by regulations and may be limited. Under the Regulated Investment Company Modernization Act of 2010 (the Act), the Fund is permitted to carry forward capital losses incurred in taxable years beginning after December 22, 2010 for an unlimited period and such capital losses are required to be used prior to any losses that expire. Capital loss carryforwards were as follows:
Fiscal year of expiration | |
2017 | $ (153,317,175) |
2018 | (136,599,532) |
Total with expiration | $ (289,916,707) |
No expiration | |
Short-term | $ (13,155,668) |
Long-term | (2,131,040) |
Total no expiration | (15,286,708) |
Total capital loss carryforward | $ (305,203,415) |
The Fund intends to elect to defer to its fiscal year ending July 31, 2013 approximately $13,183,916 of capital losses recognized during the period November 1, 2011 to July 31, 2012.
The tax character of distributions paid was as follows:
| July 31, 2012 | July 31, 2011 |
Ordinary Income | $ 13,070,253 | $ 25,333,526 |
Short-Term Trading (Redemption) Fees. Shares held by investors in the Fund less than 90 days are subject to a redemption fee equal to 1.50% of the net asset value of shares redeemed. All redemption fees, which reduce the proceeds of the shareholder redemption, are retained by the Fund and accounted for as an addition to paid in capital.
Annual Report
Notes to Financial Statements - continued
3. Significant Accounting Policies - continued
New Accounting Pronouncement. In December 2011, the Financial Accounting Standards Board issued Accounting Standard Update No. 2011-11, Disclosures about Offsetting Assets and Liabilities. The update creates new disclosure requirements requiring entities to disclose both gross and net information for derivatives and other financial instruments that are either offset in the Statement of Assets and Liabilities or subject to an enforceable master netting arrangement or similar agreement. The disclosure requirements are effective for interim and annual reporting periods beginning on or after January 1, 2013. Management is currently evaluating the impact of the update's adoption on the Fund's financial statement disclosures.
4. Purchases and Sales of Investments.
Purchases and sales of securities, other than short-term securities, aggregated $357,419,840 and $405,089,100, respectively.
5. Fees and Other Transactions with Affiliates.
Management Fee. FMR and its affiliates provide the Fund with investment management related services for which the Fund pays a monthly management fee. The management fee is the sum of an individual fund fee rate that is based on an annual rate of .45% of the Fund's average net assets and an annualized group fee rate that averaged .26% during the period. The group fee rate is based upon the average net assets of all the mutual funds advised by FMR. The group fee rate decreases as assets under management increase and increases as assets under management decrease. For the period, the total annual management fee rate was .71% of the Fund's average net assets.
Distribution and Service Plan Fees. In accordance with Rule 12b-1 of the 1940 Act, the Fund has adopted separate Distribution and Service Plans for each class of shares. Certain classes pay Fidelity Distributors Corporation (FDC), an affiliate of FMR, separate Distribution and Service Fees, each of which is based on an annual percentage of each class' average net assets. In addition, FDC may pay financial intermediaries for selling shares of the Fund and providing shareholder support services. For the period, the Distribution and Service Fee rates, total fees and amounts retained by FDC were as follows:
| Distribution
Fee | Service
Fee | Total Fees | Retained
by FDC |
Class A | -% | .25% | $ 15,646 | $ 39 |
Class T | .25% | .25% | 10,228 | - |
Class B | .75% | .25% | 4,466 | 3,349 |
Class C | .75% | .25% | 27,070 | 3,373 |
| | | $ 57,410 | $ 6,761 |
Annual Report
5. Fees and Other Transactions with Affiliates - continued
Sales Load. FDC may receive a front-end sales charge of up to 5.75% for selling Class A shares and 3.50% for selling Class T shares, some of which is paid to financial intermediaries for selling shares of the Fund. Depending on the holding period, FDC may receive contingent deferred sales charges levied on Class A, Class T, Class B, and Class C redemptions. The deferred sales charges range from 5.00% to 1.00% for Class B shares, 1.00% for Class C shares, 1.00% for certain purchases of Class A shares and .25% for certain purchases of Class T shares.
For the period, sales charge amounts retained by FDC were as follows:
| Retained
by FDC |
Class A | $ 6,375 |
Class T | 1,412 |
Class B* | 1,293 |
Class C* | 136 |
| $ 9,216 |
* When Class B and Class C shares are initially sold, FDC pays commissions from its own resources to financial intermediaries through which the sales are made.
Transfer Agent Fees. Fidelity Investments Institutional Operations Company, Inc. (FIIOC), an affiliate of FMR, is the transfer, dividend disbursing and shareholder servicing agent for each class of the Fund. FIIOC receives account fees and asset-based fees that vary according to the account size and type of account of the shareholders of the respective classes of the Fund. FIIOC pays for typesetting, printing and mailing of shareholder reports, except proxy statements. For the period, transfer agent fees for each class were as follows:
| Amount | % of
Average
Net Assets |
Class A | $ 18,681 | .30 |
Class T | 6,690 | .33 |
Class B | 1,338 | .30 |
Class C | 8,040 | .30 |
International Real Estate | 750,777 | .30 |
Institutional Class | 5,038 | .30 |
| $ 790,564 | |
Annual Report
Notes to Financial Statements - continued
5. Fees and Other Transactions with Affiliates - continued
Accounting and Security Lending Fees. Fidelity Service Company, Inc. (FSC), an affiliate of FMR, maintains the Fund's accounting records. The accounting fee is based on the level of average net assets for each month. Under a separate contract, FSC administers the security lending program. The security lending fee is based on the number and duration of lending transactions.
Brokerage Commissions. The Fund placed a portion of its portfolio transactions with brokerage firms which are affiliates of the investment adviser. The commissions paid to these affiliated firms were $12 for the period.
6. Committed Line of Credit.
The Fund participates with other funds managed by FMR or an affiliate in a $4.25 billion credit facility (the "line of credit") to be utilized for temporary or emergency purposes to fund shareholder redemptions or for other short-term liquidity purposes. The Fund has agreed to pay commitment fees on its pro-rata portion of the line of credit, which amounted to $766 and is reflected in Miscellaneous expenses on the Statement of Operations. During the period, there were no borrowings on this line of credit.
7. Security Lending.
The Fund lends portfolio securities through a lending agent from time to time in order to earn additional income. For equity securities, a lending agent is used and may loan securities to certain qualified borrowers, including Fidelity Capital Markets (FCM), a broker-dealer affiliated with the Fund. On the settlement date of the loan, the Fund receives collateral (in the form of U.S. Treasury obligations, letters of credit and/or cash) against the loaned securities and maintains collateral in an amount not less than 100% of the market value of the loaned securities during the period of the loan. The market value of the loaned securities is determined at the close of business of the Fund and any additional required collateral is delivered to the Fund on the next business day. If the borrower defaults on its obligation to return the securities loaned because of insolvency or other reasons, a fund could experience delays and costs in recovering the securities loaned or in gaining access to the collateral. Any cash collateral received is invested in the Fidelity Securities Lending Cash Central Fund. The value of loaned securities and cash collateral at period end are disclosed on the Fund's Statement of Assets and Liabilities. Security lending income represents the income earned on investing cash collateral, less rebates paid to borrowers and any lending agent fees associated with the loan, plus any premium payments received for lending certain types of securities. Security lending income is presented in the Statement of Operations as a component of income from Fidelity Central Funds. Total security lending income during the period amounted to $77,977. During the period, there were no securities loaned to FCM.
Annual Report
8. Expense Reductions.
FMR voluntarily agreed to reimburse each class to the extent annual operating expenses exceeded certain levels of average net assets as noted in the table below. Some expenses, for example interest expense, including commitment fees, are excluded from this reimbursement.
The following classes were in reimbursement during the period:
| Expense
Limitations | Reimbursement
from adviser |
Class T | 1.70% | $ 378 |
Many of the brokers with whom FMR places trades on behalf of the Fund provided services to the Fund in addition to trade execution. These services included payments of certain expenses on behalf of the Fund totaling $182,189 for the period. In addition, through arrangements with the Fund's custodian, credits realized as a result of uninvested cash balances were used to reduce the Fund's expenses. During the period, these credits reduced the Fund's custody expenses by $23.
9. Distributions to Shareholders.
Distributions to shareholders of each class were as follows:
Years ended July 31, | 2012 | 2011 |
From net investment income | | |
Class A | $ 129,790 | $ 287,564 |
Class T | 38,723 | 96,278 |
Class B | 5,465 | 19,520 |
Class C | 34,224 | 109,655 |
International Real Estate | 6,491,807 | 13,319,427 |
Institutional Class | 40,510 | 60,300 |
Total | $ 6,740,519 | $ 13,892,744 |
From net realized gain | | |
Class A | $ 132,606 | $ 250,090 |
Class T | 47,658 | 89,657 |
Class B | 10,422 | 21,506 |
Class C | 62,457 | 114,914 |
International Real Estate | 6,040,035 | 10,916,536 |
Institutional Class | 36,556 | 48,079 |
Total | $ 6,329,734 | $ 11,440,782 |
Annual Report
Notes to Financial Statements - continued
10. Share Transactions.
Transactions for each class of shares were as follows:
| Shares | Dollars |
Years ended July 31, | 2012 | 2011 | 2012 | 2011 |
Class A | | | | |
Shares sold | 561,131 | 213,763 | $ 4,326,130 | $ 1,964,473 |
Reinvestment of distributions | 30,139 | 50,966 | 225,090 | 451,020 |
Shares redeemed | (505,235) | (357,321) | (3,930,366) | (3,278,956) |
Net increase (decrease) | 86,035 | (92,592) | $ 620,854 | $ (863,463) |
Class T | | | | |
Shares sold | 121,127 | 73,470 | $ 960,744 | $ 668,265 |
Reinvestment of distributions | 11,086 | 20,063 | 82,612 | 176,852 |
Shares redeemed | (95,807) | (119,466) | (730,690) | (1,082,947) |
Net increase (decrease) | 36,406 | (25,933) | $ 312,666 | $ (237,830) |
Class B | | | | |
Shares sold | 10,309 | 4,563 | $ 80,691 | $ 41,321 |
Reinvestment of distributions | 2,053 | 4,289 | 15,253 | 37,454 |
Shares redeemed | (19,799) | (21,555) | (151,766) | (195,000) |
Net increase (decrease) | (7,437) | (12,703) | $ (55,822) | $ (116,225) |
Class C | | | | |
Shares sold | 126,213 | 111,487 | $ 1,000,819 | $ 1,002,010 |
Reinvestment of distributions | 11,099 | 21,061 | 82,243 | 183,176 |
Shares redeemed | (107,140) | (162,778) | (798,655) | (1,467,063) |
Net increase (decrease) | 30,172 | (30,230) | $ 284,407 | $ (281,877) |
International Real Estate | | | | |
Shares sold | 6,073,777 | 7,219,780 | $ 47,017,817 | $ 67,747,351 |
Reinvestment of distributions | 1,561,125 | 2,559,870 | 11,751,117 | 22,802,021 |
Shares redeemed | (12,463,432) | (12,440,980) | (96,926,190) | (115,315,484) |
Net increase (decrease) | (4,828,530) | (2,661,330) | $ (38,157,256) | $ (24,766,112) |
Institutional Class | | | | |
Shares sold | 125,764 | 99,324 | $ 977,184 | $ 925,861 |
Reinvestment of distributions | 8,633 | 10,892 | 64,775 | 96,908 |
Shares redeemed | (95,484) | (85,350) | (743,574) | (787,527) |
Net increase (decrease) | 38,913 | 24,866 | $ 298,385 | $ 235,242 |
Annual Report
11. Other.
The Fund's organizational documents provide former and current trustees and officers with a limited indemnification against liabilities arising in connection with the performance of their duties to the Fund. In the normal course of business, the Fund may also enter into contracts that provide general indemnifications. The Fund's maximum exposure under these arrangements is unknown as this would be dependent on future claims that may be made against the Fund. The risk of material loss from such claims is considered remote.
At the end of the period, FMR or its affiliates were the owners of record of approximately 12% of the outstanding shares of the fund.
Annual Report
Report of Independent Registered Public Accounting Firm
To the Trustees of Fidelity Securities Fund and the Shareholders of Fidelity International Real Estate Fund:
In our opinion, the accompanying statement of assets and liabilities, including the schedule of investments, and the related statements of operations and of changes in net assets and the financial highlights present fairly, in all material respects, the financial position of Fidelity International Real Estate Fund (a fund of Fidelity Securities Fund) at July 31, 2012, the results of its operations for the year then ended, the changes in its net assets for each of the two years in the period then ended and the financial highlights for each of the five years in the period then ended, in conformity with accounting principles generally accepted in the United States of America. These financial statements and financial highlights (hereafter referred to as "financial statements") are the responsibility of the Fidelity International Real Estate Fund's management. Our responsibility is to express an opinion on these financial statements based on our audits. We conducted our audits of these financial statements in accordance with the standards of the Public Company Accounting Oversight Board (United States). Those standards require that we plan and perform the audit to obtain reasonable assurance about whether the financial statements are free of material misstatement. An audit includes examining, on a test basis, evidence supporting the amounts and disclosures in the financial statements, assessing the accounting principles used and significant estimates made by management, and evaluating the overall financial statement presentation. We believe that our audits, which included confirmation of securities at July 31, 2012 by correspondence with the custodian and brokers, provide a reasonable basis for our opinion.
PricewaterhouseCoopers LLP
Boston, Massachusetts
September 13, 2012
Annual Report
Trustees and Officers
The Trustees, Members of the Advisory Board, and executive officers of the trust and fund, as applicable, are listed below. The Board of Trustees governs the fund and is responsible for protecting the interests of shareholders. The Trustees are experienced executives who meet periodically throughout the year to oversee the fund's activities, review contractual arrangements with companies that provide services to the fund, oversee management of the risks associated with such activities and contractual arrangements, and review the fund's performance. Except for James C. Curvey, each of the Trustees oversees 228 funds advised by FMR or an affiliate. Mr. Curvey oversees 435 funds advised by FMR or an affiliate.
The Trustees hold office without limit in time except that (a) any Trustee may resign; (b) any Trustee may be removed by written instrument, signed by at least two-thirds of the number of Trustees prior to such removal; (c) any Trustee who requests to be retired or who has become incapacitated by illness or injury may be retired by written instrument signed by a majority of the other Trustees; and (d) any Trustee may be removed at any special meeting of shareholders by a two-thirds vote of the outstanding voting securities of the trust. Each Trustee who is not an interested person (as defined in the 1940 Act) (Independent Trustee), shall retire not later than the last day of the calendar year in which his or her 75th birthday occurs. The Independent Trustees may waive this mandatory retirement age policy with respect to individual Trustees. The executive officers and Advisory Board Members hold office without limit in time, except that any officer and Advisory Board Member may resign or may be removed by a vote of a majority of the Trustees at any regular meeting or any special meeting of the Trustees. Except as indicated, each individual has held the office shown or other offices in the same company for the past five years.
Experience, Skills, Attributes, and Qualifications of the Fund's Trustees. The Governance and Nominating Committee has adopted a statement of policy that describes the experience, qualifications, attributes, and skills that are necessary and desirable for potential Independent Trustee candidates (Statement of Policy). The Board believes that each Trustee satisfied at the time he or she was initially elected or appointed a Trustee, and continues to satisfy, the standards contemplated by the Statement of Policy. The Governance and Nominating Committee also engages professional search firms to help identify potential Independent Trustee candidates who have the experience, qualifications, attributes, and skills consistent with the Statement of Policy. From time to time, additional criteria based on the composition and skills of the current Independent Trustees, as well as experience or skills that may be appropriate in light of future changes to board composition, business conditions, and regulatory or other developments, have also been considered by the professional search firms and the Governance and Nominating Committee. In addition, the Board takes into account the Trustees' commitment and participation in Board and committee meetings, as well as their leadership of standing and ad hoc committees throughout their tenure.
In determining that a particular Trustee was and continues to be qualified to serve as a Trustee, the Board has considered a variety of criteria, none of which, in isolation, was controlling. The Board believes that, collectively, the Trustees have balanced and diverse experience, qualifications, attributes, and skills, which allow the Board to operate effectively in governing the fund and protecting the interests of shareholders. Information about the specific experience, skills, attributes, and qualifications of each Trustee, which in each case led to the Board's conclusion that the Trustee should serve (or continue to serve) as a trustee of the fund, is provided below.
Annual Report
Board Structure and Oversight Function. James C. Curvey is an interested person (as defined in the 1940 Act) and currently serves as Chairman. The Trustees have determined that an interested Chairman is appropriate and benefits shareholders because an interested Chairman has a personal and professional stake in the quality and continuity of services provided to the fund. Independent Trustees exercise their informed business judgment to appoint an individual of their choosing to serve as Chairman, regardless of whether the Trustee happens to be independent or a member of management. The Independent Trustees have determined that they can act independently and effectively without having an Independent Trustee serve as Chairman and that a key structural component for assuring that they are in a position to do so is for the Independent Trustees to constitute a substantial majority for the Board. The Independent Trustees also regularly meet in executive session. Ned C. Lautenbach serves as Chairman of the Independent Trustees and as such (i) acts as a liaison between the Independent Trustees and management with respect to matters important to the Independent Trustees and (ii) with management prepares agendas for Board meetings.
Fidelity funds are overseen by different Boards of Trustees. The fund's Board oversees Fidelity's equity and high income funds and another Board oversees Fidelity's investment-grade bond, money market, and asset allocation funds. The asset allocation funds may invest in Fidelity funds overseen by the fund's Board. The use of separate Boards, each with its own committee structure, allows the Trustees of each group of Fidelity funds to focus on the unique issues of the funds they oversee, including common research, investment, and operational issues. On occasion, the separate Boards establish joint committees to address issues of overlapping consequences for the Fidelity funds overseen by each Board.
The Trustees operate using a system of committees to facilitate the timely and efficient consideration of all matters of importance to the Trustees, the fund, and fund shareholders and to facilitate compliance with legal and regulatory requirements and oversight of the fund's activities and associated risks. The Board, acting through its committees, has charged FMR and its affiliates with (i) identifying events or circumstances the occurrence of which could have demonstrably adverse effects on the fund's business and/or reputation; (ii) implementing processes and controls to lessen the possibility that such events or circumstances occur or to mitigate the effects of such events or circumstances if they do occur; and (iii) creating and maintaining a system designed to evaluate continuously business and market conditions in order to facilitate the identification and implementation processes described in (i) and (ii) above. Because the day-to-day operations and activities of the fund are carried out by or through FMR, its affiliates and other service providers, the fund's exposure to risks is mitigated but not eliminated by the processes overseen by the Trustees. While each of the Board's committees has responsibility for overseeing different aspects of the fund's activities, oversight is exercised primarily through the Operations, Audit, and Compliance Committees. In addition, the Independent Trustees have worked with FMR to enhance the Board's oversight of investment and financial risks, legal and regulatory risks, technology risks, and operational risks, including the development of additional risk reporting to the Board. For example, a working group comprised of Independent Trustees and FMR has worked and continues to work to review the Fidelity funds' valuation-related activities, reporting and risk management. Appropriate personnel, including but not limited to the fund's Chief Compliance Officer (CCO), FMR's internal auditor, the independent accountants, the fund's Treasurer and portfolio management personnel, make periodic reports to the Board's committees, as appropriate, including an annual review of FMR's risk management program for the Fidelity funds. The responsibilities of each standing committee, including their oversight responsibilities, are described further under "Standing Committees of the Fund's Trustees."
Annual Report
Trustees and Officers - continued
The fund's Statement of Additional Information (SAI) includes more information about the Trustees. To request a free copy, call Fidelity at 1-877-208-0098.
Interested Trustees*:
Correspondence intended for each Trustee who is an interested person may be sent to Fidelity Investments, 82 Devonshire Street, Boston, Massachusetts 02109.
Name, Age; Principal Occupations and Other Relevant Experience+ |
James C. Curvey (77) |
| Year of Election or Appointment: 2007 Mr. Curvey is Trustee and Chairman of the Board of Trustees of certain Trusts. Mr. Curvey also serves as Trustee (2007-present) of other investment companies advised by FMR. Mr. Curvey is a Director of Fidelity Investments Money Management, Inc. (2009-present), Director of Fidelity Research & Analysis Co. (2009-present) and Director of FMR and FMR Co., Inc. (2007-present). Mr. Curvey is also Vice Chairman (2007-present) and Director of FMR LLC. In addition, Mr. Curvey serves as an Overseer for the Boston Symphony Orchestra and a member of the Trustees of Villanova University. Previously, Mr. Curvey was the Vice Chairman (2006-2007) and Director (2000-2007) of FMR Corp. |
Ronald P. O'Hanley (55) |
| Year of Election or Appointment: 2011 Mr. O'Hanley is Director of FMR Co., Inc. (2010-present), Director of Fidelity Investments Money Management, Inc. (2010-present), Director of Fidelity Research & Analysis Company (2010-present), President of Fidelity Asset Management and Corporate Services and a member of Fidelity's Executive Committee (2010-present). Previously, Mr. O'Hanley served as President and Chief Executive Officer of BNY Mellon Asset Management (2007-2010). Mr. O'Hanley also served as Vice Chairman of Bank New York Mellon Corp. and a member of that firm's Executive Committee. Prior to the 2007 merger of The Bank of New York and Mellon Financial Corporation, he was Vice Chairman of Mellon Financial Corporation and President and Chief Executive Officer of Mellon Asset Management. He joined Mellon in February 1997. Mr. O'Hanley currently serves as Chairman of the Boston Public Library Foundation Board of Directors and sits on the Board of Directors of Beth Israel Deaconess Medical Center, the Board of Trustees of the Marine Biological Laboratory and the Advisory Board of the Maxwell School of Citizenship and Public Administration at Syracuse University. Mr. O'Hanley also chairs the Council on Asset Management for the Financial Services Roundtable and is a member of the Board of Directors of Institutional Investor's U.S. Institute. |
* Trustees have been determined to be "Interested Trustees" by virtue of, among other things, their affiliation with the trust or various entities under common control with FMR.
+ The information above includes each Trustee's principal occupation during the last five years and other information relating to the experience, attributes, and skills relevant to each Trustee's qualifications to serve as a Trustee, which led to the conclusion that each Trustee should serve as a Trustee for the fund.
Annual Report
Trustees and Officers - continued
Independent Trustees:
Correspondence intended for each Independent Trustee (that is, the Trustees other than the Interested Trustees) may be sent to Fidelity Investments, P.O. Box 55235, Boston, Massachusetts 02205-5235.
Name, Age; Principal Occupations and Other Relevant Experience+ |
Dennis J. Dirks (64) |
| Year of Election or Appointment: 2005 Prior to his retirement in May 2003, Mr. Dirks was Chief Operating Officer and a member of the Board of The Depository Trust & Clearing Corporation (DTCC). He also served as President, Chief Operating Officer, and Board member of The Depository Trust Company (DTC) and President and Board member of the National Securities Clearing Corporation (NSCC). In addition, Mr. Dirks served as Chief Executive Officer and Board member of the Government Securities Clearing Corporation, Chief Executive Officer and Board member of the Mortgage-Backed Securities Clearing Corporation, as a Trustee and a member of the Finance Committee of Manhattan College (2005-2008), and as a Trustee and a member of the Finance Committee of AHRC of Nassau County (2006-2008). Mr. Dirks is a member of the Independent Directors Council (IDC) Governing Council (2010-present) and Board of Directors for The Brookville Center for Children's Services, Inc. (2009-present). |
Alan J. Lacy (58) |
| Year of Election or Appointment: 2008 Mr. Lacy serves as Senior Adviser (2007-present) of Oak Hill Capital Partners, L.P. (private equity). Mr. Lacy also served as Chief Executive Officer (2000-2005) and Vice Chairman (2005-2006) of Sears Holdings Corporation and Sears, Roebuck and Co. (retail). In addition, Mr. Lacy serves as a member of the Board of Directors of Dave & Buster's Entertainment, Inc. (restaurant and entertainment complexes, 2010- present), Earth Fare, Inc. (retail grocery, 2012-present), The Hillman Companies, Inc. (hardware wholesalers, 2010-present), and Bristol-Myers Squibb Company (global pharmaceuticals, 2007-present). Mr. Lacy is a member of the Board of Trustees of The National Parks Conservation Association (2006-present). Previously, Mr. Lacy served as Chairman of the Board of Trustees of the National Parks Conservation Association (2008-2011) and as a member of the Board of Directors for the Western Union Company (global money transfer, 2006-2011). |
Ned C. Lautenbach (68) |
| Year of Election or Appointment: 2000 Mr. Lautenbach is Chairman of the Independent Trustees of the Equity and High Income Funds (2006-present). Mr. Lautenbach currently serves as the Lead Director of the Eaton Corporation Board of Directors (diversified industrial, 1997-present). Mr. Lautenbach is Chairman of the Board of Directors of the Philharmonic Center for the Arts in Naples, Florida (2012-present) and a member of the Council on Foreign Relations (1994-present). Previously, Mr. Lautenbach was a Partner/Advisory Partner at Clayton, Dubilier & Rice, LLC (private equity investment, 1998-2010), as well as a Director of Sony Corporation (2006-2007). |
Joseph Mauriello (67) |
| Year of Election or Appointment: 2008 Prior to his retirement in January 2006, Mr. Mauriello served in numerous senior management positions including Deputy Chairman and Chief Operating Officer (2004-2005), and Vice Chairman of Financial Services (2002-2004) of KPMG LLP US (professional services, 1965-2005). Mr. Mauriello currently serves as a member of the Board of Directors of XL Group plc. (global insurance and re-insurance, 2006-present). Previously, Mr. Mauriello served as a Director of the Hamilton Funds of the Bank of New York (2006-2007) and of Arcadia Resources Inc. (health care services and products, 2007-2012). |
Robert W. Selander (61) |
| Year of Election or Appointment: 2011 Previously, Mr. Selander served as a Member of the Advisory Board of Fidelity's Equity and High Income Funds (2011), Executive Vice Chairman (2010), Chief Executive Officer (2009-2010), and President and Chief Executive Officer (1997-2009) of Mastercard, Inc. |
Cornelia M. Small (68) |
| Year of Election or Appointment: 2005 Ms. Small is a member of the Board of Directors of the Teagle Foundation (2009-present). Ms. Small is also a member of the Investment Committee, and Chair (2008-present) and a member of the Board of Trustees of Smith College. In addition, Ms. Small serves on the Investment Committee of the Berkshire Taconic Community Foundation (2008-present). Previously, Ms. Small served as Chairperson of the Investment Committee (2002-2008) of Smith College. In addition, Ms. Small served as Chief Investment Officer, Director of Global Equity Investments, and a member of the Board of Directors of Scudder, Stevens & Clark and Scudder Kemper Investments. |
William S. Stavropoulos (73) |
| Year of Election or Appointment: 2002 Mr. Stavropoulos is Vice Chairman of the Independent Trustees of the Equity and High Income Funds (2006-present). Mr. Stavropoulos serves as President and Founder of the Michigan Baseball Foundation, the Great Lakes Loons (2007-present). Mr. Stavropoulos is Chairman Emeritus of the Board of Directors of The Dow Chemical Company, where he previously served in numerous senior management positions, including President, CEO (1995-2000; 2002-2004), Chairman of the Executive Committee (2000-2006), and as a member of the Board of Directors (1990-2006). Currently, Mr. Stavropoulos is Chairman of Univar (global distributor of commodity and specialty chemicals, 2010-present), a Director of Teradata Corporation (data warehousing and technology solutions, 2008-present), Chemical Financial Corporation, Maersk Inc. (industrial conglomerate), Tyco International, Inc. (multinational manufacturing and services, 2007-present), and a member of the Advisory Board for Metalmark Capital (private equity investment, 2005-present). Mr. Stavropoulos is a special advisor to Clayton, Dubilier & Rice, LLC (private equity investment). In addition, Mr. Stavropoulos is a member of the University of Notre Dame Advisory Council for the College of Science. |
David M. Thomas (63) |
| Year of Election or Appointment: 2008 Previously, Mr. Thomas served as Executive Chairman (2005-2006) and Chairman and Chief Executive Officer (2000-2005) of IMS Health, Inc. (pharmaceutical and healthcare information solutions). In addition, Mr. Thomas serves as a member of the Board of Directors of Fortune Brands, Inc. (consumer products), and Interpublic Group of Companies, Inc. (marketing communication, 2004-present). |
Michael E. Wiley (61) |
| Year of Election or Appointment: 2008 Mr. Wiley also serves as a Director of Asia Pacific Exploration Consolidated (international oil and gas exploration and production, 2008-present). Mr. Wiley serves as a Director of Tesoro Corporation (independent oil refiner and marketer, 2005-present), and a Director of Bill Barrett Corporation (exploration and production, 2005-present). In addition, Mr. Wiley also serves as a Director of Post Oak Bank (privately-held bank, 2004-present). Previously, Mr. Wiley served as a member of the Board of Trustees of the University of Tulsa (2000-2006; 2007-2010), as a Senior Energy Advisor of Katzenbach Partners, LLC (consulting, 2006-2007), as an Advisory Director of Riverstone Holdings (private investment), Chairman, President, and CEO of Baker Hughes, Inc. (oilfield services, 2000-2004), and as Director of Spinnaker Exploration Company (exploration and production, 2001-2005). |
Annual Report
+ The information above includes each Trustee's principal occupation during the last five years and other information relating to the experience, attributes, and skills relevant to each Trustee's qualifications to serve as a Trustee, which led to the conclusion that each Trustee should serve as a Trustee for the fund.
Advisory Board Members and Executive Officers:
Correspondence intended for David A. Rosow and Garnett A. Smith may be sent to Fidelity Investments, P.O. Box 55235, Boston, Massachusetts 02205-5235. Correspondence intended for each executive officer, Edward C. Johnson 3d, and Peter S. Lynch may be sent to Fidelity Investments, 82 Devonshire Street, Boston, Massachusetts 02109.
Name, Age; Principal Occupation |
Edward C. Johnson 3d (82) |
| Year of Election or Appointment: 2011 Member of the Advisory Board of Fidelity's Equity and High Income Funds. Mr. Johnson serves as Chief Executive Officer, Chairman, and a Director of FMR LLC, and also serves as Chairman and Director of FIL Limited. Previously, Mr. Johnson served as a Trustee and Chairman of the Board of certain Fidelity Trusts, Chairman and a Director of FMR, Chairman and a Director of FMR Co., Inc., and President of FMR LLC (2006-2007). |
Peter S. Lynch (68) |
| Year of Election or Appointment: 2003 Member of the Advisory Board of Fidelity's Equity and High Income Funds. Mr. Lynch is Vice Chairman and a Director of FMR and FMR Co., Inc. In addition, Mr. Lynch serves as a Trustee of Boston College and as the Chairman of the Inner-City Scholarship Fund. Previously, Mr. Lynch served on the Special Olympics International Board of Directors (1997-2006). |
David A. Rosow (69) |
| Year of Election or Appointment: 2012 Member of the Advisory Board of Fidelity's Equity and High Income Funds. Chairman and Chief Executive Officer of International Golf Group, Inc. (golf course development, 1990-present). Previously, Mr. Rosow served as Chairman and Chief Executive Officer of Rosow & Company, Inc. (private investment company, 1989-2011), a Lead Director of Hudson United Bancorp (2001-2006) and as a Director of TD Banknorth (1996-2006). In addition, Mr. Rosow is a member (2008-present) and President (2009-present) of the Town Council of Palm Beach, Florida. |
Garnett A. Smith (64) |
| Year of Election or Appointment: 2012 Member of the Advisory Board of Fidelity's Equity and High Income Funds. Prior to Mr. Smith's retirement, he served as Chairman and Chief Executive Officer of Inbrand Corp. (manufacturer of personal absorbent products, 1990-1997). He also served as President (1986-1990) of Inbrand Corp. Prior to his employment with Inbrand Corp., he was employed by a retail fabric chain and North Carolina National Bank. In addition, Mr. Smith is a board member of the Jackson Hole Land Trust (2009-present). |
Kenneth B. Robins (42) |
| Year of Election or Appointment: 2008 President and Treasurer of Fidelity's Equity and High Income Funds. Mr. Robins also serves as President and Treasurer (2010-present) and Assistant Treasurer (2009-present) of other Fidelity funds and is an employee of Fidelity Investments (2004-present). Previously, Mr. Robins served as Deputy Treasurer of the Fidelity funds (2005-2008) and Treasurer and Chief Financial Officer of The North Carolina Capital Management Trust: Cash and Term Portfolios (2006-2008). |
Brian B. Hogan (47) |
| Year of Election or Appointment: 2009 Vice President of Equity and High Income Funds. Mr. Hogan also serves as President of FMR's Equity Division (2009-present). Previously, Mr. Hogan served as Senior Vice President, Equity Research of FMR (2006-2009) and as a portfolio manager. |
Christopher S. Bartel (40) |
| Year of Election or Appointment: 2009 Vice President of Fidelity's Sector and Real Estate Equity Funds. Mr. Bartel also serves as a Director, President, and Chief Executive Officer of Fidelity Management & Research (Japan) Inc. (2012-present), a Director of Fidelity Management & Research (Hong Kong) (2012-present), and Senior Vice President of Global Equity Research (2010-present). Previously, Mr. Bartel served as Senior Vice President of Equity Research (2009-2010), Managing Director of Research (2006-2009), and an analyst and portfolio manager (2000-2006). |
Scott C. Goebel (44) |
| Year of Election or Appointment: 2008 Secretary and Chief Legal Officer (CLO) of the Fidelity funds. Mr. Goebel also serves as Secretary of Fidelity Investments Money Management, Inc. (FIMM) (2010-present) and Fidelity Research and Analysis Company (FRAC) (2010-present); Secretary and CLO of The North Carolina Capital Management Trust: Cash and Term Portfolios (2008-present); General Counsel, Secretary, and Senior Vice President of FMR (2008-present) and FMR Co., Inc. (2008-present); employed by FMR LLC or an affiliate (2001-present); Chief Legal Officer of Fidelity Management & Research (Hong Kong) Limited (2008-present) and Assistant Secretary of Fidelity Management & Research (Japan) Inc. (2008-present), and Fidelity Management & Research (U.K.) Inc. (2008-present). Previously, Mr. Goebel served as Assistant Secretary of FIMM (2008-2010), FRAC (2008-2010), and the Funds (2007-2008) and as Vice President and Secretary of Fidelity Distributors Corporation (FDC) (2005-2007). |
William C. Coffey (43) |
| Year of Election or Appointment: 2009 Assistant Secretary of Fidelity's Equity and High Income Funds. Mr. Coffey also serves as Senior Vice President and Deputy General Counsel of FMR LLC (2010-present), and is an employee of Fidelity Investments. Previously, Mr. Coffey served as Vice President and Associate General Counsel of FMR LLC (2005-2009). |
Elizabeth Paige Baumann (44) |
| Year of Election or Appointment: 2012 Anti-Money Laundering (AML) Officer of the Fidelity funds. Ms. Baumann also serves as AML Officer of The North Carolina Capital Management Trust: Cash and Term Portfolios (2012-present), Chief AML Officer of FMR LLC (2012-present), and is an employee of Fidelity Investments. Previously, Ms. Baumann served as Vice President and Deputy Anti-Money Laundering Officer (2007-2012). |
Christine Reynolds (53) |
| Year of Election or Appointment: 2008 Chief Financial Officer of the Fidelity funds. Ms. Reynolds became President of Fidelity Pricing and Cash Management Services (FPCMS) in August 2008. Ms. Reynolds served as Chief Operating Officer of FPCMS (2007-2008). Previously, Ms. Reynolds served as President, Treasurer, and Anti-Money Laundering officer of the Fidelity funds (2004-2007). |
Joseph A. Hanlon (44) |
| Year of Election or Appointment: 2012 Chief Compliance Officer of Fidelity's Equity and High Income Funds. Mr. Hanlon serves as Compliance Officer of FMR, FMR Co., Inc., Fidelity Investments Money Management, Inc. (FIMM), Fidelity Research and Analysis Company (FRAC), Fidelity Management & Research (Japan) Inc., Fidelity Management & Research (U.K.) Inc., Fidelity Management & Research (Hong Kong), and Strategic Advisers, Inc. (2009-present), as Senior Vice President of the Fidelity Asset Management Division (2009-present), and is an employee of Fidelity Investments. |
Joseph F. Zambello (55) |
| Year of Election or Appointment: 2011 Deputy Treasurer of the Fidelity funds. Mr. Zambello is an employee of Fidelity Investments. Previously, Mr. Zambello served as Vice President of FMR's Program Management Group (2009-2011) and Vice President of the Transfer Agent Oversight Group (2005-2009). |
Adrien E. Deberghes (44) |
| Year of Election or Appointment: 2008 Deputy Treasurer of Fidelity's Equity and High Income Funds. Mr. Deberghes also serves as Vice President (2011-present) and Assistant Treasurer (2010-present) of other Fidelity funds, and is an employee of Fidelity Investments (2008-present). Previously, Mr. Deberghes served as Senior Vice President of Mutual Fund Administration at State Street Corporation (2007-2008), Senior Director of Mutual Fund Administration at Investors Bank & Trust (2005-2007), and Director of Finance for Dunkin' Brands (2000-2005). |
Stephanie J. Dorsey (43) |
| Year of Election or Appointment: 2010 Assistant Treasurer of Fidelity's Equity and High Income Funds. Ms. Dorsey also serves as Deputy Treasurer of other Fidelity funds (2008-present) and is an employee of Fidelity Investments (2008-present). Previously, Ms. Dorsey served as Treasurer (2004-2008) of the JPMorgan Mutual Funds and Vice President (2004-2008) of JPMorgan Chase Bank. |
John R. Hebble (54) |
| Year of Election or Appointment: 2009 Assistant Treasurer of Fidelity's Equity and High Income Funds. Mr. Hebble also serves as President (2011-present), Treasurer, and Chief Financial Officer of The North Carolina Capital Management Trust: Cash and Term Portfolios (2008-present), President and Treasurer of other Fidelity funds (2008-present) and is an employee of Fidelity Investments. |
Gary W. Ryan (53) |
| Year of Election or Appointment: 2005 Assistant Treasurer of the Fidelity funds. Mr. Ryan is an employee of Fidelity Investments. Previously, Mr. Ryan served as Vice President of Fund Reporting in Fidelity Pricing and Cash Management Services (FPCMS) (1999-2005). |
Jonathan Davis (44) |
| Year of Election or Appointment: 2010 Assistant Treasurer of the Fidelity funds. Mr. Davis is also Assistant Treasurer of Fidelity Rutland Square Trust II and Fidelity Commonwealth Trust II. Mr. Davis is an employee of Fidelity Investments. Previously, Mr. Davis served as Vice President and Associate General Counsel of FMR LLC (2003-2010). |
Annual Report
Distributions (Unaudited)
The Board of Trustees of Fidelity Advisor International Real Estate Fund voted to pay on September 10, 2012, to shareholders of record at the opening of business on September 7, 2012, a distribution of $0.113 per share derived from capital gains realized from sales of portfolio securities, and a dividend of $0.127 per share from net investment income.
Institutional Class designates 18% and 32% of the dividends distributed in September and December, respectively during the fiscal year as amounts which may be taken into account as a dividend for the purposes of the maximum rate under section 1(h)(11) of the Internal Revenue Code.
The amounts per share which represent income derived from sources within, and taxes paid to, foreign countries or possessions of the United States are as follows:
Pay Date | Income | Taxes |
09/09/11 | $.324 | $.0089 |
12/16/11 | $.056 | $.0030 |
The fund will notify shareholders in January 2013 of amounts for use in preparing 2012 income tax returns.
Annual Report
Board Approval of Investment Advisory Contracts and Management Fees
Fidelity International Real Estate Fund
Each year, the Board of Trustees, including the Independent Trustees (together, the Board), votes on the renewal of the management contract and sub-advisory agreements (together, the Advisory Contracts) for the fund. The Board, assisted by the advice of fund counsel and Independent Trustees' counsel, requests and considers a broad range of information relevant to the renewal of the Advisory Contracts throughout the year.
The Board meets regularly and, at each of its meetings, considers factors that are relevant to its annual consideration of the renewal of the fund's Advisory Contracts, including the services and support provided to the fund and its shareholders. The Board has established various standing committees, each composed of and chaired by Independent Trustees with varying backgrounds, to which the Board has assigned specific subject matter responsibilities in order to enhance effective decision-making by the Board. The Board, acting directly and through its Committees, requests and receives information concerning the annual consideration of the renewal of the fund's Advisory Contracts. The Board also meets as needed to consider matters specifically related to the Board's annual consideration of the renewal of Advisory Contracts. Members of the Board may also meet with trustees of other Fidelity funds through ad hoc joint committees to discuss certain matters relevant to the Fidelity funds.
At its July 2012 meeting, the Board of Trustees, including the Independent Trustees, unanimously determined to renew the fund's Advisory Contracts. In reaching its determination, the Board considered all factors it believed relevant, including (i) the nature, extent, and quality of the services to be provided to the fund and its shareholders (including the investment performance of the fund); (ii) the competitiveness of the fund's management fee and total expense ratio relative to peer funds; (iii) the total costs of the services to be provided by and the profits to be realized by Fidelity from its relationship with the fund; (iv) the extent to which economies of scale exist and would be realized as the fund grows; and (v) whether fee levels reflect these economies of scale, if any, for the benefit of fund shareholders.
In considering whether to renew the Advisory Contracts for the fund, the Board reached a determination, with the assistance of fund counsel and Independent Trustees' counsel and through the exercise of its business judgment, that the renewal of the Advisory Contracts is in the best interests of the fund and its shareholders and that the compensation payable under the Advisory Contracts is fair and reasonable. The Board's decision to renew the Advisory Contracts was not based on any single factor, but rather was based on a comprehensive consideration of all the information provided to the Board at its meetings throughout the year. The Board, in reaching its determination to renew the Advisory Contracts, is aware that shareholders in the fund have a broad range of investment choices available to them, including a wide choice among mutual funds offered by Fidelity's competitors, and that the fund's shareholders, who have the opportunity to review and weigh the disclosure provided by the fund in its prospectus and other public disclosures, have chosen to invest in this fund, managed by Fidelity.
Annual Report
Board Approval of Investment Advisory Contracts and
Management Fees - continued
Nature, Extent, and Quality of Services Provided. The Board considered the staffing within the investment adviser, FMR, and the sub-advisers (together, the Investment Advisers), including the backgrounds of the fund's investment personnel, and also considered the fund's investment objective, strategies, and related investment philosophy. The Independent Trustees also had discussions with senior management of Fidelity's investment operations and investment groups. The Board considered the structure of the portfolio manager compensation program and whether this structure provides appropriate incentives to act in the best interests of the fund.
Resources Dedicated to Investment Management and Support Services. The Board and the Fund Oversight and Research Committees reviewed the general qualifications and capabilities of the Investment Advisers' investment staff, including its size, education, experience, and resources, as well as the Investment Advisers' approach to recruiting, training, managing, and compensating investment personnel. The Board also noted that FMR has continued to increase the resources devoted to non-U.S. offices, including expansion of Fidelity's global investment organization. The Board noted that Fidelity's analysts have extensive resources, tools and capabilities that allow them to conduct sophisticated quantitative and fundamental analysis, as well as credit analysis of issuers, counterparties and guarantors. The Board also believes that Fidelity's investment professionals have sufficient access to global information and data so as to provide competitive investment results over time, and that those professionals also have access to sophisticated tools that permit them to assess portfolio construction and risk and performance attribution characteristics continuously, as well as to transmit new information and research conclusions rapidly around the world. Additionally, in its deliberations, the Board considered the Investment Advisers' trading and risk management capabilities and resources, which are an integral part of the investment management process.
Shareholder and Administrative Services. The Board considered (i) the nature, extent, quality, and cost of advisory, administrative, and shareholder services performed by the Investment Advisers and their affiliates under the Advisory Contracts and under separate agreements covering transfer agency, pricing and bookkeeping, and securities lending services for the fund; (ii) the nature and extent of the supervision of third party service providers, principally custodians and subcustodians; and (iii) the resources devoted to, and the record of compliance with, the fund's compliance policies and procedures. The Board also reviewed the allocation of fund brokerage, including allocations to brokers affiliated with the Investment Advisers, the use of brokerage commissions to pay fund expenses, and the use of "soft" commission dollars to pay for research services.
Annual Report
The Board noted that the growth of fund assets over time across the complex allows Fidelity to reinvest in the development of services designed to enhance the value or convenience of the Fidelity funds as investment vehicles. These services include 24-hour access to account information and market information through telephone representatives and over the Internet, investor education materials and asset allocation tools, and the expanded availability of Fidelity Investor Centers.
Investment in a Large Fund Family. The Board considered the benefits to shareholders of investing in a Fidelity fund, including the benefits of investing in a fund that is part of a large family of funds offering a variety of investment disciplines and providing a large variety of mutual fund investor services. The Board noted that Fidelity had taken, or had made recommendations that resulted in the Fidelity funds taking, a number of actions over the previous year that benefited particular funds, including (i) continuing to dedicate additional resources to investment research and support of the senior management team that oversees asset management; (ii) persisting in efforts to enhance Fidelity's research capabilities, in particular, international research; (iii) launching new funds and making other enhancements to meet client needs for global and income-oriented solutions; (iv) continuing to launch dedicated lower cost underlying funds to meet investment management's portfolio construction needs related to expanding underlying fund options, specifically for the Freedom Fund product lines; (v) adopting a "Stock Selector" sector neutral investment approach and employing a team of portfolio managers who are sector specialists to manage certain funds; (vi) rationalizing product lines and gaining increased efficiencies through the mergers of several funds into other funds; (vii) strengthening the Spartan Index Fund product line by adding new funds and/or new low-cost institutional share classes, restructuring fund expenses to accommodate new classes, and reducing investment minimums for certain classes of shares; (viii) modifying the eligibility criteria for Institutional Class shares to increase their appeal to government entities and charitable investors; and (ix) reducing certain transfer agent fee rates.
Investment Performance. The Board considered whether the fund has operated in accordance with its investment objective, as well as its record of compliance with its investment restrictions. It also reviewed the fund's absolute investment performance for each class, as well as the fund's relative investment performance for each class measured over multiple periods against a broad-based securities market index. The Board noted that FMR believes that no meaningful peer group exists for the fund principally because most other funds in the fund's third-party peer group focus on different industries or sectors than the fund. The following charts considered by the Board show, over the one-, three-, and five-year periods ended December 31, 2011, as available, the cumulative total returns of the retail class and Class B of the fund and the cumulative total returns of a broad-based securities market index ("benchmark"). The returns of the retail class and Class B show the performance of the highest performing class (based on five-year performance) and the lowest performing class (based on three-year performance), respectively.
Annual Report
Board Approval of Investment Advisory Contracts and
Management Fees - continued
Fidelity International Real Estate Fund
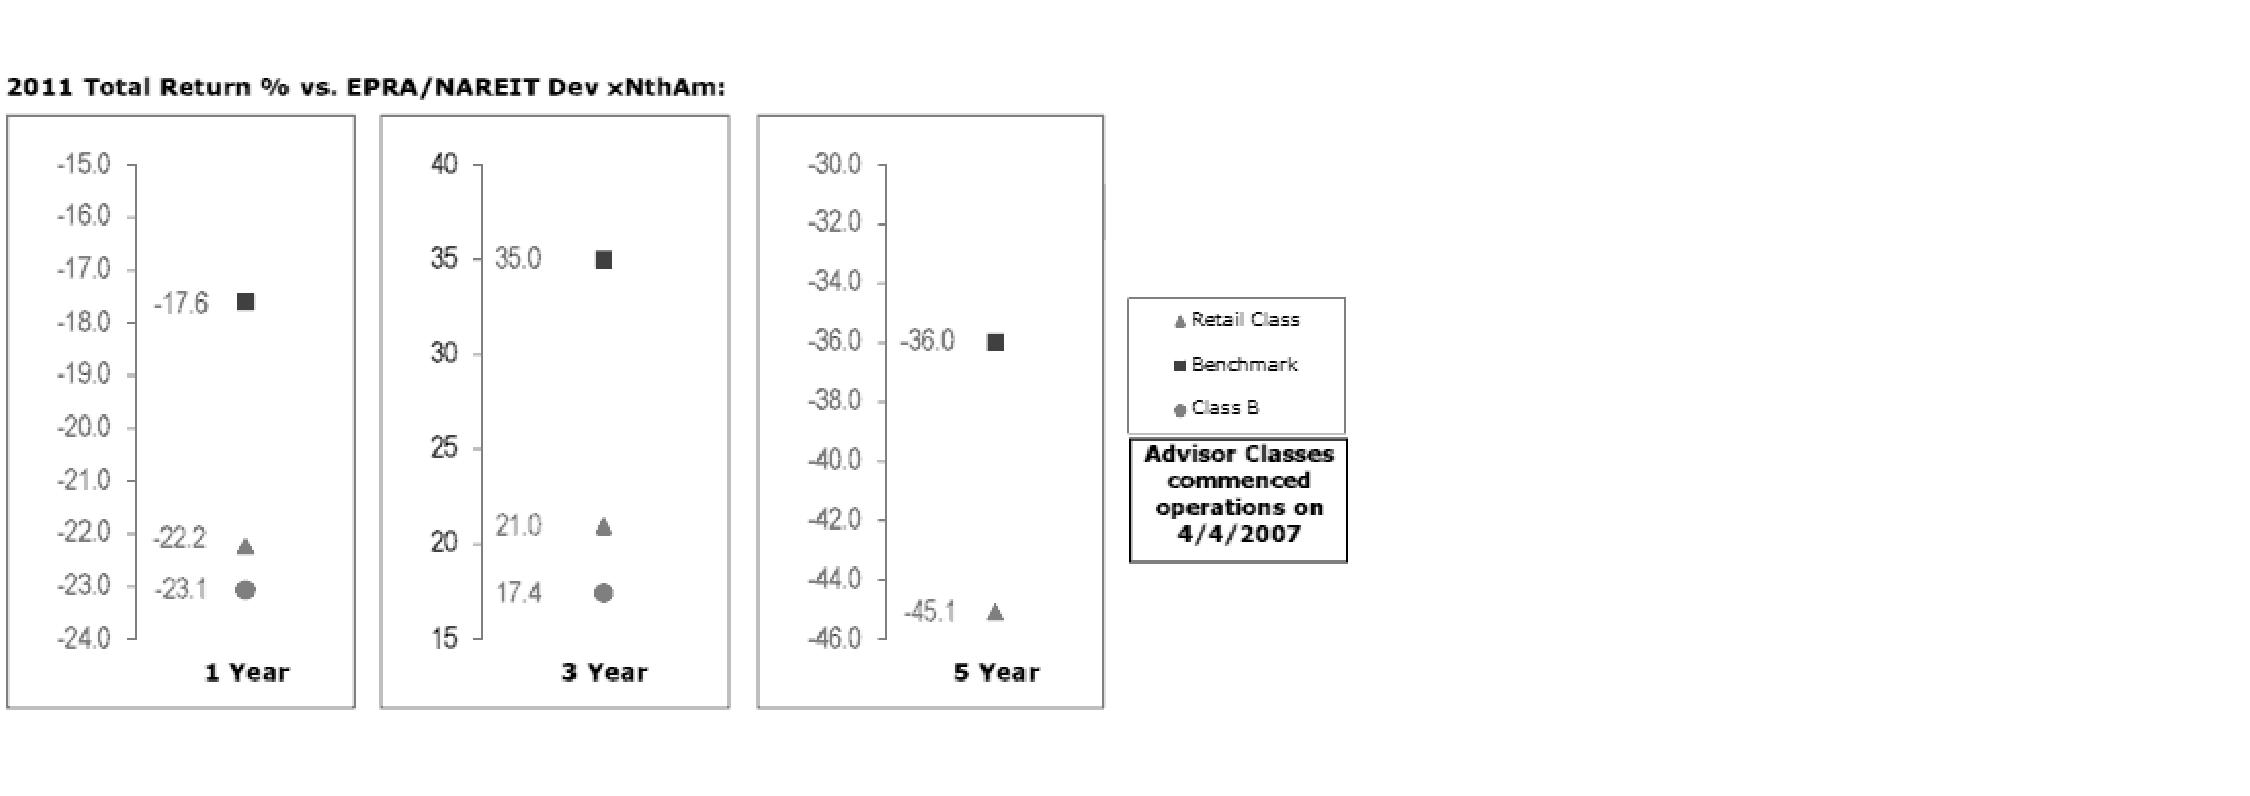
The Board noted that the investment performance of the fund was lower than its benchmark for all the periods shown. The Board considered that the variations in performance among the fund's classes reflect the variations in class expenses, which result in lower performance for higher expense classes. The Board discussed with FMR actions to improve the fund's below-benchmark performance. The Board noted that this fund had underperformed in the past and discussed with FMR its disappointment with the continued underperformance of the fund. The Board also reviewed the fund's performance since inception as well as performance in the current year. The Board will continue to closely monitor the performance of the fund in the coming year and discuss with FMR other appropriate actions to address the performance of the fund.
Based on its review, the Board concluded that the nature, extent, and quality of services provided to the fund under the Advisory Contracts should benefit the fund's shareholders.
Competitiveness of Management Fee and Total Expense Ratio. The Board considered the fund's management fee and total expense ratio compared to "mapped groups" of competitive funds and classes. Fidelity creates "mapped groups" by combining similar Lipper investment objective categories that have comparable management fee characteristics. Combining Lipper investment objective categories aids the Board's management fee and total expense ratio comparisons by broadening the competitive group used for comparison and by reducing the number of universes to which various Fidelity funds are compared.
Annual Report
Management Fee. The Board considered two proprietary management fee comparisons for the 12-month periods shown in the chart below. The group of Lipper funds used by the Board for management fee comparisons is referred to below as the "Total Mapped Group." The Total Mapped Group comparison focuses on a fund's standing relative to the total universe of comparable funds available to investors in terms of gross management fees before expense reimbursements or caps. "TMG %" represents the percentage of funds in the Total Mapped Group that had management fees that were lower than the fund's. For example, a TMG % of 31% means that 69% of the funds in the Total Mapped Group had higher management fees than the fund. The "Asset-Size Peer Group" (ASPG) comparison focuses on a fund's standing relative to non-Fidelity funds similar in size to the fund within the Total Mapped Group. The ASPG represents at least 15% of the funds in the Total Mapped Group with comparable asset size and management fee characteristics, subject to a minimum of 50 funds (or all funds in the Total Mapped Group if fewer than 50). Additional information, such as the ASPG quartile in which the fund's management fee ranked, is also included in the chart and considered by the Board.
Fidelity International Real Estate Fund

The Board noted that the fund's management fee ranked below the median of its Total Mapped Group and below the median of its ASPG for 2011.
Based on its review, the Board concluded that the fund's management fee is fair and reasonable in light of the services that the fund receives and the other factors considered.
Total Expense Ratio. In its review of each class's total expense ratio, the Board considered the fund's management fee as well as other fund or class expenses, as applicable, such as transfer agent fees, pricing and bookkeeping fees, fund-paid 12b-1 fees, and custodial, legal, and audit fees. The Board also noted the effects of any waivers and reimbursements on fees and expenses. As part of its review, the Board also considered the current and historical total expense ratios of each class of the fund compared to competitive fund median expenses. Each class of the fund is compared to those funds and classes in the Total Mapped Group (used by the Board for management fee comparisons) that have a similar sales load structure.
Annual Report
Board Approval of Investment Advisory Contracts and
Management Fees - continued
The Board noted that the total expense ratio of each of Class A and the retail class ranked below its competitive median for 2011 and the total expense ratio of each of Class T, Class B, Class C and Institutional Class ranked above its competitive median for 2011. The Board considered that various factors, including 12b-1 fees, positive or negative performance adjustments, and relatively higher other expenses in the case of small fund size, can affect total expense ratios. The Board noted that the total expense ratio of Class T was above the competitive median primarily because of higher 12b-1 fees on Class T. Class T has a higher 12b-1 fee, but a lower front-end sales charge, than traditionally priced front-end sales charge classes. The Board considered that Class T is primarily sold load-waived in the retirement plan market where its 0.50% 12b-1 fee is comparable to competing no-load, higher 12b-1 fee classes designed specifically for retirement plans. The Board noted that the fund offers multiple classes, each of which has a different sales load and 12b-1 fee structure, and that the multiple structures are intended to offer a range of pricing options for the intermediary market. The Board also noted that the total expense ratios of the classes vary primarily by the level of their 12b-1 fees, although differences in transfer agent fees may also cause expenses to vary from class to class.
Fees Charged to Other Fidelity Clients. The Board also considered Fidelity fee structures and other information with respect to clients of FMR and its affiliates, such as other mutual funds advised or subadvised by FMR or its affiliates, pension plan clients, and other institutional clients. The Board noted the findings of the 2010 ad hoc joint committee (created with the board of other Fidelity funds), which reviewed and compared Fidelity's institutional investment advisory business with its business of providing services to the Fidelity funds, including the differences in services provided, fees charged, and costs incurred, as well as competition in their respective marketplaces.
Based on its review of total expense ratios and fees charged to other Fidelity clients, the Board concluded that the total expense ratio of each class of the fund was reasonable, although in some cases above the median of the universe presented for comparison, in light of the services that the fund and its shareholders receive and the other factors considered.
Costs of the Services and Profitability. The Board considered the revenues earned and the expenses incurred by Fidelity in conducting the business of developing, marketing, distributing, managing, administering and servicing the fund and its shareholders. The Board also considered the level of Fidelity's profits in respect of all the Fidelity funds.
Annual Report
On an annual basis, FMR presents to the Board Fidelity's profitability for the fund. Fidelity calculates the profitability for each fund, as well as aggregate profitability for groups of Fidelity funds and all Fidelity funds, using a series of detailed revenue and cost allocation methodologies which originate with the books and records of Fidelity on which Fidelity's audited financial statements are based. The Audit Committee of the Board reviews any significant changes from the prior year's methodologies.
PricewaterhouseCoopers LLP (PwC), independent registered public accounting firm and auditor to Fidelity and certain Fidelity funds, has been engaged annually by the Board as part of the Board's assessment of Fidelity's profitability analysis. PwC's engagement includes the review and assessment of Fidelity's methodologies used in determining the revenues and expenses attributable to Fidelity's mutual fund business, and completion of agreed-upon procedures surrounding the mathematical accuracy of fund profitability and its conformity to allocation methodologies. After considering PwC's reports issued under the engagement and information provided by Fidelity, the Board concluded that while other allocation methods may also be reasonable, Fidelity's profitability methodologies are reasonable in all material respects.
The Board also reviewed Fidelity's non-fund businesses and fall-out benefits related to the mutual fund business as well as cases where Fidelity's affiliates may benefit from or be related to the fund's business.
The Board considered the costs of the services provided by and the profits realized by Fidelity in connection with the operation of the fund and was satisfied that the profitability was not excessive in the circumstances.
Economies of Scale. The Board considered whether there have been economies of scale in respect of the management of the Fidelity funds, whether the Fidelity funds (including the fund) have appropriately benefited from any such economies of scale, and whether there is potential for realization of any further economies of scale. The Board considered the extent to which the fund will benefit from economies of scale through increased services to the fund, through waivers or reimbursements, or through fee or expense reductions. The Board also noted that in 2009, it and the board of other Fidelity funds created an ad hoc committee (the Economies of Scale Committee) to analyze whether FMR attains economies of scale in respect of the management and servicing of the Fidelity funds, whether the Fidelity funds have appropriately benefited from such economies of scale, and whether there is potential for realization of any further economies of scale.
The Board recognized that the fund's management contract incorporates a "group fee" structure, which provides for lower group fee rates as total fund assets under FMR's management increase, and for higher group fee rates as total fund assets under FMR's management decrease. FMR calculates the group fee rates based on a tiered asset "breakpoint" schedule that varies based on asset class. The Board considered that the group fee is designed to deliver the benefits of economies of scale to fund shareholders when total Fidelity fund assets increase, even if assets of any particular fund are unchanged or have declined, because some portion of Fidelity's costs are attributable to services provided to all Fidelity funds, and all funds benefit if those costs can be allocated among more assets. The Board concluded that, given the group fee structure, fund shareholders will benefit from lower management fees as assets under FMR's management increase at the fund complex level, regardless of whether Fidelity achieves any such economies of scale.
Annual Report
Board Approval of Investment Advisory Contracts and
Management Fees - continued
The Board concluded, taking into account the analysis of the Economies of Scale Committee, that economies of scale, if any, are being appropriately shared between fund shareholders and Fidelity.
Additional Information Requested by the Board. In order to develop fully the factual basis for consideration of the Fidelity funds' Advisory Contracts, the Board requested and received additional information on certain topics, including (i) fund performance trends, actions to be taken by FMR to improve certain funds' overall performance, and Fidelity's long-term strategies for certain funds; (ii) the potential to further rationalize the Fidelity fund lineup with the possibility of achieving savings for the funds and Fidelity; (iii) Fidelity's compensation structure for portfolio managers and other key investment personnel; (iv) the amount of the investment that each portfolio manager has made in the Fidelity fund(s) that he or she manages; (v) the realization of fall-out benefits in certain Fidelity business units; (vi) Fidelity's group fee structures, the potential impact of regulatory changes on such structures, and the rationale for the individual fee rates of certain funds; (vii) fund profitability methodology, including Fidelity's cost allocation methodology, and the impact of certain factors on fund profitability results; (viii) trends regarding industry use of performance fee structures and the possibility of implementing performance fee structures for additional funds; and (ix) the impact of net redemptions from the Fidelity funds.
Based on its evaluation of all of the conclusions noted above, and after considering all factors it believed relevant, the Board ultimately concluded that the advisory fee structures are fair and reasonable, and that the fund's Advisory Contracts should be renewed.
Annual Report
Investment Adviser
Fidelity Management & Research Company
Boston, MA
Investment Sub-Advisers
FMR Co., Inc.
Fidelity Management & Research
(U.K.) Inc.
FIL Investments (Japan) Limited
FIL Investment Advisers
FIL Investment Advisers (UK) Ltd.
Fidelity Management & Research
(Hong Kong) Limited
Fidelity Management & Research
(Japan) Inc.
General Distributor
Fidelity Distributors Corporation
Smithfield, RI
Transfer and Service Agents
Fidelity Investments Institutional
Operations Company, Inc.
Boston, MA
Fidelity Service Company, Inc.
Boston, MA
Custodian
The Bank of New York Mellon
New York, NY
(Fidelity Investment logo)(registered trademark)
Corporate Headquarters
82 Devonshire St., Boston, MA 02109
www.fidelity.com
AIREI-UANN-0912
1.843171.105
Fidelity®
Small Cap Value
Fund
Annual Report
July 31, 2012
(Fidelity Cover Art)
Contents
Performance | (Click Here) | How the fund has done over time. |
Management's Discussion of Fund Performance | (Click Here) | The Portfolio Manager's review of fund performance and strategy. |
Shareholder Expense Example | (Click Here) | An example of shareholder expenses. |
Investment Changes | (Click Here) | A summary of major shifts in the fund's investments over the past six months. |
Investments | (Click Here) | A complete list of the fund's investments with their market values. |
Financial Statements | (Click Here) | Statements of assets and liabilities, operations, and changes in net assets, as well as financial highlights. |
Notes | (Click Here) | Notes to the financial statements. |
Report of Independent Registered Public Accounting Firm | (Click Here) | |
Trustees and Officers | (Click Here) | |
Distributions | (Click Here) | |
Board Approval of Investment Advisory Contracts and Management Fees | (Click Here) | |
To view a fund's proxy voting guidelines and proxy voting record for the 12-month period ended June 30, visit http://www.fidelity.com/proxyvotingresults or visit the Securities and Exchange Commission's (SEC) web site at http://www.sec.gov. You may also call 1-800-544-8544 to request a free copy of the proxy voting guidelines.
Standard & Poor's, S&P and S&P 500 are registered service marks of The McGraw-Hill Companies, Inc. and have been licensed for use by Fidelity Distributors Corporation.
Other third party marks appearing herein are the property of their respective owners.
All other marks appearing herein are registered or unregistered trademarks or service marks of FMR LLC or an affiliated company. © 2012 FMR LLC. All rights reserved.
Annual Report
This report and the financial statements contained herein are submitted for the general information of the shareholders of the fund. This report is not authorized for distribution to prospective investors in the fund unless preceded or accompanied by an effective prospectus.
A fund files its complete schedule of portfolio holdings with the SEC for the first and third quarters of each fiscal year on Form N-Q. Forms N-Q are available on the SEC's web site at http://www.sec.gov. A fund's Forms N-Q may be reviewed and copied at the SEC's Public Reference Room in Washington, DC. Information regarding the operation of the SEC's Public Reference Room may be obtained by calling 1-800-SEC-0330. For a complete list of a fund's portfolio holdings, view the most recent holdings listing, semiannual report, or annual report on Fidelity's web site at http://www.fidelity.com, http://www.advisor.fidelity.com, or http://www.401k.com, as applicable.
NOT FDIC INSURED • MAY LOSE VALUE • NO BANK GUARANTEE
Neither the fund nor Fidelity Distributors Corporation is a bank.
Annual Report
Average annual total return reflects the change in the value of an investment, assuming reinvestment of the class' distributions from dividend income and capital gains (the profits earned upon the sale of securities that have grown in value, if any) and assuming a constant rate of performance each year. The $10,000 table and the fund's returns do not reflect the deduction of taxes that a shareholder would pay on fund distributions or the redemption of fund shares. During periods of reimbursement by Fidelity, a fund's total return will be greater than it would be had the reimbursement not occurred. How a fund did yesterday is no guarantee of how it will do tomorrow.
Average Annual Total Returns
Periods ended July 31, 2012 | Past 1
year | Past 5
years | Life of
fundA |
Fidelity® Small Cap Value Fund | 3.67% | 3.92% | 8.62% |
A From November 3, 2004.
$10,000 Over Life of Fund
Let's say hypothetically that $10,000 was invested in Fidelity® Small Cap Value Fund, a class of the fund, on November 3, 2004, when the fund started. The chart shows how the value of your investment would have changed, and also shows how the Russell 2000® Value Index performed over the same period.
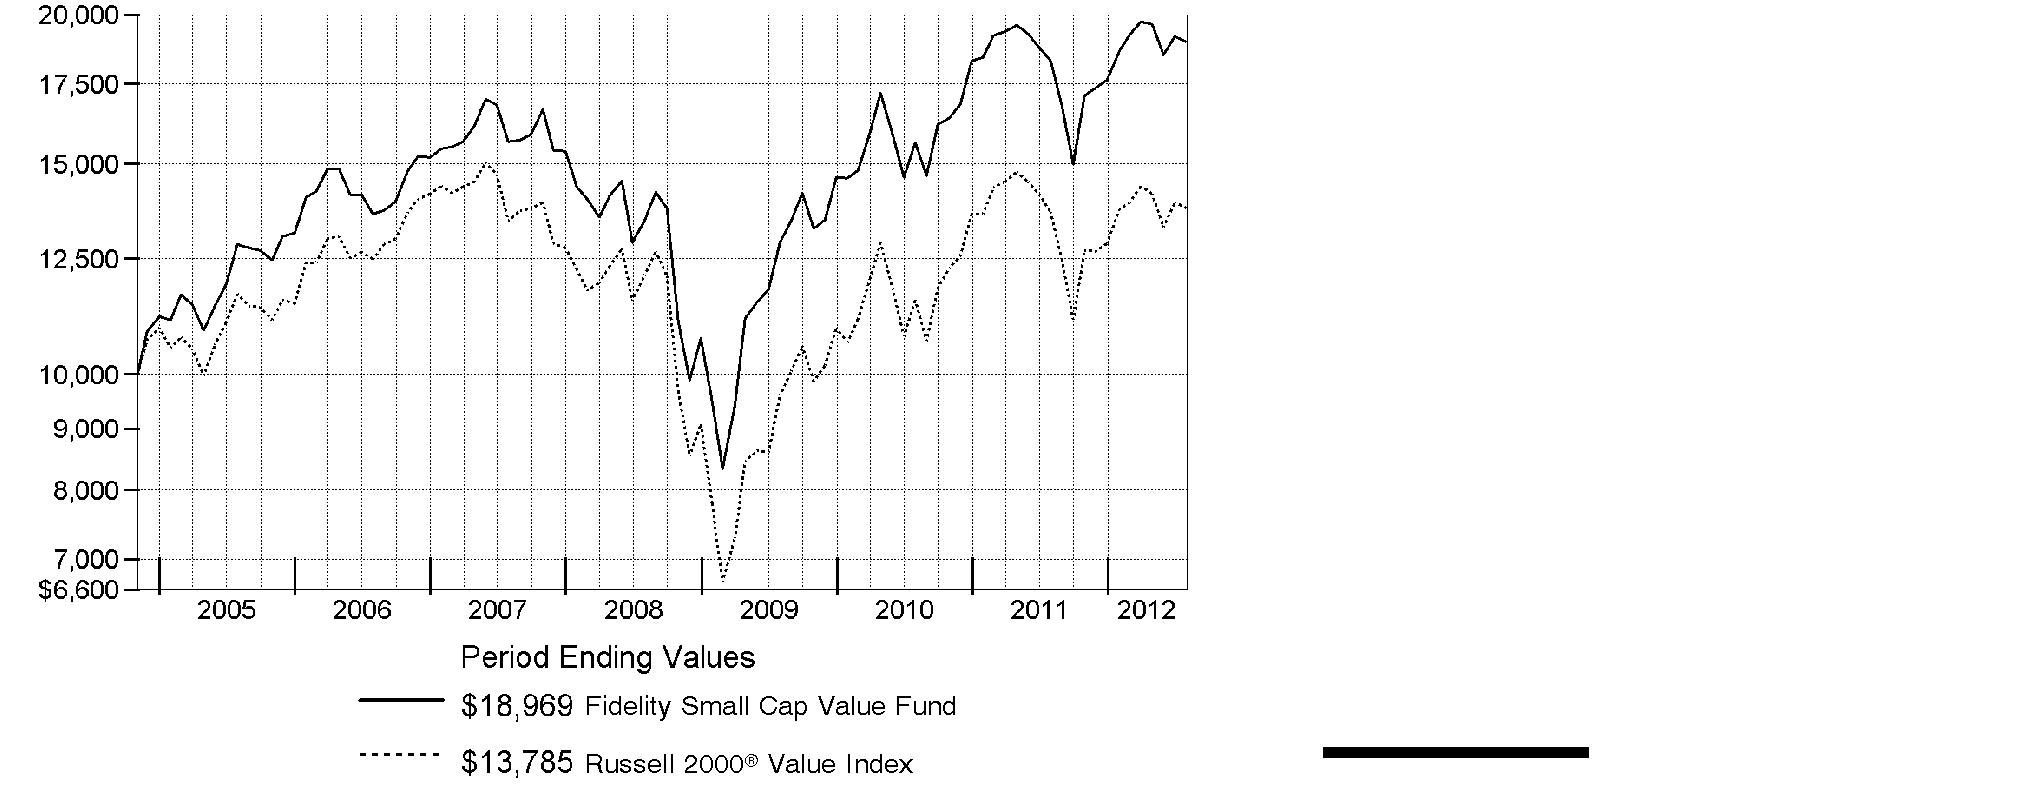
Annual Report
Market Recap: Major U.S. equity benchmarks posted solid gains for the year ending July 31, 2012, amid an uncertain investment environment. The broad-based S&P 500® Index returned 9.13%, while the blue-chip-laden Dow Jones Industrial AverageSM and technology-heavy Nasdaq Composite® Index gained 10.12% and 7.83%, respectively. Volatility spiked during the period's first half, as equities plummeted late last summer on Europe's debt woes, political wrangling over the U.S. debt ceiling, and the sovereign credit-rating downgrade that followed. By October, a seemingly improved U.S. economy rejuvenated stocks, paving the way for major equity benchmarks to post their best first-quarter performance since 1998. However, more eurozone trouble, signs that the U.S. economy had turned sluggish and a slowdown in China caused stocks to slip in May, before a new wave of optimism took hold in June and July. Within the S&P 500®, more-defensive sectors such as telecommunication services (+30%) and consumer staples (+20%) fared best, while materials and energy significantly underperformed, returning -5%. Small- and mid-cap stocks trailed their less-volatile large-cap counterparts, with the Russell 2000® Index adding 0.19% and the Russell Midcap® Index rising 2.28%. Given turmoil and local currency weakness in Europe, foreign developed-markets stocks lost ground, with the MSCI® EAFE® Index returning -11.32%.
Comments from Charles Myers, Portfolio Manager of Fidelity® Small Cap Value Fund: For the year, the fund's Retail Class shares gained 3.67%, compared with 0.89% for the Russell 2000® Value Index. On the positive side, stock picking stood out in the consumer discretionary sector, with homebuilders Ryland Group, M.D.C. Holdings and Meritage Homes all adding to results. In industrials, my choices in commercial/professional services and capital goods helped, led by H&E Equipment Services, which rents commercial construction equipment, and commercial furniture manufacturer HNI, the fund's top relative contributor of the year. In health care, managed-care company Centene added value, as did Team Health Holdings, a provider of outsourced clinical services to hospitals. Conversely, by far the most detrimental sector in the portfolio was financials, led on the downside by regional bank TCF Financial. In the energy sector, Superior Energy Services, a provider of oil-field services, and independent oil producer Berry Petroleum were hampered by declining energy prices. Other relative detractors included banana producer Chiquita Brands International and United Stationers, a wholesaler of office stationery and business supplies. Several stocks mentioned were not in the index, and Centene was not held at period end.
The views expressed above reflect those of the portfolio manager(s) only through the end of the period as stated on the cover of this report and do not necessarily represent the views of Fidelity or any other person in the Fidelity organization. Any such views are subject to change at any time based upon market or other conditions and Fidelity disclaims any responsibility to update such views. These views may not be relied on as investment advice and, because investment decisions for a Fidelity fund are based on numerous factors, may not be relied on as an indication of trading intent on behalf of any Fidelity fund.
Annual Report
Shareholder Expense Example
As a shareholder of the Fund, you incur two types of costs: (1) transaction costs, including sales charges (loads) on purchase payments or redemption proceeds, redemption fees and (2) ongoing costs, including management fees, distribution and/or service (12b-1) fees and other Fund expenses. This Example is intended to help you understand your ongoing costs (in dollars) of investing in the Fund and to compare these costs with the ongoing costs of investing in other mutual funds.
The Example is based on an investment of $1,000 invested at the beginning of the period and held for the entire period (February 1, 2012 to July 31, 2012).
Actual Expenses
The first line of the accompanying table for each class of the Fund provides information about actual account values and actual expenses. You may use the information in this line, together with the amount you invested, to estimate the expenses that you paid over the period. Simply divide your account value by $1,000.00 (for example, an $8,600 account value divided by $1,000.00 = 8.6), then multiply the result by the number in the first line for a class of the Fund under the heading entitled "Expenses Paid During Period" to estimate the expenses you paid on your account during this period. A small balance maintenance fee of $12.00 that is charged once a year may apply for certain accounts with a value of less than $2,000. This fee is not included in the table below. If it was, the estimate of expenses you paid during the period would be higher, and your ending account value lower, by this amount. In addition, the Fund, as a shareholder in the underlying Fidelity Central Funds, will indirectly bear its pro-rata share of the fees and expenses incurred by the underlying Fidelity Central Funds. These fees and expenses are not included in the Fund's annualized expense ratio used to calculate the expense estimate in the table below.
Hypothetical Example for Comparison Purposes
The second line of the accompanying table for each class of the Fund provides information about hypothetical account values and hypothetical expenses based on a Class' actual expense ratio and an assumed rate of return of 5% per year before expenses, which is not the Class' actual return. The hypothetical account values and expenses may not be used to estimate the actual ending account balance or expenses you paid for the period. You may use this information to compare the ongoing costs of investing in the Fund and other funds. To do so, compare this 5% hypothetical example with the 5% hypothetical examples that appear in the shareholder reports of the other funds. A small balance maintenance fee of $12.00 that is charged once a year may apply for certain accounts with a value of less than $2,000. This fee is not included in the table below. If it was, the estimate of expenses you paid during the period would be higher, and your ending account value lower, by this amount. In addition, the Fund, as a shareholder in the underlying Fidelity Central Funds, will indirectly bear its pro-rata share of the fees and expenses incurred by the underlying Fidelity Central Funds. These fees and expenses are not included in the Fund's annualized expense ratio used to calculate the expense estimate in the table below.
Please note that the expenses shown in the table are meant to highlight your ongoing costs only and do not reflect any transaction costs. Therefore, the second line of the table is useful in comparing ongoing costs only, and will not help you determine the relative total costs of owning different funds. In addition, if these transactional costs were included, your costs would have been higher.
Annual Report
Shareholder Expense Example - continued
| Annualized
Expense Ratio | Beginning
Account Value
February 1, 2012 | Ending
Account Value
July 31, 2012 | Expenses Paid
During Period*
February 1, 2012
to July 31, 2012 |
Class A | 1.41% | | | |
Actual | | $ 1,000.00 | $ 1,015.70 | $ 7.07 |
HypotheticalA | | $ 1,000.00 | $ 1,017.85 | $ 7.07 |
Class T | 1.63% | | | |
Actual | | $ 1,000.00 | $ 1,015.20 | $ 8.17 |
HypotheticalA | | $ 1,000.00 | $ 1,016.76 | $ 8.17 |
Class B | 2.16% | | | |
Actual | | $ 1,000.00 | $ 1,012.10 | $ 10.81 |
HypotheticalA | | $ 1,000.00 | $ 1,014.12 | $ 10.82 |
Class C | 2.16% | | | |
Actual | | $ 1,000.00 | $ 1,012.80 | $ 10.81 |
HypotheticalA | | $ 1,000.00 | $ 1,014.12 | $ 10.82 |
Small Cap Value | 1.09% | | | |
Actual | | $ 1,000.00 | $ 1,018.30 | $ 5.47 |
HypotheticalA | | $ 1,000.00 | $ 1,019.44 | $ 5.47 |
Class F | .87% | | | |
Actual | | $ 1,000.00 | $ 1,018.90 | $ 4.37 |
HypotheticalA | | $ 1,000.00 | $ 1,020.54 | $ 4.37 |
Institutional Class | 1.11% | | | |
Actual | | $ 1,000.00 | $ 1,017.60 | $ 5.57 |
HypotheticalA | | $ 1,000.00 | $ 1,019.34 | $ 5.57 |
A 5% return per year before expenses
* Expenses are equal to each Class' annualized expense ratio, multiplied by the average account value over the period, multiplied by 182/366 (to reflect the one-half year period).
Annual Report
Investment Changes (Unaudited)
Top Ten Stocks as of July 31, 2012 |
| % of fund's
net assets | % of fund's net assets
6 months ago |
Superior Energy Services, Inc. | 3.0 | 1.7 |
DCT Industrial Trust, Inc. | 2.8 | 2.7 |
TCF Financial Corp. | 2.7 | 2.4 |
HNI Corp. | 2.7 | 3.0 |
Berry Petroleum Co. Class A | 2.6 | 1.9 |
Hanesbrands, Inc. | 2.6 | 0.0 |
Team Health Holdings, Inc. | 2.5 | 1.9 |
Platinum Underwriters Holdings Ltd. | 2.4 | 2.3 |
WESCO International, Inc. | 2.4 | 3.3 |
GrafTech International Ltd. | 2.3 | 0.0 |
| 26.0 | |
Top Five Market Sectors as of July 31, 2012 |
| % of fund's
net assets | % of fund's net assets
6 months ago |
Financials | 35.8 | 35.6 |
Industrials | 14.1 | 15.2 |
Consumer Discretionary | 14.0 | 13.5 |
Information Technology | 11.0 | 11.5 |
Health Care | 6.6 | 7.9 |
Asset Allocation (% of fund's net assets) |
As of July 31, 2012* | As of January 31, 2012** |
 | Stocks 100.0% | | | Stocks 99.9% | |
 | Short-Term
Investments and
Net Other Assets
(Liabilities) † 0.0% | |  | Short-Term
Investments and
Net Other Assets
(Liabilities) 0.1% | |
* Foreign investments | 9.8% | | ** Foreign investments | 9.1% | |
† Amount represents less than 0.1%

Annual Report
Investments July 31, 2012
Showing Percentage of Net Assets
Common Stocks - 98.7% |
| Shares | | Value |
CONSUMER DISCRETIONARY - 13.5% |
Diversified Consumer Services - 2.0% |
Regis Corp. (e) | 3,100,000 | | $ 52,452,000 |
Household Durables - 6.1% |
KB Home (d) | 3,303,800 | | 30,527,112 |
M.D.C. Holdings, Inc. | 800,000 | | 25,488,000 |
Meritage Homes Corp. (a) | 700,000 | | 24,570,000 |
Ryland Group, Inc. | 1,375,000 | | 32,835,000 |
Tempur-Pedic International, Inc. (a)(d) | 1,800,000 | | 51,282,000 |
| | 164,702,112 |
Media - 1.3% |
Valassis Communications, Inc. (a)(d) | 1,584,641 | | 35,733,655 |
Specialty Retail - 1.5% |
Asbury Automotive Group, Inc. (a) | 800,000 | | 20,928,000 |
Tsutsumi Jewelry Co. Ltd. | 791,400 | | 18,561,365 |
| | 39,489,365 |
Textiles, Apparel & Luxury Goods - 2.6% |
Hanesbrands, Inc. (a) | 2,300,000 | | 69,046,000 |
TOTAL CONSUMER DISCRETIONARY | | 361,423,132 |
CONSUMER STAPLES - 3.7% |
Food Products - 2.2% |
Chiquita Brands International, Inc. (a)(d)(e) | 3,375,000 | | 17,482,500 |
Dean Foods Co. (a) | 3,450,000 | | 42,676,500 |
| | 60,159,000 |
Household Products - 1.5% |
Spectrum Brands Holdings, Inc. | 1,100,000 | | 40,513,000 |
TOTAL CONSUMER STAPLES | | 100,672,000 |
ENERGY - 5.6% |
Energy Equipment & Services - 3.0% |
Superior Energy Services, Inc. (a) | 3,800,000 | | 82,345,999 |
Oil, Gas & Consumable Fuels - 2.6% |
Berry Petroleum Co. Class A | 1,825,000 | | 69,386,500 |
TOTAL ENERGY | | 151,732,499 |
FINANCIALS - 35.0% |
Capital Markets - 4.3% |
Knight Capital Group, Inc. Class A (a) | 4,350,000 | | 44,935,500 |
Common Stocks - continued |
| Shares | | Value |
FINANCIALS - continued |
Capital Markets - continued |
Monex Group, Inc. | 149,703 | | $ 24,294,118 |
Waddell & Reed Financial, Inc. Class A | 1,610,000 | | 46,834,900 |
| | 116,064,518 |
Commercial Banks - 11.0% |
Associated Banc-Corp. | 4,432,650 | | 55,363,799 |
CapitalSource, Inc. | 7,000,000 | | 45,850,000 |
City National Corp. | 784,900 | | 38,679,872 |
National Penn Bancshares, Inc. | 4,266,604 | | 37,716,779 |
PacWest Bancorp (e) | 1,857,600 | | 42,557,616 |
TCF Financial Corp. | 7,000,000 | | 72,310,000 |
Western Liberty Bancorp (a)(e) | 992,899 | | 2,879,407 |
| | 295,357,473 |
Insurance - 7.7% |
Alterra Capital Holdings Ltd. | 2,337,411 | | 54,391,554 |
Aspen Insurance Holdings Ltd. | 1,920,200 | | 55,186,548 |
Platinum Underwriters Holdings Ltd. (e) | 1,694,139 | | 64,411,165 |
ProAssurance Corp. | 350,000 | | 31,349,500 |
| | 205,338,767 |
Real Estate Investment Trusts - 7.4% |
DCT Industrial Trust, Inc. | 11,980,586 | | 74,998,468 |
Franklin Street Properties Corp. | 3,160,000 | | 32,769,200 |
Highwoods Properties, Inc. (SBI) | 1,720,330 | | 58,267,577 |
National Retail Properties, Inc. (d) | 1,140,000 | | 33,630,000 |
| | 199,665,245 |
Real Estate Management & Development - 0.9% |
Forestar Group, Inc. (a)(e) | 1,996,875 | | 22,724,438 |
Thrifts & Mortgage Finance - 3.7% |
Astoria Financial Corp. (d)(e) | 5,418,152 | | 51,038,992 |
Washington Federal, Inc. | 3,086,175 | | 49,162,768 |
| | 100,201,760 |
TOTAL FINANCIALS | | 939,352,201 |
HEALTH CARE - 6.6% |
Health Care Equipment & Supplies - 1.1% |
Integra LifeSciences Holdings Corp. (a) | 750,000 | | 28,845,000 |
Health Care Providers & Services - 5.5% |
Chemed Corp. | 465,200 | | 29,200,604 |
Common Stocks - continued |
| Shares | | Value |
HEALTH CARE - continued |
Health Care Providers & Services - continued |
MEDNAX, Inc. (a) | 779,700 | | $ 51,561,561 |
Team Health Holdings, Inc. (a) | 2,527,580 | | 67,486,386 |
| | 148,248,551 |
TOTAL HEALTH CARE | | 177,093,551 |
INDUSTRIALS - 14.1% |
Commercial Services & Supplies - 7.2% |
ACCO Brands Corp. | 2,200,000 | | 18,634,000 |
HNI Corp. (e) | 2,700,000 | | 71,739,000 |
Knoll, Inc. | 1,750,000 | | 23,957,500 |
Quad/Graphics, Inc. (d)(e) | 1,878,394 | | 28,908,484 |
United Stationers, Inc. | 1,980,800 | | 49,935,968 |
| | 193,174,952 |
Electrical Equipment - 2.3% |
GrafTech International Ltd. (a) | 5,965,000 | | 62,334,250 |
Machinery - 2.0% |
Blount International, Inc. (a)(e) | 2,604,723 | | 37,039,161 |
Columbus McKinnon Corp. (NY Shares) (a)(e) | 1,047,872 | | 15,414,197 |
| | 52,453,358 |
Trading Companies & Distributors - 2.6% |
H&E Equipment Services, Inc. (a) | 376,625 | | 5,317,945 |
WESCO International, Inc. (a) | 1,153,633 | | 64,268,894 |
| | 69,586,839 |
TOTAL INDUSTRIALS | | 377,549,399 |
INFORMATION TECHNOLOGY - 11.0% |
Communications Equipment - 2.6% |
Polycom, Inc. (a) | 3,275,000 | | 28,623,500 |
ViaSat, Inc. (a) | 1,100,000 | | 42,130,000 |
| | 70,753,500 |
Electronic Equipment & Components - 5.1% |
Ingram Micro, Inc. Class A (a) | 1,653,100 | | 24,779,969 |
Macnica, Inc. | 677,400 | | 14,288,287 |
Ryoyo Electro Corp. (e) | 1,972,700 | | 20,552,790 |
SYNNEX Corp. (a) | 790,000 | | 26,725,700 |
Tech Data Corp. (a) | 1,000,000 | | 50,100,000 |
| | 136,446,746 |
Common Stocks - continued |
| Shares | | Value |
INFORMATION TECHNOLOGY - continued |
Internet Software & Services - 1.4% |
j2 Global, Inc. (d) | 1,270,000 | | $ 38,011,100 |
Semiconductors & Semiconductor Equipment - 0.4% |
Miraial Co. Ltd. (e) | 720,200 | | 10,410,478 |
Software - 1.5% |
Monotype Imaging Holdings, Inc. (e) | 2,652,331 | | 38,936,219 |
TOTAL INFORMATION TECHNOLOGY | | 294,558,043 |
MATERIALS - 4.7% |
Chemicals - 1.5% |
PolyOne Corp. | 2,800,000 | | 41,244,000 |
Metals & Mining - 3.2% |
Carpenter Technology Corp. | 409,380 | | 19,592,927 |
Haynes International, Inc. | 496,108 | | 23,907,445 |
RTI International Metals, Inc. (a)(e) | 1,880,000 | | 42,206,000 |
| | 85,706,372 |
TOTAL MATERIALS | | 126,950,372 |
UTILITIES - 4.5% |
Electric Utilities - 1.6% |
Westar Energy, Inc. | 1,360,000 | | 41,561,600 |
Gas Utilities - 2.9% |
Southwest Gas Corp. | 836,756 | | 37,369,523 |
UGI Corp. | 1,333,454 | | 40,870,365 |
| | 78,239,888 |
TOTAL UTILITIES | | 119,801,488 |
TOTAL COMMON STOCKS (Cost $2,307,088,586) |
2,649,132,685
|
Nonconvertible Preferred Stocks - 1.3% |
| | | |
CONSUMER DISCRETIONARY - 0.5% |
Household Durables - 0.5% |
M/I Homes, Inc. Series A, 9.75% (a) | 750,400 | | 12,944,400 |
Nonconvertible Preferred Stocks - continued |
| Shares | | Value |
FINANCIALS - 0.8% |
Real Estate Investment Trusts - 0.8% |
DDR Corp. Series H, 7.375% | 818,790 | | $ 20,658,072 |
TOTAL NONCONVERTIBLE PREFERRED STOCKS (Cost $20,354,770) |
33,602,472
|
Money Market Funds - 2.0% |
| | | |
Fidelity Cash Central Fund, 0.17% (b) | 5,899,046 | | 5,899,046 |
Fidelity Securities Lending Cash Central Fund, 0.18% (b)(c) | 48,626,645 | | 48,626,645 |
TOTAL MONEY MARKET FUNDS (Cost $54,525,691) |
54,525,691
|
TOTAL INVESTMENT PORTFOLIO - 102.0% (Cost $2,381,969,047) | | 2,737,260,848 |
NET OTHER ASSETS (LIABILITIES) - (2.0)% | | (53,568,098) |
NET ASSETS - 100% | $ 2,683,692,750 |
Legend |
(a) Non-income producing |
(b) Affiliated fund that is available only to investment companies and other accounts managed by Fidelity Investments. The rate quoted is the annualized seven-day yield of the fund at period end. A complete unaudited listing of the fund's holdings as of its most recent quarter end is available upon request. In addition, each Fidelity Central Fund's financial statements, which are not covered by the Fund's Report of Independent Registered Public Accounting Firm, are available on the SEC's website or upon request. |
(c) Investment made with cash collateral received from securities on loan. |
(d) Security or a portion of the security is on loan at period end. |
(e) Affiliated company |
Affiliated Central Funds |
Information regarding fiscal year to date income earned by the Fund from investments in Fidelity Central Funds is as follows: |
Fund | Income earned |
Fidelity Cash Central Fund | $ 14,453 |
Fidelity Securities Lending Cash Central Fund | 204,102 |
Total | $ 218,555 |
Other Affiliated Issuers |
An affiliated company is a company in which the Fund has ownership of at least 5% of the voting securities. Fiscal year to date transactions with companies which are or were affiliates are as follows: |
Affiliate | Value,
beginning of
period | Purchases | Sales
Proceeds | Dividend
Income | Value,
end of
period |
Astoria Financial Corp. | $ 56,131,471 | $ 5,135,258 | $ - | $ 2,277,805 | $ 51,038,992 |
Blount International, Inc. | 43,316,543 | - | - | - | 37,039,161 |
Chiquita Brands International, Inc. | 24,519,456 | 10,332,799 | - | - | 17,482,500 |
Columbus McKinnon Corp. (NY Shares) | 15,792,000 | 1,137,487 | - | - | 15,414,197 |
DCT Industrial Trust, Inc. | 74,961,776 | - | 8,396,655 | 3,414,064 | - |
Forestar Group, Inc. | - | 24,473,760 | - | - | 22,724,438 |
H&E Equipment Services, Inc. | 29,272,896 | 2,743,497 | 45,135,849 | - | - |
Haynes International, Inc. | 42,301,857 | - | 8,879,973 | 446,653 | - |
HNI Corp. | 49,131,621 | 19,653,848 | 17,053,493 | 2,539,706 | 71,739,000 |
Ingles Markets, Inc. Class A | 10,225,970 | - | 9,904,080 | 78,182 | - |
M.D.C. Holdings, Inc. | 54,813,423 | - | 45,064,374 | 2,311,800 | - |
Affiliate | Value,
beginning of
period | Purchases | Sales
Proceeds | Dividend
Income | Value,
end of
period |
Miraial Co. Ltd. | $ 15,046,860 | $ - | $ - | $ 516,374 | $ 10,410,478 |
Monotype Imaging Holdings, Inc. | 35,396,690 | 972,962 | - | - | 38,936,219 |
PacWest Bancorp | 36,873,360 | - | - | 1,021,680 | 42,557,616 |
Platinum Underwriters Holdings Ltd. | 54,169,091 | 3,610,350 | - | 542,124 | 64,411,165 |
Providence Service Corp. | 12,045,466 | - | 15,255,161 | - | - |
Quad/Graphics, Inc. | - | 25,545,548 | - | 469,599 | 28,908,484 |
Regis Corp. | 60,080,486 | - | 16,882,099 | 952,998 | 52,452,000 |
RTI International Metals, Inc. | 27,932,874 | 27,109,765 | 3,701,784 | - | 42,206,000 |
Ryoyo Electro Corp. | 19,684,709 | - | - | 707,200 | 20,552,790 |
Western Liberty Bancorp | 7,248,000 | - | 3,597,604 | - | 2,879,407 |
Total | $ 668,944,549 | $ 120,715,274 | $ 173,871,072 | $ 15,278,185 | $ 518,752,447 |
Other Information |
The following is a summary of the inputs used, as of July 31, 2012, involving the Fund's assets and liabilities carried at fair value. The inputs or methodology used for valuing securities may not be an indication of the risk associated with investing in those securities. For more information on valuation inputs, and their aggregation into the levels used in the tables below, please refer to the Security Valuation section in the accompanying Notes to Financial Statements. |
Valuation Inputs at Reporting Date: |
Description | Total | Level 1 | Level 2 | Level 3 |
Investments in Securities: | | | | |
Equities: | | | | |
Consumer Discretionary | $ 374,367,532 | $ 355,806,167 | $ 18,561,365 | $ - |
Consumer Staples | 100,672,000 | 100,672,000 | - | - |
Energy | 151,732,499 | 151,732,499 | - | - |
Financials | 960,010,273 | 935,716,155 | 24,294,118 | - |
Health Care | 177,093,551 | 177,093,551 | - | - |
Industrials | 377,549,399 | 377,549,399 | - | - |
Information Technology | 294,558,043 | 249,306,488 | 45,251,555 | - |
Materials | 126,950,372 | 126,950,372 | - | - |
Utilities | 119,801,488 | 119,801,488 | - | - |
Money Market Funds | 54,525,691 | 54,525,691 | - | - |
Total Investments in Securities: | $ 2,737,260,848 | $ 2,649,153,810 | $ 88,107,038 | $ - |
The following is a summary of transfers between Level 1 and Level 2 for the period ended July 31, 2012. Transfers are assumed to have occurred at the beginning of the period, and are primarily attributable to the valuation techniques used for foreign equity securities, as discussed in the accompanying Notes to Financial Statements: |
Transfers | Total |
Level 1 to Level 2 | $ 70,981,657 |
Level 2 to Level 1 | $ 0 |
See accompanying notes which are an integral part of the financial statements.
Annual Report
Statement of Assets and Liabilities
| July 31, 2012 |
| | |
Assets | | |
Investment in securities, at value (including securities loaned of $46,940,525) - See accompanying schedule: Unaffiliated issuers (cost $1,850,015,930) | $ 2,163,982,710 | |
Fidelity Central Funds (cost $54,525,691) | 54,525,691 | |
Other affiliated issuers (cost $477,427,426) | 518,752,447 | |
Total Investments (cost $2,381,969,047) | | $ 2,737,260,848 |
Receivable for investments sold | | 7,962 |
Receivable for fund shares sold | | 3,346,245 |
Dividends receivable | | 2,366,103 |
Distributions receivable from Fidelity Central Funds | | 31,400 |
Other receivables | | 10,660 |
Total assets | | 2,743,023,218 |
| | |
Liabilities | | |
Payable for investments purchased | $ 6,165,626 | |
Payable for fund shares redeemed | 2,135,374 | |
Accrued management fee | 1,742,888 | |
Distribution and service plan fees payable | 100,792 | |
Other affiliated payables | 499,987 | |
Other payables and accrued expenses | 59,156 | |
Collateral on securities loaned, at value | 48,626,645 | |
Total liabilities | | 59,330,468 |
| | |
Net Assets | | $ 2,683,692,750 |
Net Assets consist of: | | |
Paid in capital | | $ 2,251,063,836 |
Undistributed net investment income | | 4,596,351 |
Accumulated undistributed net realized gain (loss) on investments and foreign currency transactions | | 72,740,139 |
Net unrealized appreciation (depreciation) on investments and assets and liabilities in foreign currencies | | 355,292,424 |
Net Assets | | $ 2,683,692,750 |
See accompanying notes which are an integral part of the financial statements.
Annual Report
Financial Statements - continued
Statement of Assets and Liabilities - continued
| July 31, 2012 |
| | |
Calculation of Maximum Offering Price Class A:
Net Asset Value and redemption price per share ($150,285,327 ÷ 10,110,871 shares) | | $ 14.86 |
| | |
Maximum offering price per share (100/94.25 of $14.86) | | $ 15.77 |
Class T:
Net Asset Value and redemption price per share ($57,514,280 ÷ 3,913,423 shares) | | $ 14.70 |
| | |
Maximum offering price per share (100/96.50 of $14.70) | | $ 15.23 |
Class B:
Net Asset Value and offering price per share ($6,674,942 ÷ 467,617 shares)A | | $ 14.27 |
| | |
Class C:
Net Asset Value and offering price per share ($47,265,102 ÷ 3,310,493 shares)A | | $ 14.28 |
| | |
| | |
Small Cap Value:
Net Asset Value, offering price and redemption price per share ($1,756,962,176 ÷ 116,773,340 shares) | | $ 15.05 |
| | |
Class F:
Net Asset Value, offering price and redemption price per share ($526,009,440 ÷ 34,859,047 shares) | | $ 15.09 |
| | |
Institutional Class:
Net Asset Value, offering price and redemption price per share ($138,981,483 ÷ 9,231,738 shares) | | $ 15.05 |
A Redemption price per share is equal to net asset value less any applicable contingent deferred sales charge.
See accompanying notes which are an integral part of the financial statements.
Annual Report
Statement of Operations
| Year ended July 31, 2012 |
| | |
Investment Income | | |
Dividends (including $15,278,185 earned from other affiliated issuers) | | $ 37,030,660 |
Interest | | 68 |
Income from Fidelity Central Funds | | 218,555 |
Total income | | 37,249,283 |
| | |
Expenses | | |
Management fee
Basic fee | $ 17,249,880 | |
Performance adjustment | 3,419,705 | |
Transfer agent fees | 4,956,576 | |
Distribution and service plan fees | 1,124,466 | |
Accounting and security lending fees | 740,848 | |
Custodian fees and expenses | 47,382 | |
Independent trustees' compensation | 15,923 | |
Registration fees | 132,426 | |
Audit | 69,124 | |
Legal | 7,688 | |
Interest | 359 | |
Miscellaneous | 25,296 | |
Total expenses before reductions | 27,789,673 | |
Expense reductions | (31,201) | 27,758,472 |
Net investment income (loss) | | 9,490,811 |
Realized and Unrealized Gain (Loss) Net realized gain (loss) on: | | |
Investment securities: | | |
Unaffiliated issuers | 99,604,672 | |
Other affiliated issuers | 57,534 | |
Foreign currency transactions | (5,054) | |
Total net realized gain (loss) | | 99,657,152 |
Change in net unrealized appreciation (depreciation) on: Investment securities | (37,717,980) | |
Assets and liabilities in foreign currencies | (6,920) | |
Total change in net unrealized appreciation (depreciation) | | (37,724,900) |
Net gain (loss) | | 61,932,252 |
Net increase (decrease) in net assets resulting from operations | | $ 71,423,063 |
See accompanying notes which are an integral part of the financial statements.
Annual Report
Financial Statements - continued
Statement of Changes in Net Assets
| Year ended
July 31,
2012 | Year ended
July 31,
2011 |
Increase (Decrease) in Net Assets | | |
Operations | | |
Net investment income (loss) | $ 9,490,811 | $ 8,365,475 |
Net realized gain (loss) | 99,657,152 | 155,481,563 |
Change in net unrealized appreciation (depreciation) | (37,724,900) | 203,701,455 |
Net increase (decrease) in net assets resulting
from operations | 71,423,063 | 367,548,493 |
Distributions to shareholders from net investment income | (3,813,704) | (16,151,065) |
Distributions to shareholders from net realized gain | (148,970,854) | (20,051,059) |
Total distributions | (152,784,558) | (36,202,124) |
Share transactions - net increase (decrease) | 230,904,084 | 54,629,275 |
Redemption fees | 569,163 | 445,888 |
Total increase (decrease) in net assets | 150,111,752 | 386,421,532 |
| | |
Net Assets | | |
Beginning of period | 2,533,580,998 | 2,147,159,466 |
End of period (including undistributed net investment income of $4,596,351 and $0, respectively) | $ 2,683,692,750 | $ 2,533,580,998 |
See accompanying notes which are an integral part of the financial statements.
Annual Report
Financial Highlights - Class A
Years ended July 31, | 2012 | 2011 | 2010 | 2009 | 2008 |
Selected Per-Share Data | | | | |
Net asset value, beginning of period | $ 15.48 | $ 13.45 | $ 11.13 | $ 11.82 | $ 14.34 |
Income from Investment
Operations | | | | |
Net investment income (loss) C | .01 | .01 F | .02 G | .08 | (.01) |
Net realized and unrealized gain (loss) | .30 | 2.22 | 2.33 | (.60) | (1.98) |
Total from investment operations | .31 | 2.23 | 2.35 | (.52) | (1.99) |
Distributions from net investment income | (.01) | (.08) | (.03) | (.06) | - |
Distributions from net realized gain | (.93) | (.12) | - | (.11) | (.53) |
Total distributions | (.93) J | (.20) | (.03) | (.17) | (.53) |
Redemption fees added to paid in capital C, I | - | - | - | - | - |
Net asset value, end of period | $ 14.86 | $ 15.48 | $ 13.45 | $ 11.13 | $ 11.82 |
Total Return A, B | 3.24% | 16.72% | 21.16% | (4.37)% | (14.35)% |
Ratios to Average Net Assets D, H | | | | |
Expenses before reductions | 1.44% | 1.44% | 1.47% | 1.45% | 1.43% |
Expenses net of fee waivers, if any | 1.44% | 1.43% | 1.40% | 1.40% | 1.40% |
Expenses net of all reductions | 1.44% | 1.43% | 1.39% | 1.40% | 1.40% |
Net investment income (loss) | .09% | .06% F | .17% G | .81% | (.05)% |
Supplemental Data | | | | |
Net assets, end of period (000 omitted) | $ 150,285 | $ 140,707 | $ 96,994 | $ 55,029 | $ 52,446 |
Portfolio turnover rate E | 27% | 22% | 49% | 51% | 149% |
A Total returns would have been lower if certain expenses had not been reduced during the applicable periods shown.
B Total returns do not include the effect of the sales charges.
C Calculated based on average shares outstanding during the period.
D Fees and expenses of any underlying Fidelity Central Funds are not included in the Fund's expense ratio. The Fund indirectly bears its proportionate share of the expenses of any underlying Fidelity Central Funds.
E Amount does not include the portfolio activity of any underlying Fidelity Central Funds.
F Investment income per share reflects a large, non-recurring dividend which amounted to $.06 per share. Excluding this non-recurring dividend, the ratio of net investment income (loss) to average net assets would have been (.31)%.
G Investment income per share reflects a large, non-recurring dividend which amounted to $.03 per share. Excluding this non-recurring dividend, the ratio of net investment income (loss) to average net assets would have been (.10)%.
H Expense ratios reflect operating expenses of the class. Expenses before reductions do not reflect amounts reimbursed by the investment adviser or reductions from brokerage service arrangements or reductions from other expense offset arrangements and do not represent the amount paid by the class during periods when reimbursements or reductions occur. Expenses net of fee waivers reflect expenses after reimbursement by the investment adviser but prior to reductions from brokerage service arrangements or other expense offset arrangements. Expenses net of all reductions represent the net expenses paid by the class.
I Amount represents less than $.01 per share.
J Total distributions of $.93 per share is comprised of distributions from net investment income of $.006 and distributions from net realized gain of $.925 per share.
See accompanying notes which are an integral part of the financial statements.
Annual Report
Financial Highlights - Class T
Years ended July 31, | 2012 | 2011 | 2010 | 2009 | 2008 |
Selected Per-Share Data | | | | |
Net asset value, beginning of period | $ 15.34 | $ 13.34 | $ 11.05 | $ 11.74 | $ 14.28 |
Income from Investment
Operations | | | | |
Net investment income (loss) C | (.02) | (.03) F | (.01) G | .05 | (.04) |
Net realized and unrealized gain (loss) | .31 | 2.20 | 2.31 | (.59) | (1.97) |
Total from investment operations | .29 | 2.17 | 2.30 | (.54) | (2.01) |
Distributions from net investment income | - | (.05) | (.01) | (.04) | - |
Distributions from net realized gain | (.93) | (.12) | - | (.11) | (.53) |
Total distributions | (.93) | (.17) | (.01) | (.15) | (.53) |
Redemption fees added to paid in capital C, I | - | - | - | - | - |
Net asset value, end of period | $ 14.70 | $ 15.34 | $ 13.34 | $ 11.05 | $ 11.74 |
Total Return A, B | 3.08% | 16.36% | 20.87% | (4.57)% | (14.58)% |
Ratios to Average Net Assets D, H | | | | |
Expenses before reductions | 1.67% | 1.70% | 1.72% | 1.70% | 1.68% |
Expenses net of fee waivers, if any | 1.67% | 1.69% | 1.65% | 1.65% | 1.65% |
Expenses net of all reductions | 1.67% | 1.69% | 1.64% | 1.65% | 1.65% |
Net investment income (loss) | (.14)% | (.19)% F | (.08)% G | .56% | (.30)% |
Supplemental Data | | | | |
Net assets, end of period (000 omitted) | $ 57,514 | $ 55,845 | $ 44,091 | $ 28,534 | $ 32,091 |
Portfolio turnover rate E | 27% | 22% | 49% | 51% | 149% |
A Total returns would have been lower if certain expenses had not been reduced during the applicable periods shown.
B Total returns do not include the effect of the sales charges.
C Calculated based on average shares outstanding during the period.
D Fees and expenses of any underlying Fidelity Central Funds are not included in the Fund's expense ratio. The Fund indirectly bears its proportionate share of the expenses of any underlying Fidelity Central Funds.
E Amount does not include the portfolio activity of any underlying Fidelity Central Funds.
F Investment income per share reflects a large, non-recurring dividend which amounted to $.06 per share. Excluding this non-recurring dividend, the ratio of net investment income (loss) to average net assets would have been (.57)%.
G Investment income per share reflects a large, non-recurring dividend which amounted to $.03 per share. Excluding this non-recurring dividend, the ratio of net investment income (loss) to average net assets would have been (.35)%.
H Expense ratios reflect operating expenses of the class. Expenses before reductions do not reflect amounts reimbursed by the investment adviser or reductions from brokerage service arrangements or reductions from other expense offset arrangements and do not represent the amount paid by the class during periods when reimbursements or reductions occur. Expenses net of fee waivers reflect expenses after reimbursement by the investment adviser but prior to reductions from brokerage service arrangements or other expense offset arrangements. Expenses net of all reductions represent the net expenses paid by the class.
I Amount represents less than $.01 per share.
See accompanying notes which are an integral part of the financial statements.
Annual Report
Financial Highlights - Class B
Years ended July 31, | 2012 | 2011 | 2010 | 2009 | 2008 |
Selected Per-Share Data | | | | |
Net asset value, beginning of period | $ 15.00 | $ 13.08 | $ 10.88 | $ 11.60 | $ 14.19 |
Income from Investment
Operations | | | | |
Net investment income (loss) C | (.09) | (.10) F | (.07) G | .01 | (.10) |
Net realized and unrealized gain (loss) | .29 | 2.15 | 2.27 | (.59) | (1.96) |
Total from investment operations | .20 | 2.05 | 2.20 | (.58) | (2.06) |
Distributions from net investment income | - | (.01) | - | (.03) | - |
Distributions from net realized gain | (.93) | (.12) | - | (.11) | (.53) |
Total distributions | (.93) | (.13) | - | (.14) | (.53) |
Redemption fees added to paid in capital C, I | - | - | - | - | - |
Net asset value, end of period | $ 14.27 | $ 15.00 | $ 13.08 | $ 10.88 | $ 11.60 |
Total Return A, B | 2.51% | 15.80% | 20.22% | (5.05)% | (15.04)% |
Ratios to Average Net Assets D, H | | | | |
Expenses before reductions | 2.19% | 2.20% | 2.22% | 2.20% | 2.18% |
Expenses net of fee waivers, if any | 2.19% | 2.19% | 2.15% | 2.15% | 2.15% |
Expenses net of all reductions | 2.19% | 2.19% | 2.14% | 2.15% | 2.15% |
Net investment income (loss) | (.66)% | (.69)% F | (.58)% G | .06% | (.80)% |
Supplemental Data | | | | |
Net assets, end of period (000 omitted) | $ 6,675 | $ 8,549 | $ 9,747 | $ 7,153 | $ 7,886 |
Portfolio turnover rate E | 27% | 22% | 49% | 51% | 149% |
A Total returns would have been lower if certain expenses had not been reduced during the applicable periods shown.
B Total returns do not include the effect of the contingent deferred sales charge.
C Calculated based on average shares outstanding during the period.
D Fees and expenses of any underlying Fidelity Central Funds are not included in the Fund's expense ratio. The Fund indirectly bears its proportionate share of the expenses of any underlying Fidelity Central Funds.
E Amount does not include the portfolio activity of any underlying Fidelity Central Funds.
F Investment income per share reflects a large, non-recurring dividend which amounted to $.06 per share. Excluding this non-recurring dividend, the ratio of net investment income (loss) to average net assets would have been (1.07)%.
G Investment income per share reflects a large, non-recurring dividend which amounted to $.03 per share. Excluding this non-recurring dividend, the ratio of net investment income (loss) to average net assets would have been (.85)%.
H Expense ratios reflect operating expenses of the class. Expenses before reductions do not reflect amounts reimbursed by the investment adviser or reductions from brokerage service arrangements or reductions from other expense offset arrangements and do not represent the amount paid by the class during periods when reimbursements or reductions occur. Expenses net of fee waivers reflect expenses after reimbursement by the investment adviser but prior to reductions from brokerage service arrangements or other expense offset arrangements. Expenses net of all reductions represent the net expenses paid by the class.
I Amount represents less than $.01 per share.
See accompanying notes which are an integral part of the financial statements.
Annual Report
Financial Highlights - Class C
Years ended July 31, | 2012 | 2011 | 2010 | 2009 | 2008 |
Selected Per-Share Data | | | | |
Net asset value, beginning of period | $ 15.01 | $ 13.08 | $ 10.89 | $ 11.60 | $ 14.19 |
Income from Investment
Operations | | | | |
Net investment income (loss) C | (.09) | (.10) F | (.07) G | .01 | (.10) |
Net realized and unrealized gain (loss) | .29 | 2.17 | 2.26 | (.58) | (1.96) |
Total from investment operations | .20 | 2.07 | 2.19 | (.57) | (2.06) |
Distributions from net investment income | - | (.02) | - | (.03) | - |
Distributions from net realized gain | (.93) | (.12) | - | (.11) | (.53) |
Total distributions | (.93) | (.14) | - | (.14) | (.53) |
Redemption fees added to paid in capital C, I | - | - | - | - | - |
Net asset value, end of period | $ 14.28 | $ 15.01 | $ 13.08 | $ 10.89 | $ 11.60 |
Total Return A, B | 2.52% | 15.91% | 20.11% | (4.98)% | (15.04)% |
Ratios to Average Net Assets D, H | | | | |
Expenses before reductions | 2.19% | 2.18% | 2.22% | 2.20% | 2.18% |
Expenses net of fee waivers, if any | 2.19% | 2.18% | 2.15% | 2.15% | 2.15% |
Expenses net of all reductions | 2.19% | 2.18% | 2.14% | 2.15% | 2.15% |
Net investment income (loss) | (.66)% | (.68)% F | (.58)% G | .06% | (.80)% |
Supplemental Data | | | | |
Net assets, end of period (000 omitted) | $ 47,265 | $ 47,457 | $ 37,346 | $ 21,345 | $ 20,924 |
Portfolio turnover rate E | 27% | 22% | 49% | 51% | 149% |
A Total returns would have been lower if certain expenses had not been reduced during the applicable periods shown.
B Total returns do not include the effect of the contingent deferred sales charge.
C Calculated based on average shares outstanding during the period.
D Fees and expenses of any underlying Fidelity Central Funds are not included in the Fund's expense ratio. The Fund indirectly bears its proportionate share of the expenses of any underlying Fidelity Central Funds.
E Amount does not include the portfolio activity of any underlying Fidelity Central Funds.
F Investment income per share reflects a large, non-recurring dividend which amounted to $.06 per share. Excluding this non-recurring dividend, the ratio of net investment income (loss) to average net assets would have been (1.06)%.
G Investment income per share reflects a large, non-recurring dividend which amounted to $.03 per share. Excluding this non-recurring dividend, the ratio of net investment income (loss) to average net assets would have been (.85)%.
H Expense ratios reflect operating expenses of the class. Expenses before reductions do not reflect amounts reimbursed by the investment adviser or reductions from brokerage service arrangements or reductions from other expense offset arrangements and do not represent the amount paid by the class during periods when reimbursements or reductions occur. Expenses net of fee waivers reflect expenses after reimbursement by the investment adviser but prior to reductions from brokerage service arrangements or other expense offset arrangements. Expenses net of all reductions represent the net expenses paid by the class.
I Amount represents less than $.01 per share.
See accompanying notes which are an integral part of the financial statements.
Annual Report
Financial Highlights - Small Cap Value
Years ended July 31, | 2012 | 2011 | 2010 | 2009 | 2008 |
Selected Per-Share Data | | | | |
Net asset value, beginning of period | $ 15.62 | $ 13.56 | $ 11.22 | $ 11.91 | $ 14.43 |
Income from Investment
Operations | | | | |
Net investment income (loss) B | .06 | .06 E | .05 F | .10 | .03 |
Net realized and unrealized gain (loss) | .32 | 2.23 | 2.34 | (.60) | (1.99) |
Total from investment operations | .38 | 2.29 | 2.39 | (.50) | (1.96) |
Distributions from net investment income | (.02) | (.10) | (.05) | (.08) | - |
Distributions from net realized gain | (.93) | (.13) | - | (.11) | (.56) |
Total distributions | (.95) | (.23) | (.05) | (.19) | (.56) |
Redemption fees added to paid in capital B, H | - | - | - | - | - |
Net asset value, end of period | $ 15.05 | $ 15.62 | $ 13.56 | $ 11.22 | $ 11.91 |
Total Return A | 3.67% | 17.03% | 21.32% | (4.15)% | (14.10)% |
Ratios to Average Net Assets C, G | | | | |
Expenses before reductions | 1.13% | 1.13% | 1.18% | 1.20% | 1.14% |
Expenses net of fee waivers, if any | 1.13% | 1.13% | 1.18% | 1.20% | 1.14% |
Expenses net of all reductions | 1.13% | 1.13% | 1.17% | 1.20% | 1.13% |
Net investment income (loss) | .41% | .37% E | .39% F | 1.01% | .22% |
Supplemental Data | | | | |
Net assets, end of period (000 omitted) | $ 1,756,962 | $ 1,899,805 | $ 1,770,675 | $ 1,488,736 | $ 1,136,860 |
Portfolio turnover rate D | 27% | 22% | 49% | 51% | 149% |
A Total returns would have been lower if certain expenses had not been reduced during the applicable periods shown.
B Calculated based on average shares outstanding during the period.
C Fees and expenses of any underlying Fidelity Central Funds are not included in the Fund's expense ratio. The Fund indirectly bears its proportionate share of the expenses of any underlying Fidelity Central Funds.
D Amount does not include the portfolio activity of any underlying Fidelity Central Funds.
E Investment income per share reflects a large, non-recurring dividend which amounted to $.06 per share. Excluding this non-recurring dividend, the ratio of net investment income (loss) to average net assets would have been (.01)%.
F Investment income per share reflects a large, non-recurring dividend which amounted to $.03 per share. Excluding this non-recurring dividend, the ratio of net investment income (loss) to average net assets would have been .12%.
G Expense ratios reflect operating expenses of the class. Expenses before reductions do not reflect amounts reimbursed by the investment adviser or reductions from brokerage service arrangements or reductions from other expense offset arrangements and do not represent the amount paid by the class during periods when reimbursements or reductions occur. Expenses net of fee waivers reflect expenses after reimbursement by the investment adviser but prior to reductions from brokerage service arrangements or other expense offset arrangements. Expenses net of all reductions represent the net expenses paid by the class.
H Amount represents less than $.01 per share.
See accompanying notes which are an integral part of the financial statements.
Annual Report
Financial Highlights - Class F
Years ended July 31, | 2012 | 2011 | 2010 | 2009 I |
Selected Per-Share Data | | | | |
Net asset value, beginning of period | $ 15.64 | $ 13.58 | $ 11.22 | $ 10.27 |
Income from Investment Operations | | | | |
Net investment income (loss) D | .09 | .09 G | .09 H | .01 |
Net realized and unrealized gain (loss) | .32 | 2.23 | 2.34 | .94 |
Total from investment operations | .41 | 2.32 | 2.43 | .95 |
Distributions from net investment income | (.04) | (.14) | (.07) | - |
Distributions from net realized gain | (.93) | (.13) | - | - |
Total distributions | (.96) L | (.26) M | (.07) | - |
Redemption fees added to paid in capital D, K | - | - | - | - |
Net asset value, end of period | $ 15.09 | $ 15.64 | $ 13.58 | $ 11.22 |
Total Return B, C | 3.90% | 17.31% | 21.69% | 9.25% |
Ratios to Average Net Assets E, J | | | | |
Expenses before reductions | .89% | .88% | .90% | .86% A |
Expenses net of fee waivers, if any | .89% | .88% | .90% | .86% A |
Expenses net of all reductions | .89% | .88% | .89% | .86% A |
Net investment income (loss) | .64% | .61% G | .67% H | .64% A |
Supplemental Data | | | | |
Net assets, end of period (000 omitted) | $ 526,009 | $ 279,653 | $ 109,868 | $ 159 |
Portfolio turnover rate F | 27% | 22% | 49% | 51% |
A Annualized
B Total returns for periods of less than one year are not annualized.
C Total returns would have been lower if certain expenses had not been reduced during the applicable periods shown.
D Calculated based on average shares outstanding during the period.
E Fees and expenses of any underlying Fidelity Central Funds are not included in the Fund's expense ratio. The Fund indirectly bears its proportionate share of the expenses of any underlying Fidelity Central Funds.
F Amount does not include the portfolio activity of any underlying Fidelity Central Funds.
G Investment income per share reflects a large, non-recurring dividend which amounted to $.06 per share. Excluding this non-recurring dividend, the ratio of net investment income (loss) to average net assets would have been .24%.
H Investment income per share reflects a large, non-recurring dividend which amounted to $.04 per share. Excluding this non-recurring dividend, the ratio of net investment income (loss) to average net assets would have been .40%.
I For the period June 26, 2009 (commencement of sale of shares) to July 31, 2009.
J Expense ratios reflect operating expenses of the class. Expenses before reductions do not reflect amounts reimbursed by the investment adviser or reductions from brokerage service arrangements or reductions from other expense offset arrangements and do not represent the amount paid by the class during periods when reimbursements or reductions occur. Expense ratios before reductions for start-up periods may not be representative of longer-term operating periods. Expenses net of fee waivers reflect expenses after reimbursement by the investment adviser but prior to reductions from brokerage service arrangements or other expense offset arrangements. Expenses net of all reductions represent the net expenses paid by the class.
K Amount represents less than $.01 per share.
L Total distributions of $.96 per share is comprised of distributions from net investment income of $.036 and distributions from net realized gain of $.925 per share.
M Total distributions of $.26 per share is comprised of distributions from net investment income of $.138 and distributions from net realized gain of $.126 per share.
See accompanying notes which are an integral part of the financial statements.
Annual Report
Financial Highlights - Institutional Class
Years ended July 31, | 2012 | 2011 | 2010 | 2009 | 2008 |
Selected Per-Share Data | | | | |
Net asset value, beginning of period | $ 15.63 | $ 13.58 | $ 11.24 | $ 11.91 | $ 14.43 |
Income from Investment
Operations | | | | |
Net investment income (loss) B | .06 | .06 E | .06 F | .10 | .03 |
Net realized and unrealized gain (loss) | .31 | 2.23 | 2.34 | (.59) | (1.99) |
Total from investment operations | .37 | 2.29 | 2.40 | (.49) | (1.96) |
Distributions from net investment income | (.02) | (.11) | (.06) | (.07) | - |
Distributions from net realized gain | (.93) | (.13) | - | (.11) | (.56) |
Total distributions | (.95) | (.24) | (.06) | (.18) | (.56) |
Redemption fees added to paid in capital B, H | - | - | - | - | - |
Net asset value, end of period | $ 15.05 | $ 15.63 | $ 13.58 | $ 11.24 | $ 11.91 |
Total Return A | 3.59% | 17.02% | 21.42% | (4.04)% | (14.10)% |
Ratios to Average Net Assets C, G | | | | |
Expenses before reductions | 1.14% | 1.10% | 1.12% | 1.20% | 1.13% |
Expenses net of fee waivers, if any | 1.14% | 1.10% | 1.12% | 1.15% | 1.13% |
Expenses net of all reductions | 1.14% | 1.10% | 1.12% | 1.15% | 1.13% |
Net investment income (loss) | .39% | .39% E | .45% F | 1.06% | .22% |
Supplemental Data | | | | |
Net assets, end of period (000 omitted) | $ 138,981 | $ 101,565 | $ 78,440 | $ 10,336 | $ 8,584 |
Portfolio turnover rate D | 27% | 22% | 49% | 51% | 149% |
A Total returns would have been lower if certain expenses had not been reduced during the applicable periods shown.
B Calculated based on average shares outstanding during the period.
C Fees and expenses of any underlying Fidelity Central Funds are not included in the Fund's expense ratio. The Fund indirectly bears its proportionate share of the expenses of any underlying Fidelity Central Funds.
D Amount does not include the portfolio activity of any underlying Fidelity Central Funds.
E Investment income per share reflects a large, non-recurring dividend which amounted to $.06 per share. Excluding this non-recurring dividend, the ratio of net investment income (loss) to average net assets would have been .01%.
F Investment income per share reflects a large, non-recurring dividend which amounted to $.03 per share. Excluding this non-recurring dividend, the ratio of net investment income (loss) to average net assets would have been .18%.
G Expense ratios reflect operating expenses of the class. Expenses before reductions do not reflect amounts reimbursed by the investment adviser or reductions from brokerage service arrangements or reductions from other expense offset arrangements and do not represent the amount paid by the class during periods when reimbursements or reductions occur. Expenses net of fee waivers reflect expenses after reimbursement by the investment adviser but prior to reductions from brokerage service arrangements or other expense offset arrangements. Expenses net of all reductions represent the net expenses paid by the class.
H Amount represents less than $.01 per share.
See accompanying notes which are an integral part of the financial statements.
Annual Report
Notes to Financial Statements
For the period ended July 31, 2012
1. Organization.
Fidelity Small Cap Value Fund (the Fund) is a fund of Fidelity Securities Fund (the Trust) and is authorized to issue an unlimited number of shares. The Trust is registered under the Investment Company Act of 1940, as amended (the 1940 Act), as an open-end management investment company organized as a Massachusetts business trust. The Fund offers Class A, Class T, Class C, Small Cap Value, Class F and Institutional Class shares, each of which, along with Class B shares, has equal rights as to assets and voting privileges. Effective after the close of business on September 1, 2010, Class B shares were closed to new accounts and additional purchases, except for exchanges and reinvestments. Each class has exclusive voting rights with respect to matters that affect that class. Class F shares of the Fund are only available for purchase by mutual funds for which Fidelity Management & Research Company (FMR) or an affiliate serves as investment manager. Class B shares will automatically convert to Class A shares after a holding period of seven years from the initial date of purchase. Investment income, realized and unrealized capital gains and losses, the common expenses of the Fund, and certain fund-level expense reductions, if any, are allocated on a pro-rata basis to each class based on the relative net assets of each class to the total net assets of the Fund. Each class differs with respect to transfer agent and distribution and service plan fees incurred. Certain expense reductions may also differ by class.
2. Investments in Fidelity Central Funds.
The Fund invests in Fidelity Central Funds, which are open-end investment companies available only to other investment companies and accounts managed by FMR and its affiliates. The Fund's Schedule of Investments lists each of the Fidelity Central Funds held as of period end, if any, as an investment of the Fund, but does not include the underlying holdings of each Fidelity Central Fund. As an Investing Fund, the Fund indirectly bears its proportionate share of the expenses of the underlying Fidelity Central Funds.
The Money Market Central Funds seek preservation of capital and current income and are managed by Fidelity Investments Money Management, Inc. (FIMM), an affiliate of FMR.
A complete unaudited list of holdings for each Fidelity Central Fund is available upon request or at the Securities and Exchange Commission (the SEC) web site at www.sec.gov. In addition, the financial statements of the Fidelity Central Funds, which are not covered by the Fund's Report of Independent Registered Public Accounting Firm, are available on the SEC web site or upon request.
Annual Report
Notes to Financial Statements - continued
3. Significant Accounting Policies.
The financial statements have been prepared in conformity with accounting principles generally accepted in the United States of America (GAAP), which require management to make certain estimates and assumptions at the date of the financial statements. Actual results could differ from those estimates. Subsequent events, if any, through the date that the financial statements were issued have been evaluated in the preparation of the financial statements. The following summarizes the significant accounting policies of the Fund:
Security Valuation. Investments are valued as of 4:00 p.m. Eastern time on the last calendar day of the period. In accordance with valuation policies and procedures approved by the Board of Trustees (the Board), the Fund attempts to obtain prices from one or more third party pricing vendor or broker to value its investments. When current market prices, quotations or rates are not readily available or reliable, securities will be fair valued in good faith by the FMR Fair Value Committee (the Committee), in accordance with procedures adopted by the Fund's Board. Factors used in determining fair value vary by security type and may include market or security specific events. The frequency with which these procedures are used cannot be predicted and they may be utilized to a significant extent. The Committee oversees the Fund's valuation policies and procedures and is responsible for approving and reporting to the Board all fair value determinations.
The Fund categorizes the inputs to valuation techniques used to value its investments into a disclosure hierarchy consisting of three levels as shown below:
Level 1 - quoted prices in active markets for identical investments
Level 2 - other significant observable inputs (including quoted prices for similar investments, interest rates, prepayment speeds, etc.)
Level 3 - unobservable inputs (including the Fund's own assumptions based on the best information available)
Valuation techniques used to value the Fund's investments by major category are as follows:
Equity securities, including restricted securities, for which market quotations are readily available, are valued at the last reported sale price or official closing price as reported by a third party pricing vendor on the primary market or exchange on which they are traded and are categorized as Level 1 in the hierarchy. In the event there were no sales during the day or closing prices are not available, securities are valued at the last quoted bid price or may be valued using the last available price and are generally categorized as Level 2 in the hierarchy. For foreign equity securities, when significant market or security specific events arise, comparisons to the valuation of American Depositary Receipts
Annual Report
3. Significant Accounting Policies - continued
Security Valuation - continued
(ADRs), futures contracts, Exchange-Traded Funds (ETFs) and certain indexes as well as quoted prices for similar securities are used and are categorized as Level 2 in the hierarchy. Utilizing these techniques may result in transfers between Level 1 and Level 2.
Investments in open-end mutual funds, including the Fidelity Central Funds, are valued at their closing net asset value each business day and are categorized as Level 1 in the hierarchy.
Changes in valuation techniques may result in transfers in or out of an assigned level within the disclosure hierarchy. The aggregate value of investments by input level, as of July 31, 2012, including information on transfers between Levels 1 and 2, is included at the end of the Fund's Schedule of Investments.
Foreign Currency Translation. The Fund may use foreign currency contracts to facilitate transactions in foreign-denominated securities. Gains and losses from these transactions may arise from changes in the value of the foreign currency or if the counterparties do not perform under the contracts' terms.
Foreign-denominated assets, including investment securities, and liabilities are translated into U.S. dollars at the exchange rates at period end. Purchases and sales of investment securities, income and dividends received and expenses denominated in foreign currencies are translated into U.S. dollars at the exchange rate in effect on the transaction date.
The effects of exchange rate fluctuations on investments are included with the net realized and unrealized gain (loss) on investment securities. Other foreign currency transactions resulting in realized and unrealized gain (loss) are disclosed separately.
Investment Transactions and Income. For financial reporting purposes, the Fund's investment holdings and NAV include trades executed through the end of the last business day of the period. The NAV per share for processing shareholder transactions is calculated as of the close of business of the New York Stock Exchange (NYSE), normally 4:00 p.m. Eastern time and includes trades executed through the end of the prior business day. Gains and losses on securities sold are determined on the basis of identified cost and may include proceeds received from litigation. Dividend income is recorded on the ex-dividend date, except for certain dividends from foreign securities where the ex-dividend date may have passed, which are recorded as soon as the Fund is informed of the ex-dividend date. Non-cash dividends included in dividend income, if any, are recorded at the fair market value of the securities received. Distributions received on securities that represent a return of capital or capital gain are recorded as a reduction of
Annual Report
Notes to Financial Statements - continued
3. Significant Accounting Policies - continued
Investment Transactions and Income - continued
cost of investments and/or as a realized gain. The Fund estimates the components of distributions received that may be considered return of capital distributions or capital gain distributions. Interest income and distributions from the Fidelity Central Funds are accrued as earned. Interest income includes coupon interest and amortization of premium and accretion of discount on debt securities. Investment income is recorded net of foreign taxes withheld where recovery of such taxes is uncertain.
Expenses. Expenses directly attributable to a fund are charged to that fund. Expenses attributable to more than one fund are allocated among the respective funds on the basis of relative net assets or other appropriate methods. Expense estimates are accrued in the period to which they relate and adjustments are made when actual amounts are known.
Income Tax Information and Distributions to Shareholders. Each year, the Fund intends to qualify as a regulated investment company under Subchapter M of the Internal Revenue Code, including distributing substantially all of its taxable income and realized gains. As a result, no provision for income taxes is required. As of July 31, 2012, the Fund did not have any unrecognized tax benefits in the financial statements; nor is the Fund aware of any tax positions for which it is reasonably possible that the total amounts of unrecognized tax benefits will significantly change in the next twelve months. The Fund files a U.S. federal tax return, in addition to state and local tax returns as required. A fund's federal income tax returns are subject to examination by the Internal Revenue Service (IRS) for a period of three fiscal years after they are filed. State and local tax returns may be subject to examination for an additional fiscal year depending on the jurisdiction. Foreign taxes are provided for based on the Fund's understanding of the tax rules and rates that exist in the foreign markets in which it invests.
Distributions are declared and recorded on the ex-dividend date. Income dividends and capital gain distributions are declared separately for each class. Income and capital gain distributions are determined in accordance with income tax regulations, which may differ from GAAP. In addition, the Fund claimed a portion of the payment made to redeeming shareholders as a distribution for income tax purposes.
Capital accounts within the financial statements are adjusted for permanent book-tax differences. These adjustments have no impact on net assets or the results of operations. Temporary book-tax differences will reverse in a subsequent period.
Book-tax differences are primarily due to foreign currency transactions and losses deferred due to wash sales.
Annual Report
3. Significant Accounting Policies - continued
Income Tax Information and Distributions to Shareholders - continued
The federal tax cost of investment securities and unrealized appreciation (depreciation) as of period end were as follows:
Gross unrealized appreciation | $ 491,346,133 |
Gross unrealized depreciation | (137,153,760) |
Net unrealized appreciation (depreciation) on securities and other investments | $ 354,192,373 |
| |
Tax Cost | $ 2,383,068,475 |
The tax-based components of distributable earnings as of period end were as follows:
Undistributed ordinary income | $ 4,596,351 |
Undistributed long-term capital gain | $ 73,839,567 |
Net unrealized appreciation (depreciation) | $ 354,192,996 |
The tax character of distributions paid was as follows:
| July 31, 2012 | July 31, 2011 |
Ordinary Income | $ 3,813,704 | $ 16,899,273 |
Long-term Capital Gains | 148,970,854 | 19,302,851 |
Total | $ 152,784,558 | $ 36,202,124 |
Short-Term Trading (Redemption) Fees. Shares held by investors in the Fund less than 90 days are subject to a redemption fee equal to 1.50% of the net asset value of shares redeemed. All redemption fees, which reduce the proceeds of the shareholder redemption, are retained by the Fund and accounted for as an addition to paid in capital.
New Accounting Pronouncement. In December 2011, the Financial Accounting Standards Board issued Accounting Standard Update No. 2011-11, Disclosures about Offsetting Assets and Liabilities. The update creates new disclosure requirements requiring entities to disclose both gross and net information for derivatives and other financial instruments that are either offset in the Statement of Assets and Liabilities or subject to an enforceable master netting arrangement or similar agreement. The disclosure requirements are effective for interim and annual reporting periods beginning on or after January 1, 2013. Management is currently evaluating the impact of the update's adoption on the Fund's financial statement disclosures.
4. Purchases and Sales of Investments.
Purchases and sales of securities, other than short-term securities, aggregated $758,866,730 and $657,878,656, respectively.
Annual Report
Notes to Financial Statements - continued
5. Fees and Other Transactions with Affiliates.
Management Fee. FMR and its affiliates provide the Fund with investment management related services for which the Fund pays a monthly management fee. The management fee is the sum of an individual fund fee rate that is based on an annual rate of .45% of the Fund's average net assets and an annualized group fee rate that averaged .26% during the period. The group fee rate is based upon the average net assets of all the mutual funds advised by FMR. The group fee rate decreases as assets under management increase and increases as assets under management decrease. In addition, the management fee is subject to a performance adjustment (up to a maximum of ± .20% of the Fund's average net assets over a 36 month performance period). The upward or downward adjustment to the management fee is based on the relative investment performance of Small Cap Value as compared to an appropriate benchmark index. For the period, the total annual management fee rate, including the performance adjustment, was .85% of the Fund's average net assets.
Distribution and Service Plan Fees. In accordance with Rule 12b-1 of the 1940 Act, the Fund has adopted separate Distribution and Service Plans for each class of shares. Certain classes pay Fidelity Distributors Corporation (FDC), an affiliate of FMR, separate Distribution and Service Fees, each of which is based on an annual percentage of each class' average net assets. In addition, FDC may pay financial intermediaries for selling shares of the Fund and providing shareholder support services. For the period, the Distribution and Service Fee rates, total fees and amounts retained by FDC were as follows:
| Distribution
Fee | Service
Fee | Total Fees | Retained
by FDC |
Class A | -% | .25% | $ 346,065 | $ 6,112 |
Class T | .25% | .25% | 268,038 | 110 |
Class B | .75% | .25% | 72,196 | 54,146 |
Class C | .75% | .25% | 438,167 | 78,130 |
| | | $ 1,124,466 | $ 138,498 |
Sales Load. FDC may receive a front-end sales charge of up to 5.75% for selling Class A shares and 3.50% for selling Class T shares, some of which is paid to financial intermediaries for selling shares of the Fund. Depending on the holding period, FDC may receive contingent deferred sales charges levied on Class A, Class T, Class B, and Class C redemptions. The deferred sales charges range from 5.00% to 1.00% for Class B shares, 1.00% for Class C shares, 1.00% for certain purchases of Class A shares and .25% for certain purchases of Class T shares.
Annual Report
5. Fees and Other Transactions with Affiliates - continued
Sales Load - continued
For the period, sales charge amounts retained by FDC were as follows:
| Retained
by FDC |
Class A | $ 40,974 |
Class T | 7,602 |
Class B* | 9,371 |
Class C* | 4,952 |
| $ 62,899 |
* When Class B and Class C shares are initially sold, FDC pays commissions from its own resources to financial intermediaries through which the sales are made.
Transfer Agent Fees. Fidelity Investments Institutional Operations Company, Inc. (FIIOC), an affiliate of FMR, is the transfer, dividend disbursing and shareholder servicing agent for each class of the Fund. FIIOC receives account fees and asset-based fees that vary according to the account size and type of account of the shareholders of the respective classes of the Fund, except for Class F. FIIOC receives no fees for providing transfer agency services to Class F. FIIOC pays for typesetting, printing and mailing of shareholder reports, except proxy statements. For the period, transfer agent fees for each class were as follows:
| Amount | % of
Average
Net Assets |
Class A | $ 413,829 | .30 |
Class T | 150,262 | .28 |
Class B | 21,652 | .30 |
Class C | 131,410 | .30 |
Small Cap Value | 3,956,103 | .23 |
Institutional Class | 283,320 | .25 |
| $ 4,956,576 | |
Accounting and Security Lending Fees. Fidelity Service Company, Inc. (FSC), an affiliate of FMR, maintains the Fund's accounting records. The accounting fee is based on the level of average net assets for each month. Under a separate contract, FSC administers the security lending program. The security lending fee is based on the number and duration of lending transactions.
Brokerage Commissions. The Fund placed a portion of its portfolio transactions with brokerage firms which are affiliates of the investment adviser. The commissions paid to these affiliated firms were $23,890 for the period.
Annual Report
Notes to Financial Statements - continued
5. Fees and Other Transactions with Affiliates - continued
Interfund Lending Program. Pursuant to an Exemptive Order issued by the SEC, the Fund, along with other registered investment companies having management contracts with FMR, may participate in an interfund lending program. This program provides an alternative credit facility allowing the funds to borrow from, or lend money to, other participating affiliated funds. At period end, there were no interfund loans outstanding. The Fund's activity in this program during the period for which loans were outstanding was as follows:
Borrower or Lender | Average
Loan Balance | Weighted Average
Interest Rate | Interest
Expense |
Borrower | $ 6,367,333 | .34% | $ 359 |
6. Committed Line of Credit.
The Fund participates with other funds managed by FMR or an affiliate in a $4.25 billion credit facility (the "line of credit") to be utilized for temporary or emergency purposes to fund shareholder redemptions or for other short-term liquidity purposes. The Fund has agreed to pay commitment fees on its pro-rata portion of the line of credit, which amounted to $6,842 and is reflected in Miscellaneous expenses on the Statement of Operations. During the period, there were no borrowings on this line of credit.
7. Security Lending.
The Fund lends portfolio securities through a lending agent from time to time in order to earn additional income. For equity securities, a lending agent is used and may loan securities to certain qualified borrowers, including Fidelity Capital Markets (FCM), a broker-dealer affiliated with the Fund. On the settlement date of the loan, the Fund receives collateral (in the form of U.S. Treasury obligations, letters of credit and/or cash) against the loaned securities and maintains collateral in an amount not less than 100% of the market value of the loaned securities during the period of the loan. The market value of the loaned securities is determined at the close of business of the Fund and any additional required collateral is delivered to the Fund on the next business day. If the borrower defaults on its obligation to return the securities loaned because of insolvency or other reasons, a fund could experience delays and costs in recovering the securities loaned or in gaining access to the collateral. Any cash collateral received is invested in the Fidelity Securities Lending Cash Central Fund. The value of loaned securities and cash collateral at period end are disclosed on the Fund's Statement of Assets and Liabilities. The value of securities loaned to FCM at period end was $3,305,772. Security lending income represents the income earned on investing cash collateral, less rebates paid to borrowers and any lending agent fees associated with the loan, plus any premium payments received for lending certain types of securities. Security lending income is
Annual Report
7. Security Lending - continued
presented in the Statement of Operations as a component of income from Fidelity Central Funds. Total security lending income during the period amounted to $204,102, including $40,274 from securities loaned to FCM.
8. Expense Reductions.
Many of the brokers with whom FMR places trades on behalf of the Fund provided services to the Fund in addition to trade execution. These services included payments of certain expenses on behalf of the Fund totaling $31,201 for the period.
9. Distributions to Shareholders.
Distributions to shareholders of each class were as follows:
Years ended July 31, | 2012 | 2011 |
From net investment income | | |
Class A | $ 57,416 | $ 602,963 |
Class T | - | 175,083 |
Class B | - | 8,350 |
Class C | - | 50,685 |
Small Cap Value | 2,736,678 | 13,136,446 |
Class F | 858,633 | 1,502,640 |
Institutional Class | 160,977 | 674,898 |
Total | $ 3,813,704 | $ 16,151,065 |
From net realized gain | | |
Class A | $ 8,369,079 | $ 938,086 |
Class T | 3,332,444 | 417,804 |
Class B | 513,839 | 85,354 |
Class C | 2,835,863 | 362,483 |
Small Cap Value | 109,450,254 | 16,213,209 |
Class F | 18,207,376 | 1,278,822 |
Institutional Class | 6,261,999 | 755,301 |
Total | $ 148,970,854 | $ 20,051,059 |
10. Share Transactions.
Transactions for each class of shares were as follows:
| Shares | Dollars |
Years ended July 31, | 2012 | 2011 | 2012 | 2011 |
Class A | | | | |
Shares sold | 3,582,114 | 4,641,222 | $ 51,112,084 | $ 70,784,911 |
Reinvestment of distributions | 639,382 | 98,821 | 7,957,627 | 1,412,739 |
Shares redeemed | (3,203,028) | (2,860,682) | (45,298,282) | (43,524,578) |
Net increase (decrease) | 1,018,468 | 1,879,361 | $ 13,771,429 | $ 28,673,072 |
Annual Report
Notes to Financial Statements - continued
10. Share Transactions - continued
| Shares | Dollars |
Years ended July 31, | 2012 | 2011 | 2012 | 2011 |
Class T | | | | |
Shares sold | 1,074,645 | 1,830,956 | $ 15,238,625 | $ 27,619,849 |
Reinvestment of distributions | 264,657 | 40,370 | 3,258,576 | 573,649 |
Shares redeemed | (1,066,289) | (1,537,319) | (14,773,000) | (23,500,005) |
Net increase (decrease) | 273,013 | 334,007 | $ 3,724,201 | $ 4,693,493 |
Class B | | | | |
Shares sold | 17,886 | 84,331 | $ 244,464 | $ 1,230,023 |
Reinvestment of distributions | 36,117 | 5,817 | 433,889 | 79,168 |
Shares redeemed | (156,185) | (265,513) | (2,129,294) | (3,874,627) |
Net increase (decrease) | (102,182) | (175,365) | $ (1,450,941) | $ (2,565,436) |
Class C | | | | |
Shares sold | 840,854 | 1,131,174 | $ 11,606,643 | $ 16,672,873 |
Reinvestment of distributions | 202,948 | 25,779 | 2,439,209 | 354,104 |
Shares redeemed | (895,789) | (848,659) | (12,102,998) | (12,648,504) |
Net increase (decrease) | 148,013 | 308,294 | $ 1,942,854 | $ 4,378,473 |
Small Cap Value | | | | |
Shares sold | 27,786,966 | 35,677,635 | $ 403,227,336 | $ 541,990,483 |
Reinvestment of distributions | 8,564,707 | 1,987,755 | 107,820,730 | 28,460,668 |
Shares redeemed | (41,177,942) | (46,640,533) | (579,334,071) | (708,788,001) |
Net increase (decrease) | (4,826,269) | (8,975,143) | $ (68,286,005) | $ (138,336,850) |
Class F | | | | |
Shares sold | 17,383,615 | 11,644,633 | $ 249,495,726 | $ 177,097,711 |
Reinvestment of distributions | 1,506,337 | 192,943 | 19,066,009 | 2,781,462 |
Shares redeemed | (1,906,027) | (2,052,505) | (26,618,099) | (32,200,197) |
Net increase (decrease) | 16,983,925 | 9,785,071 | $ 241,943,636 | $ 147,678,976 |
Institutional Class | | | | |
Shares sold | 4,662,732 | 4,417,342 | $ 67,294,175 | $ 67,359,213 |
Reinvestment of distributions | 445,761 | 90,435 | 5,619,794 | 1,288,856 |
Shares redeemed | (2,373,514) | (3,788,938) | (33,655,059) | (58,540,522) |
Net increase (decrease) | 2,734,979 | 718,839 | $ 39,258,910 | $ 10,107,547 |
11. Other.
The Fund's organizational documents provide former and current trustees and officers with a limited indemnification against liabilities arising in connection with the performance of their duties to the Fund. In the normal course of business, the Fund may also enter into contracts that provide general indemnifications. The Fund's maximum exposure under these arrangements is unknown as this would be dependent on future claims that may be made against the Fund. The risk of material loss from such claims is considered remote.
Annual Report
11. Other - continued
At the end of the period, the Fidelity Freedom Funds and Fidelity Freedom K Funds were the owners of record, in the aggregate, of approximately 43% of the total outstanding shares of the Fund.
Annual Report
To the Trustees of Fidelity Securities Fund and the Shareholders of Fidelity Small Cap Value Fund:
In our opinion, the accompanying statement of assets and liabilities, including the schedule of investments, and the related statements of operations and of changes in net assets and the financial highlights present fairly, in all material respects, the financial position of Fidelity Small Cap Value Fund (a fund of Fidelity Securities Fund) at July 31, 2012, the results of its operations for the year then ended, the changes in its net assets for each of the two years in the period then ended and the financial highlights for each of the periods indicated, in conformity with accounting principles generally accepted in the United States of America. These financial statements and financial highlights (hereafter referred to as "financial statements") are the responsibility of the Fidelity Small Cap Value Fund's management. Our responsibility is to express an opinion on these financial statements based on our audits. We conducted our audits of these financial statements in accordance with the standards of the Public Company Accounting Oversight Board (United States). Those standards require that we plan and perform the audit to obtain reasonable assurance about whether the financial statements are free of material misstatement. An audit includes examining, on a test basis, evidence supporting the amounts and disclosures in the financial statements, assessing the accounting principles used and significant estimates made by management, and evaluating the overall financial statement presentation. We believe that our audits, which included confirmation of securities at July 31, 2012 by correspondence with the custodian and brokers, provide a reasonable basis for our opinion.
PricewaterhouseCoopers LLP
Boston, Massachusetts
September 12, 2012
Annual Report
The Trustees, Members of the Advisory Board, and executive officers of the trust and fund, as applicable, are listed below. The Board of Trustees governs the fund and is responsible for protecting the interests of shareholders. The Trustees are experienced executives who meet periodically throughout the year to oversee the fund's activities, review contractual arrangements with companies that provide services to the fund, oversee management of the risks associated with such activities and contractual arrangements, and review the fund's performance. Except for James C. Curvey, each of the Trustees oversees 228 funds advised by FMR or an affiliate. Mr. Curvey oversees 435 funds advised by FMR or an affiliate.
The Trustees hold office without limit in time except that (a) any Trustee may resign; (b) any Trustee may be removed by written instrument, signed by at least two-thirds of the number of Trustees prior to such removal; (c) any Trustee who requests to be retired or who has become incapacitated by illness or injury may be retired by written instrument signed by a majority of the other Trustees; and (d) any Trustee may be removed at any special meeting of shareholders by a two-thirds vote of the outstanding voting securities of the trust. Each Trustee who is not an interested person (as defined in the 1940 Act) (Independent Trustee), shall retire not later than the last day of the calendar year in which his or her 75th birthday occurs. The Independent Trustees may waive this mandatory retirement age policy with respect to individual Trustees. The executive officers and Advisory Board Members hold office without limit in time, except that any officer and Advisory Board Member may resign or may be removed by a vote of a majority of the Trustees at any regular meeting or any special meeting of the Trustees. Except as indicated, each individual has held the office shown or other offices in the same company for the past five years.
Experience, Skills, Attributes, and Qualifications of the Fund's Trustees. The Governance and Nominating Committee has adopted a statement of policy that describes the experience, qualifications, attributes, and skills that are necessary and desirable for potential Independent Trustee candidates (Statement of Policy). The Board believes that each Trustee satisfied at the time he or she was initially elected or appointed a Trustee, and continues to satisfy, the standards contemplated by the Statement of Policy. The Governance and Nominating Committee also engages professional search firms to help identify potential Independent Trustee candidates who have the experience, qualifications, attributes, and skills consistent with the Statement of Policy. From time to time, additional criteria based on the composition and skills of the current Independent Trustees, as well as experience or skills that may be appropriate in light of future changes to board composition, business conditions, and regulatory or other developments, have also been considered by the professional search firms and the Governance and Nominating Committee. In addition, the Board takes into account the Trustees' commitment and participation in Board and committee meetings, as well as their leadership of standing and ad hoc committees throughout their tenure.
In determining that a particular Trustee was and continues to be qualified to serve as a Trustee, the Board has considered a variety of criteria, none of which, in isolation, was controlling. The Board believes that, collectively, the Trustees have balanced and diverse experience, qualifications, attributes, and skills, which allow the Board to operate effectively in governing the fund and protecting the interests of shareholders. Information about the specific experience, skills, attributes, and qualifications of each Trustee, which in each case led to the Board's conclusion that the Trustee should serve (or continue to serve) as a trustee of the fund, is provided below.
Annual Report
Board Structure and Oversight Function. James C. Curvey is an interested person (as defined in the 1940 Act) and currently serves as Chairman. The Trustees have determined that an interested Chairman is appropriate and benefits shareholders because an interested Chairman has a personal and professional stake in the quality and continuity of services provided to the fund. Independent Trustees exercise their informed business judgment to appoint an individual of their choosing to serve as Chairman, regardless of whether the Trustee happens to be independent or a member of management. The Independent Trustees have determined that they can act independently and effectively without having an Independent Trustee serve as Chairman and that a key structural component for assuring that they are in a position to do so is for the Independent Trustees to constitute a substantial majority for the Board. The Independent Trustees also regularly meet in executive session. Ned C. Lautenbach serves as Chairman of the Independent Trustees and as such (i) acts as a liaison between the Independent Trustees and management with respect to matters important to the Independent Trustees and (ii) with management prepares agendas for Board meetings.
Fidelity funds are overseen by different Boards of Trustees. The fund's Board oversees Fidelity's equity and high income funds and another Board oversees Fidelity's investment-grade bond, money market, and asset allocation funds. The asset allocation funds may invest in Fidelity funds overseen by the fund's Board. The use of separate Boards, each with its own committee structure, allows the Trustees of each group of Fidelity funds to focus on the unique issues of the funds they oversee, including common research, investment, and operational issues. On occasion, the separate Boards establish joint committees to address issues of overlapping consequences for the Fidelity funds overseen by each Board.
The Trustees operate using a system of committees to facilitate the timely and efficient consideration of all matters of importance to the Trustees, the fund, and fund shareholders and to facilitate compliance with legal and regulatory requirements and oversight of the fund's activities and associated risks. The Board, acting through its committees, has charged FMR and its affiliates with (i) identifying events or circumstances the occurrence of which could have demonstrably adverse effects on the fund's business and/or reputation; (ii) implementing processes and controls to lessen the possibility that such events or circumstances occur or to mitigate the effects of such events or circumstances if they do occur; and (iii) creating and maintaining a system designed to evaluate continuously business and market conditions in order to facilitate the identification and implementation processes described in (i) and (ii) above. Because the day-to-day operations and activities of the fund are carried out by or through FMR, its affiliates and other service providers, the fund's exposure to risks is mitigated but not eliminated by the processes overseen by the Trustees. While each of the Board's committees has responsibility for overseeing different aspects of the fund's activities, oversight is exercised primarily through the Operations, Audit, and Compliance Committees. In addition, the Independent Trustees have worked with FMR to enhance the Board's oversight of investment and financial risks, legal and regulatory risks, technology risks, and operational risks, including the development of additional risk reporting to the Board. For example, a working group comprised of Independent Trustees and FMR has worked and continues to work to review the Fidelity funds' valuation-related activities, reporting and risk management. Appropriate personnel, including but not limited to the fund's Chief Compliance Officer (CCO), FMR's internal auditor, the independent accountants, the fund's Treasurer and portfolio management personnel, make periodic reports to the Board's committees, as appropriate, including an annual review of FMR's risk management program for the Fidelity funds. The responsibilities of each standing committee, including their oversight responsibilities, are described further under "Standing Committees of the Fund's Trustees."
Annual Report
Trustees and Officers - continued
The fund's Statement of Additional Information (SAI) includes more information about the Trustees. To request a free copy, call Fidelity at 1-800-544-8544.
Interested Trustees*:
Correspondence intended for each Trustee who is an interested person may be sent to Fidelity Investments, 82 Devonshire Street, Boston, Massachusetts 02109.
Name, Age; Principal Occupations and Other Relevant Experience+ |
James C. Curvey (77) |
| Year of Election or Appointment: 2007 Mr. Curvey is Trustee and Chairman of the Board of Trustees of certain Trusts. Mr. Curvey also serves as Trustee (2007-present) of other investment companies advised by FMR. Mr. Curvey is a Director of Fidelity Investments Money Management, Inc. (2009-present), Director of Fidelity Research & Analysis Co. (2009-present) and Director of FMR and FMR Co., Inc. (2007-present). Mr. Curvey is also Vice Chairman (2007-present) and Director of FMR LLC. In addition, Mr. Curvey serves as an Overseer for the Boston Symphony Orchestra and a member of the Trustees of Villanova University. Previously, Mr. Curvey was the Vice Chairman (2006-2007) and Director (2000-2007) of FMR Corp. |
Ronald P. O'Hanley (55) |
| Year of Election or Appointment: 2011 Mr. O'Hanley is Director of FMR Co., Inc. (2010-present), Director of Fidelity Investments Money Management, Inc. (2010-present), Director of Fidelity Research & Analysis Company (2010-present), President of Fidelity Asset Management and Corporate Services and a member of Fidelity's Executive Committee (2010-present). Previously, Mr. O'Hanley served as President and Chief Executive Officer of BNY Mellon Asset Management (2007-2010). Mr. O'Hanley also served as Vice Chairman of Bank New York Mellon Corp. and a member of that firm's Executive Committee. Prior to the 2007 merger of The Bank of New York and Mellon Financial Corporation, he was Vice Chairman of Mellon Financial Corporation and President and Chief Executive Officer of Mellon Asset Management. He joined Mellon in February 1997. Mr. O'Hanley currently serves as Chairman of the Boston Public Library Foundation Board of Directors and sits on the Board of Directors of Beth Israel Deaconess Medical Center, the Board of Trustees of the Marine Biological Laboratory and the Advisory Board of the Maxwell School of Citizenship and Public Administration at Syracuse University. Mr. O'Hanley also chairs the Council on Asset Management for the Financial Services Roundtable and is a member of the Board of Directors of Institutional Investor's U.S. Institute. |
* Trustees have been determined to be "Interested Trustees" by virtue of, among other things, their affiliation with the trust or various entities under common control with FMR.
+ The information above includes each Trustee's principal occupation during the last five years and other information relating to the experience, attributes, and skills relevant to each Trustee's qualifications to serve as a Trustee, which led to the conclusion that each Trustee should serve as a Trustee for the fund.
Annual Report
Trustees and Officers - continued
Independent Trustees:
Correspondence intended for each Independent Trustee (that is, the Trustees other than the Interested Trustees) may be sent to Fidelity Investments, P.O. Box 55235, Boston, Massachusetts 02205-5235.
Name, Age; Principal Occupations and Other Relevant Experience+ |
Dennis J. Dirks (64) |
| Year of Election or Appointment: 2005 Prior to his retirement in May 2003, Mr. Dirks was Chief Operating Officer and a member of the Board of The Depository Trust & Clearing Corporation (DTCC). He also served as President, Chief Operating Officer, and Board member of The Depository Trust Company (DTC) and President and Board member of the National Securities Clearing Corporation (NSCC). In addition, Mr. Dirks served as Chief Executive Officer and Board member of the Government Securities Clearing Corporation, Chief Executive Officer and Board member of the Mortgage-Backed Securities Clearing Corporation, as a Trustee and a member of the Finance Committee of Manhattan College (2005-2008), and as a Trustee and a member of the Finance Committee of AHRC of Nassau County (2006-2008). Mr. Dirks is a member of the Independent Directors Council (IDC) Governing Council (2010-present) and Board of Directors for The Brookville Center for Children's Services, Inc. (2009-present). |
Alan J. Lacy (58) |
| Year of Election or Appointment: 2008 Mr. Lacy serves as Senior Adviser (2007-present) of Oak Hill Capital Partners, L.P. (private equity). Mr. Lacy also served as Chief Executive Officer (2000-2005) and Vice Chairman (2005-2006) of Sears Holdings Corporation and Sears, Roebuck and Co. (retail). In addition, Mr. Lacy serves as a member of the Board of Directors of Dave & Buster's Entertainment, Inc. (restaurant and entertainment complexes, 2010-present), Earth Fare, Inc. (retail grocery, 2012-present), The Hillman Companies, Inc. (hardware wholesalers, 2010-present), and Bristol-Myers Squibb Company (global pharmaceuticals, 2007-present). Mr. Lacy is a member of the Board of Trustees of The National Parks Conservation Association (2006-present). Previously, Mr. Lacy served as Chairman of the Board of Trustees of the National Parks Conservation Association (2008-2011) and as a member of the Board of Directors for the Western Union Company (global money transfer, 2006-2011). |
Ned C. Lautenbach (68) |
| Year of Election or Appointment: 2000 Mr. Lautenbach is Chairman of the Independent Trustees of the Equity and High Income Funds (2006-present). Mr. Lautenbach currently serves as the Lead Director of the Eaton Corporation Board of Directors (diversified industrial, 1997-present). Mr. Lautenbach is Chairman of the Board of Directors of the Philharmonic Center for the Arts in Naples, Florida (2012-present) and a member of the Council on Foreign Relations (1994-present). Previously, Mr. Lautenbach was a Partner/Advisory Partner at Clayton, Dubilier & Rice, LLC (private equity investment, 1998-2010), as well as a Director of Sony Corporation (2006-2007). |
Joseph Mauriello (67) |
| Year of Election or Appointment: 2008 Prior to his retirement in January 2006, Mr. Mauriello served in numerous senior management positions including Deputy Chairman and Chief Operating Officer (2004-2005), and Vice Chairman of Financial Services (2002-2004) of KPMG LLP US (professional services, 1965-2005). Mr. Mauriello currently serves as a member of the Board of Directors of XL Group plc. (global insurance and re-insurance, 2006-present). Previously, Mr. Mauriello served as a Director of the Hamilton Funds of the Bank of New York (2006-2007) and of Arcadia Resources Inc. (health care services and products, 2007-2012). |
Robert W. Selander (61) |
| Year of Election or Appointment: 2011 Previously, Mr. Selander served as a Member of the Advisory Board of Fidelity's Equity and High Income Funds (2011), Executive Vice Chairman (2010), Chief Executive Officer (2009-2010), and President and Chief Executive Officer (1997-2009) of Mastercard, Inc. |
Cornelia M. Small (68) |
| Year of Election or Appointment: 2005 Ms. Small is a member of the Board of Directors of the Teagle Foundation (2009-present). Ms. Small is also a member of the Investment Committee, and Chair (2008-present) and a member of the Board of Trustees of Smith College. In addition, Ms. Small serves on the Investment Committee of the Berkshire Taconic Community Foundation (2008-present). Previously, Ms. Small served as Chairperson of the Investment Committee (2002-2008) of Smith College. In addition, Ms. Small served as Chief Investment Officer, Director of Global Equity Investments, and a member of the Board of Directors of Scudder, Stevens & Clark and Scudder Kemper Investments. |
William S. Stavropoulos (73) |
| Year of Election or Appointment: 2002 Mr. Stavropoulos is Vice Chairman of the Independent Trustees of the Equity and High Income Funds (2006-present). Mr. Stavropoulos serves as President and Founder of the Michigan Baseball Foundation, the Great Lakes Loons (2007-present). Mr. Stavropoulos is Chairman Emeritus of the Board of Directors of The Dow Chemical Company, where he previously served in numerous senior management positions, including President, CEO (1995-2000; 2002-2004), Chairman of the Executive Committee (2000-2006), and as a member of the Board of Directors (1990-2006). Currently, Mr. Stavropoulos is Chairman of Univar (global distributor of commodity and specialty chemicals, 2010-present), a Director of Teradata Corporation (data warehousing and technology solutions, 2008-present), Chemical Financial Corporation, Maersk Inc. (industrial conglomerate), Tyco International, Inc. (multinational manufacturing and services, 2007-present), and a member of the Advisory Board for Metalmark Capital (private equity investment, 2005-present). Mr. Stavropoulos is a special advisor to Clayton, Dubilier & Rice, LLC (private equity investment). In addition, Mr. Stavropoulos is a member of the University of Notre Dame Advisory Council for the College of Science. |
David M. Thomas (63) |
| Year of Election or Appointment: 2008 Previously, Mr. Thomas served as Executive Chairman (2005-2006) and Chairman and Chief Executive Officer (2000-2005) of IMS Health, Inc. (pharmaceutical and healthcare information solutions). In addition, Mr. Thomas serves as a member of the Board of Directors of Fortune Brands, Inc. (consumer products), and Interpublic Group of Companies, Inc. (marketing communication, 2004-present). |
Michael E. Wiley (61) |
| Year of Election or Appointment: 2008 Mr. Wiley also serves as a Director of Asia Pacific Exploration Consolidated (international oil and gas exploration and production, 2008-present). Mr. Wiley serves as a Director of Tesoro Corporation (independent oil refiner and marketer, 2005-present), and a Director of Bill Barrett Corporation (exploration and production, 2005-present). In addition, Mr. Wiley also serves as a Director of Post Oak Bank (privately-held bank, 2004-present). Previously, Mr. Wiley served as a member of the Board of Trustees of the University of Tulsa (2000-2006; 2007-2010), as a Senior Energy Advisor of Katzenbach Partners, LLC (consulting, 2006-2007), as an Advisory Director of Riverstone Holdings (private investment), Chairman, President, and CEO of Baker Hughes, Inc. (oilfield services, 2000-2004), and as Director of Spinnaker Exploration Company (exploration and production, 2001-2005). |
Annual Report
+ The information above includes each Trustee's principal occupation during the last five years and other information relating to the experience, attributes, and skills relevant to each Trustee's qualifications to serve as a Trustee, which led to the conclusion that each Trustee should serve as a Trustee for the fund.
Advisory Board Members and Executive Officers:
Correspondence intended for David A. Rosow and Garnett A. Smith may be sent to Fidelity Investments, P.O. Box 55235, Boston, Massachusetts 02205-5235. Correspondence intended for each executive officer, Edward C. Johnson 3d, and Peter S. Lynch may be sent to Fidelity Investments, 82 Devonshire Street, Boston, Massachusetts 02109.
Name, Age; Principal Occupation |
Edward C. Johnson 3d (82) |
| Year of Election or Appointment: 2011 Member of the Advisory Board of Fidelity's Equity and High Income Funds. Mr. Johnson serves as Chief Executive Officer, Chairman, and a Director of FMR LLC, and also serves as Chairman and Director of FIL Limited. Previously, Mr. Johnson served as a Trustee and Chairman of the Board of certain Fidelity Trusts, Chairman and a Director of FMR, Chairman and a Director of FMR Co., Inc., and President of FMR LLC (2006-2007). |
Peter S. Lynch (68) |
| Year of Election or Appointment: 2003 Member of the Advisory Board of Fidelity's Equity and High Income Funds. Mr. Lynch is Vice Chairman and a Director of FMR and FMR Co., Inc. In addition, Mr. Lynch serves as a Trustee of Boston College and as the Chairman of the Inner-City Scholarship Fund. Previously, Mr. Lynch served on the Special Olympics International Board of Directors (1997-2006). |
David A. Rosow (69) |
| Year of Election or Appointment: 2012 Member of the Advisory Board of Fidelity's Equity and High Income Funds. Chairman and Chief Executive Officer of International Golf Group, Inc. (golf course development, 1990-present). Previously, Mr. Rosow served as Chairman and Chief Executive Officer of Rosow & Company, Inc. (private investment company, 1989-2011), a Lead Director of Hudson United Bancorp (2001-2006) and as a Director of TD Banknorth (1996-2006). In addition, Mr. Rosow is a member (2008-present) and President (2009-present) of the Town Council of Palm Beach, Florida. |
Garnett A. Smith (64) |
| Year of Election or Appointment: 2012 Member of the Advisory Board of Fidelity's Equity and High Income Funds. Prior to Mr. Smith's retirement, he served as Chairman and Chief Executive Officer of Inbrand Corp. (manufacturer of personal absorbent products, 1990-1997). He also served as President (1986-1990) of Inbrand Corp. Prior to his employment with Inbrand Corp., he was employed by a retail fabric chain and North Carolina National Bank. In addition, Mr. Smith is a board member of the Jackson Hole Land Trust (2009-present). |
Kenneth B. Robins (42) |
| Year of Election or Appointment: 2008 President and Treasurer of Fidelity's Equity and High Income Funds. Mr. Robins also serves as President and Treasurer (2010-present) and Assistant Treasurer (2009-present) of other Fidelity funds and is an employee of Fidelity Investments (2004-present). Previously, Mr. Robins served as Deputy Treasurer of the Fidelity funds (2005-2008) and Treasurer and Chief Financial Officer of The North Carolina Capital Management Trust: Cash and Term Portfolios (2006-2008). |
Brian B. Hogan (47) |
| Year of Election or Appointment: 2009 Vice President of Equity and High Income Funds. Mr. Hogan also serves as President of FMR's Equity Division (2009-present). Previously, Mr. Hogan served as Senior Vice President, Equity Research of FMR (2006-2009) and as a portfolio manager. |
Thomas C. Hense (48) |
| Year of Election or Appointment: 2008 or 2010 Vice President of Fidelity's High Income (2008), Small Cap (2008), and Value (2010) Funds. Previously, Mr. Hense served as a portfolio manager for Fidelity's Institutional Money Management Group (Pyramis) (2003-2008). |
Scott C. Goebel (44) |
| Year of Election or Appointment: 2008 Secretary and Chief Legal Officer (CLO) of the Fidelity funds. Mr. Goebel also serves as Secretary of Fidelity Investments Money Management, Inc. (FIMM) (2010-present) and Fidelity Research and Analysis Company (FRAC) (2010-present); Secretary and CLO of The North Carolina Capital Management Trust: Cash and Term Portfolios (2008-present); General Counsel, Secretary, and Senior Vice President of FMR (2008-present) and FMR Co., Inc. (2008-present); employed by FMR LLC or an affiliate (2001-present); Chief Legal Officer of Fidelity Management & Research (Hong Kong) Limited (2008-present) and Assistant Secretary of Fidelity Management & Research (Japan) Inc. (2008-present), and Fidelity Management & Research (U.K.) Inc. (2008-present). Previously, Mr. Goebel served as Assistant Secretary of FIMM (2008-2010), FRAC (2008-2010), and the Funds (2007-2008) and as Vice President and Secretary of Fidelity Distributors Corporation (FDC) (2005-2007). |
William C. Coffey (43) |
| Year of Election or Appointment: 2009 Assistant Secretary of Fidelity's Equity and High Income Funds. Mr. Coffey also serves as Senior Vice President and Deputy General Counsel of FMR LLC (2010-present), and is an employee of Fidelity Investments. Previously, Mr. Coffey served as Vice President and Associate General Counsel of FMR LLC (2005-2009). |
Elizabeth Paige Baumann (44) |
| Year of Election or Appointment: 2012 Anti-Money Laundering (AML) Officer of the Fidelity funds. Ms. Baumann also serves as AML Officer of The North Carolina Capital Management Trust: Cash and Term Portfolios (2012-present), Chief AML Officer of FMR LLC (2012-present), and is an employee of Fidelity Investments. Previously, Ms. Baumann served as Vice President and Deputy Anti-Money Laundering Officer (2007-2012). |
Christine Reynolds (53) |
| Year of Election or Appointment: 2008 Chief Financial Officer of the Fidelity funds. Ms. Reynolds became President of Fidelity Pricing and Cash Management Services (FPCMS) in August 2008. Ms. Reynolds served as Chief Operating Officer of FPCMS (2007-2008). Previously, Ms. Reynolds served as President, Treasurer, and Anti-Money Laundering officer of the Fidelity funds (2004-2007). |
Joseph A. Hanlon (44) |
| Year of Election or Appointment: 2012 Chief Compliance Officer of Fidelity's Equity and High Income Funds. Mr. Hanlon serves as Compliance Officer of FMR, FMR Co., Inc., Fidelity Investments Money Management, Inc. (FIMM), Fidelity Research and Analysis Company (FRAC), Fidelity Management & Research (Japan) Inc., Fidelity Management & Research (U.K.) Inc., Fidelity Management & Research (Hong Kong), and Strategic Advisers, Inc. (2009-present), as Senior Vice President of the Fidelity Asset Management Division (2009-present), and is an employee of Fidelity Investments. |
Joseph F. Zambello (55) |
| Year of Election or Appointment: 2011 Deputy Treasurer of the Fidelity funds. Mr. Zambello is an employee of Fidelity Investments. Previously, Mr. Zambello served as Vice President of FMR's Program Management Group (2009-2011) and Vice President of the Transfer Agent Oversight Group (2005-2009). |
Adrien E. Deberghes (44) |
| Year of Election or Appointment: 2008 Deputy Treasurer of Fidelity's Equity and High Income Funds. Mr. Deberghes also serves as Vice President (2011-present) and Assistant Treasurer (2010-present) of other Fidelity funds, and is an employee of Fidelity Investments (2008-present). Previously, Mr. Deberghes served as Senior Vice President of Mutual Fund Administration at State Street Corporation (2007-2008), Senior Director of Mutual Fund Administration at Investors Bank & Trust (2005-2007), and Director of Finance for Dunkin' Brands (2000-2005). |
Stephanie J. Dorsey (43) |
| Year of Election or Appointment: 2010 Assistant Treasurer of Fidelity's Equity and High Income Funds. Ms. Dorsey also serves as Deputy Treasurer of other Fidelity funds (2008-present) and is an employee of Fidelity Investments (2008-present). Previously, Ms. Dorsey served as Treasurer (2004-2008) of the JPMorgan Mutual Funds and Vice President (2004-2008) of JPMorgan Chase Bank. |
John R. Hebble (54) |
| Year of Election or Appointment: 2009 Assistant Treasurer of Fidelity's Equity and High Income Funds. Mr. Hebble also serves as President (2011-present), Treasurer, and Chief Financial Officer of The North Carolina Capital Management Trust: Cash and Term Portfolios (2008-present), President and Treasurer of other Fidelity funds (2008-present) and is an employee of Fidelity Investments. |
Gary W. Ryan (53) |
| Year of Election or Appointment: 2005 Assistant Treasurer of the Fidelity funds. Mr. Ryan is an employee of Fidelity Investments. Previously, Mr. Ryan served as Vice President of Fund Reporting in Fidelity Pricing and Cash Management Services (FPCMS) (1999-2005). |
Jonathan Davis (44) |
| Year of Election or Appointment: 2010 Assistant Treasurer of the Fidelity funds. Mr. Davis is also Assistant Treasurer of Fidelity Rutland Square Trust II and Fidelity Commonwealth Trust II. Mr. Davis is an employee of Fidelity Investments. Previously, Mr. Davis served as Vice President and Associate General Counsel of FMR LLC (2003-2010). |
Annual Report
The Board of Trustees of Fidelity Small Cap Value Fund voted to pay on September 10, 2012 to shareholders of record at the opening of business on September 7, 2012, a distribution of $0.411 per share derived from capital gains realized from sales of portfolio securities and a dividend of $0.025 per share from net investment income.
Small Cap Value designates 100% of the dividends distributed during the fiscal year as qualifying for the dividends-received deduction for corporate shareholders.
Small Cap Value designates 100% of the dividends distributed during the fiscal year as amounts which can be taken into account as a dividend for the purposes of the maximum rate under section 1(h)(11) of the Internal Revenue Code.
The fund hereby designates as a capital gain dividend with respect to the taxable year ended July 31, 2012, $98,274,256, or, if subsequently determined to be different, the net capital gain of such year.
The fund will notify shareholders in January 2013 of amounts for use in preparing 2012 income tax returns.
Annual Report
Board Approval of Investment Advisory Contracts and Management Fees
Fidelity Small Cap Value Fund
Each year, the Board of Trustees, including the Independent Trustees (together, the Board), votes on the renewal of the management contract and sub-advisory agreements (together, the Advisory Contracts) for the fund. The Board, assisted by the advice of fund counsel and Independent Trustees' counsel, requests and considers a broad range of information relevant to the renewal of the Advisory Contracts throughout the year.
The Board meets regularly and, at each of its meetings, considers factors that are relevant to its annual consideration of the renewal of the fund's Advisory Contracts, including the services and support provided to the fund and its shareholders. The Board has established various standing committees, each composed of and chaired by Independent Trustees with varying backgrounds, to which the Board has assigned specific subject matter responsibilities in order to enhance effective decision-making by the Board. The Board, acting directly and through its Committees, requests and receives information concerning the annual consideration of the renewal of the fund's Advisory Contracts. The Board also meets as needed to consider matters specifically related to the Board's annual consideration of the renewal of Advisory Contracts. Members of the Board may also meet with trustees of other Fidelity funds through ad hoc joint committees to discuss certain matters relevant to the Fidelity funds.
At its July 2012 meeting, the Board of Trustees, including the Independent Trustees, unanimously determined to renew the fund's Advisory Contracts. In reaching its determination, the Board considered all factors it believed relevant, including (i) the nature, extent, and quality of the services to be provided to the fund and its shareholders (including the investment performance of the fund); (ii) the competitiveness of the fund's management fee and total expense ratio relative to peer funds; (iii) the total costs of the services to be provided by and the profits to be realized by Fidelity from its relationship with the fund; (iv) the extent to which economies of scale exist and would be realized as the fund grows; and (v) whether fee levels reflect these economies of scale, if any, for the benefit of fund shareholders.
In considering whether to renew the Advisory Contracts for the fund, the Board reached a determination, with the assistance of fund counsel and Independent Trustees' counsel and through the exercise of its business judgment, that the renewal of the Advisory Contracts is in the best interests of the fund and its shareholders and that the compensation payable under the Advisory Contracts is fair and reasonable. The Board's decision to renew the Advisory Contracts was not based on any single factor, but rather was based on a comprehensive consideration of all the information provided to the Board at its meetings throughout the year. The Board, in reaching its determination to renew the Advisory Contracts, is aware that shareholders in the fund have a broad range of investment choices available to them, including a wide choice among mutual funds offered by Fidelity's competitors, and that the fund's shareholders, who have the opportunity to review and weigh the disclosure provided by the fund in its prospectus and other public disclosures, have chosen to invest in this fund, managed by Fidelity.
Annual Report
Board Approval of Investment Advisory Contracts and
Management Fees - continued
Nature, Extent, and Quality of Services Provided. The Board considered the staffing within the investment adviser, FMR, and the sub-advisers (together, the Investment Advisers), including the backgrounds of the fund's investment personnel, and also considered the fund's investment objective, strategies, and related investment philosophy. The Independent Trustees also had discussions with senior management of Fidelity's investment operations and investment groups. The Board considered the structure of the portfolio manager compensation program and whether this structure provides appropriate incentives to act in the best interests of the fund.
Resources Dedicated to Investment Management and Support Services. The Board and the Fund Oversight and Research Committees reviewed the general qualifications and capabilities of the Investment Advisers' investment staff, including its size, education, experience, and resources, as well as the Investment Advisers' approach to recruiting, training, managing, and compensating investment personnel. The Board also noted that FMR has continued to increase the resources devoted to non-U.S. offices, including expansion of Fidelity's global investment organization. The Board noted that Fidelity's analysts have extensive resources, tools and capabilities that allow them to conduct sophisticated quantitative and fundamental analysis, as well as credit analysis of issuers, counterparties and guarantors. The Board also believes that Fidelity's investment professionals have sufficient access to global information and data so as to provide competitive investment results over time, and that those professionals also have access to sophisticated tools that permit them to assess portfolio construction and risk and performance attribution characteristics continuously, as well as to transmit new information and research conclusions rapidly around the world. Additionally, in its deliberations, the Board considered the Investment Advisers' trading and risk management capabilities and resources, which are an integral part of the investment management process.
Shareholder and Administrative Services. The Board considered (i) the nature, extent, quality, and cost of advisory, administrative, and shareholder services performed by the Investment Advisers and their affiliates under the Advisory Contracts and under separate agreements covering transfer agency, pricing and bookkeeping, and securities lending services for the fund; (ii) the nature and extent of the supervision of third party service providers, principally custodians and subcustodians; and (iii) the resources devoted to, and the record of compliance with, the fund's compliance policies and procedures. The Board also reviewed the allocation of fund brokerage, including allocations to brokers affiliated with the Investment Advisers, the use of brokerage commissions to pay fund expenses, and the use of "soft" commission dollars to pay for research services.
Annual Report
The Board noted that the growth of fund assets over time across the complex allows Fidelity to reinvest in the development of services designed to enhance the value or convenience of the Fidelity funds as investment vehicles. These services include 24-hour access to account information and market information through telephone representatives and over the Internet, investor education materials and asset allocation tools, and the expanded availability of Fidelity Investor Centers.
Investment in a Large Fund Family. The Board considered the benefits to shareholders of investing in a Fidelity fund, including the benefits of investing in a fund that is part of a large family of funds offering a variety of investment disciplines and providing a large variety of mutual fund investor services. The Board noted that Fidelity had taken, or had made recommendations that resulted in the Fidelity funds taking, a number of actions over the previous year that benefited particular funds, including (i) continuing to dedicate additional resources to investment research and support of the senior management team that oversees asset management; (ii) persisting in efforts to enhance Fidelity's research capabilities, in particular, international research; (iii) launching new funds and making other enhancements to meet client needs for global and income-oriented solutions; (iv) continuing to launch dedicated lower cost underlying funds to meet investment management's portfolio construction needs related to expanding underlying fund options, specifically for the Freedom Fund product lines; (v) adopting a "Stock Selector" sector neutral investment approach and employing a team of portfolio managers who are sector specialists to manage certain funds; (vi) rationalizing product lines and gaining increased efficiencies through the mergers of several funds into other funds; (vii) strengthening the Spartan Index Fund product line by adding new funds and/or new low-cost institutional share classes, restructuring fund expenses to accommodate new classes, and reducing investment minimums for certain classes of shares; (viii) modifying the eligibility criteria for Institutional Class shares to increase their appeal to government entities and charitable investors; and (ix) reducing certain transfer agent fee rates.
Investment Performance. The Board considered whether the fund has operated in accordance with its investment objective, as well as its record of compliance with its investment restrictions. It also reviewed the fund's absolute investment performance for each class, as well as the fund's relative investment performance for each class measured over multiple periods against (i) a broad-based securities market index, and (ii) a peer group of mutual funds deemed appropriate by Fidelity and reviewed by the Board. The following charts considered by the Board show, over the one-, three-, and five-year periods ended December 31, 2011, the cumulative total returns of Institutional Class (Class I) and Class B of the fund, the cumulative total returns of a broad-based securities market index ("benchmark"), and a range of cumulative total returns of a peer group of mutual funds identified by Morningstar, Inc. as having an investment style similar to that of the fund based on underlying portfolio holdings. The returns of Institutional Class (Class I) and Class B show the performance of the highest and lowest performing classes, respectively (based on five-year performance). The box within each chart shows the 25th percentile return (top of box) and the 75th percentile return (bottom of box) of the peer group. Returns shown above the box are in the first quartile and returns shown below the box are in the fourth quartile. The percentage beaten numbers noted below each chart correspond to the percentile box and represent the percentage of funds in the peer group whose performance was equal to or lower than that of the class indicated.
Annual Report
Board Approval of Investment Advisory Contracts and
Management Fees - continued
Fidelity Small Cap Value Fund

The Board reviewed the fund's relative investment performance against its peer group and noted that the performance of Institutional Class (Class I) of the fund was in the second quartile for the one- and three-year periods and the first quartile for the five-year period. The Board also noted that the investment performance of Institutional Class (Class I) of the fund compared favorably to its benchmark for all the periods shown. The Board considered that the variations in performance among the fund's classes reflect the variations in class expenses, which result in lower performance for higher expense classes. The Board also reviewed the fund's performance since inception as well as performance in the current year.
The Board also considered that the fund's management fee is subject to upward or downward adjustment depending upon whether, and to what extent, the fund's investment performance for the performance period exceeds, or is exceeded by, the record (over the same period) of a Board-approved performance adjustment index. The Board noted that the performance adjustment provides FMR with a strong economic incentive to seek to achieve superior performance for the fund's shareholders and helps to more closely align the interests of FMR and the fund's shareholders.
Annual Report
Based on its review, the Board concluded that the nature, extent, and quality of services provided to the fund under the Advisory Contracts should benefit the fund's shareholders.
Competitiveness of Management Fee and Total Expense Ratio. The Board considered the fund's management fee and total expense ratio compared to "mapped groups" of competitive funds and classes. Fidelity creates "mapped groups" by combining similar Lipper investment objective categories that have comparable management fee characteristics. Combining Lipper investment objective categories aids the Board's management fee and total expense ratio comparisons by broadening the competitive group used for comparison and by reducing the number of universes to which various Fidelity funds are compared.
Management Fee. The Board considered two proprietary management fee comparisons for the 12-month periods shown in the chart below. The group of Lipper funds used by the Board for management fee comparisons is referred to below as the "Total Mapped Group." The Total Mapped Group comparison focuses on a fund's standing relative to the total universe of comparable funds available to investors in terms of gross management fees before expense reimbursements or caps, and without giving effect to the fund's performance adjustment. "TMG %" represents the percentage of funds in the Total Mapped Group that had management fees that were lower than the fund's. For example, a TMG % of 13% means that 87% of the funds in the Total Mapped Group had higher management fees than the fund. The "Asset-Size Peer Group" (ASPG) comparison focuses on a fund's standing relative to non-Fidelity funds similar in size to the fund within the Total Mapped Group. The ASPG represents at least 15% of the funds in the Total Mapped Group with comparable asset size and management fee characteristics, subject to a minimum of 50 funds (or all funds in the Total Mapped Group if fewer than 50). Additional information, such as the ASPG quartile in which the fund's management fee ranked and the impact of the fund's performance adjustment, is also included in the chart and considered by the Board.
Annual Report
Board Approval of Investment Advisory Contracts and
Management Fees - continued
Fidelity Small Cap Value Fund

The Board noted that the fund's management fee ranked below the median of its Total Mapped Group and below the median of its ASPG for 2011. The Board also noted the effect of the fund's positive performance adjustment on the fund's management fee ranking. The Board noted that the performance adjustment for each year represents calculations for performance periods that differ from the periods shown in the performance charts above.
Based on its review, the Board concluded that the fund's management fee is fair and reasonable in light of the services that the fund receives and the other factors considered.
Total Expense Ratio. In its review of each class's total expense ratio, the Board considered the fund's management fee as well as other fund or class expenses, as applicable, such as transfer agent fees, pricing and bookkeeping fees, fund-paid 12b-1 fees, and custodial, legal, and audit fees. The Board also noted the effects of any waivers and reimbursements on fees and expenses, as well as the impact of the fund's performance adjustment. As part of its review, the Board also considered the current and historical total expense ratios of each class of the fund compared to competitive fund median expenses. Each class of the fund is compared to those funds and classes in the Total Mapped Group (used by the Board for management fee comparisons) that have a similar sales load structure.
The Board noted that the total expense ratio of each of the retail class and Class F ranked below its competitive median for 2011, the total expense ratio of Institutional Class ranked equal to its competitive median for 2011, and the total expense ratio of each of Class A, Class T, Class B, and Class C ranked above its competitive median for 2011. The Board considered that various factors, including 12b-1 fees, positive or negative performance adjustments, and relatively higher other expenses in the case of small fund size, can affect total expense ratios. The Board noted that the total expense ratio of Class T was above the competitive median primarily because of higher 12b-1 fees on Class T. Class T has a higher 12b-1 fee, but a lower front-end sales charge, than traditionally priced front-end sales charge classes. The Board considered that Class T is primarily sold load-waived in the retirement plan market where its 0.50% 12b-1 fee is comparable to competing no-load, higher 12b-1 fee classes designed specifically for retirement plans. The Board noted that the fund offers multiple classes, each of which has a different sales load and 12b-1 fee structure, and that the multiple structures are intended to offer a range of pricing options for the intermediary market. The Board also noted that the total expense ratios of the classes vary primarily by the level of their 12b-1 fees, although differences in transfer agent fees may also cause expenses to vary from class to class.
Annual Report
Fees Charged to Other Fidelity Clients. The Board also considered Fidelity fee structures and other information with respect to clients of FMR and its affiliates, such as other mutual funds advised or subadvised by FMR or its affiliates, pension plan clients, and other institutional clients. The Board noted the findings of the 2010 ad hoc joint committee (created with the board of other Fidelity funds), which reviewed and compared Fidelity's institutional investment advisory business with its business of providing services to the Fidelity funds, including the differences in services provided, fees charged, and costs incurred, as well as competition in their respective marketplaces.
Based on its review of total expense ratios and fees charged to other Fidelity clients, the Board concluded that the total expense ratio of each class of the fund was reasonable, although in some cases above the median of the universe presented for comparison, in light of the services that the fund and its shareholders receive and the other factors considered.
Costs of the Services and Profitability. The Board considered the revenues earned and the expenses incurred by Fidelity in conducting the business of developing, marketing, distributing, managing, administering and servicing the fund and its shareholders. The Board also considered the level of Fidelity's profits in respect of all the Fidelity funds.
On an annual basis, FMR presents to the Board Fidelity's profitability for the fund. Fidelity calculates the profitability for each fund, as well as aggregate profitability for groups of Fidelity funds and all Fidelity funds, using a series of detailed revenue and cost allocation methodologies which originate with the books and records of Fidelity on which Fidelity's audited financial statements are based. The Audit Committee of the Board reviews any significant changes from the prior year's methodologies.
Annual Report
Board Approval of Investment Advisory Contracts and
Management Fees - continued
PricewaterhouseCoopers LLP (PwC), independent registered public accounting firm and auditor to Fidelity and certain Fidelity funds, has been engaged annually by the Board as part of the Board's assessment of Fidelity's profitability analysis. PwC's engagement includes the review and assessment of Fidelity's methodologies used in determining the revenues and expenses attributable to Fidelity's mutual fund business, and completion of agreed-upon procedures surrounding the mathematical accuracy of fund profitability and its conformity to allocation methodologies. After considering PwC's reports issued under the engagement and information provided by Fidelity, the Board concluded that while other allocation methods may also be reasonable, Fidelity's profitability methodologies are reasonable in all material respects.
The Board also reviewed Fidelity's non-fund businesses and fall-out benefits related to the mutual fund business as well as cases where Fidelity's affiliates may benefit from or be related to the fund's business.
The Board considered the costs of the services provided by and the profits realized by Fidelity in connection with the operation of the fund and was satisfied that the profitability was not excessive in the circumstances.
Economies of Scale. The Board considered whether there have been economies of scale in respect of the management of the Fidelity funds, whether the Fidelity funds (including the fund) have appropriately benefited from any such economies of scale, and whether there is potential for realization of any further economies of scale. The Board considered the extent to which the fund will benefit from economies of scale through increased services to the fund, through waivers or reimbursements, or through fee or expense reductions. The Board also noted that in 2009, it and the board of other Fidelity funds created an ad hoc committee (the Economies of Scale Committee) to analyze whether FMR attains economies of scale in respect of the management and servicing of the Fidelity funds, whether the Fidelity funds have appropriately benefited from such economies of scale, and whether there is potential for realization of any further economies of scale.
The Board recognized that the fund's management contract incorporates a "group fee" structure, which provides for lower group fee rates as total fund assets under FMR's management increase, and for higher group fee rates as total fund assets under FMR's management decrease. FMR calculates the group fee rates based on a tiered asset "breakpoint" schedule that varies based on asset class. The Board considered that the group fee is designed to deliver the benefits of economies of scale to fund shareholders when total Fidelity fund assets increase, even if assets of any particular fund are unchanged or have declined, because some portion of Fidelity's costs are attributable to services provided to all Fidelity funds, and all funds benefit if those costs can be allocated among more assets. The Board concluded that, given the group fee structure, fund shareholders will benefit from lower management fees as assets under FMR's management increase at the fund complex level, regardless of whether Fidelity achieves any such economies of scale.
Annual Report
The Board concluded, taking into account the analysis of the Economies of Scale Committee, that economies of scale, if any, are being appropriately shared between fund shareholders and Fidelity.
Additional Information Requested by the Board. In order to develop fully the factual basis for consideration of the Fidelity funds' Advisory Contracts, the Board requested and received additional information on certain topics, including (i) fund performance trends, actions to be taken by FMR to improve certain funds' overall performance, and Fidelity's long-term strategies for certain funds; (ii) the potential to further rationalize the Fidelity fund lineup with the possibility of achieving savings for the funds and Fidelity; (iii) Fidelity's compensation structure for portfolio managers and other key investment personnel; (iv) the amount of the investment that each portfolio manager has made in the Fidelity fund(s) that he or she manages; (v) the realization of fall-out benefits in certain Fidelity business units; (vi) Fidelity's group fee structures, the potential impact of regulatory changes on such structures, and the rationale for the individual fee rates of certain funds; (vii) fund profitability methodology, including Fidelity's cost allocation methodology, and the impact of certain factors on fund profitability results; (viii) trends regarding industry use of performance fee structures and the possibility of implementing performance fee structures for additional funds; and (ix) the impact of net redemptions from the Fidelity funds.
Based on its evaluation of all of the conclusions noted above, and after considering all factors it believed relevant, the Board ultimately concluded that the advisory fee structures are fair and reasonable, and that the fund's Advisory Contracts should be renewed.
Annual Report
Investment Adviser
Fidelity Management & Research Company
Boston, MA
Investment Sub-Advisers
FMR Co., Inc.
Fidelity Management & Research
(U.K.) Inc.
Fidelity Management & Research
(Hong Kong) Limited
Fidelity Management & Research
(Japan) Inc.
General Distributor
Fidelity Distributors Corporation
Smithfield, RI
Transfer and Service Agents
Fidelity Investments Institutional
Operations Company, Inc.
Boston, MA
Fidelity Service Company, Inc.
Boston, MA
Custodian
Citibank, N.A.
New York, NY
The Fidelity Telephone Connection
Mutual Fund 24-Hour Service
Exchanges/Redemptions
and Account Assistance 1-800-544-6666
Product Information 1-800-544-6666
Retirement Accounts 1-800-544-4774
(8 a.m. - 9 p.m.)
TDD Service 1-800-544-0118
for the deaf and hearing impaired
(9 a.m. - 9 p.m. Eastern time)
Fidelity Automated Service
Telephone (FAST®)
1-800-544-5555
Automated line for quickest service
(Fidelity Investment logo)(registered trademark)
Corporate Headquarters
82 Devonshire St., Boston, MA 02109
www.fidelity.com
SCV-UANN-0912
1.803705.107
Fidelity®
Small Cap Value
Fund
Class F
Annual Report
July 31, 2012
(Fidelity Cover Art)
Contents
Performance | (Click Here) | How the fund has done over time. |
Management's Discussion of Fund Performance | (Click Here) | The Portfolio Manager's review of fund performance and strategy. |
Shareholder Expense Example | (Click Here) | An example of shareholder expenses. |
Investment Changes | (Click Here) | A summary of major shifts in the fund's investments over the past six months. |
Investments | (Click Here) | A complete list of the fund's investments with their market values. |
Financial Statements | (Click Here) | Statements of assets and liabilities, operations, and changes in net assets, as well as financial highlights. |
Notes | (Click Here) | Notes to the financial statements. |
Report of Independent Registered Public Accounting Firm | (Click Here) | |
Trustees and Officers | (Click Here) | |
Distributions | (Click Here) | |
Board Approval of Investment Advisory Contracts and Management Fees | (Click Here) | |
To view a fund's proxy voting guidelines and proxy voting record for the 12-month period ended June 30, visit http://www.fidelity.com/proxyvotingresults or visit the Securities and Exchange Commission's (SEC) web site at http://www.sec.gov. You may also call 1-800-835-5092 to request a free copy of the proxy voting guidelines.
Standard & Poor's, S&P and S&P 500 are registered service marks of The McGraw-Hill Companies, Inc. and have been licensed for use by Fidelity Distributors Corporation.
Other third party marks appearing herein are the property of their respective owners.
All other marks appearing herein are registered or unregistered trademarks or service marks of FMR LLC or an affiliated company. © 2012 FMR LLC. All rights reserved.
Annual Report
This report and the financial statements contained herein are submitted for the general information of the shareholders of the fund. This report is not authorized for distribution to prospective investors in the fund unless preceded or accompanied by an effective prospectus.
A fund files its complete schedule of portfolio holdings with the SEC for the first and third quarters of each fiscal year on Form N-Q. Forms N-Q are available on the SEC's web site at http://www.sec.gov. A fund's Forms N-Q may be reviewed and copied at the SEC's Public Reference Room in Washington, DC. Information regarding the operation of the SEC's Public Reference Room may be obtained by calling 1-800-SEC-0330. For a complete list of a fund's portfolio holdings, view the most recent holdings listing, semiannual report, or annual report on Fidelity's web site at http://www.fidelity.com, http://www.advisor.fidelity.com, or http://www.401k.com, as applicable.
NOT FDIC INSURED • MAY LOSE VALUE • NO BANK GUARANTEE
Neither the fund nor Fidelity Distributors Corporation is a bank.
Annual Report
Average annual total return reflects the change in the value of an investment, assuming reinvestment of the class' distributions from dividend income and capital gains (the profits earned upon the sale of securities that have grown in value, if any) and assuming a constant rate of performance each year. The $10,000 table and the fund's returns do not reflect the deduction of taxes that a shareholder would pay on fund distributions or the redemption of fund shares. During periods of reimbursement by Fidelity, a fund's total return will be greater than it would be had the reimbursement not occurred. How a fund did yesterday is no guarantee of how it will do tomorrow.
Average Annual Total Returns
Periods ended July 31, 2012 | Past 1
year | Past 5
years | Life of fund A |
Class F B | 3.90% | 4.08% | 8.72% |
A From November 3, 2004.
B The initial offering of Class F shares took place on June 26, 2009. Returns prior to June 26, 2009 are those of Fidelity® Small Cap Value Fund, the original class of the fund.
$10,000 Over Life of Fund
Let's say hypothetically that $10,000 was invested in Fidelity® Small Cap Value Fund - Class F on November 3, 2004, when the fund started. The chart shows how the value of your investment would have changed, and also shows how the Russell 2000® Value Index performed over the same period. The initial offering of Class F took place on June 26, 2009. See above for additional information regarding the performance of Class F.
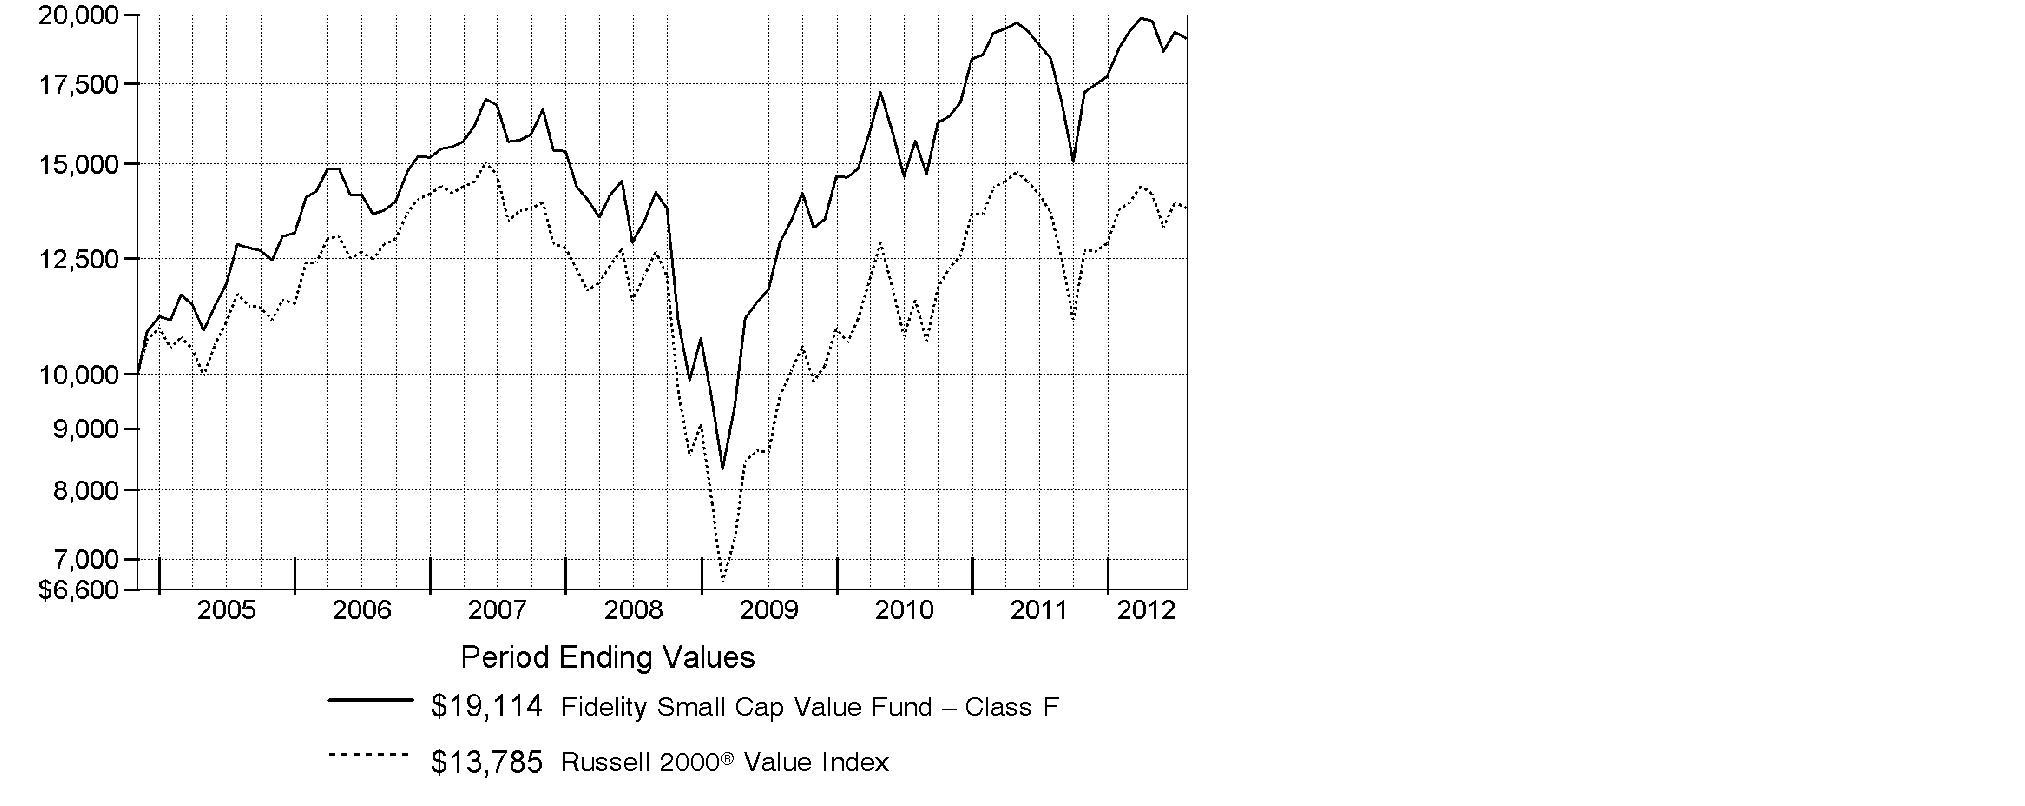
Annual Report
Market Recap: Major U.S. equity benchmarks posted solid gains for the year ending July 31, 2012, amid an uncertain investment environment. The broad-based S&P 500® Index returned 9.13%, while the blue-chip-laden Dow Jones Industrial AverageSM and technology-heavy Nasdaq Composite® Index gained 10.12% and 7.83%, respectively. Volatility spiked during the period's first half, as equities plummeted late last summer on Europe's debt woes, political wrangling over the U.S. debt ceiling, and the sovereign credit-rating downgrade that followed. By October, a seemingly improved U.S. economy rejuvenated stocks, paving the way for major equity benchmarks to post their best first-quarter performance since 1998. However, more eurozone trouble, signs that the U.S. economy had turned sluggish and a slowdown in China caused stocks to slip in May, before a new wave of optimism took hold in June and July. Within the S&P 500®, more-defensive sectors such as telecommunication services (+30%) and consumer staples (+20%) fared best, while materials and energy significantly underperformed, returning -5%. Small- and mid-cap stocks trailed their less-volatile large-cap counterparts, with the Russell 2000® Index adding 0.19% and the Russell Midcap® Index rising 2.28%. Given turmoil and local currency weakness in Europe, foreign developed-markets stocks lost ground, with the MSCI® EAFE® Index returning -11.32%.
Comments from Charles Myers, Portfolio Manager of Fidelity® Small Cap Value Fund: For the year, the fund's Class F shares gained 3.90%, compared with 0.89% for the Russell 2000® Value Index. On the positive side, stock picking stood out in the consumer discretionary sector, with homebuilders Ryland Group, M.D.C. Holdings and Meritage Homes all adding to results. In industrials, my choices in commercial/professional services and capital goods helped, led by H&E Equipment Services, which rents commercial construction equipment, and commercial furniture manufacturer HNI, the fund's top relative contributor of the year. In health care, managed-care company Centene added value, as did Team Health Holdings, a provider of outsourced clinical services to hospitals. Conversely, by far the most detrimental sector in the portfolio was financials, led on the downside by regional bank TCF Financial. In the energy sector, Superior Energy Services, a provider of oil-field services, and independent oil producer Berry Petroleum were hampered by declining energy prices. Other relative detractors included banana producer Chiquita Brands International and United Stationers, a wholesaler of office stationery and business supplies. Several stocks were not in the index, and Centene was not held at period end.
The views expressed above reflect those of the portfolio manager(s) only through the end of the period as stated on the cover of this report and do not necessarily represent the views of Fidelity or any other person in the Fidelity organization. Any such views are subject to change at any time based upon market or other conditions and Fidelity disclaims any responsibility to update such views. These views may not be relied on as investment advice and, because investment decisions for a Fidelity fund are based on numerous factors, may not be relied on as an indication of trading intent on behalf of any Fidelity fund.
Annual Report
Shareholder Expense Example
As a shareholder of the Fund, you incur two types of costs: (1) transaction costs, including sales charges (loads) on purchase payments or redemption proceeds, redemption fees and (2) ongoing costs, including management fees, distribution and/or service (12b-1) fees and other Fund expenses. This Example is intended to help you understand your ongoing costs (in dollars) of investing in the Fund and to compare these costs with the ongoing costs of investing in other mutual funds.
The Example is based on an investment of $1,000 invested at the beginning of the period and held for the entire period (February 1, 2012 to July 31, 2012).
Actual Expenses
The first line of the accompanying table for each class of the Fund provides information about actual account values and actual expenses. You may use the information in this line, together with the amount you invested, to estimate the expenses that you paid over the period. Simply divide your account value by $1,000.00 (for example, an $8,600 account value divided by $1,000.00 = 8.6), then multiply the result by the number in the first line for a class of the Fund under the heading entitled "Expenses Paid During Period" to estimate the expenses you paid on your account during this period. A small balance maintenance fee of $12.00 that is charged once a year may apply for certain accounts with a value of less than $2,000. This fee is not included in the table below. If it was, the estimate of expenses you paid during the period would be higher, and your ending account value lower, by this amount. In addition, the Fund, as a shareholder in the underlying Fidelity Central Funds, will indirectly bear its pro-rata share of the fees and expenses incurred by the underlying Fidelity Central Funds. These fees and expenses are not included in the Fund's annualized expense ratio used to calculate the expense estimate in the table below.
Hypothetical Example for Comparison Purposes
The second line of the accompanying table for each class of the Fund provides information about hypothetical account values and hypothetical expenses based on a Class' actual expense ratio and an assumed rate of return of 5% per year before expenses, which is not the Class' actual return. The hypothetical account values and expenses may not be used to estimate the actual ending account balance or expenses you paid for the period. You may use this information to compare the ongoing costs of investing in the Fund and other funds. To do so, compare this 5% hypothetical example with the 5% hypothetical examples that appear in the shareholder reports of the other funds. A small balance maintenance fee of $12.00 that is charged once a year may apply for certain accounts with a value of less than $2,000. This fee is not included in the table below. If it was, the estimate of expenses you paid during the period would be higher, and your ending account value lower, by this amount. In addition, the Fund, as a shareholder in the underlying Fidelity Central Funds, will indirectly bear its pro-rata share of the fees and expenses incurred by the underlying Fidelity Central Funds. These fees and expenses are not included in the Fund's annualized expense ratio used to calculate the expense estimate in the table below.
Please note that the expenses shown in the table are meant to highlight your ongoing costs only and do not reflect any transaction costs. Therefore, the second line of the table is useful in comparing ongoing costs only, and will not help you determine the relative total costs of owning different funds. In addition, if these transactional costs were included, your costs would have been higher.
Annual Report
| Annualized
Expense Ratio | Beginning
Account Value
February 1, 2012 | Ending
Account Value
July 31, 2012 | Expenses Paid
During Period*
February 1, 2012
to July 31, 2012 |
Class A | 1.41% | | | |
Actual | | $ 1,000.00 | $ 1,015.70 | $ 7.07 |
HypotheticalA | | $ 1,000.00 | $ 1,017.85 | $ 7.07 |
Class T | 1.63% | | | |
Actual | | $ 1,000.00 | $ 1,015.20 | $ 8.17 |
HypotheticalA | | $ 1,000.00 | $ 1,016.76 | $ 8.17 |
Class B | 2.16% | | | |
Actual | | $ 1,000.00 | $ 1,012.10 | $ 10.81 |
HypotheticalA | | $ 1,000.00 | $ 1,014.12 | $ 10.82 |
Class C | 2.16% | | | |
Actual | | $ 1,000.00 | $ 1,012.80 | $ 10.81 |
HypotheticalA | | $ 1,000.00 | $ 1,014.12 | $ 10.82 |
Small Cap Value | 1.09% | | | |
Actual | | $ 1,000.00 | $ 1,018.30 | $ 5.47 |
HypotheticalA | | $ 1,000.00 | $ 1,019.44 | $ 5.47 |
Class F | .87% | | | |
Actual | | $ 1,000.00 | $ 1,018.90 | $ 4.37 |
HypotheticalA | | $ 1,000.00 | $ 1,020.54 | $ 4.37 |
Institutional Class | 1.11% | | | |
Actual | | $ 1,000.00 | $ 1,017.60 | $ 5.57 |
HypotheticalA | | $ 1,000.00 | $ 1,019.34 | $ 5.57 |
A 5% return per year before expenses
* Expenses are equal to each Class' annualized expense ratio, multiplied by the average account value over the period, multiplied by 182/366 (to reflect the one-half year period).
Annual Report
Investment Changes (Unaudited)
Top Ten Stocks as of July 31, 2012 |
| % of fund's
net assets | % of fund's net assets
6 months ago |
Superior Energy Services, Inc. | 3.0 | 1.7 |
DCT Industrial Trust, Inc. | 2.8 | 2.7 |
TCF Financial Corp. | 2.7 | 2.4 |
HNI Corp. | 2.7 | 3.0 |
Berry Petroleum Co. Class A | 2.6 | 1.9 |
Hanesbrands, Inc. | 2.6 | 0.0 |
Team Health Holdings, Inc. | 2.5 | 1.9 |
Platinum Underwriters Holdings Ltd. | 2.4 | 2.3 |
WESCO International, Inc. | 2.4 | 3.3 |
GrafTech International Ltd. | 2.3 | 0.0 |
| 26.0 | |
Top Five Market Sectors as of July 31, 2012 |
| % of fund's
net assets | % of fund's net assets
6 months ago |
Financials | 35.8 | 35.6 |
Industrials | 14.1 | 15.2 |
Consumer Discretionary | 14.0 | 13.5 |
Information Technology | 11.0 | 11.5 |
Health Care | 6.6 | 7.9 |
Asset Allocation (% of fund's net assets) |
As of July 31, 2012* | As of January 31, 2012** |
 | Stocks 100.0% | | | Stocks 99.9% | |
 | Short-Term
Investments and
Net Other Assets
(Liabilities) † 0.0% | |  | Short-Term
Investments and
Net Other Assets
(Liabilities) 0.1% | |
* Foreign investments | 9.8% | | ** Foreign investments | 9.1% | |
† Amount represents less than 0.1%

Annual Report
Investments July 31, 2012
Showing Percentage of Net Assets
Common Stocks - 98.7% |
| Shares | | Value |
CONSUMER DISCRETIONARY - 13.5% |
Diversified Consumer Services - 2.0% |
Regis Corp. (e) | 3,100,000 | | $ 52,452,000 |
Household Durables - 6.1% |
KB Home (d) | 3,303,800 | | 30,527,112 |
M.D.C. Holdings, Inc. | 800,000 | | 25,488,000 |
Meritage Homes Corp. (a) | 700,000 | | 24,570,000 |
Ryland Group, Inc. | 1,375,000 | | 32,835,000 |
Tempur-Pedic International, Inc. (a)(d) | 1,800,000 | | 51,282,000 |
| | 164,702,112 |
Media - 1.3% |
Valassis Communications, Inc. (a)(d) | 1,584,641 | | 35,733,655 |
Specialty Retail - 1.5% |
Asbury Automotive Group, Inc. (a) | 800,000 | | 20,928,000 |
Tsutsumi Jewelry Co. Ltd. | 791,400 | | 18,561,365 |
| | 39,489,365 |
Textiles, Apparel & Luxury Goods - 2.6% |
Hanesbrands, Inc. (a) | 2,300,000 | | 69,046,000 |
TOTAL CONSUMER DISCRETIONARY | | 361,423,132 |
CONSUMER STAPLES - 3.7% |
Food Products - 2.2% |
Chiquita Brands International, Inc. (a)(d)(e) | 3,375,000 | | 17,482,500 |
Dean Foods Co. (a) | 3,450,000 | | 42,676,500 |
| | 60,159,000 |
Household Products - 1.5% |
Spectrum Brands Holdings, Inc. | 1,100,000 | | 40,513,000 |
TOTAL CONSUMER STAPLES | | 100,672,000 |
ENERGY - 5.6% |
Energy Equipment & Services - 3.0% |
Superior Energy Services, Inc. (a) | 3,800,000 | | 82,345,999 |
Oil, Gas & Consumable Fuels - 2.6% |
Berry Petroleum Co. Class A | 1,825,000 | | 69,386,500 |
TOTAL ENERGY | | 151,732,499 |
FINANCIALS - 35.0% |
Capital Markets - 4.3% |
Knight Capital Group, Inc. Class A (a) | 4,350,000 | | 44,935,500 |
Common Stocks - continued |
| Shares | | Value |
FINANCIALS - continued |
Capital Markets - continued |
Monex Group, Inc. | 149,703 | | $ 24,294,118 |
Waddell & Reed Financial, Inc. Class A | 1,610,000 | | 46,834,900 |
| | 116,064,518 |
Commercial Banks - 11.0% |
Associated Banc-Corp. | 4,432,650 | | 55,363,799 |
CapitalSource, Inc. | 7,000,000 | | 45,850,000 |
City National Corp. | 784,900 | | 38,679,872 |
National Penn Bancshares, Inc. | 4,266,604 | | 37,716,779 |
PacWest Bancorp (e) | 1,857,600 | | 42,557,616 |
TCF Financial Corp. | 7,000,000 | | 72,310,000 |
Western Liberty Bancorp (a)(e) | 992,899 | | 2,879,407 |
| | 295,357,473 |
Insurance - 7.7% |
Alterra Capital Holdings Ltd. | 2,337,411 | | 54,391,554 |
Aspen Insurance Holdings Ltd. | 1,920,200 | | 55,186,548 |
Platinum Underwriters Holdings Ltd. (e) | 1,694,139 | | 64,411,165 |
ProAssurance Corp. | 350,000 | | 31,349,500 |
| | 205,338,767 |
Real Estate Investment Trusts - 7.4% |
DCT Industrial Trust, Inc. | 11,980,586 | | 74,998,468 |
Franklin Street Properties Corp. | 3,160,000 | | 32,769,200 |
Highwoods Properties, Inc. (SBI) | 1,720,330 | | 58,267,577 |
National Retail Properties, Inc. (d) | 1,140,000 | | 33,630,000 |
| | 199,665,245 |
Real Estate Management & Development - 0.9% |
Forestar Group, Inc. (a)(e) | 1,996,875 | | 22,724,438 |
Thrifts & Mortgage Finance - 3.7% |
Astoria Financial Corp. (d)(e) | 5,418,152 | | 51,038,992 |
Washington Federal, Inc. | 3,086,175 | | 49,162,768 |
| | 100,201,760 |
TOTAL FINANCIALS | | 939,352,201 |
HEALTH CARE - 6.6% |
Health Care Equipment & Supplies - 1.1% |
Integra LifeSciences Holdings Corp. (a) | 750,000 | | 28,845,000 |
Health Care Providers & Services - 5.5% |
Chemed Corp. | 465,200 | | 29,200,604 |
Common Stocks - continued |
| Shares | | Value |
HEALTH CARE - continued |
Health Care Providers & Services - continued |
MEDNAX, Inc. (a) | 779,700 | | $ 51,561,561 |
Team Health Holdings, Inc. (a) | 2,527,580 | | 67,486,386 |
| | 148,248,551 |
TOTAL HEALTH CARE | | 177,093,551 |
INDUSTRIALS - 14.1% |
Commercial Services & Supplies - 7.2% |
ACCO Brands Corp. | 2,200,000 | | 18,634,000 |
HNI Corp. (e) | 2,700,000 | | 71,739,000 |
Knoll, Inc. | 1,750,000 | | 23,957,500 |
Quad/Graphics, Inc. (d)(e) | 1,878,394 | | 28,908,484 |
United Stationers, Inc. | 1,980,800 | | 49,935,968 |
| | 193,174,952 |
Electrical Equipment - 2.3% |
GrafTech International Ltd. (a) | 5,965,000 | | 62,334,250 |
Machinery - 2.0% |
Blount International, Inc. (a)(e) | 2,604,723 | | 37,039,161 |
Columbus McKinnon Corp. (NY Shares) (a)(e) | 1,047,872 | | 15,414,197 |
| | 52,453,358 |
Trading Companies & Distributors - 2.6% |
H&E Equipment Services, Inc. (a) | 376,625 | | 5,317,945 |
WESCO International, Inc. (a) | 1,153,633 | | 64,268,894 |
| | 69,586,839 |
TOTAL INDUSTRIALS | | 377,549,399 |
INFORMATION TECHNOLOGY - 11.0% |
Communications Equipment - 2.6% |
Polycom, Inc. (a) | 3,275,000 | | 28,623,500 |
ViaSat, Inc. (a) | 1,100,000 | | 42,130,000 |
| | 70,753,500 |
Electronic Equipment & Components - 5.1% |
Ingram Micro, Inc. Class A (a) | 1,653,100 | | 24,779,969 |
Macnica, Inc. | 677,400 | | 14,288,287 |
Ryoyo Electro Corp. (e) | 1,972,700 | | 20,552,790 |
SYNNEX Corp. (a) | 790,000 | | 26,725,700 |
Tech Data Corp. (a) | 1,000,000 | | 50,100,000 |
| | 136,446,746 |
Common Stocks - continued |
| Shares | | Value |
INFORMATION TECHNOLOGY - continued |
Internet Software & Services - 1.4% |
j2 Global, Inc. (d) | 1,270,000 | | $ 38,011,100 |
Semiconductors & Semiconductor Equipment - 0.4% |
Miraial Co. Ltd. (e) | 720,200 | | 10,410,478 |
Software - 1.5% |
Monotype Imaging Holdings, Inc. (e) | 2,652,331 | | 38,936,219 |
TOTAL INFORMATION TECHNOLOGY | | 294,558,043 |
MATERIALS - 4.7% |
Chemicals - 1.5% |
PolyOne Corp. | 2,800,000 | | 41,244,000 |
Metals & Mining - 3.2% |
Carpenter Technology Corp. | 409,380 | | 19,592,927 |
Haynes International, Inc. | 496,108 | | 23,907,445 |
RTI International Metals, Inc. (a)(e) | 1,880,000 | | 42,206,000 |
| | 85,706,372 |
TOTAL MATERIALS | | 126,950,372 |
UTILITIES - 4.5% |
Electric Utilities - 1.6% |
Westar Energy, Inc. | 1,360,000 | | 41,561,600 |
Gas Utilities - 2.9% |
Southwest Gas Corp. | 836,756 | | 37,369,523 |
UGI Corp. | 1,333,454 | | 40,870,365 |
| | 78,239,888 |
TOTAL UTILITIES | | 119,801,488 |
TOTAL COMMON STOCKS (Cost $2,307,088,586) |
2,649,132,685
|
Nonconvertible Preferred Stocks - 1.3% |
| | | |
CONSUMER DISCRETIONARY - 0.5% |
Household Durables - 0.5% |
M/I Homes, Inc. Series A, 9.75% (a) | 750,400 | | 12,944,400 |
Nonconvertible Preferred Stocks - continued |
| Shares | | Value |
FINANCIALS - 0.8% |
Real Estate Investment Trusts - 0.8% |
DDR Corp. Series H, 7.375% | 818,790 | | $ 20,658,072 |
TOTAL NONCONVERTIBLE PREFERRED STOCKS (Cost $20,354,770) |
33,602,472
|
Money Market Funds - 2.0% |
| | | |
Fidelity Cash Central Fund, 0.17% (b) | 5,899,046 | | 5,899,046 |
Fidelity Securities Lending Cash Central Fund, 0.18% (b)(c) | 48,626,645 | | 48,626,645 |
TOTAL MONEY MARKET FUNDS (Cost $54,525,691) |
54,525,691
|
TOTAL INVESTMENT PORTFOLIO - 102.0% (Cost $2,381,969,047) | | 2,737,260,848 |
NET OTHER ASSETS (LIABILITIES) - (2.0)% | | (53,568,098) |
NET ASSETS - 100% | $ 2,683,692,750 |
Legend |
(a) Non-income producing |
(b) Affiliated fund that is available only to investment companies and other accounts managed by Fidelity Investments. The rate quoted is the annualized seven-day yield of the fund at period end. A complete unaudited listing of the fund's holdings as of its most recent quarter end is available upon request. In addition, each Fidelity Central Fund's financial statements, which are not covered by the Fund's Report of Independent Registered Public Accounting Firm, are available on the SEC's website or upon request. |
(c) Investment made with cash collateral received from securities on loan. |
(d) Security or a portion of the security is on loan at period end. |
(e) Affiliated company |
Affiliated Central Funds |
Information regarding fiscal year to date income earned by the Fund from investments in Fidelity Central Funds is as follows: |
Fund | Income earned |
Fidelity Cash Central Fund | $ 14,453 |
Fidelity Securities Lending Cash Central Fund | 204,102 |
Total | $ 218,555 |
Other Affiliated Issuers |
An affiliated company is a company in which the Fund has ownership of at least 5% of the voting securities. Fiscal year to date transactions with companies which are or were affiliates are as follows: |
Affiliate | Value,
beginning of
period | Purchases | Sales
Proceeds | Dividend
Income | Value,
end of
period |
Astoria Financial Corp. | $ 56,131,471 | $ 5,135,258 | $ - | $ 2,277,805 | $ 51,038,992 |
Blount International, Inc. | 43,316,543 | - | - | - | 37,039,161 |
Chiquita Brands International, Inc. | 24,519,456 | 10,332,799 | - | - | 17,482,500 |
Columbus McKinnon Corp. (NY Shares) | 15,792,000 | 1,137,487 | - | - | 15,414,197 |
DCT Industrial Trust, Inc. | 74,961,776 | - | 8,396,655 | 3,414,064 | - |
Forestar Group, Inc. | - | 24,473,760 | - | - | 22,724,438 |
H&E Equipment Services, Inc. | 29,272,896 | 2,743,497 | 45,135,849 | - | - |
Haynes International, Inc. | 42,301,857 | - | 8,879,973 | 446,653 | - |
HNI Corp. | 49,131,621 | 19,653,848 | 17,053,493 | 2,539,706 | 71,739,000 |
Ingles Markets, Inc. Class A | 10,225,970 | - | 9,904,080 | 78,182 | - |
M.D.C. Holdings, Inc. | 54,813,423 | - | 45,064,374 | 2,311,800 | - |
Affiliate | Value,
beginning of
period | Purchases | Sales
Proceeds | Dividend
Income | Value,
end of
period |
Miraial Co. Ltd. | $ 15,046,860 | $ - | $ - | $ 516,374 | $ 10,410,478 |
Monotype Imaging Holdings, Inc. | 35,396,690 | 972,962 | - | - | 38,936,219 |
PacWest Bancorp | 36,873,360 | - | - | 1,021,680 | 42,557,616 |
Platinum Underwriters Holdings Ltd. | 54,169,091 | 3,610,350 | - | 542,124 | 64,411,165 |
Providence Service Corp. | 12,045,466 | - | 15,255,161 | - | - |
Quad/Graphics, Inc. | - | 25,545,548 | - | 469,599 | 28,908,484 |
Regis Corp. | 60,080,486 | - | 16,882,099 | 952,998 | 52,452,000 |
RTI International Metals, Inc. | 27,932,874 | 27,109,765 | 3,701,784 | - | 42,206,000 |
Ryoyo Electro Corp. | 19,684,709 | - | - | 707,200 | 20,552,790 |
Western Liberty Bancorp | 7,248,000 | - | 3,597,604 | - | 2,879,407 |
Total | $ 668,944,549 | $ 120,715,274 | $ 173,871,072 | $ 15,278,185 | $ 518,752,447 |
Other Information |
The following is a summary of the inputs used, as of July 31, 2012, involving the Fund's assets and liabilities carried at fair value. The inputs or methodology used for valuing securities may not be an indication of the risk associated with investing in those securities. For more information on valuation inputs, and their aggregation into the levels used in the tables below, please refer to the Security Valuation section in the accompanying Notes to Financial Statements. |
Valuation Inputs at Reporting Date: |
Description | Total | Level 1 | Level 2 | Level 3 |
Investments in Securities: | | | | |
Equities: | | | | |
Consumer Discretionary | $ 374,367,532 | $ 355,806,167 | $ 18,561,365 | $ - |
Consumer Staples | 100,672,000 | 100,672,000 | - | - |
Energy | 151,732,499 | 151,732,499 | - | - |
Financials | 960,010,273 | 935,716,155 | 24,294,118 | - |
Health Care | 177,093,551 | 177,093,551 | - | - |
Industrials | 377,549,399 | 377,549,399 | - | - |
Information Technology | 294,558,043 | 249,306,488 | 45,251,555 | - |
Materials | 126,950,372 | 126,950,372 | - | - |
Utilities | 119,801,488 | 119,801,488 | - | - |
Money Market Funds | 54,525,691 | 54,525,691 | - | - |
Total Investments in Securities: | $ 2,737,260,848 | $ 2,649,153,810 | $ 88,107,038 | $ - |
The following is a summary of transfers between Level 1 and Level 2 for the period ended July 31, 2012. Transfers are assumed to have occurred at the beginning of the period, and are primarily attributable to the valuation techniques used for foreign equity securities, as discussed in the accompanying Notes to Financial Statements: |
Transfers | Total |
Level 1 to Level 2 | $ 70,981,657 |
Level 2 to Level 1 | $ 0 |
See accompanying notes which are an integral part of the financial statements.
Annual Report
Statement of Assets and Liabilities
| July 31, 2012 |
| | |
Assets | | |
Investment in securities, at value (including securities loaned of $46,940,525) - See accompanying schedule: Unaffiliated issuers (cost $1,850,015,930) | $ 2,163,982,710 | |
Fidelity Central Funds (cost $54,525,691) | 54,525,691 | |
Other affiliated issuers (cost $477,427,426) | 518,752,447 | |
Total Investments (cost $2,381,969,047) | | $ 2,737,260,848 |
Receivable for investments sold | | 7,962 |
Receivable for fund shares sold | | 3,346,245 |
Dividends receivable | | 2,366,103 |
Distributions receivable from Fidelity Central Funds | | 31,400 |
Other receivables | | 10,660 |
Total assets | | 2,743,023,218 |
| | |
Liabilities | | |
Payable for investments purchased | $ 6,165,626 | |
Payable for fund shares redeemed | 2,135,374 | |
Accrued management fee | 1,742,888 | |
Distribution and service plan fees payable | 100,792 | |
Other affiliated payables | 499,987 | |
Other payables and accrued expenses | 59,156 | |
Collateral on securities loaned, at value | 48,626,645 | |
Total liabilities | | 59,330,468 |
| | |
Net Assets | | $ 2,683,692,750 |
Net Assets consist of: | | |
Paid in capital | | $ 2,251,063,836 |
Undistributed net investment income | | 4,596,351 |
Accumulated undistributed net realized gain (loss) on investments and foreign currency transactions | | 72,740,139 |
Net unrealized appreciation (depreciation) on investments and assets and liabilities in foreign currencies | | 355,292,424 |
Net Assets | | $ 2,683,692,750 |
See accompanying notes which are an integral part of the financial statements.
Annual Report
Statement of Assets and Liabilities - continued
| July 31, 2012 |
| | |
Calculation of Maximum Offering Price Class A:
Net Asset Value and redemption price per share ($150,285,327 ÷ 10,110,871 shares) | | $ 14.86 |
| | |
Maximum offering price per share (100/94.25 of $14.86) | | $ 15.77 |
Class T:
Net Asset Value and redemption price per share ($57,514,280 ÷ 3,913,423 shares) | | $ 14.70 |
| | |
Maximum offering price per share (100/96.50 of $14.70) | | $ 15.23 |
Class B:
Net Asset Value and offering price per share ($6,674,942 ÷ 467,617 shares)A | | $ 14.27 |
| | |
Class C:
Net Asset Value and offering price per share ($47,265,102 ÷ 3,310,493 shares)A | | $ 14.28 |
| | |
| | |
Small Cap Value:
Net Asset Value, offering price and redemption price per share ($1,756,962,176 ÷ 116,773,340 shares) | | $ 15.05 |
| | |
Class F:
Net Asset Value, offering price and redemption price per share ($526,009,440 ÷ 34,859,047 shares) | | $ 15.09 |
| | |
Institutional Class:
Net Asset Value, offering price and redemption price per share ($138,981,483 ÷ 9,231,738 shares) | | $ 15.05 |
A Redemption price per share is equal to net asset value less any applicable contingent deferred sales charge.
See accompanying notes which are an integral part of the financial statements.
Annual Report
Financial Statements - continued
Statement of Operations
| Year ended July 31, 2012 |
| | |
Investment Income | | |
Dividends (including $15,278,185 earned from other affiliated issuers) | | $ 37,030,660 |
Interest | | 68 |
Income from Fidelity Central Funds | | 218,555 |
Total income | | 37,249,283 |
| | |
Expenses | | |
Management fee
Basic fee | $ 17,249,880 | |
Performance adjustment | 3,419,705 | |
Transfer agent fees | 4,956,576 | |
Distribution and service plan fees | 1,124,466 | |
Accounting and security lending fees | 740,848 | |
Custodian fees and expenses | 47,382 | |
Independent trustees' compensation | 15,923 | |
Registration fees | 132,426 | |
Audit | 69,124 | |
Legal | 7,688 | |
Interest | 359 | |
Miscellaneous | 25,296 | |
Total expenses before reductions | 27,789,673 | |
Expense reductions | (31,201) | 27,758,472 |
Net investment income (loss) | | 9,490,811 |
Realized and Unrealized Gain (Loss) Net realized gain (loss) on: | | |
Investment securities: | | |
Unaffiliated issuers | 99,604,672 | |
Other affiliated issuers | 57,534 | |
Foreign currency transactions | (5,054) | |
Total net realized gain (loss) | | 99,657,152 |
Change in net unrealized appreciation (depreciation) on: Investment securities | (37,717,980) | |
Assets and liabilities in foreign currencies | (6,920) | |
Total change in net unrealized appreciation (depreciation) | | (37,724,900) |
Net gain (loss) | | 61,932,252 |
Net increase (decrease) in net assets resulting from operations | | $ 71,423,063 |
See accompanying notes which are an integral part of the financial statements.
Annual Report
Statement of Changes in Net Assets
| Year ended
July 31,
2012 | Year ended
July 31,
2011 |
Increase (Decrease) in Net Assets | | |
Operations | | |
Net investment income (loss) | $ 9,490,811 | $ 8,365,475 |
Net realized gain (loss) | 99,657,152 | 155,481,563 |
Change in net unrealized appreciation (depreciation) | (37,724,900) | 203,701,455 |
Net increase (decrease) in net assets resulting
from operations | 71,423,063 | 367,548,493 |
Distributions to shareholders from net investment income | (3,813,704) | (16,151,065) |
Distributions to shareholders from net realized gain | (148,970,854) | (20,051,059) |
Total distributions | (152,784,558) | (36,202,124) |
Share transactions - net increase (decrease) | 230,904,084 | 54,629,275 |
Redemption fees | 569,163 | 445,888 |
Total increase (decrease) in net assets | 150,111,752 | 386,421,532 |
| | |
Net Assets | | |
Beginning of period | 2,533,580,998 | 2,147,159,466 |
End of period (including undistributed net investment income of $4,596,351 and $0, respectively) | $ 2,683,692,750 | $ 2,533,580,998 |
See accompanying notes which are an integral part of the financial statements.
Annual Report
Financial Highlights - Class A
Years ended July 31, | 2012 | 2011 | 2010 | 2009 | 2008 |
Selected Per-Share Data | | | | |
Net asset value, beginning of period | $ 15.48 | $ 13.45 | $ 11.13 | $ 11.82 | $ 14.34 |
Income from Investment
Operations | | | | |
Net investment income (loss) C | .01 | .01 F | .02 G | .08 | (.01) |
Net realized and unrealized gain (loss) | .30 | 2.22 | 2.33 | (.60) | (1.98) |
Total from investment operations | .31 | 2.23 | 2.35 | (.52) | (1.99) |
Distributions from net investment income | (.01) | (.08) | (.03) | (.06) | - |
Distributions from net realized gain | (.93) | (.12) | - | (.11) | (.53) |
Total distributions | (.93) J | (.20) | (.03) | (.17) | (.53) |
Redemption fees added to paid in capital C, I | - | - | - | - | - |
Net asset value, end of period | $ 14.86 | $ 15.48 | $ 13.45 | $ 11.13 | $ 11.82 |
Total Return A, B | 3.24% | 16.72% | 21.16% | (4.37)% | (14.35)% |
Ratios to Average Net Assets D, H | | | | |
Expenses before reductions | 1.44% | 1.44% | 1.47% | 1.45% | 1.43% |
Expenses net of fee waivers, if any | 1.44% | 1.43% | 1.40% | 1.40% | 1.40% |
Expenses net of all reductions | 1.44% | 1.43% | 1.39% | 1.40% | 1.40% |
Net investment income (loss) | .09% | .06% F | .17% G | .81% | (.05)% |
Supplemental Data | | | | |
Net assets, end of period (000 omitted) | $ 150,285 | $ 140,707 | $ 96,994 | $ 55,029 | $ 52,446 |
Portfolio turnover rate E | 27% | 22% | 49% | 51% | 149% |
A Total returns would have been lower if certain expenses had not been reduced during the applicable periods shown.
B Total returns do not include the effect of the sales charges.
C Calculated based on average shares outstanding during the period.
D Fees and expenses of any underlying Fidelity Central Funds are not included in the Fund's expense ratio. The Fund indirectly bears its proportionate share of the expenses of any underlying Fidelity Central Funds.
E Amount does not include the portfolio activity of any underlying Fidelity Central Funds.
F Investment income per share reflects a large, non-recurring dividend which amounted to $.06 per share. Excluding this non-recurring dividend, the ratio of net investment income (loss) to average net assets would have been (.31)%.
G Investment income per share reflects a large, non-recurring dividend which amounted to $.03 per share. Excluding this non-recurring dividend, the ratio of net investment income (loss) to average net assets would have been (.10)%.
H Expense ratios reflect operating expenses of the class. Expenses before reductions do not reflect amounts reimbursed by the investment adviser or reductions from brokerage service arrangements or reductions from other expense offset arrangements and do not represent the amount paid by the class during periods when reimbursements or reductions occur. Expenses net of fee waivers reflect expenses after reimbursement by the investment adviser but prior to reductions from brokerage service arrangements or other expense offset arrangements. Expenses net of all reductions represent the net expenses paid by the class.
I Amount represents less than $.01 per share.
J Total distributions of $.93 per share is comprised of distributions from net investment income of $.006 and distributions from net realized gain of $.925 per share.
See accompanying notes which are an integral part of the financial statements.
Annual Report
Financial Highlights - Class T
Years ended July 31, | 2012 | 2011 | 2010 | 2009 | 2008 |
Selected Per-Share Data | | | | |
Net asset value, beginning of period | $ 15.34 | $ 13.34 | $ 11.05 | $ 11.74 | $ 14.28 |
Income from Investment
Operations | | | | |
Net investment income (loss) C | (.02) | (.03) F | (.01) G | .05 | (.04) |
Net realized and unrealized gain (loss) | .31 | 2.20 | 2.31 | (.59) | (1.97) |
Total from investment operations | .29 | 2.17 | 2.30 | (.54) | (2.01) |
Distributions from net investment income | - | (.05) | (.01) | (.04) | - |
Distributions from net realized gain | (.93) | (.12) | - | (.11) | (.53) |
Total distributions | (.93) | (.17) | (.01) | (.15) | (.53) |
Redemption fees added to paid in capital C, I | - | - | - | - | - |
Net asset value, end of period | $ 14.70 | $ 15.34 | $ 13.34 | $ 11.05 | $ 11.74 |
Total Return A, B | 3.08% | 16.36% | 20.87% | (4.57)% | (14.58)% |
Ratios to Average Net Assets D, H | | | | |
Expenses before reductions | 1.67% | 1.70% | 1.72% | 1.70% | 1.68% |
Expenses net of fee waivers, if any | 1.67% | 1.69% | 1.65% | 1.65% | 1.65% |
Expenses net of all reductions | 1.67% | 1.69% | 1.64% | 1.65% | 1.65% |
Net investment income (loss) | (.14)% | (.19)% F | (.08)% G | .56% | (.30)% |
Supplemental Data | | | | |
Net assets, end of period (000 omitted) | $ 57,514 | $ 55,845 | $ 44,091 | $ 28,534 | $ 32,091 |
Portfolio turnover rate E | 27% | 22% | 49% | 51% | 149% |
A Total returns would have been lower if certain expenses had not been reduced during the applicable periods shown.
B Total returns do not include the effect of the sales charges.
C Calculated based on average shares outstanding during the period.
D Fees and expenses of any underlying Fidelity Central Funds are not included in the Fund's expense ratio. The Fund indirectly bears its proportionate share of the expenses of any underlying Fidelity Central Funds.
E Amount does not include the portfolio activity of any underlying Fidelity Central Funds.
F Investment income per share reflects a large, non-recurring dividend which amounted to $.06 per share. Excluding this non-recurring dividend, the ratio of net investment income (loss) to average net assets would have been (.57)%.
G Investment income per share reflects a large, non-recurring dividend which amounted to $.03 per share. Excluding this non-recurring dividend, the ratio of net investment income (loss) to average net assets would have been (.35)%.
H Expense ratios reflect operating expenses of the class. Expenses before reductions do not reflect amounts reimbursed by the investment adviser or reductions from brokerage service arrangements or reductions from other expense offset arrangements and do not represent the amount paid by the class during periods when reimbursements or reductions occur. Expenses net of fee waivers reflect expenses after reimbursement by the investment adviser but prior to reductions from brokerage service arrangements or other expense offset arrangements. Expenses net of all reductions represent the net expenses paid by the class.
I Amount represents less than $.01 per share.
See accompanying notes which are an integral part of the financial statements.
Annual Report
Financial Highlights - Class B
Years ended July 31, | 2012 | 2011 | 2010 | 2009 | 2008 |
Selected Per-Share Data | | | | |
Net asset value, beginning of period | $ 15.00 | $ 13.08 | $ 10.88 | $ 11.60 | $ 14.19 |
Income from Investment
Operations | | | | |
Net investment income (loss) C | (.09) | (.10) F | (.07) G | .01 | (.10) |
Net realized and unrealized gain (loss) | .29 | 2.15 | 2.27 | (.59) | (1.96) |
Total from investment operations | .20 | 2.05 | 2.20 | (.58) | (2.06) |
Distributions from net investment income | - | (.01) | - | (.03) | - |
Distributions from net realized gain | (.93) | (.12) | - | (.11) | (.53) |
Total distributions | (.93) | (.13) | - | (.14) | (.53) |
Redemption fees added to paid in capital C, I | - | - | - | - | - |
Net asset value, end of period | $ 14.27 | $ 15.00 | $ 13.08 | $ 10.88 | $ 11.60 |
Total Return A, B | 2.51% | 15.80% | 20.22% | (5.05)% | (15.04)% |
Ratios to Average Net Assets D, H | | | | |
Expenses before reductions | 2.19% | 2.20% | 2.22% | 2.20% | 2.18% |
Expenses net of fee waivers, if any | 2.19% | 2.19% | 2.15% | 2.15% | 2.15% |
Expenses net of all reductions | 2.19% | 2.19% | 2.14% | 2.15% | 2.15% |
Net investment income (loss) | (.66)% | (.69)% F | (.58)% G | .06% | (.80)% |
Supplemental Data | | | | |
Net assets, end of period (000 omitted) | $ 6,675 | $ 8,549 | $ 9,747 | $ 7,153 | $ 7,886 |
Portfolio turnover rate E | 27% | 22% | 49% | 51% | 149% |
A Total returns would have been lower if certain expenses had not been reduced during the applicable periods shown.
B Total returns do not include the effect of the contingent deferred sales charge.
C Calculated based on average shares outstanding during the period.
D Fees and expenses of any underlying Fidelity Central Funds are not included in the Fund's expense ratio. The Fund indirectly bears its proportionate share of the expenses of any underlying Fidelity Central Funds.
E Amount does not include the portfolio activity of any underlying Fidelity Central Funds.
F Investment income per share reflects a large, non-recurring dividend which amounted to $.06 per share. Excluding this non-recurring dividend, the ratio of net investment income (loss) to average net assets would have been (1.07)%.
G Investment income per share reflects a large, non-recurring dividend which amounted to $.03 per share. Excluding this non-recurring dividend, the ratio of net investment income (loss) to average net assets would have been (.85)%.
H Expense ratios reflect operating expenses of the class. Expenses before reductions do not reflect amounts reimbursed by the investment adviser or reductions from brokerage service arrangements or reductions from other expense offset arrangements and do not represent the amount paid by the class during periods when reimbursements or reductions occur. Expenses net of fee waivers reflect expenses after reimbursement by the investment adviser but prior to reductions from brokerage service arrangements or other expense offset arrangements. Expenses net of all reductions represent the net expenses paid by the class.
I Amount represents less than $.01 per share.
See accompanying notes which are an integral part of the financial statements.
Annual Report
Financial Highlights - Class C
Years ended July 31, | 2012 | 2011 | 2010 | 2009 | 2008 |
Selected Per-Share Data | | | | |
Net asset value, beginning of period | $ 15.01 | $ 13.08 | $ 10.89 | $ 11.60 | $ 14.19 |
Income from Investment
Operations | | | | |
Net investment income (loss) C | (.09) | (.10) F | (.07) G | .01 | (.10) |
Net realized and unrealized gain (loss) | .29 | 2.17 | 2.26 | (.58) | (1.96) |
Total from investment operations | .20 | 2.07 | 2.19 | (.57) | (2.06) |
Distributions from net investment income | - | (.02) | - | (.03) | - |
Distributions from net realized gain | (.93) | (.12) | - | (.11) | (.53) |
Total distributions | (.93) | (.14) | - | (.14) | (.53) |
Redemption fees added to paid in capital C, I | - | - | - | - | - |
Net asset value, end of period | $ 14.28 | $ 15.01 | $ 13.08 | $ 10.89 | $ 11.60 |
Total Return A, B | 2.52% | 15.91% | 20.11% | (4.98)% | (15.04)% |
Ratios to Average Net Assets D, H | | | | |
Expenses before reductions | 2.19% | 2.18% | 2.22% | 2.20% | 2.18% |
Expenses net of fee waivers, if any | 2.19% | 2.18% | 2.15% | 2.15% | 2.15% |
Expenses net of all reductions | 2.19% | 2.18% | 2.14% | 2.15% | 2.15% |
Net investment income (loss) | (.66)% | (.68)% F | (.58)% G | .06% | (.80)% |
Supplemental Data | | | | |
Net assets, end of period (000 omitted) | $ 47,265 | $ 47,457 | $ 37,346 | $ 21,345 | $ 20,924 |
Portfolio turnover rate E | 27% | 22% | 49% | 51% | 149% |
A Total returns would have been lower if certain expenses had not been reduced during the applicable periods shown.
B Total returns do not include the effect of the contingent deferred sales charge.
C Calculated based on average shares outstanding during the period.
D Fees and expenses of any underlying Fidelity Central Funds are not included in the Fund's expense ratio. The Fund indirectly bears its proportionate share of the expenses of any underlying Fidelity Central Funds.
E Amount does not include the portfolio activity of any underlying Fidelity Central Funds.
F Investment income per share reflects a large, non-recurring dividend which amounted to $.06 per share. Excluding this non-recurring dividend, the ratio of net investment income (loss) to average net assets would have been (1.06)%.
G Investment income per share reflects a large, non-recurring dividend which amounted to $.03 per share. Excluding this non-recurring dividend, the ratio of net investment income (loss) to average net assets would have been (.85)%.
H Expense ratios reflect operating expenses of the class. Expenses before reductions do not reflect amounts reimbursed by the investment adviser or reductions from brokerage service arrangements or reductions from other expense offset arrangements and do not represent the amount paid by the class during periods when reimbursements or reductions occur. Expenses net of fee waivers reflect expenses after reimbursement by the investment adviser but prior to reductions from brokerage service arrangements or other expense offset arrangements. Expenses net of all reductions represent the net expenses paid by the class.
I Amount represents less than $.01 per share.
See accompanying notes which are an integral part of the financial statements.
Annual Report
Financial Highlights - Small Cap Value
Years ended July 31, | 2012 | 2011 | 2010 | 2009 | 2008 |
Selected Per-Share Data | | | | |
Net asset value, beginning of period | $ 15.62 | $ 13.56 | $ 11.22 | $ 11.91 | $ 14.43 |
Income from Investment
Operations | | | | |
Net investment income (loss) B | .06 | .06 E | .05 F | .10 | .03 |
Net realized and unrealized gain (loss) | .32 | 2.23 | 2.34 | (.60) | (1.99) |
Total from investment operations | .38 | 2.29 | 2.39 | (.50) | (1.96) |
Distributions from net investment income | (.02) | (.10) | (.05) | (.08) | - |
Distributions from net realized gain | (.93) | (.13) | - | (.11) | (.56) |
Total distributions | (.95) | (.23) | (.05) | (.19) | (.56) |
Redemption fees added to paid in capital B, H | - | - | - | - | - |
Net asset value, end of period | $ 15.05 | $ 15.62 | $ 13.56 | $ 11.22 | $ 11.91 |
Total Return A | 3.67% | 17.03% | 21.32% | (4.15)% | (14.10)% |
Ratios to Average Net Assets C, G | | | | |
Expenses before reductions | 1.13% | 1.13% | 1.18% | 1.20% | 1.14% |
Expenses net of fee waivers, if any | 1.13% | 1.13% | 1.18% | 1.20% | 1.14% |
Expenses net of all reductions | 1.13% | 1.13% | 1.17% | 1.20% | 1.13% |
Net investment income (loss) | .41% | .37% E | .39% F | 1.01% | .22% |
Supplemental Data | | | | |
Net assets, end of period (000 omitted) | $ 1,756,962 | $ 1,899,805 | $ 1,770,675 | $ 1,488,736 | $ 1,136,860 |
Portfolio turnover rate D | 27% | 22% | 49% | 51% | 149% |
A Total returns would have been lower if certain expenses had not been reduced during the applicable periods shown.
B Calculated based on average shares outstanding during the period.
C Fees and expenses of any underlying Fidelity Central Funds are not included in the Fund's expense ratio. The Fund indirectly bears its proportionate share of the expenses of any underlying Fidelity Central Funds.
D Amount does not include the portfolio activity of any underlying Fidelity Central Funds.
E Investment income per share reflects a large, non-recurring dividend which amounted to $.06 per share. Excluding this non-recurring dividend, the ratio of net investment income (loss) to average net assets would have been (.01)%.
F Investment income per share reflects a large, non-recurring dividend which amounted to $.03 per share. Excluding this non-recurring dividend, the ratio of net investment income (loss) to average net assets would have been .12%.
G Expense ratios reflect operating expenses of the class. Expenses before reductions do not reflect amounts reimbursed by the investment adviser or reductions from brokerage service arrangements or reductions from other expense offset arrangements and do not represent the amount paid by the class during periods when reimbursements or reductions occur. Expenses net of fee waivers reflect expenses after reimbursement by the investment adviser but prior to reductions from brokerage service arrangements or other expense offset arrangements. Expenses net of all reductions represent the net expenses paid by the class.
H Amount represents less than $.01 per share.
See accompanying notes which are an integral part of the financial statements.
Annual Report
Financial Highlights - Class F
Years ended July 31, | 2012 | 2011 | 2010 | 2009 I |
Selected Per-Share Data | | | | |
Net asset value, beginning of period | $ 15.64 | $ 13.58 | $ 11.22 | $ 10.27 |
Income from Investment Operations | | | | |
Net investment income (loss) D | .09 | .09 G | .09 H | .01 |
Net realized and unrealized gain (loss) | .32 | 2.23 | 2.34 | .94 |
Total from investment operations | .41 | 2.32 | 2.43 | .95 |
Distributions from net investment income | (.04) | (.14) | (.07) | - |
Distributions from net realized gain | (.93) | (.13) | - | - |
Total distributions | (.96) L | (.26) M | (.07) | - |
Redemption fees added to paid in capital D, K | - | - | - | - |
Net asset value, end of period | $ 15.09 | $ 15.64 | $ 13.58 | $ 11.22 |
Total Return B, C | 3.90% | 17.31% | 21.69% | 9.25% |
Ratios to Average Net Assets E, J | | | | |
Expenses before reductions | .89% | .88% | .90% | .86% A |
Expenses net of fee waivers, if any | .89% | .88% | .90% | .86% A |
Expenses net of all reductions | .89% | .88% | .89% | .86% A |
Net investment income (loss) | .64% | .61% G | .67% H | .64% A |
Supplemental Data | | | | |
Net assets, end of period (000 omitted) | $ 526,009 | $ 279,653 | $ 109,868 | $ 159 |
Portfolio turnover rate F | 27% | 22% | 49% | 51% |
A Annualized
B Total returns for periods of less than one year are not annualized.
C Total returns would have been lower if certain expenses had not been reduced during the applicable periods shown.
D Calculated based on average shares outstanding during the period.
E Fees and expenses of any underlying Fidelity Central Funds are not included in the Fund's expense ratio. The Fund indirectly bears its proportionate share of the expenses of any underlying Fidelity Central Funds.
F Amount does not include the portfolio activity of any underlying Fidelity Central Funds.
G Investment income per share reflects a large, non-recurring dividend which amounted to $.06 per share. Excluding this non-recurring dividend, the ratio of net investment income (loss) to average net assets would have been .24%.
H Investment income per share reflects a large, non-recurring dividend which amounted to $.04 per share. Excluding this non-recurring dividend, the ratio of net investment income (loss) to average net assets would have been .40%.
I For the period June 26, 2009 (commencement of sale of shares) to July 31, 2009.
J Expense ratios reflect operating expenses of the class. Expenses before reductions do not reflect amounts reimbursed by the investment adviser or reductions from brokerage service arrangements or reductions from other expense offset arrangements and do not represent the amount paid by the class during periods when reimbursements or reductions occur. Expense ratios before reductions for start-up periods may not be representative of longer-term operating periods. Expenses net of fee waivers reflect expenses after reimbursement by the investment adviser but prior to reductions from brokerage service arrangements or other expense offset arrangements. Expenses net of all reductions represent the net expenses paid by the class.
K Amount represents less than $.01 per share.
L Total distributions of $.96 per share is comprised of distributions from net investment income of $.036 and distributions from net realized gain of $.925 per share.
M Total distributions of $.26 per share is comprised of distributions from net investment income of $.138 and distributions from net realized gain of $.126 per share.
See accompanying notes which are an integral part of the financial statements.
Annual Report
Financial Highlights - Institutional Class
Years ended July 31, | 2012 | 2011 | 2010 | 2009 | 2008 |
Selected Per-Share Data | | | | |
Net asset value, beginning of period | $ 15.63 | $ 13.58 | $ 11.24 | $ 11.91 | $ 14.43 |
Income from Investment
Operations | | | | |
Net investment income (loss) B | .06 | .06 E | .06 F | .10 | .03 |
Net realized and unrealized gain (loss) | .31 | 2.23 | 2.34 | (.59) | (1.99) |
Total from investment operations | .37 | 2.29 | 2.40 | (.49) | (1.96) |
Distributions from net investment income | (.02) | (.11) | (.06) | (.07) | - |
Distributions from net realized gain | (.93) | (.13) | - | (.11) | (.56) |
Total distributions | (.95) | (.24) | (.06) | (.18) | (.56) |
Redemption fees added to paid in capital B, H | - | - | - | - | - |
Net asset value, end of period | $ 15.05 | $ 15.63 | $ 13.58 | $ 11.24 | $ 11.91 |
Total Return A | 3.59% | 17.02% | 21.42% | (4.04)% | (14.10)% |
Ratios to Average Net Assets C, G | | | | |
Expenses before reductions | 1.14% | 1.10% | 1.12% | 1.20% | 1.13% |
Expenses net of fee waivers, if any | 1.14% | 1.10% | 1.12% | 1.15% | 1.13% |
Expenses net of all reductions | 1.14% | 1.10% | 1.12% | 1.15% | 1.13% |
Net investment income (loss) | .39% | .39% E | .45% F | 1.06% | .22% |
Supplemental Data | | | | |
Net assets, end of period (000 omitted) | $ 138,981 | $ 101,565 | $ 78,440 | $ 10,336 | $ 8,584 |
Portfolio turnover rate D | 27% | 22% | 49% | 51% | 149% |
A Total returns would have been lower if certain expenses had not been reduced during the applicable periods shown.
B Calculated based on average shares outstanding during the period.
C Fees and expenses of any underlying Fidelity Central Funds are not included in the Fund's expense ratio. The Fund indirectly bears its proportionate share of the expenses of any underlying Fidelity Central Funds.
D Amount does not include the portfolio activity of any underlying Fidelity Central Funds.
E Investment income per share reflects a large, non-recurring dividend which amounted to $.06 per share. Excluding this non-recurring dividend, the ratio of net investment income (loss) to average net assets would have been .01%.
F Investment income per share reflects a large, non-recurring dividend which amounted to $.03 per share. Excluding this non-recurring dividend, the ratio of net investment income (loss) to average net assets would have been .18%.
G Expense ratios reflect operating expenses of the class. Expenses before reductions do not reflect amounts reimbursed by the investment adviser or reductions from brokerage service arrangements or reductions from other expense offset arrangements and do not represent the amount paid by the class during periods when reimbursements or reductions occur. Expenses net of fee waivers reflect expenses after reimbursement by the investment adviser but prior to reductions from brokerage service arrangements or other expense offset arrangements. Expenses net of all reductions represent the net expenses paid by the class.
H Amount represents less than $.01 per share.
See accompanying notes which are an integral part of the financial statements.
Annual Report
Notes to Financial Statements
For the period ended July 31, 2012
1. Organization.
Fidelity Small Cap Value Fund (the Fund) is a fund of Fidelity Securities Fund (the Trust) and is authorized to issue an unlimited number of shares. The Trust is registered under the Investment Company Act of 1940, as amended (the 1940 Act), as an open-end management investment company organized as a Massachusetts business trust. The Fund offers Class A, Class T, Class C, Small Cap Value, Class F and Institutional Class shares, each of which, along with Class B shares, has equal rights as to assets and voting privileges. Effective after the close of business on September 1, 2010, Class B shares were closed to new accounts and additional purchases, except for exchanges and reinvestments. Each class has exclusive voting rights with respect to matters that affect that class. Class F shares of the Fund are only available for purchase by mutual funds for which Fidelity Management & Research Company (FMR) or an affiliate serves as investment manager. Class B shares will automatically convert to Class A shares after a holding period of seven years from the initial date of purchase. Investment income, realized and unrealized capital gains and losses, the common expenses of the Fund, and certain fund-level expense reductions, if any, are allocated on a pro-rata basis to each class based on the relative net assets of each class to the total net assets of the Fund. Each class differs with respect to transfer agent and distribution and service plan fees incurred. Certain expense reductions may also differ by class.
2. Investments in Fidelity Central Funds.
The Fund invests in Fidelity Central Funds, which are open-end investment companies available only to other investment companies and accounts managed by FMR and its affiliates. The Fund's Schedule of Investments lists each of the Fidelity Central Funds held as of period end, if any, as an investment of the Fund, but does not include the underlying holdings of each Fidelity Central Fund. As an Investing Fund, the Fund indirectly bears its proportionate share of the expenses of the underlying Fidelity Central Funds.
The Money Market Central Funds seek preservation of capital and current income and are managed by Fidelity Investments Money Management, Inc. (FIMM), an affiliate of FMR.
A complete unaudited list of holdings for each Fidelity Central Fund is available upon request or at the Securities and Exchange Commission (the SEC) web site at www.sec.gov. In addition, the financial statements of the Fidelity Central Funds, which are not covered by the Fund's Report of Independent Registered Public Accounting Firm, are available on the SEC web site or upon request.
Annual Report
Notes to Financial Statements - continued
3. Significant Accounting Policies.
The financial statements have been prepared in conformity with accounting principles generally accepted in the United States of America (GAAP), which require management to make certain estimates and assumptions at the date of the financial statements. Actual results could differ from those estimates. Subsequent events, if any, through the date that the financial statements were issued have been evaluated in the preparation of the financial statements. The following summarizes the significant accounting policies of the Fund:
Security Valuation. Investments are valued as of 4:00 p.m. Eastern time on the last calendar day of the period. In accordance with valuation policies and procedures approved by the Board of Trustees (the Board), the Fund attempts to obtain prices from one or more third party pricing vendor or broker to value its investments. When current market prices, quotations or rates are not readily available or reliable, securities will be fair valued in good faith by the FMR Fair Value Committee (the Committee), in accordance with procedures adopted by the Fund's Board. Factors used in determining fair value vary by security type and may include market or security specific events. The frequency with which these procedures are used cannot be predicted and they may be utilized to a significant extent. The Committee oversees the Fund's valuation policies and procedures and is responsible for approving and reporting to the Board all fair value determinations.
The Fund categorizes the inputs to valuation techniques used to value its investments into a disclosure hierarchy consisting of three levels as shown below:
Level 1 - quoted prices in active markets for identical investments
Level 2 - other significant observable inputs (including quoted prices for similar investments, interest rates, prepayment speeds, etc.)
Level 3 - unobservable inputs (including the Fund's own assumptions based on the best information available)
Valuation techniques used to value the Fund's investments by major category are as follows:
Equity securities, including restricted securities, for which market quotations are readily available, are valued at the last reported sale price or official closing price as reported by a third party pricing vendor on the primary market or exchange on which they are traded and are categorized as Level 1 in the hierarchy. In the event there were no sales during the day or closing prices are not available, securities are valued at the last quoted bid price or may be valued using the last available price and are generally categorized as Level 2 in the hierarchy. For foreign equity securities, when significant market or security specific events arise, comparisons to the valuation of American Depositary Receipts
Annual Report
3. Significant Accounting Policies - continued
Security Valuation - continued
(ADRs), futures contracts, Exchange-Traded Funds (ETFs) and certain indexes as well as quoted prices for similar securities are used and are categorized as Level 2 in the hierarchy. Utilizing these techniques may result in transfers between Level 1 and Level 2.
Investments in open-end mutual funds, including the Fidelity Central Funds, are valued at their closing net asset value each business day and are categorized as Level 1 in the hierarchy.
Changes in valuation techniques may result in transfers in or out of an assigned level within the disclosure hierarchy. The aggregate value of investments by input level, as of July 31, 2012, including information on transfers between Levels 1 and 2, is included at the end of the Fund's Schedule of Investments.
Foreign Currency Translation. The Fund may use foreign currency contracts to facilitate transactions in foreign-denominated securities. Gains and losses from these transactions may arise from changes in the value of the foreign currency or if the counterparties do not perform under the contracts' terms.
Foreign-denominated assets, including investment securities, and liabilities are translated into U.S. dollars at the exchange rates at period end. Purchases and sales of investment securities, income and dividends received and expenses denominated in foreign currencies are translated into U.S. dollars at the exchange rate in effect on the transaction date.
The effects of exchange rate fluctuations on investments are included with the net realized and unrealized gain (loss) on investment securities. Other foreign currency transactions resulting in realized and unrealized gain (loss) are disclosed separately.
Investment Transactions and Income. For financial reporting purposes, the Fund's investment holdings and NAV include trades executed through the end of the last business day of the period. The NAV per share for processing shareholder transactions is calculated as of the close of business of the New York Stock Exchange (NYSE), normally 4:00 p.m. Eastern time and includes trades executed through the end of the prior business day. Gains and losses on securities sold are determined on the basis of identified cost and may include proceeds received from litigation. Dividend income is recorded on the ex-dividend date, except for certain dividends from foreign securities where the ex-dividend date may have passed, which are recorded as soon as the Fund is informed of the ex-dividend date. Non-cash dividends included in dividend income, if any, are recorded at the fair market value of the securities received. Distributions received on securities that represent a return of capital or capital gain are recorded as a reduction of
Annual Report
Notes to Financial Statements - continued
3. Significant Accounting Policies - continued
Investment Transactions and Income - continued
cost of investments and/or as a realized gain. The Fund estimates the components of distributions received that may be considered return of capital distributions or capital gain distributions. Interest income and distributions from the Fidelity Central Funds are accrued as earned. Interest income includes coupon interest and amortization of premium and accretion of discount on debt securities. Investment income is recorded net of foreign taxes withheld where recovery of such taxes is uncertain.
Expenses. Expenses directly attributable to a fund are charged to that fund. Expenses attributable to more than one fund are allocated among the respective funds on the basis of relative net assets or other appropriate methods. Expense estimates are accrued in the period to which they relate and adjustments are made when actual amounts are known.
Income Tax Information and Distributions to Shareholders. Each year, the Fund intends to qualify as a regulated investment company under Subchapter M of the Internal Revenue Code, including distributing substantially all of its taxable income and realized gains. As a result, no provision for income taxes is required. As of July 31, 2012, the Fund did not have any unrecognized tax benefits in the financial statements; nor is the Fund aware of any tax positions for which it is reasonably possible that the total amounts of unrecognized tax benefits will significantly change in the next twelve months. The Fund files a U.S. federal tax return, in addition to state and local tax returns as required. A fund's federal income tax returns are subject to examination by the Internal Revenue Service (IRS) for a period of three fiscal years after they are filed. State and local tax returns may be subject to examination for an additional fiscal year depending on the jurisdiction. Foreign taxes are provided for based on the Fund's understanding of the tax rules and rates that exist in the foreign markets in which it invests.
Distributions are declared and recorded on the ex-dividend date. Income dividends and capital gain distributions are declared separately for each class. Income and capital gain distributions are determined in accordance with income tax regulations, which may differ from GAAP. In addition, the Fund claimed a portion of the payment made to redeeming shareholders as a distribution for income tax purposes.
Capital accounts within the financial statements are adjusted for permanent book-tax differences. These adjustments have no impact on net assets or the results of operations. Temporary book-tax differences will reverse in a subsequent period.
Book-tax differences are primarily due to foreign currency transactions and losses deferred due to wash sales.
Annual Report
3. Significant Accounting Policies - continued
Income Tax Information and Distributions to Shareholders - continued
The federal tax cost of investment securities and unrealized appreciation (depreciation) as of period end were as follows:
Gross unrealized appreciation | $ 491,346,133 |
Gross unrealized depreciation | (137,153,760) |
Net unrealized appreciation (depreciation) on securities and other investments | $ 354,192,373 |
| |
Tax Cost | $ 2,383,068,475 |
The tax-based components of distributable earnings as of period end were as follows:
Undistributed ordinary income | $ 4,596,351 |
Undistributed long-term capital gain | $ 73,839,567 |
Net unrealized appreciation (depreciation) | $ 354,192,996 |
The tax character of distributions paid was as follows:
| July 31, 2012 | July 31, 2011 |
Ordinary Income | $ 3,813,704 | $ 16,899,273 |
Long-term Capital Gains | 148,970,854 | 19,302,851 |
Total | $ 152,784,558 | $ 36,202,124 |
Short-Term Trading (Redemption) Fees. Shares held by investors in the Fund less than 90 days are subject to a redemption fee equal to 1.50% of the net asset value of shares redeemed. All redemption fees, which reduce the proceeds of the shareholder redemption, are retained by the Fund and accounted for as an addition to paid in capital.
New Accounting Pronouncement. In December 2011, the Financial Accounting Standards Board issued Accounting Standard Update No. 2011-11, Disclosures about Offsetting Assets and Liabilities. The update creates new disclosure requirements requiring entities to disclose both gross and net information for derivatives and other financial instruments that are either offset in the Statement of Assets and Liabilities or subject to an enforceable master netting arrangement or similar agreement. The disclosure requirements are effective for interim and annual reporting periods beginning on or after January 1, 2013. Management is currently evaluating the impact of the update's adoption on the Fund's financial statement disclosures.
4. Purchases and Sales of Investments.
Purchases and sales of securities, other than short-term securities, aggregated $758,866,730 and $657,878,656, respectively.
Annual Report
Notes to Financial Statements - continued
5. Fees and Other Transactions with Affiliates.
Management Fee. FMR and its affiliates provide the Fund with investment management related services for which the Fund pays a monthly management fee. The management fee is the sum of an individual fund fee rate that is based on an annual rate of .45% of the Fund's average net assets and an annualized group fee rate that averaged .26% during the period. The group fee rate is based upon the average net assets of all the mutual funds advised by FMR. The group fee rate decreases as assets under management increase and increases as assets under management decrease. In addition, the management fee is subject to a performance adjustment (up to a maximum of ± .20% of the Fund's average net assets over a 36 month performance period). The upward or downward adjustment to the management fee is based on the relative investment performance of Small Cap Value as compared to an appropriate benchmark index. For the period, the total annual management fee rate, including the performance adjustment, was .85% of the Fund's average net assets.
Distribution and Service Plan Fees. In accordance with Rule 12b-1 of the 1940 Act, the Fund has adopted separate Distribution and Service Plans for each class of shares. Certain classes pay Fidelity Distributors Corporation (FDC), an affiliate of FMR, separate Distribution and Service Fees, each of which is based on an annual percentage of each class' average net assets. In addition, FDC may pay financial intermediaries for selling shares of the Fund and providing shareholder support services. For the period, the Distribution and Service Fee rates, total fees and amounts retained by FDC were as follows:
| Distribution
Fee | Service
Fee | Total Fees | Retained
by FDC |
Class A | -% | .25% | $ 346,065 | $ 6,112 |
Class T | .25% | .25% | 268,038 | 110 |
Class B | .75% | .25% | 72,196 | 54,146 |
Class C | .75% | .25% | 438,167 | 78,130 |
| | | $ 1,124,466 | $ 138,498 |
Sales Load. FDC may receive a front-end sales charge of up to 5.75% for selling Class A shares and 3.50% for selling Class T shares, some of which is paid to financial intermediaries for selling shares of the Fund. Depending on the holding period, FDC may receive contingent deferred sales charges levied on Class A, Class T, Class B, and Class C redemptions. The deferred sales charges range from 5.00% to 1.00% for Class B shares, 1.00% for Class C shares, 1.00% for certain purchases of Class A shares and .25% for certain purchases of Class T shares.
Annual Report
5. Fees and Other Transactions with Affiliates - continued
Sales Load - continued
For the period, sales charge amounts retained by FDC were as follows:
| Retained
by FDC |
Class A | $ 40,974 |
Class T | 7,602 |
Class B* | 9,371 |
Class C* | 4,952 |
| $ 62,899 |
* When Class B and Class C shares are initially sold, FDC pays commissions from its own resources to financial intermediaries through which the sales are made.
Transfer Agent Fees. Fidelity Investments Institutional Operations Company, Inc. (FIIOC), an affiliate of FMR, is the transfer, dividend disbursing and shareholder servicing agent for each class of the Fund. FIIOC receives account fees and asset-based fees that vary according to the account size and type of account of the shareholders of the respective classes of the Fund, except for Class F. FIIOC receives no fees for providing transfer agency services to Class F. FIIOC pays for typesetting, printing and mailing of shareholder reports, except proxy statements. For the period, transfer agent fees for each class were as follows:
| Amount | % of
Average
Net Assets |
Class A | $ 413,829 | .30 |
Class T | 150,262 | .28 |
Class B | 21,652 | .30 |
Class C | 131,410 | .30 |
Small Cap Value | 3,956,103 | .23 |
Institutional Class | 283,320 | .25 |
| $ 4,956,576 | |
Accounting and Security Lending Fees. Fidelity Service Company, Inc. (FSC), an affiliate of FMR, maintains the Fund's accounting records. The accounting fee is based on the level of average net assets for each month. Under a separate contract, FSC administers the security lending program. The security lending fee is based on the number and duration of lending transactions.
Brokerage Commissions. The Fund placed a portion of its portfolio transactions with brokerage firms which are affiliates of the investment adviser. The commissions paid to these affiliated firms were $23,890 for the period.
Annual Report
Notes to Financial Statements - continued
5. Fees and Other Transactions with Affiliates - continued
Interfund Lending Program. Pursuant to an Exemptive Order issued by the SEC, the Fund, along with other registered investment companies having management contracts with FMR, may participate in an interfund lending program. This program provides an alternative credit facility allowing the funds to borrow from, or lend money to, other participating affiliated funds. At period end, there were no interfund loans outstanding. The Fund's activity in this program during the period for which loans were outstanding was as follows:
Borrower or Lender | Average
Loan Balance | Weighted Average
Interest Rate | Interest
Expense |
Borrower | $ 6,367,333 | .34% | $ 359 |
6. Committed Line of Credit.
The Fund participates with other funds managed by FMR or an affiliate in a $4.25 billion credit facility (the "line of credit") to be utilized for temporary or emergency purposes to fund shareholder redemptions or for other short-term liquidity purposes. The Fund has agreed to pay commitment fees on its pro-rata portion of the line of credit, which amounted to $6,842 and is reflected in Miscellaneous expenses on the Statement of Operations. During the period, there were no borrowings on this line of credit.
7. Security Lending.
The Fund lends portfolio securities through a lending agent from time to time in order to earn additional income. For equity securities, a lending agent is used and may loan securities to certain qualified borrowers, including Fidelity Capital Markets (FCM), a broker-dealer affiliated with the Fund. On the settlement date of the loan, the Fund receives collateral (in the form of U.S. Treasury obligations, letters of credit and/or cash) against the loaned securities and maintains collateral in an amount not less than 100% of the market value of the loaned securities during the period of the loan. The market value of the loaned securities is determined at the close of business of the Fund and any additional required collateral is delivered to the Fund on the next business day. If the borrower defaults on its obligation to return the securities loaned because of insolvency or other reasons, a fund could experience delays and costs in recovering the securities loaned or in gaining access to the collateral. Any cash collateral received is invested in the Fidelity Securities Lending Cash Central Fund. The value of loaned securities and cash collateral at period end are disclosed on the Fund's Statement of Assets and Liabilities. The value of securities loaned to FCM at period end was $3,305,772. Security lending income represents the income earned on investing cash collateral, less rebates paid to borrowers and any lending agent fees associated with the loan, plus any premium payments received for lending certain types of securities. Security lending income is
Annual Report
7. Security Lending - continued
presented in the Statement of Operations as a component of income from Fidelity Central Funds. Total security lending income during the period amounted to $204,102, including $40,274 from securities loaned to FCM.
8. Expense Reductions.
Many of the brokers with whom FMR places trades on behalf of the Fund provided services to the Fund in addition to trade execution. These services included payments of certain expenses on behalf of the Fund totaling $31,201 for the period.
9. Distributions to Shareholders.
Distributions to shareholders of each class were as follows:
Years ended July 31, | 2012 | 2011 |
From net investment income | | |
Class A | $ 57,416 | $ 602,963 |
Class T | - | 175,083 |
Class B | - | 8,350 |
Class C | - | 50,685 |
Small Cap Value | 2,736,678 | 13,136,446 |
Class F | 858,633 | 1,502,640 |
Institutional Class | 160,977 | 674,898 |
Total | $ 3,813,704 | $ 16,151,065 |
From net realized gain | | |
Class A | $ 8,369,079 | $ 938,086 |
Class T | 3,332,444 | 417,804 |
Class B | 513,839 | 85,354 |
Class C | 2,835,863 | 362,483 |
Small Cap Value | 109,450,254 | 16,213,209 |
Class F | 18,207,376 | 1,278,822 |
Institutional Class | 6,261,999 | 755,301 |
Total | $ 148,970,854 | $ 20,051,059 |
10. Share Transactions.
Transactions for each class of shares were as follows:
| Shares | Dollars |
Years ended July 31, | 2012 | 2011 | 2012 | 2011 |
Class A | | | | |
Shares sold | 3,582,114 | 4,641,222 | $ 51,112,084 | $ 70,784,911 |
Reinvestment of distributions | 639,382 | 98,821 | 7,957,627 | 1,412,739 |
Shares redeemed | (3,203,028) | (2,860,682) | (45,298,282) | (43,524,578) |
Net increase (decrease) | 1,018,468 | 1,879,361 | $ 13,771,429 | $ 28,673,072 |
Annual Report
Notes to Financial Statements - continued
10. Share Transactions - continued
| Shares | Dollars |
Years ended July 31, | 2012 | 2011 | 2012 | 2011 |
Class T | | | | |
Shares sold | 1,074,645 | 1,830,956 | $ 15,238,625 | $ 27,619,849 |
Reinvestment of distributions | 264,657 | 40,370 | 3,258,576 | 573,649 |
Shares redeemed | (1,066,289) | (1,537,319) | (14,773,000) | (23,500,005) |
Net increase (decrease) | 273,013 | 334,007 | $ 3,724,201 | $ 4,693,493 |
Class B | | | | |
Shares sold | 17,886 | 84,331 | $ 244,464 | $ 1,230,023 |
Reinvestment of distributions | 36,117 | 5,817 | 433,889 | 79,168 |
Shares redeemed | (156,185) | (265,513) | (2,129,294) | (3,874,627) |
Net increase (decrease) | (102,182) | (175,365) | $ (1,450,941) | $ (2,565,436) |
Class C | | | | |
Shares sold | 840,854 | 1,131,174 | $ 11,606,643 | $ 16,672,873 |
Reinvestment of distributions | 202,948 | 25,779 | 2,439,209 | 354,104 |
Shares redeemed | (895,789) | (848,659) | (12,102,998) | (12,648,504) |
Net increase (decrease) | 148,013 | 308,294 | $ 1,942,854 | $ 4,378,473 |
Small Cap Value | | | | |
Shares sold | 27,786,966 | 35,677,635 | $ 403,227,336 | $ 541,990,483 |
Reinvestment of distributions | 8,564,707 | 1,987,755 | 107,820,730 | 28,460,668 |
Shares redeemed | (41,177,942) | (46,640,533) | (579,334,071) | (708,788,001) |
Net increase (decrease) | (4,826,269) | (8,975,143) | $ (68,286,005) | $ (138,336,850) |
Class F | | | | |
Shares sold | 17,383,615 | 11,644,633 | $ 249,495,726 | $ 177,097,711 |
Reinvestment of distributions | 1,506,337 | 192,943 | 19,066,009 | 2,781,462 |
Shares redeemed | (1,906,027) | (2,052,505) | (26,618,099) | (32,200,197) |
Net increase (decrease) | 16,983,925 | 9,785,071 | $ 241,943,636 | $ 147,678,976 |
Institutional Class | | | | |
Shares sold | 4,662,732 | 4,417,342 | $ 67,294,175 | $ 67,359,213 |
Reinvestment of distributions | 445,761 | 90,435 | 5,619,794 | 1,288,856 |
Shares redeemed | (2,373,514) | (3,788,938) | (33,655,059) | (58,540,522) |
Net increase (decrease) | 2,734,979 | 718,839 | $ 39,258,910 | $ 10,107,547 |
11. Other.
The Fund's organizational documents provide former and current trustees and officers with a limited indemnification against liabilities arising in connection with the performance of their duties to the Fund. In the normal course of business, the Fund may also enter into contracts that provide general indemnifications. The Fund's maximum exposure under these arrangements is unknown as this would be dependent on future claims that may be made against the Fund. The risk of material loss from such claims is considered remote.
Annual Report
11. Other - continued
At the end of the period, the Fidelity Freedom Funds and Fidelity Freedom K Funds were the owners of record, in the aggregate, of approximately 43% of the total outstanding shares of the Fund.
Annual Report
To the Trustees of Fidelity Securities Fund and the Shareholders of Fidelity Small Cap Value Fund:
In our opinion, the accompanying statement of assets and liabilities, including the schedule of investments, and the related statements of operations and of changes in net assets and the financial highlights present fairly, in all material respects, the financial position of Fidelity Small Cap Value Fund (a fund of Fidelity Securities Fund) at July 31, 2012, the results of its operations for the year then ended, the changes in its net assets for each of the two years in the period then ended and the financial highlights for each of the periods indicated, in conformity with accounting principles generally accepted in the United States of America. These financial statements and financial highlights (hereafter referred to as "financial statements") are the responsibility of the Fidelity Small Cap Value Fund's management. Our responsibility is to express an opinion on these financial statements based on our audits. We conducted our audits of these financial statements in accordance with the standards of the Public Company Accounting Oversight Board (United States). Those standards require that we plan and perform the audit to obtain reasonable assurance about whether the financial statements are free of material misstatement. An audit includes examining, on a test basis, evidence supporting the amounts and disclosures in the financial statements, assessing the accounting principles used and significant estimates made by management, and evaluating the overall financial statement presentation. We believe that our audits, which included confirmation of securities at July 31, 2012 by correspondence with the custodian and brokers, provide a reasonable basis for our opinion.
PricewaterhouseCoopers LLP
Boston, Massachusetts
September 12, 2012
Annual Report
The Trustees, Members of the Advisory Board, and executive officers of the trust and fund, as applicable, are listed below. The Board of Trustees governs the fund and is responsible for protecting the interests of shareholders. The Trustees are experienced executives who meet periodically throughout the year to oversee the fund's activities, review contractual arrangements with companies that provide services to the fund, oversee management of the risks associated with such activities and contractual arrangements, and review the fund's performance. Except for James C. Curvey, each of the Trustees oversees 228 funds advised by FMR or an affiliate. Mr. Curvey oversees 435 funds advised by FMR or an affiliate.
The Trustees hold office without limit in time except that (a) any Trustee may resign; (b) any Trustee may be removed by written instrument, signed by at least two-thirds of the number of Trustees prior to such removal; (c) any Trustee who requests to be retired or who has become incapacitated by illness or injury may be retired by written instrument signed by a majority of the other Trustees; and (d) any Trustee may be removed at any special meeting of shareholders by a two-thirds vote of the outstanding voting securities of the trust. Each Trustee who is not an interested person (as defined in the 1940 Act) (Independent Trustee), shall retire not later than the last day of the calendar year in which his or her 75th birthday occurs. The Independent Trustees may waive this mandatory retirement age policy with respect to individual Trustees. The executive officers and Advisory Board Members hold office without limit in time, except that any officer and Advisory Board Member may resign or may be removed by a vote of a majority of the Trustees at any regular meeting or any special meeting of the Trustees. Except as indicated, each individual has held the office shown or other offices in the same company for the past five years.
Experience, Skills, Attributes, and Qualifications of the Fund's Trustees. The Governance and Nominating Committee has adopted a statement of policy that describes the experience, qualifications, attributes, and skills that are necessary and desirable for potential Independent Trustee candidates (Statement of Policy). The Board believes that each Trustee satisfied at the time he or she was initially elected or appointed a Trustee, and continues to satisfy, the standards contemplated by the Statement of Policy. The Governance and Nominating Committee also engages professional search firms to help identify potential Independent Trustee candidates who have the experience, qualifications, attributes, and skills consistent with the Statement of Policy. From time to time, additional criteria based on the composition and skills of the current Independent Trustees, as well as experience or skills that may be appropriate in light of future changes to board composition, business conditions, and regulatory or other developments, have also been considered by the professional search firms and the Governance and Nominating Committee. In addition, the Board takes into account the Trustees' commitment and participation in Board and committee meetings, as well as their leadership of standing and ad hoc committees throughout their tenure.
In determining that a particular Trustee was and continues to be qualified to serve as a Trustee, the Board has considered a variety of criteria, none of which, in isolation, was controlling. The Board believes that, collectively, the Trustees have balanced and diverse experience, qualifications, attributes, and skills, which allow the Board to operate effectively in governing the fund and protecting the interests of shareholders. Information about the specific experience, skills, attributes, and qualifications of each Trustee, which in each case led to the Board's conclusion that the Trustee should serve (or continue to serve) as a trustee of the fund, is provided below.
Annual Report
Board Structure and Oversight Function. James C. Curvey is an interested person (as defined in the 1940 Act) and currently serves as Chairman. The Trustees have determined that an interested Chairman is appropriate and benefits shareholders because an interested Chairman has a personal and professional stake in the quality and continuity of services provided to the fund. Independent Trustees exercise their informed business judgment to appoint an individual of their choosing to serve as Chairman, regardless of whether the Trustee happens to be independent or a member of management. The Independent Trustees have determined that they can act independently and effectively without having an Independent Trustee serve as Chairman and that a key structural component for assuring that they are in a position to do so is for the Independent Trustees to constitute a substantial majority for the Board. The Independent Trustees also regularly meet in executive session. Ned C. Lautenbach serves as Chairman of the Independent Trustees and as such (i) acts as a liaison between the Independent Trustees and management with respect to matters important to the Independent Trustees and (ii) with management prepares agendas for Board meetings.
Fidelity funds are overseen by different Boards of Trustees. The fund's Board oversees Fidelity's equity and high income funds and another Board oversees Fidelity's investment-grade bond, money market, and asset allocation funds. The asset allocation funds may invest in Fidelity funds overseen by the fund's Board. The use of separate Boards, each with its own committee structure, allows the Trustees of each group of Fidelity funds to focus on the unique issues of the funds they oversee, including common research, investment, and operational issues. On occasion, the separate Boards establish joint committees to address issues of overlapping consequences for the Fidelity funds overseen by each Board.
The Trustees operate using a system of committees to facilitate the timely and efficient consideration of all matters of importance to the Trustees, the fund, and fund shareholders and to facilitate compliance with legal and regulatory requirements and oversight of the fund's activities and associated risks. The Board, acting through its committees, has charged FMR and its affiliates with (i) identifying events or circumstances the occurrence of which could have demonstrably adverse effects on the fund's business and/or reputation; (ii) implementing processes and controls to lessen the possibility that such events or circumstances occur or to mitigate the effects of such events or circumstances if they do occur; and (iii) creating and maintaining a system designed to evaluate continuously business and market conditions in order to facilitate the identification and implementation processes described in (i) and (ii) above. Because the day-to-day operations and activities of the fund are carried out by or through FMR, its affiliates and other service providers, the fund's exposure to risks is mitigated but not eliminated by the processes overseen by the Trustees. While each of the Board's committees has responsibility for overseeing different aspects of the fund's activities, oversight is exercised primarily through the Operations, Audit, and Compliance Committees. In addition, the Independent Trustees have worked with FMR to enhance the Board's oversight of investment and financial risks, legal and regulatory risks, technology risks, and operational risks, including the development of additional risk reporting to the Board. For example, a working group comprised of Independent Trustees and FMR has worked and continues to work to review the Fidelity funds' valuation-related activities, reporting and risk management. Appropriate personnel, including but not limited to the fund's Chief Compliance Officer (CCO), FMR's internal auditor, the independent accountants, the fund's Treasurer and portfolio management personnel, make periodic reports to the Board's committees, as appropriate, including an annual review of FMR's risk management program for the Fidelity funds. The responsibilities of each standing committee, including their oversight responsibilities, are described further under "Standing Committees of the Fund's Trustees."
Annual Report
Trustees and Officers - continued
The fund's Statement of Additional Information (SAI) includes more information about the Trustees. To request a free copy, call Fidelity at 1-800-835-5092.
Interested Trustees*:
Correspondence intended for each Trustee who is an interested person may be sent to Fidelity Investments, 82 Devonshire Street, Boston, Massachusetts 02109.
Name, Age; Principal Occupations and Other Relevant Experience+ |
James C. Curvey (77) |
| Year of Election or Appointment: 2007 Mr. Curvey is Trustee and Chairman of the Board of Trustees of certain Trusts. Mr. Curvey also serves as Trustee (2007-present) of other investment companies advised by FMR. Mr. Curvey is a Director of Fidelity Investments Money Management, Inc. (2009-present), Director of Fidelity Research & Analysis Co. (2009-present) and Director of FMR and FMR Co., Inc. (2007-present). Mr. Curvey is also Vice Chairman (2007-present) and Director of FMR LLC. In addition, Mr. Curvey serves as an Overseer for the Boston Symphony Orchestra and a member of the Trustees of Villanova University. Previously, Mr. Curvey was the Vice Chairman (2006-2007) and Director (2000-2007) of FMR Corp. |
Ronald P. O'Hanley (55) |
| Year of Election or Appointment: 2011 Mr. O'Hanley is Director of FMR Co., Inc. (2010-present), Director of Fidelity Investments Money Management, Inc. (2010-present), Director of Fidelity Research & Analysis Company (2010-present), President of Fidelity Asset Management and Corporate Services and a member of Fidelity's Executive Committee (2010-present). Previously, Mr. O'Hanley served as President and Chief Executive Officer of BNY Mellon Asset Management (2007-2010). Mr. O'Hanley also served as Vice Chairman of Bank New York Mellon Corp. and a member of that firm's Executive Committee. Prior to the 2007 merger of The Bank of New York and Mellon Financial Corporation, he was Vice Chairman of Mellon Financial Corporation and President and Chief Executive Officer of Mellon Asset Management. He joined Mellon in February 1997. Mr. O'Hanley currently serves as Chairman of the Boston Public Library Foundation Board of Directors and sits on the Board of Directors of Beth Israel Deaconess Medical Center, the Board of Trustees of the Marine Biological Laboratory and the Advisory Board of the Maxwell School of Citizenship and Public Administration at Syracuse University. Mr. O'Hanley also chairs the Council on Asset Management for the Financial Services Roundtable and is a member of the Board of Directors of Institutional Investor's U.S. Institute. |
* Trustees have been determined to be "Interested Trustees" by virtue of, among other things, their affiliation with the trusts or various entities under common control with FMR.
+ The information above includes each Trustee's principal occupation during the last five years and other information relating to the experience, attributes, and skills relevant to each Trustee's qualifications to serve as a Trustee, which led to the conclusion that each Trustee should serve as a Trustee for the fund.
Annual Report
Trustees and Officers - continued
Independent Trustees:
Correspondence intended for each Independent Trustee (that is, the Trustees other than the Interested Trustees) may be sent to Fidelity Investments, P.O. Box 55235, Boston, Massachusetts 02205-5235.
Name, Age; Principal Occupations and Other Relevant Experience+ |
Dennis J. Dirks (64) |
| Year of Election or Appointment: 2005 Prior to his retirement in May 2003, Mr. Dirks was Chief Operating Officer and a member of the Board of The Depository Trust & Clearing Corporation (DTCC). He also served as President, Chief Operating Officer, and Board member of The Depository Trust Company (DTC) and President and Board member of the National Securities Clearing Corporation (NSCC). In addition, Mr. Dirks served as Chief Executive Officer and Board member of the Government Securities Clearing Corporation, Chief Executive Officer and Board member of the Mortgage-Backed Securities Clearing Corporation, as a Trustee and a member of the Finance Committee of Manhattan College (2005-2008), and as a Trustee and a member of the Finance Committee of AHRC of Nassau County (2006-2008). Mr. Dirks is a member of the Independent Directors Council (IDC) Governing Council (2010-present) and Board of Directors for The Brookville Center for Children's Services, Inc. (2009-present). |
Alan J. Lacy (58) |
| Year of Election or Appointment: 2008 Mr. Lacy serves as Senior Adviser (2007-present) of Oak Hill Capital Partners, L.P. (private equity). Mr. Lacy also served as Chief Executive Officer (2000-2005) and Vice Chairman (2005-2006) of Sears Holdings Corporation and Sears, Roebuck and Co. (retail). In addition, Mr. Lacy serves as a member of the Board of Directors of Dave & Buster's Entertainment, Inc. (restaurant and entertainment complexes, 2010-present), Earth Fare, Inc. (retail grocery, 2012-present), The Hillman Companies, Inc. (hardware wholesalers, 2010-present), and Bristol-Myers Squibb Company (global pharmaceuticals, 2007-present). Mr. Lacy is a member of the Board of Trustees of The National Parks Conservation Association (2006-present). Previously, Mr. Lacy served as Chairman of the Board of Trustees of the National Parks Conservation Association (2008-2011) and as a member of the Board of Directors for the Western Union Company (global money transfer, 2006-2011). |
Ned C. Lautenbach (68) |
| Year of Election or Appointment: 2000 Mr. Lautenbach is Chairman of the Independent Trustees of the Equity and High Income Funds (2006-present). Mr. Lautenbach currently serves as the Lead Director of the Eaton Corporation Board of Directors (diversified industrial, 1997-present). Mr. Lautenbach is Chairman of the Board of Directors of the Philharmonic Center for the Arts in Naples, Florida (2012-present) and a member of the Council on Foreign Relations (1994-present). Previously, Mr. Lautenbach was a Partner/Advisory Partner at Clayton, Dubilier & Rice, LLC (private equity investment, 1998-2010), as well as a Director of Sony Corporation (2006-2007). |
Joseph Mauriello (67) |
| Year of Election or Appointment: 2008 Prior to his retirement in January 2006, Mr. Mauriello served in numerous senior management positions including Deputy Chairman and Chief Operating Officer (2004-2005), and Vice Chairman of Financial Services (2002-2004) of KPMG LLP US (professional services, 1965-2005). Mr. Mauriello currently serves as a member of the Board of Directors of XL Group plc. (global insurance and re-insurance, 2006-present). Previously, Mr. Mauriello served as a Director of the Hamilton Funds of the Bank of New York (2006-2007) and of Arcadia Resources Inc. (health care services and products, 2007-2012). |
Robert W. Selander (61) |
| Year of Election or Appointment: 2011 Previously, Mr. Selander served as a Member of the Advisory Board of Fidelity's Equity and High Income Funds (2011), Executive Vice Chairman (2010), Chief Executive Officer (2009-2010), and President and Chief Executive Officer (1997-2009) of Mastercard, Inc. |
Cornelia M. Small (68) |
| Year of Election or Appointment: 2005 Ms. Small is a member of the Board of Directors of the Teagle Foundation (2009-present). Ms. Small is also a member of the Investment Committee, and Chair (2008-present) and a member of the Board of Trustees of Smith College. In addition, Ms. Small serves on the Investment Committee of the Berkshire Taconic Community Foundation (2008-present). Previously, Ms. Small served as Chairperson of the Investment Committee (2002-2008) of Smith College. In addition, Ms. Small served as Chief Investment Officer, Director of Global Equity Investments, and a member of the Board of Directors of Scudder, Stevens & Clark and Scudder Kemper Investments. |
William S. Stavropoulos (73) |
| Year of Election or Appointment: 2002 Mr. Stavropoulos is Vice Chairman of the Independent Trustees of the Equity and High Income Funds (2006-present). Mr. Stavropoulos serves as President and Founder of the Michigan Baseball Foundation, the Great Lakes Loons (2007-present). Mr. Stavropoulos is Chairman Emeritus of the Board of Directors of The Dow Chemical Company, where he previously served in numerous senior management positions, including President, CEO (1995-2000; 2002-2004), Chairman of the Executive Committee (2000-2006), and as a member of the Board of Directors (1990-2006). Currently, Mr. Stavropoulos is Chairman of Univar (global distributor of commodity and specialty chemicals, 2010-present), a Director of Teradata Corporation (data warehousing and technology solutions, 2008-present), Chemical Financial Corporation, Maersk Inc. (industrial conglomerate), Tyco International, Inc. (multinational manufacturing and services, 2007-present), and a member of the Advisory Board for Metalmark Capital (private equity investment, 2005-present). Mr. Stavropoulos is a special advisor to Clayton, Dubilier & Rice, LLC (private equity investment). In addition, Mr. Stavropoulos is a member of the University of Notre Dame Advisory Council for the College of Science. |
David M. Thomas (63) |
| Year of Election or Appointment: 2008 Previously, Mr. Thomas served as Executive Chairman (2005-2006) and Chairman and Chief Executive Officer (2000-2005) of IMS Health, Inc. (pharmaceutical and healthcare information solutions). In addition, Mr. Thomas serves as a member of the Board of Directors of Fortune Brands, Inc. (consumer products), and Interpublic Group of Companies, Inc. (marketing communication, 2004-present). |
Michael E. Wiley (61) |
| Year of Election or Appointment: 2008 Mr. Wiley also serves as a Director of Asia Pacific Exploration Consolidated (international oil and gas exploration and production, 2008-present). Mr. Wiley serves as a Director of Tesoro Corporation (independent oil refiner and marketer, 2005-present), and a Director of Bill Barrett Corporation (exploration and production, 2005-present). In addition, Mr. Wiley also serves as a Director of Post Oak Bank (privately-held bank, 2004-present). Previously, Mr. Wiley served as a member of the Board of Trustees of the University of Tulsa (2000-2006; 2007-2010), as a Senior Energy Advisor of Katzenbach Partners, LLC (consulting, 2006-2007), as an Advisory Director of Riverstone Holdings (private investment), Chairman, President, and CEO of Baker Hughes, Inc. (oilfield services, 2000-2004), and as Director of Spinnaker Exploration Company (exploration and production, 2001-2005). |
Annual Report
+ The information above includes each Trustee's principal occupation during the last five years and other information relating to the experience, attributes, and skills relevant to each Trustee's qualifications to serve as a Trustee, which led to the conclusion that each Trustee should serve as a Trustee for the fund.
Advisory Board Members and Executive Officers:
Correspondence intended for David A. Rosow and Garnett A. Smith may be sent to Fidelity Investments, P.O. Box 55235, Boston, Massachusetts 02205-5235. Correspondence intended for each executive officer, Edward C. Johnson 3d, and Peter S. Lynch may be sent to Fidelity Investments, 82 Devonshire Street, Boston, Massachusetts 02109.
Name, Age; Principal Occupation |
Edward C. Johnson 3d (82) |
| Year of Election or Appointment: 2011 Member of the Advisory Board of Fidelity's Equity and High Income Funds. Mr. Johnson serves as Chief Executive Officer, Chairman, and a Director of FMR LLC, and also serves as Chairman and Director of FIL Limited. Previously, Mr. Johnson served as a Trustee and Chairman of the Board of certain Fidelity Trusts, Chairman and a Director of FMR, Chairman and a Director of FMR Co., Inc., and President of FMR LLC (2006-2007). |
Peter S. Lynch (68) |
| Year of Election or Appointment: 2003 Member of the Advisory Board of Fidelity's Equity and High Income Funds. Mr. Lynch is Vice Chairman and a Director of FMR and FMR Co., Inc. In addition, Mr. Lynch serves as a Trustee of Boston College and as the Chairman of the Inner-City Scholarship Fund. Previously, Mr. Lynch served on the Special Olympics International Board of Directors (1997-2006). |
David A. Rosow (69) |
| Year of Election or Appointment: 2012 Member of the Advisory Board of Fidelity's Equity and High Income Funds. Chairman and Chief Executive Officer of International Golf Group, Inc. (golf course development, 1990-present). Previously, Mr. Rosow served as Chairman and Chief Executive Officer of Rosow & Company, Inc. (private investment company, 1989-2011), a Lead Director of Hudson United Bancorp (2001-2006) and as a Director of TD Banknorth (1996-2006). In addition, Mr. Rosow is a member (2008-present) and President (2009-present) of the Town Council of Palm Beach, Florida. |
Garnett A. Smith (64) |
| Year of Election or Appointment: 2012 Member of the Advisory Board of Fidelity's Equity and High Income Funds. Prior to Mr. Smith's retirement, he served as Chairman and Chief Executive Officer of Inbrand Corp. (manufacturer of personal absorbent products, 1990-1997). He also served as President (1986-1990) of Inbrand Corp. Prior to his employment with Inbrand Corp., he was employed by a retail fabric chain and North Carolina National Bank. In addition, Mr. Smith is a board member of the Jackson Hole Land Trust (2009-present). |
Kenneth B. Robins (42) |
| Year of Election or Appointment: 2008 President and Treasurer of Fidelity's Equity and High Income Funds. Mr. Robins also serves as President and Treasurer (2010-present) and Assistant Treasurer (2009-present) of other Fidelity funds and is an employee of Fidelity Investments (2004-present). Previously, Mr. Robins served as Deputy Treasurer of the Fidelity funds (2005-2008) and Treasurer and Chief Financial Officer of The North Carolina Capital Management Trust: Cash and Term Portfolios (2006-2008). |
Brian B. Hogan (47) |
| Year of Election or Appointment: 2009 Vice President of Equity and High Income Funds. Mr. Hogan also serves as President of FMR's Equity Division (2009-present). Previously, Mr. Hogan served as Senior Vice President, Equity Research of FMR (2006-2009) and as a portfolio manager. |
Thomas C. Hense (48) |
| Year of Election or Appointment: 2008 or 2010 Vice President of Fidelity's High Income (2008), Small Cap (2008), and Value (2010) Funds. Previously, Mr. Hense served as a portfolio manager for Fidelity's Institutional Money Management Group (Pyramis) (2003-2008). |
Scott C. Goebel (44) |
| Year of Election or Appointment: 2008 Secretary and Chief Legal Officer (CLO) of the Fidelity funds. Mr. Goebel also serves as Secretary of Fidelity Investments Money Management, Inc. (FIMM) (2010-present) and Fidelity Research and Analysis Company (FRAC) (2010-present); Secretary and CLO of The North Carolina Capital Management Trust: Cash and Term Portfolios (2008-present); General Counsel, Secretary, and Senior Vice President of FMR (2008-present) and FMR Co., Inc. (2008-present); employed by FMR LLC or an affiliate (2001-present); Chief Legal Officer of Fidelity Management & Research (Hong Kong) Limited (2008-present) and Assistant Secretary of Fidelity Management & Research (Japan) Inc. (2008-present), and Fidelity Management & Research (U.K.) Inc. (2008-present). Previously, Mr. Goebel served as Assistant Secretary of FIMM (2008-2010), FRAC (2008-2010), and the Funds (2007-2008) and as Vice President and Secretary of Fidelity Distributors Corporation (FDC) (2005-2007). |
William C. Coffey (43) |
| Year of Election or Appointment: 2009 Assistant Secretary of Fidelity's Equity and High Income Funds. Mr. Coffey also serves as Senior Vice President and Deputy General Counsel of FMR LLC (2010-present), and is an employee of Fidelity Investments. Previously, Mr. Coffey served as Vice President and Associate General Counsel of FMR LLC (2005-2009). |
Elizabeth Paige Baumann (44) |
| Year of Election or Appointment: 2012 Anti-Money Laundering (AML) Officer of the Fidelity funds. Ms. Baumann also serves as AML Officer of The North Carolina Capital Management Trust: Cash and Term Portfolios (2012-present), Chief AML Officer of FMR LLC (2012-present), and is an employee of Fidelity Investments. Previously, Ms. Baumann served as Vice President and Deputy Anti-Money Laundering Officer (2007-2012). |
Christine Reynolds (53) |
| Year of Election or Appointment: 2008 Chief Financial Officer of the Fidelity funds. Ms. Reynolds became President of Fidelity Pricing and Cash Management Services (FPCMS) in August 2008. Ms. Reynolds served as Chief Operating Officer of FPCMS (2007-2008). Previously, Ms. Reynolds served as President, Treasurer, and Anti-Money Laundering officer of the Fidelity funds (2004-2007). |
Joseph A. Hanlon (44) |
| Year of Election or Appointment: 2012 Chief Compliance Officer of Fidelity's Equity and High Income Funds. Mr. Hanlon serves as Compliance Officer of FMR, FMR Co., Inc., Fidelity Investments Money Management, Inc. (FIMM), Fidelity Research and Analysis Company (FRAC), Fidelity Management & Research (Japan) Inc., Fidelity Management & Research (U.K.) Inc., Fidelity Management & Research (Hong Kong), and Strategic Advisers, Inc. (2009-present), as Senior Vice President of the Fidelity Asset Management Division (2009-present), and is an employee of Fidelity Investments. |
Joseph F. Zambello (55) |
| Year of Election or Appointment: 2011 Deputy Treasurer of the Fidelity funds. Mr. Zambello is an employee of Fidelity Investments. Previously, Mr. Zambello served as Vice President of FMR's Program Management Group (2009-2011) and Vice President of the Transfer Agent Oversight Group (2005-2009). |
Adrien E. Deberghes (44) |
| Year of Election or Appointment: 2008 Deputy Treasurer of Fidelity's Equity and High Income Funds. Mr. Deberghes also serves as Vice President (2011-present) and Assistant Treasurer (2010-present) of other Fidelity funds, and is an employee of Fidelity Investments (2008-present). Previously, Mr. Deberghes served as Senior Vice President of Mutual Fund Administration at State Street Corporation (2007-2008), Senior Director of Mutual Fund Administration at Investors Bank & Trust (2005-2007), and Director of Finance for Dunkin' Brands (2000-2005). |
Stephanie J. Dorsey (43) |
| Year of Election or Appointment: 2010 Assistant Treasurer of Fidelity's Equity and High Income Funds. Ms. Dorsey also serves as Deputy Treasurer of other Fidelity funds (2008-present) and is an employee of Fidelity Investments (2008-present). Previously, Ms. Dorsey served as Treasurer (2004-2008) of the JPMorgan Mutual Funds and Vice President (2004-2008) of JPMorgan Chase Bank. |
John R. Hebble (54) |
| Year of Election or Appointment: 2009 Assistant Treasurer of Fidelity's Equity and High Income Funds. Mr. Hebble also serves as President (2011-present), Treasurer, and Chief Financial Officer of The North Carolina Capital Management Trust: Cash and Term Portfolios (2008-present), President and Treasurer of other Fidelity funds (2008-present) and is an employee of Fidelity Investments. |
Gary W. Ryan (53) |
| Year of Election or Appointment: 2005 Assistant Treasurer of the Fidelity funds. Mr. Ryan is an employee of Fidelity Investments. Previously, Mr. Ryan served as Vice President of Fund Reporting in Fidelity Pricing and Cash Management Services (FPCMS) (1999-2005). |
Jonathan Davis (44) |
| Year of Election or Appointment: 2010 Assistant Treasurer of the Fidelity funds. Mr. Davis is also Assistant Treasurer of Fidelity Rutland Square Trust II and Fidelity Commonwealth Trust II. Mr. Davis is an employee of Fidelity Investments. Previously, Mr. Davis served as Vice President and Associate General Counsel of FMR LLC (2003-2010). |
Annual Report
The Board of Trustees of Fidelity Small Cap Value Fund voted to pay to shareholders of record at the opening of business, the following distributions per share derived from capital gains realized from sales of portfolio securities, and dividends derived from net investment income:
| Pay Date | Record Date | Dividends | Capital Gains |
Class F | 09/10/12 | 09/07/12 | $0.045 | $0.411 |
Class F designates 100% of the dividends distributed during the fiscal year as qualifying for the dividends-received deduction for corporate shareholders.
Class F designates 100% of the dividends distributed during the fiscal year as amounts which can be taken into account as a dividend for the purposes of the maximum rate under section 1(h)(11) of the Internal Revenue Code.
The fund hereby designates as a capital gain dividend with respect to the taxable year ended July 31,2012, $98,274,256, or, if subsequently determined to be different, the net capital gain of such year.
The fund will notify shareholders in January 2013 of amounts for use in preparing 2012 income tax returns.
Annual Report
Board Approval of Investment Advisory Contracts and Management Fees
Fidelity Small Cap Value Fund
Each year, the Board of Trustees, including the Independent Trustees (together, the Board), votes on the renewal of the management contract and sub-advisory agreements (together, the Advisory Contracts) for the fund. The Board, assisted by the advice of fund counsel and Independent Trustees' counsel, requests and considers a broad range of information relevant to the renewal of the Advisory Contracts throughout the year.
The Board meets regularly and, at each of its meetings, considers factors that are relevant to its annual consideration of the renewal of the fund's Advisory Contracts, including the services and support provided to the fund and its shareholders. The Board has established various standing committees, each composed of and chaired by Independent Trustees with varying backgrounds, to which the Board has assigned specific subject matter responsibilities in order to enhance effective decision-making by the Board. The Board, acting directly and through its Committees, requests and receives information concerning the annual consideration of the renewal of the fund's Advisory Contracts. The Board also meets as needed to consider matters specifically related to the Board's annual consideration of the renewal of Advisory Contracts. Members of the Board may also meet with trustees of other Fidelity funds through ad hoc joint committees to discuss certain matters relevant to the Fidelity funds.
At its July 2012 meeting, the Board of Trustees, including the Independent Trustees, unanimously determined to renew the fund's Advisory Contracts. In reaching its determination, the Board considered all factors it believed relevant, including (i) the nature, extent, and quality of the services to be provided to the fund and its shareholders (including the investment performance of the fund); (ii) the competitiveness of the fund's management fee and total expense ratio relative to peer funds; (iii) the total costs of the services to be provided by and the profits to be realized by Fidelity from its relationship with the fund; (iv) the extent to which economies of scale exist and would be realized as the fund grows; and (v) whether fee levels reflect these economies of scale, if any, for the benefit of fund shareholders.
In considering whether to renew the Advisory Contracts for the fund, the Board reached a determination, with the assistance of fund counsel and Independent Trustees' counsel and through the exercise of its business judgment, that the renewal of the Advisory Contracts is in the best interests of the fund and its shareholders and that the compensation payable under the Advisory Contracts is fair and reasonable. The Board's decision to renew the Advisory Contracts was not based on any single factor, but rather was based on a comprehensive consideration of all the information provided to the Board at its meetings throughout the year. The Board, in reaching its determination to renew the Advisory Contracts, is aware that shareholders in the fund have a broad range of investment choices available to them, including a wide choice among mutual funds offered by Fidelity's competitors, and that the fund's shareholders, who have the opportunity to review and weigh the disclosure provided by the fund in its prospectus and other public disclosures, have chosen to invest in this fund, managed by Fidelity.
Annual Report
Board Approval of Investment Advisory Contracts and
Management Fees - continued
Nature, Extent, and Quality of Services Provided. The Board considered the staffing within the investment adviser, FMR, and the sub-advisers (together, the Investment Advisers), including the backgrounds of the fund's investment personnel, and also considered the fund's investment objective, strategies, and related investment philosophy. The Independent Trustees also had discussions with senior management of Fidelity's investment operations and investment groups. The Board considered the structure of the portfolio manager compensation program and whether this structure provides appropriate incentives to act in the best interests of the fund.
Resources Dedicated to Investment Management and Support Services. The Board and the Fund Oversight and Research Committees reviewed the general qualifications and capabilities of the Investment Advisers' investment staff, including its size, education, experience, and resources, as well as the Investment Advisers' approach to recruiting, training, managing, and compensating investment personnel. The Board also noted that FMR has continued to increase the resources devoted to non-U.S. offices, including expansion of Fidelity's global investment organization. The Board noted that Fidelity's analysts have extensive resources, tools and capabilities that allow them to conduct sophisticated quantitative and fundamental analysis, as well as credit analysis of issuers, counterparties and guarantors. The Board also believes that Fidelity's investment professionals have sufficient access to global information and data so as to provide competitive investment results over time, and that those professionals also have access to sophisticated tools that permit them to assess portfolio construction and risk and performance attribution characteristics continuously, as well as to transmit new information and research conclusions rapidly around the world. Additionally, in its deliberations, the Board considered the Investment Advisers' trading and risk management capabilities and resources, which are an integral part of the investment management process.
Shareholder and Administrative Services. The Board considered (i) the nature, extent, quality, and cost of advisory, administrative, and shareholder services performed by the Investment Advisers and their affiliates under the Advisory Contracts and under separate agreements covering transfer agency, pricing and bookkeeping, and securities lending services for the fund; (ii) the nature and extent of the supervision of third party service providers, principally custodians and subcustodians; and (iii) the resources devoted to, and the record of compliance with, the fund's compliance policies and procedures. The Board also reviewed the allocation of fund brokerage, including allocations to brokers affiliated with the Investment Advisers, the use of brokerage commissions to pay fund expenses, and the use of "soft" commission dollars to pay for research services.
Annual Report
The Board noted that the growth of fund assets over time across the complex allows Fidelity to reinvest in the development of services designed to enhance the value or convenience of the Fidelity funds as investment vehicles. These services include 24-hour access to account information and market information through telephone representatives and over the Internet, investor education materials and asset allocation tools, and the expanded availability of Fidelity Investor Centers.
Investment in a Large Fund Family. The Board considered the benefits to shareholders of investing in a Fidelity fund, including the benefits of investing in a fund that is part of a large family of funds offering a variety of investment disciplines and providing a large variety of mutual fund investor services. The Board noted that Fidelity had taken, or had made recommendations that resulted in the Fidelity funds taking, a number of actions over the previous year that benefited particular funds, including (i) continuing to dedicate additional resources to investment research and support of the senior management team that oversees asset management; (ii) persisting in efforts to enhance Fidelity's research capabilities, in particular, international research; (iii) launching new funds and making other enhancements to meet client needs for global and income-oriented solutions; (iv) continuing to launch dedicated lower cost underlying funds to meet investment management's portfolio construction needs related to expanding underlying fund options, specifically for the Freedom Fund product lines; (v) adopting a "Stock Selector" sector neutral investment approach and employing a team of portfolio managers who are sector specialists to manage certain funds; (vi) rationalizing product lines and gaining increased efficiencies through the mergers of several funds into other funds; (vii) strengthening the Spartan Index Fund product line by adding new funds and/or new low-cost institutional share classes, restructuring fund expenses to accommodate new classes, and reducing investment minimums for certain classes of shares; (viii) modifying the eligibility criteria for Institutional Class shares to increase their appeal to government entities and charitable investors; and (ix) reducing certain transfer agent fee rates.
Investment Performance. The Board considered whether the fund has operated in accordance with its investment objective, as well as its record of compliance with its investment restrictions. It also reviewed the fund's absolute investment performance for each class, as well as the fund's relative investment performance for each class measured over multiple periods against (i) a broad-based securities market index, and (ii) a peer group of mutual funds deemed appropriate by Fidelity and reviewed by the Board. The following charts considered by the Board show, over the one-, three-, and five-year periods ended December 31, 2011, the cumulative total returns of Institutional Class (Class I) and Class B of the fund, the cumulative total returns of a broad-based securities market index ("benchmark"), and a range of cumulative total returns of a peer group of mutual funds identified by Morningstar, Inc. as having an investment style similar to that of the fund based on underlying portfolio holdings. The returns of Institutional Class (Class I) and Class B show the performance of the highest and lowest performing classes, respectively (based on five-year performance). The box within each chart shows the 25th percentile return (top of box) and the 75th percentile return (bottom of box) of the peer group. Returns shown above the box are in the first quartile and returns shown below the box are in the fourth quartile. The percentage beaten numbers noted below each chart correspond to the percentile box and represent the percentage of funds in the peer group whose performance was equal to or lower than that of the class indicated.
Annual Report
Board Approval of Investment Advisory Contracts and
Management Fees - continued
Fidelity Small Cap Value Fund

The Board reviewed the fund's relative investment performance against its peer group and noted that the performance of Institutional Class (Class I) of the fund was in the second quartile for the one- and three-year periods and the first quartile for the five-year period. The Board also noted that the investment performance of Institutional Class (Class I) of the fund compared favorably to its benchmark for all the periods shown. The Board considered that the variations in performance among the fund's classes reflect the variations in class expenses, which result in lower performance for higher expense classes. The Board also reviewed the fund's performance since inception as well as performance in the current year.
The Board also considered that the fund's management fee is subject to upward or downward adjustment depending upon whether, and to what extent, the fund's investment performance for the performance period exceeds, or is exceeded by, the record (over the same period) of a Board-approved performance adjustment index. The Board noted that the performance adjustment provides FMR with a strong economic incentive to seek to achieve superior performance for the fund's shareholders and helps to more closely align the interests of FMR and the fund's shareholders.
Annual Report
Based on its review, the Board concluded that the nature, extent, and quality of services provided to the fund under the Advisory Contracts should benefit the fund's shareholders.
Competitiveness of Management Fee and Total Expense Ratio. The Board considered the fund's management fee and total expense ratio compared to "mapped groups" of competitive funds and classes. Fidelity creates "mapped groups" by combining similar Lipper investment objective categories that have comparable management fee characteristics. Combining Lipper investment objective categories aids the Board's management fee and total expense ratio comparisons by broadening the competitive group used for comparison and by reducing the number of universes to which various Fidelity funds are compared.
Management Fee. The Board considered two proprietary management fee comparisons for the 12-month periods shown in the chart below. The group of Lipper funds used by the Board for management fee comparisons is referred to below as the "Total Mapped Group." The Total Mapped Group comparison focuses on a fund's standing relative to the total universe of comparable funds available to investors in terms of gross management fees before expense reimbursements or caps, and without giving effect to the fund's performance adjustment. "TMG %" represents the percentage of funds in the Total Mapped Group that had management fees that were lower than the fund's. For example, a TMG % of 13% means that 87% of the funds in the Total Mapped Group had higher management fees than the fund. The "Asset-Size Peer Group" (ASPG) comparison focuses on a fund's standing relative to non-Fidelity funds similar in size to the fund within the Total Mapped Group. The ASPG represents at least 15% of the funds in the Total Mapped Group with comparable asset size and management fee characteristics, subject to a minimum of 50 funds (or all funds in the Total Mapped Group if fewer than 50). Additional information, such as the ASPG quartile in which the fund's management fee ranked and the impact of the fund's performance adjustment, is also included in the chart and considered by the Board.
Annual Report
Board Approval of Investment Advisory Contracts and
Management Fees - continued
Fidelity Small Cap Value Fund

The Board noted that the fund's management fee ranked below the median of its Total Mapped Group and below the median of its ASPG for 2011. The Board also noted the effect of the fund's positive performance adjustment on the fund's management fee ranking. The Board noted that the performance adjustment for each year represents calculations for performance periods that differ from the periods shown in the performance charts above.
Based on its review, the Board concluded that the fund's management fee is fair and reasonable in light of the services that the fund receives and the other factors considered.
Total Expense Ratio. In its review of each class's total expense ratio, the Board considered the fund's management fee as well as other fund or class expenses, as applicable, such as transfer agent fees, pricing and bookkeeping fees, fund-paid 12b-1 fees, and custodial, legal, and audit fees. The Board also noted the effects of any waivers and reimbursements on fees and expenses, as well as the impact of the fund's performance adjustment. As part of its review, the Board also considered the current and historical total expense ratios of each class of the fund compared to competitive fund median expenses. Each class of the fund is compared to those funds and classes in the Total Mapped Group (used by the Board for management fee comparisons) that have a similar sales load structure.
The Board noted that the total expense ratio of each of the retail class and Class F ranked below its competitive median for 2011, the total expense ratio of Institutional Class ranked equal to its competitive median for 2011, and the total expense ratio of each of Class A, Class T, Class B, and Class C ranked above its competitive median for 2011. The Board considered that various factors, including 12b-1 fees, positive or negative performance adjustments, and relatively higher other expenses in the case of small fund size, can affect total expense ratios. The Board noted that the total expense ratio of Class T was above the competitive median primarily because of higher 12b-1 fees on Class T. Class T has a higher 12b-1 fee, but a lower front-end sales charge, than traditionally priced front-end sales charge classes. The Board considered that Class T is primarily sold load-waived in the retirement plan market where its 0.50% 12b-1 fee is comparable to competing no-load, higher 12b-1 fee classes designed specifically for retirement plans. The Board noted that the fund offers multiple classes, each of which has a different sales load and 12b-1 fee structure, and that the multiple structures are intended to offer a range of pricing options for the intermediary market. The Board also noted that the total expense ratios of the classes vary primarily by the level of their 12b-1 fees, although differences in transfer agent fees may also cause expenses to vary from class to class.
Annual Report
Fees Charged to Other Fidelity Clients. The Board also considered Fidelity fee structures and other information with respect to clients of FMR and its affiliates, such as other mutual funds advised or subadvised by FMR or its affiliates, pension plan clients, and other institutional clients. The Board noted the findings of the 2010 ad hoc joint committee (created with the board of other Fidelity funds), which reviewed and compared Fidelity's institutional investment advisory business with its business of providing services to the Fidelity funds, including the differences in services provided, fees charged, and costs incurred, as well as competition in their respective marketplaces.
Based on its review of total expense ratios and fees charged to other Fidelity clients, the Board concluded that the total expense ratio of each class of the fund was reasonable, although in some cases above the median of the universe presented for comparison, in light of the services that the fund and its shareholders receive and the other factors considered.
Costs of the Services and Profitability. The Board considered the revenues earned and the expenses incurred by Fidelity in conducting the business of developing, marketing, distributing, managing, administering and servicing the fund and its shareholders. The Board also considered the level of Fidelity's profits in respect of all the Fidelity funds.
On an annual basis, FMR presents to the Board Fidelity's profitability for the fund. Fidelity calculates the profitability for each fund, as well as aggregate profitability for groups of Fidelity funds and all Fidelity funds, using a series of detailed revenue and cost allocation methodologies which originate with the books and records of Fidelity on which Fidelity's audited financial statements are based. The Audit Committee of the Board reviews any significant changes from the prior year's methodologies.
Annual Report
Board Approval of Investment Advisory Contracts and
Management Fees - continued
PricewaterhouseCoopers LLP (PwC), independent registered public accounting firm and auditor to Fidelity and certain Fidelity funds, has been engaged annually by the Board as part of the Board's assessment of Fidelity's profitability analysis. PwC's engagement includes the review and assessment of Fidelity's methodologies used in determining the revenues and expenses attributable to Fidelity's mutual fund business, and completion of agreed-upon procedures surrounding the mathematical accuracy of fund profitability and its conformity to allocation methodologies. After considering PwC's reports issued under the engagement and information provided by Fidelity, the Board concluded that while other allocation methods may also be reasonable, Fidelity's profitability methodologies are reasonable in all material respects.
The Board also reviewed Fidelity's non-fund businesses and fall-out benefits related to the mutual fund business as well as cases where Fidelity's affiliates may benefit from or be related to the fund's business.
The Board considered the costs of the services provided by and the profits realized by Fidelity in connection with the operation of the fund and was satisfied that the profitability was not excessive in the circumstances.
Economies of Scale. The Board considered whether there have been economies of scale in respect of the management of the Fidelity funds, whether the Fidelity funds (including the fund) have appropriately benefited from any such economies of scale, and whether there is potential for realization of any further economies of scale. The Board considered the extent to which the fund will benefit from economies of scale through increased services to the fund, through waivers or reimbursements, or through fee or expense reductions. The Board also noted that in 2009, it and the board of other Fidelity funds created an ad hoc committee (the Economies of Scale Committee) to analyze whether FMR attains economies of scale in respect of the management and servicing of the Fidelity funds, whether the Fidelity funds have appropriately benefited from such economies of scale, and whether there is potential for realization of any further economies of scale.
The Board recognized that the fund's management contract incorporates a "group fee" structure, which provides for lower group fee rates as total fund assets under FMR's management increase, and for higher group fee rates as total fund assets under FMR's management decrease. FMR calculates the group fee rates based on a tiered asset "breakpoint" schedule that varies based on asset class. The Board considered that the group fee is designed to deliver the benefits of economies of scale to fund shareholders when total Fidelity fund assets increase, even if assets of any particular fund are unchanged or have declined, because some portion of Fidelity's costs are attributable to services provided to all Fidelity funds, and all funds benefit if those costs can be allocated among more assets. The Board concluded that, given the group fee structure, fund shareholders will benefit from lower management fees as assets under FMR's management increase at the fund complex level, regardless of whether Fidelity achieves any such economies of scale.
Annual Report
The Board concluded, taking into account the analysis of the Economies of Scale Committee, that economies of scale, if any, are being appropriately shared between fund shareholders and Fidelity.
Additional Information Requested by the Board. In order to develop fully the factual basis for consideration of the Fidelity funds' Advisory Contracts, the Board requested and received additional information on certain topics, including (i) fund performance trends, actions to be taken by FMR to improve certain funds' overall performance, and Fidelity's long-term strategies for certain funds; (ii) the potential to further rationalize the Fidelity fund lineup with the possibility of achieving savings for the funds and Fidelity; (iii) Fidelity's compensation structure for portfolio managers and other key investment personnel; (iv) the amount of the investment that each portfolio manager has made in the Fidelity fund(s) that he or she manages; (v) the realization of fall-out benefits in certain Fidelity business units; (vi) Fidelity's group fee structures, the potential impact of regulatory changes on such structures, and the rationale for the individual fee rates of certain funds; (vii) fund profitability methodology, including Fidelity's cost allocation methodology, and the impact of certain factors on fund profitability results; (viii) trends regarding industry use of performance fee structures and the possibility of implementing performance fee structures for additional funds; and (ix) the impact of net redemptions from the Fidelity funds.
Based on its evaluation of all of the conclusions noted above, and after considering all factors it believed relevant, the Board ultimately concluded that the advisory fee structures are fair and reasonable, and that the fund's Advisory Contracts should be renewed.
Annual Report
Investment Adviser
Fidelity Management & Research Company
Boston, MA
Investment Sub-Advisers
FMR Co., Inc.
Fidelity Management & Research
(U.K.) Inc.
Fidelity Management & Research
(Hong Kong) Limited
Fidelity Management & Research
(Japan) Inc.
General Distributor
Fidelity Distributors Corporation
Smithfield, RI
Transfer and Service Agents
Fidelity Investments Institutional
Operations Company, Inc.
Boston, MA
Fidelity Service Company, Inc.
Boston, MA
Custodian
Citibank, N.A.
New York, NY
(Fidelity Investment logo)(registered trademark)
Corporate Headquarters
82 Devonshire St., Boston, MA 02109
www.fidelity.com
SCV-F-ANN-0912
1.891896.103
(Fidelity Investment logo)(registered trademark)
Fidelity Advisor®
Small Cap Value
Fund - Class A, Class T,
Class B and Class C
Annual Report
July 31, 2012
(Fidelity Cover Art)
Class A, Class T, Class B
and Class C are classes of
Fidelity® Small Cap Value Fund
Contents
Performance | (Click Here) | How the fund has done over time. |
Management's Discussion of Fund Performance | (Click Here) | The Portfolio Manager's review of fund performance and strategy. |
Shareholder Expense Example | (Click Here) | An example of shareholder expenses. |
Investment Changes | (Click Here) | A summary of major shifts in the fund's investments over the past six months. |
Investments | (Click Here) | A complete list of the fund's investments with their market values. |
Financial Statements | (Click Here) | Statements of assets and liabilities, operations, and changes in net assets, as well as financial highlights. |
Notes | (Click Here) | Notes to the financial statements. |
Report of Independent Registered Public Accounting Firm | (Click Here) | |
Trustees and Officers | (Click Here) | |
Distributions | (Click Here) | |
Board Approval of Investment Advisory Contracts and Management Fees | (Click Here) | |
To view a fund's proxy voting guidelines and proxy voting record for the 12-month period ended June 30, visit http://www.fidelity.com/proxyvotingresults or visit the Securities and Exchange Commission's (SEC) web site at http://www.sec.gov. You may also call 1-877-208-0098 to request a free copy of the proxy voting guidelines.
Standard & Poor's, S&P and S&P 500 are registered service marks of The McGraw-Hill Companies, Inc. and have been licensed for use by Fidelity Distributors Corporation.
Other third party marks appearing herein are the property of their respective owners.
All other marks appearing herein are registered or unregistered trademarks or service marks of FMR LLC or an affiliated company. © 2012 FMR LLC. All rights reserved.
Annual Report
This report and the financial statements contained herein are submitted for the general information of the shareholders of the fund. This report is not authorized for distribution to prospective investors in the fund unless preceded or accompanied by an effective prospectus.
A fund files its complete schedule of portfolio holdings with the SEC for the first and third quarters of each fiscal year on Form N-Q. Forms N-Q are available on the SEC's web site at http://www.sec.gov. A fund's Forms N-Q may be reviewed and copied at the SEC's Public Reference Room in Washington, DC. Information regarding the operation of the SEC's Public Reference Room may be obtained by calling 1-800-SEC-0330. For a complete list of a fund's portfolio holdings, view the most recent holdings listing, semiannual report, or annual report on Fidelity's web site at http://www.fidelity.com, http://www.advisor.fidelity.com, or http://www.401k.com, as applicable.
NOT FDIC INSURED • MAY LOSE VALUE • NO BANK GUARANTEE
Neither the fund nor Fidelity Distributors Corporation is a bank.
Annual Report
Average annual total return reflects the change in the value of an investment, assuming reinvestment of the class' distributions from dividend income and capital gains (the profits earned upon the sale of securities that have grown in value, if any) and assuming a constant rate of performance each year. The $10,000 table and the fund's returns do not reflect the deduction of taxes that a shareholder would pay on fund distributions or the redemption of fund shares. During periods of reimbursement by Fidelity, a fund's total return will be greater than it would be had the reimbursement not occurred. How a fund did yesterday is no guarantee of how it will do tomorrow. Returns reflect the conversion of Class B shares to Class A shares after a maximum of seven years.
Average Annual Total Returns
Periods ended July 31, 2012 | Past 1
year | Past 5
years | Life of
fundA |
Class A (incl. 5.75% sales charge) | -2.70% | 2.42% | 7.48% |
Class T (incl. 3.50% sales charge) | -0.53% | 2.66% | 7.55% |
Class B (incl. contingent deferred sales charge) B | -2.24% | 2.50% | 7.57% |
Class C (incl. contingent deferred sales charge) C | 1.56% | 2.87% | 7.51% |
A From November 3, 2004.
B Class B shares' contingent deferred sales charges included in the past one year, past five years, and life of fund total return figures are 5%, 2%, and 0%, respectively.
C Class C shares' contingent deferred sales charges included in the past one year, past five years, and life of fund total return figures are 1%, 0%, and 0%, respectively.
Annual Report
$10,000 Over Life of Fund
Let's say hypothetically that $10,000 was invested in Fidelity Advisor® Small Cap Value Fund - Class A on November 3, 2004, when the fund started, and the current 5.75% sales charge was paid. The chart shows how the value of your investment would have changed, and also shows how the Russell 2000® Value Index performed over the same period.
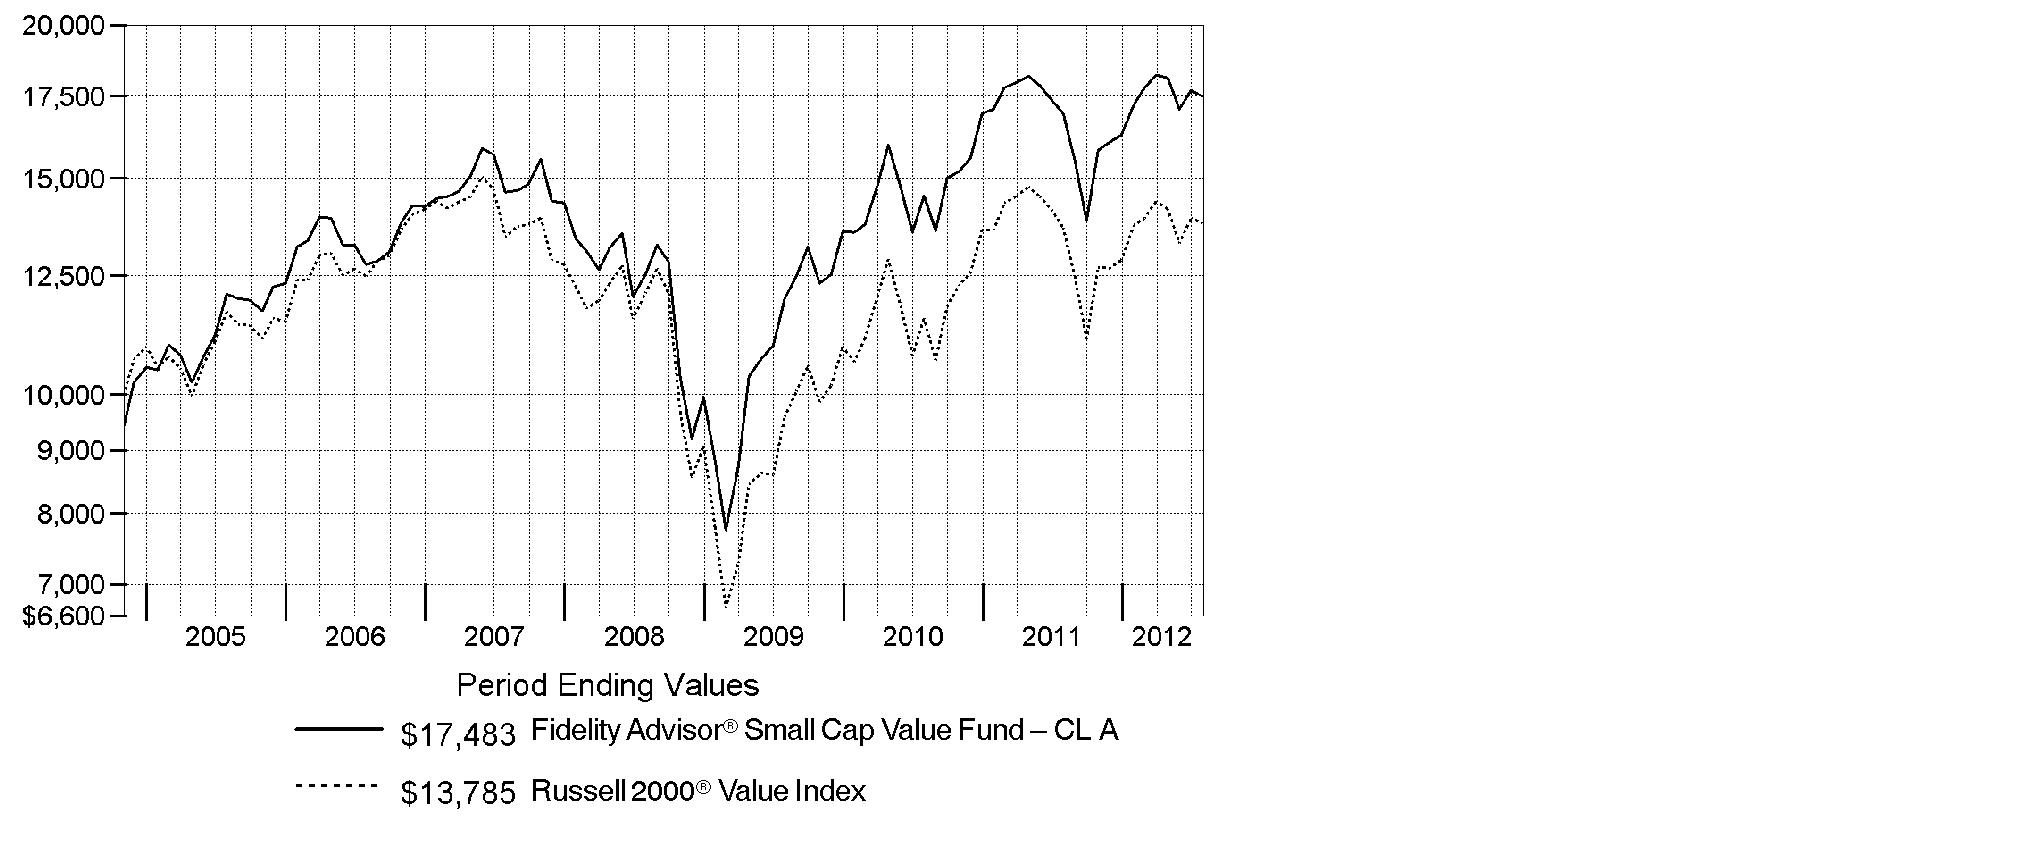
Annual Report
Market Recap: Major U.S. equity benchmarks posted solid gains for the year ending July 31, 2012, amid an uncertain investment environment. The broad-based S&P 500® Index returned 9.13%, while the blue-chip-laden Dow Jones Industrial AverageSM and technology-heavy Nasdaq Composite® Index gained 10.12% and 7.83%, respectively. Volatility spiked during the period's first half, as equities plummeted late last summer on Europe's debt woes, political wrangling over the U.S. debt ceiling, and the sovereign credit-rating downgrade that followed. By October, a seemingly improved U.S. economy rejuvenated stocks, paving the way for major equity benchmarks to post their best first-quarter performance since 1998. However, more eurozone trouble, signs that the U.S. economy had turned sluggish and a slowdown in China caused stocks to slip in May, before a new wave of optimism took hold in June and July. Within the S&P 500®, more-defensive sectors such as telecommunication services (+30%) and consumer staples (+20%) fared best, while materials and energy significantly underperformed, returning -5%. Small- and mid-cap stocks trailed their less-volatile large-cap counterparts, with the Russell 2000® Index adding 0.19% and the Russell Midcap® Index rising 2.28%. Given turmoil and local currency weakness in Europe, foreign developed-markets stocks lost ground, with the MSCI® EAFE® Index returning -11.32%.
Comments from Charles Myers, Portfolio Manager of Fidelity Advisor® Small Cap Value Fund: For the year, the fund's Class A, Class T, Class B and Class C shares gained 3.24%, 3.08%, 2.51% and 2.52%, respectively (excluding sales charges), compared with 0.89% for the Russell 2000® Value Index. On the positive side, stock picking stood out in the consumer discretionary sector, with homebuilders Ryland Group, M.D.C. Holdings and Meritage Homes all adding to results. In industrials, my choices in commercial/professional services and capital goods helped, led by H&E Equipment Services, which rents commercial construction equipment, and commercial furniture manufacturer HNI, the fund's top relative contributor of the year. In health care, managed-care company Centene added value, as did Team Health Holdings, a provider of outsourced clinical services to hospitals. Conversely, by far the most detrimental sector in the portfolio was financials, led on the downside by regional bank TCF Financial. In the energy sector, Superior Energy Services, a provider of oil-field services, and independent oil producer Berry Petroleum were hampered by declining energy prices. Other relative detractors included banana producer Chiquita Brands International and United Stationers, a wholesaler of office stationery and business supplies. Several stocks mentioned were not in the index, and Centene was not held at period end.
The views expressed above reflect those of the portfolio manager(s) only through the end of the period as stated on the cover of this report and do not necessarily represent the views of Fidelity or any other person in the Fidelity organization. Any such views are subject to change at any time based upon market or other conditions and Fidelity disclaims any responsibility to update such views. These views may not be relied on as investment advice and, because investment decisions for a Fidelity fund are based on numerous factors, may not be relied on as an indication of trading intent on behalf of any Fidelity fund.
Annual Report
Shareholder Expense Example
As a shareholder of the Fund, you incur two types of costs: (1) transaction costs, including sales charges (loads) on purchase payments or redemption proceeds, redemption fees and (2) ongoing costs, including management fees, distribution and/or service (12b-1) fees and other Fund expenses. This Example is intended to help you understand your ongoing costs (in dollars) of investing in the Fund and to compare these costs with the ongoing costs of investing in other mutual funds.
The Example is based on an investment of $1,000 invested at the beginning of the period and held for the entire period (February 1, 2012 to July 31, 2012).
Actual Expenses
The first line of the accompanying table for each class of the Fund provides information about actual account values and actual expenses. You may use the information in this line, together with the amount you invested, to estimate the expenses that you paid over the period. Simply divide your account value by $1,000.00 (for example, an $8,600 account value divided by $1,000.00 = 8.6), then multiply the result by the number in the first line for a class of the Fund under the heading entitled "Expenses Paid During Period" to estimate the expenses you paid on your account during this period. A small balance maintenance fee of $12.00 that is charged once a year may apply for certain accounts with a value of less than $2,000. This fee is not included in the table below. If it was, the estimate of expenses you paid during the period would be higher, and your ending account value lower, by this amount. In addition, the Fund, as a shareholder in the underlying Fidelity Central Funds, will indirectly bear its pro-rata share of the fees and expenses incurred by the underlying Fidelity Central Funds. These fees and expenses are not included in the Fund's annualized expense ratio used to calculate the expense estimate in the table below.
Hypothetical Example for Comparison Purposes
The second line of the accompanying table for each class of the Fund provides information about hypothetical account values and hypothetical expenses based on a Class' actual expense ratio and an assumed rate of return of 5% per year before expenses, which is not the Class' actual return. The hypothetical account values and expenses may not be used to estimate the actual ending account balance or expenses you paid for the period. You may use this information to compare the ongoing costs of investing in the Fund and other funds. To do so, compare this 5% hypothetical example with the 5% hypothetical examples that appear in the shareholder reports of the other funds. A small balance maintenance fee of $12.00 that is charged once a year may apply for certain accounts with a value of less than $2,000. This fee is not included in the table below. If it was, the estimate of expenses you paid during the period would be higher, and your ending account value lower, by this amount. In addition, the Fund, as a shareholder in the underlying Fidelity Central Funds, will indirectly bear its pro-rata share of the fees and expenses incurred by the underlying Fidelity Central Funds. These fees and expenses are not included in the Fund's annualized expense ratio used to calculate the expense estimate in the table below.
Please note that the expenses shown in the table are meant to highlight your ongoing costs only and do not reflect any transaction costs. Therefore, the second line of the table is useful in comparing ongoing costs only, and will not help you determine the relative total costs of owning different funds. In addition, if these transactional costs were included, your costs would have been higher.
Annual Report
| Annualized
Expense Ratio | Beginning
Account Value
February 1, 2012 | Ending
Account Value
July 31, 2012 | Expenses Paid
During Period*
February 1, 2012
to July 31, 2012 |
Class A | 1.41% | | | |
Actual | | $ 1,000.00 | $ 1,015.70 | $ 7.07 |
HypotheticalA | | $ 1,000.00 | $ 1,017.85 | $ 7.07 |
Class T | 1.63% | | | |
Actual | | $ 1,000.00 | $ 1,015.20 | $ 8.17 |
HypotheticalA | | $ 1,000.00 | $ 1,016.76 | $ 8.17 |
Class B | 2.16% | | | |
Actual | | $ 1,000.00 | $ 1,012.10 | $ 10.81 |
HypotheticalA | | $ 1,000.00 | $ 1,014.12 | $ 10.82 |
Class C | 2.16% | | | |
Actual | | $ 1,000.00 | $ 1,012.80 | $ 10.81 |
HypotheticalA | | $ 1,000.00 | $ 1,014.12 | $ 10.82 |
Small Cap Value | 1.09% | | | |
Actual | | $ 1,000.00 | $ 1,018.30 | $ 5.47 |
HypotheticalA | | $ 1,000.00 | $ 1,019.44 | $ 5.47 |
Class F | .87% | | | |
Actual | | $ 1,000.00 | $ 1,018.90 | $ 4.37 |
HypotheticalA | | $ 1,000.00 | $ 1,020.54 | $ 4.37 |
Institutional Class | 1.11% | | | |
Actual | | $ 1,000.00 | $ 1,017.60 | $ 5.57 |
HypotheticalA | | $ 1,000.00 | $ 1,019.34 | $ 5.57 |
A 5% return per year before expenses
* Expenses are equal to each Class' annualized expense ratio, multiplied by the average account value over the period, multiplied by 182/366 (to reflect the one-half year period).
Annual Report
Investment Changes (Unaudited)
Top Ten Stocks as of July 31, 2012 |
| % of fund's
net assets | % of fund's net assets
6 months ago |
Superior Energy Services, Inc. | 3.0 | 1.7 |
DCT Industrial Trust, Inc. | 2.8 | 2.7 |
TCF Financial Corp. | 2.7 | 2.4 |
HNI Corp. | 2.7 | 3.0 |
Berry Petroleum Co. Class A | 2.6 | 1.9 |
Hanesbrands, Inc. | 2.6 | 0.0 |
Team Health Holdings, Inc. | 2.5 | 1.9 |
Platinum Underwriters Holdings Ltd. | 2.4 | 2.3 |
WESCO International, Inc. | 2.4 | 3.3 |
GrafTech International Ltd. | 2.3 | 0.0 |
| 26.0 | |
Top Five Market Sectors as of July 31, 2012 |
| % of fund's
net assets | % of fund's net assets
6 months ago |
Financials | 35.8 | 35.6 |
Industrials | 14.1 | 15.2 |
Consumer Discretionary | 14.0 | 13.5 |
Information Technology | 11.0 | 11.5 |
Health Care | 6.6 | 7.9 |
Asset Allocation (% of fund's net assets) |
As of July 31, 2012* | As of January 31, 2012** |
 | Stocks 100.0% | | | Stocks 99.9% | |
 | Short-Term
Investments and
Net Other Assets
(Liabilities) † 0.0% | |  | Short-Term
Investments and
Net Other Assets
(Liabilities) 0.1% | |
* Foreign investments | 9.8% | | ** Foreign investments | 9.1% | |
† Amount represents less than 0.1%

Annual Report
Investments July 31, 2012
Showing Percentage of Net Assets
Common Stocks - 98.7% |
| Shares | | Value |
CONSUMER DISCRETIONARY - 13.5% |
Diversified Consumer Services - 2.0% |
Regis Corp. (e) | 3,100,000 | | $ 52,452,000 |
Household Durables - 6.1% |
KB Home (d) | 3,303,800 | | 30,527,112 |
M.D.C. Holdings, Inc. | 800,000 | | 25,488,000 |
Meritage Homes Corp. (a) | 700,000 | | 24,570,000 |
Ryland Group, Inc. | 1,375,000 | | 32,835,000 |
Tempur-Pedic International, Inc. (a)(d) | 1,800,000 | | 51,282,000 |
| | 164,702,112 |
Media - 1.3% |
Valassis Communications, Inc. (a)(d) | 1,584,641 | | 35,733,655 |
Specialty Retail - 1.5% |
Asbury Automotive Group, Inc. (a) | 800,000 | | 20,928,000 |
Tsutsumi Jewelry Co. Ltd. | 791,400 | | 18,561,365 |
| | 39,489,365 |
Textiles, Apparel & Luxury Goods - 2.6% |
Hanesbrands, Inc. (a) | 2,300,000 | | 69,046,000 |
TOTAL CONSUMER DISCRETIONARY | | 361,423,132 |
CONSUMER STAPLES - 3.7% |
Food Products - 2.2% |
Chiquita Brands International, Inc. (a)(d)(e) | 3,375,000 | | 17,482,500 |
Dean Foods Co. (a) | 3,450,000 | | 42,676,500 |
| | 60,159,000 |
Household Products - 1.5% |
Spectrum Brands Holdings, Inc. | 1,100,000 | | 40,513,000 |
TOTAL CONSUMER STAPLES | | 100,672,000 |
ENERGY - 5.6% |
Energy Equipment & Services - 3.0% |
Superior Energy Services, Inc. (a) | 3,800,000 | | 82,345,999 |
Oil, Gas & Consumable Fuels - 2.6% |
Berry Petroleum Co. Class A | 1,825,000 | | 69,386,500 |
TOTAL ENERGY | | 151,732,499 |
FINANCIALS - 35.0% |
Capital Markets - 4.3% |
Knight Capital Group, Inc. Class A (a) | 4,350,000 | | 44,935,500 |
Common Stocks - continued |
| Shares | | Value |
FINANCIALS - continued |
Capital Markets - continued |
Monex Group, Inc. | 149,703 | | $ 24,294,118 |
Waddell & Reed Financial, Inc. Class A | 1,610,000 | | 46,834,900 |
| | 116,064,518 |
Commercial Banks - 11.0% |
Associated Banc-Corp. | 4,432,650 | | 55,363,799 |
CapitalSource, Inc. | 7,000,000 | | 45,850,000 |
City National Corp. | 784,900 | | 38,679,872 |
National Penn Bancshares, Inc. | 4,266,604 | | 37,716,779 |
PacWest Bancorp (e) | 1,857,600 | | 42,557,616 |
TCF Financial Corp. | 7,000,000 | | 72,310,000 |
Western Liberty Bancorp (a)(e) | 992,899 | | 2,879,407 |
| | 295,357,473 |
Insurance - 7.7% |
Alterra Capital Holdings Ltd. | 2,337,411 | | 54,391,554 |
Aspen Insurance Holdings Ltd. | 1,920,200 | | 55,186,548 |
Platinum Underwriters Holdings Ltd. (e) | 1,694,139 | | 64,411,165 |
ProAssurance Corp. | 350,000 | | 31,349,500 |
| | 205,338,767 |
Real Estate Investment Trusts - 7.4% |
DCT Industrial Trust, Inc. | 11,980,586 | | 74,998,468 |
Franklin Street Properties Corp. | 3,160,000 | | 32,769,200 |
Highwoods Properties, Inc. (SBI) | 1,720,330 | | 58,267,577 |
National Retail Properties, Inc. (d) | 1,140,000 | | 33,630,000 |
| | 199,665,245 |
Real Estate Management & Development - 0.9% |
Forestar Group, Inc. (a)(e) | 1,996,875 | | 22,724,438 |
Thrifts & Mortgage Finance - 3.7% |
Astoria Financial Corp. (d)(e) | 5,418,152 | | 51,038,992 |
Washington Federal, Inc. | 3,086,175 | | 49,162,768 |
| | 100,201,760 |
TOTAL FINANCIALS | | 939,352,201 |
HEALTH CARE - 6.6% |
Health Care Equipment & Supplies - 1.1% |
Integra LifeSciences Holdings Corp. (a) | 750,000 | | 28,845,000 |
Health Care Providers & Services - 5.5% |
Chemed Corp. | 465,200 | | 29,200,604 |
Common Stocks - continued |
| Shares | | Value |
HEALTH CARE - continued |
Health Care Providers & Services - continued |
MEDNAX, Inc. (a) | 779,700 | | $ 51,561,561 |
Team Health Holdings, Inc. (a) | 2,527,580 | | 67,486,386 |
| | 148,248,551 |
TOTAL HEALTH CARE | | 177,093,551 |
INDUSTRIALS - 14.1% |
Commercial Services & Supplies - 7.2% |
ACCO Brands Corp. | 2,200,000 | | 18,634,000 |
HNI Corp. (e) | 2,700,000 | | 71,739,000 |
Knoll, Inc. | 1,750,000 | | 23,957,500 |
Quad/Graphics, Inc. (d)(e) | 1,878,394 | | 28,908,484 |
United Stationers, Inc. | 1,980,800 | | 49,935,968 |
| | 193,174,952 |
Electrical Equipment - 2.3% |
GrafTech International Ltd. (a) | 5,965,000 | | 62,334,250 |
Machinery - 2.0% |
Blount International, Inc. (a)(e) | 2,604,723 | | 37,039,161 |
Columbus McKinnon Corp. (NY Shares) (a)(e) | 1,047,872 | | 15,414,197 |
| | 52,453,358 |
Trading Companies & Distributors - 2.6% |
H&E Equipment Services, Inc. (a) | 376,625 | | 5,317,945 |
WESCO International, Inc. (a) | 1,153,633 | | 64,268,894 |
| | 69,586,839 |
TOTAL INDUSTRIALS | | 377,549,399 |
INFORMATION TECHNOLOGY - 11.0% |
Communications Equipment - 2.6% |
Polycom, Inc. (a) | 3,275,000 | | 28,623,500 |
ViaSat, Inc. (a) | 1,100,000 | | 42,130,000 |
| | 70,753,500 |
Electronic Equipment & Components - 5.1% |
Ingram Micro, Inc. Class A (a) | 1,653,100 | | 24,779,969 |
Macnica, Inc. | 677,400 | | 14,288,287 |
Ryoyo Electro Corp. (e) | 1,972,700 | | 20,552,790 |
SYNNEX Corp. (a) | 790,000 | | 26,725,700 |
Tech Data Corp. (a) | 1,000,000 | | 50,100,000 |
| | 136,446,746 |
Common Stocks - continued |
| Shares | | Value |
INFORMATION TECHNOLOGY - continued |
Internet Software & Services - 1.4% |
j2 Global, Inc. (d) | 1,270,000 | | $ 38,011,100 |
Semiconductors & Semiconductor Equipment - 0.4% |
Miraial Co. Ltd. (e) | 720,200 | | 10,410,478 |
Software - 1.5% |
Monotype Imaging Holdings, Inc. (e) | 2,652,331 | | 38,936,219 |
TOTAL INFORMATION TECHNOLOGY | | 294,558,043 |
MATERIALS - 4.7% |
Chemicals - 1.5% |
PolyOne Corp. | 2,800,000 | | 41,244,000 |
Metals & Mining - 3.2% |
Carpenter Technology Corp. | 409,380 | | 19,592,927 |
Haynes International, Inc. | 496,108 | | 23,907,445 |
RTI International Metals, Inc. (a)(e) | 1,880,000 | | 42,206,000 |
| | 85,706,372 |
TOTAL MATERIALS | | 126,950,372 |
UTILITIES - 4.5% |
Electric Utilities - 1.6% |
Westar Energy, Inc. | 1,360,000 | | 41,561,600 |
Gas Utilities - 2.9% |
Southwest Gas Corp. | 836,756 | | 37,369,523 |
UGI Corp. | 1,333,454 | | 40,870,365 |
| | 78,239,888 |
TOTAL UTILITIES | | 119,801,488 |
TOTAL COMMON STOCKS (Cost $2,307,088,586) |
2,649,132,685
|
Nonconvertible Preferred Stocks - 1.3% |
| | | |
CONSUMER DISCRETIONARY - 0.5% |
Household Durables - 0.5% |
M/I Homes, Inc. Series A, 9.75% (a) | 750,400 | | 12,944,400 |
Nonconvertible Preferred Stocks - continued |
| Shares | | Value |
FINANCIALS - 0.8% |
Real Estate Investment Trusts - 0.8% |
DDR Corp. Series H, 7.375% | 818,790 | | $ 20,658,072 |
TOTAL NONCONVERTIBLE PREFERRED STOCKS (Cost $20,354,770) |
33,602,472
|
Money Market Funds - 2.0% |
| | | |
Fidelity Cash Central Fund, 0.17% (b) | 5,899,046 | | 5,899,046 |
Fidelity Securities Lending Cash Central Fund, 0.18% (b)(c) | 48,626,645 | | 48,626,645 |
TOTAL MONEY MARKET FUNDS (Cost $54,525,691) |
54,525,691
|
TOTAL INVESTMENT PORTFOLIO - 102.0% (Cost $2,381,969,047) | | 2,737,260,848 |
NET OTHER ASSETS (LIABILITIES) - (2.0)% | | (53,568,098) |
NET ASSETS - 100% | $ 2,683,692,750 |
Legend |
(a) Non-income producing |
(b) Affiliated fund that is available only to investment companies and other accounts managed by Fidelity Investments. The rate quoted is the annualized seven-day yield of the fund at period end. A complete unaudited listing of the fund's holdings as of its most recent quarter end is available upon request. In addition, each Fidelity Central Fund's financial statements, which are not covered by the Fund's Report of Independent Registered Public Accounting Firm, are available on the SEC's website or upon request. |
(c) Investment made with cash collateral received from securities on loan. |
(d) Security or a portion of the security is on loan at period end. |
(e) Affiliated company |
Affiliated Central Funds |
Information regarding fiscal year to date income earned by the Fund from investments in Fidelity Central Funds is as follows: |
Fund | Income earned |
Fidelity Cash Central Fund | $ 14,453 |
Fidelity Securities Lending Cash Central Fund | 204,102 |
Total | $ 218,555 |
Other Affiliated Issuers |
An affiliated company is a company in which the Fund has ownership of at least 5% of the voting securities. Fiscal year to date transactions with companies which are or were affiliates are as follows: |
Affiliate | Value,
beginning of
period | Purchases | Sales
Proceeds | Dividend
Income | Value,
end of
period |
Astoria Financial Corp. | $ 56,131,471 | $ 5,135,258 | $ - | $ 2,277,805 | $ 51,038,992 |
Blount International, Inc. | 43,316,543 | - | - | - | 37,039,161 |
Chiquita Brands International, Inc. | 24,519,456 | 10,332,799 | - | - | 17,482,500 |
Columbus McKinnon Corp. (NY Shares) | 15,792,000 | 1,137,487 | - | - | 15,414,197 |
DCT Industrial Trust, Inc. | 74,961,776 | - | 8,396,655 | 3,414,064 | - |
Forestar Group, Inc. | - | 24,473,760 | - | - | 22,724,438 |
H&E Equipment Services, Inc. | 29,272,896 | 2,743,497 | 45,135,849 | - | - |
Haynes International, Inc. | 42,301,857 | - | 8,879,973 | 446,653 | - |
HNI Corp. | 49,131,621 | 19,653,848 | 17,053,493 | 2,539,706 | 71,739,000 |
Ingles Markets, Inc. Class A | 10,225,970 | - | 9,904,080 | 78,182 | - |
M.D.C. Holdings, Inc. | 54,813,423 | - | 45,064,374 | 2,311,800 | - |
Affiliate | Value,
beginning of
period | Purchases | Sales
Proceeds | Dividend
Income | Value,
end of
period |
Miraial Co. Ltd. | $ 15,046,860 | $ - | $ - | $ 516,374 | $ 10,410,478 |
Monotype Imaging Holdings, Inc. | 35,396,690 | 972,962 | - | - | 38,936,219 |
PacWest Bancorp | 36,873,360 | - | - | 1,021,680 | 42,557,616 |
Platinum Underwriters Holdings Ltd. | 54,169,091 | 3,610,350 | - | 542,124 | 64,411,165 |
Providence Service Corp. | 12,045,466 | - | 15,255,161 | - | - |
Quad/Graphics, Inc. | - | 25,545,548 | - | 469,599 | 28,908,484 |
Regis Corp. | 60,080,486 | - | 16,882,099 | 952,998 | 52,452,000 |
RTI International Metals, Inc. | 27,932,874 | 27,109,765 | 3,701,784 | - | 42,206,000 |
Ryoyo Electro Corp. | 19,684,709 | - | - | 707,200 | 20,552,790 |
Western Liberty Bancorp | 7,248,000 | - | 3,597,604 | - | 2,879,407 |
Total | $ 668,944,549 | $ 120,715,274 | $ 173,871,072 | $ 15,278,185 | $ 518,752,447 |
Other Information |
The following is a summary of the inputs used, as of July 31, 2012, involving the Fund's assets and liabilities carried at fair value. The inputs or methodology used for valuing securities may not be an indication of the risk associated with investing in those securities. For more information on valuation inputs, and their aggregation into the levels used in the tables below, please refer to the Security Valuation section in the accompanying Notes to Financial Statements. |
Valuation Inputs at Reporting Date: |
Description | Total | Level 1 | Level 2 | Level 3 |
Investments in Securities: | | | | |
Equities: | | | | |
Consumer Discretionary | $ 374,367,532 | $ 355,806,167 | $ 18,561,365 | $ - |
Consumer Staples | 100,672,000 | 100,672,000 | - | - |
Energy | 151,732,499 | 151,732,499 | - | - |
Financials | 960,010,273 | 935,716,155 | 24,294,118 | - |
Health Care | 177,093,551 | 177,093,551 | - | - |
Industrials | 377,549,399 | 377,549,399 | - | - |
Information Technology | 294,558,043 | 249,306,488 | 45,251,555 | - |
Materials | 126,950,372 | 126,950,372 | - | - |
Utilities | 119,801,488 | 119,801,488 | - | - |
Money Market Funds | 54,525,691 | 54,525,691 | - | - |
Total Investments in Securities: | $ 2,737,260,848 | $ 2,649,153,810 | $ 88,107,038 | $ - |
The following is a summary of transfers between Level 1 and Level 2 for the period ended July 31, 2012. Transfers are assumed to have occurred at the beginning of the period, and are primarily attributable to the valuation techniques used for foreign equity securities, as discussed in the accompanying Notes to Financial Statements: |
Transfers | Total |
Level 1 to Level 2 | $ 70,981,657 |
Level 2 to Level 1 | $ 0 |
See accompanying notes which are an integral part of the financial statements.
Annual Report
Statement of Assets and Liabilities
| July 31, 2012 |
| | |
Assets | | |
Investment in securities, at value (including securities loaned of $46,940,525) - See accompanying schedule: Unaffiliated issuers (cost $1,850,015,930) | $ 2,163,982,710 | |
Fidelity Central Funds (cost $54,525,691) | 54,525,691 | |
Other affiliated issuers (cost $477,427,426) | 518,752,447 | |
Total Investments (cost $2,381,969,047) | | $ 2,737,260,848 |
Receivable for investments sold | | 7,962 |
Receivable for fund shares sold | | 3,346,245 |
Dividends receivable | | 2,366,103 |
Distributions receivable from Fidelity Central Funds | | 31,400 |
Other receivables | | 10,660 |
Total assets | | 2,743,023,218 |
| | |
Liabilities | | |
Payable for investments purchased | $ 6,165,626 | |
Payable for fund shares redeemed | 2,135,374 | |
Accrued management fee | 1,742,888 | |
Distribution and service plan fees payable | 100,792 | |
Other affiliated payables | 499,987 | |
Other payables and accrued expenses | 59,156 | |
Collateral on securities loaned, at value | 48,626,645 | |
Total liabilities | | 59,330,468 |
| | |
Net Assets | | $ 2,683,692,750 |
Net Assets consist of: | | |
Paid in capital | | $ 2,251,063,836 |
Undistributed net investment income | | 4,596,351 |
Accumulated undistributed net realized gain (loss) on investments and foreign currency transactions | | 72,740,139 |
Net unrealized appreciation (depreciation) on investments and assets and liabilities in foreign currencies | | 355,292,424 |
Net Assets | | $ 2,683,692,750 |
See accompanying notes which are an integral part of the financial statements.
Annual Report
Statement of Assets and Liabilities - continued
| July 31, 2012 |
| | |
Calculation of Maximum Offering Price Class A:
Net Asset Value and redemption price per share ($150,285,327 ÷ 10,110,871 shares) | | $ 14.86 |
| | |
Maximum offering price per share (100/94.25 of $14.86) | | $ 15.77 |
Class T:
Net Asset Value and redemption price per share ($57,514,280 ÷ 3,913,423 shares) | | $ 14.70 |
| | |
Maximum offering price per share (100/96.50 of $14.70) | | $ 15.23 |
Class B:
Net Asset Value and offering price per share ($6,674,942 ÷ 467,617 shares)A | | $ 14.27 |
| | |
Class C:
Net Asset Value and offering price per share ($47,265,102 ÷ 3,310,493 shares)A | | $ 14.28 |
| | |
| | |
Small Cap Value:
Net Asset Value, offering price and redemption price per share ($1,756,962,176 ÷ 116,773,340 shares) | | $ 15.05 |
| | |
Class F:
Net Asset Value, offering price and redemption price per share ($526,009,440 ÷ 34,859,047 shares) | | $ 15.09 |
| | |
Institutional Class:
Net Asset Value, offering price and redemption price per share ($138,981,483 ÷ 9,231,738 shares) | | $ 15.05 |
A Redemption price per share is equal to net asset value less any applicable contingent deferred sales charge.
See accompanying notes which are an integral part of the financial statements.
Annual Report
Financial Statements - continued
Statement of Operations
| Year ended July 31, 2012 |
| | |
Investment Income | | |
Dividends (including $15,278,185 earned from other affiliated issuers) | | $ 37,030,660 |
Interest | | 68 |
Income from Fidelity Central Funds | | 218,555 |
Total income | | 37,249,283 |
| | |
Expenses | | |
Management fee
Basic fee | $ 17,249,880 | |
Performance adjustment | 3,419,705 | |
Transfer agent fees | 4,956,576 | |
Distribution and service plan fees | 1,124,466 | |
Accounting and security lending fees | 740,848 | |
Custodian fees and expenses | 47,382 | |
Independent trustees' compensation | 15,923 | |
Registration fees | 132,426 | |
Audit | 69,124 | |
Legal | 7,688 | |
Interest | 359 | |
Miscellaneous | 25,296 | |
Total expenses before reductions | 27,789,673 | |
Expense reductions | (31,201) | 27,758,472 |
Net investment income (loss) | | 9,490,811 |
Realized and Unrealized Gain (Loss) Net realized gain (loss) on: | | |
Investment securities: | | |
Unaffiliated issuers | 99,604,672 | |
Other affiliated issuers | 57,534 | |
Foreign currency transactions | (5,054) | |
Total net realized gain (loss) | | 99,657,152 |
Change in net unrealized appreciation (depreciation) on: Investment securities | (37,717,980) | |
Assets and liabilities in foreign currencies | (6,920) | |
Total change in net unrealized appreciation (depreciation) | | (37,724,900) |
Net gain (loss) | | 61,932,252 |
Net increase (decrease) in net assets resulting from operations | | $ 71,423,063 |
See accompanying notes which are an integral part of the financial statements.
Annual Report
Statement of Changes in Net Assets
| Year ended
July 31,
2012 | Year ended
July 31,
2011 |
Increase (Decrease) in Net Assets | | |
Operations | | |
Net investment income (loss) | $ 9,490,811 | $ 8,365,475 |
Net realized gain (loss) | 99,657,152 | 155,481,563 |
Change in net unrealized appreciation (depreciation) | (37,724,900) | 203,701,455 |
Net increase (decrease) in net assets resulting
from operations | 71,423,063 | 367,548,493 |
Distributions to shareholders from net investment income | (3,813,704) | (16,151,065) |
Distributions to shareholders from net realized gain | (148,970,854) | (20,051,059) |
Total distributions | (152,784,558) | (36,202,124) |
Share transactions - net increase (decrease) | 230,904,084 | 54,629,275 |
Redemption fees | 569,163 | 445,888 |
Total increase (decrease) in net assets | 150,111,752 | 386,421,532 |
| | |
Net Assets | | |
Beginning of period | 2,533,580,998 | 2,147,159,466 |
End of period (including undistributed net investment income of $4,596,351 and $0, respectively) | $ 2,683,692,750 | $ 2,533,580,998 |
See accompanying notes which are an integral part of the financial statements.
Annual Report
Financial Highlights - Class A
Years ended July 31, | 2012 | 2011 | 2010 | 2009 | 2008 |
Selected Per-Share Data | | | | |
Net asset value, beginning of period | $ 15.48 | $ 13.45 | $ 11.13 | $ 11.82 | $ 14.34 |
Income from Investment
Operations | | | | |
Net investment income (loss) C | .01 | .01 F | .02 G | .08 | (.01) |
Net realized and unrealized gain (loss) | .30 | 2.22 | 2.33 | (.60) | (1.98) |
Total from investment operations | .31 | 2.23 | 2.35 | (.52) | (1.99) |
Distributions from net investment income | (.01) | (.08) | (.03) | (.06) | - |
Distributions from net realized gain | (.93) | (.12) | - | (.11) | (.53) |
Total distributions | (.93) J | (.20) | (.03) | (.17) | (.53) |
Redemption fees added to paid in capital C, I | - | - | - | - | - |
Net asset value, end of period | $ 14.86 | $ 15.48 | $ 13.45 | $ 11.13 | $ 11.82 |
Total Return A, B | 3.24% | 16.72% | 21.16% | (4.37)% | (14.35)% |
Ratios to Average Net Assets D, H | | | | |
Expenses before reductions | 1.44% | 1.44% | 1.47% | 1.45% | 1.43% |
Expenses net of fee waivers, if any | 1.44% | 1.43% | 1.40% | 1.40% | 1.40% |
Expenses net of all reductions | 1.44% | 1.43% | 1.39% | 1.40% | 1.40% |
Net investment income (loss) | .09% | .06% F | .17% G | .81% | (.05)% |
Supplemental Data | | | | |
Net assets, end of period (000 omitted) | $ 150,285 | $ 140,707 | $ 96,994 | $ 55,029 | $ 52,446 |
Portfolio turnover rate E | 27% | 22% | 49% | 51% | 149% |
A Total returns would have been lower if certain expenses had not been reduced during the applicable periods shown.
B Total returns do not include the effect of the sales charges.
C Calculated based on average shares outstanding during the period.
D Fees and expenses of any underlying Fidelity Central Funds are not included in the Fund's expense ratio. The Fund indirectly bears its proportionate share of the expenses of any underlying Fidelity Central Funds.
E Amount does not include the portfolio activity of any underlying Fidelity Central Funds.
F Investment income per share reflects a large, non-recurring dividend which amounted to $.06 per share. Excluding this non-recurring dividend, the ratio of net investment income (loss) to average net assets would have been (.31)%.
G Investment income per share reflects a large, non-recurring dividend which amounted to $.03 per share. Excluding this non-recurring dividend, the ratio of net investment income (loss) to average net assets would have been (.10)%.
H Expense ratios reflect operating expenses of the class. Expenses before reductions do not reflect amounts reimbursed by the investment adviser or reductions from brokerage service arrangements or reductions from other expense offset arrangements and do not represent the amount paid by the class during periods when reimbursements or reductions occur. Expenses net of fee waivers reflect expenses after reimbursement by the investment adviser but prior to reductions from brokerage service arrangements or other expense offset arrangements. Expenses net of all reductions represent the net expenses paid by the class.
I Amount represents less than $.01 per share.
J Total distributions of $.93 per share is comprised of distributions from net investment income of $.006 and distributions from net realized gain of $.925 per share.
See accompanying notes which are an integral part of the financial statements.
Annual Report
Financial Highlights - Class T
Years ended July 31, | 2012 | 2011 | 2010 | 2009 | 2008 |
Selected Per-Share Data | | | | |
Net asset value, beginning of period | $ 15.34 | $ 13.34 | $ 11.05 | $ 11.74 | $ 14.28 |
Income from Investment
Operations | | | | |
Net investment income (loss) C | (.02) | (.03) F | (.01) G | .05 | (.04) |
Net realized and unrealized gain (loss) | .31 | 2.20 | 2.31 | (.59) | (1.97) |
Total from investment operations | .29 | 2.17 | 2.30 | (.54) | (2.01) |
Distributions from net investment income | - | (.05) | (.01) | (.04) | - |
Distributions from net realized gain | (.93) | (.12) | - | (.11) | (.53) |
Total distributions | (.93) | (.17) | (.01) | (.15) | (.53) |
Redemption fees added to paid in capital C, I | - | - | - | - | - |
Net asset value, end of period | $ 14.70 | $ 15.34 | $ 13.34 | $ 11.05 | $ 11.74 |
Total Return A, B | 3.08% | 16.36% | 20.87% | (4.57)% | (14.58)% |
Ratios to Average Net Assets D, H | | | | |
Expenses before reductions | 1.67% | 1.70% | 1.72% | 1.70% | 1.68% |
Expenses net of fee waivers, if any | 1.67% | 1.69% | 1.65% | 1.65% | 1.65% |
Expenses net of all reductions | 1.67% | 1.69% | 1.64% | 1.65% | 1.65% |
Net investment income (loss) | (.14)% | (.19)% F | (.08)% G | .56% | (.30)% |
Supplemental Data | | | | |
Net assets, end of period (000 omitted) | $ 57,514 | $ 55,845 | $ 44,091 | $ 28,534 | $ 32,091 |
Portfolio turnover rate E | 27% | 22% | 49% | 51% | 149% |
A Total returns would have been lower if certain expenses had not been reduced during the applicable periods shown.
B Total returns do not include the effect of the sales charges.
C Calculated based on average shares outstanding during the period.
D Fees and expenses of any underlying Fidelity Central Funds are not included in the Fund's expense ratio. The Fund indirectly bears its proportionate share of the expenses of any underlying Fidelity Central Funds.
E Amount does not include the portfolio activity of any underlying Fidelity Central Funds.
F Investment income per share reflects a large, non-recurring dividend which amounted to $.06 per share. Excluding this non-recurring dividend, the ratio of net investment income (loss) to average net assets would have been (.57)%.
G Investment income per share reflects a large, non-recurring dividend which amounted to $.03 per share. Excluding this non-recurring dividend, the ratio of net investment income (loss) to average net assets would have been (.35)%.
H Expense ratios reflect operating expenses of the class. Expenses before reductions do not reflect amounts reimbursed by the investment adviser or reductions from brokerage service arrangements or reductions from other expense offset arrangements and do not represent the amount paid by the class during periods when reimbursements or reductions occur. Expenses net of fee waivers reflect expenses after reimbursement by the investment adviser but prior to reductions from brokerage service arrangements or other expense offset arrangements. Expenses net of all reductions represent the net expenses paid by the class.
I Amount represents less than $.01 per share.
See accompanying notes which are an integral part of the financial statements.
Annual Report
Financial Highlights - Class B
Years ended July 31, | 2012 | 2011 | 2010 | 2009 | 2008 |
Selected Per-Share Data | | | | |
Net asset value, beginning of period | $ 15.00 | $ 13.08 | $ 10.88 | $ 11.60 | $ 14.19 |
Income from Investment
Operations | | | | |
Net investment income (loss) C | (.09) | (.10) F | (.07) G | .01 | (.10) |
Net realized and unrealized gain (loss) | .29 | 2.15 | 2.27 | (.59) | (1.96) |
Total from investment operations | .20 | 2.05 | 2.20 | (.58) | (2.06) |
Distributions from net investment income | - | (.01) | - | (.03) | - |
Distributions from net realized gain | (.93) | (.12) | - | (.11) | (.53) |
Total distributions | (.93) | (.13) | - | (.14) | (.53) |
Redemption fees added to paid in capital C, I | - | - | - | - | - |
Net asset value, end of period | $ 14.27 | $ 15.00 | $ 13.08 | $ 10.88 | $ 11.60 |
Total Return A, B | 2.51% | 15.80% | 20.22% | (5.05)% | (15.04)% |
Ratios to Average Net Assets D, H | | | | |
Expenses before reductions | 2.19% | 2.20% | 2.22% | 2.20% | 2.18% |
Expenses net of fee waivers, if any | 2.19% | 2.19% | 2.15% | 2.15% | 2.15% |
Expenses net of all reductions | 2.19% | 2.19% | 2.14% | 2.15% | 2.15% |
Net investment income (loss) | (.66)% | (.69)% F | (.58)% G | .06% | (.80)% |
Supplemental Data | | | | |
Net assets, end of period (000 omitted) | $ 6,675 | $ 8,549 | $ 9,747 | $ 7,153 | $ 7,886 |
Portfolio turnover rate E | 27% | 22% | 49% | 51% | 149% |
A Total returns would have been lower if certain expenses had not been reduced during the applicable periods shown.
B Total returns do not include the effect of the contingent deferred sales charge.
C Calculated based on average shares outstanding during the period.
D Fees and expenses of any underlying Fidelity Central Funds are not included in the Fund's expense ratio. The Fund indirectly bears its proportionate share of the expenses of any underlying Fidelity Central Funds.
E Amount does not include the portfolio activity of any underlying Fidelity Central Funds.
F Investment income per share reflects a large, non-recurring dividend which amounted to $.06 per share. Excluding this non-recurring dividend, the ratio of net investment income (loss) to average net assets would have been (1.07)%.
G Investment income per share reflects a large, non-recurring dividend which amounted to $.03 per share. Excluding this non-recurring dividend, the ratio of net investment income (loss) to average net assets would have been (.85)%.
H Expense ratios reflect operating expenses of the class. Expenses before reductions do not reflect amounts reimbursed by the investment adviser or reductions from brokerage service arrangements or reductions from other expense offset arrangements and do not represent the amount paid by the class during periods when reimbursements or reductions occur. Expenses net of fee waivers reflect expenses after reimbursement by the investment adviser but prior to reductions from brokerage service arrangements or other expense offset arrangements. Expenses net of all reductions represent the net expenses paid by the class.
I Amount represents less than $.01 per share.
See accompanying notes which are an integral part of the financial statements.
Annual Report
Financial Highlights - Class C
Years ended July 31, | 2012 | 2011 | 2010 | 2009 | 2008 |
Selected Per-Share Data | | | | |
Net asset value, beginning of period | $ 15.01 | $ 13.08 | $ 10.89 | $ 11.60 | $ 14.19 |
Income from Investment
Operations | | | | |
Net investment income (loss) C | (.09) | (.10) F | (.07) G | .01 | (.10) |
Net realized and unrealized gain (loss) | .29 | 2.17 | 2.26 | (.58) | (1.96) |
Total from investment operations | .20 | 2.07 | 2.19 | (.57) | (2.06) |
Distributions from net investment income | - | (.02) | - | (.03) | - |
Distributions from net realized gain | (.93) | (.12) | - | (.11) | (.53) |
Total distributions | (.93) | (.14) | - | (.14) | (.53) |
Redemption fees added to paid in capital C, I | - | - | - | - | - |
Net asset value, end of period | $ 14.28 | $ 15.01 | $ 13.08 | $ 10.89 | $ 11.60 |
Total Return A, B | 2.52% | 15.91% | 20.11% | (4.98)% | (15.04)% |
Ratios to Average Net Assets D, H | | | | |
Expenses before reductions | 2.19% | 2.18% | 2.22% | 2.20% | 2.18% |
Expenses net of fee waivers, if any | 2.19% | 2.18% | 2.15% | 2.15% | 2.15% |
Expenses net of all reductions | 2.19% | 2.18% | 2.14% | 2.15% | 2.15% |
Net investment income (loss) | (.66)% | (.68)% F | (.58)% G | .06% | (.80)% |
Supplemental Data | | | | |
Net assets, end of period (000 omitted) | $ 47,265 | $ 47,457 | $ 37,346 | $ 21,345 | $ 20,924 |
Portfolio turnover rate E | 27% | 22% | 49% | 51% | 149% |
A Total returns would have been lower if certain expenses had not been reduced during the applicable periods shown.
B Total returns do not include the effect of the contingent deferred sales charge.
C Calculated based on average shares outstanding during the period.
D Fees and expenses of any underlying Fidelity Central Funds are not included in the Fund's expense ratio. The Fund indirectly bears its proportionate share of the expenses of any underlying Fidelity Central Funds.
E Amount does not include the portfolio activity of any underlying Fidelity Central Funds.
F Investment income per share reflects a large, non-recurring dividend which amounted to $.06 per share. Excluding this non-recurring dividend, the ratio of net investment income (loss) to average net assets would have been (1.06)%.
G Investment income per share reflects a large, non-recurring dividend which amounted to $.03 per share. Excluding this non-recurring dividend, the ratio of net investment income (loss) to average net assets would have been (.85)%.
H Expense ratios reflect operating expenses of the class. Expenses before reductions do not reflect amounts reimbursed by the investment adviser or reductions from brokerage service arrangements or reductions from other expense offset arrangements and do not represent the amount paid by the class during periods when reimbursements or reductions occur. Expenses net of fee waivers reflect expenses after reimbursement by the investment adviser but prior to reductions from brokerage service arrangements or other expense offset arrangements. Expenses net of all reductions represent the net expenses paid by the class.
I Amount represents less than $.01 per share.
See accompanying notes which are an integral part of the financial statements.
Annual Report
Financial Highlights - Small Cap Value
Years ended July 31, | 2012 | 2011 | 2010 | 2009 | 2008 |
Selected Per-Share Data | | | | |
Net asset value, beginning of period | $ 15.62 | $ 13.56 | $ 11.22 | $ 11.91 | $ 14.43 |
Income from Investment
Operations | | | | |
Net investment income (loss) B | .06 | .06 E | .05 F | .10 | .03 |
Net realized and unrealized gain (loss) | .32 | 2.23 | 2.34 | (.60) | (1.99) |
Total from investment operations | .38 | 2.29 | 2.39 | (.50) | (1.96) |
Distributions from net investment income | (.02) | (.10) | (.05) | (.08) | - |
Distributions from net realized gain | (.93) | (.13) | - | (.11) | (.56) |
Total distributions | (.95) | (.23) | (.05) | (.19) | (.56) |
Redemption fees added to paid in capital B, H | - | - | - | - | - |
Net asset value, end of period | $ 15.05 | $ 15.62 | $ 13.56 | $ 11.22 | $ 11.91 |
Total Return A | 3.67% | 17.03% | 21.32% | (4.15)% | (14.10)% |
Ratios to Average Net Assets C, G | | | | |
Expenses before reductions | 1.13% | 1.13% | 1.18% | 1.20% | 1.14% |
Expenses net of fee waivers, if any | 1.13% | 1.13% | 1.18% | 1.20% | 1.14% |
Expenses net of all reductions | 1.13% | 1.13% | 1.17% | 1.20% | 1.13% |
Net investment income (loss) | .41% | .37% E | .39% F | 1.01% | .22% |
Supplemental Data | | | | |
Net assets, end of period (000 omitted) | $ 1,756,962 | $ 1,899,805 | $ 1,770,675 | $ 1,488,736 | $ 1,136,860 |
Portfolio turnover rate D | 27% | 22% | 49% | 51% | 149% |
A Total returns would have been lower if certain expenses had not been reduced during the applicable periods shown.
B Calculated based on average shares outstanding during the period.
C Fees and expenses of any underlying Fidelity Central Funds are not included in the Fund's expense ratio. The Fund indirectly bears its proportionate share of the expenses of any underlying Fidelity Central Funds.
D Amount does not include the portfolio activity of any underlying Fidelity Central Funds.
E Investment income per share reflects a large, non-recurring dividend which amounted to $.06 per share. Excluding this non-recurring dividend, the ratio of net investment income (loss) to average net assets would have been (.01)%.
F Investment income per share reflects a large, non-recurring dividend which amounted to $.03 per share. Excluding this non-recurring dividend, the ratio of net investment income (loss) to average net assets would have been .12%.
G Expense ratios reflect operating expenses of the class. Expenses before reductions do not reflect amounts reimbursed by the investment adviser or reductions from brokerage service arrangements or reductions from other expense offset arrangements and do not represent the amount paid by the class during periods when reimbursements or reductions occur. Expenses net of fee waivers reflect expenses after reimbursement by the investment adviser but prior to reductions from brokerage service arrangements or other expense offset arrangements. Expenses net of all reductions represent the net expenses paid by the class.
H Amount represents less than $.01 per share.
See accompanying notes which are an integral part of the financial statements.
Annual Report
Financial Highlights - Class F
Years ended July 31, | 2012 | 2011 | 2010 | 2009 I |
Selected Per-Share Data | | | | |
Net asset value, beginning of period | $ 15.64 | $ 13.58 | $ 11.22 | $ 10.27 |
Income from Investment Operations | | | | |
Net investment income (loss) D | .09 | .09 G | .09 H | .01 |
Net realized and unrealized gain (loss) | .32 | 2.23 | 2.34 | .94 |
Total from investment operations | .41 | 2.32 | 2.43 | .95 |
Distributions from net investment income | (.04) | (.14) | (.07) | - |
Distributions from net realized gain | (.93) | (.13) | - | - |
Total distributions | (.96) L | (.26) M | (.07) | - |
Redemption fees added to paid in capital D, K | - | - | - | - |
Net asset value, end of period | $ 15.09 | $ 15.64 | $ 13.58 | $ 11.22 |
Total Return B, C | 3.90% | 17.31% | 21.69% | 9.25% |
Ratios to Average Net Assets E, J | | | | |
Expenses before reductions | .89% | .88% | .90% | .86% A |
Expenses net of fee waivers, if any | .89% | .88% | .90% | .86% A |
Expenses net of all reductions | .89% | .88% | .89% | .86% A |
Net investment income (loss) | .64% | .61% G | .67% H | .64% A |
Supplemental Data | | | | |
Net assets, end of period (000 omitted) | $ 526,009 | $ 279,653 | $ 109,868 | $ 159 |
Portfolio turnover rate F | 27% | 22% | 49% | 51% |
A Annualized
B Total returns for periods of less than one year are not annualized.
C Total returns would have been lower if certain expenses had not been reduced during the applicable periods shown.
D Calculated based on average shares outstanding during the period.
E Fees and expenses of any underlying Fidelity Central Funds are not included in the Fund's expense ratio. The Fund indirectly bears its proportionate share of the expenses of any underlying Fidelity Central Funds.
F Amount does not include the portfolio activity of any underlying Fidelity Central Funds.
G Investment income per share reflects a large, non-recurring dividend which amounted to $.06 per share. Excluding this non-recurring dividend, the ratio of net investment income (loss) to average net assets would have been .24%.
H Investment income per share reflects a large, non-recurring dividend which amounted to $.04 per share. Excluding this non-recurring dividend, the ratio of net investment income (loss) to average net assets would have been .40%.
I For the period June 26, 2009 (commencement of sale of shares) to July 31, 2009.
J Expense ratios reflect operating expenses of the class. Expenses before reductions do not reflect amounts reimbursed by the investment adviser or reductions from brokerage service arrangements or reductions from other expense offset arrangements and do not represent the amount paid by the class during periods when reimbursements or reductions occur. Expense ratios before reductions for start-up periods may not be representative of longer-term operating periods. Expenses net of fee waivers reflect expenses after reimbursement by the investment adviser but prior to reductions from brokerage service arrangements or other expense offset arrangements. Expenses net of all reductions represent the net expenses paid by the class.
K Amount represents less than $.01 per share.
L Total distributions of $.96 per share is comprised of distributions from net investment income of $.036 and distributions from net realized gain of $.925 per share.
M Total distributions of $.26 per share is comprised of distributions from net investment income of $.138 and distributions from net realized gain of $.126 per share.
See accompanying notes which are an integral part of the financial statements.
Annual Report
Financial Highlights - Institutional Class
Years ended July 31, | 2012 | 2011 | 2010 | 2009 | 2008 |
Selected Per-Share Data | | | | |
Net asset value, beginning of period | $ 15.63 | $ 13.58 | $ 11.24 | $ 11.91 | $ 14.43 |
Income from Investment
Operations | | | | |
Net investment income (loss) B | .06 | .06 E | .06 F | .10 | .03 |
Net realized and unrealized gain (loss) | .31 | 2.23 | 2.34 | (.59) | (1.99) |
Total from investment operations | .37 | 2.29 | 2.40 | (.49) | (1.96) |
Distributions from net investment income | (.02) | (.11) | (.06) | (.07) | - |
Distributions from net realized gain | (.93) | (.13) | - | (.11) | (.56) |
Total distributions | (.95) | (.24) | (.06) | (.18) | (.56) |
Redemption fees added to paid in capital B, H | - | - | - | - | - |
Net asset value, end of period | $ 15.05 | $ 15.63 | $ 13.58 | $ 11.24 | $ 11.91 |
Total Return A | 3.59% | 17.02% | 21.42% | (4.04)% | (14.10)% |
Ratios to Average Net Assets C, G | | | | |
Expenses before reductions | 1.14% | 1.10% | 1.12% | 1.20% | 1.13% |
Expenses net of fee waivers, if any | 1.14% | 1.10% | 1.12% | 1.15% | 1.13% |
Expenses net of all reductions | 1.14% | 1.10% | 1.12% | 1.15% | 1.13% |
Net investment income (loss) | .39% | .39% E | .45% F | 1.06% | .22% |
Supplemental Data | | | | |
Net assets, end of period (000 omitted) | $ 138,981 | $ 101,565 | $ 78,440 | $ 10,336 | $ 8,584 |
Portfolio turnover rate D | 27% | 22% | 49% | 51% | 149% |
A Total returns would have been lower if certain expenses had not been reduced during the applicable periods shown.
B Calculated based on average shares outstanding during the period.
C Fees and expenses of any underlying Fidelity Central Funds are not included in the Fund's expense ratio. The Fund indirectly bears its proportionate share of the expenses of any underlying Fidelity Central Funds.
D Amount does not include the portfolio activity of any underlying Fidelity Central Funds.
E Investment income per share reflects a large, non-recurring dividend which amounted to $.06 per share. Excluding this non-recurring dividend, the ratio of net investment income (loss) to average net assets would have been .01%.
F Investment income per share reflects a large, non-recurring dividend which amounted to $.03 per share. Excluding this non-recurring dividend, the ratio of net investment income (loss) to average net assets would have been .18%.
G Expense ratios reflect operating expenses of the class. Expenses before reductions do not reflect amounts reimbursed by the investment adviser or reductions from brokerage service arrangements or reductions from other expense offset arrangements and do not represent the amount paid by the class during periods when reimbursements or reductions occur. Expenses net of fee waivers reflect expenses after reimbursement by the investment adviser but prior to reductions from brokerage service arrangements or other expense offset arrangements. Expenses net of all reductions represent the net expenses paid by the class.
H Amount represents less than $.01 per share.
See accompanying notes which are an integral part of the financial statements.
Annual Report
Notes to Financial Statements
For the period ended July 31, 2012
1. Organization.
Fidelity Small Cap Value Fund (the Fund) is a fund of Fidelity Securities Fund (the Trust) and is authorized to issue an unlimited number of shares. The Trust is registered under the Investment Company Act of 1940, as amended (the 1940 Act), as an open-end management investment company organized as a Massachusetts business trust. The Fund offers Class A, Class T, Class C, Small Cap Value, Class F and Institutional Class shares, each of which, along with Class B shares, has equal rights as to assets and voting privileges. Effective after the close of business on September 1, 2010, Class B shares were closed to new accounts and additional purchases, except for exchanges and reinvestments. Each class has exclusive voting rights with respect to matters that affect that class. Class F shares of the Fund are only available for purchase by mutual funds for which Fidelity Management & Research Company (FMR) or an affiliate serves as investment manager. Class B shares will automatically convert to Class A shares after a holding period of seven years from the initial date of purchase. Investment income, realized and unrealized capital gains and losses, the common expenses of the Fund, and certain fund-level expense reductions, if any, are allocated on a pro-rata basis to each class based on the relative net assets of each class to the total net assets of the Fund. Each class differs with respect to transfer agent and distribution and service plan fees incurred. Certain expense reductions may also differ by class.
2. Investments in Fidelity Central Funds.
The Fund invests in Fidelity Central Funds, which are open-end investment companies available only to other investment companies and accounts managed by FMR and its affiliates. The Fund's Schedule of Investments lists each of the Fidelity Central Funds held as of period end, if any, as an investment of the Fund, but does not include the underlying holdings of each Fidelity Central Fund. As an Investing Fund, the Fund indirectly bears its proportionate share of the expenses of the underlying Fidelity Central Funds.
The Money Market Central Funds seek preservation of capital and current income and are managed by Fidelity Investments Money Management, Inc. (FIMM), an affiliate of FMR.
A complete unaudited list of holdings for each Fidelity Central Fund is available upon request or at the Securities and Exchange Commission (the SEC) web site at www.sec.gov. In addition, the financial statements of the Fidelity Central Funds, which are not covered by the Fund's Report of Independent Registered Public Accounting Firm, are available on the SEC web site or upon request.
Annual Report
Notes to Financial Statements - continued
3. Significant Accounting Policies.
The financial statements have been prepared in conformity with accounting principles generally accepted in the United States of America (GAAP), which require management to make certain estimates and assumptions at the date of the financial statements. Actual results could differ from those estimates. Subsequent events, if any, through the date that the financial statements were issued have been evaluated in the preparation of the financial statements. The following summarizes the significant accounting policies of the Fund:
Security Valuation. Investments are valued as of 4:00 p.m. Eastern time on the last calendar day of the period. In accordance with valuation policies and procedures approved by the Board of Trustees (the Board), the Fund attempts to obtain prices from one or more third party pricing vendor or broker to value its investments. When current market prices, quotations or rates are not readily available or reliable, securities will be fair valued in good faith by the FMR Fair Value Committee (the Committee), in accordance with procedures adopted by the Fund's Board. Factors used in determining fair value vary by security type and may include market or security specific events. The frequency with which these procedures are used cannot be predicted and they may be utilized to a significant extent. The Committee oversees the Fund's valuation policies and procedures and is responsible for approving and reporting to the Board all fair value determinations.
The Fund categorizes the inputs to valuation techniques used to value its investments into a disclosure hierarchy consisting of three levels as shown below:
Level 1 - quoted prices in active markets for identical investments
Level 2 - other significant observable inputs (including quoted prices for similar investments, interest rates, prepayment speeds, etc.)
Level 3 - unobservable inputs (including the Fund's own assumptions based on the best information available)
Valuation techniques used to value the Fund's investments by major category are as follows:
Equity securities, including restricted securities, for which market quotations are readily available, are valued at the last reported sale price or official closing price as reported by a third party pricing vendor on the primary market or exchange on which they are traded and are categorized as Level 1 in the hierarchy. In the event there were no sales during the day or closing prices are not available, securities are valued at the last quoted bid price or may be valued using the last available price and are generally categorized as Level 2 in the hierarchy. For foreign equity securities, when significant market or security specific events arise, comparisons to the valuation of American Depositary Receipts
Annual Report
3. Significant Accounting Policies - continued
Security Valuation - continued
(ADRs), futures contracts, Exchange-Traded Funds (ETFs) and certain indexes as well as quoted prices for similar securities are used and are categorized as Level 2 in the hierarchy. Utilizing these techniques may result in transfers between Level 1 and Level 2.
Investments in open-end mutual funds, including the Fidelity Central Funds, are valued at their closing net asset value each business day and are categorized as Level 1 in the hierarchy.
Changes in valuation techniques may result in transfers in or out of an assigned level within the disclosure hierarchy. The aggregate value of investments by input level, as of July 31, 2012, including information on transfers between Levels 1 and 2, is included at the end of the Fund's Schedule of Investments.
Foreign Currency Translation. The Fund may use foreign currency contracts to facilitate transactions in foreign-denominated securities. Gains and losses from these transactions may arise from changes in the value of the foreign currency or if the counterparties do not perform under the contracts' terms.
Foreign-denominated assets, including investment securities, and liabilities are translated into U.S. dollars at the exchange rates at period end. Purchases and sales of investment securities, income and dividends received and expenses denominated in foreign currencies are translated into U.S. dollars at the exchange rate in effect on the transaction date.
The effects of exchange rate fluctuations on investments are included with the net realized and unrealized gain (loss) on investment securities. Other foreign currency transactions resulting in realized and unrealized gain (loss) are disclosed separately.
Investment Transactions and Income. For financial reporting purposes, the Fund's investment holdings and NAV include trades executed through the end of the last business day of the period. The NAV per share for processing shareholder transactions is calculated as of the close of business of the New York Stock Exchange (NYSE), normally 4:00 p.m. Eastern time and includes trades executed through the end of the prior business day. Gains and losses on securities sold are determined on the basis of identified cost and may include proceeds received from litigation. Dividend income is recorded on the ex-dividend date, except for certain dividends from foreign securities where the ex-dividend date may have passed, which are recorded as soon as the Fund is informed of the ex-dividend date. Non-cash dividends included in dividend income, if any, are recorded at the fair market value of the securities received. Distributions received on securities that represent a return of capital or capital gain are recorded as a reduction of
Annual Report
Notes to Financial Statements - continued
3. Significant Accounting Policies - continued
Investment Transactions and Income - continued
cost of investments and/or as a realized gain. The Fund estimates the components of distributions received that may be considered return of capital distributions or capital gain distributions. Interest income and distributions from the Fidelity Central Funds are accrued as earned. Interest income includes coupon interest and amortization of premium and accretion of discount on debt securities. Investment income is recorded net of foreign taxes withheld where recovery of such taxes is uncertain.
Expenses. Expenses directly attributable to a fund are charged to that fund. Expenses attributable to more than one fund are allocated among the respective funds on the basis of relative net assets or other appropriate methods. Expense estimates are accrued in the period to which they relate and adjustments are made when actual amounts are known.
Income Tax Information and Distributions to Shareholders. Each year, the Fund intends to qualify as a regulated investment company under Subchapter M of the Internal Revenue Code, including distributing substantially all of its taxable income and realized gains. As a result, no provision for income taxes is required. As of July 31, 2012, the Fund did not have any unrecognized tax benefits in the financial statements; nor is the Fund aware of any tax positions for which it is reasonably possible that the total amounts of unrecognized tax benefits will significantly change in the next twelve months. The Fund files a U.S. federal tax return, in addition to state and local tax returns as required. A fund's federal income tax returns are subject to examination by the Internal Revenue Service (IRS) for a period of three fiscal years after they are filed. State and local tax returns may be subject to examination for an additional fiscal year depending on the jurisdiction. Foreign taxes are provided for based on the Fund's understanding of the tax rules and rates that exist in the foreign markets in which it invests.
Distributions are declared and recorded on the ex-dividend date. Income dividends and capital gain distributions are declared separately for each class. Income and capital gain distributions are determined in accordance with income tax regulations, which may differ from GAAP. In addition, the Fund claimed a portion of the payment made to redeeming shareholders as a distribution for income tax purposes.
Capital accounts within the financial statements are adjusted for permanent book-tax differences. These adjustments have no impact on net assets or the results of operations. Temporary book-tax differences will reverse in a subsequent period.
Book-tax differences are primarily due to foreign currency transactions and losses deferred due to wash sales.
Annual Report
3. Significant Accounting Policies - continued
Income Tax Information and Distributions to Shareholders - continued
The federal tax cost of investment securities and unrealized appreciation (depreciation) as of period end were as follows:
Gross unrealized appreciation | $ 491,346,133 |
Gross unrealized depreciation | (137,153,760) |
Net unrealized appreciation (depreciation) on securities and other investments | $ 354,192,373 |
| |
Tax Cost | $ 2,383,068,475 |
The tax-based components of distributable earnings as of period end were as follows:
Undistributed ordinary income | $ 4,596,351 |
Undistributed long-term capital gain | $ 73,839,567 |
Net unrealized appreciation (depreciation) | $ 354,192,996 |
The tax character of distributions paid was as follows:
| July 31, 2012 | July 31, 2011 |
Ordinary Income | $ 3,813,704 | $ 16,899,273 |
Long-term Capital Gains | 148,970,854 | 19,302,851 |
Total | $ 152,784,558 | $ 36,202,124 |
Short-Term Trading (Redemption) Fees. Shares held by investors in the Fund less than 90 days are subject to a redemption fee equal to 1.50% of the net asset value of shares redeemed. All redemption fees, which reduce the proceeds of the shareholder redemption, are retained by the Fund and accounted for as an addition to paid in capital.
New Accounting Pronouncement. In December 2011, the Financial Accounting Standards Board issued Accounting Standard Update No. 2011-11, Disclosures about Offsetting Assets and Liabilities. The update creates new disclosure requirements requiring entities to disclose both gross and net information for derivatives and other financial instruments that are either offset in the Statement of Assets and Liabilities or subject to an enforceable master netting arrangement or similar agreement. The disclosure requirements are effective for interim and annual reporting periods beginning on or after January 1, 2013. Management is currently evaluating the impact of the update's adoption on the Fund's financial statement disclosures.
4. Purchases and Sales of Investments.
Purchases and sales of securities, other than short-term securities, aggregated $758,866,730 and $657,878,656, respectively.
Annual Report
Notes to Financial Statements - continued
5. Fees and Other Transactions with Affiliates.
Management Fee. FMR and its affiliates provide the Fund with investment management related services for which the Fund pays a monthly management fee. The management fee is the sum of an individual fund fee rate that is based on an annual rate of .45% of the Fund's average net assets and an annualized group fee rate that averaged .26% during the period. The group fee rate is based upon the average net assets of all the mutual funds advised by FMR. The group fee rate decreases as assets under management increase and increases as assets under management decrease. In addition, the management fee is subject to a performance adjustment (up to a maximum of ± .20% of the Fund's average net assets over a 36 month performance period). The upward or downward adjustment to the management fee is based on the relative investment performance of Small Cap Value as compared to an appropriate benchmark index. For the period, the total annual management fee rate, including the performance adjustment, was .85% of the Fund's average net assets.
Distribution and Service Plan Fees. In accordance with Rule 12b-1 of the 1940 Act, the Fund has adopted separate Distribution and Service Plans for each class of shares. Certain classes pay Fidelity Distributors Corporation (FDC), an affiliate of FMR, separate Distribution and Service Fees, each of which is based on an annual percentage of each class' average net assets. In addition, FDC may pay financial intermediaries for selling shares of the Fund and providing shareholder support services. For the period, the Distribution and Service Fee rates, total fees and amounts retained by FDC were as follows:
| Distribution
Fee | Service
Fee | Total Fees | Retained
by FDC |
Class A | -% | .25% | $ 346,065 | $ 6,112 |
Class T | .25% | .25% | 268,038 | 110 |
Class B | .75% | .25% | 72,196 | 54,146 |
Class C | .75% | .25% | 438,167 | 78,130 |
| | | $ 1,124,466 | $ 138,498 |
Sales Load. FDC may receive a front-end sales charge of up to 5.75% for selling Class A shares and 3.50% for selling Class T shares, some of which is paid to financial intermediaries for selling shares of the Fund. Depending on the holding period, FDC may receive contingent deferred sales charges levied on Class A, Class T, Class B, and Class C redemptions. The deferred sales charges range from 5.00% to 1.00% for Class B shares, 1.00% for Class C shares, 1.00% for certain purchases of Class A shares and .25% for certain purchases of Class T shares.
Annual Report
5. Fees and Other Transactions with Affiliates - continued
Sales Load - continued
For the period, sales charge amounts retained by FDC were as follows:
| Retained
by FDC |
Class A | $ 40,974 |
Class T | 7,602 |
Class B* | 9,371 |
Class C* | 4,952 |
| $ 62,899 |
* When Class B and Class C shares are initially sold, FDC pays commissions from its own resources to financial intermediaries through which the sales are made.
Transfer Agent Fees. Fidelity Investments Institutional Operations Company, Inc. (FIIOC), an affiliate of FMR, is the transfer, dividend disbursing and shareholder servicing agent for each class of the Fund. FIIOC receives account fees and asset-based fees that vary according to the account size and type of account of the shareholders of the respective classes of the Fund, except for Class F. FIIOC receives no fees for providing transfer agency services to Class F. FIIOC pays for typesetting, printing and mailing of shareholder reports, except proxy statements. For the period, transfer agent fees for each class were as follows:
| Amount | % of
Average
Net Assets |
Class A | $ 413,829 | .30 |
Class T | 150,262 | .28 |
Class B | 21,652 | .30 |
Class C | 131,410 | .30 |
Small Cap Value | 3,956,103 | .23 |
Institutional Class | 283,320 | .25 |
| $ 4,956,576 | |
Accounting and Security Lending Fees. Fidelity Service Company, Inc. (FSC), an affiliate of FMR, maintains the Fund's accounting records. The accounting fee is based on the level of average net assets for each month. Under a separate contract, FSC administers the security lending program. The security lending fee is based on the number and duration of lending transactions.
Brokerage Commissions. The Fund placed a portion of its portfolio transactions with brokerage firms which are affiliates of the investment adviser. The commissions paid to these affiliated firms were $23,890 for the period.
Annual Report
Notes to Financial Statements - continued
5. Fees and Other Transactions with Affiliates - continued
Interfund Lending Program. Pursuant to an Exemptive Order issued by the SEC, the Fund, along with other registered investment companies having management contracts with FMR, may participate in an interfund lending program. This program provides an alternative credit facility allowing the funds to borrow from, or lend money to, other participating affiliated funds. At period end, there were no interfund loans outstanding. The Fund's activity in this program during the period for which loans were outstanding was as follows:
Borrower or Lender | Average
Loan Balance | Weighted Average
Interest Rate | Interest
Expense |
Borrower | $ 6,367,333 | .34% | $ 359 |
6. Committed Line of Credit.
The Fund participates with other funds managed by FMR or an affiliate in a $4.25 billion credit facility (the "line of credit") to be utilized for temporary or emergency purposes to fund shareholder redemptions or for other short-term liquidity purposes. The Fund has agreed to pay commitment fees on its pro-rata portion of the line of credit, which amounted to $6,842 and is reflected in Miscellaneous expenses on the Statement of Operations. During the period, there were no borrowings on this line of credit.
7. Security Lending.
The Fund lends portfolio securities through a lending agent from time to time in order to earn additional income. For equity securities, a lending agent is used and may loan securities to certain qualified borrowers, including Fidelity Capital Markets (FCM), a broker-dealer affiliated with the Fund. On the settlement date of the loan, the Fund receives collateral (in the form of U.S. Treasury obligations, letters of credit and/or cash) against the loaned securities and maintains collateral in an amount not less than 100% of the market value of the loaned securities during the period of the loan. The market value of the loaned securities is determined at the close of business of the Fund and any additional required collateral is delivered to the Fund on the next business day. If the borrower defaults on its obligation to return the securities loaned because of insolvency or other reasons, a fund could experience delays and costs in recovering the securities loaned or in gaining access to the collateral. Any cash collateral received is invested in the Fidelity Securities Lending Cash Central Fund. The value of loaned securities and cash collateral at period end are disclosed on the Fund's Statement of Assets and Liabilities. The value of securities loaned to FCM at period end was $3,305,772. Security lending income represents the income earned on investing cash collateral, less rebates paid to borrowers and any lending agent fees associated with the loan, plus any premium payments received for lending certain types of securities. Security lending income is
Annual Report
7. Security Lending - continued
presented in the Statement of Operations as a component of income from Fidelity Central Funds. Total security lending income during the period amounted to $204,102, including $40,274 from securities loaned to FCM.
8. Expense Reductions.
Many of the brokers with whom FMR places trades on behalf of the Fund provided services to the Fund in addition to trade execution. These services included payments of certain expenses on behalf of the Fund totaling $31,201 for the period.
9. Distributions to Shareholders.
Distributions to shareholders of each class were as follows:
Years ended July 31, | 2012 | 2011 |
From net investment income | | |
Class A | $ 57,416 | $ 602,963 |
Class T | - | 175,083 |
Class B | - | 8,350 |
Class C | - | 50,685 |
Small Cap Value | 2,736,678 | 13,136,446 |
Class F | 858,633 | 1,502,640 |
Institutional Class | 160,977 | 674,898 |
Total | $ 3,813,704 | $ 16,151,065 |
From net realized gain | | |
Class A | $ 8,369,079 | $ 938,086 |
Class T | 3,332,444 | 417,804 |
Class B | 513,839 | 85,354 |
Class C | 2,835,863 | 362,483 |
Small Cap Value | 109,450,254 | 16,213,209 |
Class F | 18,207,376 | 1,278,822 |
Institutional Class | 6,261,999 | 755,301 |
Total | $ 148,970,854 | $ 20,051,059 |
10. Share Transactions.
Transactions for each class of shares were as follows:
| Shares | Dollars |
Years ended July 31, | 2012 | 2011 | 2012 | 2011 |
Class A | | | | |
Shares sold | 3,582,114 | 4,641,222 | $ 51,112,084 | $ 70,784,911 |
Reinvestment of distributions | 639,382 | 98,821 | 7,957,627 | 1,412,739 |
Shares redeemed | (3,203,028) | (2,860,682) | (45,298,282) | (43,524,578) |
Net increase (decrease) | 1,018,468 | 1,879,361 | $ 13,771,429 | $ 28,673,072 |
Annual Report
Notes to Financial Statements - continued
10. Share Transactions - continued
| Shares | Dollars |
Years ended July 31, | 2012 | 2011 | 2012 | 2011 |
Class T | | | | |
Shares sold | 1,074,645 | 1,830,956 | $ 15,238,625 | $ 27,619,849 |
Reinvestment of distributions | 264,657 | 40,370 | 3,258,576 | 573,649 |
Shares redeemed | (1,066,289) | (1,537,319) | (14,773,000) | (23,500,005) |
Net increase (decrease) | 273,013 | 334,007 | $ 3,724,201 | $ 4,693,493 |
Class B | | | | |
Shares sold | 17,886 | 84,331 | $ 244,464 | $ 1,230,023 |
Reinvestment of distributions | 36,117 | 5,817 | 433,889 | 79,168 |
Shares redeemed | (156,185) | (265,513) | (2,129,294) | (3,874,627) |
Net increase (decrease) | (102,182) | (175,365) | $ (1,450,941) | $ (2,565,436) |
Class C | | | | |
Shares sold | 840,854 | 1,131,174 | $ 11,606,643 | $ 16,672,873 |
Reinvestment of distributions | 202,948 | 25,779 | 2,439,209 | 354,104 |
Shares redeemed | (895,789) | (848,659) | (12,102,998) | (12,648,504) |
Net increase (decrease) | 148,013 | 308,294 | $ 1,942,854 | $ 4,378,473 |
Small Cap Value | | | | |
Shares sold | 27,786,966 | 35,677,635 | $ 403,227,336 | $ 541,990,483 |
Reinvestment of distributions | 8,564,707 | 1,987,755 | 107,820,730 | 28,460,668 |
Shares redeemed | (41,177,942) | (46,640,533) | (579,334,071) | (708,788,001) |
Net increase (decrease) | (4,826,269) | (8,975,143) | $ (68,286,005) | $ (138,336,850) |
Class F | | | | |
Shares sold | 17,383,615 | 11,644,633 | $ 249,495,726 | $ 177,097,711 |
Reinvestment of distributions | 1,506,337 | 192,943 | 19,066,009 | 2,781,462 |
Shares redeemed | (1,906,027) | (2,052,505) | (26,618,099) | (32,200,197) |
Net increase (decrease) | 16,983,925 | 9,785,071 | $ 241,943,636 | $ 147,678,976 |
Institutional Class | | | | |
Shares sold | 4,662,732 | 4,417,342 | $ 67,294,175 | $ 67,359,213 |
Reinvestment of distributions | 445,761 | 90,435 | 5,619,794 | 1,288,856 |
Shares redeemed | (2,373,514) | (3,788,938) | (33,655,059) | (58,540,522) |
Net increase (decrease) | 2,734,979 | 718,839 | $ 39,258,910 | $ 10,107,547 |
11. Other.
The Fund's organizational documents provide former and current trustees and officers with a limited indemnification against liabilities arising in connection with the performance of their duties to the Fund. In the normal course of business, the Fund may also enter into contracts that provide general indemnifications. The Fund's maximum exposure under these arrangements is unknown as this would be dependent on future claims that may be made against the Fund. The risk of material loss from such claims is considered remote.
Annual Report
11. Other - continued
At the end of the period, the Fidelity Freedom Funds and Fidelity Freedom K Funds were the owners of record, in the aggregate, of approximately 43% of the total outstanding shares of the Fund.
Annual Report
To the Trustees of Fidelity Securities Fund and the Shareholders of Fidelity Small Cap Value Fund:
In our opinion, the accompanying statement of assets and liabilities, including the schedule of investments, and the related statements of operations and of changes in net assets and the financial highlights present fairly, in all material respects, the financial position of Fidelity Small Cap Value Fund (a fund of Fidelity Securities Fund) at July 31, 2012, the results of its operations for the year then ended, the changes in its net assets for each of the two years in the period then ended and the financial highlights for each of the periods indicated, in conformity with accounting principles generally accepted in the United States of America. These financial statements and financial highlights (hereafter referred to as "financial statements") are the responsibility of the Fidelity Small Cap Value Fund's management. Our responsibility is to express an opinion on these financial statements based on our audits. We conducted our audits of these financial statements in accordance with the standards of the Public Company Accounting Oversight Board (United States). Those standards require that we plan and perform the audit to obtain reasonable assurance about whether the financial statements are free of material misstatement. An audit includes examining, on a test basis, evidence supporting the amounts and disclosures in the financial statements, assessing the accounting principles used and significant estimates made by management, and evaluating the overall financial statement presentation. We believe that our audits, which included confirmation of securities at July 31, 2012 by correspondence with the custodian and brokers, provide a reasonable basis for our opinion.
PricewaterhouseCoopers LLP
Boston, Massachusetts
September 12, 2012
Annual Report
The Trustees, Members of the Advisory Board, and executive officers of the trust and fund, as applicable, are listed below. The Board of Trustees governs the fund and is responsible for protecting the interests of shareholders. The Trustees are experienced executives who meet periodically throughout the year to oversee the fund's activities, review contractual arrangements with companies that provide services to the fund, oversee management of the risks associated with such activities and contractual arrangements, and review the fund's performance. Except for James C. Curvey, each of the Trustees oversees 228 funds advised by FMR or an affiliate. Mr. Curvey oversees 435 funds advised by FMR or an affiliate.
The Trustees hold office without limit in time except that (a) any Trustee may resign; (b) any Trustee may be removed by written instrument, signed by at least two-thirds of the number of Trustees prior to such removal; (c) any Trustee who requests to be retired or who has become incapacitated by illness or injury may be retired by written instrument signed by a majority of the other Trustees; and (d) any Trustee may be removed at any special meeting of shareholders by a two-thirds vote of the outstanding voting securities of the trust. Each Trustee who is not an interested person (as defined in the 1940 Act) (Independent Trustee), shall retire not later than the last day of the calendar year in which his or her 75th birthday occurs. The Independent Trustees may waive this mandatory retirement age policy with respect to individual Trustees. The executive officers and Advisory Board Members hold office without limit in time, except that any officer and Advisory Board Member may resign or may be removed by a vote of a majority of the Trustees at any regular meeting or any special meeting of the Trustees. Except as indicated, each individual has held the office shown or other offices in the same company for the past five years.
Experience, Skills, Attributes, and Qualifications of the Fund's Trustees. The Governance and Nominating Committee has adopted a statement of policy that describes the experience, qualifications, attributes, and skills that are necessary and desirable for potential Independent Trustee candidates (Statement of Policy). The Board believes that each Trustee satisfied at the time he or she was initially elected or appointed a Trustee, and continues to satisfy, the standards contemplated by the Statement of Policy. The Governance and Nominating Committee also engages professional search firms to help identify potential Independent Trustee candidates who have the experience, qualifications, attributes, and skills consistent with the Statement of Policy. From time to time, additional criteria based on the composition and skills of the current Independent Trustees, as well as experience or skills that may be appropriate in light of future changes to board composition, business conditions, and regulatory or other developments, have also been considered by the professional search firms and the Governance and Nominating Committee. In addition, the Board takes into account the Trustees' commitment and participation in Board and committee meetings, as well as their leadership of standing and ad hoc committees throughout their tenure.
In determining that a particular Trustee was and continues to be qualified to serve as a Trustee, the Board has considered a variety of criteria, none of which, in isolation, was controlling. The Board believes that, collectively, the Trustees have balanced and diverse experience, qualifications, attributes, and skills, which allow the Board to operate effectively in governing the fund and protecting the interests of shareholders. Information about the specific experience, skills, attributes, and qualifications of each Trustee, which in each case led to the Board's conclusion that the Trustee should serve (or continue to serve) as a trustee of the fund, is provided below.
Annual Report
Board Structure and Oversight Function. James C. Curvey is an interested person (as defined in the 1940 Act) and currently serves as Chairman. The Trustees have determined that an interested Chairman is appropriate and benefits shareholders because an interested Chairman has a personal and professional stake in the quality and continuity of services provided to the fund. Independent Trustees exercise their informed business judgment to appoint an individual of their choosing to serve as Chairman, regardless of whether the Trustee happens to be independent or a member of management. The Independent Trustees have determined that they can act independently and effectively without having an Independent Trustee serve as Chairman and that a key structural component for assuring that they are in a position to do so is for the Independent Trustees to constitute a substantial majority for the Board. The Independent Trustees also regularly meet in executive session. Ned C. Lautenbach serves as Chairman of the Independent Trustees and as such (i) acts as a liaison between the Independent Trustees and management with respect to matters important to the Independent Trustees and (ii) with management prepares agendas for Board meetings.
Fidelity funds are overseen by different Boards of Trustees. The fund's Board oversees Fidelity's equity and high income funds and another Board oversees Fidelity's investment-grade bond, money market, and asset allocation funds. The asset allocation funds may invest in Fidelity funds overseen by the fund's Board. The use of separate Boards, each with its own committee structure, allows the Trustees of each group of Fidelity funds to focus on the unique issues of the funds they oversee, including common research, investment, and operational issues. On occasion, the separate Boards establish joint committees to address issues of overlapping consequences for the Fidelity funds overseen by each Board.
The Trustees operate using a system of committees to facilitate the timely and efficient consideration of all matters of importance to the Trustees, the fund, and fund shareholders and to facilitate compliance with legal and regulatory requirements and oversight of the fund's activities and associated risks. The Board, acting through its committees, has charged FMR and its affiliates with (i) identifying events or circumstances the occurrence of which could have demonstrably adverse effects on the fund's business and/or reputation; (ii) implementing processes and controls to lessen the possibility that such events or circumstances occur or to mitigate the effects of such events or circumstances if they do occur; and (iii) creating and maintaining a system designed to evaluate continuously business and market conditions in order to facilitate the identification and implementation processes described in (i) and (ii) above. Because the day-to-day operations and activities of the fund are carried out by or through FMR, its affiliates and other service providers, the fund's exposure to risks is mitigated but not eliminated by the processes overseen by the Trustees. While each of the Board's committees has responsibility for overseeing different aspects of the fund's activities, oversight is exercised primarily through the Operations, Audit, and Compliance Committees. In addition, the Independent Trustees have worked with FMR to enhance the Board's oversight of investment and financial risks, legal and regulatory risks, technology risks, and operational risks, including the development of additional risk reporting to the Board. For example, a working group comprised of Independent Trustees and FMR has worked and continues to work to review the Fidelity funds' valuation-related activities, reporting and risk management. Appropriate personnel, including but not limited to the fund's Chief Compliance Officer (CCO), FMR's internal auditor, the independent accountants, the fund's Treasurer and portfolio management personnel, make periodic reports to the Board's committees, as appropriate, including an annual review of FMR's risk management program for the Fidelity funds. The responsibilities of each standing committee, including their oversight responsibilities, are described further under "Standing Committees of the Fund's Trustees."
Annual Report
Trustees and Officers - continued
The fund's Statement of Additional Information (SAI) includes more information about the Trustees. To request a free copy, call Fidelity at 1-800-208-0098.
Interested Trustees*:
Correspondence intended for each Trustee who is an interested person may be sent to Fidelity Investments, 82 Devonshire Street, Boston, Massachusetts 02109.
Name, Age; Principal Occupations and Other Relevant Experience+ |
James C. Curvey (77) |
| Year of Election or Appointment: 2007 Mr. Curvey is Trustee and Chairman of the Board of Trustees of certain Trusts. Mr. Curvey also serves as Trustee (2007-present) of other investment companies advised by FMR. Mr. Curvey is a Director of Fidelity Investments Money Management, Inc. (2009-present), Director of Fidelity Research & Analysis Co. (2009-present) and Director of FMR and FMR Co., Inc. (2007-present). Mr. Curvey is also Vice Chairman (2007-present) and Director of FMR LLC. In addition, Mr. Curvey serves as an Overseer for the Boston Symphony Orchestra and a member of the Trustees of Villanova University. Previously, Mr. Curvey was the Vice Chairman (2006-2007) and Director (2000-2007) of FMR Corp. |
Ronald P. O'Hanley (55) |
| Year of Election or Appointment: 2011 Mr. O'Hanley is Director of FMR Co., Inc. (2010-present), Director of Fidelity Investments Money Management, Inc. (2010-present), Director of Fidelity Research & Analysis Company (2010-present), President of Fidelity Asset Management and Corporate Services and a member of Fidelity's Executive Committee (2010-present). Previously, Mr. O'Hanley served as President and Chief Executive Officer of BNY Mellon Asset Management (2007-2010). Mr. O'Hanley also served as Vice Chairman of Bank New York Mellon Corp. and a member of that firm's Executive Committee. Prior to the 2007 merger of The Bank of New York and Mellon Financial Corporation, he was Vice Chairman of Mellon Financial Corporation and President and Chief Executive Officer of Mellon Asset Management. He joined Mellon in February 1997. Mr. O'Hanley currently serves as Chairman of the Boston Public Library Foundation Board of Directors and sits on the Board of Directors of Beth Israel Deaconess Medical Center, the Board of Trustees of the Marine Biological Laboratory and the Advisory Board of the Maxwell School of Citizenship and Public Administration at Syracuse University. Mr. O'Hanley also chairs the Council on Asset Management for the Financial Services Roundtable and is a member of the Board of Directors of Institutional Investor's U.S. Institute. |
* Trustees have been determined to be "Interested Trustees" by virtue of, among other things, their affiliation with the trust or various entities under common control with FMR.
+ The information above includes each Trustee's principal occupation during the last five years and other information relating to the experience, attributes, and skills relevant to each Trustee's qualifications to serve as a Trustee, which led to the conclusion that each Trustee should serve as a Trustee for the fund.
Annual Report
Trustees and Officers - continued
Independent Trustees:
Correspondence intended for each Independent Trustee (that is, the Trustees other than the Interested Trustees) may be sent to Fidelity Investments, P.O. Box 55235, Boston, Massachusetts 02205-5235.
Name, Age; Principal Occupations and Other Relevant Experience+ |
Dennis J. Dirks (64) |
| Year of Election or Appointment: 2005 Prior to his retirement in May 2003, Mr. Dirks was Chief Operating Officer and a member of the Board of The Depository Trust & Clearing Corporation (DTCC). He also served as President, Chief Operating Officer, and Board member of The Depository Trust Company (DTC) and President and Board member of the National Securities Clearing Corporation (NSCC). In addition, Mr. Dirks served as Chief Executive Officer and Board member of the Government Securities Clearing Corporation, Chief Executive Officer and Board member of the Mortgage-Backed Securities Clearing Corporation, as a Trustee and a member of the Finance Committee of Manhattan College (2005-2008), and as a Trustee and a member of the Finance Committee of AHRC of Nassau County (2006-2008). Mr. Dirks is a member of the Independent Directors Council (IDC) Governing Council (2010-present) and Board of Directors for The Brookville Center for Children's Services, Inc. (2009-present). |
Alan J. Lacy (58) |
| Year of Election or Appointment: 2008 Mr. Lacy serves as Senior Adviser (2007-present) of Oak Hill Capital Partners, L.P. (private equity). Mr. Lacy also served as Chief Executive Officer (2000-2005) and Vice Chairman (2005-2006) of Sears Holdings Corporation and Sears, Roebuck and Co. (retail). In addition, Mr. Lacy serves as a member of the Board of Directors of Dave & Buster's Entertainment, Inc. (restaurant and entertainment complexes, 2010-present), Earth Fare, Inc. (retail grocery, 2012-present), The Hillman Companies, Inc. (hardware wholesalers, 2010-present), and Bristol-Myers Squibb Company (global pharmaceuticals, 2007-present). Mr. Lacy is a member of the Board of Trustees of The National Parks Conservation Association (2006-present). Previously, Mr. Lacy served as Chairman of the Board of Trustees of the National Parks Conservation Association (2008-2011) and as a member of the Board of Directors for the Western Union Company (global money transfer, 2006-2011). |
Ned C. Lautenbach (68) |
| Year of Election or Appointment: 2000 Mr. Lautenbach is Chairman of the Independent Trustees of the Equity and High Income Funds (2006-present). Mr. Lautenbach currently serves as the Lead Director of the Eaton Corporation Board of Directors (diversified industrial, 1997-present). Mr. Lautenbach is Chairman of the Board of Directors of the Philharmonic Center for the Arts in Naples, Florida (2012-present) and a member of the Council on Foreign Relations (1994-present). Previously, Mr. Lautenbach was a Partner/Advisory Partner at Clayton, Dubilier & Rice, LLC (private equity investment, 1998-2010), as well as a Director of Sony Corporation (2006-2007). |
Joseph Mauriello (67) |
| Year of Election or Appointment: 2008 Prior to his retirement in January 2006, Mr. Mauriello served in numerous senior management positions including Deputy Chairman and Chief Operating Officer (2004-2005), and Vice Chairman of Financial Services (2002-2004) of KPMG LLP US (professional services, 1965-2005). Mr. Mauriello currently serves as a member of the Board of Directors of XL Group plc. (global insurance and re-insurance, 2006-present). Previously, Mr. Mauriello served as a Director of the Hamilton Funds of the Bank of New York (2006-2007) and of Arcadia Resources Inc. (health care services and products, 2007-2012). |
Robert W. Selander (61) |
| Year of Election or Appointment: 2011 Previously, Mr. Selander served as a Member of the Advisory Board of Fidelity's Equity and High Income Funds (2011), Executive Vice Chairman (2010), Chief Executive Officer (2009-2010), and President and Chief Executive Officer (1997-2009) of Mastercard, Inc. |
Cornelia M. Small (68) |
| Year of Election or Appointment: 2005 Ms. Small is a member of the Board of Directors of the Teagle Foundation (2009-present). Ms. Small is also a member of the Investment Committee, and Chair (2008-present) and a member of the Board of Trustees of Smith College. In addition, Ms. Small serves on the Investment Committee of the Berkshire Taconic Community Foundation (2008-present). Previously, Ms. Small served as Chairperson of the Investment Committee (2002-2008) of Smith College. In addition, Ms. Small served as Chief Investment Officer, Director of Global Equity Investments, and a member of the Board of Directors of Scudder, Stevens & Clark and Scudder Kemper Investments. |
William S. Stavropoulos (73) |
| Year of Election or Appointment: 2002 Mr. Stavropoulos is Vice Chairman of the Independent Trustees of the Equity and High Income Funds (2006-present). Mr. Stavropoulos serves as President and Founder of the Michigan Baseball Foundation, the Great Lakes Loons (2007-present). Mr. Stavropoulos is Chairman Emeritus of the Board of Directors of The Dow Chemical Company, where he previously served in numerous senior management positions, including President, CEO (1995-2000; 2002-2004), Chairman of the Executive Committee (2000-2006), and as a member of the Board of Directors (1990-2006). Currently, Mr. Stavropoulos is Chairman of Univar (global distributor of commodity and specialty chemicals, 2010-present), a Director of Teradata Corporation (data warehousing and technology solutions, 2008-present), Chemical Financial Corporation, Maersk Inc. (industrial conglomerate), Tyco International, Inc. (multinational manufacturing and services, 2007-present), and a member of the Advisory Board for Metalmark Capital (private equity investment, 2005-present). Mr. Stavropoulos is a special advisor to Clayton, Dubilier & Rice, LLC (private equity investment). In addition, Mr. Stavropoulos is a member of the University of Notre Dame Advisory Council for the College of Science. |
David M. Thomas (63) |
| Year of Election or Appointment: 2008 Previously, Mr. Thomas served as Executive Chairman (2005-2006) and Chairman and Chief Executive Officer (2000-2005) of IMS Health, Inc. (pharmaceutical and healthcare information solutions). In addition, Mr. Thomas serves as a member of the Board of Directors of Fortune Brands, Inc. (consumer products), and Interpublic Group of Companies, Inc. (marketing communication, 2004-present). |
Michael E. Wiley (61) |
| Year of Election or Appointment: 2008 Mr. Wiley also serves as a Director of Asia Pacific Exploration Consolidated (international oil and gas exploration and production, 2008-present). Mr. Wiley serves as a Director of Tesoro Corporation (independent oil refiner and marketer, 2005-present), and a Director of Bill Barrett Corporation (exploration and production, 2005-present). In addition, Mr. Wiley also serves as a Director of Post Oak Bank (privately-held bank, 2004-present). Previously, Mr. Wiley served as a member of the Board of Trustees of the University of Tulsa (2000-2006; 2007-2010), as a Senior Energy Advisor of Katzenbach Partners, LLC (consulting, 2006-2007), as an Advisory Director of Riverstone Holdings (private investment), Chairman, President, and CEO of Baker Hughes, Inc. (oilfield services, 2000-2004), and as Director of Spinnaker Exploration Company (exploration and production, 2001-2005). |
Annual Report
+ The information above includes each Trustee's principal occupation during the last five years and other information relating to the experience, attributes, and skills relevant to each Trustee's qualifications to serve as a Trustee, which led to the conclusion that each Trustee should serve as a Trustee for the fund.
Advisory Board Members and Executive Officers:
Correspondence intended for David A. Rosow and Garnett A. Smith may be sent to Fidelity Investments, P.O. Box 55235, Boston, Massachusetts 02205-5235. Correspondence intended for each executive officer, Edward C. Johnson 3d, and Peter S. Lynch may be sent to Fidelity Investments, 82 Devonshire Street, Boston, Massachusetts 02109.
Name, Age; Principal Occupation |
Edward C. Johnson 3d (82) |
| Year of Election or Appointment: 2011 Member of the Advisory Board of Fidelity's Equity and High Income Funds. Mr. Johnson serves as Chief Executive Officer, Chairman, and a Director of FMR LLC, and also serves as Chairman and Director of FIL Limited. Previously, Mr. Johnson served as a Trustee and Chairman of the Board of certain Fidelity Trusts, Chairman and a Director of FMR, Chairman and a Director of FMR Co., Inc., and President of FMR LLC (2006-2007). |
Peter S. Lynch (68) |
| Year of Election or Appointment: 2003 Member of the Advisory Board of Fidelity's Equity and High Income Funds. Mr. Lynch is Vice Chairman and a Director of FMR and FMR Co., Inc. In addition, Mr. Lynch serves as a Trustee of Boston College and as the Chairman of the Inner-City Scholarship Fund. Previously, Mr. Lynch served on the Special Olympics International Board of Directors (1997-2006). |
David A. Rosow (69) |
| Year of Election or Appointment: 2012 Member of the Advisory Board of Fidelity's Equity and High Income Funds. Chairman and Chief Executive Officer of International Golf Group, Inc. (golf course development, 1990-present). Previously, Mr. Rosow served as Chairman and Chief Executive Officer of Rosow & Company, Inc. (private investment company, 1989-2011), a Lead Director of Hudson United Bancorp (2001-2006) and as a Director of TD Banknorth (1996-2006). In addition, Mr. Rosow is a member (2008-present) and President (2009-present) of the Town Council of Palm Beach, Florida. |
Garnett A. Smith (64) |
| Year of Election or Appointment: 2012 Member of the Advisory Board of Fidelity's Equity and High Income Funds. Prior to Mr. Smith's retirement, he served as Chairman and Chief Executive Officer of Inbrand Corp. (manufacturer of personal absorbent products, 1990-1997). He also served as President (1986-1990) of Inbrand Corp. Prior to his employment with Inbrand Corp., he was employed by a retail fabric chain and North Carolina National Bank. In addition, Mr. Smith is a board member of the Jackson Hole Land Trust (2009-present). |
Kenneth B. Robins (42) |
| Year of Election or Appointment: 2008 President and Treasurer of Fidelity's Equity and High Income Funds. Mr. Robins also serves as President and Treasurer (2010-present) and Assistant Treasurer (2009-present) of other Fidelity funds and is an employee of Fidelity Investments (2004-present). Previously, Mr. Robins served as Deputy Treasurer of the Fidelity funds (2005-2008) and Treasurer and Chief Financial Officer of The North Carolina Capital Management Trust: Cash and Term Portfolios (2006-2008). |
Brian B. Hogan (47) |
| Year of Election or Appointment: 2009 Vice President of Equity and High Income Funds. Mr. Hogan also serves as President of FMR's Equity Division (2009-present). Previously, Mr. Hogan served as Senior Vice President, Equity Research of FMR (2006-2009) and as a portfolio manager. |
Thomas C. Hense (48) |
| Year of Election or Appointment: 2008 or 2010 Vice President of Fidelity's High Income (2008), Small Cap (2008), and Value (2010) Funds. Previously, Mr. Hense served as a portfolio manager for Fidelity's Institutional Money Management Group (Pyramis) (2003-2008). |
Scott C. Goebel (44) |
| Year of Election or Appointment: 2008 Secretary and Chief Legal Officer (CLO) of the Fidelity funds. Mr. Goebel also serves as Secretary of Fidelity Investments Money Management, Inc. (FIMM) (2010-present) and Fidelity Research and Analysis Company (FRAC) (2010-present); Secretary and CLO of The North Carolina Capital Management Trust: Cash and Term Portfolios (2008-present); General Counsel, Secretary, and Senior Vice President of FMR (2008-present) and FMR Co., Inc. (2008-present); employed by FMR LLC or an affiliate (2001-present); Chief Legal Officer of Fidelity Management & Research (Hong Kong) Limited (2008-present) and Assistant Secretary of Fidelity Management & Research (Japan) Inc. (2008-present), and Fidelity Management & Research (U.K.) Inc. (2008-present). Previously, Mr. Goebel served as Assistant Secretary of FIMM (2008-2010), FRAC (2008-2010), and the Funds (2007-2008) and as Vice President and Secretary of Fidelity Distributors Corporation (FDC) (2005-2007). |
William C. Coffey (43) |
| Year of Election or Appointment: 2009 Assistant Secretary of Fidelity's Equity and High Income Funds. Mr. Coffey also serves as Senior Vice President and Deputy General Counsel of FMR LLC (2010-present), and is an employee of Fidelity Investments. Previously, Mr. Coffey served as Vice President and Associate General Counsel of FMR LLC (2005-2009). |
Elizabeth Paige Baumann (44) |
| Year of Election or Appointment: 2012 Anti-Money Laundering (AML) Officer of the Fidelity funds. Ms. Baumann also serves as AML Officer of The North Carolina Capital Management Trust: Cash and Term Portfolios (2012-present), Chief AML Officer of FMR LLC (2012-present), and is an employee of Fidelity Investments. Previously, Ms. Baumann served as Vice President and Deputy Anti-Money Laundering Officer (2007-2012). |
Christine Reynolds (53) |
| Year of Election or Appointment: 2008 Chief Financial Officer of the Fidelity funds. Ms. Reynolds became President of Fidelity Pricing and Cash Management Services (FPCMS) in August 2008. Ms. Reynolds served as Chief Operating Officer of FPCMS (2007-2008). Previously, Ms. Reynolds served as President, Treasurer, and Anti-Money Laundering officer of the Fidelity funds (2004-2007). |
Joseph A. Hanlon (44) |
| Year of Election or Appointment: 2012 Chief Compliance Officer of Fidelity's Equity and High Income Funds. Mr. Hanlon serves as Compliance Officer of FMR, FMR Co., Inc., Fidelity Investments Money Management, Inc. (FIMM), Fidelity Research and Analysis Company (FRAC), Fidelity Management & Research (Japan) Inc., Fidelity Management & Research (U.K.) Inc., Fidelity Management & Research (Hong Kong), and Strategic Advisers, Inc. (2009-present), as Senior Vice President of the Fidelity Asset Management Division (2009-present), and is an employee of Fidelity Investments. |
Joseph F. Zambello (55) |
| Year of Election or Appointment: 2011 Deputy Treasurer of the Fidelity funds. Mr. Zambello is an employee of Fidelity Investments. Previously, Mr. Zambello served as Vice President of FMR's Program Management Group (2009-2011) and Vice President of the Transfer Agent Oversight Group (2005-2009). |
Adrien E. Deberghes (44) |
| Year of Election or Appointment: 2008 Deputy Treasurer of Fidelity's Equity and High Income Funds. Mr. Deberghes also serves as Vice President (2011-present) and Assistant Treasurer (2010-present) of other Fidelity funds, and is an employee of Fidelity Investments (2008-present). Previously, Mr. Deberghes served as Senior Vice President of Mutual Fund Administration at State Street Corporation (2007-2008), Senior Director of Mutual Fund Administration at Investors Bank & Trust (2005-2007), and Director of Finance for Dunkin' Brands (2000-2005). |
Stephanie J. Dorsey (43) |
| Year of Election or Appointment: 2010 Assistant Treasurer of Fidelity's Equity and High Income Funds. Ms. Dorsey also serves as Deputy Treasurer of other Fidelity funds (2008-present) and is an employee of Fidelity Investments (2008-present). Previously, Ms. Dorsey served as Treasurer (2004-2008) of the JPMorgan Mutual Funds and Vice President (2004-2008) of JPMorgan Chase Bank. |
John R. Hebble (54) |
| Year of Election or Appointment: 2009 Assistant Treasurer of Fidelity's Equity and High Income Funds. Mr. Hebble also serves as President (2011-present), Treasurer, and Chief Financial Officer of The North Carolina Capital Management Trust: Cash and Term Portfolios (2008-present), President and Treasurer of other Fidelity funds (2008-present) and is an employee of Fidelity Investments. |
Gary W. Ryan (53) |
| Year of Election or Appointment: 2005 Assistant Treasurer of the Fidelity funds. Mr. Ryan is an employee of Fidelity Investments. Previously, Mr. Ryan served as Vice President of Fund Reporting in Fidelity Pricing and Cash Management Services (FPCMS) (1999-2005). |
Jonathan Davis (44) |
| Year of Election or Appointment: 2010 Assistant Treasurer of the Fidelity funds. Mr. Davis is also Assistant Treasurer of Fidelity Rutland Square Trust II and Fidelity Commonwealth Trust II. Mr. Davis is an employee of Fidelity Investments. Previously, Mr. Davis served as Vice President and Associate General Counsel of FMR LLC (2003-2010). |
Annual Report
The Board of Trustees of Fidelity Small Cap Value Fund voted to pay to shareholders of record at the opening of business, the following distributions per share derived from capital gains realized from sales of portfolio securities, and dividends derived from net investment income:
| Pay Date | Record Date | Dividends | Capital Gains |
Class A | 09/10/12 | 09/07/12 | $0.000 | $0.411 |
Class T | 09/10/12 | 09/07/12 | $0.000 | $0.411 |
Class B | 09/10/12 | 09/07/12 | $0.000 | $0.411 |
Class C | 09/10/12 | 09/07/12 | $0.000 | $0.411 |
Class A designates 100% of the dividends distributed during the fiscal year as qualifying for the dividends-received deduction for corporate shareholders.
Class A designates 100% of the dividends distributed during the fiscal year as amounts which can be taken into account as a dividend for the purposes of the maximum rate under section 1(h)(11) of the Internal Revenue Code.
The fund hereby designates as a capital gain dividend with respect to the taxable year ended July 31,2012, $98,274,256, or, if subsequently determined to be different, the net capital gain of such year.
The fund will notify shareholders in January 2013 of amounts for use in preparing 2012 income tax returns.
Annual Report
Board Approval of Investment Advisory Contracts and Management Fees
Fidelity Small Cap Value Fund
Each year, the Board of Trustees, including the Independent Trustees (together, the Board), votes on the renewal of the management contract and sub-advisory agreements (together, the Advisory Contracts) for the fund. The Board, assisted by the advice of fund counsel and Independent Trustees' counsel, requests and considers a broad range of information relevant to the renewal of the Advisory Contracts throughout the year.
The Board meets regularly and, at each of its meetings, considers factors that are relevant to its annual consideration of the renewal of the fund's Advisory Contracts, including the services and support provided to the fund and its shareholders. The Board has established various standing committees, each composed of and chaired by Independent Trustees with varying backgrounds, to which the Board has assigned specific subject matter responsibilities in order to enhance effective decision-making by the Board. The Board, acting directly and through its Committees, requests and receives information concerning the annual consideration of the renewal of the fund's Advisory Contracts. The Board also meets as needed to consider matters specifically related to the Board's annual consideration of the renewal of Advisory Contracts. Members of the Board may also meet with trustees of other Fidelity funds through ad hoc joint committees to discuss certain matters relevant to the Fidelity funds.
At its July 2012 meeting, the Board of Trustees, including the Independent Trustees, unanimously determined to renew the fund's Advisory Contracts. In reaching its determination, the Board considered all factors it believed relevant, including (i) the nature, extent, and quality of the services to be provided to the fund and its shareholders (including the investment performance of the fund); (ii) the competitiveness of the fund's management fee and total expense ratio relative to peer funds; (iii) the total costs of the services to be provided by and the profits to be realized by Fidelity from its relationship with the fund; (iv) the extent to which economies of scale exist and would be realized as the fund grows; and (v) whether fee levels reflect these economies of scale, if any, for the benefit of fund shareholders.
In considering whether to renew the Advisory Contracts for the fund, the Board reached a determination, with the assistance of fund counsel and Independent Trustees' counsel and through the exercise of its business judgment, that the renewal of the Advisory Contracts is in the best interests of the fund and its shareholders and that the compensation payable under the Advisory Contracts is fair and reasonable. The Board's decision to renew the Advisory Contracts was not based on any single factor, but rather was based on a comprehensive consideration of all the information provided to the Board at its meetings throughout the year. The Board, in reaching its determination to renew the Advisory Contracts, is aware that shareholders in the fund have a broad range of investment choices available to them, including a wide choice among mutual funds offered by Fidelity's competitors, and that the fund's shareholders, who have the opportunity to review and weigh the disclosure provided by the fund in its prospectus and other public disclosures, have chosen to invest in this fund, managed by Fidelity.
Annual Report
Board Approval of Investment Advisory Contracts and
Management Fees - continued
Nature, Extent, and Quality of Services Provided. The Board considered the staffing within the investment adviser, FMR, and the sub-advisers (together, the Investment Advisers), including the backgrounds of the fund's investment personnel, and also considered the fund's investment objective, strategies, and related investment philosophy. The Independent Trustees also had discussions with senior management of Fidelity's investment operations and investment groups. The Board considered the structure of the portfolio manager compensation program and whether this structure provides appropriate incentives to act in the best interests of the fund.
Resources Dedicated to Investment Management and Support Services. The Board and the Fund Oversight and Research Committees reviewed the general qualifications and capabilities of the Investment Advisers' investment staff, including its size, education, experience, and resources, as well as the Investment Advisers' approach to recruiting, training, managing, and compensating investment personnel. The Board also noted that FMR has continued to increase the resources devoted to non-U.S. offices, including expansion of Fidelity's global investment organization. The Board noted that Fidelity's analysts have extensive resources, tools and capabilities that allow them to conduct sophisticated quantitative and fundamental analysis, as well as credit analysis of issuers, counterparties and guarantors. The Board also believes that Fidelity's investment professionals have sufficient access to global information and data so as to provide competitive investment results over time, and that those professionals also have access to sophisticated tools that permit them to assess portfolio construction and risk and performance attribution characteristics continuously, as well as to transmit new information and research conclusions rapidly around the world. Additionally, in its deliberations, the Board considered the Investment Advisers' trading and risk management capabilities and resources, which are an integral part of the investment management process.
Shareholder and Administrative Services. The Board considered (i) the nature, extent, quality, and cost of advisory, administrative, and shareholder services performed by the Investment Advisers and their affiliates under the Advisory Contracts and under separate agreements covering transfer agency, pricing and bookkeeping, and securities lending services for the fund; (ii) the nature and extent of the supervision of third party service providers, principally custodians and subcustodians; and (iii) the resources devoted to, and the record of compliance with, the fund's compliance policies and procedures. The Board also reviewed the allocation of fund brokerage, including allocations to brokers affiliated with the Investment Advisers, the use of brokerage commissions to pay fund expenses, and the use of "soft" commission dollars to pay for research services.
Annual Report
The Board noted that the growth of fund assets over time across the complex allows Fidelity to reinvest in the development of services designed to enhance the value or convenience of the Fidelity funds as investment vehicles. These services include 24-hour access to account information and market information through telephone representatives and over the Internet, investor education materials and asset allocation tools, and the expanded availability of Fidelity Investor Centers.
Investment in a Large Fund Family. The Board considered the benefits to shareholders of investing in a Fidelity fund, including the benefits of investing in a fund that is part of a large family of funds offering a variety of investment disciplines and providing a large variety of mutual fund investor services. The Board noted that Fidelity had taken, or had made recommendations that resulted in the Fidelity funds taking, a number of actions over the previous year that benefited particular funds, including (i) continuing to dedicate additional resources to investment research and support of the senior management team that oversees asset management; (ii) persisting in efforts to enhance Fidelity's research capabilities, in particular, international research; (iii) launching new funds and making other enhancements to meet client needs for global and income-oriented solutions; (iv) continuing to launch dedicated lower cost underlying funds to meet investment management's portfolio construction needs related to expanding underlying fund options, specifically for the Freedom Fund product lines; (v) adopting a "Stock Selector" sector neutral investment approach and employing a team of portfolio managers who are sector specialists to manage certain funds; (vi) rationalizing product lines and gaining increased efficiencies through the mergers of several funds into other funds; (vii) strengthening the Spartan Index Fund product line by adding new funds and/or new low-cost institutional share classes, restructuring fund expenses to accommodate new classes, and reducing investment minimums for certain classes of shares; (viii) modifying the eligibility criteria for Institutional Class shares to increase their appeal to government entities and charitable investors; and (ix) reducing certain transfer agent fee rates.
Investment Performance. The Board considered whether the fund has operated in accordance with its investment objective, as well as its record of compliance with its investment restrictions. It also reviewed the fund's absolute investment performance for each class, as well as the fund's relative investment performance for each class measured over multiple periods against (i) a broad-based securities market index, and (ii) a peer group of mutual funds deemed appropriate by Fidelity and reviewed by the Board. The following charts considered by the Board show, over the one-, three-, and five-year periods ended December 31, 2011, the cumulative total returns of Institutional Class (Class I) and Class B of the fund, the cumulative total returns of a broad-based securities market index ("benchmark"), and a range of cumulative total returns of a peer group of mutual funds identified by Morningstar, Inc. as having an investment style similar to that of the fund based on underlying portfolio holdings. The returns of Institutional Class (Class I) and Class B show the performance of the highest and lowest performing classes, respectively (based on five-year performance). The box within each chart shows the 25th percentile return (top of box) and the 75th percentile return (bottom of box) of the peer group. Returns shown above the box are in the first quartile and returns shown below the box are in the fourth quartile. The percentage beaten numbers noted below each chart correspond to the percentile box and represent the percentage of funds in the peer group whose performance was equal to or lower than that of the class indicated.
Annual Report
Board Approval of Investment Advisory Contracts and
Management Fees - continued
Fidelity Small Cap Value Fund

The Board reviewed the fund's relative investment performance against its peer group and noted that the performance of Institutional Class (Class I) of the fund was in the second quartile for the one- and three-year periods and the first quartile for the five-year period. The Board also noted that the investment performance of Institutional Class (Class I) of the fund compared favorably to its benchmark for all the periods shown. The Board considered that the variations in performance among the fund's classes reflect the variations in class expenses, which result in lower performance for higher expense classes. The Board also reviewed the fund's performance since inception as well as performance in the current year.
The Board also considered that the fund's management fee is subject to upward or downward adjustment depending upon whether, and to what extent, the fund's investment performance for the performance period exceeds, or is exceeded by, the record (over the same period) of a Board-approved performance adjustment index. The Board noted that the performance adjustment provides FMR with a strong economic incentive to seek to achieve superior performance for the fund's shareholders and helps to more closely align the interests of FMR and the fund's shareholders.
Annual Report
Based on its review, the Board concluded that the nature, extent, and quality of services provided to the fund under the Advisory Contracts should benefit the fund's shareholders.
Competitiveness of Management Fee and Total Expense Ratio. The Board considered the fund's management fee and total expense ratio compared to "mapped groups" of competitive funds and classes. Fidelity creates "mapped groups" by combining similar Lipper investment objective categories that have comparable management fee characteristics. Combining Lipper investment objective categories aids the Board's management fee and total expense ratio comparisons by broadening the competitive group used for comparison and by reducing the number of universes to which various Fidelity funds are compared.
Management Fee. The Board considered two proprietary management fee comparisons for the 12-month periods shown in the chart below. The group of Lipper funds used by the Board for management fee comparisons is referred to below as the "Total Mapped Group." The Total Mapped Group comparison focuses on a fund's standing relative to the total universe of comparable funds available to investors in terms of gross management fees before expense reimbursements or caps, and without giving effect to the fund's performance adjustment. "TMG %" represents the percentage of funds in the Total Mapped Group that had management fees that were lower than the fund's. For example, a TMG % of 13% means that 87% of the funds in the Total Mapped Group had higher management fees than the fund. The "Asset-Size Peer Group" (ASPG) comparison focuses on a fund's standing relative to non-Fidelity funds similar in size to the fund within the Total Mapped Group. The ASPG represents at least 15% of the funds in the Total Mapped Group with comparable asset size and management fee characteristics, subject to a minimum of 50 funds (or all funds in the Total Mapped Group if fewer than 50). Additional information, such as the ASPG quartile in which the fund's management fee ranked and the impact of the fund's performance adjustment, is also included in the chart and considered by the Board.
Annual Report
Board Approval of Investment Advisory Contracts and
Management Fees - continued
Fidelity Small Cap Value Fund

The Board noted that the fund's management fee ranked below the median of its Total Mapped Group and below the median of its ASPG for 2011. The Board also noted the effect of the fund's positive performance adjustment on the fund's management fee ranking. The Board noted that the performance adjustment for each year represents calculations for performance periods that differ from the periods shown in the performance charts above.
Based on its review, the Board concluded that the fund's management fee is fair and reasonable in light of the services that the fund receives and the other factors considered.
Total Expense Ratio. In its review of each class's total expense ratio, the Board considered the fund's management fee as well as other fund or class expenses, as applicable, such as transfer agent fees, pricing and bookkeeping fees, fund-paid 12b-1 fees, and custodial, legal, and audit fees. The Board also noted the effects of any waivers and reimbursements on fees and expenses, as well as the impact of the fund's performance adjustment. As part of its review, the Board also considered the current and historical total expense ratios of each class of the fund compared to competitive fund median expenses. Each class of the fund is compared to those funds and classes in the Total Mapped Group (used by the Board for management fee comparisons) that have a similar sales load structure.
The Board noted that the total expense ratio of each of the retail class and Class F ranked below its competitive median for 2011, the total expense ratio of Institutional Class ranked equal to its competitive median for 2011, and the total expense ratio of each of Class A, Class T, Class B, and Class C ranked above its competitive median for 2011. The Board considered that various factors, including 12b-1 fees, positive or negative performance adjustments, and relatively higher other expenses in the case of small fund size, can affect total expense ratios. The Board noted that the total expense ratio of Class T was above the competitive median primarily because of higher 12b-1 fees on Class T. Class T has a higher 12b-1 fee, but a lower front-end sales charge, than traditionally priced front-end sales charge classes. The Board considered that Class T is primarily sold load-waived in the retirement plan market where its 0.50% 12b-1 fee is comparable to competing no-load, higher 12b-1 fee classes designed specifically for retirement plans. The Board noted that the fund offers multiple classes, each of which has a different sales load and 12b-1 fee structure, and that the multiple structures are intended to offer a range of pricing options for the intermediary market. The Board also noted that the total expense ratios of the classes vary primarily by the level of their 12b-1 fees, although differences in transfer agent fees may also cause expenses to vary from class to class.
Annual Report
Fees Charged to Other Fidelity Clients. The Board also considered Fidelity fee structures and other information with respect to clients of FMR and its affiliates, such as other mutual funds advised or subadvised by FMR or its affiliates, pension plan clients, and other institutional clients. The Board noted the findings of the 2010 ad hoc joint committee (created with the board of other Fidelity funds), which reviewed and compared Fidelity's institutional investment advisory business with its business of providing services to the Fidelity funds, including the differences in services provided, fees charged, and costs incurred, as well as competition in their respective marketplaces.
Based on its review of total expense ratios and fees charged to other Fidelity clients, the Board concluded that the total expense ratio of each class of the fund was reasonable, although in some cases above the median of the universe presented for comparison, in light of the services that the fund and its shareholders receive and the other factors considered.
Costs of the Services and Profitability. The Board considered the revenues earned and the expenses incurred by Fidelity in conducting the business of developing, marketing, distributing, managing, administering and servicing the fund and its shareholders. The Board also considered the level of Fidelity's profits in respect of all the Fidelity funds.
On an annual basis, FMR presents to the Board Fidelity's profitability for the fund. Fidelity calculates the profitability for each fund, as well as aggregate profitability for groups of Fidelity funds and all Fidelity funds, using a series of detailed revenue and cost allocation methodologies which originate with the books and records of Fidelity on which Fidelity's audited financial statements are based. The Audit Committee of the Board reviews any significant changes from the prior year's methodologies.
Annual Report
Board Approval of Investment Advisory Contracts and
Management Fees - continued
PricewaterhouseCoopers LLP (PwC), independent registered public accounting firm and auditor to Fidelity and certain Fidelity funds, has been engaged annually by the Board as part of the Board's assessment of Fidelity's profitability analysis. PwC's engagement includes the review and assessment of Fidelity's methodologies used in determining the revenues and expenses attributable to Fidelity's mutual fund business, and completion of agreed-upon procedures surrounding the mathematical accuracy of fund profitability and its conformity to allocation methodologies. After considering PwC's reports issued under the engagement and information provided by Fidelity, the Board concluded that while other allocation methods may also be reasonable, Fidelity's profitability methodologies are reasonable in all material respects.
The Board also reviewed Fidelity's non-fund businesses and fall-out benefits related to the mutual fund business as well as cases where Fidelity's affiliates may benefit from or be related to the fund's business.
The Board considered the costs of the services provided by and the profits realized by Fidelity in connection with the operation of the fund and was satisfied that the profitability was not excessive in the circumstances.
Economies of Scale. The Board considered whether there have been economies of scale in respect of the management of the Fidelity funds, whether the Fidelity funds (including the fund) have appropriately benefited from any such economies of scale, and whether there is potential for realization of any further economies of scale. The Board considered the extent to which the fund will benefit from economies of scale through increased services to the fund, through waivers or reimbursements, or through fee or expense reductions. The Board also noted that in 2009, it and the board of other Fidelity funds created an ad hoc committee (the Economies of Scale Committee) to analyze whether FMR attains economies of scale in respect of the management and servicing of the Fidelity funds, whether the Fidelity funds have appropriately benefited from such economies of scale, and whether there is potential for realization of any further economies of scale.
The Board recognized that the fund's management contract incorporates a "group fee" structure, which provides for lower group fee rates as total fund assets under FMR's management increase, and for higher group fee rates as total fund assets under FMR's management decrease. FMR calculates the group fee rates based on a tiered asset "breakpoint" schedule that varies based on asset class. The Board considered that the group fee is designed to deliver the benefits of economies of scale to fund shareholders when total Fidelity fund assets increase, even if assets of any particular fund are unchanged or have declined, because some portion of Fidelity's costs are attributable to services provided to all Fidelity funds, and all funds benefit if those costs can be allocated among more assets. The Board concluded that, given the group fee structure, fund shareholders will benefit from lower management fees as assets under FMR's management increase at the fund complex level, regardless of whether Fidelity achieves any such economies of scale.
Annual Report
The Board concluded, taking into account the analysis of the Economies of Scale Committee, that economies of scale, if any, are being appropriately shared between fund shareholders and Fidelity.
Additional Information Requested by the Board. In order to develop fully the factual basis for consideration of the Fidelity funds' Advisory Contracts, the Board requested and received additional information on certain topics, including (i) fund performance trends, actions to be taken by FMR to improve certain funds' overall performance, and Fidelity's long-term strategies for certain funds; (ii) the potential to further rationalize the Fidelity fund lineup with the possibility of achieving savings for the funds and Fidelity; (iii) Fidelity's compensation structure for portfolio managers and other key investment personnel; (iv) the amount of the investment that each portfolio manager has made in the Fidelity fund(s) that he or she manages; (v) the realization of fall-out benefits in certain Fidelity business units; (vi) Fidelity's group fee structures, the potential impact of regulatory changes on such structures, and the rationale for the individual fee rates of certain funds; (vii) fund profitability methodology, including Fidelity's cost allocation methodology, and the impact of certain factors on fund profitability results; (viii) trends regarding industry use of performance fee structures and the possibility of implementing performance fee structures for additional funds; and (ix) the impact of net redemptions from the Fidelity funds.
Based on its evaluation of all of the conclusions noted above, and after considering all factors it believed relevant, the Board ultimately concluded that the advisory fee structures are fair and reasonable, and that the fund's Advisory Contracts should be renewed.
Annual Report
Investment Adviser
Fidelity Management & Research Company
Boston, MA
Investment Sub-Advisers
FMR Co., Inc.
Fidelity Management & Research
(U.K.) Inc.
Fidelity Management & Research
(Hong Kong) Limited
Fidelity Management & Research
(Japan) Inc.
General Distributor
Fidelity Distributors Corporation
Smithfield, RI
Transfer and Service Agents
Fidelity Investments Institutional
Operations Company, Inc.
Boston, MA
Fidelity Service Company, Inc.
Boston, MA
Custodian
Citibank, N.A.
New York, NY
(Fidelity Investment logo)(registered trademark)
ASCV-UANN-0912
1.803731.107
(Fidelity Investment logo)(registered trademark)
Fidelity Advisor®
Small Cap Value
Fund - Institutional Class
Annual Report
July 31, 2012
(Fidelity Cover Art)
Institutional Class
is a class of Fidelity®
Small Cap Value Fund
Contents
Performance | 4 | How the fund has done over time. |
Management's Discussion of Fund Performance | 5 | The Portfolio Manager's review of fund performance and strategy. |
Shareholder Expense Example | 6 | An example of shareholder expenses. |
Investment Changes | 8 | A summary of major shifts in the fund's investments over the past six months. |
Investments | 9 | A complete list of the fund's investments with their market values. |
Financial Statements | 17 | Statements of assets and liabilities, operations, and changes in net assets, as well as financial highlights. |
Notes | 28 | Notes to the financial statements. |
Report of Independent Registered Public Accounting Firm | 39 | |
Trustees and Officers | 40 | |
Distributions | 52 | |
Board Approval of Investment Advisory Contracts and Management Fees | 53 | |
To view a fund's proxy voting guidelines and proxy voting record for the 12-month period ended June 30, visit http://www.fidelity.com/proxyvotingresults or visit the Securities and Exchange Commission's (SEC) web site at http://www.sec.gov. You may also call 1-877-208-0098 to request a free copy of the proxy voting guidelines.
Standard & Poor's, S&P and S&P 500 are registered service marks of The McGraw-Hill Companies, Inc. and have been licensed for use by Fidelity Distributors Corporation.
Other third party marks appearing herein are the property of their respective owners.
All other marks appearing herein are registered or unregistered trademarks or service marks of FMR LLC or an affiliated company. © 2012 FMR LLC. All rights reserved.
Annual Report
This report and the financial statements contained herein are submitted for the general information of the shareholders of the fund. This report is not authorized for distribution to prospective investors in the fund unless preceded or accompanied by an effective prospectus.
A fund files its complete schedule of portfolio holdings with the SEC for the first and third quarters of each fiscal year on Form N-Q. Forms N-Q are available on the SEC's web site at http://www.sec.gov. A fund's Forms N-Q may be reviewed and copied at the SEC's Public Reference Room in Washington, DC. Information regarding the operation of the SEC's Public Reference Room may be obtained by calling 1-800-SEC-0330. For a complete list of a fund's portfolio holdings, view the most recent holdings listing, semiannual report, or annual report on Fidelity's web site at http://www.fidelity.com, http://www.advisor.fidelity.com, or http://www.401k.com, as applicable.
NOT FDIC INSURED • MAY LOSE VALUE • NO BANK GUARANTEE
Neither the fund nor Fidelity Distributors Corporation is a bank.
Annual Report
Performance: The Bottom Line
Average annual total return reflects the change in the value of an investment, assuming reinvestment of the class' distributions from dividend income and capital gains (the profits earned upon the sale of securities that have grown in value, if any) and assuming a constant rate of performance each year. The $10,000 table and the fund's returns do not reflect the deduction of taxes that a shareholder would pay on fund distributions or the redemption of fund shares. During periods of reimbursement by Fidelity, a fund's total return will be greater than it would be had the reimbursement not occurred. How a fund did yesterday is no guarantee of how it will do tomorrow.
Average Annual Total Returns
Periods ended July 31, 2012 | Past 1
year | Past 5
years | Life of
fundA |
Institutional Class | 3.59% | 3.94% | 8.64% |
A From November 3, 2004.
$10,000 Over Life of Fund
Let's say hypothetically that $10,000 was invested in Fidelity Advisor® Small Cap Value Fund - Institutional Class on November 3, 2004, when the fund started. The chart shows how the value of your investment would have changed, and also shows how the Russell 2000® Value Index performed over the same period.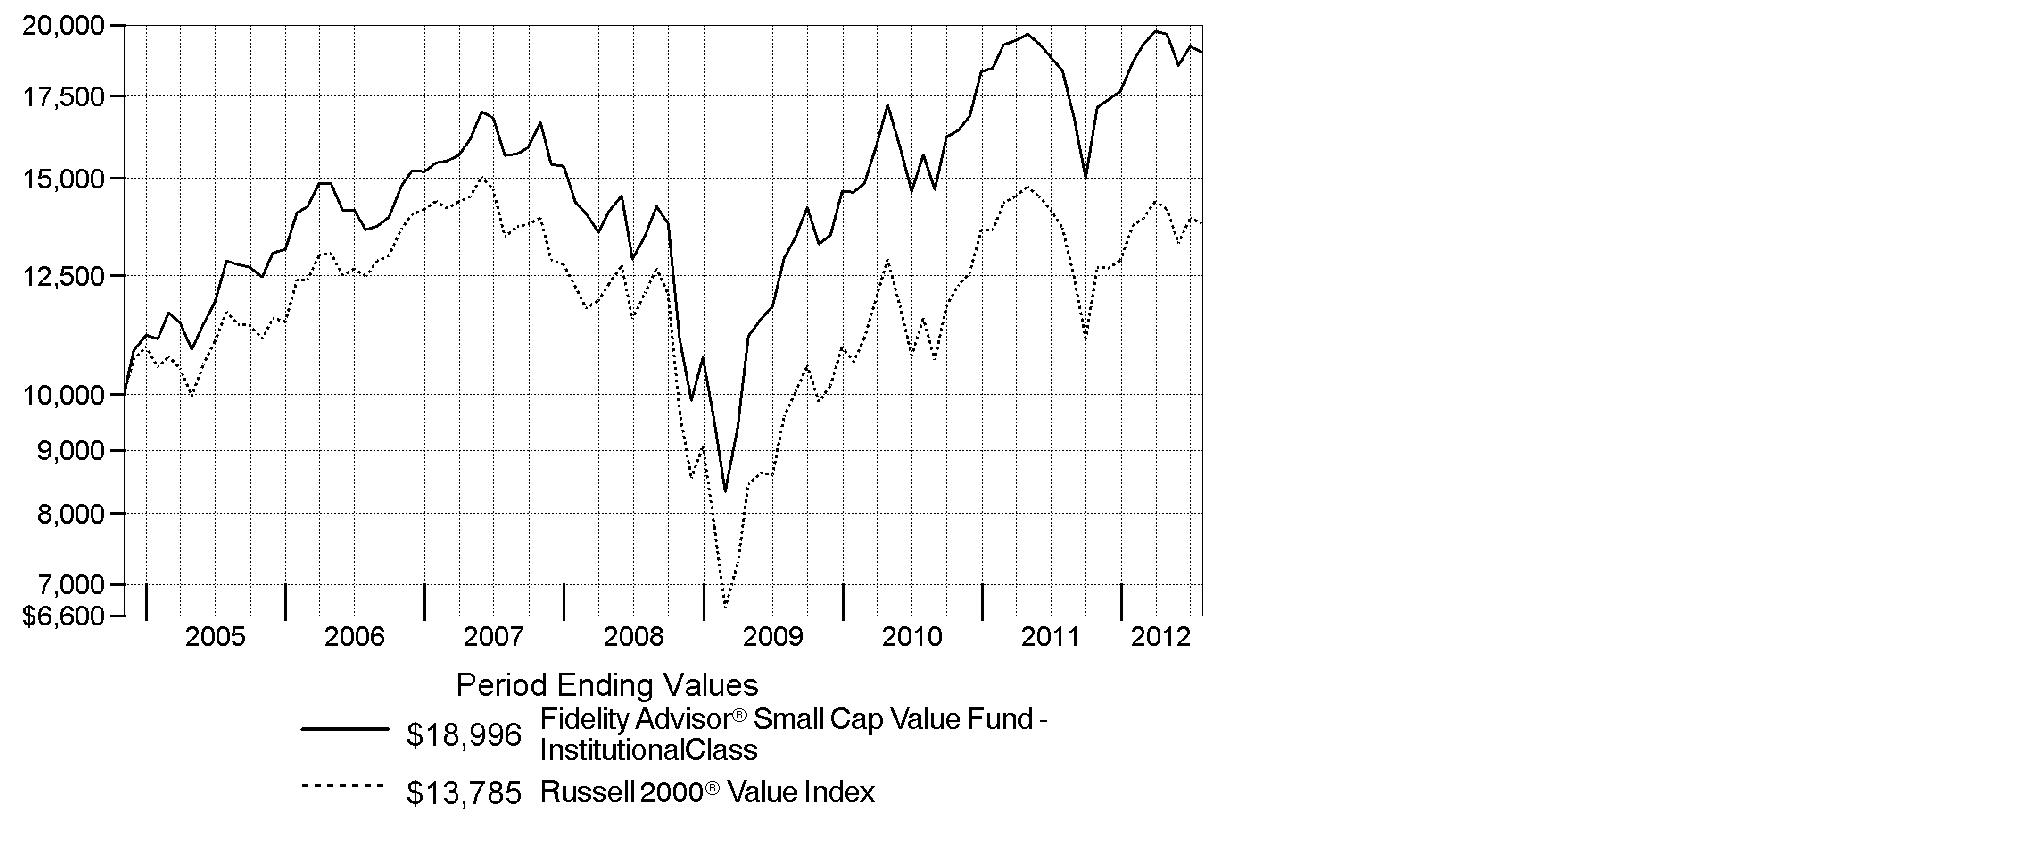
Annual Report
Management's Discussion of Fund Performance
Market Recap: Major U.S. equity benchmarks posted solid gains for the year ending July 31, 2012, amid an uncertain investment environment. The broad-based S&P 500® Index returned 9.13%, while the blue-chip-laden Dow Jones Industrial AverageSM and technology-heavy Nasdaq Composite® Index gained 10.12% and 7.83%, respectively. Volatility spiked during the period's first half, as equities plummeted late last summer on Europe's debt woes, political wrangling over the U.S. debt ceiling, and the sovereign credit-rating downgrade that followed. By October, a seemingly improved U.S. economy rejuvenated stocks, paving the way for major equity benchmarks to post their best first-quarter performance since 1998. However, more eurozone trouble, signs that the U.S. economy had turned sluggish and a slowdown in China caused stocks to slip in May, before a new wave of optimism took hold in June and July. Within the S&P 500®, more-defensive sectors such as telecommunication services (+30%) and consumer staples (+20%) fared best, while materials and energy significantly underperformed, returning -5%. Small- and mid-cap stocks trailed their less-volatile large-cap counterparts, with the Russell 2000® Index adding 0.19% and the Russell Midcap® Index rising 2.28%. Given turmoil and local currency weakness in Europe, foreign developed-markets stocks lost ground, with the MSCI® EAFE® Index returning -11.32%.
Comments from Charles Myers, Portfolio Manager of Fidelity Advisor® Small Cap Value Fund: For the year, the fund's Institutional Class shares gained 3.59%, compared with 0.89% for the Russell 2000® Value Index. On the positive side, stock picking stood out in the consumer discretionary sector, with homebuilders Ryland Group, M.D.C. Holdings and Meritage Homes all adding to results. In industrials, my choices in commercial/professional services and capital goods helped, led by H&E Equipment Services, which rents commercial construction equipment, and commercial furniture manufacturer HNI, the fund's top relative contributor of the year. In health care, managed-care company Centene added value, as did Team Health Holdings, a provider of outsourced clinical services to hospitals. Conversely, by far the most detrimental sector in the portfolio was financials, led on the downside by regional bank TCF Financial. In the energy sector, Superior Energy Services, a provider of oil-field services, and independent oil producer Berry Petroleum were hampered by declining energy prices. Other relative detractors included banana producer Chiquita Brands International and United Stationers, a wholesaler of office stationery and business supplies. Several stocks mentioned were not in the index, and Centene was not held at period end.
The views expressed above reflect those of the portfolio manager(s) only through the end of the period as stated on the cover of this report and do not necessarily represent the views of Fidelity or any other person in the Fidelity organization. Any such views are subject to change at any time based upon market or other conditions and Fidelity disclaims any responsibility to update such views. These views may not be relied on as investment advice and, because investment decisions for a Fidelity fund are based on numerous factors, may not be relied on as an indication of trading intent on behalf of any Fidelity fund.
Annual Report
Shareholder Expense Example
As a shareholder of the Fund, you incur two types of costs: (1) transaction costs, including sales charges (loads) on purchase payments or redemption proceeds, redemption fees and (2) ongoing costs, including management fees, distribution and/or service (12b-1) fees and other Fund expenses. This Example is intended to help you understand your ongoing costs (in dollars) of investing in the Fund and to compare these costs with the ongoing costs of investing in other mutual funds.
The Example is based on an investment of $1,000 invested at the beginning of the period and held for the entire period (February 1, 2012 to July 31, 2012).
Actual Expenses
The first line of the accompanying table for each class of the Fund provides information about actual account values and actual expenses. You may use the information in this line, together with the amount you invested, to estimate the expenses that you paid over the period. Simply divide your account value by $1,000.00 (for example, an $8,600 account value divided by $1,000.00 = 8.6), then multiply the result by the number in the first line for a class of the Fund under the heading entitled "Expenses Paid During Period" to estimate the expenses you paid on your account during this period. A small balance maintenance fee of $12.00 that is charged once a year may apply for certain accounts with a value of less than $2,000. This fee is not included in the table below. If it was, the estimate of expenses you paid during the period would be higher, and your ending account value lower, by this amount. In addition, the Fund, as a shareholder in the underlying Fidelity Central Funds, will indirectly bear its pro-rata share of the fees and expenses incurred by the underlying Fidelity Central Funds. These fees and expenses are not included in the Fund's annualized expense ratio used to calculate the expense estimate in the table below.
Hypothetical Example for Comparison Purposes
The second line of the accompanying table for each class of the Fund provides information about hypothetical account values and hypothetical expenses based on a Class' actual expense ratio and an assumed rate of return of 5% per year before expenses, which is not the Class' actual return. The hypothetical account values and expenses may not be used to estimate the actual ending account balance or expenses you paid for the period. You may use this information to compare the ongoing costs of investing in the Fund and other funds. To do so, compare this 5% hypothetical example with the 5% hypothetical examples that appear in the shareholder reports of the other funds. A small balance maintenance fee of $12.00 that is charged once a year may apply for certain accounts with a value of less than $2,000. This fee is not included in the table below. If it was, the estimate of expenses you paid during the period would be higher, and your ending account value lower, by this amount. In addition, the Fund, as a shareholder in the underlying Fidelity Central Funds, will indirectly bear its pro-rata share of the fees and expenses incurred by the underlying Fidelity Central Funds. These fees and expenses are not included in the Fund's annualized expense ratio used to calculate the expense estimate in the table below.
Please note that the expenses shown in the table are meant to highlight your ongoing costs only and do not reflect any transaction costs. Therefore, the second line of the table is useful in comparing ongoing costs only, and will not help you determine the relative total costs of owning different funds. In addition, if these transactional costs were included, your costs would have been higher.
Annual Report
| Annualized
Expense Ratio | Beginning
Account Value
February 1, 2012 | Ending
Account Value
July 31, 2012 | Expenses Paid
During Period*
February 1, 2012
to July 31, 2012 |
Class A | 1.41% | | | |
Actual | | $ 1,000.00 | $ 1,015.70 | $ 7.07 |
HypotheticalA | | $ 1,000.00 | $ 1,017.85 | $ 7.07 |
Class T | 1.63% | | | |
Actual | | $ 1,000.00 | $ 1,015.20 | $ 8.17 |
HypotheticalA | | $ 1,000.00 | $ 1,016.76 | $ 8.17 |
Class B | 2.16% | | | |
Actual | | $ 1,000.00 | $ 1,012.10 | $ 10.81 |
HypotheticalA | | $ 1,000.00 | $ 1,014.12 | $ 10.82 |
Class C | 2.16% | | | |
Actual | | $ 1,000.00 | $ 1,012.80 | $ 10.81 |
HypotheticalA | | $ 1,000.00 | $ 1,014.12 | $ 10.82 |
Small Cap Value | 1.09% | | | |
Actual | | $ 1,000.00 | $ 1,018.30 | $ 5.47 |
HypotheticalA | | $ 1,000.00 | $ 1,019.44 | $ 5.47 |
Class F | .87% | | | |
Actual | | $ 1,000.00 | $ 1,018.90 | $ 4.37 |
HypotheticalA | | $ 1,000.00 | $ 1,020.54 | $ 4.37 |
Institutional Class | 1.11% | | | |
Actual | | $ 1,000.00 | $ 1,017.60 | $ 5.57 |
HypotheticalA | | $ 1,000.00 | $ 1,019.34 | $ 5.57 |
A 5% return per year before expenses
* Expenses are equal to each Class' annualized expense ratio, multiplied by the average account value over the period, multiplied by 182/366 (to reflect the one-half year period).
Annual Report
Investment Changes (Unaudited)
Top Ten Stocks as of July 31, 2012 |
| % of fund's
net assets | % of fund's net assets
6 months ago |
Superior Energy Services, Inc. | 3.0 | 1.7 |
DCT Industrial Trust, Inc. | 2.8 | 2.7 |
TCF Financial Corp. | 2.7 | 2.4 |
HNI Corp. | 2.7 | 3.0 |
Berry Petroleum Co. Class A | 2.6 | 1.9 |
Hanesbrands, Inc. | 2.6 | 0.0 |
Team Health Holdings, Inc. | 2.5 | 1.9 |
Platinum Underwriters Holdings Ltd. | 2.4 | 2.3 |
WESCO International, Inc. | 2.4 | 3.3 |
GrafTech International Ltd. | 2.3 | 0.0 |
| 26.0 | |
Top Five Market Sectors as of July 31, 2012 |
| % of fund's
net assets | % of fund's net assets
6 months ago |
Financials | 35.8 | 35.6 |
Industrials | 14.1 | 15.2 |
Consumer Discretionary | 14.0 | 13.5 |
Information Technology | 11.0 | 11.5 |
Health Care | 6.6 | 7.9 |
Asset Allocation (% of fund's net assets) |
As of July 31, 2012* | As of January 31, 2012** |
 | Stocks 100.0% | | | Stocks 99.9% | |
 | Short-Term
Investments and
Net Other Assets
(Liabilities) † 0.0% | |  | Short-Term
Investments and
Net Other Assets
(Liabilities) 0.1% | |
* Foreign investments | 9.8% | | ** Foreign investments | 9.1% | |
† Amount represents less than 0.1%

Annual Report
Investments July 31, 2012
Showing Percentage of Net Assets
Common Stocks - 98.7% |
| Shares | | Value |
CONSUMER DISCRETIONARY - 13.5% |
Diversified Consumer Services - 2.0% |
Regis Corp. (e) | 3,100,000 | | $ 52,452,000 |
Household Durables - 6.1% |
KB Home (d) | 3,303,800 | | 30,527,112 |
M.D.C. Holdings, Inc. | 800,000 | | 25,488,000 |
Meritage Homes Corp. (a) | 700,000 | | 24,570,000 |
Ryland Group, Inc. | 1,375,000 | | 32,835,000 |
Tempur-Pedic International, Inc. (a)(d) | 1,800,000 | | 51,282,000 |
| | 164,702,112 |
Media - 1.3% |
Valassis Communications, Inc. (a)(d) | 1,584,641 | | 35,733,655 |
Specialty Retail - 1.5% |
Asbury Automotive Group, Inc. (a) | 800,000 | | 20,928,000 |
Tsutsumi Jewelry Co. Ltd. | 791,400 | | 18,561,365 |
| | 39,489,365 |
Textiles, Apparel & Luxury Goods - 2.6% |
Hanesbrands, Inc. (a) | 2,300,000 | | 69,046,000 |
TOTAL CONSUMER DISCRETIONARY | | 361,423,132 |
CONSUMER STAPLES - 3.7% |
Food Products - 2.2% |
Chiquita Brands International, Inc. (a)(d)(e) | 3,375,000 | | 17,482,500 |
Dean Foods Co. (a) | 3,450,000 | | 42,676,500 |
| | 60,159,000 |
Household Products - 1.5% |
Spectrum Brands Holdings, Inc. | 1,100,000 | | 40,513,000 |
TOTAL CONSUMER STAPLES | | 100,672,000 |
ENERGY - 5.6% |
Energy Equipment & Services - 3.0% |
Superior Energy Services, Inc. (a) | 3,800,000 | | 82,345,999 |
Oil, Gas & Consumable Fuels - 2.6% |
Berry Petroleum Co. Class A | 1,825,000 | | 69,386,500 |
TOTAL ENERGY | | 151,732,499 |
FINANCIALS - 35.0% |
Capital Markets - 4.3% |
Knight Capital Group, Inc. Class A (a) | 4,350,000 | | 44,935,500 |
Common Stocks - continued |
| Shares | | Value |
FINANCIALS - continued |
Capital Markets - continued |
Monex Group, Inc. | 149,703 | | $ 24,294,118 |
Waddell & Reed Financial, Inc. Class A | 1,610,000 | | 46,834,900 |
| | 116,064,518 |
Commercial Banks - 11.0% |
Associated Banc-Corp. | 4,432,650 | | 55,363,799 |
CapitalSource, Inc. | 7,000,000 | | 45,850,000 |
City National Corp. | 784,900 | | 38,679,872 |
National Penn Bancshares, Inc. | 4,266,604 | | 37,716,779 |
PacWest Bancorp (e) | 1,857,600 | | 42,557,616 |
TCF Financial Corp. | 7,000,000 | | 72,310,000 |
Western Liberty Bancorp (a)(e) | 992,899 | | 2,879,407 |
| | 295,357,473 |
Insurance - 7.7% |
Alterra Capital Holdings Ltd. | 2,337,411 | | 54,391,554 |
Aspen Insurance Holdings Ltd. | 1,920,200 | | 55,186,548 |
Platinum Underwriters Holdings Ltd. (e) | 1,694,139 | | 64,411,165 |
ProAssurance Corp. | 350,000 | | 31,349,500 |
| | 205,338,767 |
Real Estate Investment Trusts - 7.4% |
DCT Industrial Trust, Inc. | 11,980,586 | | 74,998,468 |
Franklin Street Properties Corp. | 3,160,000 | | 32,769,200 |
Highwoods Properties, Inc. (SBI) | 1,720,330 | | 58,267,577 |
National Retail Properties, Inc. (d) | 1,140,000 | | 33,630,000 |
| | 199,665,245 |
Real Estate Management & Development - 0.9% |
Forestar Group, Inc. (a)(e) | 1,996,875 | | 22,724,438 |
Thrifts & Mortgage Finance - 3.7% |
Astoria Financial Corp. (d)(e) | 5,418,152 | | 51,038,992 |
Washington Federal, Inc. | 3,086,175 | | 49,162,768 |
| | 100,201,760 |
TOTAL FINANCIALS | | 939,352,201 |
HEALTH CARE - 6.6% |
Health Care Equipment & Supplies - 1.1% |
Integra LifeSciences Holdings Corp. (a) | 750,000 | | 28,845,000 |
Health Care Providers & Services - 5.5% |
Chemed Corp. | 465,200 | | 29,200,604 |
Common Stocks - continued |
| Shares | | Value |
HEALTH CARE - continued |
Health Care Providers & Services - continued |
MEDNAX, Inc. (a) | 779,700 | | $ 51,561,561 |
Team Health Holdings, Inc. (a) | 2,527,580 | | 67,486,386 |
| | 148,248,551 |
TOTAL HEALTH CARE | | 177,093,551 |
INDUSTRIALS - 14.1% |
Commercial Services & Supplies - 7.2% |
ACCO Brands Corp. | 2,200,000 | | 18,634,000 |
HNI Corp. (e) | 2,700,000 | | 71,739,000 |
Knoll, Inc. | 1,750,000 | | 23,957,500 |
Quad/Graphics, Inc. (d)(e) | 1,878,394 | | 28,908,484 |
United Stationers, Inc. | 1,980,800 | | 49,935,968 |
| | 193,174,952 |
Electrical Equipment - 2.3% |
GrafTech International Ltd. (a) | 5,965,000 | | 62,334,250 |
Machinery - 2.0% |
Blount International, Inc. (a)(e) | 2,604,723 | | 37,039,161 |
Columbus McKinnon Corp. (NY Shares) (a)(e) | 1,047,872 | | 15,414,197 |
| | 52,453,358 |
Trading Companies & Distributors - 2.6% |
H&E Equipment Services, Inc. (a) | 376,625 | | 5,317,945 |
WESCO International, Inc. (a) | 1,153,633 | | 64,268,894 |
| | 69,586,839 |
TOTAL INDUSTRIALS | | 377,549,399 |
INFORMATION TECHNOLOGY - 11.0% |
Communications Equipment - 2.6% |
Polycom, Inc. (a) | 3,275,000 | | 28,623,500 |
ViaSat, Inc. (a) | 1,100,000 | | 42,130,000 |
| | 70,753,500 |
Electronic Equipment & Components - 5.1% |
Ingram Micro, Inc. Class A (a) | 1,653,100 | | 24,779,969 |
Macnica, Inc. | 677,400 | | 14,288,287 |
Ryoyo Electro Corp. (e) | 1,972,700 | | 20,552,790 |
SYNNEX Corp. (a) | 790,000 | | 26,725,700 |
Tech Data Corp. (a) | 1,000,000 | | 50,100,000 |
| | 136,446,746 |
Common Stocks - continued |
| Shares | | Value |
INFORMATION TECHNOLOGY - continued |
Internet Software & Services - 1.4% |
j2 Global, Inc. (d) | 1,270,000 | | $ 38,011,100 |
Semiconductors & Semiconductor Equipment - 0.4% |
Miraial Co. Ltd. (e) | 720,200 | | 10,410,478 |
Software - 1.5% |
Monotype Imaging Holdings, Inc. (e) | 2,652,331 | | 38,936,219 |
TOTAL INFORMATION TECHNOLOGY | | 294,558,043 |
MATERIALS - 4.7% |
Chemicals - 1.5% |
PolyOne Corp. | 2,800,000 | | 41,244,000 |
Metals & Mining - 3.2% |
Carpenter Technology Corp. | 409,380 | | 19,592,927 |
Haynes International, Inc. | 496,108 | | 23,907,445 |
RTI International Metals, Inc. (a)(e) | 1,880,000 | | 42,206,000 |
| | 85,706,372 |
TOTAL MATERIALS | | 126,950,372 |
UTILITIES - 4.5% |
Electric Utilities - 1.6% |
Westar Energy, Inc. | 1,360,000 | | 41,561,600 |
Gas Utilities - 2.9% |
Southwest Gas Corp. | 836,756 | | 37,369,523 |
UGI Corp. | 1,333,454 | | 40,870,365 |
| | 78,239,888 |
TOTAL UTILITIES | | 119,801,488 |
TOTAL COMMON STOCKS (Cost $2,307,088,586) |
2,649,132,685
|
Nonconvertible Preferred Stocks - 1.3% |
| | | |
CONSUMER DISCRETIONARY - 0.5% |
Household Durables - 0.5% |
M/I Homes, Inc. Series A, 9.75% (a) | 750,400 | | 12,944,400 |
Nonconvertible Preferred Stocks - continued |
| Shares | | Value |
FINANCIALS - 0.8% |
Real Estate Investment Trusts - 0.8% |
DDR Corp. Series H, 7.375% | 818,790 | | $ 20,658,072 |
TOTAL NONCONVERTIBLE PREFERRED STOCKS (Cost $20,354,770) |
33,602,472
|
Money Market Funds - 2.0% |
| | | |
Fidelity Cash Central Fund, 0.17% (b) | 5,899,046 | | 5,899,046 |
Fidelity Securities Lending Cash Central Fund, 0.18% (b)(c) | 48,626,645 | | 48,626,645 |
TOTAL MONEY MARKET FUNDS (Cost $54,525,691) |
54,525,691
|
TOTAL INVESTMENT PORTFOLIO - 102.0% (Cost $2,381,969,047) | | 2,737,260,848 |
NET OTHER ASSETS (LIABILITIES) - (2.0)% | | (53,568,098) |
NET ASSETS - 100% | $ 2,683,692,750 |
Legend |
(a) Non-income producing |
(b) Affiliated fund that is available only to investment companies and other accounts managed by Fidelity Investments. The rate quoted is the annualized seven-day yield of the fund at period end. A complete unaudited listing of the fund's holdings as of its most recent quarter end is available upon request. In addition, each Fidelity Central Fund's financial statements, which are not covered by the Fund's Report of Independent Registered Public Accounting Firm, are available on the SEC's website or upon request. |
(c) Investment made with cash collateral received from securities on loan. |
(d) Security or a portion of the security is on loan at period end. |
(e) Affiliated company |
Affiliated Central Funds |
Information regarding fiscal year to date income earned by the Fund from investments in Fidelity Central Funds is as follows: |
Fund | Income earned |
Fidelity Cash Central Fund | $ 14,453 |
Fidelity Securities Lending Cash Central Fund | 204,102 |
Total | $ 218,555 |
Other Affiliated Issuers |
An affiliated company is a company in which the Fund has ownership of at least 5% of the voting securities. Fiscal year to date transactions with companies which are or were affiliates are as follows: |
Affiliate | Value,
beginning of
period | Purchases | Sales
Proceeds | Dividend
Income | Value,
end of
period |
Astoria Financial Corp. | $ 56,131,471 | $ 5,135,258 | $ - | $ 2,277,805 | $ 51,038,992 |
Blount International, Inc. | 43,316,543 | - | - | - | 37,039,161 |
Chiquita Brands International, Inc. | 24,519,456 | 10,332,799 | - | - | 17,482,500 |
Columbus McKinnon Corp. (NY Shares) | 15,792,000 | 1,137,487 | - | - | 15,414,197 |
DCT Industrial Trust, Inc. | 74,961,776 | - | 8,396,655 | 3,414,064 | - |
Forestar Group, Inc. | - | 24,473,760 | - | - | 22,724,438 |
H&E Equipment Services, Inc. | 29,272,896 | 2,743,497 | 45,135,849 | - | - |
Haynes International, Inc. | 42,301,857 | - | 8,879,973 | 446,653 | - |
HNI Corp. | 49,131,621 | 19,653,848 | 17,053,493 | 2,539,706 | 71,739,000 |
Ingles Markets, Inc. Class A | 10,225,970 | - | 9,904,080 | 78,182 | - |
M.D.C. Holdings, Inc. | 54,813,423 | - | 45,064,374 | 2,311,800 | - |
Affiliate | Value,
beginning of
period | Purchases | Sales
Proceeds | Dividend
Income | Value,
end of
period |
Miraial Co. Ltd. | $ 15,046,860 | $ - | $ - | $ 516,374 | $ 10,410,478 |
Monotype Imaging Holdings, Inc. | 35,396,690 | 972,962 | - | - | 38,936,219 |
PacWest Bancorp | 36,873,360 | - | - | 1,021,680 | 42,557,616 |
Platinum Underwriters Holdings Ltd. | 54,169,091 | 3,610,350 | - | 542,124 | 64,411,165 |
Providence Service Corp. | 12,045,466 | - | 15,255,161 | - | - |
Quad/Graphics, Inc. | - | 25,545,548 | - | 469,599 | 28,908,484 |
Regis Corp. | 60,080,486 | - | 16,882,099 | 952,998 | 52,452,000 |
RTI International Metals, Inc. | 27,932,874 | 27,109,765 | 3,701,784 | - | 42,206,000 |
Ryoyo Electro Corp. | 19,684,709 | - | - | 707,200 | 20,552,790 |
Western Liberty Bancorp | 7,248,000 | - | 3,597,604 | - | 2,879,407 |
Total | $ 668,944,549 | $ 120,715,274 | $ 173,871,072 | $ 15,278,185 | $ 518,752,447 |
Other Information |
The following is a summary of the inputs used, as of July 31, 2012, involving the Fund's assets and liabilities carried at fair value. The inputs or methodology used for valuing securities may not be an indication of the risk associated with investing in those securities. For more information on valuation inputs, and their aggregation into the levels used in the tables below, please refer to the Security Valuation section in the accompanying Notes to Financial Statements. |
Valuation Inputs at Reporting Date: |
Description | Total | Level 1 | Level 2 | Level 3 |
Investments in Securities: | | | | |
Equities: | | | | |
Consumer Discretionary | $ 374,367,532 | $ 355,806,167 | $ 18,561,365 | $ - |
Consumer Staples | 100,672,000 | 100,672,000 | - | - |
Energy | 151,732,499 | 151,732,499 | - | - |
Financials | 960,010,273 | 935,716,155 | 24,294,118 | - |
Health Care | 177,093,551 | 177,093,551 | - | - |
Industrials | 377,549,399 | 377,549,399 | - | - |
Information Technology | 294,558,043 | 249,306,488 | 45,251,555 | - |
Materials | 126,950,372 | 126,950,372 | - | - |
Utilities | 119,801,488 | 119,801,488 | - | - |
Money Market Funds | 54,525,691 | 54,525,691 | - | - |
Total Investments in Securities: | $ 2,737,260,848 | $ 2,649,153,810 | $ 88,107,038 | $ - |
The following is a summary of transfers between Level 1 and Level 2 for the period ended July 31, 2012. Transfers are assumed to have occurred at the beginning of the period, and are primarily attributable to the valuation techniques used for foreign equity securities, as discussed in the accompanying Notes to Financial Statements: |
Transfers | Total |
Level 1 to Level 2 | $ 70,981,657 |
Level 2 to Level 1 | $ 0 |
See accompanying notes which are an integral part of the financial statements.
Annual Report
Financial Statements
Statement of Assets and Liabilities
| July 31, 2012 |
| | |
Assets | | |
Investment in securities, at value (including securities loaned of $46,940,525) - See accompanying schedule: Unaffiliated issuers (cost $1,850,015,930) | $ 2,163,982,710 | |
Fidelity Central Funds (cost $54,525,691) | 54,525,691 | |
Other affiliated issuers (cost $477,427,426) | 518,752,447 | |
Total Investments (cost $2,381,969,047) | | $ 2,737,260,848 |
Receivable for investments sold | | 7,962 |
Receivable for fund shares sold | | 3,346,245 |
Dividends receivable | | 2,366,103 |
Distributions receivable from Fidelity Central Funds | | 31,400 |
Other receivables | | 10,660 |
Total assets | | 2,743,023,218 |
| | |
Liabilities | | |
Payable for investments purchased | $ 6,165,626 | |
Payable for fund shares redeemed | 2,135,374 | |
Accrued management fee | 1,742,888 | |
Distribution and service plan fees payable | 100,792 | |
Other affiliated payables | 499,987 | |
Other payables and accrued expenses | 59,156 | |
Collateral on securities loaned, at value | 48,626,645 | |
Total liabilities | | 59,330,468 |
| | |
Net Assets | | $ 2,683,692,750 |
Net Assets consist of: | | |
Paid in capital | | $ 2,251,063,836 |
Undistributed net investment income | | 4,596,351 |
Accumulated undistributed net realized gain (loss) on investments and foreign currency transactions | | 72,740,139 |
Net unrealized appreciation (depreciation) on investments and assets and liabilities in foreign currencies | | 355,292,424 |
Net Assets | | $ 2,683,692,750 |
See accompanying notes which are an integral part of the financial statements.
Annual Report
Statement of Assets and Liabilities - continued
| July 31, 2012 |
| | |
Calculation of Maximum Offering Price Class A:
Net Asset Value and redemption price per share ($150,285,327 ÷ 10,110,871 shares) | | $ 14.86 |
| | |
Maximum offering price per share (100/94.25 of $14.86) | | $ 15.77 |
Class T:
Net Asset Value and redemption price per share ($57,514,280 ÷ 3,913,423 shares) | | $ 14.70 |
| | |
Maximum offering price per share (100/96.50 of $14.70) | | $ 15.23 |
Class B:
Net Asset Value and offering price per share ($6,674,942 ÷ 467,617 shares)A | | $ 14.27 |
| | |
Class C:
Net Asset Value and offering price per share ($47,265,102 ÷ 3,310,493 shares)A | | $ 14.28 |
| | |
| | |
Small Cap Value:
Net Asset Value, offering price and redemption price per share ($1,756,962,176 ÷ 116,773,340 shares) | | $ 15.05 |
| | |
Class F:
Net Asset Value, offering price and redemption price per share ($526,009,440 ÷ 34,859,047 shares) | | $ 15.09 |
| | |
Institutional Class:
Net Asset Value, offering price and redemption price per share ($138,981,483 ÷ 9,231,738 shares) | | $ 15.05 |
A Redemption price per share is equal to net asset value less any applicable contingent deferred sales charge.
See accompanying notes which are an integral part of the financial statements.
Annual Report
Financial Statements - continued
Statement of Operations
| Year ended July 31, 2012 |
| | |
Investment Income | | |
Dividends (including $15,278,185 earned from other affiliated issuers) | | $ 37,030,660 |
Interest | | 68 |
Income from Fidelity Central Funds | | 218,555 |
Total income | | 37,249,283 |
| | |
Expenses | | |
Management fee
Basic fee | $ 17,249,880 | |
Performance adjustment | 3,419,705 | |
Transfer agent fees | 4,956,576 | |
Distribution and service plan fees | 1,124,466 | |
Accounting and security lending fees | 740,848 | |
Custodian fees and expenses | 47,382 | |
Independent trustees' compensation | 15,923 | |
Registration fees | 132,426 | |
Audit | 69,124 | |
Legal | 7,688 | |
Interest | 359 | |
Miscellaneous | 25,296 | |
Total expenses before reductions | 27,789,673 | |
Expense reductions | (31,201) | 27,758,472 |
Net investment income (loss) | | 9,490,811 |
Realized and Unrealized Gain (Loss) Net realized gain (loss) on: | | |
Investment securities: | | |
Unaffiliated issuers | 99,604,672 | |
Other affiliated issuers | 57,534 | |
Foreign currency transactions | (5,054) | |
Total net realized gain (loss) | | 99,657,152 |
Change in net unrealized appreciation (depreciation) on: Investment securities | (37,717,980) | |
Assets and liabilities in foreign currencies | (6,920) | |
Total change in net unrealized appreciation (depreciation) | | (37,724,900) |
Net gain (loss) | | 61,932,252 |
Net increase (decrease) in net assets resulting from operations | | $ 71,423,063 |
See accompanying notes which are an integral part of the financial statements.
Annual Report
Statement of Changes in Net Assets
| Year ended
July 31,
2012 | Year ended
July 31,
2011 |
Increase (Decrease) in Net Assets | | |
Operations | | |
Net investment income (loss) | $ 9,490,811 | $ 8,365,475 |
Net realized gain (loss) | 99,657,152 | 155,481,563 |
Change in net unrealized appreciation (depreciation) | (37,724,900) | 203,701,455 |
Net increase (decrease) in net assets resulting
from operations | 71,423,063 | 367,548,493 |
Distributions to shareholders from net investment income | (3,813,704) | (16,151,065) |
Distributions to shareholders from net realized gain | (148,970,854) | (20,051,059) |
Total distributions | (152,784,558) | (36,202,124) |
Share transactions - net increase (decrease) | 230,904,084 | 54,629,275 |
Redemption fees | 569,163 | 445,888 |
Total increase (decrease) in net assets | 150,111,752 | 386,421,532 |
| | |
Net Assets | | |
Beginning of period | 2,533,580,998 | 2,147,159,466 |
End of period (including undistributed net investment income of $4,596,351 and $0, respectively) | $ 2,683,692,750 | $ 2,533,580,998 |
See accompanying notes which are an integral part of the financial statements.
Annual Report
Financial Highlights - Class A
Years ended July 31, | 2012 | 2011 | 2010 | 2009 | 2008 |
Selected Per-Share Data | | | | |
Net asset value, beginning of period | $ 15.48 | $ 13.45 | $ 11.13 | $ 11.82 | $ 14.34 |
Income from Investment
Operations | | | | |
Net investment income (loss) C | .01 | .01 F | .02 G | .08 | (.01) |
Net realized and unrealized gain (loss) | .30 | 2.22 | 2.33 | (.60) | (1.98) |
Total from investment operations | .31 | 2.23 | 2.35 | (.52) | (1.99) |
Distributions from net investment income | (.01) | (.08) | (.03) | (.06) | - |
Distributions from net realized gain | (.93) | (.12) | - | (.11) | (.53) |
Total distributions | (.93) J | (.20) | (.03) | (.17) | (.53) |
Redemption fees added to paid in capital C, I | - | - | - | - | - |
Net asset value, end of period | $ 14.86 | $ 15.48 | $ 13.45 | $ 11.13 | $ 11.82 |
Total Return A, B | 3.24% | 16.72% | 21.16% | (4.37)% | (14.35)% |
Ratios to Average Net Assets D, H | | | | |
Expenses before reductions | 1.44% | 1.44% | 1.47% | 1.45% | 1.43% |
Expenses net of fee waivers, if any | 1.44% | 1.43% | 1.40% | 1.40% | 1.40% |
Expenses net of all reductions | 1.44% | 1.43% | 1.39% | 1.40% | 1.40% |
Net investment income (loss) | .09% | .06% F | .17% G | .81% | (.05)% |
Supplemental Data | | | | |
Net assets, end of period (000 omitted) | $ 150,285 | $ 140,707 | $ 96,994 | $ 55,029 | $ 52,446 |
Portfolio turnover rate E | 27% | 22% | 49% | 51% | 149% |
A Total returns would have been lower if certain expenses had not been reduced during the applicable periods shown.
B Total returns do not include the effect of the sales charges.
C Calculated based on average shares outstanding during the period.
D Fees and expenses of any underlying Fidelity Central Funds are not included in the Fund's expense ratio. The Fund indirectly bears its proportionate share of the expenses of any underlying Fidelity Central Funds.
E Amount does not include the portfolio activity of any underlying Fidelity Central Funds.
F Investment income per share reflects a large, non-recurring dividend which amounted to $.06 per share. Excluding this non-recurring dividend, the ratio of net investment income (loss) to average net assets would have been (.31)%.
G Investment income per share reflects a large, non-recurring dividend which amounted to $.03 per share. Excluding this non-recurring dividend, the ratio of net investment income (loss) to average net assets would have been (.10)%.
H Expense ratios reflect operating expenses of the class. Expenses before reductions do not reflect amounts reimbursed by the investment adviser or reductions from brokerage service arrangements or reductions from other expense offset arrangements and do not represent the amount paid by the class during periods when reimbursements or reductions occur. Expenses net of fee waivers reflect expenses after reimbursement by the investment adviser but prior to reductions from brokerage service arrangements or other expense offset arrangements. Expenses net of all reductions represent the net expenses paid by the class.
I Amount represents less than $.01 per share.
J Total distributions of $.93 per share is comprised of distributions from net investment income of $.006 and distributions from net realized gain of $.925 per share.
See accompanying notes which are an integral part of the financial statements.
Annual Report
Financial Highlights - Class T
Years ended July 31, | 2012 | 2011 | 2010 | 2009 | 2008 |
Selected Per-Share Data | | | | |
Net asset value, beginning of period | $ 15.34 | $ 13.34 | $ 11.05 | $ 11.74 | $ 14.28 |
Income from Investment
Operations | | | | |
Net investment income (loss) C | (.02) | (.03) F | (.01) G | .05 | (.04) |
Net realized and unrealized gain (loss) | .31 | 2.20 | 2.31 | (.59) | (1.97) |
Total from investment operations | .29 | 2.17 | 2.30 | (.54) | (2.01) |
Distributions from net investment income | - | (.05) | (.01) | (.04) | - |
Distributions from net realized gain | (.93) | (.12) | - | (.11) | (.53) |
Total distributions | (.93) | (.17) | (.01) | (.15) | (.53) |
Redemption fees added to paid in capital C, I | - | - | - | - | - |
Net asset value, end of period | $ 14.70 | $ 15.34 | $ 13.34 | $ 11.05 | $ 11.74 |
Total Return A, B | 3.08% | 16.36% | 20.87% | (4.57)% | (14.58)% |
Ratios to Average Net Assets D, H | | | | |
Expenses before reductions | 1.67% | 1.70% | 1.72% | 1.70% | 1.68% |
Expenses net of fee waivers, if any | 1.67% | 1.69% | 1.65% | 1.65% | 1.65% |
Expenses net of all reductions | 1.67% | 1.69% | 1.64% | 1.65% | 1.65% |
Net investment income (loss) | (.14)% | (.19)% F | (.08)% G | .56% | (.30)% |
Supplemental Data | | | | |
Net assets, end of period (000 omitted) | $ 57,514 | $ 55,845 | $ 44,091 | $ 28,534 | $ 32,091 |
Portfolio turnover rate E | 27% | 22% | 49% | 51% | 149% |
A Total returns would have been lower if certain expenses had not been reduced during the applicable periods shown.
B Total returns do not include the effect of the sales charges.
C Calculated based on average shares outstanding during the period.
D Fees and expenses of any underlying Fidelity Central Funds are not included in the Fund's expense ratio. The Fund indirectly bears its proportionate share of the expenses of any underlying Fidelity Central Funds.
E Amount does not include the portfolio activity of any underlying Fidelity Central Funds.
F Investment income per share reflects a large, non-recurring dividend which amounted to $.06 per share. Excluding this non-recurring dividend, the ratio of net investment income (loss) to average net assets would have been (.57)%.
G Investment income per share reflects a large, non-recurring dividend which amounted to $.03 per share. Excluding this non-recurring dividend, the ratio of net investment income (loss) to average net assets would have been (.35)%.
H Expense ratios reflect operating expenses of the class. Expenses before reductions do not reflect amounts reimbursed by the investment adviser or reductions from brokerage service arrangements or reductions from other expense offset arrangements and do not represent the amount paid by the class during periods when reimbursements or reductions occur. Expenses net of fee waivers reflect expenses after reimbursement by the investment adviser but prior to reductions from brokerage service arrangements or other expense offset arrangements. Expenses net of all reductions represent the net expenses paid by the class.
I Amount represents less than $.01 per share.
See accompanying notes which are an integral part of the financial statements.
Annual Report
Financial Highlights - Class B
Years ended July 31, | 2012 | 2011 | 2010 | 2009 | 2008 |
Selected Per-Share Data | | | | |
Net asset value, beginning of period | $ 15.00 | $ 13.08 | $ 10.88 | $ 11.60 | $ 14.19 |
Income from Investment
Operations | | | | |
Net investment income (loss) C | (.09) | (.10) F | (.07) G | .01 | (.10) |
Net realized and unrealized gain (loss) | .29 | 2.15 | 2.27 | (.59) | (1.96) |
Total from investment operations | .20 | 2.05 | 2.20 | (.58) | (2.06) |
Distributions from net investment income | - | (.01) | - | (.03) | - |
Distributions from net realized gain | (.93) | (.12) | - | (.11) | (.53) |
Total distributions | (.93) | (.13) | - | (.14) | (.53) |
Redemption fees added to paid in capital C, I | - | - | - | - | - |
Net asset value, end of period | $ 14.27 | $ 15.00 | $ 13.08 | $ 10.88 | $ 11.60 |
Total Return A, B | 2.51% | 15.80% | 20.22% | (5.05)% | (15.04)% |
Ratios to Average Net Assets D, H | | | | |
Expenses before reductions | 2.19% | 2.20% | 2.22% | 2.20% | 2.18% |
Expenses net of fee waivers, if any | 2.19% | 2.19% | 2.15% | 2.15% | 2.15% |
Expenses net of all reductions | 2.19% | 2.19% | 2.14% | 2.15% | 2.15% |
Net investment income (loss) | (.66)% | (.69)% F | (.58)% G | .06% | (.80)% |
Supplemental Data | | | | |
Net assets, end of period (000 omitted) | $ 6,675 | $ 8,549 | $ 9,747 | $ 7,153 | $ 7,886 |
Portfolio turnover rate E | 27% | 22% | 49% | 51% | 149% |
A Total returns would have been lower if certain expenses had not been reduced during the applicable periods shown.
B Total returns do not include the effect of the contingent deferred sales charge.
C Calculated based on average shares outstanding during the period.
D Fees and expenses of any underlying Fidelity Central Funds are not included in the Fund's expense ratio. The Fund indirectly bears its proportionate share of the expenses of any underlying Fidelity Central Funds.
E Amount does not include the portfolio activity of any underlying Fidelity Central Funds.
F Investment income per share reflects a large, non-recurring dividend which amounted to $.06 per share. Excluding this non-recurring dividend, the ratio of net investment income (loss) to average net assets would have been (1.07)%.
G Investment income per share reflects a large, non-recurring dividend which amounted to $.03 per share. Excluding this non-recurring dividend, the ratio of net investment income (loss) to average net assets would have been (.85)%.
H Expense ratios reflect operating expenses of the class. Expenses before reductions do not reflect amounts reimbursed by the investment adviser or reductions from brokerage service arrangements or reductions from other expense offset arrangements and do not represent the amount paid by the class during periods when reimbursements or reductions occur. Expenses net of fee waivers reflect expenses after reimbursement by the investment adviser but prior to reductions from brokerage service arrangements or other expense offset arrangements. Expenses net of all reductions represent the net expenses paid by the class.
I Amount represents less than $.01 per share.
See accompanying notes which are an integral part of the financial statements.
Annual Report
Financial Highlights - Class C
Years ended July 31, | 2012 | 2011 | 2010 | 2009 | 2008 |
Selected Per-Share Data | | | | |
Net asset value, beginning of period | $ 15.01 | $ 13.08 | $ 10.89 | $ 11.60 | $ 14.19 |
Income from Investment
Operations | | | | |
Net investment income (loss) C | (.09) | (.10) F | (.07) G | .01 | (.10) |
Net realized and unrealized gain (loss) | .29 | 2.17 | 2.26 | (.58) | (1.96) |
Total from investment operations | .20 | 2.07 | 2.19 | (.57) | (2.06) |
Distributions from net investment income | - | (.02) | - | (.03) | - |
Distributions from net realized gain | (.93) | (.12) | - | (.11) | (.53) |
Total distributions | (.93) | (.14) | - | (.14) | (.53) |
Redemption fees added to paid in capital C, I | - | - | - | - | - |
Net asset value, end of period | $ 14.28 | $ 15.01 | $ 13.08 | $ 10.89 | $ 11.60 |
Total Return A, B | 2.52% | 15.91% | 20.11% | (4.98)% | (15.04)% |
Ratios to Average Net Assets D, H | | | | |
Expenses before reductions | 2.19% | 2.18% | 2.22% | 2.20% | 2.18% |
Expenses net of fee waivers, if any | 2.19% | 2.18% | 2.15% | 2.15% | 2.15% |
Expenses net of all reductions | 2.19% | 2.18% | 2.14% | 2.15% | 2.15% |
Net investment income (loss) | (.66)% | (.68)% F | (.58)% G | .06% | (.80)% |
Supplemental Data | | | | |
Net assets, end of period (000 omitted) | $ 47,265 | $ 47,457 | $ 37,346 | $ 21,345 | $ 20,924 |
Portfolio turnover rate E | 27% | 22% | 49% | 51% | 149% |
A Total returns would have been lower if certain expenses had not been reduced during the applicable periods shown.
B Total returns do not include the effect of the contingent deferred sales charge.
C Calculated based on average shares outstanding during the period.
D Fees and expenses of any underlying Fidelity Central Funds are not included in the Fund's expense ratio. The Fund indirectly bears its proportionate share of the expenses of any underlying Fidelity Central Funds.
E Amount does not include the portfolio activity of any underlying Fidelity Central Funds.
F Investment income per share reflects a large, non-recurring dividend which amounted to $.06 per share. Excluding this non-recurring dividend, the ratio of net investment income (loss) to average net assets would have been (1.06)%.
G Investment income per share reflects a large, non-recurring dividend which amounted to $.03 per share. Excluding this non-recurring dividend, the ratio of net investment income (loss) to average net assets would have been (.85)%.
H Expense ratios reflect operating expenses of the class. Expenses before reductions do not reflect amounts reimbursed by the investment adviser or reductions from brokerage service arrangements or reductions from other expense offset arrangements and do not represent the amount paid by the class during periods when reimbursements or reductions occur. Expenses net of fee waivers reflect expenses after reimbursement by the investment adviser but prior to reductions from brokerage service arrangements or other expense offset arrangements. Expenses net of all reductions represent the net expenses paid by the class.
I Amount represents less than $.01 per share.
See accompanying notes which are an integral part of the financial statements.
Annual Report
Financial Highlights - Small Cap Value
Years ended July 31, | 2012 | 2011 | 2010 | 2009 | 2008 |
Selected Per-Share Data | | | | |
Net asset value, beginning of period | $ 15.62 | $ 13.56 | $ 11.22 | $ 11.91 | $ 14.43 |
Income from Investment
Operations | | | | |
Net investment income (loss) B | .06 | .06 E | .05 F | .10 | .03 |
Net realized and unrealized gain (loss) | .32 | 2.23 | 2.34 | (.60) | (1.99) |
Total from investment operations | .38 | 2.29 | 2.39 | (.50) | (1.96) |
Distributions from net investment income | (.02) | (.10) | (.05) | (.08) | - |
Distributions from net realized gain | (.93) | (.13) | - | (.11) | (.56) |
Total distributions | (.95) | (.23) | (.05) | (.19) | (.56) |
Redemption fees added to paid in capital B, H | - | - | - | - | - |
Net asset value, end of period | $ 15.05 | $ 15.62 | $ 13.56 | $ 11.22 | $ 11.91 |
Total Return A | 3.67% | 17.03% | 21.32% | (4.15)% | (14.10)% |
Ratios to Average Net Assets C, G | | | | |
Expenses before reductions | 1.13% | 1.13% | 1.18% | 1.20% | 1.14% |
Expenses net of fee waivers, if any | 1.13% | 1.13% | 1.18% | 1.20% | 1.14% |
Expenses net of all reductions | 1.13% | 1.13% | 1.17% | 1.20% | 1.13% |
Net investment income (loss) | .41% | .37% E | .39% F | 1.01% | .22% |
Supplemental Data | | | | |
Net assets, end of period (000 omitted) | $ 1,756,962 | $ 1,899,805 | $ 1,770,675 | $ 1,488,736 | $ 1,136,860 |
Portfolio turnover rate D | 27% | 22% | 49% | 51% | 149% |
A Total returns would have been lower if certain expenses had not been reduced during the applicable periods shown.
B Calculated based on average shares outstanding during the period.
C Fees and expenses of any underlying Fidelity Central Funds are not included in the Fund's expense ratio. The Fund indirectly bears its proportionate share of the expenses of any underlying Fidelity Central Funds.
D Amount does not include the portfolio activity of any underlying Fidelity Central Funds.
E Investment income per share reflects a large, non-recurring dividend which amounted to $.06 per share. Excluding this non-recurring dividend, the ratio of net investment income (loss) to average net assets would have been (.01)%.
F Investment income per share reflects a large, non-recurring dividend which amounted to $.03 per share. Excluding this non-recurring dividend, the ratio of net investment income (loss) to average net assets would have been .12%.
G Expense ratios reflect operating expenses of the class. Expenses before reductions do not reflect amounts reimbursed by the investment adviser or reductions from brokerage service arrangements or reductions from other expense offset arrangements and do not represent the amount paid by the class during periods when reimbursements or reductions occur. Expenses net of fee waivers reflect expenses after reimbursement by the investment adviser but prior to reductions from brokerage service arrangements or other expense offset arrangements. Expenses net of all reductions represent the net expenses paid by the class.
H Amount represents less than $.01 per share.
See accompanying notes which are an integral part of the financial statements.
Annual Report
Financial Highlights - Class F
Years ended July 31, | 2012 | 2011 | 2010 | 2009 I |
Selected Per-Share Data | | | | |
Net asset value, beginning of period | $ 15.64 | $ 13.58 | $ 11.22 | $ 10.27 |
Income from Investment Operations | | | | |
Net investment income (loss) D | .09 | .09 G | .09 H | .01 |
Net realized and unrealized gain (loss) | .32 | 2.23 | 2.34 | .94 |
Total from investment operations | .41 | 2.32 | 2.43 | .95 |
Distributions from net investment income | (.04) | (.14) | (.07) | - |
Distributions from net realized gain | (.93) | (.13) | - | - |
Total distributions | (.96) L | (.26) M | (.07) | - |
Redemption fees added to paid in capital D, K | - | - | - | - |
Net asset value, end of period | $ 15.09 | $ 15.64 | $ 13.58 | $ 11.22 |
Total Return B, C | 3.90% | 17.31% | 21.69% | 9.25% |
Ratios to Average Net Assets E, J | | | | |
Expenses before reductions | .89% | .88% | .90% | .86% A |
Expenses net of fee waivers, if any | .89% | .88% | .90% | .86% A |
Expenses net of all reductions | .89% | .88% | .89% | .86% A |
Net investment income (loss) | .64% | .61% G | .67% H | .64% A |
Supplemental Data | | | | |
Net assets, end of period (000 omitted) | $ 526,009 | $ 279,653 | $ 109,868 | $ 159 |
Portfolio turnover rate F | 27% | 22% | 49% | 51% |
A Annualized
B Total returns for periods of less than one year are not annualized.
C Total returns would have been lower if certain expenses had not been reduced during the applicable periods shown.
D Calculated based on average shares outstanding during the period.
E Fees and expenses of any underlying Fidelity Central Funds are not included in the Fund's expense ratio. The Fund indirectly bears its proportionate share of the expenses of any underlying Fidelity Central Funds.
F Amount does not include the portfolio activity of any underlying Fidelity Central Funds.
G Investment income per share reflects a large, non-recurring dividend which amounted to $.06 per share. Excluding this non-recurring dividend, the ratio of net investment income (loss) to average net assets would have been .24%.
H Investment income per share reflects a large, non-recurring dividend which amounted to $.04 per share. Excluding this non-recurring dividend, the ratio of net investment income (loss) to average net assets would have been .40%.
I For the period June 26, 2009 (commencement of sale of shares) to July 31, 2009.
J Expense ratios reflect operating expenses of the class. Expenses before reductions do not reflect amounts reimbursed by the investment adviser or reductions from brokerage service arrangements or reductions from other expense offset arrangements and do not represent the amount paid by the class during periods when reimbursements or reductions occur. Expense ratios before reductions for start-up periods may not be representative of longer-term operating periods. Expenses net of fee waivers reflect expenses after reimbursement by the investment adviser but prior to reductions from brokerage service arrangements or other expense offset arrangements. Expenses net of all reductions represent the net expenses paid by the class.
K Amount represents less than $.01 per share.
L Total distributions of $.96 per share is comprised of distributions from net investment income of $.036 and distributions from net realized gain of $.925 per share.
M Total distributions of $.26 per share is comprised of distributions from net investment income of $.138 and distributions from net realized gain of $.126 per share.
See accompanying notes which are an integral part of the financial statements.
Annual Report
Financial Highlights - Institutional Class
Years ended July 31, | 2012 | 2011 | 2010 | 2009 | 2008 |
Selected Per-Share Data | | | | |
Net asset value, beginning of period | $ 15.63 | $ 13.58 | $ 11.24 | $ 11.91 | $ 14.43 |
Income from Investment
Operations | | | | |
Net investment income (loss) B | .06 | .06 E | .06 F | .10 | .03 |
Net realized and unrealized gain (loss) | .31 | 2.23 | 2.34 | (.59) | (1.99) |
Total from investment operations | .37 | 2.29 | 2.40 | (.49) | (1.96) |
Distributions from net investment income | (.02) | (.11) | (.06) | (.07) | - |
Distributions from net realized gain | (.93) | (.13) | - | (.11) | (.56) |
Total distributions | (.95) | (.24) | (.06) | (.18) | (.56) |
Redemption fees added to paid in capital B, H | - | - | - | - | - |
Net asset value, end of period | $ 15.05 | $ 15.63 | $ 13.58 | $ 11.24 | $ 11.91 |
Total Return A | 3.59% | 17.02% | 21.42% | (4.04)% | (14.10)% |
Ratios to Average Net Assets C, G | | | | |
Expenses before reductions | 1.14% | 1.10% | 1.12% | 1.20% | 1.13% |
Expenses net of fee waivers, if any | 1.14% | 1.10% | 1.12% | 1.15% | 1.13% |
Expenses net of all reductions | 1.14% | 1.10% | 1.12% | 1.15% | 1.13% |
Net investment income (loss) | .39% | .39% E | .45% F | 1.06% | .22% |
Supplemental Data | | | | |
Net assets, end of period (000 omitted) | $ 138,981 | $ 101,565 | $ 78,440 | $ 10,336 | $ 8,584 |
Portfolio turnover rate D | 27% | 22% | 49% | 51% | 149% |
A Total returns would have been lower if certain expenses had not been reduced during the applicable periods shown.
B Calculated based on average shares outstanding during the period.
C Fees and expenses of any underlying Fidelity Central Funds are not included in the Fund's expense ratio. The Fund indirectly bears its proportionate share of the expenses of any underlying Fidelity Central Funds.
D Amount does not include the portfolio activity of any underlying Fidelity Central Funds.
E Investment income per share reflects a large, non-recurring dividend which amounted to $.06 per share. Excluding this non-recurring dividend, the ratio of net investment income (loss) to average net assets would have been .01%.
F Investment income per share reflects a large, non-recurring dividend which amounted to $.03 per share. Excluding this non-recurring dividend, the ratio of net investment income (loss) to average net assets would have been .18%.
G Expense ratios reflect operating expenses of the class. Expenses before reductions do not reflect amounts reimbursed by the investment adviser or reductions from brokerage service arrangements or reductions from other expense offset arrangements and do not represent the amount paid by the class during periods when reimbursements or reductions occur. Expenses net of fee waivers reflect expenses after reimbursement by the investment adviser but prior to reductions from brokerage service arrangements or other expense offset arrangements. Expenses net of all reductions represent the net expenses paid by the class.
H Amount represents less than $.01 per share.
See accompanying notes which are an integral part of the financial statements.
Annual Report
Notes to Financial Statements
For the period ended July 31, 2012
1. Organization.
Fidelity Small Cap Value Fund (the Fund) is a fund of Fidelity Securities Fund (the Trust) and is authorized to issue an unlimited number of shares. The Trust is registered under the Investment Company Act of 1940, as amended (the 1940 Act), as an open-end management investment company organized as a Massachusetts business trust. The Fund offers Class A, Class T, Class C, Small Cap Value, Class F and Institutional Class shares, each of which, along with Class B shares, has equal rights as to assets and voting privileges. Effective after the close of business on September 1, 2010, Class B shares were closed to new accounts and additional purchases, except for exchanges and reinvestments. Each class has exclusive voting rights with respect to matters that affect that class. Class F shares of the Fund are only available for purchase by mutual funds for which Fidelity Management & Research Company (FMR) or an affiliate serves as investment manager. Class B shares will automatically convert to Class A shares after a holding period of seven years from the initial date of purchase. Investment income, realized and unrealized capital gains and losses, the common expenses of the Fund, and certain fund-level expense reductions, if any, are allocated on a pro-rata basis to each class based on the relative net assets of each class to the total net assets of the Fund. Each class differs with respect to transfer agent and distribution and service plan fees incurred. Certain expense reductions may also differ by class.
2. Investments in Fidelity Central Funds.
The Fund invests in Fidelity Central Funds, which are open-end investment companies available only to other investment companies and accounts managed by FMR and its affiliates. The Fund's Schedule of Investments lists each of the Fidelity Central Funds held as of period end, if any, as an investment of the Fund, but does not include the underlying holdings of each Fidelity Central Fund. As an Investing Fund, the Fund indirectly bears its proportionate share of the expenses of the underlying Fidelity Central Funds.
The Money Market Central Funds seek preservation of capital and current income and are managed by Fidelity Investments Money Management, Inc. (FIMM), an affiliate of FMR.
A complete unaudited list of holdings for each Fidelity Central Fund is available upon request or at the Securities and Exchange Commission (the SEC) web site at www.sec.gov. In addition, the financial statements of the Fidelity Central Funds, which are not covered by the Fund's Report of Independent Registered Public Accounting Firm, are available on the SEC web site or upon request.
Annual Report
Notes to Financial Statements - continued
3. Significant Accounting Policies.
The financial statements have been prepared in conformity with accounting principles generally accepted in the United States of America (GAAP), which require management to make certain estimates and assumptions at the date of the financial statements. Actual results could differ from those estimates. Subsequent events, if any, through the date that the financial statements were issued have been evaluated in the preparation of the financial statements. The following summarizes the significant accounting policies of the Fund:
Security Valuation. Investments are valued as of 4:00 p.m. Eastern time on the last calendar day of the period. In accordance with valuation policies and procedures approved by the Board of Trustees (the Board), the Fund attempts to obtain prices from one or more third party pricing vendor or broker to value its investments. When current market prices, quotations or rates are not readily available or reliable, securities will be fair valued in good faith by the FMR Fair Value Committee (the Committee), in accordance with procedures adopted by the Fund's Board. Factors used in determining fair value vary by security type and may include market or security specific events. The frequency with which these procedures are used cannot be predicted and they may be utilized to a significant extent. The Committee oversees the Fund's valuation policies and procedures and is responsible for approving and reporting to the Board all fair value determinations.
The Fund categorizes the inputs to valuation techniques used to value its investments into a disclosure hierarchy consisting of three levels as shown below:
Level 1 - quoted prices in active markets for identical investments
Level 2 - other significant observable inputs (including quoted prices for similar investments, interest rates, prepayment speeds, etc.)
Level 3 - unobservable inputs (including the Fund's own assumptions based on the best information available)
Valuation techniques used to value the Fund's investments by major category are as follows:
Equity securities, including restricted securities, for which market quotations are readily available, are valued at the last reported sale price or official closing price as reported by a third party pricing vendor on the primary market or exchange on which they are traded and are categorized as Level 1 in the hierarchy. In the event there were no sales during the day or closing prices are not available, securities are valued at the last quoted bid price or may be valued using the last available price and are generally categorized as Level 2 in the hierarchy. For foreign equity securities, when significant market or security specific events arise, comparisons to the valuation of American Depositary Receipts
Annual Report
3. Significant Accounting Policies - continued
Security Valuation - continued
(ADRs), futures contracts, Exchange-Traded Funds (ETFs) and certain indexes as well as quoted prices for similar securities are used and are categorized as Level 2 in the hierarchy. Utilizing these techniques may result in transfers between Level 1 and Level 2.
Investments in open-end mutual funds, including the Fidelity Central Funds, are valued at their closing net asset value each business day and are categorized as Level 1 in the hierarchy.
Changes in valuation techniques may result in transfers in or out of an assigned level within the disclosure hierarchy. The aggregate value of investments by input level, as of July 31, 2012, including information on transfers between Levels 1 and 2, is included at the end of the Fund's Schedule of Investments.
Foreign Currency Translation. The Fund may use foreign currency contracts to facilitate transactions in foreign-denominated securities. Gains and losses from these transactions may arise from changes in the value of the foreign currency or if the counterparties do not perform under the contracts' terms.
Foreign-denominated assets, including investment securities, and liabilities are translated into U.S. dollars at the exchange rates at period end. Purchases and sales of investment securities, income and dividends received and expenses denominated in foreign currencies are translated into U.S. dollars at the exchange rate in effect on the transaction date.
The effects of exchange rate fluctuations on investments are included with the net realized and unrealized gain (loss) on investment securities. Other foreign currency transactions resulting in realized and unrealized gain (loss) are disclosed separately.
Investment Transactions and Income. For financial reporting purposes, the Fund's investment holdings and NAV include trades executed through the end of the last business day of the period. The NAV per share for processing shareholder transactions is calculated as of the close of business of the New York Stock Exchange (NYSE), normally 4:00 p.m. Eastern time and includes trades executed through the end of the prior business day. Gains and losses on securities sold are determined on the basis of identified cost and may include proceeds received from litigation. Dividend income is recorded on the ex-dividend date, except for certain dividends from foreign securities where the ex-dividend date may have passed, which are recorded as soon as the Fund is informed of the ex-dividend date. Non-cash dividends included in dividend income, if any, are recorded at the fair market value of the securities received. Distributions received on securities that represent a return of capital or capital gain are recorded as a reduction of
Annual Report
Notes to Financial Statements - continued
3. Significant Accounting Policies - continued
Investment Transactions and Income - continued
cost of investments and/or as a realized gain. The Fund estimates the components of distributions received that may be considered return of capital distributions or capital gain distributions. Interest income and distributions from the Fidelity Central Funds are accrued as earned. Interest income includes coupon interest and amortization of premium and accretion of discount on debt securities. Investment income is recorded net of foreign taxes withheld where recovery of such taxes is uncertain.
Expenses. Expenses directly attributable to a fund are charged to that fund. Expenses attributable to more than one fund are allocated among the respective funds on the basis of relative net assets or other appropriate methods. Expense estimates are accrued in the period to which they relate and adjustments are made when actual amounts are known.
Income Tax Information and Distributions to Shareholders. Each year, the Fund intends to qualify as a regulated investment company under Subchapter M of the Internal Revenue Code, including distributing substantially all of its taxable income and realized gains. As a result, no provision for income taxes is required. As of July 31, 2012, the Fund did not have any unrecognized tax benefits in the financial statements; nor is the Fund aware of any tax positions for which it is reasonably possible that the total amounts of unrecognized tax benefits will significantly change in the next twelve months. The Fund files a U.S. federal tax return, in addition to state and local tax returns as required. A fund's federal income tax returns are subject to examination by the Internal Revenue Service (IRS) for a period of three fiscal years after they are filed. State and local tax returns may be subject to examination for an additional fiscal year depending on the jurisdiction. Foreign taxes are provided for based on the Fund's understanding of the tax rules and rates that exist in the foreign markets in which it invests.
Distributions are declared and recorded on the ex-dividend date. Income dividends and capital gain distributions are declared separately for each class. Income and capital gain distributions are determined in accordance with income tax regulations, which may differ from GAAP. In addition, the Fund claimed a portion of the payment made to redeeming shareholders as a distribution for income tax purposes.
Capital accounts within the financial statements are adjusted for permanent book-tax differences. These adjustments have no impact on net assets or the results of operations. Temporary book-tax differences will reverse in a subsequent period.
Book-tax differences are primarily due to foreign currency transactions and losses deferred due to wash sales.
Annual Report
3. Significant Accounting Policies - continued
Income Tax Information and Distributions to Shareholders - continued
The federal tax cost of investment securities and unrealized appreciation (depreciation) as of period end were as follows:
Gross unrealized appreciation | $ 491,346,133 |
Gross unrealized depreciation | (137,153,760) |
Net unrealized appreciation (depreciation) on securities and other investments | $ 354,192,373 |
| |
Tax Cost | $ 2,383,068,475 |
The tax-based components of distributable earnings as of period end were as follows:
Undistributed ordinary income | $ 4,596,351 |
Undistributed long-term capital gain | $ 73,839,567 |
Net unrealized appreciation (depreciation) | $ 354,192,996 |
The tax character of distributions paid was as follows:
| July 31, 2012 | July 31, 2011 |
Ordinary Income | $ 3,813,704 | $ 16,899,273 |
Long-term Capital Gains | 148,970,854 | 19,302,851 |
Total | $ 152,784,558 | $ 36,202,124 |
Short-Term Trading (Redemption) Fees. Shares held by investors in the Fund less than 90 days are subject to a redemption fee equal to 1.50% of the net asset value of shares redeemed. All redemption fees, which reduce the proceeds of the shareholder redemption, are retained by the Fund and accounted for as an addition to paid in capital.
New Accounting Pronouncement. In December 2011, the Financial Accounting Standards Board issued Accounting Standard Update No. 2011-11, Disclosures about Offsetting Assets and Liabilities. The update creates new disclosure requirements requiring entities to disclose both gross and net information for derivatives and other financial instruments that are either offset in the Statement of Assets and Liabilities or subject to an enforceable master netting arrangement or similar agreement. The disclosure requirements are effective for interim and annual reporting periods beginning on or after January 1, 2013. Management is currently evaluating the impact of the update's adoption on the Fund's financial statement disclosures.
4. Purchases and Sales of Investments.
Purchases and sales of securities, other than short-term securities, aggregated $758,866,730 and $657,878,656, respectively.
Annual Report
Notes to Financial Statements - continued
5. Fees and Other Transactions with Affiliates.
Management Fee. FMR and its affiliates provide the Fund with investment management related services for which the Fund pays a monthly management fee. The management fee is the sum of an individual fund fee rate that is based on an annual rate of .45% of the Fund's average net assets and an annualized group fee rate that averaged .26% during the period. The group fee rate is based upon the average net assets of all the mutual funds advised by FMR. The group fee rate decreases as assets under management increase and increases as assets under management decrease. In addition, the management fee is subject to a performance adjustment (up to a maximum of ± .20% of the Fund's average net assets over a 36 month performance period). The upward or downward adjustment to the management fee is based on the relative investment performance of Small Cap Value as compared to an appropriate benchmark index. For the period, the total annual management fee rate, including the performance adjustment, was .85% of the Fund's average net assets.
Distribution and Service Plan Fees. In accordance with Rule 12b-1 of the 1940 Act, the Fund has adopted separate Distribution and Service Plans for each class of shares. Certain classes pay Fidelity Distributors Corporation (FDC), an affiliate of FMR, separate Distribution and Service Fees, each of which is based on an annual percentage of each class' average net assets. In addition, FDC may pay financial intermediaries for selling shares of the Fund and providing shareholder support services. For the period, the Distribution and Service Fee rates, total fees and amounts retained by FDC were as follows:
| Distribution
Fee | Service
Fee | Total Fees | Retained
by FDC |
Class A | -% | .25% | $ 346,065 | $ 6,112 |
Class T | .25% | .25% | 268,038 | 110 |
Class B | .75% | .25% | 72,196 | 54,146 |
Class C | .75% | .25% | 438,167 | 78,130 |
| | | $ 1,124,466 | $ 138,498 |
Sales Load. FDC may receive a front-end sales charge of up to 5.75% for selling Class A shares and 3.50% for selling Class T shares, some of which is paid to financial intermediaries for selling shares of the Fund. Depending on the holding period, FDC may receive contingent deferred sales charges levied on Class A, Class T, Class B, and Class C redemptions. The deferred sales charges range from 5.00% to 1.00% for Class B shares, 1.00% for Class C shares, 1.00% for certain purchases of Class A shares and .25% for certain purchases of Class T shares.
Annual Report
5. Fees and Other Transactions with Affiliates - continued
Sales Load - continued
For the period, sales charge amounts retained by FDC were as follows:
| Retained
by FDC |
Class A | $ 40,974 |
Class T | 7,602 |
Class B* | 9,371 |
Class C* | 4,952 |
| $ 62,899 |
* When Class B and Class C shares are initially sold, FDC pays commissions from its own resources to financial intermediaries through which the sales are made.
Transfer Agent Fees. Fidelity Investments Institutional Operations Company, Inc. (FIIOC), an affiliate of FMR, is the transfer, dividend disbursing and shareholder servicing agent for each class of the Fund. FIIOC receives account fees and asset-based fees that vary according to the account size and type of account of the shareholders of the respective classes of the Fund, except for Class F. FIIOC receives no fees for providing transfer agency services to Class F. FIIOC pays for typesetting, printing and mailing of shareholder reports, except proxy statements. For the period, transfer agent fees for each class were as follows:
| Amount | % of
Average
Net Assets |
Class A | $ 413,829 | .30 |
Class T | 150,262 | .28 |
Class B | 21,652 | .30 |
Class C | 131,410 | .30 |
Small Cap Value | 3,956,103 | .23 |
Institutional Class | 283,320 | .25 |
| $ 4,956,576 | |
Accounting and Security Lending Fees. Fidelity Service Company, Inc. (FSC), an affiliate of FMR, maintains the Fund's accounting records. The accounting fee is based on the level of average net assets for each month. Under a separate contract, FSC administers the security lending program. The security lending fee is based on the number and duration of lending transactions.
Brokerage Commissions. The Fund placed a portion of its portfolio transactions with brokerage firms which are affiliates of the investment adviser. The commissions paid to these affiliated firms were $23,890 for the period.
Annual Report
Notes to Financial Statements - continued
5. Fees and Other Transactions with Affiliates - continued
Interfund Lending Program. Pursuant to an Exemptive Order issued by the SEC, the Fund, along with other registered investment companies having management contracts with FMR, may participate in an interfund lending program. This program provides an alternative credit facility allowing the funds to borrow from, or lend money to, other participating affiliated funds. At period end, there were no interfund loans outstanding. The Fund's activity in this program during the period for which loans were outstanding was as follows:
Borrower or Lender | Average
Loan Balance | Weighted Average
Interest Rate | Interest
Expense |
Borrower | $ 6,367,333 | .34% | $ 359 |
6. Committed Line of Credit.
The Fund participates with other funds managed by FMR or an affiliate in a $4.25 billion credit facility (the "line of credit") to be utilized for temporary or emergency purposes to fund shareholder redemptions or for other short-term liquidity purposes. The Fund has agreed to pay commitment fees on its pro-rata portion of the line of credit, which amounted to $6,842 and is reflected in Miscellaneous expenses on the Statement of Operations. During the period, there were no borrowings on this line of credit.
7. Security Lending.
The Fund lends portfolio securities through a lending agent from time to time in order to earn additional income. For equity securities, a lending agent is used and may loan securities to certain qualified borrowers, including Fidelity Capital Markets (FCM), a broker-dealer affiliated with the Fund. On the settlement date of the loan, the Fund receives collateral (in the form of U.S. Treasury obligations, letters of credit and/or cash) against the loaned securities and maintains collateral in an amount not less than 100% of the market value of the loaned securities during the period of the loan. The market value of the loaned securities is determined at the close of business of the Fund and any additional required collateral is delivered to the Fund on the next business day. If the borrower defaults on its obligation to return the securities loaned because of insolvency or other reasons, a fund could experience delays and costs in recovering the securities loaned or in gaining access to the collateral. Any cash collateral received is invested in the Fidelity Securities Lending Cash Central Fund. The value of loaned securities and cash collateral at period end are disclosed on the Fund's Statement of Assets and Liabilities. The value of securities loaned to FCM at period end was $3,305,772. Security lending income represents the income earned on investing cash collateral, less rebates paid to borrowers and any lending agent fees associated with the loan, plus any premium payments received for lending certain types of securities. Security lending income is
Annual Report
7. Security Lending - continued
presented in the Statement of Operations as a component of income from Fidelity Central Funds. Total security lending income during the period amounted to $204,102, including $40,274 from securities loaned to FCM.
8. Expense Reductions.
Many of the brokers with whom FMR places trades on behalf of the Fund provided services to the Fund in addition to trade execution. These services included payments of certain expenses on behalf of the Fund totaling $31,201 for the period.
9. Distributions to Shareholders.
Distributions to shareholders of each class were as follows:
Years ended July 31, | 2012 | 2011 |
From net investment income | | |
Class A | $ 57,416 | $ 602,963 |
Class T | - | 175,083 |
Class B | - | 8,350 |
Class C | - | 50,685 |
Small Cap Value | 2,736,678 | 13,136,446 |
Class F | 858,633 | 1,502,640 |
Institutional Class | 160,977 | 674,898 |
Total | $ 3,813,704 | $ 16,151,065 |
From net realized gain | | |
Class A | $ 8,369,079 | $ 938,086 |
Class T | 3,332,444 | 417,804 |
Class B | 513,839 | 85,354 |
Class C | 2,835,863 | 362,483 |
Small Cap Value | 109,450,254 | 16,213,209 |
Class F | 18,207,376 | 1,278,822 |
Institutional Class | 6,261,999 | 755,301 |
Total | $ 148,970,854 | $ 20,051,059 |
10. Share Transactions.
Transactions for each class of shares were as follows:
| Shares | Dollars |
Years ended July 31, | 2012 | 2011 | 2012 | 2011 |
Class A | | | | |
Shares sold | 3,582,114 | 4,641,222 | $ 51,112,084 | $ 70,784,911 |
Reinvestment of distributions | 639,382 | 98,821 | 7,957,627 | 1,412,739 |
Shares redeemed | (3,203,028) | (2,860,682) | (45,298,282) | (43,524,578) |
Net increase (decrease) | 1,018,468 | 1,879,361 | $ 13,771,429 | $ 28,673,072 |
Annual Report
Notes to Financial Statements - continued
10. Share Transactions - continued
| Shares | Dollars |
Years ended July 31, | 2012 | 2011 | 2012 | 2011 |
Class T | | | | |
Shares sold | 1,074,645 | 1,830,956 | $ 15,238,625 | $ 27,619,849 |
Reinvestment of distributions | 264,657 | 40,370 | 3,258,576 | 573,649 |
Shares redeemed | (1,066,289) | (1,537,319) | (14,773,000) | (23,500,005) |
Net increase (decrease) | 273,013 | 334,007 | $ 3,724,201 | $ 4,693,493 |
Class B | | | | |
Shares sold | 17,886 | 84,331 | $ 244,464 | $ 1,230,023 |
Reinvestment of distributions | 36,117 | 5,817 | 433,889 | 79,168 |
Shares redeemed | (156,185) | (265,513) | (2,129,294) | (3,874,627) |
Net increase (decrease) | (102,182) | (175,365) | $ (1,450,941) | $ (2,565,436) |
Class C | | | | |
Shares sold | 840,854 | 1,131,174 | $ 11,606,643 | $ 16,672,873 |
Reinvestment of distributions | 202,948 | 25,779 | 2,439,209 | 354,104 |
Shares redeemed | (895,789) | (848,659) | (12,102,998) | (12,648,504) |
Net increase (decrease) | 148,013 | 308,294 | $ 1,942,854 | $ 4,378,473 |
Small Cap Value | | | | |
Shares sold | 27,786,966 | 35,677,635 | $ 403,227,336 | $ 541,990,483 |
Reinvestment of distributions | 8,564,707 | 1,987,755 | 107,820,730 | 28,460,668 |
Shares redeemed | (41,177,942) | (46,640,533) | (579,334,071) | (708,788,001) |
Net increase (decrease) | (4,826,269) | (8,975,143) | $ (68,286,005) | $ (138,336,850) |
Class F | | | | |
Shares sold | 17,383,615 | 11,644,633 | $ 249,495,726 | $ 177,097,711 |
Reinvestment of distributions | 1,506,337 | 192,943 | 19,066,009 | 2,781,462 |
Shares redeemed | (1,906,027) | (2,052,505) | (26,618,099) | (32,200,197) |
Net increase (decrease) | 16,983,925 | 9,785,071 | $ 241,943,636 | $ 147,678,976 |
Institutional Class | | | | |
Shares sold | 4,662,732 | 4,417,342 | $ 67,294,175 | $ 67,359,213 |
Reinvestment of distributions | 445,761 | 90,435 | 5,619,794 | 1,288,856 |
Shares redeemed | (2,373,514) | (3,788,938) | (33,655,059) | (58,540,522) |
Net increase (decrease) | 2,734,979 | 718,839 | $ 39,258,910 | $ 10,107,547 |
11. Other.
The Fund's organizational documents provide former and current trustees and officers with a limited indemnification against liabilities arising in connection with the performance of their duties to the Fund. In the normal course of business, the Fund may also enter into contracts that provide general indemnifications. The Fund's maximum exposure under these arrangements is unknown as this would be dependent on future claims that may be made against the Fund. The risk of material loss from such claims is considered remote.
Annual Report
11. Other - continued
At the end of the period, the Fidelity Freedom Funds and Fidelity Freedom K Funds were the owners of record, in the aggregate, of approximately 43% of the total outstanding shares of the Fund.
Annual Report
Report of Independent Registered Public Accounting Firm
To the Trustees of Fidelity Securities Fund and the Shareholders of Fidelity Small Cap Value Fund:
In our opinion, the accompanying statement of assets and liabilities, including the schedule of investments, and the related statements of operations and of changes in net assets and the financial highlights present fairly, in all material respects, the financial position of Fidelity Small Cap Value Fund (a fund of Fidelity Securities Fund) at July 31, 2012, the results of its operations for the year then ended, the changes in its net assets for each of the two years in the period then ended and the financial highlights for each of the periods indicated, in conformity with accounting principles generally accepted in the United States of America. These financial statements and financial highlights (hereafter referred to as "financial statements") are the responsibility of the Fidelity Small Cap Value Fund's management. Our responsibility is to express an opinion on these financial statements based on our audits. We conducted our audits of these financial statements in accordance with the standards of the Public Company Accounting Oversight Board (United States). Those standards require that we plan and perform the audit to obtain reasonable assurance about whether the financial statements are free of material misstatement. An audit includes examining, on a test basis, evidence supporting the amounts and disclosures in the financial statements, assessing the accounting principles used and significant estimates made by management, and evaluating the overall financial statement presentation. We believe that our audits, which included confirmation of securities at July 31, 2012 by correspondence with the custodian and brokers, provide a reasonable basis for our opinion.
PricewaterhouseCoopers LLP
Boston, Massachusetts
September 12, 2012
Annual Report
Trustees and Officers
The Trustees, Members of the Advisory Board, and executive officers of the trust and fund, as applicable, are listed below. The Board of Trustees governs the fund and is responsible for protecting the interests of shareholders. The Trustees are experienced executives who meet periodically throughout the year to oversee the fund's activities, review contractual arrangements with companies that provide services to the fund, oversee management of the risks associated with such activities and contractual arrangements, and review the fund's performance. Except for James C. Curvey, each of the Trustees oversees 228 funds advised by FMR or an affiliate. Mr. Curvey oversees 435 funds advised by FMR or an affiliate.
The Trustees hold office without limit in time except that (a) any Trustee may resign; (b) any Trustee may be removed by written instrument, signed by at least two-thirds of the number of Trustees prior to such removal; (c) any Trustee who requests to be retired or who has become incapacitated by illness or injury may be retired by written instrument signed by a majority of the other Trustees; and (d) any Trustee may be removed at any special meeting of shareholders by a two-thirds vote of the outstanding voting securities of the trust. Each Trustee who is not an interested person (as defined in the 1940 Act) (Independent Trustee), shall retire not later than the last day of the calendar year in which his or her 75th birthday occurs. The Independent Trustees may waive this mandatory retirement age policy with respect to individual Trustees. The executive officers and Advisory Board Members hold office without limit in time, except that any officer and Advisory Board Member may resign or may be removed by a vote of a majority of the Trustees at any regular meeting or any special meeting of the Trustees. Except as indicated, each individual has held the office shown or other offices in the same company for the past five years.
Experience, Skills, Attributes, and Qualifications of the Fund's Trustees. The Governance and Nominating Committee has adopted a statement of policy that describes the experience, qualifications, attributes, and skills that are necessary and desirable for potential Independent Trustee candidates (Statement of Policy). The Board believes that each Trustee satisfied at the time he or she was initially elected or appointed a Trustee, and continues to satisfy, the standards contemplated by the Statement of Policy. The Governance and Nominating Committee also engages professional search firms to help identify potential Independent Trustee candidates who have the experience, qualifications, attributes, and skills consistent with the Statement of Policy. From time to time, additional criteria based on the composition and skills of the current Independent Trustees, as well as experience or skills that may be appropriate in light of future changes to board composition, business conditions, and regulatory or other developments, have also been considered by the professional search firms and the Governance and Nominating Committee. In addition, the Board takes into account the Trustees' commitment and participation in Board and committee meetings, as well as their leadership of standing and ad hoc committees throughout their tenure.
In determining that a particular Trustee was and continues to be qualified to serve as a Trustee, the Board has considered a variety of criteria, none of which, in isolation, was controlling. The Board believes that, collectively, the Trustees have balanced and diverse experience, qualifications, attributes, and skills, which allow the Board to operate effectively in governing the fund and protecting the interests of shareholders. Information about the specific experience, skills, attributes, and qualifications of each Trustee, which in each case led to the Board's conclusion that the Trustee should serve (or continue to serve) as a trustee of the fund, is provided below.
Annual Report
Board Structure and Oversight Function. James C. Curvey is an interested person (as defined in the 1940 Act) and currently serves as Chairman. The Trustees have determined that an interested Chairman is appropriate and benefits shareholders because an interested Chairman has a personal and professional stake in the quality and continuity of services provided to the fund. Independent Trustees exercise their informed business judgment to appoint an individual of their choosing to serve as Chairman, regardless of whether the Trustee happens to be independent or a member of management. The Independent Trustees have determined that they can act independently and effectively without having an Independent Trustee serve as Chairman and that a key structural component for assuring that they are in a position to do so is for the Independent Trustees to constitute a substantial majority for the Board. The Independent Trustees also regularly meet in executive session. Ned C. Lautenbach serves as Chairman of the Independent Trustees and as such (i) acts as a liaison between the Independent Trustees and management with respect to matters important to the Independent Trustees and (ii) with management prepares agendas for Board meetings.
Fidelity funds are overseen by different Boards of Trustees. The fund's Board oversees Fidelity's equity and high income funds and another Board oversees Fidelity's investment-grade bond, money market, and asset allocation funds. The asset allocation funds may invest in Fidelity funds overseen by the fund's Board. The use of separate Boards, each with its own committee structure, allows the Trustees of each group of Fidelity funds to focus on the unique issues of the funds they oversee, including common research, investment, and operational issues. On occasion, the separate Boards establish joint committees to address issues of overlapping consequences for the Fidelity funds overseen by each Board.
The Trustees operate using a system of committees to facilitate the timely and efficient consideration of all matters of importance to the Trustees, the fund, and fund shareholders and to facilitate compliance with legal and regulatory requirements and oversight of the fund's activities and associated risks. The Board, acting through its committees, has charged FMR and its affiliates with (i) identifying events or circumstances the occurrence of which could have demonstrably adverse effects on the fund's business and/or reputation; (ii) implementing processes and controls to lessen the possibility that such events or circumstances occur or to mitigate the effects of such events or circumstances if they do occur; and (iii) creating and maintaining a system designed to evaluate continuously business and market conditions in order to facilitate the identification and implementation processes described in (i) and (ii) above. Because the day-to-day operations and activities of the fund are carried out by or through FMR, its affiliates and other service providers, the fund's exposure to risks is mitigated but not eliminated by the processes overseen by the Trustees. While each of the Board's committees has responsibility for overseeing different aspects of the fund's activities, oversight is exercised primarily through the Operations, Audit, and Compliance Committees. In addition, the Independent Trustees have worked with FMR to enhance the Board's oversight of investment and financial risks, legal and regulatory risks, technology risks, and operational risks, including the development of additional risk reporting to the Board. For example, a working group comprised of Independent Trustees and FMR has worked and continues to work to review the Fidelity funds' valuation-related activities, reporting and risk management. Appropriate personnel, including but not limited to the fund's Chief Compliance Officer (CCO), FMR's internal auditor, the independent accountants, the fund's Treasurer and portfolio management personnel, make periodic reports to the Board's committees, as appropriate, including an annual review of FMR's risk management program for the Fidelity funds. The responsibilities of each standing committee, including their oversight responsibilities, are described further under "Standing Committees of the Fund's Trustees."
Annual Report
Trustees and Officers - continued
The fund's Statement of Additional Information (SAI) includes more information about the Trustees. To request a free copy, call Fidelity at 1-800-208-0098.
Interested Trustees*:
Correspondence intended for each Trustee who is an interested person may be sent to Fidelity Investments, 82 Devonshire Street, Boston, Massachusetts 02109.
Name, Age; Principal Occupations and Other Relevant Experience+ |
James C. Curvey (77) |
| Year of Election or Appointment: 2007 Mr. Curvey is Trustee and Chairman of the Board of Trustees of certain Trusts. Mr. Curvey also serves as Trustee (2007-present) of other investment companies advised by FMR. Mr. Curvey is a Director of Fidelity Investments Money Management, Inc. (2009-present), Director of Fidelity Research & Analysis Co. (2009-present) and Director of FMR and FMR Co., Inc. (2007-present). Mr. Curvey is also Vice Chairman (2007-present) and Director of FMR LLC. In addition, Mr. Curvey serves as an Overseer for the Boston Symphony Orchestra and a member of the Trustees of Villanova University. Previously, Mr. Curvey was the Vice Chairman (2006-2007) and Director (2000-2007) of FMR Corp. |
Ronald P. O'Hanley (55) |
| Year of Election or Appointment: 2011 Mr. O'Hanley is Director of FMR Co., Inc. (2010-present), Director of Fidelity Investments Money Management, Inc. (2010-present), Director of Fidelity Research & Analysis Company (2010-present), President of Fidelity Asset Management and Corporate Services and a member of Fidelity's Executive Committee (2010-present). Previously, Mr. O'Hanley served as President and Chief Executive Officer of BNY Mellon Asset Management (2007-2010). Mr. O'Hanley also served as Vice Chairman of Bank New York Mellon Corp. and a member of that firm's Executive Committee. Prior to the 2007 merger of The Bank of New York and Mellon Financial Corporation, he was Vice Chairman of Mellon Financial Corporation and President and Chief Executive Officer of Mellon Asset Management. He joined Mellon in February 1997. Mr. O'Hanley currently serves as Chairman of the Boston Public Library Foundation Board of Directors and sits on the Board of Directors of Beth Israel Deaconess Medical Center, the Board of Trustees of the Marine Biological Laboratory and the Advisory Board of the Maxwell School of Citizenship and Public Administration at Syracuse University. Mr. O'Hanley also chairs the Council on Asset Management for the Financial Services Roundtable and is a member of the Board of Directors of Institutional Investor's U.S. Institute. |
* Trustees have been determined to be "Interested Trustees" by virtue of, among other things, their affiliation with the trust or various entities under common control with FMR.
+ The information above includes each Trustee's principal occupation during the last five years and other information relating to the experience, attributes, and skills relevant to each Trustee's qualifications to serve as a Trustee, which led to the conclusion that each Trustee should serve as a Trustee for the fund.
Annual Report
Trustees and Officers - continued
Independent Trustees:
Correspondence intended for each Independent Trustee (that is, the Trustees other than the Interested Trustees) may be sent to Fidelity Investments, P.O. Box 55235, Boston, Massachusetts 02205-5235.
Name, Age; Principal Occupations and Other Relevant Experience+ |
Dennis J. Dirks (64) |
| Year of Election or Appointment: 2005 Prior to his retirement in May 2003, Mr. Dirks was Chief Operating Officer and a member of the Board of The Depository Trust & Clearing Corporation (DTCC). He also served as President, Chief Operating Officer, and Board member of The Depository Trust Company (DTC) and President and Board member of the National Securities Clearing Corporation (NSCC). In addition, Mr. Dirks served as Chief Executive Officer and Board member of the Government Securities Clearing Corporation, Chief Executive Officer and Board member of the Mortgage-Backed Securities Clearing Corporation, as a Trustee and a member of the Finance Committee of Manhattan College (2005-2008), and as a Trustee and a member of the Finance Committee of AHRC of Nassau County (2006-2008). Mr. Dirks is a member of the Independent Directors Council (IDC) Governing Council (2010-present) and Board of Directors for The Brookville Center for Children's Services, Inc. (2009-present). |
Alan J. Lacy (58) |
| Year of Election or Appointment: 2008 Mr. Lacy serves as Senior Adviser (2007-present) of Oak Hill Capital Partners, L.P. (private equity). Mr. Lacy also served as Chief Executive Officer (2000-2005) and Vice Chairman (2005-2006) of Sears Holdings Corporation and Sears, Roebuck and Co. (retail). In addition, Mr. Lacy serves as a member of the Board of Directors of Dave & Buster's Entertainment, Inc. (restaurant and entertainment complexes, 2010-present), Earth Fare, Inc. (retail grocery, 2012-present), The Hillman Companies, Inc. (hardware wholesalers, 2010-present), and Bristol-Myers Squibb Company (global pharmaceuticals, 2007-present). Mr. Lacy is a member of the Board of Trustees of The National Parks Conservation Association (2006-present). Previously, Mr. Lacy served as Chairman of the Board of Trustees of the National Parks Conservation Association (2008-2011) and as a member of the Board of Directors for the Western Union Company (global money transfer, 2006-2011). |
Ned C. Lautenbach (68) |
| Year of Election or Appointment: 2000 Mr. Lautenbach is Chairman of the Independent Trustees of the Equity and High Income Funds (2006-present). Mr. Lautenbach currently serves as the Lead Director of the Eaton Corporation Board of Directors (diversified industrial, 1997-present). Mr. Lautenbach is Chairman of the Board of Directors of the Philharmonic Center for the Arts in Naples, Florida (2012-present) and a member of the Council on Foreign Relations (1994-present). Previously, Mr. Lautenbach was a Partner/Advisory Partner at Clayton, Dubilier & Rice, LLC (private equity investment, 1998-2010), as well as a Director of Sony Corporation (2006-2007). |
Joseph Mauriello (67) |
| Year of Election or Appointment: 2008 Prior to his retirement in January 2006, Mr. Mauriello served in numerous senior management positions including Deputy Chairman and Chief Operating Officer (2004-2005), and Vice Chairman of Financial Services (2002-2004) of KPMG LLP US (professional services, 1965-2005). Mr. Mauriello currently serves as a member of the Board of Directors of XL Group plc. (global insurance and re-insurance, 2006-present). Previously, Mr. Mauriello served as a Director of the Hamilton Funds of the Bank of New York (2006-2007) and of Arcadia Resources Inc. (health care services and products, 2007-2012). |
Robert W. Selander (61) |
| Year of Election or Appointment: 2011 Previously, Mr. Selander served as a Member of the Advisory Board of Fidelity's Equity and High Income Funds (2011), Executive Vice Chairman (2010), Chief Executive Officer (2009-2010), and President and Chief Executive Officer (1997-2009) of Mastercard, Inc. |
Cornelia M. Small (68) |
| Year of Election or Appointment: 2005 Ms. Small is a member of the Board of Directors of the Teagle Foundation (2009-present). Ms. Small is also a member of the Investment Committee, and Chair (2008-present) and a member of the Board of Trustees of Smith College. In addition, Ms. Small serves on the Investment Committee of the Berkshire Taconic Community Foundation (2008-present). Previously, Ms. Small served as Chairperson of the Investment Committee (2002-2008) of Smith College. In addition, Ms. Small served as Chief Investment Officer, Director of Global Equity Investments, and a member of the Board of Directors of Scudder, Stevens & Clark and Scudder Kemper Investments. |
William S. Stavropoulos (73) |
| Year of Election or Appointment: 2002 Mr. Stavropoulos is Vice Chairman of the Independent Trustees of the Equity and High Income Funds (2006-present). Mr. Stavropoulos serves as President and Founder of the Michigan Baseball Foundation, the Great Lakes Loons (2007-present). Mr. Stavropoulos is Chairman Emeritus of the Board of Directors of The Dow Chemical Company, where he previously served in numerous senior management positions, including President, CEO (1995-2000; 2002-2004), Chairman of the Executive Committee (2000-2006), and as a member of the Board of Directors (1990-2006). Currently, Mr. Stavropoulos is Chairman of Univar (global distributor of commodity and specialty chemicals, 2010-present), a Director of Teradata Corporation (data warehousing and technology solutions, 2008-present), Chemical Financial Corporation, Maersk Inc. (industrial conglomerate), Tyco International, Inc. (multinational manufacturing and services, 2007-present), and a member of the Advisory Board for Metalmark Capital (private equity investment, 2005-present). Mr. Stavropoulos is a special advisor to Clayton, Dubilier & Rice, LLC (private equity investment). In addition, Mr. Stavropoulos is a member of the University of Notre Dame Advisory Council for the College of Science. |
David M. Thomas (63) |
| Year of Election or Appointment: 2008 Previously, Mr. Thomas served as Executive Chairman (2005-2006) and Chairman and Chief Executive Officer (2000-2005) of IMS Health, Inc. (pharmaceutical and healthcare information solutions). In addition, Mr. Thomas serves as a member of the Board of Directors of Fortune Brands, Inc. (consumer products), and Interpublic Group of Companies, Inc. (marketing communication, 2004-present). |
Michael E. Wiley (61) |
| Year of Election or Appointment: 2008 Mr. Wiley also serves as a Director of Asia Pacific Exploration Consolidated (international oil and gas exploration and production, 2008-present). Mr. Wiley serves as a Director of Tesoro Corporation (independent oil refiner and marketer, 2005-present), and a Director of Bill Barrett Corporation (exploration and production, 2005-present). In addition, Mr. Wiley also serves as a Director of Post Oak Bank (privately-held bank, 2004-present). Previously, Mr. Wiley served as a member of the Board of Trustees of the University of Tulsa (2000-2006; 2007-2010), as a Senior Energy Advisor of Katzenbach Partners, LLC (consulting, 2006-2007), as an Advisory Director of Riverstone Holdings (private investment), Chairman, President, and CEO of Baker Hughes, Inc. (oilfield services, 2000-2004), and as Director of Spinnaker Exploration Company (exploration and production, 2001-2005). |
Annual Report
+ The information above includes each Trustee's principal occupation during the last five years and other information relating to the experience, attributes, and skills relevant to each Trustee's qualifications to serve as a Trustee, which led to the conclusion that each Trustee should serve as a Trustee for the fund.
Advisory Board Members and Executive Officers:
Correspondence intended for David A. Rosow and Garnett A. Smith may be sent to Fidelity Investments, P.O. Box 55235, Boston, Massachusetts 02205-5235. Correspondence intended for each executive officer, Edward C. Johnson 3d, and Peter S. Lynch may be sent to Fidelity Investments, 82 Devonshire Street, Boston, Massachusetts 02109.
Name, Age; Principal Occupation |
Edward C. Johnson 3d (82) |
| Year of Election or Appointment: 2011 Member of the Advisory Board of Fidelity's Equity and High Income Funds. Mr. Johnson serves as Chief Executive Officer, Chairman, and a Director of FMR LLC, and also serves as Chairman and Director of FIL Limited. Previously, Mr. Johnson served as a Trustee and Chairman of the Board of certain Fidelity Trusts, Chairman and a Director of FMR, Chairman and a Director of FMR Co., Inc., and President of FMR LLC (2006-2007). |
Peter S. Lynch (68) |
| Year of Election or Appointment: 2003 Member of the Advisory Board of Fidelity's Equity and High Income Funds. Mr. Lynch is Vice Chairman and a Director of FMR and FMR Co., Inc. In addition, Mr. Lynch serves as a Trustee of Boston College and as the Chairman of the Inner-City Scholarship Fund. Previously, Mr. Lynch served on the Special Olympics International Board of Directors (1997-2006). |
David A. Rosow (69) |
| Year of Election or Appointment: 2012 Member of the Advisory Board of Fidelity's Equity and High Income Funds. Chairman and Chief Executive Officer of International Golf Group, Inc. (golf course development, 1990-present). Previously, Mr. Rosow served as Chairman and Chief Executive Officer of Rosow & Company, Inc. (private investment company, 1989-2011), a Lead Director of Hudson United Bancorp (2001-2006) and as a Director of TD Banknorth (1996-2006). In addition, Mr. Rosow is a member (2008-present) and President (2009-present) of the Town Council of Palm Beach, Florida. |
Garnett A. Smith (64) |
| Year of Election or Appointment: 2012 Member of the Advisory Board of Fidelity's Equity and High Income Funds. Prior to Mr. Smith's retirement, he served as Chairman and Chief Executive Officer of Inbrand Corp. (manufacturer of personal absorbent products, 1990-1997). He also served as President (1986-1990) of Inbrand Corp. Prior to his employment with Inbrand Corp., he was employed by a retail fabric chain and North Carolina National Bank. In addition, Mr. Smith is a board member of the Jackson Hole Land Trust (2009-present). |
Kenneth B. Robins (42) |
| Year of Election or Appointment: 2008 President and Treasurer of Fidelity's Equity and High Income Funds. Mr. Robins also serves as President and Treasurer (2010-present) and Assistant Treasurer (2009-present) of other Fidelity funds and is an employee of Fidelity Investments (2004-present). Previously, Mr. Robins served as Deputy Treasurer of the Fidelity funds (2005-2008) and Treasurer and Chief Financial Officer of The North Carolina Capital Management Trust: Cash and Term Portfolios (2006-2008). |
Brian B. Hogan (47) |
| Year of Election or Appointment: 2009 Vice President of Equity and High Income Funds. Mr. Hogan also serves as President of FMR's Equity Division (2009-present). Previously, Mr. Hogan served as Senior Vice President, Equity Research of FMR (2006-2009) and as a portfolio manager. |
Thomas C. Hense (48) |
| Year of Election or Appointment: 2008 or 2010 Vice President of Fidelity's High Income (2008), Small Cap (2008), and Value (2010) Funds. Previously, Mr. Hense served as a portfolio manager for Fidelity's Institutional Money Management Group (Pyramis) (2003-2008). |
Scott C. Goebel (44) |
| Year of Election or Appointment: 2008 Secretary and Chief Legal Officer (CLO) of the Fidelity funds. Mr. Goebel also serves as Secretary of Fidelity Investments Money Management, Inc. (FIMM) (2010-present) and Fidelity Research and Analysis Company (FRAC) (2010-present); Secretary and CLO of The North Carolina Capital Management Trust: Cash and Term Portfolios (2008-present); General Counsel, Secretary, and Senior Vice President of FMR (2008-present) and FMR Co., Inc. (2008-present); employed by FMR LLC or an affiliate (2001-present); Chief Legal Officer of Fidelity Management & Research (Hong Kong) Limited (2008-present) and Assistant Secretary of Fidelity Management & Research (Japan) Inc. (2008-present), and Fidelity Management & Research (U.K.) Inc. (2008-present). Previously, Mr. Goebel served as Assistant Secretary of FIMM (2008-2010), FRAC (2008-2010), and the Funds (2007-2008) and as Vice President and Secretary of Fidelity Distributors Corporation (FDC) (2005-2007). |
William C. Coffey (43) |
| Year of Election or Appointment: 2009 Assistant Secretary of Fidelity's Equity and High Income Funds. Mr. Coffey also serves as Senior Vice President and Deputy General Counsel of FMR LLC (2010-present), and is an employee of Fidelity Investments. Previously, Mr. Coffey served as Vice President and Associate General Counsel of FMR LLC (2005-2009). |
Elizabeth Paige Baumann (44) |
| Year of Election or Appointment: 2012 Anti-Money Laundering (AML) Officer of the Fidelity funds. Ms. Baumann also serves as AML Officer of The North Carolina Capital Management Trust: Cash and Term Portfolios (2012-present), Chief AML Officer of FMR LLC (2012-present), and is an employee of Fidelity Investments. Previously, Ms. Baumann served as Vice President and Deputy Anti-Money Laundering Officer (2007-2012). |
Christine Reynolds (53) |
| Year of Election or Appointment: 2008 Chief Financial Officer of the Fidelity funds. Ms. Reynolds became President of Fidelity Pricing and Cash Management Services (FPCMS) in August 2008. Ms. Reynolds served as Chief Operating Officer of FPCMS (2007-2008). Previously, Ms. Reynolds served as President, Treasurer, and Anti-Money Laundering officer of the Fidelity funds (2004-2007). |
Joseph A. Hanlon (44) |
| Year of Election or Appointment: 2012 Chief Compliance Officer of Fidelity's Equity and High Income Funds. Mr. Hanlon serves as Compliance Officer of FMR, FMR Co., Inc., Fidelity Investments Money Management, Inc. (FIMM), Fidelity Research and Analysis Company (FRAC), Fidelity Management & Research (Japan) Inc., Fidelity Management & Research (U.K.) Inc., Fidelity Management & Research (Hong Kong), and Strategic Advisers, Inc. (2009-present), as Senior Vice President of the Fidelity Asset Management Division (2009-present), and is an employee of Fidelity Investments. |
Joseph F. Zambello (55) |
| Year of Election or Appointment: 2011 Deputy Treasurer of the Fidelity funds. Mr. Zambello is an employee of Fidelity Investments. Previously, Mr. Zambello served as Vice President of FMR's Program Management Group (2009-2011) and Vice President of the Transfer Agent Oversight Group (2005-2009). |
Adrien E. Deberghes (44) |
| Year of Election or Appointment: 2008 Deputy Treasurer of Fidelity's Equity and High Income Funds. Mr. Deberghes also serves as Vice President (2011-present) and Assistant Treasurer (2010-present) of other Fidelity funds, and is an employee of Fidelity Investments (2008-present). Previously, Mr. Deberghes served as Senior Vice President of Mutual Fund Administration at State Street Corporation (2007-2008), Senior Director of Mutual Fund Administration at Investors Bank & Trust (2005-2007), and Director of Finance for Dunkin' Brands (2000-2005). |
Stephanie J. Dorsey (43) |
| Year of Election or Appointment: 2010 Assistant Treasurer of Fidelity's Equity and High Income Funds. Ms. Dorsey also serves as Deputy Treasurer of other Fidelity funds (2008-present) and is an employee of Fidelity Investments (2008-present). Previously, Ms. Dorsey served as Treasurer (2004-2008) of the JPMorgan Mutual Funds and Vice President (2004-2008) of JPMorgan Chase Bank. |
John R. Hebble (54) |
| Year of Election or Appointment: 2009 Assistant Treasurer of Fidelity's Equity and High Income Funds. Mr. Hebble also serves as President (2011-present), Treasurer, and Chief Financial Officer of The North Carolina Capital Management Trust: Cash and Term Portfolios (2008-present), President and Treasurer of other Fidelity funds (2008-present) and is an employee of Fidelity Investments. |
Gary W. Ryan (53) |
| Year of Election or Appointment: 2005 Assistant Treasurer of the Fidelity funds. Mr. Ryan is an employee of Fidelity Investments. Previously, Mr. Ryan served as Vice President of Fund Reporting in Fidelity Pricing and Cash Management Services (FPCMS) (1999-2005). |
Jonathan Davis (44) |
| Year of Election or Appointment: 2010 Assistant Treasurer of the Fidelity funds. Mr. Davis is also Assistant Treasurer of Fidelity Rutland Square Trust II and Fidelity Commonwealth Trust II. Mr. Davis is an employee of Fidelity Investments. Previously, Mr. Davis served as Vice President and Associate General Counsel of FMR LLC (2003-2010). |
Annual Report
Distributions (Unaudited)
The Board of Trustees of Fidelity Small Cap Value Fund voted to pay to shareholders of record at the opening of business, the following distributions per share derived from capital gains realized from sales of portfolio securities, and dividends derived from net investment income:
| Pay Date | Record Date | Dividends | Capital Gains |
Institutional Class | 09/10/12 | 09/07/12 | $0.027 | $0.411 |
Institutional Class designates 100% of the dividends distributed during the fiscal year as qualifying for the dividends-received deduction for corporate shareholders.
Institutional Class designates 100% of the dividends distributed during the fiscal year as amounts which can be taken into account as a dividend for the purposes of the maximum rate under section 1(h)(11) of the Internal Revenue Code.
The fund hereby designates as a capital gain dividend with respect to the taxable year ended July 31,2012, $98,274,256, or, if subsequently determined to be different, the net capital gain of such year.
The fund will notify shareholders in January 2013 of amounts for use in preparing 2012 income tax returns.
Annual Report
Board Approval of Investment Advisory Contracts and Management Fees
Fidelity Small Cap Value Fund
Each year, the Board of Trustees, including the Independent Trustees (together, the Board), votes on the renewal of the management contract and sub-advisory agreements (together, the Advisory Contracts) for the fund. The Board, assisted by the advice of fund counsel and Independent Trustees' counsel, requests and considers a broad range of information relevant to the renewal of the Advisory Contracts throughout the year.
The Board meets regularly and, at each of its meetings, considers factors that are relevant to its annual consideration of the renewal of the fund's Advisory Contracts, including the services and support provided to the fund and its shareholders. The Board has established various standing committees, each composed of and chaired by Independent Trustees with varying backgrounds, to which the Board has assigned specific subject matter responsibilities in order to enhance effective decision-making by the Board. The Board, acting directly and through its Committees, requests and receives information concerning the annual consideration of the renewal of the fund's Advisory Contracts. The Board also meets as needed to consider matters specifically related to the Board's annual consideration of the renewal of Advisory Contracts. Members of the Board may also meet with trustees of other Fidelity funds through ad hoc joint committees to discuss certain matters relevant to the Fidelity funds.
At its July 2012 meeting, the Board of Trustees, including the Independent Trustees, unanimously determined to renew the fund's Advisory Contracts. In reaching its determination, the Board considered all factors it believed relevant, including (i) the nature, extent, and quality of the services to be provided to the fund and its shareholders (including the investment performance of the fund); (ii) the competitiveness of the fund's management fee and total expense ratio relative to peer funds; (iii) the total costs of the services to be provided by and the profits to be realized by Fidelity from its relationship with the fund; (iv) the extent to which economies of scale exist and would be realized as the fund grows; and (v) whether fee levels reflect these economies of scale, if any, for the benefit of fund shareholders.
In considering whether to renew the Advisory Contracts for the fund, the Board reached a determination, with the assistance of fund counsel and Independent Trustees' counsel and through the exercise of its business judgment, that the renewal of the Advisory Contracts is in the best interests of the fund and its shareholders and that the compensation payable under the Advisory Contracts is fair and reasonable. The Board's decision to renew the Advisory Contracts was not based on any single factor, but rather was based on a comprehensive consideration of all the information provided to the Board at its meetings throughout the year. The Board, in reaching its determination to renew the Advisory Contracts, is aware that shareholders in the fund have a broad range of investment choices available to them, including a wide choice among mutual funds offered by Fidelity's competitors, and that the fund's shareholders, who have the opportunity to review and weigh the disclosure provided by the fund in its prospectus and other public disclosures, have chosen to invest in this fund, managed by Fidelity.
Annual Report
Board Approval of Investment Advisory Contracts and
Management Fees - continued
Nature, Extent, and Quality of Services Provided. The Board considered the staffing within the investment adviser, FMR, and the sub-advisers (together, the Investment Advisers), including the backgrounds of the fund's investment personnel, and also considered the fund's investment objective, strategies, and related investment philosophy. The Independent Trustees also had discussions with senior management of Fidelity's investment operations and investment groups. The Board considered the structure of the portfolio manager compensation program and whether this structure provides appropriate incentives to act in the best interests of the fund.
Resources Dedicated to Investment Management and Support Services. The Board and the Fund Oversight and Research Committees reviewed the general qualifications and capabilities of the Investment Advisers' investment staff, including its size, education, experience, and resources, as well as the Investment Advisers' approach to recruiting, training, managing, and compensating investment personnel. The Board also noted that FMR has continued to increase the resources devoted to non-U.S. offices, including expansion of Fidelity's global investment organization. The Board noted that Fidelity's analysts have extensive resources, tools and capabilities that allow them to conduct sophisticated quantitative and fundamental analysis, as well as credit analysis of issuers, counterparties and guarantors. The Board also believes that Fidelity's investment professionals have sufficient access to global information and data so as to provide competitive investment results over time, and that those professionals also have access to sophisticated tools that permit them to assess portfolio construction and risk and performance attribution characteristics continuously, as well as to transmit new information and research conclusions rapidly around the world. Additionally, in its deliberations, the Board considered the Investment Advisers' trading and risk management capabilities and resources, which are an integral part of the investment management process.
Shareholder and Administrative Services. The Board considered (i) the nature, extent, quality, and cost of advisory, administrative, and shareholder services performed by the Investment Advisers and their affiliates under the Advisory Contracts and under separate agreements covering transfer agency, pricing and bookkeeping, and securities lending services for the fund; (ii) the nature and extent of the supervision of third party service providers, principally custodians and subcustodians; and (iii) the resources devoted to, and the record of compliance with, the fund's compliance policies and procedures. The Board also reviewed the allocation of fund brokerage, including allocations to brokers affiliated with the Investment Advisers, the use of brokerage commissions to pay fund expenses, and the use of "soft" commission dollars to pay for research services.
Annual Report
The Board noted that the growth of fund assets over time across the complex allows Fidelity to reinvest in the development of services designed to enhance the value or convenience of the Fidelity funds as investment vehicles. These services include 24-hour access to account information and market information through telephone representatives and over the Internet, investor education materials and asset allocation tools, and the expanded availability of Fidelity Investor Centers.
Investment in a Large Fund Family. The Board considered the benefits to shareholders of investing in a Fidelity fund, including the benefits of investing in a fund that is part of a large family of funds offering a variety of investment disciplines and providing a large variety of mutual fund investor services. The Board noted that Fidelity had taken, or had made recommendations that resulted in the Fidelity funds taking, a number of actions over the previous year that benefited particular funds, including (i) continuing to dedicate additional resources to investment research and support of the senior management team that oversees asset management; (ii) persisting in efforts to enhance Fidelity's research capabilities, in particular, international research; (iii) launching new funds and making other enhancements to meet client needs for global and income-oriented solutions; (iv) continuing to launch dedicated lower cost underlying funds to meet investment management's portfolio construction needs related to expanding underlying fund options, specifically for the Freedom Fund product lines; (v) adopting a "Stock Selector" sector neutral investment approach and employing a team of portfolio managers who are sector specialists to manage certain funds; (vi) rationalizing product lines and gaining increased efficiencies through the mergers of several funds into other funds; (vii) strengthening the Spartan Index Fund product line by adding new funds and/or new low-cost institutional share classes, restructuring fund expenses to accommodate new classes, and reducing investment minimums for certain classes of shares; (viii) modifying the eligibility criteria for Institutional Class shares to increase their appeal to government entities and charitable investors; and (ix) reducing certain transfer agent fee rates.
Investment Performance. The Board considered whether the fund has operated in accordance with its investment objective, as well as its record of compliance with its investment restrictions. It also reviewed the fund's absolute investment performance for each class, as well as the fund's relative investment performance for each class measured over multiple periods against (i) a broad-based securities market index, and (ii) a peer group of mutual funds deemed appropriate by Fidelity and reviewed by the Board. The following charts considered by the Board show, over the one-, three-, and five-year periods ended December 31, 2011, the cumulative total returns of Institutional Class (Class I) and Class B of the fund, the cumulative total returns of a broad-based securities market index ("benchmark"), and a range of cumulative total returns of a peer group of mutual funds identified by Morningstar, Inc. as having an investment style similar to that of the fund based on underlying portfolio holdings. The returns of Institutional Class (Class I) and Class B show the performance of the highest and lowest performing classes, respectively (based on five-year performance). The box within each chart shows the 25th percentile return (top of box) and the 75th percentile return (bottom of box) of the peer group. Returns shown above the box are in the first quartile and returns shown below the box are in the fourth quartile. The percentage beaten numbers noted below each chart correspond to the percentile box and represent the percentage of funds in the peer group whose performance was equal to or lower than that of the class indicated.
Annual Report
Board Approval of Investment Advisory Contracts and
Management Fees - continued
Fidelity Small Cap Value Fund
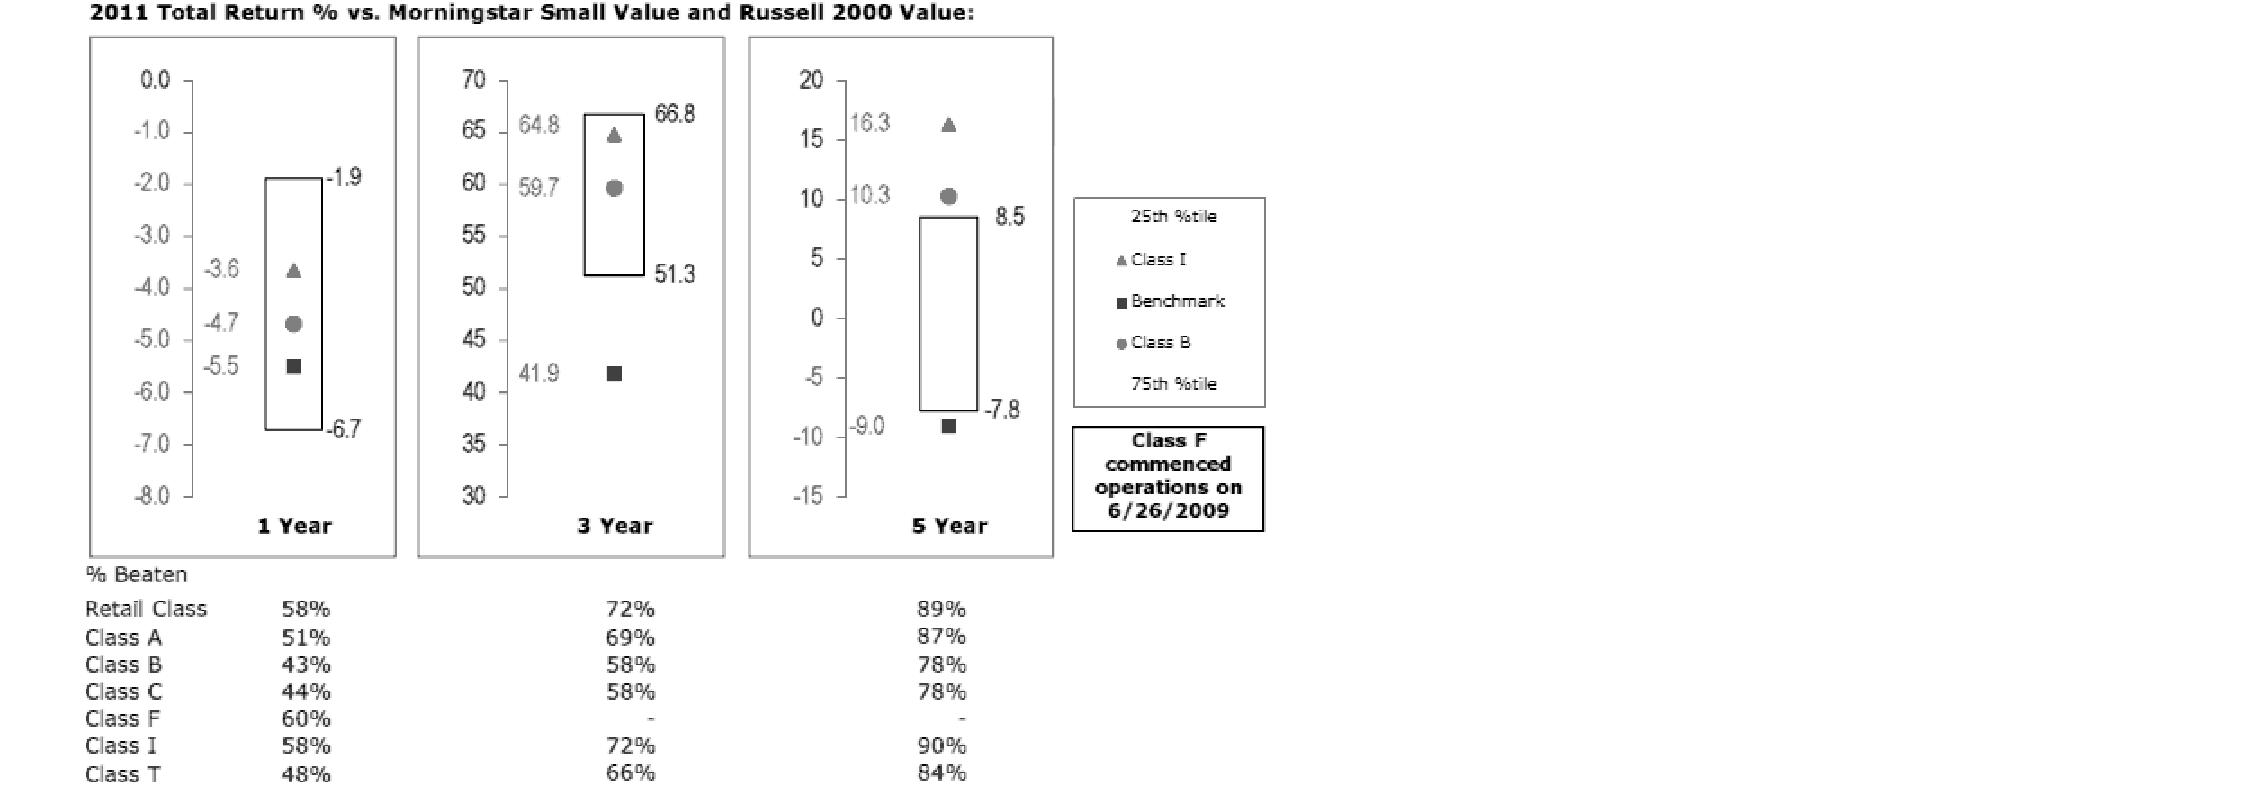
The Board reviewed the fund's relative investment performance against its peer group and noted that the performance of Institutional Class (Class I) of the fund was in the second quartile for the one- and three-year periods and the first quartile for the five-year period. The Board also noted that the investment performance of Institutional Class (Class I) of the fund compared favorably to its benchmark for all the periods shown. The Board considered that the variations in performance among the fund's classes reflect the variations in class expenses, which result in lower performance for higher expense classes. The Board also reviewed the fund's performance since inception as well as performance in the current year.
The Board also considered that the fund's management fee is subject to upward or downward adjustment depending upon whether, and to what extent, the fund's investment performance for the performance period exceeds, or is exceeded by, the record (over the same period) of a Board-approved performance adjustment index. The Board noted that the performance adjustment provides FMR with a strong economic incentive to seek to achieve superior performance for the fund's shareholders and helps to more closely align the interests of FMR and the fund's shareholders.
Annual Report
Based on its review, the Board concluded that the nature, extent, and quality of services provided to the fund under the Advisory Contracts should benefit the fund's shareholders.
Competitiveness of Management Fee and Total Expense Ratio. The Board considered the fund's management fee and total expense ratio compared to "mapped groups" of competitive funds and classes. Fidelity creates "mapped groups" by combining similar Lipper investment objective categories that have comparable management fee characteristics. Combining Lipper investment objective categories aids the Board's management fee and total expense ratio comparisons by broadening the competitive group used for comparison and by reducing the number of universes to which various Fidelity funds are compared.
Management Fee. The Board considered two proprietary management fee comparisons for the 12-month periods shown in the chart below. The group of Lipper funds used by the Board for management fee comparisons is referred to below as the "Total Mapped Group." The Total Mapped Group comparison focuses on a fund's standing relative to the total universe of comparable funds available to investors in terms of gross management fees before expense reimbursements or caps, and without giving effect to the fund's performance adjustment. "TMG %" represents the percentage of funds in the Total Mapped Group that had management fees that were lower than the fund's. For example, a TMG % of 13% means that 87% of the funds in the Total Mapped Group had higher management fees than the fund. The "Asset-Size Peer Group" (ASPG) comparison focuses on a fund's standing relative to non-Fidelity funds similar in size to the fund within the Total Mapped Group. The ASPG represents at least 15% of the funds in the Total Mapped Group with comparable asset size and management fee characteristics, subject to a minimum of 50 funds (or all funds in the Total Mapped Group if fewer than 50). Additional information, such as the ASPG quartile in which the fund's management fee ranked and the impact of the fund's performance adjustment, is also included in the chart and considered by the Board.
Annual Report
Board Approval of Investment Advisory Contracts and
Management Fees - continued
Fidelity Small Cap Value Fund
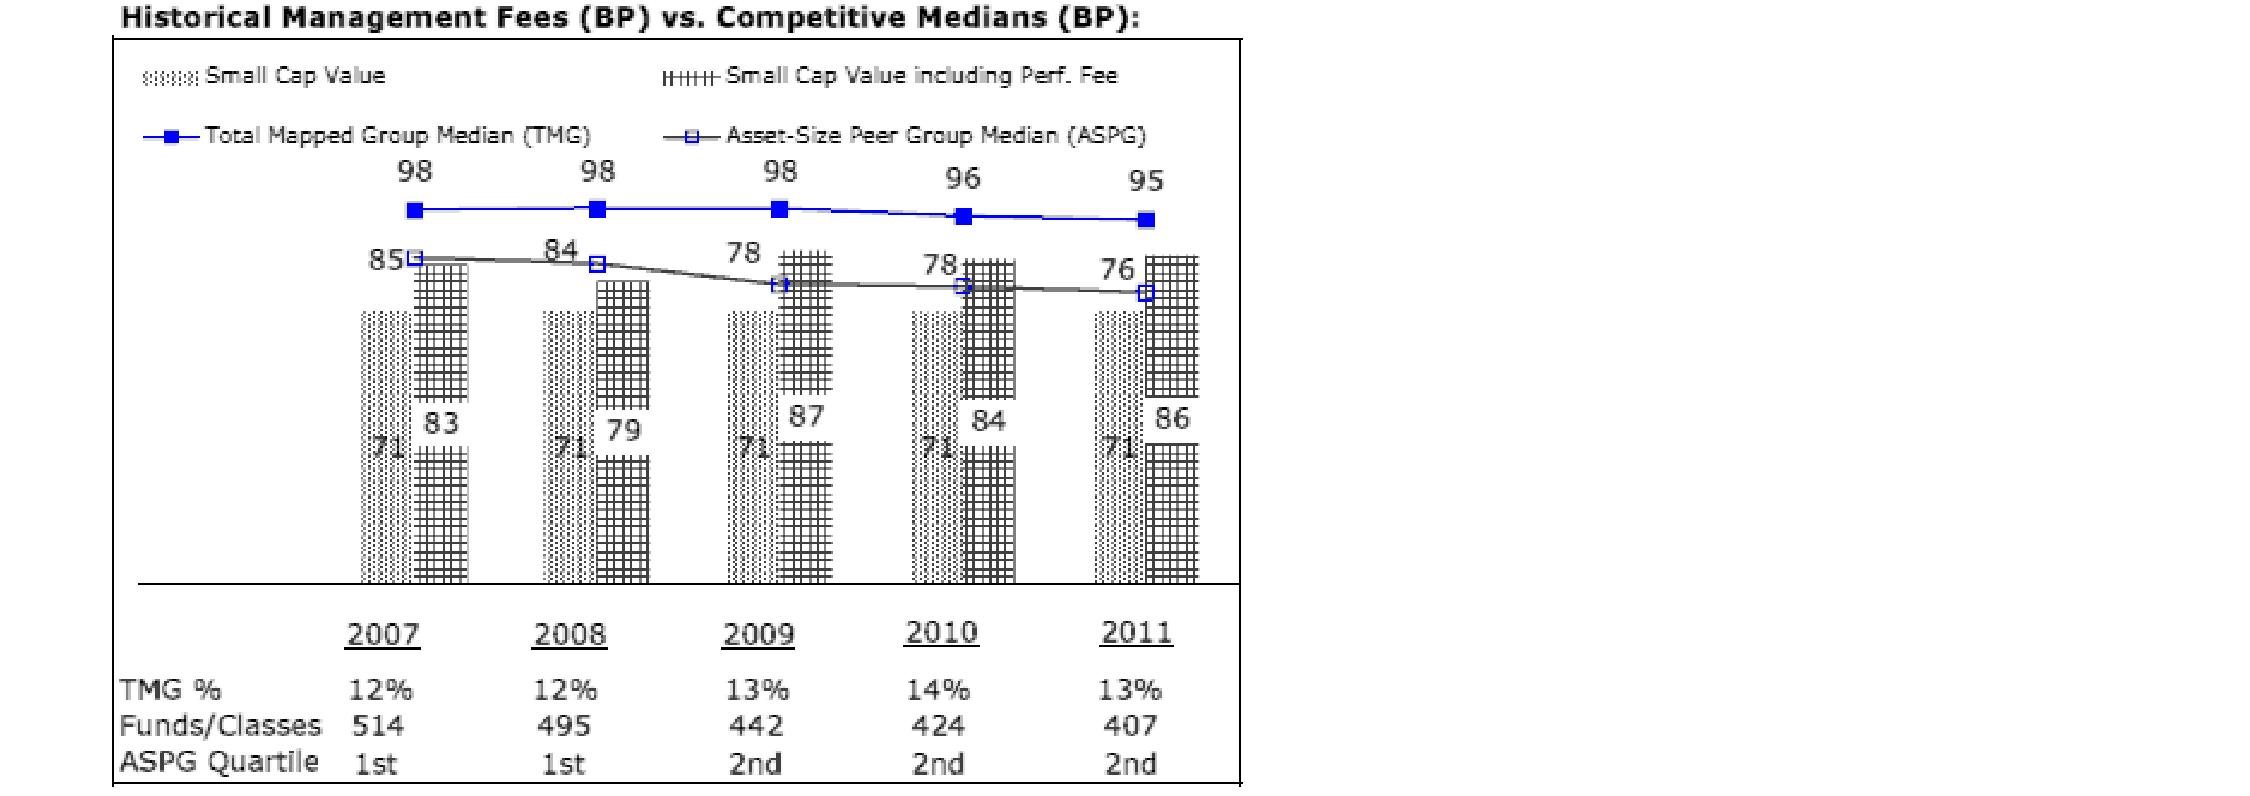
The Board noted that the fund's management fee ranked below the median of its Total Mapped Group and below the median of its ASPG for 2011. The Board also noted the effect of the fund's positive performance adjustment on the fund's management fee ranking. The Board noted that the performance adjustment for each year represents calculations for performance periods that differ from the periods shown in the performance charts above.
Based on its review, the Board concluded that the fund's management fee is fair and reasonable in light of the services that the fund receives and the other factors considered.
Total Expense Ratio. In its review of each class's total expense ratio, the Board considered the fund's management fee as well as other fund or class expenses, as applicable, such as transfer agent fees, pricing and bookkeeping fees, fund-paid 12b-1 fees, and custodial, legal, and audit fees. The Board also noted the effects of any waivers and reimbursements on fees and expenses, as well as the impact of the fund's performance adjustment. As part of its review, the Board also considered the current and historical total expense ratios of each class of the fund compared to competitive fund median expenses. Each class of the fund is compared to those funds and classes in the Total Mapped Group (used by the Board for management fee comparisons) that have a similar sales load structure.
The Board noted that the total expense ratio of each of the retail class and Class F ranked below its competitive median for 2011, the total expense ratio of Institutional Class ranked equal to its competitive median for 2011, and the total expense ratio of each of Class A, Class T, Class B, and Class C ranked above its competitive median for 2011. The Board considered that various factors, including 12b-1 fees, positive or negative performance adjustments, and relatively higher other expenses in the case of small fund size, can affect total expense ratios. The Board noted that the total expense ratio of Class T was above the competitive median primarily because of higher 12b-1 fees on Class T. Class T has a higher 12b-1 fee, but a lower front-end sales charge, than traditionally priced front-end sales charge classes. The Board considered that Class T is primarily sold load-waived in the retirement plan market where its 0.50% 12b-1 fee is comparable to competing no-load, higher 12b-1 fee classes designed specifically for retirement plans. The Board noted that the fund offers multiple classes, each of which has a different sales load and 12b-1 fee structure, and that the multiple structures are intended to offer a range of pricing options for the intermediary market. The Board also noted that the total expense ratios of the classes vary primarily by the level of their 12b-1 fees, although differences in transfer agent fees may also cause expenses to vary from class to class.
Annual Report
Fees Charged to Other Fidelity Clients. The Board also considered Fidelity fee structures and other information with respect to clients of FMR and its affiliates, such as other mutual funds advised or subadvised by FMR or its affiliates, pension plan clients, and other institutional clients. The Board noted the findings of the 2010 ad hoc joint committee (created with the board of other Fidelity funds), which reviewed and compared Fidelity's institutional investment advisory business with its business of providing services to the Fidelity funds, including the differences in services provided, fees charged, and costs incurred, as well as competition in their respective marketplaces.
Based on its review of total expense ratios and fees charged to other Fidelity clients, the Board concluded that the total expense ratio of each class of the fund was reasonable, although in some cases above the median of the universe presented for comparison, in light of the services that the fund and its shareholders receive and the other factors considered.
Costs of the Services and Profitability. The Board considered the revenues earned and the expenses incurred by Fidelity in conducting the business of developing, marketing, distributing, managing, administering and servicing the fund and its shareholders. The Board also considered the level of Fidelity's profits in respect of all the Fidelity funds.
On an annual basis, FMR presents to the Board Fidelity's profitability for the fund. Fidelity calculates the profitability for each fund, as well as aggregate profitability for groups of Fidelity funds and all Fidelity funds, using a series of detailed revenue and cost allocation methodologies which originate with the books and records of Fidelity on which Fidelity's audited financial statements are based. The Audit Committee of the Board reviews any significant changes from the prior year's methodologies.
Annual Report
Board Approval of Investment Advisory Contracts and
Management Fees - continued
PricewaterhouseCoopers LLP (PwC), independent registered public accounting firm and auditor to Fidelity and certain Fidelity funds, has been engaged annually by the Board as part of the Board's assessment of Fidelity's profitability analysis. PwC's engagement includes the review and assessment of Fidelity's methodologies used in determining the revenues and expenses attributable to Fidelity's mutual fund business, and completion of agreed-upon procedures surrounding the mathematical accuracy of fund profitability and its conformity to allocation methodologies. After considering PwC's reports issued under the engagement and information provided by Fidelity, the Board concluded that while other allocation methods may also be reasonable, Fidelity's profitability methodologies are reasonable in all material respects.
The Board also reviewed Fidelity's non-fund businesses and fall-out benefits related to the mutual fund business as well as cases where Fidelity's affiliates may benefit from or be related to the fund's business.
The Board considered the costs of the services provided by and the profits realized by Fidelity in connection with the operation of the fund and was satisfied that the profitability was not excessive in the circumstances.
Economies of Scale. The Board considered whether there have been economies of scale in respect of the management of the Fidelity funds, whether the Fidelity funds (including the fund) have appropriately benefited from any such economies of scale, and whether there is potential for realization of any further economies of scale. The Board considered the extent to which the fund will benefit from economies of scale through increased services to the fund, through waivers or reimbursements, or through fee or expense reductions. The Board also noted that in 2009, it and the board of other Fidelity funds created an ad hoc committee (the Economies of Scale Committee) to analyze whether FMR attains economies of scale in respect of the management and servicing of the Fidelity funds, whether the Fidelity funds have appropriately benefited from such economies of scale, and whether there is potential for realization of any further economies of scale.
The Board recognized that the fund's management contract incorporates a "group fee" structure, which provides for lower group fee rates as total fund assets under FMR's management increase, and for higher group fee rates as total fund assets under FMR's management decrease. FMR calculates the group fee rates based on a tiered asset "breakpoint" schedule that varies based on asset class. The Board considered that the group fee is designed to deliver the benefits of economies of scale to fund shareholders when total Fidelity fund assets increase, even if assets of any particular fund are unchanged or have declined, because some portion of Fidelity's costs are attributable to services provided to all Fidelity funds, and all funds benefit if those costs can be allocated among more assets. The Board concluded that, given the group fee structure, fund shareholders will benefit from lower management fees as assets under FMR's management increase at the fund complex level, regardless of whether Fidelity achieves any such economies of scale.
Annual Report
The Board concluded, taking into account the analysis of the Economies of Scale Committee, that economies of scale, if any, are being appropriately shared between fund shareholders and Fidelity.
Additional Information Requested by the Board. In order to develop fully the factual basis for consideration of the Fidelity funds' Advisory Contracts, the Board requested and received additional information on certain topics, including (i) fund performance trends, actions to be taken by FMR to improve certain funds' overall performance, and Fidelity's long-term strategies for certain funds; (ii) the potential to further rationalize the Fidelity fund lineup with the possibility of achieving savings for the funds and Fidelity; (iii) Fidelity's compensation structure for portfolio managers and other key investment personnel; (iv) the amount of the investment that each portfolio manager has made in the Fidelity fund(s) that he or she manages; (v) the realization of fall-out benefits in certain Fidelity business units; (vi) Fidelity's group fee structures, the potential impact of regulatory changes on such structures, and the rationale for the individual fee rates of certain funds; (vii) fund profitability methodology, including Fidelity's cost allocation methodology, and the impact of certain factors on fund profitability results; (viii) trends regarding industry use of performance fee structures and the possibility of implementing performance fee structures for additional funds; and (ix) the impact of net redemptions from the Fidelity funds.
Based on its evaluation of all of the conclusions noted above, and after considering all factors it believed relevant, the Board ultimately concluded that the advisory fee structures are fair and reasonable, and that the fund's Advisory Contracts should be renewed.
Annual Report
Investment Adviser
Fidelity Management & Research Company
Boston, MA
Investment Sub-Advisers
FMR Co., Inc.
Fidelity Management & Research
(U.K.) Inc.
Fidelity Management & Research
(Hong Kong) Limited
Fidelity Management & Research
(Japan) Inc.
General Distributor
Fidelity Distributors Corporation
Smithfield, RI
Transfer and Service Agents
Fidelity Investments Institutional
Operations Company, Inc.
Boston, MA
Fidelity Service Company, Inc.
Boston, MA
Custodian
Citibank, N.A.
New York, NY
(Fidelity Investment logo)(registered trademark)
ASCVI-UANN-0912
1.803743.107
Fidelity®
Blue Chip Growth
Fund -
Class K
Annual Report
July 31, 2012
(Fidelity Cover Art)
Contents
Performance | (Click Here) | How the fund has done over time. |
Management's Discussion of Fund Performance | (Click Here) | The Portfolio Manager's review of fund performance and strategy. |
Shareholder Expense Example | (Click Here) | An example of shareholder expenses. |
Investment Changes | (Click Here) | A summary of major shifts in the fund's investments over the past six months. |
Investments | (Click Here) | A complete list of the fund's investments with their market values. |
Financial Statements | (Click Here) | Statements of assets and liabilities, operations, and changes in net assets, as well as financial highlights. |
Notes | (Click Here) | Notes to the financial statements. |
Report of Independent Registered Public Accounting Firm | (Click Here) | |
Trustees and Officers | (Click Here) | |
Distributions | (Click Here) | |
Board Approval of Investment Advisory Contracts and Management Fees | (Click Here) | |
To view a fund's proxy voting guidelines and proxy voting record for the 12-month period ended June 30, visit http://www.fidelity.com/proxyvotingresults or visit the Securities and Exchange Commission's (SEC) web site at http://www.sec.gov. You may also call 1-800-835-5092 to request a free copy of the proxy voting guidelines.
Standard & Poor's, S&P and S&P 500 are registered service marks of The McGraw-Hill Companies, Inc. and have been licensed for use by Fidelity Distributors Corporation.
Other third party marks appearing herein are the property of their respective owners.
All other marks appearing herein are registered or unregistered trademarks or service marks of FMR LLC or an affiliated company. © 2012 FMR LLC. All rights reserved.
Annual Report
This report and the financial statements contained herein are submitted for the general information of the shareholders of the fund. This report is not authorized for distribution to prospective investors in the fund unless preceded or accompanied by an effective prospectus.
A fund files its complete schedule of portfolio holdings with the SEC for the first and third quarters of each fiscal year on Form N-Q. Forms N-Q are available on the SEC's web site at http://www.sec.gov. A fund's Forms N-Q may be reviewed and copied at the SEC's Public Reference Room in Washington, DC. Information regarding the operation of the SEC's Public Reference Room may be obtained by calling 1-800-SEC-0330. For a complete list of a fund's portfolio holdings, view the most recent holdings listing, semiannual report, or annual report on Fidelity's web site at http://www.fidelity.com, http://www.advisor.fidelity.com, or http://www.401k.com, as applicable.
NOT FDIC INSURED • MAY LOSE VALUE • NO BANK GUARANTEE
Neither the fund nor Fidelity Distributors Corporation is a bank.
Annual Report
Average annual total return reflects the change in the value of an investment, assuming reinvestment of the class' distributions from dividend income and capital gains (the profits earned upon the sale of securities that have grown in value, if any) and assuming a constant rate of performance each year. The $10,000 table and the fund's returns do not reflect the deduction of taxes that a shareholder would pay on fund distributions or the redemption of fund shares. During periods of reimbursement by Fidelity, a fund's total return will be greater than it would be had the reimbursement not occurred. How a fund did yesterday is no guarantee of how it will do tomorrow.
Average Annual Total Returns
Periods ended July 31, 2012 | Past 1
year | Past 5
years | Past 10
years |
Class K A | 2.43% | 4.26% | 6.24% |
A The initial offering of Class K shares took place on May 9, 2008. Returns prior to May 9, 2008 are those of Fidelity® Blue Chip Growth Fund, the original class of the fund.
$10,000 Over 10 Years
Let's say hypothetically that $10,000 was invested in Fidelity® Blue Chip Growth Fund - Class K on July 31, 2002. The chart shows how the value of your investment would have changed, and also shows how the Russell 1000® Growth Index performed over the same period. The initial offering of Class K took place on May 9, 2008. See above for additional information regarding the performance of Class K.
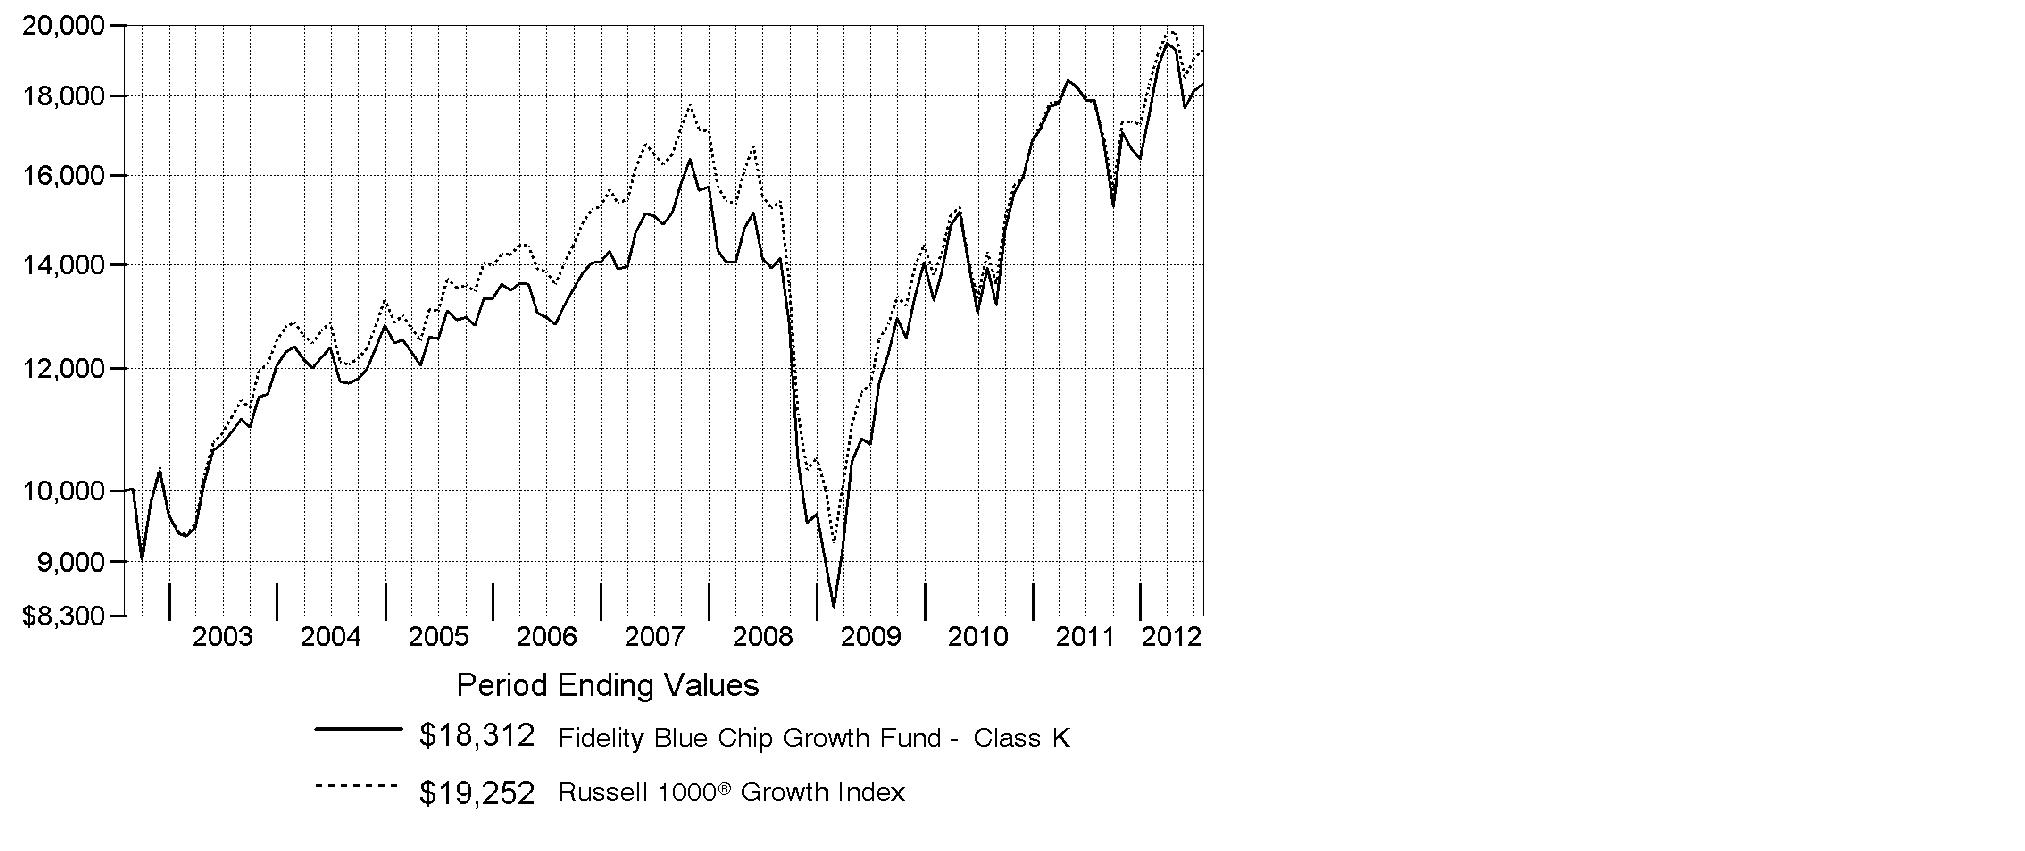
Annual Report
Market Recap: Major U.S. equity benchmarks posted solid gains for the year ending July 31, 2012, amid an uncertain investment environment. The broad-based S&P 500® Index returned 9.13%, while the blue-chip-laden Dow Jones Industrial AverageSM and technology-heavy Nasdaq Composite® Index gained 10.12% and 7.83%, respectively. Volatility spiked during the period's first half, as equities plummeted late last summer on Europe's debt woes, political wrangling over the U.S. debt ceiling and the sovereign credit-rating downgrade that followed. By October, a seemingly improved U.S. economy rejuvenated stocks, paving the way for major equity benchmarks to post their best first-quarter performance since 1998. However, more eurozone trouble, signs that the U.S. economy had turned sluggish and a slowdown in China caused stocks to slip in May, before a new wave of optimism took hold in June and July. Within the S&P 500®, more-defensive sectors such as telecommunication services (+30%) and consumer staples (+20%) fared best, while materials and energy significantly underperformed, returning -5%. Small- and mid-cap stocks trailed their less-volatile large-cap counterparts, with the Russell 2000® Index adding 0.19% and the Russell Midcap® Index rising 2.28%. Given turmoil and local currency weakness in Europe, foreign developed-markets stocks lost ground, with the MSCI® EAFE® Index returning -11.32%.
Comments from Sonu Kalra, Portfolio Manager of Fidelity® Blue Chip Growth Fund: For the year, the fund's Class K shares rose 2.43%, trailing the 8.26% gain of the Russell 1000® Growth Index. Picks in the food, beverage and tobacco segment of consumer staples hurt, primarily due to the fund's overweighted position in Green Mountain Coffee Roasters, by far the largest relative detractor. Investors began to worry that the maker of Keurig® single-cup coffee systems wouldn't be able to sustain its rapid growth, the company couldn't consistently meet expectations and some well-known hedge fund managers were openly critical about the stock. In May, Green Mountain overestimated the amount of demand for its products and reduced its revenue and earnings expectations. Leading U.S. coal producer Alpha Natural Resources - sold from the fund by period end - detracted, as did the fund's investments in foreign stocks, driven in part by a stronger U.S. dollar. Info tech was a bright spot, where overweighting giant Apple - by far the fund's largest holding - made the biggest overall contribution. Continued strong sales of the company's iPhone® 4S smartphone, personal computers and iPad® tablets boosted Apple's stock. Elsewhere, Hong Kong-based handbag maker Michael Kors Holdings was lifted by significant growth of its retail stores.
The views expressed above reflect those of the portfolio manager(s) only through the end of the period as stated on the cover of this report and do not necessarily represent the views of Fidelity or any other person in the Fidelity organization. Any such views are subject to change at any time based upon market or other conditions and Fidelity disclaims any responsibility to update such views. These views may not be relied on as investment advice and, because investment decisions for a Fidelity fund are based on numerous factors, may not be relied on as an indication of trading intent on behalf of any Fidelity fund.
Annual Report
Shareholder Expense Example
As a shareholder of the Fund, you incur two types of costs: (1) transaction costs, and (2) ongoing costs, including management fees and other Fund expenses. This Example is intended to help you understand your ongoing costs (in dollars) of investing in the Fund and to compare these costs with the ongoing costs of investing in other mutual funds.
The Example is based on an investment of $1,000 invested at the beginning of the period and held for the entire period (February 1, 2012 to July 31, 2012).
Actual Expenses
The first line of the accompanying table for each class of the Fund provides information about actual account values and actual expenses. You may use the information in this line, together with the amount you invested, to estimate the expenses that you paid over the period. Simply divide your account value by $1,000.00 (for example, an $8,600 account value divided by $1,000.00 = 8.6), then multiply the result by the number in the first line for a class of the Fund under the heading entitled "Expenses Paid During Period" to estimate the expenses you paid on your account during this period. A small balance maintenance fee of $12.00 that is charged once a year may apply for certain accounts with a value of less than $2,000. This fee is not included in the table below. If it was, the estimate of expenses you paid during the period would be higher, and your ending account value lower, by this amount. In addition, the Fund, as a shareholder in the underlying Fidelity Central Funds, will indirectly bear its pro-rata share of the fees and expenses incurred by the underlying Fidelity Central Funds. These fees and expenses are not included in the Fund's annualized expense ratio used to calculate the expense estimate in the table below.
Hypothetical Example for Comparison Purposes
The second line of the accompanying table for each class of the Fund provides information about hypothetical account values and hypothetical expenses based on a Class' actual expense ratio and an assumed rate of return of 5% per year before expenses, which is not the Class' actual return. The hypothetical account values and expenses may not be used to estimate the actual ending account balance or expenses you paid for the period. You may use this information to compare the ongoing costs of investing in the Fund and other funds. To do so, compare this 5% hypothetical example with the 5% hypothetical examples that appear in the shareholder reports of the other funds. A small balance maintenance fee of $12.00 that is charged once a year may apply for certain accounts with a value of less than $2,000. This fee is not included in the table below. If it was, the estimate of expenses you paid during the period would be higher, and your ending account value lower, by this amount. In addition, the Fund, as a shareholder in the underlying Fidelity Central Funds, will indirectly bear its pro-rata share of the fees and expenses incurred by the underlying Fidelity Central Funds. These fees and expenses are not included in the Fund's annualized expense ratio used to calculate the expense estimate in the table below.
Please note that the expenses shown in the table are meant to highlight your ongoing costs only and do not reflect any transaction costs. Therefore, the second line of the table is useful in comparing ongoing costs only, and will not help you determine the relative total costs of owning different funds.
Annual Report
| Annualized Expense Ratio | Beginning
Account Value
February 1, 2012 | Ending
Account Value
July 31, 2012 | Expenses Paid
During Period*
February 1, 2012 to
July 31, 2012 |
Blue Chip Growth | .88% | | | |
Actual | | $ 1,000.00 | $ 1,046.40 | $ 4.48 |
Hypothetical A | | $ 1,000.00 | $ 1,020.49 | $ 4.42 |
Class K | .73% | | | |
Actual | | $ 1,000.00 | $ 1,047.50 | $ 3.72 |
Hypothetical A | | $ 1,000.00 | $ 1,021.23 | $ 3.67 |
Class F | .68% | | | |
Actual | | $ 1,000.00 | $ 1,047.60 | $ 3.46 |
Hypothetical A | | $ 1,000.00 | $ 1,021.48 | $ 3.42 |
A 5% return per year before expenses
* Expenses are equal to each Class' annualized expense ratio, multiplied by the average account value over the period, multiplied by 182/366 (to reflect the one-half year period).
Annual Report
Investment Changes (Unaudited)
Top Ten Stocks as of July 31, 2012 |
| % of fund's
net assets | % of fund's net assets
6 months ago |
Apple, Inc. | 10.4 | 9.8 |
Google, Inc. Class A | 5.4 | 4.5 |
Amazon.com, Inc. | 2.1 | 1.7 |
QUALCOMM, Inc. | 2.1 | 2.1 |
The Coca-Cola Co. | 2.1 | 1.9 |
Microsoft Corp. | 1.9 | 1.2 |
Philip Morris International, Inc. | 1.6 | 1.4 |
Broadcom Corp. Class A | 1.5 | 1.0 |
MasterCard, Inc. Class A | 1.3 | 1.1 |
McDonald's Corp. | 1.3 | 2.2 |
| 29.7 | |
Top Five Market Sectors as of July 31, 2012 |
| % of fund's
net assets | % of fund's net assets
6 months ago |
Information Technology | 36.8 | 33.3 |
Consumer Discretionary | 21.1 | 19.8 |
Consumer Staples | 14.1 | 11.6 |
Health Care | 9.3 | 9.5 |
Industrials | 8.5 | 10.8 |
Asset Allocation (% of fund's net assets) |
As of July 31, 2012* | As of January 31, 2012** |
 | Stocks 99.8% | | | Stocks 100.3% | |
 | Convertible
Securities 0.0% | |  | Convertible
Securities 0.1% | |
 | Short-Term
Investments and
Net Other Assets (Liabilities) 0.2% | | | Short-Term
Investments and
Net Other Assets (Liabilities)† (0.4)% | |
* Foreign investments | 9.7% | | ** Foreign investments | 11.4% | |

† Short-term Investments and Net Other Assets (Liabilities) are not included in the pie chart. |
Annual Report
Investments July 31, 2012
Showing Percentage of Net Assets
Common Stocks - 99.3% |
| Shares | | Value (000s) |
CONSUMER DISCRETIONARY - 20.6% |
Auto Components - 0.3% |
Delphi Automotive PLC | 605,200 | | $ 17,182 |
The Goodyear Tire & Rubber Co. (a) | 739,100 | | 8,463 |
TRW Automotive Holdings Corp. (a) | 493,500 | | 19,395 |
| | 45,040 |
Automobiles - 0.7% |
Harley-Davidson, Inc. | 208,600 | | 9,018 |
Hyundai Motor Co. | 75,033 | | 15,728 |
Kia Motors Corp. | 152,660 | | 10,545 |
Tesla Motors, Inc. (a)(d) | 2,702,754 | | 74,110 |
| | 109,401 |
Hotels, Restaurants & Leisure - 4.6% |
Bravo Brio Restaurant Group, Inc. (a) | 740,800 | | 13,386 |
Chipotle Mexican Grill, Inc. (a) | 137,700 | | 40,254 |
Dunkin' Brands Group, Inc. | 533,300 | | 16,148 |
Hyatt Hotels Corp. Class A (a) | 316,497 | | 11,251 |
Jubilant Foodworks Ltd. (a) | 216,731 | | 4,387 |
Las Vegas Sands Corp. | 2,200,900 | | 80,157 |
McDonald's Corp. | 2,218,930 | | 198,284 |
Panera Bread Co. Class A (a) | 658,500 | | 103,707 |
Starbucks Corp. | 2,572,800 | | 116,496 |
Wyndham Worldwide Corp. | 340,985 | | 17,748 |
Yum! Brands, Inc. | 1,328,700 | | 86,153 |
| | 687,971 |
Household Durables - 1.1% |
Lennar Corp. Class A | 1,543,452 | | 45,084 |
SodaStream International Ltd. (a) | 286,400 | | 11,172 |
Toll Brothers, Inc. (a) | 1,176,800 | | 34,327 |
Whirlpool Corp. | 1,143,543 | | 77,258 |
| | 167,841 |
Internet & Catalog Retail - 3.3% |
Amazon.com, Inc. (a) | 1,356,600 | | 316,495 |
Expedia, Inc. (d) | 1,004,300 | | 57,235 |
Kayak Software Corp. | 15,300 | | 513 |
Priceline.com, Inc. (a) | 170,900 | | 113,091 |
| | 487,334 |
Media - 1.6% |
Comcast Corp. Class A | 4,174,700 | | 135,886 |
The Walt Disney Co. | 1,706,000 | | 83,833 |
Common Stocks - continued |
| Shares | | Value (000s) |
CONSUMER DISCRETIONARY - continued |
Media - continued |
Time Warner Cable, Inc. | 174,500 | | $ 14,820 |
Time Warner, Inc. | 113,500 | | 4,440 |
| | 238,979 |
Multiline Retail - 1.4% |
Dollar General Corp. (a) | 636,700 | | 32,478 |
Dollar Tree, Inc. (a) | 329,800 | | 16,602 |
Dollarama, Inc. | 420,234 | | 26,190 |
JCPenney Co., Inc. | 341,700 | | 7,692 |
Macy's, Inc. | 1,977,900 | | 70,888 |
Target Corp. | 883,700 | | 53,596 |
| | 207,446 |
Specialty Retail - 4.4% |
American Eagle Outfitters, Inc. | 142,800 | | 2,973 |
AutoZone, Inc. (a) | 33,600 | | 12,608 |
CarMax, Inc. (a) | 106,400 | | 2,961 |
Cia.Hering SA | 254,600 | | 5,027 |
Five Below, Inc. | 15,500 | | 455 |
Foot Locker, Inc. | 506,500 | | 16,725 |
Francescas Holdings Corp. (a) | 856,800 | | 26,912 |
GNC Holdings, Inc. | 569,900 | | 21,958 |
Home Depot, Inc. | 2,808,900 | | 146,568 |
Limited Brands, Inc. | 2,769,800 | | 131,704 |
Lowe's Companies, Inc. | 769,500 | | 19,522 |
Ross Stores, Inc. | 516,700 | | 34,330 |
TJX Companies, Inc. | 3,643,580 | | 161,338 |
Ulta Salon, Cosmetics & Fragrance, Inc. | 294,400 | | 24,989 |
Urban Outfitters, Inc. (a) | 1,228,400 | | 37,528 |
| | 645,598 |
Textiles, Apparel & Luxury Goods - 3.2% |
Arezzo Industria e Comercio SA | 1,681,000 | | 26,390 |
Brunello Cucinelli SpA | 561,900 | | 7,660 |
Coach, Inc. | 745,500 | | 36,776 |
Fifth & Pacific Companies, Inc. (a)(d) | 2,198,511 | | 24,360 |
Fossil, Inc. (a) | 644,319 | | 46,191 |
lululemon athletica, Inc. (a) | 446,180 | | 25,200 |
Michael Kors Holdings Ltd. | 2,825,537 | | 116,666 |
NIKE, Inc. Class B | 858,200 | | 80,113 |
Common Stocks - continued |
| Shares | | Value (000s) |
CONSUMER DISCRETIONARY - continued |
Textiles, Apparel & Luxury Goods - continued |
PVH Corp. | 954,900 | | $ 75,848 |
Under Armour, Inc. Class A (sub. vtg.) (a) | 511,418 | | 27,842 |
| | 467,046 |
TOTAL CONSUMER DISCRETIONARY | | 3,056,656 |
CONSUMER STAPLES - 14.1% |
Beverages - 4.8% |
Anheuser-Busch InBev SA NV ADR | 734,800 | | 58,211 |
Beam, Inc. | 285,100 | | 17,927 |
Constellation Brands, Inc. Class A (sub. vtg.) (a) | 366,600 | | 10,342 |
Diageo PLC sponsored ADR | 74,000 | | 7,911 |
Dr Pepper Snapple Group, Inc. | 862,000 | | 39,290 |
Monster Beverage Corp. (a) | 2,184,800 | | 145,224 |
PepsiCo, Inc. | 1,619,800 | | 117,808 |
SABMiller PLC | 181,900 | | 7,863 |
The Coca-Cola Co. | 3,773,800 | | 304,923 |
| | 709,499 |
Food & Staples Retailing - 2.7% |
Costco Wholesale Corp. | 759,900 | | 73,087 |
CVS Caremark Corp. | 2,692,800 | | 121,849 |
Fresh Market, Inc. (a) | 445,100 | | 26,212 |
Wal-Mart Stores, Inc. | 1,262,200 | | 93,946 |
Whole Foods Market, Inc. | 960,000 | | 88,109 |
| | 403,203 |
Food Products - 1.7% |
Annie's, Inc. (d) | 13,200 | | 538 |
Calbee, Inc. (d) | 386,000 | | 26,875 |
ConAgra Foods, Inc. | 347,800 | | 8,587 |
DE Master Blenders 1753 NV (a) | 821,500 | | 9,520 |
Green Mountain Coffee Roasters, Inc. (a)(d) | 3,782,299 | | 69,065 |
Kraft Foods, Inc. Class A | 678,200 | | 26,931 |
Mead Johnson Nutrition Co. Class A | 349,400 | | 25,492 |
The Hershey Co. | 1,014,500 | | 72,780 |
The J.M. Smucker Co. | 193,900 | | 14,892 |
| | 254,680 |
Household Products - 1.7% |
Colgate-Palmolive Co. | 500,300 | | 53,712 |
Kimberly-Clark Corp. | 1,046,600 | | 90,960 |
Common Stocks - continued |
| Shares | | Value (000s) |
CONSUMER STAPLES - continued |
Household Products - continued |
Procter & Gamble Co. | 1,337,400 | | $ 86,316 |
Reckitt Benckiser Group PLC | 275,100 | | 15,126 |
| | 246,114 |
Personal Products - 0.4% |
Herbalife Ltd. | 1,137,731 | | 62,450 |
Tobacco - 2.8% |
Altria Group, Inc. | 1,873,900 | | 67,404 |
British American Tobacco PLC (United Kingdom) | 146,800 | | 7,797 |
Lorillard, Inc. | 772,000 | | 99,310 |
Philip Morris International, Inc. | 2,640,600 | | 241,456 |
Souza Cruz SA | 202,200 | | 2,852 |
| | 418,819 |
TOTAL CONSUMER STAPLES | | 2,094,765 |
ENERGY - 5.5% |
Energy Equipment & Services - 2.0% |
Atwood Oceanics, Inc. (a) | 128,800 | | 5,735 |
Ensco PLC Class A | 270,400 | | 14,691 |
Halliburton Co. | 493,200 | | 16,340 |
National Oilwell Varco, Inc. | 1,343,500 | | 97,135 |
Schlumberger Ltd. | 1,886,000 | | 134,396 |
Seadrill Ltd. | 722,500 | | 28,026 |
| | 296,323 |
Oil, Gas & Consumable Fuels - 3.5% |
Anadarko Petroleum Corp. | 1,223,700 | | 84,974 |
Apache Corp. | 344,100 | | 29,634 |
Chevron Corp. | 794,500 | | 87,061 |
Concho Resources, Inc. (a) | 34,600 | | 2,950 |
EOG Resources, Inc. | 315,200 | | 30,893 |
Hess Corp. | 153,700 | | 7,248 |
Marathon Petroleum Corp. | 625,400 | | 29,581 |
Noble Energy, Inc. | 31,100 | | 2,719 |
Occidental Petroleum Corp. | 1,164,000 | | 101,303 |
Peabody Energy Corp. | 787,800 | | 16,449 |
Pioneer Natural Resources Co. | 438,300 | | 38,847 |
Plains Exploration & Production Co. (a) | 1,762,200 | | 70,418 |
Common Stocks - continued |
| Shares | | Value (000s) |
ENERGY - continued |
Oil, Gas & Consumable Fuels - continued |
SM Energy Co. | 439,000 | | $ 20,673 |
Valero Energy Corp. | 117,100 | | 3,220 |
| | 525,970 |
TOTAL ENERGY | | 822,293 |
FINANCIALS - 1.9% |
Capital Markets - 0.4% |
KKR & Co. LP | 623,200 | | 8,719 |
Morgan Stanley | 3,653,912 | | 49,912 |
| | 58,631 |
Commercial Banks - 0.2% |
ICICI Bank Ltd. | 666,777 | | 11,486 |
Wells Fargo & Co. | 366,800 | | 12,402 |
| | 23,888 |
Consumer Finance - 0.3% |
Discover Financial Services | 1,163,600 | | 41,843 |
Diversified Financial Services - 0.9% |
Citigroup, Inc. | 3,352,420 | | 90,951 |
JPMorgan Chase & Co. | 1,283,400 | | 46,202 |
| | 137,153 |
Real Estate Management & Development - 0.1% |
Parsvnath Developers Ltd. (a)(e) | 21,771,340 | | 15,302 |
TOTAL FINANCIALS | | 276,817 |
HEALTH CARE - 9.3% |
Biotechnology - 4.5% |
Alexion Pharmaceuticals, Inc. (a) | 665,000 | | 69,725 |
Alkermes PLC (a) | 917,100 | | 17,049 |
Alnylam Pharmaceuticals, Inc. (a) | 324,500 | | 6,065 |
Amgen, Inc. | 346,300 | | 28,604 |
ARIAD Pharmaceuticals, Inc. (a) | 1,698,200 | | 32,487 |
Biogen Idec, Inc. (a) | 894,800 | | 130,489 |
BioMarin Pharmaceutical, Inc. (a) | 107,500 | | 4,224 |
Clovis Oncology, Inc. | 195,300 | | 3,455 |
Exelixis, Inc. (a) | 3,425,500 | | 21,409 |
Gilead Sciences, Inc. (a) | 2,463,300 | | 133,831 |
Grifols SA (a) | 95,600 | | 2,981 |
Grifols SA ADR | 38,200 | | 853 |
Common Stocks - continued |
| Shares | | Value (000s) |
HEALTH CARE - continued |
Biotechnology - continued |
Ironwood Pharmaceuticals, Inc. Class A (a) | 473,000 | | $ 6,088 |
Medivation, Inc. (a) | 149,500 | | 14,905 |
Merrimack Pharmaceuticals, Inc. | 265,000 | | 2,112 |
Merrimack Pharmaceuticals, Inc. (f) | 2,142,858 | | 15,371 |
ONYX Pharmaceuticals, Inc. (a) | 256,300 | | 19,215 |
Regeneron Pharmaceuticals, Inc. (a) | 297,100 | | 40,005 |
Spectrum Pharmaceuticals, Inc. (a)(d) | 1,347,100 | | 18,846 |
Theravance, Inc. (a) | 437,314 | | 12,739 |
Vertex Pharmaceuticals, Inc. (a) | 1,669,800 | | 81,002 |
ZIOPHARM Oncology, Inc. (a) | 721,728 | | 4,063 |
| | 665,518 |
Health Care Equipment & Supplies - 1.0% |
Align Technology, Inc. (a) | 919,500 | | 31,226 |
Baxter International, Inc. | 132,600 | | 7,758 |
Covidien PLC | 215,000 | | 12,014 |
Insulet Corp. (a) | 310,600 | | 6,075 |
Intuitive Surgical, Inc. (a) | 44,400 | | 21,379 |
The Cooper Companies, Inc. | 730,272 | | 54,960 |
William Demant Holding A/S (a) | 126,000 | | 11,906 |
| | 145,318 |
Health Care Providers & Services - 1.2% |
Apollo Hospitals Enterprise Ltd. | 649,448 | | 7,366 |
Catamaran Corp. (a) | 102,300 | | 8,689 |
Express Scripts Holding Co. (a) | 2,168,727 | | 125,656 |
McKesson Corp. | 479,144 | | 43,473 |
| | 185,184 |
Health Care Technology - 0.1% |
athenahealth, Inc. (a)(d) | 154,575 | | 14,144 |
Pharmaceuticals - 2.5% |
Abbott Laboratories | 244,100 | | 16,186 |
Allergan, Inc. | 126,100 | | 10,349 |
AVANIR Pharmaceuticals Class A (a) | 2,885,556 | | 8,253 |
Bristol-Myers Squibb Co. | 2,435,100 | | 86,690 |
Elan Corp. PLC sponsored ADR (a) | 2,445,600 | | 28,247 |
Eli Lilly & Co. | 375,600 | | 16,538 |
Johnson & Johnson | 930,440 | | 64,405 |
Merck & Co., Inc. | 101,200 | | 4,470 |
Pfizer, Inc. | 1,839,600 | | 44,224 |
Questcor Pharmaceuticals, Inc. (a)(d) | 457,619 | | 16,872 |
Common Stocks - continued |
| Shares | | Value (000s) |
HEALTH CARE - continued |
Pharmaceuticals - continued |
Salix Pharmaceuticals Ltd. (a) | 446,500 | | $ 20,012 |
Valeant Pharmaceuticals International, Inc. (Canada) (a) | 1,073,200 | | 51,153 |
| | 367,399 |
TOTAL HEALTH CARE | | 1,377,563 |
INDUSTRIALS - 8.5% |
Aerospace & Defense - 2.8% |
Honeywell International, Inc. | 762,700 | | 44,275 |
Precision Castparts Corp. | 594,500 | | 92,480 |
The Boeing Co. | 2,057,200 | | 152,048 |
United Technologies Corp. | 1,767,400 | | 131,565 |
| | 420,368 |
Air Freight & Logistics - 0.8% |
United Parcel Service, Inc. Class B | 1,591,000 | | 120,296 |
Airlines - 0.3% |
United Continental Holdings, Inc. (a) | 2,038,600 | | 38,509 |
Building Products - 0.3% |
Armstrong World Industries, Inc. | 692,100 | | 26,750 |
Owens Corning (a) | 347,800 | | 9,342 |
| | 36,092 |
Commercial Services & Supplies - 0.0% |
Swisher Hygiene, Inc. (a) | 2,095,491 | | 3,790 |
Construction & Engineering - 0.2% |
Foster Wheeler AG (a) | 250,000 | | 4,510 |
Quanta Services, Inc. (a) | 961,400 | | 22,103 |
| | 26,613 |
Industrial Conglomerates - 1.2% |
Carlisle Companies, Inc. | 290,500 | | 14,667 |
Danaher Corp. | 2,579,900 | | 136,245 |
General Electric Co. | 1,505,100 | | 31,231 |
| | 182,143 |
Machinery - 1.8% |
Caterpillar, Inc. | 794,100 | | 66,871 |
Cummins, Inc. | 497,000 | | 47,662 |
Illinois Tool Works, Inc. | 256,300 | | 13,927 |
Ingersoll-Rand PLC | 1,293,700 | | 54,866 |
Common Stocks - continued |
| Shares | | Value (000s) |
INDUSTRIALS - continued |
Machinery - continued |
Joy Global, Inc. | 1,506,700 | | $ 78,258 |
Manitowoc Co., Inc. | 693,700 | | 8,324 |
| | 269,908 |
Professional Services - 0.1% |
Qualicorp SA (a) | 836,000 | | 7,445 |
Road & Rail - 0.9% |
Canadian Pacific | 390,000 | | 31,699 |
Norfolk Southern Corp. | 60,500 | | 4,480 |
Union Pacific Corp. | 787,000 | | 96,494 |
| | 132,673 |
Trading Companies & Distributors - 0.1% |
H&E Equipment Services, Inc. (a) | 463,290 | | 6,542 |
Mills Estruturas e Servicos de Engenharia SA | 827,400 | | 11,156 |
| | 17,698 |
TOTAL INDUSTRIALS | | 1,255,535 |
INFORMATION TECHNOLOGY - 36.8% |
Communications Equipment - 2.5% |
Finisar Corp. (a) | 613,500 | | 7,626 |
Juniper Networks, Inc. (a) | 1,887,500 | | 33,088 |
Motorola Solutions, Inc. | 208,700 | | 10,089 |
Palo Alto Networks, Inc. | 18,300 | | 1,046 |
QUALCOMM, Inc. | 5,298,100 | | 316,191 |
| | 368,040 |
Computers & Peripherals - 11.5% |
Apple, Inc. | 2,533,200 | | 1,547,175 |
EMC Corp. (a) | 2,121,200 | | 55,597 |
Fusion-io, Inc. (a) | 692,400 | | 13,239 |
Gemalto NV | 363,932 | | 27,892 |
NetApp, Inc. (a) | 1,903,000 | | 62,171 |
| | 1,706,074 |
Internet Software & Services - 7.9% |
Akamai Technologies, Inc. (a) | 1,556,600 | | 54,761 |
Baidu.com, Inc. sponsored ADR (a) | 386,000 | | 46,521 |
Dropbox, Inc. (f) | 1,003,814 | | 9,084 |
eBay, Inc. (a) | 2,122,700 | | 94,036 |
Facebook, Inc.: | | | |
Class A (d) | 1,256,300 | | 27,274 |
Common Stocks - continued |
| Shares | | Value (000s) |
INFORMATION TECHNOLOGY - continued |
Internet Software & Services - continued |
Facebook, Inc.: - continued | | | |
Class B (a)(f) | 636,167 | | $ 12,430 |
Google, Inc. Class A (a) | 1,255,867 | | 794,926 |
IAC/InterActiveCorp | 587,700 | | 30,919 |
LinkedIn Corp. (a) | 151,100 | | 15,510 |
SINA Corp. (a)(d) | 393,992 | | 17,891 |
Tencent Holdings Ltd. | 496,000 | | 14,826 |
Yahoo!, Inc. (a) | 3,051,200 | | 48,331 |
| | 1,166,509 |
IT Services - 3.2% |
Cognizant Technology Solutions Corp. Class A (a) | 1,643,500 | | 93,301 |
EPAM Systems, Inc. | 303,400 | | 4,867 |
IBM Corp. | 36,100 | | 7,075 |
MasterCard, Inc. Class A | 457,200 | | 199,600 |
Maximus, Inc. | 96,200 | | 4,858 |
Teradata Corp. (a) | 269,100 | | 18,197 |
The Western Union Co. | 433,100 | | 7,549 |
Visa, Inc. Class A | 1,103,500 | | 142,429 |
| | 477,876 |
Semiconductors & Semiconductor Equipment - 5.7% |
Altera Corp. | 2,107,500 | | 74,711 |
ASML Holding NV | 227,100 | | 13,058 |
Avago Technologies Ltd. | 2,168,600 | | 80,238 |
Broadcom Corp. Class A | 6,636,700 | | 224,851 |
Cirrus Logic, Inc. (a) | 1,162,528 | | 42,746 |
Cree, Inc. (a) | 768,200 | | 18,398 |
Freescale Semiconductor Holdings I Ltd. (a) | 5,697,958 | | 60,797 |
Mellanox Technologies Ltd. (a) | 380,700 | | 39,920 |
NVIDIA Corp. (a) | 7,619,673 | | 103,170 |
NXP Semiconductors NV (a) | 7,331,835 | | 165,626 |
Samsung Electronics Co. Ltd. | 7,550 | | 8,741 |
Skyworks Solutions, Inc. (a) | 516,400 | | 14,939 |
| | 847,195 |
Software - 6.0% |
Activision Blizzard, Inc. | 2,939,000 | | 35,356 |
Check Point Software Technologies Ltd. (a) | 1,030,400 | | 50,047 |
Citrix Systems, Inc. (a) | 1,550,100 | | 112,661 |
Guidewire Software, Inc. | 248,300 | | 6,371 |
Informatica Corp. (a) | 437,700 | | 12,917 |
Jive Software, Inc. | 533,500 | | 10,686 |
Common Stocks - continued |
| Shares | | Value (000s) |
INFORMATION TECHNOLOGY - continued |
Software - continued |
Microsoft Corp. | 9,327,700 | | $ 274,887 |
Oracle Corp. | 2,392,100 | | 72,241 |
QLIK Technologies, Inc. (a) | 767,063 | | 15,341 |
Red Hat, Inc. (a) | 1,020,700 | | 54,771 |
salesforce.com, Inc. (a) | 1,341,665 | | 166,849 |
ServiceNow, Inc. | 36,400 | | 983 |
Splunk, Inc. (d) | 196,000 | | 5,762 |
VMware, Inc. Class A (a) | 771,500 | | 70,021 |
| | 888,893 |
TOTAL INFORMATION TECHNOLOGY | | 5,454,587 |
MATERIALS - 2.4% |
Chemicals - 2.2% |
Albemarle Corp. | 856,400 | | 49,860 |
CF Industries Holdings, Inc. | 178,000 | | 34,845 |
E.I. du Pont de Nemours & Co. | 1,225,400 | | 60,902 |
Eastman Chemical Co. | 169,100 | | 8,841 |
LyondellBasell Industries NV Class A | 1,211,700 | | 53,957 |
Monsanto Co. | 763,800 | | 65,397 |
PetroLogistics LP | 883,200 | | 10,916 |
Sherwin-Williams Co. | 165,000 | | 22,168 |
Westlake Chemical Corp. (d) | 417,500 | | 24,783 |
| | 331,669 |
Containers & Packaging - 0.2% |
Rock-Tenn Co. Class A | 439,500 | | 25,588 |
TOTAL MATERIALS | | 357,257 |
TELECOMMUNICATION SERVICES - 0.2% |
Wireless Telecommunication Services - 0.2% |
Sprint Nextel Corp. (a) | 3,330,000 | | 14,519 |
Vodafone Group PLC sponsored ADR | 407,300 | | 11,710 |
| | 26,229 |
TOTAL COMMON STOCKS (Cost $11,025,400) |
14,721,702
|
Nonconvertible Preferred Stocks - 0.5% |
| Shares | | Value (000s) |
CONSUMER DISCRETIONARY - 0.5% |
Automobiles - 0.5% |
Volkswagen AG | 469,300 | | $ 80,262 |
TOTAL NONCONVERTIBLE PREFERRED STOCKS (Cost $52,053) |
80,262
|
Money Market Funds - 1.3% |
| | | |
Fidelity Cash Central Fund, 0.17% (b) | 12,339,372 | | 12,339 |
Fidelity Securities Lending Cash Central Fund, 0.18% (b)(c) | 173,924,939 | | 173,925 |
TOTAL MONEY MARKET FUNDS (Cost $186,264) |
186,264
|
TOTAL INVESTMENT PORTFOLIO - 101.1% (Cost $11,263,717) | | 14,988,228 |
NET OTHER ASSETS (LIABILITIES) - (1.1)% | | (168,514) |
NET ASSETS - 100% | $ 14,819,714 |
Legend |
(a) Non-income producing |
(b) Affiliated fund that is available only to investment companies and other accounts managed by Fidelity Investments. The rate quoted is the annualized seven-day yield of the fund at period end. A complete unaudited listing of the fund's holdings as of its most recent quarter end is available upon request. In addition, each Fidelity Central Fund's financial statements, which are not covered by the Fund's Report of Independent Registered Public Accounting Firm, are available on the SEC's website or upon request. |
(c) Investment made with cash collateral received from securities on loan. |
(d) Security or a portion of the security is on loan at period end. |
(e) Affiliated company |
(f) Restricted securities - Investment in securities not registered under the Securities Act of 1933 (excluding 144A issues). At the end of the period, the value of restricted securities (excluding 144A issues) amounted to $36,885,000 or 0.2% of net assets. |
Additional information on each restricted holding is as follows: |
Security | Acquisition Date | Acquisition
Cost (000s) |
Dropbox, Inc. | 5/2/12 | $ 9,084 |
Facebook, Inc. Class B | 3/31/11 - 5/19/11 | $ 15,909 |
Merrimack Pharmaceuticals, Inc. | 3/31/11 | $ 15,000 |
Affiliated Central Funds |
Information regarding fiscal year to date income earned by the Fund from investments in Fidelity Central Funds is as follows: |
Fund | Income earned
(Amounts in thousands) |
Fidelity Cash Central Fund | $ 55 |
Fidelity Securities Lending Cash Central Fund | 3,357 |
Total | $ 3,412 |
Other Affiliated Issuers |
An affiliated company is a company in which the Fund has ownership of at least 5% of the voting securities. Fiscal year to date transactions with companies which are or were affiliates are as follows: |
Affiliate
(Amounts in thousands) | Value, beginning of period | Purchases | Sales Proceeds | Dividend Income | Value,
end of
period |
Parsvnath Developers Ltd. | $ 22,924 | $ - | $ - | $ - | $ 15,302 |
Spectrum Pharmaceuticals, Inc. | - | 42,886 | 19,181 | - | - |
Total | $ 22,924 | $ 42,886 | $ 19,181 | $ - | $ 15,302 |
Other Information |
The following is a summary of the inputs used, as of July 31, 2012, involving the Fund's assets and liabilities carried at fair value. The inputs or methodology used for valuing securities may not be an indication of the risk associated with investing in those securities. For more information on valuation inputs, and their aggregation into the levels used in the table below, please refer to the Security Valuation section in the accompanying Notes to Financial Statements. |
Valuation Inputs at Reporting Date: |
Description
(Amounts in thousands) | Total | Level 1 | Level 2 | Level 3 |
Investments in Securities: | | | | |
Equities: | | | | |
Consumer Discretionary | $ 3,136,918 | $ 3,136,918 | $ - | $ - |
Consumer Staples | 2,094,765 | 2,060,093 | 34,672 | - |
Energy | 822,293 | 822,293 | - | - |
Financials | 276,817 | 265,331 | 11,486 | - |
Health Care | 1,377,563 | 1,362,192 | 15,371 | - |
Industrials | 1,255,535 | 1,251,745 | 3,790 | - |
Information Technology | 5,454,587 | 5,433,073 | 12,430 | 9,084 |
Materials | 357,257 | 357,257 | - | - |
Telecommunication Services | 26,229 | 26,229 | - | - |
Money Market Funds | 186,264 | 186,264 | - | - |
Total Investments in Securities: | $ 14,988,228 | $ 14,901,395 | $ 77,749 | $ 9,084 |
See accompanying notes which are an integral part of the financial statements.
Annual Report
Statement of Assets and Liabilities
Amounts in thousands (except per-share amounts) | July 31, 2012 |
| | |
Assets | | |
Investment in securities, at value (including securities loaned of $165,637) - See accompanying schedule: Unaffiliated issuers (cost $11,046,602) | $ 14,786,662 | |
Fidelity Central Funds (cost $186,264) | 186,264 | |
Other affiliated issuers (cost $30,851) | 15,302 | |
Total Investments (cost $11,263,717) | | $ 14,988,228 |
Foreign currency held at value (cost $2,675) | | 2,675 |
Receivable for investments sold | | 203,022 |
Receivable for fund shares sold | | 32,067 |
Dividends receivable | | 3,803 |
Distributions receivable from Fidelity Central Funds | | 286 |
Other receivables | | 749 |
Total assets | | 15,230,830 |
| | |
Liabilities | | |
Payable to custodian bank | $ 6 | |
Payable for investments purchased | 187,368 | |
Payable for fund shares redeemed | 40,039 | |
Accrued management fee | 7,123 | |
Other affiliated payables | 2,028 | |
Other payables and accrued expenses | 627 | |
Collateral on securities loaned, at value | 173,925 | |
Total liabilities | | 411,116 |
| | |
Net Assets | | $ 14,819,714 |
Net Assets consist of: | | |
Paid in capital | | $ 11,168,136 |
Undistributed net investment income | | 10,385 |
Accumulated undistributed net realized gain (loss) on investments and foreign currency transactions | | (83,290) |
Net unrealized appreciation (depreciation) on investments and assets and liabilities in foreign currencies | | 3,724,483 |
Net Assets | | $ 14,819,714 |
See accompanying notes which are an integral part of the financial statements.
Annual Report
Financial Statements - continued
Statement of Assets and Liabilities - continued
Amounts in thousands (except per-share amounts) | July 31, 2012 |
| | |
Blue Chip Growth:
Net Asset Value, offering price and redemption price per share ($10,595,343 ÷ 223,607 shares) | | $ 47.38 |
| | |
Class K:
Net Asset Value, offering price and redemption price per share ($2,467,455 ÷ 51,991 shares) | | $ 47.46 |
| | |
Class F:
Net Asset Value, offering price and redemption price per share ($1,756,916 ÷ 36,980 shares) | | $ 47.51 |
See accompanying notes which are an integral part of the financial statements.
Annual Report
Statement of Operations
Amounts in thousands | Year ended July 31, 2012 |
| | |
Investment Income | | |
Dividends | | $ 150,681 |
Interest | | 1 |
Income from Fidelity Central Funds | | 3,412 |
Total income | | 154,094 |
| | |
Expenses | | |
Management fee
Basic fee | $ 77,977 | |
Performance adjustment | 15,095 | |
Transfer agent fees | 23,533 | |
Accounting and security lending fees | 1,491 | |
Custodian fees and expenses | 585 | |
Independent trustees' compensation | 94 | |
Registration fees | 252 | |
Audit | 101 | |
Legal | 53 | |
Interest | 6 | |
Miscellaneous | 142 | |
Total expenses before reductions | 119,329 | |
Expense reductions | (618) | 118,711 |
Net investment income (loss) | | 35,383 |
Realized and Unrealized Gain (Loss) Net realized gain (loss) on: | | |
Investment securities: | | |
Unaffiliated issuers | (32,788) | |
Other affiliated issuers | (4,301) | |
Foreign currency transactions | (342) | |
Total net realized gain (loss) | | (37,431) |
Change in net unrealized appreciation (depreciation) on: Investment securities | 271,818 | |
Assets and liabilities in foreign currencies | (29) | |
Total change in net unrealized appreciation (depreciation) | | 271,789 |
Net gain (loss) | | 234,358 |
Net increase (decrease) in net assets resulting from operations | | $ 269,741 |
See accompanying notes which are an integral part of the financial statements.
Annual Report
Financial Statements - continued
Statement of Changes in Net Assets
Amounts in thousands | Year ended
July 31,
2012 | Year ended
July 31,
2011 |
Increase (Decrease) in Net Assets | | |
Operations | | |
Net investment income (loss) | $ 35,383 | $ (4,517) |
Net realized gain (loss) | (37,431) | 1,562,158 |
Change in net unrealized appreciation (depreciation) | 271,789 | 1,651,657 |
Net increase (decrease) in net assets resulting
from operations | 269,741 | 3,209,298 |
Distributions to shareholders from net investment income | (15,666) | (2,405) |
Distributions to shareholders from net realized gain | (480,841) | (12,451) |
Total distributions | (496,507) | (14,856) |
Share transactions - net increase (decrease) | 656,032 | (352,214) |
Total increase (decrease) in net assets | 429,266 | 2,842,228 |
| | |
Net Assets | | |
Beginning of period | 14,390,448 | 11,548,220 |
End of period (including undistributed net investment income of $10,385 and accumulated net investment loss of $7,667, respectively) | $ 14,819,714 | $ 14,390,448 |
See accompanying notes which are an integral part of the financial statements.
Annual Report
Financial Highlights - Blue Chip Growth
Years ended July 31, | 2012 | 2011 | 2010 | 2009 | 2008 |
Selected Per-Share Data | | | | | |
Net asset value, beginning of period | $ 48.17 | $ 37.63 | $ 31.97 | $ 39.06 | $ 46.88 |
Income from Investment Operations | | | | | |
Net investment income (loss) B | .10 | (.03) | .04 | .27 | .35 |
Net realized and unrealized gain (loss) | .75 | 10.61 | 5.80 | (6.36) | (2.89) |
Total from investment operations | .85 | 10.58 | 5.84 | (6.09) | (2.54) |
Distributions from net investment income | (.04) | (.00) F, G | (.18) | (.29) | (.33) |
Distributions from net realized gain | (1.60) | (.04) F | - | (.71) | (4.95) |
Total distributions | (1.64) | (.04) | (.18) | (1.00) | (5.28) |
Net asset value, end of period | $ 47.38 | $ 48.17 | $ 37.63 | $ 31.97 | $ 39.06 |
Total Return A | 2.27% | 28.12% | 18.29% | (15.85)% | (6.30)% |
Ratios to Average Net Assets C, E | | | | | |
Expenses before reductions | .90% | .94% | .94% | .76% | .58% |
Expenses net of fee waivers, if any | .90% | .94% | .94% | .76% | .58% |
Expenses net of all reductions | .89% | .92% | .93% | .76% | .57% |
Net investment income (loss) | .21% | (.06)% | .10% | .93% | .81% |
Supplemental Data | | | | | |
Net assets, end of period (in millions) | $ 10,595 | $ 12,024 | $ 10,295 | $ 9,691 | $ 13,349 |
Portfolio turnover rate D | 95% | 132% | 135% | 134% | 82% |
A Total returns would have been lower if certain expenses had not been reduced during the applicable periods shown.
B Calculated based on average shares outstanding during the period.
C Fees and expenses of any underlying Fidelity Central Funds are not included in the Fund's expense ratio. The Fund indirectly bears its proportionate share of the expenses of any underlying Fidelity Central Funds.
D Amount does not include the portfolio activity of any underlying Fidelity Central Funds.
E Expense ratios reflect operating expenses of the class. Expenses before reductions do not reflect amounts reimbursed by the investment adviser or reductions from brokerage service arrangements or reductions from other expense offset arrangements and do not represent the amount paid by the class during periods when reimbursements or reductions occur. Expenses net of fee waivers reflect expenses after reimbursement by the investment adviser but prior to reductions from brokerage service arrangements or other expense offset arrangements. Expenses net of all reductions represent the net expenses paid by the class.
F The amount shown reflects certain reclassifications related to book to tax differences.
G Amount represents less than $.01 per share.
See accompanying notes which are an integral part of the financial statements.
Annual Report
Financial Highlights - Class K
Years ended July 31, | 2012 | 2011 | 2010 | 2009 | 2008 G |
Selected Per-Share Data | | | | | |
Net asset value, beginning of period | $ 48.21 | $ 37.66 | $ 32.01 | $ 39.07 | $ 41.81 |
Income from Investment Operations | | | | | |
Net investment income (loss) D | .17 | .05 | .11 | .32 | .10 |
Net realized and unrealized gain (loss) | .75 | 10.62 | 5.79 | (6.33) | (2.84) |
Total from investment operations | .92 | 10.67 | 5.90 | (6.01) | (2.74) |
Distributions from net investment income | (.08) | (.05) I | (.25) | (.34) | - |
Distributions from net realized gain | (1.60) | (.07) I | - | (.71) | - |
Total distributions | (1.67) J | (.12) | (.25) | (1.05) | - |
Net asset value, end of period | $ 47.46 | $ 48.21 | $ 37.66 | $ 32.01 | $ 39.07 |
Total Return B, C | 2.43% | 28.37% | 18.48% | (15.61)% | (6.55)% |
Ratios to Average Net Assets E, H | | | | | |
Expenses before reductions | .74% | .77% | .75% | .53% | .41% A |
Expenses net of fee waivers, if any | .74% | .77% | .75% | .53% | .41% A |
Expenses net of all reductions | .73% | .76% | .74% | .52% | .41% A |
Net investment income (loss) | .37% | .11% | .30% | 1.16% | 1.09% A |
Supplemental Data | | | | | |
Net assets, end of period (000 omitted) | $ 2,467,455 | $ 1,454,854 | $ 931,601 | $ 590,673 | $ 93 |
Portfolio turnover rate F | 95% | 132% | 135% | 134% | 82% |
A Annualized
B Total returns for periods of less than one year are not annualized.
C Total returns would have been lower if certain expenses had not been reduced during the applicable periods shown.
D Calculated based on average shares outstanding during the period.
E Fees and expenses of any underlying Fidelity Central Funds are not included in the Fund's expense ratio. The Fund indirectly bears its proportionate share of the expenses of any underlying Fidelity Central Funds.
F Amount does not include the portfolio activity of any underlying Fidelity Central Funds.
G For the period May 9, 2008 (commencement of sale of shares) to July 31, 2008.
H Expense ratios reflect operating expenses of the class. Expenses before reductions do not reflect amounts reimbursed by the investment adviser or reductions from brokerage service arrangements or reductions from other expense offset arrangements and do not represent the amount paid by the class during periods when reimbursements or reductions occur. Expense ratios before reductions for start-up periods may not be representative of longer-term operating periods. Expenses net of fee waivers reflect expenses after reimbursement by the investment adviser but prior to reductions from brokerage service arrangements or other expense offset arrangements. Expenses net of all reductions represent the net expenses paid by the class.
I The amount shown reflects certain reclassifications related to book to tax differences.
J Total distributions of $1.67 per share is comprised of distributions from net investment income of $.076 and distributions from net realized gain of $1.598 per share.
See accompanying notes which are an integral part of the financial statements.
Annual Report
Financial Highlights - Class F
Years ended July 31, | 2012 | 2011 | 2010 | 2009 G |
Selected Per-Share Data | | | | |
Net asset value, beginning of period | $ 48.24 | $ 37.69 | $ 31.98 | $ 29.16 |
Income from Investment Operations | | | | |
Net investment income (loss) D | .19 | .07 | .13 | - I |
Net realized and unrealized gain (loss) | .76 | 10.61 | 5.80 | 2.82 |
Total from investment operations | .95 | 10.68 | 5.93 | 2.82 |
Distributions from net investment income | (.08) | (.06) J | (.22) | - |
Distributions from net realized gain | (1.60) | (.08) J | - | - |
Total distributions | (1.68) | (.13) K | (.22) | - |
Net asset value, end of period | $ 47.51 | $ 48.24 | $ 37.69 | $ 31.98 |
Total Return B, C | 2.49% | 28.41% | 18.59% | 9.67% |
Ratios to Average Net Assets E, H | | | | |
Expenses before reductions | .69% | .72% | .70% | .51% A |
Expenses net of fee waivers, if any | .69% | .72% | .70% | .51% A |
Expenses net of all reductions | .68% | .71% | .68% | .51% A |
Net investment income (loss) | .42% | .16% | .35% | (.05)% A |
Supplemental Data | | | | |
Net assets, end of period (000 omitted) | $ 1,756,916 | $ 911,556 | $ 321,409 | $ 261 |
Portfolio turnover rate F | 95% | 132% | 135% | 134% |
A Annualized
B Total returns for periods of less than one year are not annualized.
C Total returns would have been lower if certain expenses had not been reduced during the applicable periods shown.
D Calculated based on average shares outstanding during the period.
E Fees and expenses of any underlying Fidelity Central Funds are not included in the Fund's expense ratio. The Fund indirectly bears its proportionate share of the expenses of any underlying Fidelity Central Funds.
F Amount does not include the portfolio activity of any underlying Fidelity Central Funds.
G For the period June 26, 2009 (commencement of sale of shares) to July 31, 2009.
H Expense ratios reflect operating expenses of the class. Expenses before reductions do not reflect amounts reimbursed by the investment adviser or reductions from brokerage service arrangements or reductions from other expense offset arrangements and do not represent the amount paid by the class during periods when reimbursements or reductions occur. Expense ratios before reductions for start-up periods may not be representative of longer-term operating periods. Expenses net of fee waivers reflect expenses after reimbursement by the investment adviser but prior to reductions from brokerage service arrangements or other expense offset arrangements. Expenses net of all reductions represent the net expenses paid by the class.
I Amount represents less than $.01 per share.
J The amount shown reflects certain reclassifications related to book to tax differences.
K Total distributions of $.13 per share is comprised of distributions from net investment income of $.058 and distributions from net realized gain of $.076 per share.
See accompanying notes which are an integral part of the financial statements.
Annual Report
Notes to Financial Statements
For the period ended July 31, 2012
(Amounts in thousands except percentages)
1. Organization.
Fidelity® Blue Chip Growth Fund (the Fund) is a fund of Fidelity Securities Fund (the Trust) and is authorized to issue an unlimited number of shares. The Trust is registered under the Investment Company Act of 1940, as amended (the 1940 Act), as an open-end management investment company organized as a Massachusetts business trust. The Fund offers Blue Chip Growth, Class K and Class F shares, each of which has equal rights as to assets and voting privileges. Each class has exclusive voting rights with respect to matters that affect that class. Class F shares of the Fund are only available for purchase by mutual funds for which Fidelity Management & Research Company (FMR) or an affiliate serves as investment manager. Investment income, realized and unrealized capital gains and losses, the common expenses of the Fund, and certain fund-level expense reductions, if any, are allocated on a pro-rata basis to each class based on the relative net assets of each class to the total net assets of the Fund. Each class differs with respect to transfer agent fees incurred. Certain expense reductions may also differ by class.
2. Investments in Fidelity Central Funds.
The Fund invests in Fidelity Central Funds, which are open-end investment companies available only to other investment companies and accounts managed by FMR and its affiliates. The Fund's Schedule of Investments lists each of the Fidelity Central Funds held as of period end, if any, as an investment of the Fund, but does not include the underlying holdings of each Fidelity Central Fund. As an Investing Fund, the Fund indirectly bears its proportionate share of the expenses of the underlying Fidelity Central Funds.
The Money Market Central Funds seek preservation of capital and current income and are managed by Fidelity Investments Money Management, Inc. (FIMM), an affiliate of FMR.
A complete unaudited list of holdings for each Fidelity Central Fund is available upon request or at the Securities and Exchange Commission (the SEC) web site at www.sec.gov. In addition, the financial statements of the Fidelity Central Funds, which are not covered by the Fund's Report of Independent Registered Public Accounting Firm, are available on the SEC web site or upon request.
3. Significant Accounting Policies.
The financial statements have been prepared in conformity with accounting principles generally accepted in the United States of America (GAAP), which require management to make certain estimates and assumptions at the date of the financial statements. Actual results could differ from those estimates. Subsequent events, if any, through the date that the financial statements were issued have been evaluated in the preparation of the financial statements. The following summarizes the significant accounting policies of the Fund:
Annual Report
3. Significant Accounting Policies - continued
Security Valuation. Investments are valued as of 4:00 p.m. Eastern time on the last calendar day of the period. In accordance with valuation policies and procedures approved by the Board of Trustees (the Board), the Fund attempts to obtain prices from one or more third party pricing vendor or broker to value its investments. When current market prices, quotations or rates are not readily available or reliable, securities will be fair valued in good faith by the FMR Fair Value Committee (the Committee), in accordance with procedures adopted by the Fund's Board. Factors used in determining fair value vary by security type and may include market or security specific events. The frequency with which these procedures are used cannot be predicted and they may be utilized to a significant extent. The Committee oversees the Fund's valuation policies and procedures and is responsible for approving and reporting to the Board all fair value determinations.
The Fund categorizes the inputs to valuation techniques used to value its investments into a disclosure hierarchy consisting of three levels as shown below:
Level 1 - quoted prices in active markets for identical investments
Level 2 - other significant observable inputs (including quoted prices for similar investments, interest rates, prepayment speeds, etc.)
Level 3 - unobservable inputs (including the Fund's own assumptions based on the best information available)
Valuation techniques used to value the Fund's investments by major category are as follows:
Equity securities, including restricted securities, for which market quotations are readily available, are valued at the last reported sale price or official closing price as reported by a third party pricing vendor on the primary market or exchange on which they are traded and are categorized as Level 1 in the hierarchy. In the event there were no sales during the day or closing prices are not available, securities are valued at the last quoted bid price or may be valued using the last available price and are generally categorized as Level 2 in the hierarchy. For foreign equity securities, when significant market or security specific events arise, comparisons to the valuation of American Depositary Receipts (ADRs), futures contracts, Exchange-Traded Funds (ETFs) and certain indexes as well as quoted prices for similar securities are used and are categorized as Level 2 in the hierarchy. Utilizing these techniques may result in transfers between Level 1 and Level 2. For restricted equity securities and private placements where observable inputs are limited, assumptions about market activity and risk are used and these securities are categorized as Level 3 in the hierarchy.
Annual Report
Notes to Financial Statements - continued
(Amounts in thousands except percentages)
3. Significant Accounting Policies - continued
Security Valuation - continued
Investments in open-end mutual funds, including the Fidelity Central Funds, are valued at their closing net asset value each business day and are categorized as Level 1 in the hierarchy.
Changes in valuation techniques may result in transfers in or out of an assigned level within the disclosure hierarchy. The aggregate value of investments by input level, as of July 31, 2012, is included at the end of the Fund's Schedule of Investments.
Foreign Currency Translation. The Fund may use foreign currency contracts to facilitate transactions in foreign-denominated securities. Gains and losses from these transactions may arise from changes in the value of the foreign currency or if the counterparties do not perform under the contracts' terms.
Foreign-denominated assets, including investment securities, and liabilities are translated into U.S. dollars at the exchange rates at period end. Purchases and sales of investment securities, income and dividends received and expenses denominated in foreign currencies are translated into U.S. dollars at the exchange rate in effect on the transaction date.
The effects of exchange rate fluctuations on investments are included with the net realized and unrealized gain (loss) on investment securities. Other foreign currency transactions resulting in realized and unrealized gain (loss) are disclosed separately.
Investment Transactions and Income. For financial reporting purposes, the Fund's investment holdings and NAV include trades executed through the end of the last business day of the period. The NAV per share for processing shareholder transactions is calculated as of the close of business of the New York Stock Exchange (NYSE), normally 4:00 p.m. Eastern time and includes trades executed through the end of the prior business day. Gains and losses on securities sold are determined on the basis of identified cost and may include proceeds received from litigation. Dividend income is recorded on the ex-dividend date, except for certain dividends from foreign securities where the ex-dividend date may have passed, which are recorded as soon as the Fund is informed of the ex-dividend date. Non-cash dividends included in dividend income, if any, are recorded at the fair market value of the securities received. Distributions received on securities that represent a return of capital or capital gain are recorded as a reduction of cost of investments and/or as a realized gain. The Fund estimates the components of distributions received that may be considered return of capital distributions or capital gain distributions. Interest income and distributions from the Fidelity Central Funds are accrued as earned. Interest income includes coupon interest and amortization of premium and accretion of discount on debt securities. Investment income is recorded net of foreign taxes withheld where recovery of such taxes is uncertain.
Annual Report
3. Significant Accounting Policies - continued
Expenses. Expenses directly attributable to a fund are charged to that fund. Expenses attributable to more than one fund are allocated among the respective funds on the basis of relative net assets or other appropriate methods. Expense estimates are accrued in the period to which they relate and adjustments are made when actual amounts are known.
Deferred Trustee Compensation. Under a Deferred Compensation Plan (the Plan), independent Trustees may elect to defer receipt of a portion of their annual compensation. Deferred amounts are invested in a cross-section of Fidelity funds, are marked-to-market and remain in the Fund until distributed in accordance with the Plan. The investment of deferred amounts and the offsetting payable to the Trustees are included in the accompanying Statement of Assets and Liabilities.
Income Tax Information and Distributions to Shareholders. Each year, the Fund intends to qualify as a regulated investment company under Subchapter M of the Internal Revenue Code, including distributing substantially all of its taxable income and realized gains. As a result, no provision for income taxes is required. As of July 31, 2012, the Fund did not have any unrecognized tax benefits in the financial statements; nor is the Fund aware of any tax positions for which it is reasonably possible that the total amounts of unrecognized tax benefits will significantly change in the next twelve months. The Fund files a U.S. federal tax return, in addition to state and local tax returns as required. A fund's federal income tax returns are subject to examination by the Internal Revenue Service (IRS) for a period of three fiscal years after they are filed. State and local tax returns may be subject to examination for an additional fiscal year depending on the jurisdiction. Foreign taxes are provided for based on the Fund's understanding of the tax rules and rates that exist in the foreign markets in which it invests.
Distributions are declared and recorded on the ex-dividend date. Income dividends and capital gain distributions are declared separately for each class. Income and capital gain distributions are determined in accordance with income tax regulations, which may differ from GAAP. These differences resulted in distribution reclassifications. In addition, the Fund claimed a portion of the payment made to redeeming shareholders as a distribution for income tax purposes.
Capital accounts within the financial statements are adjusted for permanent book-tax differences. These adjustments have no impact on net assets or the results of operations. Temporary book-tax differences will reverse in a subsequent period.
Book-tax differences are primarily due to foreign currency transactions, passive foreign investment companies (PFIC), partnerships, deferred trustee compensation, capital loss carryforwards and losses deferred due to wash sales and excise tax regulations.
Annual Report
Notes to Financial Statements - continued
(Amounts in thousands except percentages)
3. Significant Accounting Policies - continued
Income Tax Information and Distributions to Shareholders - continued
The federal tax cost of investment securities and unrealized appreciation (depreciation) as of period end were as follows:
Gross unrealized appreciation | $ 4,132,802 |
Gross unrealized depreciation | (484,426) |
Net unrealized appreciation (depreciation) on securities and other investments | $ 3,648,376 |
| |
Tax Cost | $ 11,339,852 |
The tax-based components of distributable earnings as of period end were as follows:
Undistributed ordinary income | $ 10,887 |
Capital loss carryforward | $ (7,155) |
Net unrealized appreciation (depreciation) | $ 3,648,348 |
Capital loss carryforwards are only available to offset future capital gains of the Fund to the extent provided by regulations and may be limited. Under the Regulated Investment Company Modernization Act of 2010 (the Act), the Fund is permitted to carry forward capital losses incurred in taxable years beginning after December 22, 2010 for an unlimited period and such capital losses are required to be used prior to any losses that expire. Capital loss carryforwards were as follows:
Fiscal year of expiration | |
No expiration | |
Short-term | $ (7,155) |
The tax character of distributions paid was as follows:
| July 31, 2012 | July 31, 2011 |
Ordinary Income | $ 15,666 | $ 2,405 |
Long-term Capital Gains | 480,841 | 12,451 |
Total | $ 496,507 | $ 14,856 |
New Accounting Pronouncement. In December 2011, the Financial Accounting Standards Board issued Accounting Standard Update No. 2011-11, Disclosures about Offsetting Assets and Liabilities. The update creates new disclosure requirements requiring entities to disclose both gross and net information for derivatives and other financial instruments that are either offset in the Statement of Assets and Liabilities or
Annual Report
3. Significant Accounting Policies - continued
New Accounting Pronouncement - continued
subject to an enforceable master netting arrangement or similar agreement. The disclosure requirements are effective for interim and annual reporting periods beginning on or after January 1, 2013. Management is currently evaluating the impact of the update's adoption on the Fund's financial statement disclosures.
4. Operating Policies.
Restricted Securities. The Fund may invest in securities that are subject to legal or contractual restrictions on resale. These securities generally may be resold in transactions exempt from registration or to the public if the securities are registered. Disposal of these securities may involve time-consuming negotiations and expense, and prompt sale at an acceptable price may be difficult. Information regarding restricted securities is included at the end of the Fund's Schedule of Investments.
5. Purchases and Sales of Investments.
Purchases and sales of securities, other than short-term securities, aggregated $13,550,160 and $13,321,571, respectively.
6. Fees and Other Transactions with Affiliates.
Management Fee. FMR and its affiliates provide the Fund with investment management related services for which the Fund pays a monthly management fee. The management fee is the sum of an individual fund fee rate that is based on an annual rate of .30% of the Fund's average net assets and an annualized group fee rate that averaged .26% during the period. The group fee rate is based upon the average net assets of all the mutual funds advised by FMR. The group fee rate decreases as assets under management increase and increases as assets under management decrease. In addition, the management fee is subject to a performance adjustment (up to a maximum of ± .20% of the Fund's average net assets over a 36 month performance period). The upward or downward adjustment to the management fee is based on the relative investment performance of Blue Chip Growth as compared to an appropriate benchmark index. For the period, the total annual management fee rate, including the performance adjustment, was .67% of the Fund's average net assets.
Annual Report
Notes to Financial Statements - continued
(Amounts in thousands except percentages)
6. Fees and Other Transactions with Affiliates - continued
Transfer Agent Fees. Fidelity Investments Institutional Operations Company, Inc. (FIIOC), an affiliate of FMR, is the transfer, dividend disbursing and shareholder servicing agent for each class of the Fund. FIIOC receives account fees and asset-based fees that vary according to the account size and type of account of the shareholders of Blue Chip Growth FIIOC receives an asset-based fee of Class K's average net assets. FIIOC receives no fees for providing transfer agency services to Class F. FIIOC pays for typesetting, printing and mailing of shareholder reports, except proxy statements. For the period, transfer agent fees for each class were as follows:
| Amount | % of
Average
Net Assets |
Blue Chip Growth | $ 22,565 | .21 |
Class K | 968 | .05 |
| $ 23,533 | |
Accounting and Security Lending Fees. Fidelity Service Company, Inc. (FSC), an affiliate of FMR, maintains the Fund's accounting records. The accounting fee is based on the level of average net assets for each month. Under a separate contract, FSC administers the security lending program. The security lending fee is based on the number and duration of lending transactions.
Brokerage Commissions. The Fund placed a portion of its portfolio transactions with brokerage firms which are affiliates of the investment adviser. The commissions paid to these affiliated firms were $353 for the period.
Interfund Lending Program. Pursuant to an Exemptive Order issued by the SEC, the Fund, along with other registered investment companies having management contracts with FMR, may participate in an interfund lending program. This program provides an alternative credit facility allowing the funds to borrow from, or lend money to, other participating affiliated funds. The Fund's activity in this program during the period for which loans were outstanding was as follows:
Borrower or Lender | Average Loan
Balance | Weighted Average Interest Rate | Interest
Expense |
Borrower | $ 14,697 | .35% | $ 6 |
7. Committed Line of Credit.
The Fund participates with other funds managed by FMR or an affiliate in a $4.25 billion credit facility (the "line of credit") to be utilized for temporary or emergency purposes to fund shareholder redemptions or for other short-term liquidity purposes. The Fund has agreed to pay commitment fees on its pro-rata portion of the line of credit, which amounted to $39 and is reflected in Miscellaneous expenses on the Statement of Operations. During the period, there were no borrowings on this line of credit.
Annual Report
8. Security Lending.
The Fund lends portfolio securities through a lending agent from time to time in order to earn additional income. For equity securities, a lending agent is used and may loan securities to certain qualified borrowers, including Fidelity Capital Markets (FCM), a broker-dealer affiliated with the Fund. On the settlement date of the loan, the Fund receives collateral (in the form of U.S. Treasury obligations, letters of credit and/or cash) against the loaned securities and maintains collateral in an amount not less than 100% of the market value of the loaned securities during the period of the loan. The market value of the loaned securities is determined at the close of business of the Fund and any additional required collateral is delivered to the Fund on the next business day. If the borrower defaults on its obligation to return the securities loaned because of insolvency or other reasons, a fund could experience delays and costs in recovering the securities loaned or in gaining access to the collateral. Any cash collateral received is invested in the Fidelity Securities Lending Cash Central Fund. The value of loaned securities and cash collateral at period end are disclosed on the Fund's Statement of Assets and Liabilities. The value of securities loaned to FCM at period end was $3,016. Security lending income represents the income earned on investing cash collateral, less rebates paid to borrowers and any lending agent fees associated with the loan, plus any premium payments received for lending certain types of securities. Security lending income is presented in the Statement of Operations as a component of income from Fidelity Central Funds. Total security lending income during the period amounted to $3,357, including $95 from securities loaned to FCM.
9. Expense Reductions.
Many of the brokers with whom FMR places trades on behalf of the Fund provided services to the Fund in addition to trade execution. These services included payments of certain expenses on behalf of the Fund totaling $618 for the period.
10. Distributions to Shareholders.
Distributions to shareholders of each class were as follows:
Years ended July 31, | 2012 | 2011 |
From net investment income | | |
Blue Chip Growth | $ 10,644 | $ 670 |
Class K | 2,860 | 1,165 |
Class F | 2,162 | 570 |
Total | $ 15,666 | $ 2,405 |
From net realized gain | | |
Blue Chip Growth | $ 397,250 | $ 9,690 |
Class K | 51,295 | 1,750 |
Class F | 32,296 | 1,011 |
Total | $ 480,841 | $ 12,451 |
Annual Report
Notes to Financial Statements - continued
(Amounts in thousands except percentages)
11. Share Transactions.
Transactions for each class of shares were as follows:
| Shares | Dollars |
Years ended July 31, | 2012 | 2011 | 2012 | 2011 |
Blue Chip Growth | | | | |
Shares sold | 42,825 | 42,281 | $ 1,970,082 | $ 1,904,203 |
Reinvestment of distributions | 9,668 | 232 | 399,689 | 10,166 |
Shares redeemed | (78,498) | (66,514) | (3,530,347) | (2,974,498) |
Net increase (decrease) | (26,005) | (24,001) | $ (1,160,576) | $ (1,060,129) |
Class K | | | | |
Shares sold | 29,866 | 13,902 | $ 1,366,770 | $ 625,856 |
Reinvestment of distributions | 1,309 | 70 | 54,155 | 2,916 |
Shares redeemed | (9,363) | (8,528) | (426,597) | (379,087) |
Net increase (decrease) | 21,812 | 5,444 | $ 994,328 | $ 249,685 |
Class F | | | | |
Shares sold | 19,170 | 12,501 | $ 873,960 | $ 558,704 |
Reinvestment of distributions | 832 | 38 | 34,458 | 1,580 |
Shares redeemed | (1,918) | (2,171) | (86,138) | (102,054) |
Net increase (decrease) | 18,084 | 10,368 | $ 822,280 | $ 458,230 |
12. Other.
The Fund's organizational documents provide former and current trustees and officers with a limited indemnification against liabilities arising in connection with the performance of their duties to the Fund. In the normal course of business, the Fund may also enter into contracts that provide general indemnifications. The Fund's maximum exposure under these arrangements is unknown as this would be dependent on future claims that may be made against the Fund. The risk of material loss from such claims is considered remote.
At the end of the period, the Fidelity Adviser Freedom Funds, the Fidelity Freedom Funds and the Fidelity Freedom K Funds were the owners of record in the aggregate of approximately 25% of the total outstanding shares of the Fund.
Annual Report
To the Trustees of Fidelity Securities Fund and Shareholders of Fidelity Blue Chip Growth Fund:
We have audited the accompanying statement of assets and liabilities of Fidelity Blue Chip Growth Fund (the Fund), a fund of Fidelity Securities Fund, including the schedule of investments, as of July 31, 2012, and the related statement of operations for the year then ended, the statement of changes in net assets for each of the two years in the period then ended, and the financial highlights for each of the five years in the period then ended. These financial statements and financial highlights are the responsibility of the Fund's management. Our responsibility is to express an opinion on these financial statements and financial highlights based on our audits.
We conducted our audits in accordance with the standards of the Public Company Accounting Oversight Board (United States). Those standards require that we plan and perform the audit to obtain reasonable assurance about whether the financial statements and financial highlights are free of material misstatement. The Fund is not required to have, nor were we engaged to perform, an audit of its internal control over financial reporting. Our audits included consideration of internal control over financial reporting as a basis for designing audit procedures that are appropriate in the circumstances, but not for the purpose of expressing an opinion on the effectiveness of the Fund's internal control over financial reporting. Accordingly, we express no such opinion. An audit also includes examining, on a test basis, evidence supporting the amounts and disclosures in the financial statements, assessing the accounting principles used and significant estimates made by management, as well as evaluating the overall financial statement presentation. Our procedures included confirmation of securities owned as of July 31, 2012, by correspondence with the custodians and brokers; where replies were not received from brokers, we performed other auditing procedures. We believe that our audits provide a reasonable basis for our opinion.
In our opinion, the financial statements and financial highlights referred to above present fairly, in all material respects, the financial position of Fidelity Blue Chip Growth Fund as of July 31, 2012, the results of its operations for the year then ended, the changes in its net assets for each of the two years in the period then ended, and the financial highlights for each of the five years in the period then ended, in conformity with accounting principles generally accepted in the United States of America.
DELOITTE & TOUCHE LLP
Boston, Massachusetts
September 12, 2012
Annual Report
The Trustees, Members of the Advisory Board, and executive officers of the trust and fund, as applicable, are listed below. The Board of Trustees governs the fund and is responsible for protecting the interests of shareholders. The Trustees are experienced executives who meet periodically throughout the year to oversee the fund's activities, review contractual arrangements with companies that provide services to the fund, oversee management of the risks associated with such activities and contractual arrangements, and review the fund's performance. Except for James C. Curvey, each of the Trustees oversees 228 funds advised by FMR or an affiliate. Mr. Curvey oversees 435 funds advised by FMR or an affiliate.
The Trustees hold office without limit in time except that (a) any Trustee may resign; (b) any Trustee may be removed by written instrument, signed by at least two-thirds of the number of Trustees prior to such removal; (c) any Trustee who requests to be retired or who has become incapacitated by illness or injury may be retired by written instrument signed by a majority of the other Trustees; and (d) any Trustee may be removed at any special meeting of shareholders by a two-thirds vote of the outstanding voting securities of the trust. Each Trustee who is not an interested person (as defined in the 1940 Act) (Independent Trustee), shall retire not later than the last day of the calendar year in which his or her 75th birthday occurs. The Independent Trustees may waive this mandatory retirement age policy with respect to individual Trustees. The executive officers and Advisory Board Members hold office without limit in time, except that any officer and Advisory Board Member may resign or may be removed by a vote of a majority of the Trustees at any regular meeting or any special meeting of the Trustees. Except as indicated, each individual has held the office shown or other offices in the same company for the past five years.
Experience, Skills, Attributes, and Qualifications of the Fund's Trustees. The Governance and Nominating Committee has adopted a statement of policy that describes the experience, qualifications, attributes, and skills that are necessary and desirable for potential Independent Trustee candidates (Statement of Policy). The Board believes that each Trustee satisfied at the time he or she was initially elected or appointed a Trustee, and continues to satisfy, the standards contemplated by the Statement of Policy. The Governance and Nominating Committee also engages professional search firms to help identify potential Independent Trustee candidates who have the experience, qualifications, attributes, and skills consistent with the Statement of Policy. From time to time, additional criteria based on the composition and skills of the current Independent Trustees, as well as experience or skills that may be appropriate in light of future changes to board composition, business conditions, and regulatory or other developments, have also been considered by the professional search firms and the Governance and Nominating Committee. In addition, the Board takes into account the Trustees' commitment and participation in Board and committee meetings, as well as their leadership of standing and ad hoc committees throughout their tenure.
In determining that a particular Trustee was and continues to be qualified to serve as a Trustee, the Board has considered a variety of criteria, none of which, in isolation, was controlling. The Board believes that, collectively, the Trustees have balanced and diverse experience, qualifications, attributes, and skills, which allow the Board to operate effectively in governing the fund and protecting the interests of shareholders. Information about the specific experience, skills, attributes, and qualifications of each Trustee, which in each case led to the Board's conclusion that the Trustee should serve (or continue to serve) as a trustee of the fund, is provided below.
Annual Report
Trustees and Officers - continued
Board Structure and Oversight Function. James C. Curvey is an interested person (as defined in the 1940 Act) and currently serves as Chairman. The Trustees have determined that an interested Chairman is appropriate and benefits shareholders because an interested Chairman has a personal and professional stake in the quality and continuity of services provided to the fund. Independent Trustees exercise their informed business judgment to appoint an individual of their choosing to serve as Chairman, regardless of whether the Trustee happens to be independent or a member of management. The Independent Trustees have determined that they can act independently and effectively without having an Independent Trustee serve as Chairman and that a key structural component for assuring that they are in a position to do so is for the Independent Trustees to constitute a substantial majority for the Board. The Independent Trustees also regularly meet in executive session. Ned C. Lautenbach serves as Chairman of the Independent Trustees and as such (i) acts as a liaison between the Independent Trustees and management with respect to matters important to the Independent Trustees and (ii) with management prepares agendas for Board meetings.
Fidelity funds are overseen by different Boards of Trustees. The fund's Board oversees Fidelity's equity and high income funds and another Board oversees Fidelity's investment-grade bond, money market, and asset allocation funds. The asset allocation funds may invest in Fidelity funds overseen by the fund's Board. The use of separate Boards, each with its own committee structure, allows the Trustees of each group of Fidelity funds to focus on the unique issues of the funds they oversee, including common research, investment, and operational issues. On occasion, the separate Boards establish joint committees to address issues of overlapping consequences for the Fidelity funds overseen by each Board.
The Trustees operate using a system of committees to facilitate the timely and efficient consideration of all matters of importance to the Trustees, the fund, and fund shareholders and to facilitate compliance with legal and regulatory requirements and oversight of the fund's activities and associated risks. The Board, acting through its committees, has charged FMR and its affiliates with (i) identifying events or circumstances the occurrence of which could have demonstrably adverse effects on the fund's business and/or reputation; (ii) implementing processes and controls to lessen the possibility that such events or circumstances occur or to mitigate the effects of such events or circumstances if they do occur; and (iii) creating and maintaining a system designed to evaluate continuously business and market conditions in order to facilitate the identification and implementation processes described in (i) and (ii) above. Because the day-to-day operations and activities of the fund are carried out by or through FMR, its affiliates and other service providers, the fund's exposure to risks is mitigated but not eliminated by the processes overseen by the Trustees. While each of the Board's committees has responsibility for overseeing different aspects of the fund's activities, oversight is exercised primarily through the Operations, Audit, and Compliance Committees. In addition, the Independent Trustees have worked with FMR to enhance the Board's oversight of investment and financial risks, legal and regulatory risks, technology risks, and operational risks, including the development of additional risk reporting to the Board. For example, a working group comprised of Independent Trustees and FMR has worked and continues to work to review the Fidelity funds' valuation-related activities, reporting and risk management. Appropriate personnel, including but not limited to the fund's Chief Compliance Officer (CCO), FMR's internal auditor, the independent accountants, the fund's Treasurer and portfolio management personnel, make periodic reports to the Board's committees, as appropriate, including an annual review of FMR's risk management program for the Fidelity funds. The responsibilities of each standing committee, including their oversight responsibilities, are described further under "Standing Committees of the Fund's Trustees."
Annual Report
The fund's Statement of Additional Information (SAI) includes more information about the Trustees. To request a free copy, call Fidelity at 1-800-835-5092.
Interested Trustees*:
Correspondence intended for each Trustee who is an interested person may be sent to Fidelity Investments, 82 Devonshire Street, Boston, Massachusetts 02109.
Name, Age; Principal Occupations and Other Relevant Experience+ |
James C. Curvey (77) |
| Year of Election or Appointment: 2007 Mr. Curvey is Trustee and Chairman of the Board of Trustees of certain Trusts. Mr. Curvey also serves as Trustee (2007-present) of other investment companies advised by FMR. Mr. Curvey is a Director of Fidelity Investments Money Management, Inc. (2009-present), Director of Fidelity Research & Analysis Co. (2009-present) and Director of FMR and FMR Co., Inc. (2007-present). Mr. Curvey is also Vice Chairman (2007-present) and Director of FMR LLC. In addition, Mr. Curvey serves as an Overseer for the Boston Symphony Orchestra and a member of the Trustees of Villanova University. Previously, Mr. Curvey was the Vice Chairman (2006-2007) and Director (2000-2007) of FMR Corp. |
Ronald P. O'Hanley (55) |
| Year of Election or Appointment: 2011 Mr. O'Hanley is Director of FMR Co., Inc. (2010-present), Director of Fidelity Investments Money Management, Inc. (2010-present), Director of Fidelity Research & Analysis Company (2010-present), President of Fidelity Asset Management and Corporate Services and a member of Fidelity's Executive Committee (2010-present). Previously, Mr. O'Hanley served as President and Chief Executive Officer of BNY Mellon Asset Management (2007-2010). Mr. O'Hanley also served as Vice Chairman of Bank New York Mellon Corp. and a member of that firm's Executive Committee. Prior to the 2007 merger of The Bank of New York and Mellon Financial Corporation, he was Vice Chairman of Mellon Financial Corporation and President and Chief Executive Officer of Mellon Asset Management. He joined Mellon in February 1997. Mr. O'Hanley currently serves as Chairman of the Boston Public Library Foundation Board of Directors and sits on the Board of Directors of Beth Israel Deaconess Medical Center, the Board of Trustees of the Marine Biological Laboratory and the Advisory Board of the Maxwell School of Citizenship and Public Administration at Syracuse University. Mr. O'Hanley also chairs the Council on Asset Management for the Financial Services Roundtable and is a member of the Board of Directors of Institutional Investor's U.S. Institute. |
* Trustees have been determined to be "Interested Trustees" by virtue of, among other things, their affiliation with the trust or various entities under common control with FMR.
+ The information above includes each Trustee's principal occupation during the last five years and other information relating to the experience, attributes, and skills relevant to each Trustee's qualifications to serve as a Trustee, which led to the conclusion that each Trustee should serve as a Trustee for the fund.
Annual Report
Independent Trustees:
Correspondence intended for each Independent Trustee (that is, the Trustees other than the Interested Trustees) may be sent to Fidelity Investments, P.O. Box 55235, Boston, Massachusetts 02205-5235.
Name, Age; Principal Occupations and Other Relevant Experience+ |
Dennis J. Dirks (64) |
| Year of Election or Appointment: 2005 Prior to his retirement in May 2003, Mr. Dirks was Chief Operating Officer and a member of the Board of The Depository Trust & Clearing Corporation (DTCC). He also served as President, Chief Operating Officer, and Board member of The Depository Trust Company (DTC) and President and Board member of the National Securities Clearing Corporation (NSCC). In addition, Mr. Dirks served as Chief Executive Officer and Board member of the Government Securities Clearing Corporation, Chief Executive Officer and Board member of the Mortgage-Backed Securities Clearing Corporation, as a Trustee and a member of the Finance Committee of Manhattan College (2005-2008), and as a Trustee and a member of the Finance Committee of AHRC of Nassau County (2006-2008). Mr. Dirks is a member of the Independent Directors Council (IDC) Governing Council (2010-present) and Board of Directors for The Brookville Center for Children's Services, Inc. (2009-present). |
Alan J. Lacy (58) |
| Year of Election or Appointment: 2008 Mr. Lacy serves as Senior Adviser (2007-present) of Oak Hill Capital Partners, L.P. (private equity). Mr. Lacy also served as Chief Executive Officer (2000-2005) and Vice Chairman (2005-2006) of Sears Holdings Corporation and Sears, Roebuck and Co. (retail). In addition, Mr. Lacy serves as a member of the Board of Directors of Dave & Buster's Entertainment, Inc. (restaurant and entertainment complexes, 2010-present), Earth Fare, Inc. (retail grocery, 2012-present), The Hillman Companies, Inc. (hardware wholesalers, 2010-present), and Bristol-Myers Squibb Company (global pharmaceuticals, 2007-present). Mr. Lacy is a member of the Board of Trustees of The National Parks Conservation Association (2006-present). Previously, Mr. Lacy served as Chairman of the Board of Trustees of the National Parks Conservation Association (2008-2011) and as a member of the Board of Directors for the Western Union Company (global money transfer, 2006-2011). |
Ned C. Lautenbach (68) |
| Year of Election or Appointment: 2000 Mr. Lautenbach is Chairman of the Independent Trustees of the Equity and High Income Funds (2006-present). Mr. Lautenbach currently serves as the Lead Director of the Eaton Corporation Board of Directors (diversified industrial, 1997-present). Mr. Lautenbach is Chairman of the Board of Directors of the Philharmonic Center for the Arts in Naples, Florida (2012-present) and a member of the Council on Foreign Relations (1994-present). Previously, Mr. Lautenbach was a Partner/Advisory Partner at Clayton, Dubilier & Rice, LLC (private equity investment, 1998-2010), as well as a Director of Sony Corporation (2006-2007). |
Joseph Mauriello (67) |
| Year of Election or Appointment: 2008 Prior to his retirement in January 2006, Mr. Mauriello served in numerous senior management positions including Deputy Chairman and Chief Operating Officer (2004-2005), and Vice Chairman of Financial Services (2002-2004) of KPMG LLP US (professional services, 1965-2005). Mr. Mauriello currently serves as a member of the Board of Directors of XL Group plc. (global insurance and re-insurance, 2006-present). Previously, Mr. Mauriello served as a Director of the Hamilton Funds of the Bank of New York (2006-2007) and of Arcadia Resources Inc. (health care services and products, 2007-2012). |
Robert W. Selander (61) |
| Year of Election or Appointment: 2011 Previously, Mr. Selander served as a Member of the Advisory Board of Fidelity's Equity and High Income Funds (2011), Executive Vice Chairman (2010), Chief Executive Officer (2009-2010), and President and Chief Executive Officer (1997-2009) of Mastercard, Inc. |
Cornelia M. Small (68) |
| Year of Election or Appointment: 2005 Ms. Small is a member of the Board of Directors of the Teagle Foundation (2009-present). Ms. Small is also a member of the Investment Committee, and Chair (2008-present) and a member of the Board of Trustees of Smith College. In addition, Ms. Small serves on the Investment Committee of the Berkshire Taconic Community Foundation (2008-present). Previously, Ms. Small served as Chairperson of the Investment Committee (2002-2008) of Smith College. In addition, Ms. Small served as Chief Investment Officer, Director of Global Equity Investments, and a member of the Board of Directors of Scudder, Stevens & Clark and Scudder Kemper Investments. |
William S. Stavropoulos (73) |
| Year of Election or Appointment: 2002 Mr. Stavropoulos is Vice Chairman of the Independent Trustees of the Equity and High Income Funds (2006-present). Mr. Stavropoulos serves as President and Founder of the Michigan Baseball Foundation, the Great Lakes Loons (2007-present). Mr. Stavropoulos is Chairman Emeritus of the Board of Directors of The Dow Chemical Company, where he previously served in numerous senior management positions, including President, CEO (1995-2000; 2002-2004), Chairman of the Executive Committee (2000-2006), and as a member of the Board of Directors (1990-2006). Currently, Mr. Stavropoulos is Chairman of Univar (global distributor of commodity and specialty chemicals, 2010-present), a Director of Teradata Corporation (data warehousing and technology solutions, 2008-present), Chemical Financial Corporation, Maersk Inc. (industrial conglomerate), Tyco International, Inc. (multinational manufacturing and services, 2007-present), and a member of the Advisory Board for Metalmark Capital (private equity investment, 2005-present). Mr. Stavropoulos is a special advisor to Clayton, Dubilier & Rice, LLC (private equity investment). In addition, Mr. Stavropoulos is a member of the University of Notre Dame Advisory Council for the College of Science. |
David M. Thomas (63) |
| Year of Election or Appointment: 2008 Previously, Mr. Thomas served as Executive Chairman (2005-2006) and Chairman and Chief Executive Officer (2000-2005) of IMS Health, Inc. (pharmaceutical and healthcare information solutions). In addition, Mr. Thomas serves as a member of the Board of Directors of Fortune Brands, Inc. (consumer products), and Interpublic Group of Companies, Inc. (marketing communication, 2004-present). |
Michael E. Wiley (61) |
| Year of Election or Appointment: 2008 Mr. Wiley also serves as a Director of Asia Pacific Exploration Consolidated (international oil and gas exploration and production, 2008-present). Mr. Wiley serves as a Director of Tesoro Corporation (independent oil refiner and marketer, 2005-present), and a Director of Bill Barrett Corporation (exploration and production, 2005-present). In addition, Mr. Wiley also serves as a Director of Post Oak Bank (privately-held bank, 2004-present). Previously, Mr. Wiley served as a member of the Board of Trustees of the University of Tulsa (2000-2006; 2007-2010), as a Senior Energy Advisor of Katzenbach Partners, LLC (consulting, 2006-2007), as an Advisory Director of Riverstone Holdings (private investment), Chairman, President, and CEO of Baker Hughes, Inc. (oilfield services, 2000-2004), and as Director of Spinnaker Exploration Company (exploration and production, 2001-2005). |
Annual Report
Trustees and Officers - continued
+ The information above includes each Trustee's principal occupation during the last five years and other information relating to the experience, attributes, and skills relevant to each Trustee's qualifications to serve as a Trustee, which led to the conclusion that each Trustee should serve as a Trustee for the fund.
Advisory Board Members and Executive Officers:
Correspondence intended for David A. Rosow and Garnett A. Smith may be sent to Fidelity Investments, P.O. Box 55235, Boston, Massachusetts 02205-5235. Correspondence intended for each executive officer, Edward C. Johnson 3d, and Peter S. Lynch may be sent to Fidelity Investments, 82 Devonshire Street, Boston, Massachusetts 02109.
Name, Age; Principal Occupation |
Edward C. Johnson 3d (82) |
| Year of Election or Appointment: 2011 Member of the Advisory Board of Fidelity's Equity and High Income Funds. Mr. Johnson serves as Chief Executive Officer, Chairman, and a Director of FMR LLC, and also serves as Chairman and Director of FIL Limited. Previously, Mr. Johnson served as a Trustee and Chairman of the Board of certain Fidelity Trusts, Chairman and a Director of FMR, Chairman and a Director of FMR Co., Inc., and President of FMR LLC (2006-2007). |
Peter S. Lynch (68) |
| Year of Election or Appointment: 2003 Member of the Advisory Board of Fidelity's Equity and High Income Funds. Mr. Lynch is Vice Chairman and a Director of FMR and FMR Co., Inc. In addition, Mr. Lynch serves as a Trustee of Boston College and as the Chairman of the Inner-City Scholarship Fund. Previously, Mr. Lynch served on the Special Olympics International Board of Directors (1997-2006). |
David A. Rosow (69) |
| Year of Election or Appointment: 2012 Member of the Advisory Board of Fidelity's Equity and High Income Funds. Chairman and Chief Executive Officer of International Golf Group, Inc. (golf course development, 1990-present). Previously, Mr. Rosow served as Chairman and Chief Executive Officer of Rosow & Company, Inc. (private investment company, 1989-2011), a Lead Director of Hudson United Bancorp (2001-2006) and as a Director of TD Banknorth (1996-2006). In addition, Mr. Rosow is a member (2008-present) and President (2009-present) of the Town Council of Palm Beach, Florida. |
Garnett A. Smith (64) |
| Year of Election or Appointment: 2012 Member of the Advisory Board of Fidelity's Equity and High Income Funds. Prior to Mr. Smith's retirement, he served as Chairman and Chief Executive Officer of Inbrand Corp. (manufacturer of personal absorbent products, 1990-1997). He also served as President (1986-1990) of Inbrand Corp. Prior to his employment with Inbrand Corp., he was employed by a retail fabric chain and North Carolina National Bank. In addition, Mr. Smith is a board member of the Jackson Hole Land Trust (2009-present). |
Kenneth B. Robins (42) |
| Year of Election or Appointment: 2008 President and Treasurer of Fidelity's Equity and High Income Funds. Mr. Robins also serves as President and Treasurer (2010-present) and Assistant Treasurer (2009-present) of other Fidelity funds and is an employee of Fidelity Investments (2004-present). Previously, Mr. Robins served as Deputy Treasurer of the Fidelity funds (2005-2008) and Treasurer and Chief Financial Officer of The North Carolina Capital Management Trust: Cash and Term Portfolios (2006-2008). |
Bruce T. Herring (46) |
| Year of Election or Appointment: 2006 Vice President of certain Equity Funds. Mr. Herring also serves as President of Fidelity Research & Analysis Company (2010-present), Chief Investment Officer and Director of Fidelity Management & Research (U.K.) Inc. (2010-present) and Group Chief Investment Officer of FMR. Previously, Mr. Herring served as Vice President (2005-2006) and Senior Vice President (2006-2007) of Fidelity Management & Research Company, Vice President of FMR Co., Inc. (2001-2007) and as a portfolio manager for Fidelity U.S. Equity Funds. |
Brian B. Hogan (47) |
| Year of Election or Appointment: 2009 Vice President of Equity and High Income Funds. Mr. Hogan also serves as President of FMR's Equity Division (2009-present). Previously, Mr. Hogan served as Senior Vice President, Equity Research of FMR (2006-2009) and as a portfolio manager. |
Scott C. Goebel (44) |
| Year of Election or Appointment: 2008 Secretary and Chief Legal Officer (CLO) of the Fidelity funds. Mr. Goebel also serves as Secretary of Fidelity Investments Money Management, Inc. (FIMM) (2010-present) and Fidelity Research and Analysis Company (FRAC) (2010-present); Secretary and CLO of The North Carolina Capital Management Trust: Cash and Term Portfolios (2008-present); General Counsel, Secretary, and Senior Vice President of FMR (2008-present) and FMR Co., Inc. (2008-present); employed by FMR LLC or an affiliate (2001-present); Chief Legal Officer of Fidelity Management & Research (Hong Kong) Limited (2008-present) and Assistant Secretary of Fidelity Management & Research (Japan) Inc. (2008-present), and Fidelity Management & Research (U.K.) Inc. (2008-present). Previously, Mr. Goebel served as Assistant Secretary of FIMM (2008-2010), FRAC (2008-2010), and the Funds (2007-2008) and as Vice President and Secretary of Fidelity Distributors Corporation (FDC) (2005-2007). |
William C. Coffey (43) |
| Year of Election or Appointment: 2009 Assistant Secretary of Fidelity's Equity and High Income Funds. Mr. Coffey also serves as Senior Vice President and Deputy General Counsel of FMR LLC (2010-present), and is an employee of Fidelity Investments. Previously, Mr. Coffey served as Vice President and Associate General Counsel of FMR LLC (2005-2009). |
Elizabeth Paige Baumann (44) |
| Year of Election or Appointment: 2012 Anti-Money Laundering (AML) Officer of the Fidelity funds. Ms. Baumann also serves as AML Officer of The North Carolina Capital Management Trust: Cash and Term Portfolios (2012-present), Chief AML Officer of FMR LLC (2012-present), and is an employee of Fidelity Investments. Previously, Ms. Baumann served as Vice President and Deputy Anti-Money Laundering Officer (2007-2012). |
Christine Reynolds (53) |
| Year of Election or Appointment: 2008 Chief Financial Officer of the Fidelity funds. Ms. Reynolds became President of Fidelity Pricing and Cash Management Services (FPCMS) in August 2008. Ms. Reynolds served as Chief Operating Officer of FPCMS (2007-2008). Previously, Ms. Reynolds served as President, Treasurer, and Anti-Money Laundering officer of the Fidelity funds (2004-2007). |
Joseph A. Hanlon (44) |
| Year of Election or Appointment: 2012 Chief Compliance Officer of Fidelity's Equity and High Income Funds. Mr. Hanlon serves as Compliance Officer of FMR, FMR Co., Inc., Fidelity Investments Money Management, Inc. (FIMM), Fidelity Research and Analysis Company (FRAC), Fidelity Management & Research (Japan) Inc., Fidelity Management & Research (U.K.) Inc., Fidelity Management & Research (Hong Kong), and Strategic Advisers, Inc. (2009-present), as Senior Vice President of the Fidelity Asset Management Division (2009-present), and is an employee of Fidelity Investments. |
Joseph F. Zambello (55) |
| Year of Election or Appointment: 2011 Deputy Treasurer of the Fidelity funds. Mr. Zambello is an employee of Fidelity Investments. Previously, Mr. Zambello served as Vice President of FMR's Program Management Group (2009-2011) and Vice President of the Transfer Agent Oversight Group (2005-2009). |
Adrien E. Deberghes (44) |
| Year of Election or Appointment: 2008 Deputy Treasurer of Fidelity's Equity and High Income Funds. Mr. Deberghes also serves as Vice President (2011-present) and Assistant Treasurer (2010-present) of other Fidelity funds, and is an employee of Fidelity Investments (2008-present). Previously, Mr. Deberghes served as Senior Vice President of Mutual Fund Administration at State Street Corporation (2007-2008), Senior Director of Mutual Fund Administration at Investors Bank & Trust (2005-2007), and Director of Finance for Dunkin' Brands (2000-2005). |
Stephanie J. Dorsey (43) |
| Year of Election or Appointment: 2010 Assistant Treasurer of Fidelity's Equity and High Income Funds. Ms. Dorsey also serves as Deputy Treasurer of other Fidelity funds (2008-present) and is an employee of Fidelity Investments (2008-present). Previously, Ms. Dorsey served as Treasurer (2004-2008) of the JPMorgan Mutual Funds and Vice President (2004-2008) of JPMorgan Chase Bank. |
John R. Hebble (54) |
| Year of Election or Appointment: 2009 Assistant Treasurer of Fidelity's Equity and High Income Funds. Mr. Hebble also serves as President (2011-present), Treasurer, and Chief Financial Officer of The North Carolina Capital Management Trust: Cash and Term Portfolios (2008-present), President and Treasurer of other Fidelity funds (2008-present) and is an employee of Fidelity Investments. |
Gary W. Ryan (54) |
| Year of Election or Appointment: 2005 Assistant Treasurer of the Fidelity funds. Mr. Ryan is an employee of Fidelity Investments. Previously, Mr. Ryan served as Vice President of Fund Reporting in Fidelity Pricing and Cash Management Services (FPCMS) (1999-2005). |
Jonathan Davis (44) |
| Year of Election or Appointment: 2010 Assistant Treasurer of the Fidelity funds. Mr. Davis is also Assistant Treasurer of Fidelity Rutland Square Trust II and Fidelity Commonwealth Trust II. Mr. Davis is an employee of Fidelity Investments. Previously, Mr. Davis served as Vice President and Associate General Counsel of FMR LLC (2003-2010). |
Annual Report
Class K designates 100% of the dividends distributed during the fiscal year as qualifying for the dividends-received deduction for corporate shareholders.
Class K designates 100% of the dividends distributed during the fiscal year as amounts which can be taken into account as a dividend for the purposes of the maximum rate under section 1(h)(11) of the Internal Revenue Code.
The fund will notify shareholders in January 2013 of amounts for use in preparing 2012 income tax returns.
Annual Report
Board Approval of Investment Advisory Contracts and Management Fees
Fidelity Blue Chip Growth Fund
Each year, the Board of Trustees, including the Independent Trustees (together, the Board), votes on the renewal of the management contract and sub-advisory agreements (together, the Advisory Contracts) for the fund. The Board, assisted by the advice of fund counsel and Independent Trustees' counsel, requests and considers a broad range of information relevant to the renewal of the Advisory Contracts throughout the year.
The Board meets regularly and, at each of its meetings, considers factors that are relevant to its annual consideration of the renewal of the fund's Advisory Contracts, including the services and support provided to the fund and its shareholders. The Board has established various standing committees, each composed of and chaired by Independent Trustees with varying backgrounds, to which the Board has assigned specific subject matter responsibilities in order to enhance effective decision-making by the Board. The Board, acting directly and through its Committees, requests and receives information concerning the annual consideration of the renewal of the fund's Advisory Contracts. The Board also meets as needed to consider matters specifically related to the Board's annual consideration of the renewal of Advisory Contracts. Members of the Board may also meet with trustees of other Fidelity funds through ad hoc joint committees to discuss certain matters relevant to the Fidelity funds.
At its July 2012 meeting, the Board of Trustees, including the Independent Trustees, unanimously determined to renew the fund's Advisory Contracts. In reaching its determination, the Board considered all factors it believed relevant, including (i) the nature, extent, and quality of the services to be provided to the fund and its shareholders (including the investment performance of the fund); (ii) the competitiveness of the fund's management fee and total expense ratio relative to peer funds; (iii) the total costs of the services to be provided by and the profits to be realized by Fidelity from its relationship with the fund; (iv) the extent to which economies of scale exist and would be realized as the fund grows; and (v) whether fee levels reflect these economies of scale, if any, for the benefit of fund shareholders.
In considering whether to renew the Advisory Contracts for the fund, the Board reached a determination, with the assistance of fund counsel and Independent Trustees' counsel and through the exercise of its business judgment, that the renewal of the Advisory Contracts is in the best interests of the fund and its shareholders and that the compensation payable under the Advisory Contracts is fair and reasonable. The Board's decision to renew the Advisory Contracts was not based on any single factor, but rather was based on a comprehensive consideration of all the information provided to the Board at its meetings throughout the year. The Board, in reaching its determination to renew the Advisory Contracts, is aware that shareholders in the fund have a broad range of investment choices available to them, including a wide choice among mutual funds offered by Fidelity's competitors, and that the fund's shareholders, who have the opportunity to review and weigh the disclosure provided by the fund in its prospectus and other public disclosures, have chosen to invest in this fund, managed by Fidelity.
Annual Report
Nature, Extent, and Quality of Services Provided. The Board considered the staffing within the investment adviser, FMR, and the sub-advisers (together, the Investment Advisers), including the backgrounds of the fund's investment personnel, and also considered the fund's investment objective, strategies, and related investment philosophy. The Independent Trustees also had discussions with senior management of Fidelity's investment operations and investment groups. The Board considered the structure of the portfolio manager compensation program and whether this structure provides appropriate incentives to act in the best interests of the fund.
Resources Dedicated to Investment Management and Support Services. The Board and the Fund Oversight and Research Committees reviewed the general qualifications and capabilities of the Investment Advisers' investment staff, including its size, education, experience, and resources, as well as the Investment Advisers' approach to recruiting, training, managing, and compensating investment personnel. The Board also noted that FMR has continued to increase the resources devoted to non-U.S. offices, including expansion of Fidelity's global investment organization. The Board noted that Fidelity's analysts have extensive resources, tools and capabilities that allow them to conduct sophisticated quantitative and fundamental analysis, as well as credit analysis of issuers, counterparties and guarantors. The Board also believes that Fidelity's investment professionals have sufficient access to global information and data so as to provide competitive investment results over time, and that those professionals also have access to sophisticated tools that permit them to assess portfolio construction and risk and performance attribution characteristics continuously, as well as to transmit new information and research conclusions rapidly around the world. Additionally, in its deliberations, the Board considered the Investment Advisers' trading and risk management capabilities and resources, which are an integral part of the investment management process.
Shareholder and Administrative Services. The Board considered (i) the nature, extent, quality, and cost of advisory, administrative, and shareholder services performed by the Investment Advisers and their affiliates under the Advisory Contracts and under separate agreements covering transfer agency, pricing and bookkeeping, and securities lending services for the fund; (ii) the nature and extent of the supervision of third party service providers, principally custodians and subcustodians; and (iii) the resources devoted to, and the record of compliance with, the fund's compliance policies and procedures. The Board also reviewed the allocation of fund brokerage, including allocations to brokers affiliated with the Investment Advisers, the use of brokerage commissions to pay fund expenses, and the use of "soft" commission dollars to pay for research services.
Annual Report
Board Approval of Investment Advisory Contracts and
Management Fees - continued
The Board noted that the growth of fund assets over time across the complex allows Fidelity to reinvest in the development of services designed to enhance the value or convenience of the Fidelity funds as investment vehicles. These services include 24-hour access to account information and market information through telephone representatives and over the Internet, investor education materials and asset allocation tools, and the expanded availability of Fidelity Investor Centers.
Investment in a Large Fund Family. The Board considered the benefits to shareholders of investing in a Fidelity fund, including the benefits of investing in a fund that is part of a large family of funds offering a variety of investment disciplines and providing a large variety of mutual fund investor services. The Board noted that Fidelity had taken, or had made recommendations that resulted in the Fidelity funds taking, a number of actions over the previous year that benefited particular funds, including (i) continuing to dedicate additional resources to investment research and support of the senior management team that oversees asset management; (ii) persisting in efforts to enhance Fidelity's research capabilities, in particular, international research; (iii) launching new funds and making other enhancements to meet client needs for global and income-oriented solutions; (iv) continuing to launch dedicated lower cost underlying funds to meet investment management's portfolio construction needs related to expanding underlying fund options, specifically for the Freedom Fund product lines; (v) adopting a "Stock Selector" sector neutral investment approach and employing a team of portfolio managers who are sector specialists to manage certain funds; (vi) rationalizing product lines and gaining increased efficiencies through the mergers of several funds into other funds; (vii) strengthening the Spartan Index Fund product line by adding new funds and/or new low-cost institutional share classes, restructuring fund expenses to accommodate new classes, and reducing investment minimums for certain classes of shares; (viii) modifying the eligibility criteria for Institutional Class shares to increase their appeal to government entities and charitable investors; and (ix) reducing certain transfer agent fee rates.
Investment Performance. The Board considered whether the fund has operated in accordance with its investment objective, as well as its record of compliance with its investment restrictions. It also reviewed the fund's absolute investment performance for each class, as well as the fund's relative investment performance for each class measured over multiple periods against (i) a broad-based securities market index, and (ii) a peer group of mutual funds deemed appropriate by Fidelity and reviewed by the Board. The following charts considered by the Board show, over the one-, three-, and five-year periods ended December 31, 2011, as available, the cumulative total returns of Class K and the retail class of the fund, the cumulative total returns of a broad-based securities market index ("benchmark"), and a range of cumulative total returns of a peer group of mutual funds identified by Morningstar, Inc. as having an investment style similar to that of the fund based on underlying portfolio holdings. The returns of Class K and the retail class show the performance of the highest and lowest performing classes, respectively (based on three-year performance). The box within each chart shows the 25th percentile return (top of box) and the 75th percentile return (bottom of box) of the peer group. Returns shown above the box are in the first quartile and returns shown below the box are in the fourth quartile. The percentage beaten numbers noted below each chart correspond to the percentile box and represent the percentage of funds in the peer group whose performance was equal to or lower than that of the class indicated.
Annual Report
Fidelity Blue Chip Growth Fund

The Board reviewed the fund's relative investment performance against its peer group and noted that the performance of the retail class of the fund (the class with the longest performance record) was in the third quartile for the one-year period and the first quartile for the three- and five-year periods. The Board also noted that the investment performance of the retail class of the fund compared favorably to its benchmark for the three- and five-year periods, although the fund's one-year total return was lower than its benchmark. The Board considered that the variations in performance among the fund's classes reflect the variations in class expenses, which result in lower performance for higher expense classes. The Board also reviewed the fund's performance since inception as well as performance in the current year.
The Board also considered that the fund's management fee is subject to upward or downward adjustment depending upon whether, and to what extent, the fund's investment performance for the performance period exceeds, or is exceeded by, the record (over the same period) of a Board-approved performance adjustment index. The Board noted that the performance adjustment provides FMR with a strong economic incentive to seek to achieve superior performance for the fund's shareholders and helps to more closely align the interests of FMR and the fund's shareholders.
Annual Report
Board Approval of Investment Advisory Contracts and
Management Fees - continued
Based on its review, the Board concluded that the nature, extent, and quality of services provided to the fund under the Advisory Contracts should benefit the fund's shareholders.
Competitiveness of Management Fee and Total Expense Ratio. The Board considered the fund's management fee and total expense ratio compared to "mapped groups" of competitive funds and classes. Fidelity creates "mapped groups" by combining similar Lipper investment objective categories that have comparable management fee characteristics. Combining Lipper investment objective categories aids the Board's management fee and total expense ratio comparisons by broadening the competitive group used for comparison and by reducing the number of universes to which various Fidelity funds are compared.
Management Fee. The Board considered two proprietary management fee comparisons for the 12-month periods shown in the chart below. The group of Lipper funds used by the Board for management fee comparisons is referred to below as the "Total Mapped Group." The Total Mapped Group comparison focuses on a fund's standing relative to the total universe of comparable funds available to investors in terms of gross management fees before expense reimbursements or caps, and without giving effect to the fund's performance adjustment. "TMG %" represents the percentage of funds in the Total Mapped Group that had management fees that were lower than the fund's. For example, a TMG % of 10% means that 90% of the funds in the Total Mapped Group had higher management fees than the fund. The "Asset-Size Peer Group" (ASPG) comparison focuses on a fund's standing relative to non-Fidelity funds similar in size to the fund within the Total Mapped Group. The ASPG represents at least 15% of the funds in the Total Mapped Group with comparable asset size and management fee characteristics, subject to a minimum of 50 funds (or all funds in the Total Mapped Group if fewer than 50). Additional information, such as the ASPG quartile in which the fund's management fee ranked and the impact of the fund's performance adjustment, is also included in the chart and considered by the Board.
Annual Report
Fidelity Blue Chip Growth Fund

The Board noted that the fund's management fee ranked below the median of its Total Mapped Group and below the median of its ASPG for 2011. The Board also noted the effect of the fund's positive performance adjustment on the fund's management fee ranking. The Board noted that the performance adjustment for each year represents calculations for performance periods that differ from the periods shown in the performance charts above.
Furthermore, the Board considered that shareholders approved a prospective change in the index used to calculate the fund's performance adjustment beginning June 1, 2006. The Board also considered that, because the performance adjustment is based on a rolling 36-month measurement period, during a transition period the fund's performance is compared to a blended index return that reflects the performance of the former index for the portion of the measurement period prior to June 1, 2006 and the performance of the current index for the remainder of the measurement period. The Board noted that the fund's performance adjustments for 2007 through 2009 shown in the chart above reflect the effect of using the blended index return to calculate the fund's performance adjustment.
Based on its review, the Board concluded that the fund's management fee is fair and reasonable in light of the services that the fund receives and the other factors considered.
Total Expense Ratio. In its review of each class's total expense ratio, the Board considered the fund's management fee as well as other fund or class expenses, as applicable, such as transfer agent fees, pricing and bookkeeping fees, and custodial, legal, and audit fees. The Board also noted the effects of any waivers and reimbursements on fees and expenses, as well as the impact of the fund's performance adjustment. As part of its review, the Board also considered the current and historical total expense ratios of each class of the fund compared to competitive fund median expenses. Each class of the fund is compared to those funds and classes in the Total Mapped Group (used by the Board for management fee comparisons) that have a similar sales load structure.
Annual Report
Board Approval of Investment Advisory Contracts and
Management Fees - continued
The Board noted that the total expense ratio of each class ranked below its competitive median for 2011.
Fees Charged to Other Fidelity Clients. The Board also considered Fidelity fee structures and other information with respect to clients of FMR and its affiliates, such as other mutual funds advised or subadvised by FMR or its affiliates, pension plan clients, and other institutional clients. The Board noted the findings of the 2010 ad hoc joint committee (created with the board of other Fidelity funds), which reviewed and compared Fidelity's institutional investment advisory business with its business of providing services to the Fidelity funds, including the differences in services provided, fees charged, and costs incurred, as well as competition in their respective marketplaces.
Based on its review of total expense ratios and fees charged to other Fidelity clients, the Board concluded that the total expense ratio of each class of the fund was reasonable in light of the services that the fund and its shareholders receive and the other factors considered.
Costs of the Services and Profitability. The Board considered the revenues earned and the expenses incurred by Fidelity in conducting the business of developing, marketing, distributing, managing, administering and servicing the fund and its shareholders. The Board also considered the level of Fidelity's profits in respect of all the Fidelity funds.
On an annual basis, FMR presents to the Board Fidelity's profitability for the fund. Fidelity calculates the profitability for each fund, as well as aggregate profitability for groups of Fidelity funds and all Fidelity funds, using a series of detailed revenue and cost allocation methodologies which originate with the books and records of Fidelity on which Fidelity's audited financial statements are based. The Audit Committee of the Board reviews any significant changes from the prior year's methodologies.
PricewaterhouseCoopers LLP (PwC), independent registered public accounting firm and auditor to Fidelity and certain Fidelity funds, has been engaged annually by the Board as part of the Board's assessment of Fidelity's profitability analysis. PwC's engagement includes the review and assessment of Fidelity's methodologies used in determining the revenues and expenses attributable to Fidelity's mutual fund business, and completion of agreed-upon procedures surrounding the mathematical accuracy of fund profitability and its conformity to allocation methodologies. After considering PwC's reports issued under the engagement and information provided by Fidelity, the Board concluded that while other allocation methods may also be reasonable, Fidelity's profitability methodologies are reasonable in all material respects.
Annual Report
The Board also reviewed Fidelity's non-fund businesses and fall-out benefits related to the mutual fund business as well as cases where Fidelity's affiliates may benefit from or be related to the fund's business.
The Board considered the costs of the services provided by and the profits realized by Fidelity in connection with the operation of the fund and was satisfied that the profitability was not excessive in the circumstances.
Economies of Scale. The Board considered whether there have been economies of scale in respect of the management of the Fidelity funds, whether the Fidelity funds (including the fund) have appropriately benefited from any such economies of scale, and whether there is potential for realization of any further economies of scale. The Board considered the extent to which the fund will benefit from economies of scale through increased services to the fund, through waivers or reimbursements, or through fee or expense reductions. The Board also noted that in 2009, it and the board of other Fidelity funds created an ad hoc committee (the Economies of Scale Committee) to analyze whether FMR attains economies of scale in respect of the management and servicing of the Fidelity funds, whether the Fidelity funds have appropriately benefited from such economies of scale, and whether there is potential for realization of any further economies of scale.
The Board recognized that the fund's management contract incorporates a "group fee" structure, which provides for lower group fee rates as total fund assets under FMR's management increase, and for higher group fee rates as total fund assets under FMR's management decrease. FMR calculates the group fee rates based on a tiered asset "breakpoint" schedule that varies based on asset class. The Board considered that the group fee is designed to deliver the benefits of economies of scale to fund shareholders when total Fidelity fund assets increase, even if assets of any particular fund are unchanged or have declined, because some portion of Fidelity's costs are attributable to services provided to all Fidelity funds, and all funds benefit if those costs can be allocated among more assets. The Board concluded that, given the group fee structure, fund shareholders will benefit from lower management fees as assets under FMR's management increase at the fund complex level, regardless of whether Fidelity achieves any such economies of scale.
The Board concluded, taking into account the analysis of the Economies of Scale Committee, that economies of scale, if any, are being appropriately shared between fund shareholders and Fidelity.
Annual Report
Board Approval of Investment Advisory Contracts and
Management Fees - continued
Additional Information Requested by the Board. In order to develop fully the factual basis for consideration of the Fidelity funds' Advisory Contracts, the Board requested and received additional information on certain topics, including (i) fund performance trends, actions to be taken by FMR to improve certain funds' overall performance, and Fidelity's long-term strategies for certain funds; (ii) the potential to further rationalize the Fidelity fund lineup with the possibility of achieving savings for the funds and Fidelity; (iii) Fidelity's compensation structure for portfolio managers and other key investment personnel; (iv) the amount of the investment that each portfolio manager has made in the Fidelity fund(s) that he or she manages; (v) the realization of fall-out benefits in certain Fidelity business units; (vi) Fidelity's group fee structures, the potential impact of regulatory changes on such structures, and the rationale for the individual fee rates of certain funds; (vii) fund profitability methodology, including Fidelity's cost allocation methodology, and the impact of certain factors on fund profitability results; (viii) trends regarding industry use of performance fee structures and the possibility of implementing performance fee structures for additional funds; and (ix) the impact of net redemptions from the Fidelity funds.
Based on its evaluation of all of the conclusions noted above, and after considering all factors it believed relevant, the Board ultimately concluded that the advisory fee structures are fair and reasonable, and that the fund's Advisory Contracts should be renewed.
Annual Report
Investment Adviser
Fidelity Management & Research Company
Boston, MA
Investment Sub-Advisers
FMR Co., Inc.
Fidelity Management & Research
(U.K.) Inc.
Fidelity Management & Research
(Hong Kong) Limited
Fidelity Management & Research
(Japan) Inc.
General Distributor
Fidelity Distributors Corporation
Smithfield, RI
Transfer and Service Agents
Fidelity Investments Institutional
Operations Company, Inc.
Boston, MA
Fidelity Service Company, Inc.
Boston, MA
Custodian
Citibank, N.A.
New York, NY
(Fidelity Investment logo)(registered trademark)
Corporate Headquarters
82 Devonshire St., Boston, MA 02109
www.fidelity.com
BCF-K-UANN-0912
1.863112.103
Fidelity®
Blue Chip Growth
Fund
Annual Report
July 31, 2012
(Fidelity Cover Art)
Contents
Performance | (Click Here) | How the fund has done over time. |
Management's Discussion of Fund Performance | (Click Here) | The Portfolio Manager's review of fund performance and strategy. |
Shareholder Expense Example | (Click Here) | An example of shareholder expenses. |
Investment Changes | (Click Here) | A summary of major shifts in the fund's investments over the past six months. |
Investments | (Click Here) | A complete list of the fund's investments with their market values. |
Financial Statements | (Click Here) | Statements of assets and liabilities, operations, and changes in net assets, as well as financial highlights. |
Notes | (Click Here) | Notes to the financial statements. |
Report of Independent Registered Public Accounting Firm | (Click Here) | |
Trustees and Officers | (Click Here) | |
Distributions | (Click Here) | |
Board Approval of Investment Advisory Contracts and Management Fees | (Click Here) | |
To view a fund's proxy voting guidelines and proxy voting record for the 12-month period ended June 30, visit http://www.fidelity.com/proxyvotingresults or visit the Securities and Exchange Commission's (SEC) web site at http://www.sec.gov. You may also call 1-800-544-8544 to request a free copy of the proxy voting guidelines.
Standard & Poor's, S&P and S&P 500 are registered service marks of The McGraw-Hill Companies, Inc. and have been licensed for use by Fidelity Distributors Corporation.
Other third party marks appearing herein are the property of their respective owners.
All other marks appearing herein are registered or unregistered trademarks or service marks of FMR LLC or an affiliated company. © 2012 FMR LLC. All rights reserved.
Annual Report
This report and the financial statements contained herein are submitted for the general information of the shareholders of the fund. This report is not authorized for distribution to prospective investors in the fund unless preceded or accompanied by an effective prospectus.
A fund files its complete schedule of portfolio holdings with the SEC for the first and third quarters of each fiscal year on Form N-Q. Forms N-Q are available on the SEC's web site at http://www.sec.gov. A fund's Forms N-Q may be reviewed and copied at the SEC's Public Reference Room in Washington, DC. Information regarding the operation of the SEC's Public Reference Room may be obtained by calling 1-800-SEC-0330. For a complete list of a fund's portfolio holdings, view the most recent holdings listing, semiannual report, or annual report on Fidelity's web site at http://www.fidelity.com, http://www.advisor.fidelity.com, or http://www.401k.com, as applicable.
NOT FDIC INSURED • MAY LOSE VALUE • NO BANK GUARANTEE
Neither the fund nor Fidelity Distributors Corporation is a bank.
Annual Report
Average annual total return reflects the change in the value of an investment, assuming reinvestment of the class' distributions from dividend income and capital gains (the profits earned upon the sale of securities that have grown in value, if any) and assuming a constant rate of performance each year. The $10,000 table and the fund's returns do not reflect the deduction of taxes that a shareholder would pay on fund distributions or the redemption of fund shares. During periods of reimbursement by Fidelity, a fund's total return will be greater than it would be had the reimbursement not occurred. How a fund did yesterday is no guarantee of how it will do tomorrow.
Average Annual Total Returns
Periods ended July 31, 2012 | Past 1
year | Past 5
years | Past 10
years |
Fidelity® Blue Chip Growth Fund | 2.27% | 4.09% | 6.15% |
$10,000 Over 10 Years
Let's say hypothetically that $10,000 was invested in Fidelity® Blue Chip Growth Fund, a class of the fund, on July 31, 2002. The chart shows how the value of your investment would have changed, and also shows how the Russell 1000® Growth Index performed over the same period.
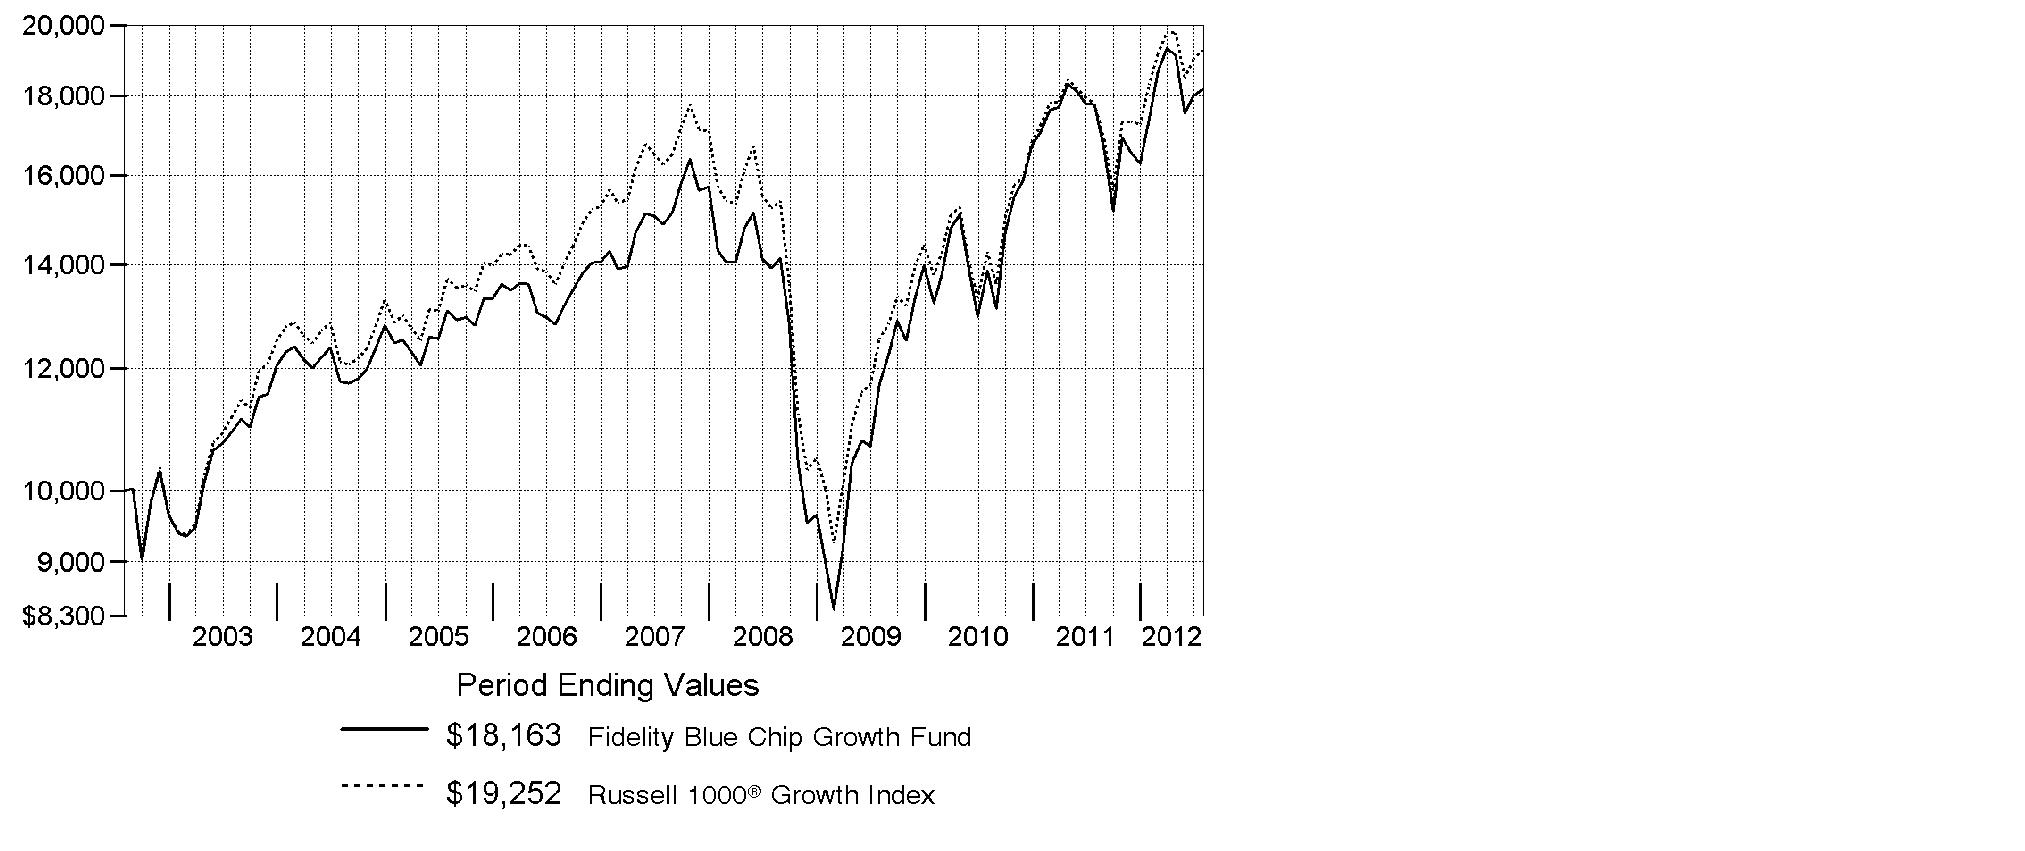
Annual Report
Market Recap: Major U.S. equity benchmarks posted solid gains for the year ending July 31, 2012, amid an uncertain investment environment. The broad-based S&P 500® Index returned 9.13%, while the blue-chip-laden Dow Jones Industrial AverageSM and technology-heavy Nasdaq Composite® Index gained 10.12% and 7.83%, respectively. Volatility spiked during the period's first half, as equities plummeted late last summer on Europe's debt woes, political wrangling over the U.S. debt ceiling and the sovereign credit-rating downgrade that followed. By October, a seemingly improved U.S. economy rejuvenated stocks, paving the way for major equity benchmarks to post their best first-quarter performance since 1998. However, more eurozone trouble, signs that the U.S. economy had turned sluggish and a slowdown in China caused stocks to slip in May, before a new wave of optimism took hold in June and July. Within the S&P 500®, more-defensive sectors such as telecommunication services (+30%) and consumer staples (+20%) fared best, while materials and energy significantly underperformed, returning -5%. Small- and mid-cap stocks trailed their less-volatile large-cap counterparts, with the Russell 2000® Index adding 0.19% and the Russell Midcap® Index rising 2.28%. Given turmoil and local currency weakness in Europe, foreign developed-markets stocks lost ground, with the MSCI® EAFE® Index returning -11.32%.
Comments from Sonu Kalra, Portfolio Manager of Fidelity® Blue Chip Growth Fund: For the year, the fund's Retail Class shares rose 2.27%, trailing the 8.26% gain of the Russell 1000® Growth Index. Picks in the food, beverage and tobacco segment of consumer staples hurt, primarily due to the fund's overweighted position in Green Mountain Coffee Roasters, by far the largest relative detractor. Investors began to worry that the maker of Keurig® single-cup coffee systems wouldn't be able to sustain its rapid growth, the company couldn't consistently meet expectations and some well-known hedge fund managers were openly critical about the stock. In May, Green Mountain overestimated the amount of demand for its products and reduced its revenue and earnings expectations. Leading U.S. coal producer Alpha Natural Resources - sold from the fund by period end - detracted, as did the fund's investments in foreign stocks, driven in part by a stronger U.S. dollar. Info tech was a bright spot, where overweighting giant Apple - by far the fund's largest holding - made the biggest overall contribution. Continued strong sales of the company's iPhone® 4S smartphone, personal computers and iPad® tablets boosted Apple's stock. Elsewhere, Hong Kong-based handbag maker Michael Kors Holdings was lifted by significant growth of its retail stores.
The views expressed above reflect those of the portfolio manager(s) only through the end of the period as stated on the cover of this report and do not necessarily represent the views of Fidelity or any other person in the Fidelity organization. Any such views are subject to change at any time based upon market or other conditions and Fidelity disclaims any responsibility to update such views. These views may not be relied on as investment advice and, because investment decisions for a Fidelity fund are based on numerous factors, may not be relied on as an indication of trading intent on behalf of any Fidelity fund.
Annual Report
Shareholder Expense Example
As a shareholder of the Fund, you incur two types of costs: (1) transaction costs, and (2) ongoing costs, including management fees and other Fund expenses. This Example is intended to help you understand your ongoing costs (in dollars) of investing in the Fund and to compare these costs with the ongoing costs of investing in other mutual funds.
The Example is based on an investment of $1,000 invested at the beginning of the period and held for the entire period (February 1, 2012 to July 31, 2012).
Actual Expenses
The first line of the accompanying table for each class of the Fund provides information about actual account values and actual expenses. You may use the information in this line, together with the amount you invested, to estimate the expenses that you paid over the period. Simply divide your account value by $1,000.00 (for example, an $8,600 account value divided by $1,000.00 = 8.6), then multiply the result by the number in the first line for a class of the Fund under the heading entitled "Expenses Paid During Period" to estimate the expenses you paid on your account during this period. A small balance maintenance fee of $12.00 that is charged once a year may apply for certain accounts with a value of less than $2,000. This fee is not included in the table below. If it was, the estimate of expenses you paid during the period would be higher, and your ending account value lower, by this amount. In addition, the Fund, as a shareholder in the underlying Fidelity Central Funds, will indirectly bear its pro-rata share of the fees and expenses incurred by the underlying Fidelity Central Funds. These fees and expenses are not included in the Fund's annualized expense ratio used to calculate the expense estimate in the table below.
Hypothetical Example for Comparison Purposes
The second line of the accompanying table for each class of the Fund provides information about hypothetical account values and hypothetical expenses based on a Class' actual expense ratio and an assumed rate of return of 5% per year before expenses, which is not the Class' actual return. The hypothetical account values and expenses may not be used to estimate the actual ending account balance or expenses you paid for the period. You may use this information to compare the ongoing costs of investing in the Fund and other funds. To do so, compare this 5% hypothetical example with the 5% hypothetical examples that appear in the shareholder reports of the other funds. A small balance maintenance fee of $12.00 that is charged once a year may apply for certain accounts with a value of less than $2,000. This fee is not included in the table below. If it was, the estimate of expenses you paid during the period would be higher, and your ending account value lower, by this amount. In addition, the Fund, as a shareholder in the underlying Fidelity Central Funds, will indirectly bear its pro-rata share of the fees and expenses incurred by the underlying Fidelity Central Funds. These fees and expenses are not included in the Fund's annualized expense ratio used to calculate the expense estimate in the table below.
Please note that the expenses shown in the table are meant to highlight your ongoing costs only and do not reflect any transaction costs. Therefore, the second line of the table is useful in comparing ongoing costs only, and will not help you determine the relative total costs of owning different funds.
Annual Report
Shareholder Expense Example - continued
| Annualized Expense Ratio | Beginning
Account Value
February 1, 2012 | Ending
Account Value
July 31, 2012 | Expenses Paid
During Period*
February 1, 2012 to
July 31, 2012 |
Blue Chip Growth | .88% | | | |
Actual | | $ 1,000.00 | $ 1,046.40 | $ 4.48 |
Hypothetical A | | $ 1,000.00 | $ 1,020.49 | $ 4.42 |
Class K | .73% | | | |
Actual | | $ 1,000.00 | $ 1,047.50 | $ 3.72 |
Hypothetical A | | $ 1,000.00 | $ 1,021.23 | $ 3.67 |
Class F | .68% | | | |
Actual | | $ 1,000.00 | $ 1,047.60 | $ 3.46 |
Hypothetical A | | $ 1,000.00 | $ 1,021.48 | $ 3.42 |
A 5% return per year before expenses
* Expenses are equal to each Class' annualized expense ratio, multiplied by the average account value over the period, multiplied by 182/366 (to reflect the one-half year period).
Annual Report
Investment Changes (Unaudited)
Top Ten Stocks as of July 31, 2012 |
| % of fund's
net assets | % of fund's net assets
6 months ago |
Apple, Inc. | 10.4 | 9.8 |
Google, Inc. Class A | 5.4 | 4.5 |
Amazon.com, Inc. | 2.1 | 1.7 |
QUALCOMM, Inc. | 2.1 | 2.1 |
The Coca-Cola Co. | 2.1 | 1.9 |
Microsoft Corp. | 1.9 | 1.2 |
Philip Morris International, Inc. | 1.6 | 1.4 |
Broadcom Corp. Class A | 1.5 | 1.0 |
MasterCard, Inc. Class A | 1.3 | 1.1 |
McDonald's Corp. | 1.3 | 2.2 |
| 29.7 | |
Top Five Market Sectors as of July 31, 2012 |
| % of fund's
net assets | % of fund's net assets
6 months ago |
Information Technology | 36.8 | 33.3 |
Consumer Discretionary | 21.1 | 19.8 |
Consumer Staples | 14.1 | 11.6 |
Health Care | 9.3 | 9.5 |
Industrials | 8.5 | 10.8 |
Asset Allocation (% of fund's net assets) |
As of July 31, 2012* | As of January 31, 2012** |
 | Stocks 99.8% | | | Stocks 100.3% | |
 | Convertible
Securities 0.0% | |  | Convertible
Securities 0.1% | |
 | Short-Term
Investments and
Net Other Assets (Liabilities) 0.2% | | | Short-Term
Investments and
Net Other Assets (Liabilities)† (0.4)% | |
* Foreign investments | 9.7% | | ** Foreign investments | 11.4% | |

† Short-term Investments and Net Other Assets (Liabilities) are not included in the pie chart. |
Annual Report
Investments July 31, 2012
Showing Percentage of Net Assets
Common Stocks - 99.3% |
| Shares | | Value (000s) |
CONSUMER DISCRETIONARY - 20.6% |
Auto Components - 0.3% |
Delphi Automotive PLC | 605,200 | | $ 17,182 |
The Goodyear Tire & Rubber Co. (a) | 739,100 | | 8,463 |
TRW Automotive Holdings Corp. (a) | 493,500 | | 19,395 |
| | 45,040 |
Automobiles - 0.7% |
Harley-Davidson, Inc. | 208,600 | | 9,018 |
Hyundai Motor Co. | 75,033 | | 15,728 |
Kia Motors Corp. | 152,660 | | 10,545 |
Tesla Motors, Inc. (a)(d) | 2,702,754 | | 74,110 |
| | 109,401 |
Hotels, Restaurants & Leisure - 4.6% |
Bravo Brio Restaurant Group, Inc. (a) | 740,800 | | 13,386 |
Chipotle Mexican Grill, Inc. (a) | 137,700 | | 40,254 |
Dunkin' Brands Group, Inc. | 533,300 | | 16,148 |
Hyatt Hotels Corp. Class A (a) | 316,497 | | 11,251 |
Jubilant Foodworks Ltd. (a) | 216,731 | | 4,387 |
Las Vegas Sands Corp. | 2,200,900 | | 80,157 |
McDonald's Corp. | 2,218,930 | | 198,284 |
Panera Bread Co. Class A (a) | 658,500 | | 103,707 |
Starbucks Corp. | 2,572,800 | | 116,496 |
Wyndham Worldwide Corp. | 340,985 | | 17,748 |
Yum! Brands, Inc. | 1,328,700 | | 86,153 |
| | 687,971 |
Household Durables - 1.1% |
Lennar Corp. Class A | 1,543,452 | | 45,084 |
SodaStream International Ltd. (a) | 286,400 | | 11,172 |
Toll Brothers, Inc. (a) | 1,176,800 | | 34,327 |
Whirlpool Corp. | 1,143,543 | | 77,258 |
| | 167,841 |
Internet & Catalog Retail - 3.3% |
Amazon.com, Inc. (a) | 1,356,600 | | 316,495 |
Expedia, Inc. (d) | 1,004,300 | | 57,235 |
Kayak Software Corp. | 15,300 | | 513 |
Priceline.com, Inc. (a) | 170,900 | | 113,091 |
| | 487,334 |
Media - 1.6% |
Comcast Corp. Class A | 4,174,700 | | 135,886 |
The Walt Disney Co. | 1,706,000 | | 83,833 |
Common Stocks - continued |
| Shares | | Value (000s) |
CONSUMER DISCRETIONARY - continued |
Media - continued |
Time Warner Cable, Inc. | 174,500 | | $ 14,820 |
Time Warner, Inc. | 113,500 | | 4,440 |
| | 238,979 |
Multiline Retail - 1.4% |
Dollar General Corp. (a) | 636,700 | | 32,478 |
Dollar Tree, Inc. (a) | 329,800 | | 16,602 |
Dollarama, Inc. | 420,234 | | 26,190 |
JCPenney Co., Inc. | 341,700 | | 7,692 |
Macy's, Inc. | 1,977,900 | | 70,888 |
Target Corp. | 883,700 | | 53,596 |
| | 207,446 |
Specialty Retail - 4.4% |
American Eagle Outfitters, Inc. | 142,800 | | 2,973 |
AutoZone, Inc. (a) | 33,600 | | 12,608 |
CarMax, Inc. (a) | 106,400 | | 2,961 |
Cia.Hering SA | 254,600 | | 5,027 |
Five Below, Inc. | 15,500 | | 455 |
Foot Locker, Inc. | 506,500 | | 16,725 |
Francescas Holdings Corp. (a) | 856,800 | | 26,912 |
GNC Holdings, Inc. | 569,900 | | 21,958 |
Home Depot, Inc. | 2,808,900 | | 146,568 |
Limited Brands, Inc. | 2,769,800 | | 131,704 |
Lowe's Companies, Inc. | 769,500 | | 19,522 |
Ross Stores, Inc. | 516,700 | | 34,330 |
TJX Companies, Inc. | 3,643,580 | | 161,338 |
Ulta Salon, Cosmetics & Fragrance, Inc. | 294,400 | | 24,989 |
Urban Outfitters, Inc. (a) | 1,228,400 | | 37,528 |
| | 645,598 |
Textiles, Apparel & Luxury Goods - 3.2% |
Arezzo Industria e Comercio SA | 1,681,000 | | 26,390 |
Brunello Cucinelli SpA | 561,900 | | 7,660 |
Coach, Inc. | 745,500 | | 36,776 |
Fifth & Pacific Companies, Inc. (a)(d) | 2,198,511 | | 24,360 |
Fossil, Inc. (a) | 644,319 | | 46,191 |
lululemon athletica, Inc. (a) | 446,180 | | 25,200 |
Michael Kors Holdings Ltd. | 2,825,537 | | 116,666 |
NIKE, Inc. Class B | 858,200 | | 80,113 |
Common Stocks - continued |
| Shares | | Value (000s) |
CONSUMER DISCRETIONARY - continued |
Textiles, Apparel & Luxury Goods - continued |
PVH Corp. | 954,900 | | $ 75,848 |
Under Armour, Inc. Class A (sub. vtg.) (a) | 511,418 | | 27,842 |
| | 467,046 |
TOTAL CONSUMER DISCRETIONARY | | 3,056,656 |
CONSUMER STAPLES - 14.1% |
Beverages - 4.8% |
Anheuser-Busch InBev SA NV ADR | 734,800 | | 58,211 |
Beam, Inc. | 285,100 | | 17,927 |
Constellation Brands, Inc. Class A (sub. vtg.) (a) | 366,600 | | 10,342 |
Diageo PLC sponsored ADR | 74,000 | | 7,911 |
Dr Pepper Snapple Group, Inc. | 862,000 | | 39,290 |
Monster Beverage Corp. (a) | 2,184,800 | | 145,224 |
PepsiCo, Inc. | 1,619,800 | | 117,808 |
SABMiller PLC | 181,900 | | 7,863 |
The Coca-Cola Co. | 3,773,800 | | 304,923 |
| | 709,499 |
Food & Staples Retailing - 2.7% |
Costco Wholesale Corp. | 759,900 | | 73,087 |
CVS Caremark Corp. | 2,692,800 | | 121,849 |
Fresh Market, Inc. (a) | 445,100 | | 26,212 |
Wal-Mart Stores, Inc. | 1,262,200 | | 93,946 |
Whole Foods Market, Inc. | 960,000 | | 88,109 |
| | 403,203 |
Food Products - 1.7% |
Annie's, Inc. (d) | 13,200 | | 538 |
Calbee, Inc. (d) | 386,000 | | 26,875 |
ConAgra Foods, Inc. | 347,800 | | 8,587 |
DE Master Blenders 1753 NV (a) | 821,500 | | 9,520 |
Green Mountain Coffee Roasters, Inc. (a)(d) | 3,782,299 | | 69,065 |
Kraft Foods, Inc. Class A | 678,200 | | 26,931 |
Mead Johnson Nutrition Co. Class A | 349,400 | | 25,492 |
The Hershey Co. | 1,014,500 | | 72,780 |
The J.M. Smucker Co. | 193,900 | | 14,892 |
| | 254,680 |
Household Products - 1.7% |
Colgate-Palmolive Co. | 500,300 | | 53,712 |
Kimberly-Clark Corp. | 1,046,600 | | 90,960 |
Common Stocks - continued |
| Shares | | Value (000s) |
CONSUMER STAPLES - continued |
Household Products - continued |
Procter & Gamble Co. | 1,337,400 | | $ 86,316 |
Reckitt Benckiser Group PLC | 275,100 | | 15,126 |
| | 246,114 |
Personal Products - 0.4% |
Herbalife Ltd. | 1,137,731 | | 62,450 |
Tobacco - 2.8% |
Altria Group, Inc. | 1,873,900 | | 67,404 |
British American Tobacco PLC (United Kingdom) | 146,800 | | 7,797 |
Lorillard, Inc. | 772,000 | | 99,310 |
Philip Morris International, Inc. | 2,640,600 | | 241,456 |
Souza Cruz SA | 202,200 | | 2,852 |
| | 418,819 |
TOTAL CONSUMER STAPLES | | 2,094,765 |
ENERGY - 5.5% |
Energy Equipment & Services - 2.0% |
Atwood Oceanics, Inc. (a) | 128,800 | | 5,735 |
Ensco PLC Class A | 270,400 | | 14,691 |
Halliburton Co. | 493,200 | | 16,340 |
National Oilwell Varco, Inc. | 1,343,500 | | 97,135 |
Schlumberger Ltd. | 1,886,000 | | 134,396 |
Seadrill Ltd. | 722,500 | | 28,026 |
| | 296,323 |
Oil, Gas & Consumable Fuels - 3.5% |
Anadarko Petroleum Corp. | 1,223,700 | | 84,974 |
Apache Corp. | 344,100 | | 29,634 |
Chevron Corp. | 794,500 | | 87,061 |
Concho Resources, Inc. (a) | 34,600 | | 2,950 |
EOG Resources, Inc. | 315,200 | | 30,893 |
Hess Corp. | 153,700 | | 7,248 |
Marathon Petroleum Corp. | 625,400 | | 29,581 |
Noble Energy, Inc. | 31,100 | | 2,719 |
Occidental Petroleum Corp. | 1,164,000 | | 101,303 |
Peabody Energy Corp. | 787,800 | | 16,449 |
Pioneer Natural Resources Co. | 438,300 | | 38,847 |
Plains Exploration & Production Co. (a) | 1,762,200 | | 70,418 |
Common Stocks - continued |
| Shares | | Value (000s) |
ENERGY - continued |
Oil, Gas & Consumable Fuels - continued |
SM Energy Co. | 439,000 | | $ 20,673 |
Valero Energy Corp. | 117,100 | | 3,220 |
| | 525,970 |
TOTAL ENERGY | | 822,293 |
FINANCIALS - 1.9% |
Capital Markets - 0.4% |
KKR & Co. LP | 623,200 | | 8,719 |
Morgan Stanley | 3,653,912 | | 49,912 |
| | 58,631 |
Commercial Banks - 0.2% |
ICICI Bank Ltd. | 666,777 | | 11,486 |
Wells Fargo & Co. | 366,800 | | 12,402 |
| | 23,888 |
Consumer Finance - 0.3% |
Discover Financial Services | 1,163,600 | | 41,843 |
Diversified Financial Services - 0.9% |
Citigroup, Inc. | 3,352,420 | | 90,951 |
JPMorgan Chase & Co. | 1,283,400 | | 46,202 |
| | 137,153 |
Real Estate Management & Development - 0.1% |
Parsvnath Developers Ltd. (a)(e) | 21,771,340 | | 15,302 |
TOTAL FINANCIALS | | 276,817 |
HEALTH CARE - 9.3% |
Biotechnology - 4.5% |
Alexion Pharmaceuticals, Inc. (a) | 665,000 | | 69,725 |
Alkermes PLC (a) | 917,100 | | 17,049 |
Alnylam Pharmaceuticals, Inc. (a) | 324,500 | | 6,065 |
Amgen, Inc. | 346,300 | | 28,604 |
ARIAD Pharmaceuticals, Inc. (a) | 1,698,200 | | 32,487 |
Biogen Idec, Inc. (a) | 894,800 | | 130,489 |
BioMarin Pharmaceutical, Inc. (a) | 107,500 | | 4,224 |
Clovis Oncology, Inc. | 195,300 | | 3,455 |
Exelixis, Inc. (a) | 3,425,500 | | 21,409 |
Gilead Sciences, Inc. (a) | 2,463,300 | | 133,831 |
Grifols SA (a) | 95,600 | | 2,981 |
Grifols SA ADR | 38,200 | | 853 |
Common Stocks - continued |
| Shares | | Value (000s) |
HEALTH CARE - continued |
Biotechnology - continued |
Ironwood Pharmaceuticals, Inc. Class A (a) | 473,000 | | $ 6,088 |
Medivation, Inc. (a) | 149,500 | | 14,905 |
Merrimack Pharmaceuticals, Inc. | 265,000 | | 2,112 |
Merrimack Pharmaceuticals, Inc. (f) | 2,142,858 | | 15,371 |
ONYX Pharmaceuticals, Inc. (a) | 256,300 | | 19,215 |
Regeneron Pharmaceuticals, Inc. (a) | 297,100 | | 40,005 |
Spectrum Pharmaceuticals, Inc. (a)(d) | 1,347,100 | | 18,846 |
Theravance, Inc. (a) | 437,314 | | 12,739 |
Vertex Pharmaceuticals, Inc. (a) | 1,669,800 | | 81,002 |
ZIOPHARM Oncology, Inc. (a) | 721,728 | | 4,063 |
| | 665,518 |
Health Care Equipment & Supplies - 1.0% |
Align Technology, Inc. (a) | 919,500 | | 31,226 |
Baxter International, Inc. | 132,600 | | 7,758 |
Covidien PLC | 215,000 | | 12,014 |
Insulet Corp. (a) | 310,600 | | 6,075 |
Intuitive Surgical, Inc. (a) | 44,400 | | 21,379 |
The Cooper Companies, Inc. | 730,272 | | 54,960 |
William Demant Holding A/S (a) | 126,000 | | 11,906 |
| | 145,318 |
Health Care Providers & Services - 1.2% |
Apollo Hospitals Enterprise Ltd. | 649,448 | | 7,366 |
Catamaran Corp. (a) | 102,300 | | 8,689 |
Express Scripts Holding Co. (a) | 2,168,727 | | 125,656 |
McKesson Corp. | 479,144 | | 43,473 |
| | 185,184 |
Health Care Technology - 0.1% |
athenahealth, Inc. (a)(d) | 154,575 | | 14,144 |
Pharmaceuticals - 2.5% |
Abbott Laboratories | 244,100 | | 16,186 |
Allergan, Inc. | 126,100 | | 10,349 |
AVANIR Pharmaceuticals Class A (a) | 2,885,556 | | 8,253 |
Bristol-Myers Squibb Co. | 2,435,100 | | 86,690 |
Elan Corp. PLC sponsored ADR (a) | 2,445,600 | | 28,247 |
Eli Lilly & Co. | 375,600 | | 16,538 |
Johnson & Johnson | 930,440 | | 64,405 |
Merck & Co., Inc. | 101,200 | | 4,470 |
Pfizer, Inc. | 1,839,600 | | 44,224 |
Questcor Pharmaceuticals, Inc. (a)(d) | 457,619 | | 16,872 |
Common Stocks - continued |
| Shares | | Value (000s) |
HEALTH CARE - continued |
Pharmaceuticals - continued |
Salix Pharmaceuticals Ltd. (a) | 446,500 | | $ 20,012 |
Valeant Pharmaceuticals International, Inc. (Canada) (a) | 1,073,200 | | 51,153 |
| | 367,399 |
TOTAL HEALTH CARE | | 1,377,563 |
INDUSTRIALS - 8.5% |
Aerospace & Defense - 2.8% |
Honeywell International, Inc. | 762,700 | | 44,275 |
Precision Castparts Corp. | 594,500 | | 92,480 |
The Boeing Co. | 2,057,200 | | 152,048 |
United Technologies Corp. | 1,767,400 | | 131,565 |
| | 420,368 |
Air Freight & Logistics - 0.8% |
United Parcel Service, Inc. Class B | 1,591,000 | | 120,296 |
Airlines - 0.3% |
United Continental Holdings, Inc. (a) | 2,038,600 | | 38,509 |
Building Products - 0.3% |
Armstrong World Industries, Inc. | 692,100 | | 26,750 |
Owens Corning (a) | 347,800 | | 9,342 |
| | 36,092 |
Commercial Services & Supplies - 0.0% |
Swisher Hygiene, Inc. (a) | 2,095,491 | | 3,790 |
Construction & Engineering - 0.2% |
Foster Wheeler AG (a) | 250,000 | | 4,510 |
Quanta Services, Inc. (a) | 961,400 | | 22,103 |
| | 26,613 |
Industrial Conglomerates - 1.2% |
Carlisle Companies, Inc. | 290,500 | | 14,667 |
Danaher Corp. | 2,579,900 | | 136,245 |
General Electric Co. | 1,505,100 | | 31,231 |
| | 182,143 |
Machinery - 1.8% |
Caterpillar, Inc. | 794,100 | | 66,871 |
Cummins, Inc. | 497,000 | | 47,662 |
Illinois Tool Works, Inc. | 256,300 | | 13,927 |
Ingersoll-Rand PLC | 1,293,700 | | 54,866 |
Common Stocks - continued |
| Shares | | Value (000s) |
INDUSTRIALS - continued |
Machinery - continued |
Joy Global, Inc. | 1,506,700 | | $ 78,258 |
Manitowoc Co., Inc. | 693,700 | | 8,324 |
| | 269,908 |
Professional Services - 0.1% |
Qualicorp SA (a) | 836,000 | | 7,445 |
Road & Rail - 0.9% |
Canadian Pacific | 390,000 | | 31,699 |
Norfolk Southern Corp. | 60,500 | | 4,480 |
Union Pacific Corp. | 787,000 | | 96,494 |
| | 132,673 |
Trading Companies & Distributors - 0.1% |
H&E Equipment Services, Inc. (a) | 463,290 | | 6,542 |
Mills Estruturas e Servicos de Engenharia SA | 827,400 | | 11,156 |
| | 17,698 |
TOTAL INDUSTRIALS | | 1,255,535 |
INFORMATION TECHNOLOGY - 36.8% |
Communications Equipment - 2.5% |
Finisar Corp. (a) | 613,500 | | 7,626 |
Juniper Networks, Inc. (a) | 1,887,500 | | 33,088 |
Motorola Solutions, Inc. | 208,700 | | 10,089 |
Palo Alto Networks, Inc. | 18,300 | | 1,046 |
QUALCOMM, Inc. | 5,298,100 | | 316,191 |
| | 368,040 |
Computers & Peripherals - 11.5% |
Apple, Inc. | 2,533,200 | | 1,547,175 |
EMC Corp. (a) | 2,121,200 | | 55,597 |
Fusion-io, Inc. (a) | 692,400 | | 13,239 |
Gemalto NV | 363,932 | | 27,892 |
NetApp, Inc. (a) | 1,903,000 | | 62,171 |
| | 1,706,074 |
Internet Software & Services - 7.9% |
Akamai Technologies, Inc. (a) | 1,556,600 | | 54,761 |
Baidu.com, Inc. sponsored ADR (a) | 386,000 | | 46,521 |
Dropbox, Inc. (f) | 1,003,814 | | 9,084 |
eBay, Inc. (a) | 2,122,700 | | 94,036 |
Facebook, Inc.: | | | |
Class A (d) | 1,256,300 | | 27,274 |
Common Stocks - continued |
| Shares | | Value (000s) |
INFORMATION TECHNOLOGY - continued |
Internet Software & Services - continued |
Facebook, Inc.: - continued | | | |
Class B (a)(f) | 636,167 | | $ 12,430 |
Google, Inc. Class A (a) | 1,255,867 | | 794,926 |
IAC/InterActiveCorp | 587,700 | | 30,919 |
LinkedIn Corp. (a) | 151,100 | | 15,510 |
SINA Corp. (a)(d) | 393,992 | | 17,891 |
Tencent Holdings Ltd. | 496,000 | | 14,826 |
Yahoo!, Inc. (a) | 3,051,200 | | 48,331 |
| | 1,166,509 |
IT Services - 3.2% |
Cognizant Technology Solutions Corp. Class A (a) | 1,643,500 | | 93,301 |
EPAM Systems, Inc. | 303,400 | | 4,867 |
IBM Corp. | 36,100 | | 7,075 |
MasterCard, Inc. Class A | 457,200 | | 199,600 |
Maximus, Inc. | 96,200 | | 4,858 |
Teradata Corp. (a) | 269,100 | | 18,197 |
The Western Union Co. | 433,100 | | 7,549 |
Visa, Inc. Class A | 1,103,500 | | 142,429 |
| | 477,876 |
Semiconductors & Semiconductor Equipment - 5.7% |
Altera Corp. | 2,107,500 | | 74,711 |
ASML Holding NV | 227,100 | | 13,058 |
Avago Technologies Ltd. | 2,168,600 | | 80,238 |
Broadcom Corp. Class A | 6,636,700 | | 224,851 |
Cirrus Logic, Inc. (a) | 1,162,528 | | 42,746 |
Cree, Inc. (a) | 768,200 | | 18,398 |
Freescale Semiconductor Holdings I Ltd. (a) | 5,697,958 | | 60,797 |
Mellanox Technologies Ltd. (a) | 380,700 | | 39,920 |
NVIDIA Corp. (a) | 7,619,673 | | 103,170 |
NXP Semiconductors NV��(a) | 7,331,835 | | 165,626 |
Samsung Electronics Co. Ltd. | 7,550 | | 8,741 |
Skyworks Solutions, Inc. (a) | 516,400 | | 14,939 |
| | 847,195 |
Software - 6.0% |
Activision Blizzard, Inc. | 2,939,000 | | 35,356 |
Check Point Software Technologies Ltd. (a) | 1,030,400 | | 50,047 |
Citrix Systems, Inc. (a) | 1,550,100 | | 112,661 |
Guidewire Software, Inc. | 248,300 | | 6,371 |
Informatica Corp. (a) | 437,700 | | 12,917 |
Jive Software, Inc. | 533,500 | | 10,686 |
Common Stocks - continued |
| Shares | | Value (000s) |
INFORMATION TECHNOLOGY - continued |
Software - continued |
Microsoft Corp. | 9,327,700 | | $ 274,887 |
Oracle Corp. | 2,392,100 | | 72,241 |
QLIK Technologies, Inc. (a) | 767,063 | | 15,341 |
Red Hat, Inc. (a) | 1,020,700 | | 54,771 |
salesforce.com, Inc. (a) | 1,341,665 | | 166,849 |
ServiceNow, Inc. | 36,400 | | 983 |
Splunk, Inc. (d) | 196,000 | | 5,762 |
VMware, Inc. Class A (a) | 771,500 | | 70,021 |
| | 888,893 |
TOTAL INFORMATION TECHNOLOGY | | 5,454,587 |
MATERIALS - 2.4% |
Chemicals - 2.2% |
Albemarle Corp. | 856,400 | | 49,860 |
CF Industries Holdings, Inc. | 178,000 | | 34,845 |
E.I. du Pont de Nemours & Co. | 1,225,400 | | 60,902 |
Eastman Chemical Co. | 169,100 | | 8,841 |
LyondellBasell Industries NV Class A | 1,211,700 | | 53,957 |
Monsanto Co. | 763,800 | | 65,397 |
PetroLogistics LP | 883,200 | | 10,916 |
Sherwin-Williams Co. | 165,000 | | 22,168 |
Westlake Chemical Corp. (d) | 417,500 | | 24,783 |
| | 331,669 |
Containers & Packaging - 0.2% |
Rock-Tenn Co. Class A | 439,500 | | 25,588 |
TOTAL MATERIALS | | 357,257 |
TELECOMMUNICATION SERVICES - 0.2% |
Wireless Telecommunication Services - 0.2% |
Sprint Nextel Corp. (a) | 3,330,000 | | 14,519 |
Vodafone Group PLC sponsored ADR | 407,300 | | 11,710 |
| | 26,229 |
TOTAL COMMON STOCKS (Cost $11,025,400) |
14,721,702
|
Nonconvertible Preferred Stocks - 0.5% |
| Shares | | Value (000s) |
CONSUMER DISCRETIONARY - 0.5% |
Automobiles - 0.5% |
Volkswagen AG | 469,300 | | $ 80,262 |
TOTAL NONCONVERTIBLE PREFERRED STOCKS (Cost $52,053) |
80,262
|
Money Market Funds - 1.3% |
| | | |
Fidelity Cash Central Fund, 0.17% (b) | 12,339,372 | | 12,339 |
Fidelity Securities Lending Cash Central Fund, 0.18% (b)(c) | 173,924,939 | | 173,925 |
TOTAL MONEY MARKET FUNDS (Cost $186,264) |
186,264
|
TOTAL INVESTMENT PORTFOLIO - 101.1% (Cost $11,263,717) | | 14,988,228 |
NET OTHER ASSETS (LIABILITIES) - (1.1)% | | (168,514) |
NET ASSETS - 100% | $ 14,819,714 |
Legend |
(a) Non-income producing |
(b) Affiliated fund that is available only to investment companies and other accounts managed by Fidelity Investments. The rate quoted is the annualized seven-day yield of the fund at period end. A complete unaudited listing of the fund's holdings as of its most recent quarter end is available upon request. In addition, each Fidelity Central Fund's financial statements, which are not covered by the Fund's Report of Independent Registered Public Accounting Firm, are available on the SEC's website or upon request. |
(c) Investment made with cash collateral received from securities on loan. |
(d) Security or a portion of the security is on loan at period end. |
(e) Affiliated company |
(f) Restricted securities - Investment in securities not registered under the Securities Act of 1933 (excluding 144A issues). At the end of the period, the value of restricted securities (excluding 144A issues) amounted to $36,885,000 or 0.2% of net assets. |
Additional information on each restricted holding is as follows: |
Security | Acquisition Date | Acquisition
Cost (000s) |
Dropbox, Inc. | 5/2/12 | $ 9,084 |
Facebook, Inc. Class B | 3/31/11 - 5/19/11 | $ 15,909 |
Merrimack Pharmaceuticals, Inc. | 3/31/11 | $ 15,000 |
Affiliated Central Funds |
Information regarding fiscal year to date income earned by the Fund from investments in Fidelity Central Funds is as follows: |
Fund | Income earned
(Amounts in thousands) |
Fidelity Cash Central Fund | $ 55 |
Fidelity Securities Lending Cash Central Fund | 3,357 |
Total | $ 3,412 |
Other Affiliated Issuers |
An affiliated company is a company in which the Fund has ownership of at least 5% of the voting securities. Fiscal year to date transactions with companies which are or were affiliates are as follows: |
Affiliate
(Amounts in thousands) | Value, beginning of period | Purchases | Sales Proceeds | Dividend Income | Value,
end of
period |
Parsvnath Developers Ltd. | $ 22,924 | $ - | $ - | $ - | $ 15,302 |
Spectrum Pharmaceuticals, Inc. | - | 42,886 | 19,181 | - | - |
Total | $ 22,924 | $ 42,886 | $ 19,181 | $ - | $ 15,302 |
Other Information |
The following is a summary of the inputs used, as of July 31, 2012, involving the Fund's assets and liabilities carried at fair value. The inputs or methodology used for valuing securities may not be an indication of the risk associated with investing in those securities. For more information on valuation inputs, and their aggregation into the levels used in the table below, please refer to the Security Valuation section in the accompanying Notes to Financial Statements. |
Valuation Inputs at Reporting Date: |
Description
(Amounts in thousands) | Total | Level 1 | Level 2 | Level 3 |
Investments in Securities: | | | | |
Equities: | | | | |
Consumer Discretionary | $ 3,136,918 | $ 3,136,918 | $ - | $ - |
Consumer Staples | 2,094,765 | 2,060,093 | 34,672 | - |
Energy | 822,293 | 822,293 | - | - |
Financials | 276,817 | 265,331 | 11,486 | - |
Health Care | 1,377,563 | 1,362,192 | 15,371 | - |
Industrials | 1,255,535 | 1,251,745 | 3,790 | - |
Information Technology | 5,454,587 | 5,433,073 | 12,430 | 9,084 |
Materials | 357,257 | 357,257 | - | - |
Telecommunication Services | 26,229 | 26,229 | - | - |
Money Market Funds | 186,264 | 186,264 | - | - |
Total Investments in Securities: | $ 14,988,228 | $ 14,901,395 | $ 77,749 | $ 9,084 |
See accompanying notes which are an integral part of the financial statements.
Annual Report
Statement of Assets and Liabilities
Amounts in thousands (except per-share amounts) | July 31, 2012 |
| | |
Assets | | |
Investment in securities, at value (including securities loaned of $165,637) - See accompanying schedule: Unaffiliated issuers (cost $11,046,602) | $ 14,786,662 | |
Fidelity Central Funds (cost $186,264) | 186,264 | |
Other affiliated issuers (cost $30,851) | 15,302 | |
Total Investments (cost $11,263,717) | | $ 14,988,228 |
Foreign currency held at value (cost $2,675) | | 2,675 |
Receivable for investments sold | | 203,022 |
Receivable for fund shares sold | | 32,067 |
Dividends receivable | | 3,803 |
Distributions receivable from Fidelity Central Funds | | 286 |
Other receivables | | 749 |
Total assets | | 15,230,830 |
| | |
Liabilities | | |
Payable to custodian bank | $ 6 | |
Payable for investments purchased | 187,368 | |
Payable for fund shares redeemed | 40,039 | |
Accrued management fee | 7,123 | |
Other affiliated payables | 2,028 | |
Other payables and accrued expenses | 627 | |
Collateral on securities loaned, at value | 173,925 | |
Total liabilities | | 411,116 |
| | |
Net Assets | | $ 14,819,714 |
Net Assets consist of: | | |
Paid in capital | | $ 11,168,136 |
Undistributed net investment income | | 10,385 |
Accumulated undistributed net realized gain (loss) on investments and foreign currency transactions | | (83,290) |
Net unrealized appreciation (depreciation) on investments and assets and liabilities in foreign currencies | | 3,724,483 |
Net Assets | | $ 14,819,714 |
See accompanying notes which are an integral part of the financial statements.
Annual Report
Statement of Assets and Liabilities - continued
Amounts in thousands (except per-share amounts) | July 31, 2012 |
| | |
Blue Chip Growth:
Net Asset Value, offering price and redemption price per share ($10,595,343 ÷ 223,607 shares) | | $ 47.38 |
| | |
Class K:
Net Asset Value, offering price and redemption price per share ($2,467,455 ÷ 51,991 shares) | | $ 47.46 |
| | |
Class F:
Net Asset Value, offering price and redemption price per share ($1,756,916 ÷ 36,980 shares) | | $ 47.51 |
See accompanying notes which are an integral part of the financial statements.
Annual Report
Financial Statements - continued
Statement of Operations
Amounts in thousands | Year ended July 31, 2012 |
| | |
Investment Income | | |
Dividends | | $ 150,681 |
Interest | | 1 |
Income from Fidelity Central Funds | | 3,412 |
Total income | | 154,094 |
| | |
Expenses | | |
Management fee
Basic fee | $ 77,977 | |
Performance adjustment | 15,095 | |
Transfer agent fees | 23,533 | |
Accounting and security lending fees | 1,491 | |
Custodian fees and expenses | 585 | |
Independent trustees' compensation | 94 | |
Registration fees | 252 | |
Audit | 101 | |
Legal | 53 | |
Interest | 6 | |
Miscellaneous | 142 | |
Total expenses before reductions | 119,329 | |
Expense reductions | (618) | 118,711 |
Net investment income (loss) | | 35,383 |
Realized and Unrealized Gain (Loss) Net realized gain (loss) on: | | |
Investment securities: | | |
Unaffiliated issuers | (32,788) | |
Other affiliated issuers | (4,301) | |
Foreign currency transactions | (342) | |
Total net realized gain (loss) | | (37,431) |
Change in net unrealized appreciation (depreciation) on: Investment securities | 271,818 | |
Assets and liabilities in foreign currencies | (29) | |
Total change in net unrealized appreciation (depreciation) | | 271,789 |
Net gain (loss) | | 234,358 |
Net increase (decrease) in net assets resulting from operations | | $ 269,741 |
See accompanying notes which are an integral part of the financial statements.
Annual Report
Statement of Changes in Net Assets
Amounts in thousands | Year ended
July 31,
2012 | Year ended
July 31,
2011 |
Increase (Decrease) in Net Assets | | |
Operations | | |
Net investment income (loss) | $ 35,383 | $ (4,517) |
Net realized gain (loss) | (37,431) | 1,562,158 |
Change in net unrealized appreciation (depreciation) | 271,789 | 1,651,657 |
Net increase (decrease) in net assets resulting
from operations | 269,741 | 3,209,298 |
Distributions to shareholders from net investment income | (15,666) | (2,405) |
Distributions to shareholders from net realized gain | (480,841) | (12,451) |
Total distributions | (496,507) | (14,856) |
Share transactions - net increase (decrease) | 656,032 | (352,214) |
Total increase (decrease) in net assets | 429,266 | 2,842,228 |
| | |
Net Assets | | |
Beginning of period | 14,390,448 | 11,548,220 |
End of period (including undistributed net investment income of $10,385 and accumulated net investment loss of $7,667, respectively) | $ 14,819,714 | $ 14,390,448 |
See accompanying notes which are an integral part of the financial statements.
Annual Report
Financial Highlights - Blue Chip Growth
Years ended July 31, | 2012 | 2011 | 2010 | 2009 | 2008 |
Selected Per-Share Data | | | | | |
Net asset value, beginning of period | $ 48.17 | $ 37.63 | $ 31.97 | $ 39.06 | $ 46.88 |
Income from Investment Operations | | | | | |
Net investment income (loss) B | .10 | (.03) | .04 | .27 | .35 |
Net realized and unrealized gain (loss) | .75 | 10.61 | 5.80 | (6.36) | (2.89) |
Total from investment operations | .85 | 10.58 | 5.84 | (6.09) | (2.54) |
Distributions from net investment income | (.04) | (.00) F, G | (.18) | (.29) | (.33) |
Distributions from net realized gain | (1.60) | (.04) F | - | (.71) | (4.95) |
Total distributions | (1.64) | (.04) | (.18) | (1.00) | (5.28) |
Net asset value, end of period | $ 47.38 | $ 48.17 | $ 37.63 | $ 31.97 | $ 39.06 |
Total Return A | 2.27% | 28.12% | 18.29% | (15.85)% | (6.30)% |
Ratios to Average Net Assets C, E | | | | | |
Expenses before reductions | .90% | .94% | .94% | .76% | .58% |
Expenses net of fee waivers, if any | .90% | .94% | .94% | .76% | .58% |
Expenses net of all reductions | .89% | .92% | .93% | .76% | .57% |
Net investment income (loss) | .21% | (.06)% | .10% | .93% | .81% |
Supplemental Data | | | | | |
Net assets, end of period (in millions) | $ 10,595 | $ 12,024 | $ 10,295 | $ 9,691 | $ 13,349 |
Portfolio turnover rate D | 95% | 132% | 135% | 134% | 82% |
A Total returns would have been lower if certain expenses had not been reduced during the applicable periods shown.
B Calculated based on average shares outstanding during the period.
C Fees and expenses of any underlying Fidelity Central Funds are not included in the Fund's expense ratio. The Fund indirectly bears its proportionate share of the expenses of any underlying Fidelity Central Funds.
D Amount does not include the portfolio activity of any underlying Fidelity Central Funds.
E Expense ratios reflect operating expenses of the class. Expenses before reductions do not reflect amounts reimbursed by the investment adviser or reductions from brokerage service arrangements or reductions from other expense offset arrangements and do not represent the amount paid by the class during periods when reimbursements or reductions occur. Expenses net of fee waivers reflect expenses after reimbursement by the investment adviser but prior to reductions from brokerage service arrangements or other expense offset arrangements. Expenses net of all reductions represent the net expenses paid by the class.
F The amount shown reflects certain reclassifications related to book to tax differences.
G Amount represents less than $.01 per share.
See accompanying notes which are an integral part of the financial statements.
Annual Report
Financial Highlights - Class K
Years ended July 31, | 2012 | 2011 | 2010 | 2009 | 2008 G |
Selected Per-Share Data | | | | | |
Net asset value, beginning of period | $ 48.21 | $ 37.66 | $ 32.01 | $ 39.07 | $ 41.81 |
Income from Investment Operations | | | | | |
Net investment income (loss) D | .17 | .05 | .11 | .32 | .10 |
Net realized and unrealized gain (loss) | .75 | 10.62 | 5.79 | (6.33) | (2.84) |
Total from investment operations | .92 | 10.67 | 5.90 | (6.01) | (2.74) |
Distributions from net investment income | (.08) | (.05) I | (.25) | (.34) | �� - |
Distributions from net realized gain | (1.60) | (.07) I | - | (.71) | - |
Total distributions | (1.67) J | (.12) | (.25) | (1.05) | - |
Net asset value, end of period | $ 47.46 | $ 48.21 | $ 37.66 | $ 32.01 | $ 39.07 |
Total Return B, C | 2.43% | 28.37% | 18.48% | (15.61)% | (6.55)% |
Ratios to Average Net Assets E, H | | | | | |
Expenses before reductions | .74% | .77% | .75% | .53% | .41% A |
Expenses net of fee waivers, if any | .74% | .77% | .75% | .53% | .41% A |
Expenses net of all reductions | .73% | .76% | .74% | .52% | .41% A |
Net investment income (loss) | .37% | .11% | .30% | 1.16% | 1.09% A |
Supplemental Data | | | | | |
Net assets, end of period (000 omitted) | $ 2,467,455 | $ 1,454,854 | $ 931,601 | $ 590,673 | $ 93 |
Portfolio turnover rate F | 95% | 132% | 135% | 134% | 82% |
A Annualized
B Total returns for periods of less than one year are not annualized.
C Total returns would have been lower if certain expenses had not been reduced during the applicable periods shown.
D Calculated based on average shares outstanding during the period.
E Fees and expenses of any underlying Fidelity Central Funds are not included in the Fund's expense ratio. The Fund indirectly bears its proportionate share of the expenses of any underlying Fidelity Central Funds.
F Amount does not include the portfolio activity of any underlying Fidelity Central Funds.
G For the period May 9, 2008 (commencement of sale of shares) to July 31, 2008.
H Expense ratios reflect operating expenses of the class. Expenses before reductions do not reflect amounts reimbursed by the investment adviser or reductions from brokerage service arrangements or reductions from other expense offset arrangements and do not represent the amount paid by the class during periods when reimbursements or reductions occur. Expense ratios before reductions for start-up periods may not be representative of longer-term operating periods. Expenses net of fee waivers reflect expenses after reimbursement by the investment adviser but prior to reductions from brokerage service arrangements or other expense offset arrangements. Expenses net of all reductions represent the net expenses paid by the class.
I The amount shown reflects certain reclassifications related to book to tax differences.
J Total distributions of $1.67 per share is comprised of distributions from net investment income of $.076 and distributions from net realized gain of $1.598 per share.
See accompanying notes which are an integral part of the financial statements.
Annual Report
Financial Highlights - Class F
Years ended July 31, | 2012 | 2011 | 2010 | 2009 G |
Selected Per-Share Data | | | | |
Net asset value, beginning of period | $ 48.24 | $ 37.69 | $ 31.98 | $ 29.16 |
Income from Investment Operations | | | | |
Net investment income (loss) D | .19 | .07 | .13 | - I |
Net realized and unrealized gain (loss) | .76 | 10.61 | 5.80 | 2.82 |
Total from investment operations | .95 | 10.68 | 5.93 | 2.82 |
Distributions from net investment income | (.08) | (.06) J | (.22) | - |
Distributions from net realized gain | (1.60) | (.08) J | - | - |
Total distributions | (1.68) | (.13) K | (.22) | - |
Net asset value, end of period | $ 47.51 | $ 48.24 | $ 37.69 | $ 31.98 |
Total Return B, C | 2.49% | 28.41% | 18.59% | 9.67% |
Ratios to Average Net Assets E, H | | | | |
Expenses before reductions | .69% | .72% | .70% | .51% A |
Expenses net of fee waivers, if any | .69% | .72% | .70% | .51% A |
Expenses net of all reductions | .68% | .71% | .68% | .51% A |
Net investment income (loss) | .42% | .16% | .35% | (.05)% A |
Supplemental Data | | | | |
Net assets, end of period (000 omitted) | $ 1,756,916 | $ 911,556 | $ 321,409 | $ 261 |
Portfolio turnover rate F | 95% | 132% | 135% | 134% |
A Annualized
B Total returns for periods of less than one year are not annualized.
C Total returns would have been lower if certain expenses had not been reduced during the applicable periods shown.
D Calculated based on average shares outstanding during the period.
E Fees and expenses of any underlying Fidelity Central Funds are not included in the Fund's expense ratio. The Fund indirectly bears its proportionate share of the expenses of any underlying Fidelity Central Funds.
F Amount does not include the portfolio activity of any underlying Fidelity Central Funds.
G For the period June 26, 2009 (commencement of sale of shares) to July 31, 2009.
H Expense ratios reflect operating expenses of the class. Expenses before reductions do not reflect amounts reimbursed by the investment adviser or reductions from brokerage service arrangements or reductions from other expense offset arrangements and do not represent the amount paid by the class during periods when reimbursements or reductions occur. Expense ratios before reductions for start-up periods may not be representative of longer-term operating periods. Expenses net of fee waivers reflect expenses after reimbursement by the investment adviser but prior to reductions from brokerage service arrangements or other expense offset arrangements. Expenses net of all reductions represent the net expenses paid by the class.
I Amount represents less than $.01 per share.
J The amount shown reflects certain reclassifications related to book to tax differences.
K Total distributions of $.13 per share is comprised of distributions from net investment income of $.058 and distributions from net realized gain of $.076 per share.
See accompanying notes which are an integral part of the financial statements.
Annual Report
Notes to Financial Statements
For the period ended July 31, 2012
(Amounts in thousands except percentages)
1. Organization.
Fidelity® Blue Chip Growth Fund (the Fund) is a fund of Fidelity Securities Fund (the Trust) and is authorized to issue an unlimited number of shares. The Trust is registered under the Investment Company Act of 1940, as amended (the 1940 Act), as an open-end management investment company organized as a Massachusetts business trust. The Fund offers Blue Chip Growth, Class K and Class F shares, each of which has equal rights as to assets and voting privileges. Each class has exclusive voting rights with respect to matters that affect that class. Class F shares of the Fund are only available for purchase by mutual funds for which Fidelity Management & Research Company (FMR) or an affiliate serves as investment manager. Investment income, realized and unrealized capital gains and losses, the common expenses of the Fund, and certain fund-level expense reductions, if any, are allocated on a pro-rata basis to each class based on the relative net assets of each class to the total net assets of the Fund. Each class differs with respect to transfer agent fees incurred. Certain expense reductions may also differ by class.
2. Investments in Fidelity Central Funds.
The Fund invests in Fidelity Central Funds, which are open-end investment companies available only to other investment companies and accounts managed by FMR and its affiliates. The Fund's Schedule of Investments lists each of the Fidelity Central Funds held as of period end, if any, as an investment of the Fund, but does not include the underlying holdings of each Fidelity Central Fund. As an Investing Fund, the Fund indirectly bears its proportionate share of the expenses of the underlying Fidelity Central Funds.
The Money Market Central Funds seek preservation of capital and current income and are managed by Fidelity Investments Money Management, Inc. (FIMM), an affiliate of FMR.
A complete unaudited list of holdings for each Fidelity Central Fund is available upon request or at the Securities and Exchange Commission (the SEC) web site at www.sec.gov. In addition, the financial statements of the Fidelity Central Funds, which are not covered by the Fund's Report of Independent Registered Public Accounting Firm, are available on the SEC web site or upon request.
3. Significant Accounting Policies.
The financial statements have been prepared in conformity with accounting principles generally accepted in the United States of America (GAAP), which require management to make certain estimates and assumptions at the date of the financial statements. Actual results could differ from those estimates. Subsequent events, if any, through the date that the financial statements were issued have been evaluated in the preparation of the financial statements. The following summarizes the significant accounting policies of the Fund:
Annual Report
3. Significant Accounting Policies - continued
Security Valuation. Investments are valued as of 4:00 p.m. Eastern time on the last calendar day of the period. In accordance with valuation policies and procedures approved by the Board of Trustees (the Board), the Fund attempts to obtain prices from one or more third party pricing vendor or broker to value its investments. When current market prices, quotations or rates are not readily available or reliable, securities will be fair valued in good faith by the FMR Fair Value Committee (the Committee), in accordance with procedures adopted by the Fund's Board. Factors used in determining fair value vary by security type and may include market or security specific events. The frequency with which these procedures are used cannot be predicted and they may be utilized to a significant extent. The Committee oversees the Fund's valuation policies and procedures and is responsible for approving and reporting to the Board all fair value determinations.
The Fund categorizes the inputs to valuation techniques used to value its investments into a disclosure hierarchy consisting of three levels as shown below:
Level 1 - quoted prices in active markets for identical investments
Level 2 - other significant observable inputs (including quoted prices for similar investments, interest rates, prepayment speeds, etc.)
Level 3 - unobservable inputs (including the Fund's own assumptions based on the best information available)
Valuation techniques used to value the Fund's investments by major category are as follows:
Equity securities, including restricted securities, for which market quotations are readily available, are valued at the last reported sale price or official closing price as reported by a third party pricing vendor on the primary market or exchange on which they are traded and are categorized as Level 1 in the hierarchy. In the event there were no sales during the day or closing prices are not available, securities are valued at the last quoted bid price or may be valued using the last available price and are generally categorized as Level 2 in the hierarchy. For foreign equity securities, when significant market or security specific events arise, comparisons to the valuation of American Depositary Receipts (ADRs), futures contracts, Exchange-Traded Funds (ETFs) and certain indexes as well as quoted prices for similar securities are used and are categorized as Level 2 in the hierarchy. Utilizing these techniques may result in transfers between Level 1 and Level 2. For restricted equity securities and private placements where observable inputs are limited, assumptions about market activity and risk are used and these securities are categorized as Level 3 in the hierarchy.
Annual Report
Notes to Financial Statements - continued
(Amounts in thousands except percentages)
3. Significant Accounting Policies - continued
Security Valuation - continued
Investments in open-end mutual funds, including the Fidelity Central Funds, are valued at their closing net asset value each business day and are categorized as Level 1 in the hierarchy.
Changes in valuation techniques may result in transfers in or out of an assigned level within the disclosure hierarchy. The aggregate value of investments by input level, as of July 31, 2012, is included at the end of the Fund's Schedule of Investments.
Foreign Currency Translation. The Fund may use foreign currency contracts to facilitate transactions in foreign-denominated securities. Gains and losses from these transactions may arise from changes in the value of the foreign currency or if the counterparties do not perform under the contracts' terms.
Foreign-denominated assets, including investment securities, and liabilities are translated into U.S. dollars at the exchange rates at period end. Purchases and sales of investment securities, income and dividends received and expenses denominated in foreign currencies are translated into U.S. dollars at the exchange rate in effect on the transaction date.
The effects of exchange rate fluctuations on investments are included with the net realized and unrealized gain (loss) on investment securities. Other foreign currency transactions resulting in realized and unrealized gain (loss) are disclosed separately.
Investment Transactions and Income. For financial reporting purposes, the Fund's investment holdings and NAV include trades executed through the end of the last business day of the period. The NAV per share for processing shareholder transactions is calculated as of the close of business of the New York Stock Exchange (NYSE), normally 4:00 p.m. Eastern time and includes trades executed through the end of the prior business day. Gains and losses on securities sold are determined on the basis of identified cost and may include proceeds received from litigation. Dividend income is recorded on the ex-dividend date, except for certain dividends from foreign securities where the ex-dividend date may have passed, which are recorded as soon as the Fund is informed of the ex-dividend date. Non-cash dividends included in dividend income, if any, are recorded at the fair market value of the securities received. Distributions received on securities that represent a return of capital or capital gain are recorded as a reduction of cost of investments and/or as a realized gain. The Fund estimates the components of distributions received that may be considered return of capital distributions or capital gain distributions. Interest income and distributions from the Fidelity Central Funds are accrued as earned. Interest income includes coupon interest and amortization of premium and accretion of discount on debt securities. Investment income is recorded net of foreign taxes withheld where recovery of such taxes is uncertain.
Annual Report
3. Significant Accounting Policies - continued
Expenses. Expenses directly attributable to a fund are charged to that fund. Expenses attributable to more than one fund are allocated among the respective funds on the basis of relative net assets or other appropriate methods. Expense estimates are accrued in the period to which they relate and adjustments are made when actual amounts are known.
Deferred Trustee Compensation. Under a Deferred Compensation Plan (the Plan), independent Trustees may elect to defer receipt of a portion of their annual compensation. Deferred amounts are invested in a cross-section of Fidelity funds, are marked-to-market and remain in the Fund until distributed in accordance with the Plan. The investment of deferred amounts and the offsetting payable to the Trustees are included in the accompanying Statement of Assets and Liabilities.
Income Tax Information and Distributions to Shareholders. Each year, the Fund intends to qualify as a regulated investment company under Subchapter M of the Internal Revenue Code, including distributing substantially all of its taxable income and realized gains. As a result, no provision for income taxes is required. As of July 31, 2012, the Fund did not have any unrecognized tax benefits in the financial statements; nor is the Fund aware of any tax positions for which it is reasonably possible that the total amounts of unrecognized tax benefits will significantly change in the next twelve months. The Fund files a U.S. federal tax return, in addition to state and local tax returns as required. A fund's federal income tax returns are subject to examination by the Internal Revenue Service (IRS) for a period of three fiscal years after they are filed. State and local tax returns may be subject to examination for an additional fiscal year depending on the jurisdiction. Foreign taxes are provided for based on the Fund's understanding of the tax rules and rates that exist in the foreign markets in which it invests.
Distributions are declared and recorded on the ex-dividend date. Income dividends and capital gain distributions are declared separately for each class. Income and capital gain distributions are determined in accordance with income tax regulations, which may differ from GAAP. These differences resulted in distribution reclassifications. In addition, the Fund claimed a portion of the payment made to redeeming shareholders as a distribution for income tax purposes.
Capital accounts within the financial statements are adjusted for permanent book-tax differences. These adjustments have no impact on net assets or the results of operations. Temporary book-tax differences will reverse in a subsequent period.
Book-tax differences are primarily due to foreign currency transactions, passive foreign investment companies (PFIC), partnerships, deferred trustee compensation, capital loss carryforwards and losses deferred due to wash sales and excise tax regulations.
Annual Report
Notes to Financial Statements - continued
(Amounts in thousands except percentages)
3. Significant Accounting Policies - continued
Income Tax Information and Distributions to Shareholders - continued
The federal tax cost of investment securities and unrealized appreciation (depreciation) as of period end were as follows:
Gross unrealized appreciation | $ 4,132,802 |
Gross unrealized depreciation | (484,426) |
Net unrealized appreciation (depreciation) on securities and other investments | $ 3,648,376 |
| |
Tax Cost | $ 11,339,852 |
The tax-based components of distributable earnings as of period end were as follows:
Undistributed ordinary income | $ 10,887 |
Capital loss carryforward | $ (7,155) |
Net unrealized appreciation (depreciation) | $ 3,648,348 |
Capital loss carryforwards are only available to offset future capital gains of the Fund to the extent provided by regulations and may be limited. Under the Regulated Investment Company Modernization Act of 2010 (the Act), the Fund is permitted to carry forward capital losses incurred in taxable years beginning after December 22, 2010 for an unlimited period and such capital losses are required to be used prior to any losses that expire. Capital loss carryforwards were as follows:
Fiscal year of expiration | |
No expiration | |
Short-term | $ (7,155) |
The tax character of distributions paid was as follows:
| July 31, 2012 | July 31, 2011 |
Ordinary Income | $ 15,666 | $ 2,405 |
Long-term Capital Gains | 480,841 | 12,451 |
Total | $ 496,507 | $ 14,856 |
New Accounting Pronouncement. In December 2011, the Financial Accounting Standards Board issued Accounting Standard Update No. 2011-11, Disclosures about Offsetting Assets and Liabilities. The update creates new disclosure requirements requiring entities to disclose both gross and net information for derivatives and other financial instruments that are either offset in the Statement of Assets and Liabilities or
Annual Report
3. Significant Accounting Policies - continued
New Accounting Pronouncement - continued
subject to an enforceable master netting arrangement or similar agreement. The disclosure requirements are effective for interim and annual reporting periods beginning on or after January 1, 2013. Management is currently evaluating the impact of the update's adoption on the Fund's financial statement disclosures.
4. Operating Policies.
Restricted Securities. The Fund may invest in securities that are subject to legal or contractual restrictions on resale. These securities generally may be resold in transactions exempt from registration or to the public if the securities are registered. Disposal of these securities may involve time-consuming negotiations and expense, and prompt sale at an acceptable price may be difficult. Information regarding restricted securities is included at the end of the Fund's Schedule of Investments.
5. Purchases and Sales of Investments.
Purchases and sales of securities, other than short-term securities, aggregated $13,550,160 and $13,321,571, respectively.
6. Fees and Other Transactions with Affiliates.
Management Fee. FMR and its affiliates provide the Fund with investment management related services for which the Fund pays a monthly management fee. The management fee is the sum of an individual fund fee rate that is based on an annual rate of .30% of the Fund's average net assets and an annualized group fee rate that averaged .26% during the period. The group fee rate is based upon the average net assets of all the mutual funds advised by FMR. The group fee rate decreases as assets under management increase and increases as assets under management decrease. In addition, the management fee is subject to a performance adjustment (up to a maximum of ± .20% of the Fund's average net assets over a 36 month performance period). The upward or downward adjustment to the management fee is based on the relative investment performance of Blue Chip Growth as compared to an appropriate benchmark index. For the period, the total annual management fee rate, including the performance adjustment, was .67% of the Fund's average net assets.
Annual Report
Notes to Financial Statements - continued
(Amounts in thousands except percentages)
6. Fees and Other Transactions with Affiliates - continued
Transfer Agent Fees. Fidelity Investments Institutional Operations Company, Inc. (FIIOC), an affiliate of FMR, is the transfer, dividend disbursing and shareholder servicing agent for each class of the Fund. FIIOC receives account fees and asset-based fees that vary according to the account size and type of account of the shareholders of Blue Chip Growth FIIOC receives an asset-based fee of Class K's average net assets. FIIOC receives no fees for providing transfer agency services to Class F. FIIOC pays for typesetting, printing and mailing of shareholder reports, except proxy statements. For the period, transfer agent fees for each class were as follows:
| Amount | % of
Average
Net Assets |
Blue Chip Growth | $ 22,565 | .21 |
Class K | 968 | .05 |
| $ 23,533 | |
Accounting and Security Lending Fees. Fidelity Service Company, Inc. (FSC), an affiliate of FMR, maintains the Fund's accounting records. The accounting fee is based on the level of average net assets for each month. Under a separate contract, FSC administers the security lending program. The security lending fee is based on the number and duration of lending transactions.
Brokerage Commissions. The Fund placed a portion of its portfolio transactions with brokerage firms which are affiliates of the investment adviser. The commissions paid to these affiliated firms were $353 for the period.
Interfund Lending Program. Pursuant to an Exemptive Order issued by the SEC, the Fund, along with other registered investment companies having management contracts with FMR, may participate in an interfund lending program. This program provides an alternative credit facility allowing the funds to borrow from, or lend money to, other participating affiliated funds. The Fund's activity in this program during the period for which loans were outstanding was as follows:
Borrower or Lender | Average Loan
Balance | Weighted Average Interest Rate | Interest
Expense |
Borrower | $ 14,697 | .35% | $ 6 |
7. Committed Line of Credit.
The Fund participates with other funds managed by FMR or an affiliate in a $4.25 billion credit facility (the "line of credit") to be utilized for temporary or emergency purposes to fund shareholder redemptions or for other short-term liquidity purposes. The Fund has agreed to pay commitment fees on its pro-rata portion of the line of credit, which amounted to $39 and is reflected in Miscellaneous expenses on the Statement of Operations. During the period, there were no borrowings on this line of credit.
Annual Report
8. Security Lending.
The Fund lends portfolio securities through a lending agent from time to time in order to earn additional income. For equity securities, a lending agent is used and may loan securities to certain qualified borrowers, including Fidelity Capital Markets (FCM), a broker-dealer affiliated with the Fund. On the settlement date of the loan, the Fund receives collateral (in the form of U.S. Treasury obligations, letters of credit and/or cash) against the loaned securities and maintains collateral in an amount not less than 100% of the market value of the loaned securities during the period of the loan. The market value of the loaned securities is determined at the close of business of the Fund and any additional required collateral is delivered to the Fund on the next business day. If the borrower defaults on its obligation to return the securities loaned because of insolvency or other reasons, a fund could experience delays and costs in recovering the securities loaned or in gaining access to the collateral. Any cash collateral received is invested in the Fidelity Securities Lending Cash Central Fund. The value of loaned securities and cash collateral at period end are disclosed on the Fund's Statement of Assets and Liabilities. The value of securities loaned to FCM at period end was $3,016. Security lending income represents the income earned on investing cash collateral, less rebates paid to borrowers and any lending agent fees associated with the loan, plus any premium payments received for lending certain types of securities. Security lending income is presented in the Statement of Operations as a component of income from Fidelity Central Funds. Total security lending income during the period amounted to $3,357, including $95 from securities loaned to FCM.
9. Expense Reductions.
Many of the brokers with whom FMR places trades on behalf of the Fund provided services to the Fund in addition to trade execution. These services included payments of certain expenses on behalf of the Fund totaling $618 for the period.
10. Distributions to Shareholders.
Distributions to shareholders of each class were as follows:
Years ended July 31, | 2012 | 2011 |
From net investment income | | |
Blue Chip Growth | $ 10,644 | $ 670 |
Class K | 2,860 | 1,165 |
Class F | 2,162 | 570 |
Total | $ 15,666 | $ 2,405 |
From net realized gain | | |
Blue Chip Growth | $ 397,250 | $ 9,690 |
Class K | 51,295 | 1,750 |
Class F | 32,296 | 1,011 |
Total | $ 480,841 | $ 12,451 |
Annual Report
Notes to Financial Statements - continued
(Amounts in thousands except percentages)
11. Share Transactions.
Transactions for each class of shares were as follows:
| Shares | Dollars |
Years ended July 31, | 2012 | 2011 | 2012 | 2011 |
Blue Chip Growth | | | | |
Shares sold | 42,825 | 42,281 | $ 1,970,082 | $ 1,904,203 |
Reinvestment of distributions | 9,668 | 232 | 399,689 | 10,166 |
Shares redeemed | (78,498) | (66,514) | (3,530,347) | (2,974,498) |
Net increase (decrease) | (26,005) | (24,001) | $ (1,160,576) | $ (1,060,129) |
Class K | | | | |
Shares sold | 29,866 | 13,902 | $ 1,366,770 | $ 625,856 |
Reinvestment of distributions | 1,309 | 70 | 54,155 | 2,916 |
Shares redeemed | (9,363) | (8,528) | (426,597) | (379,087) |
Net increase (decrease) | 21,812 | 5,444 | $ 994,328 | $ 249,685 |
Class F | | | | |
Shares sold | 19,170 | 12,501 | $ 873,960 | $ 558,704 |
Reinvestment of distributions | 832 | 38 | 34,458 | 1,580 |
Shares redeemed | (1,918) | (2,171) | (86,138) | (102,054) |
Net increase (decrease) | 18,084 | 10,368 | $ 822,280 | $ 458,230 |
12. Other.
The Fund's organizational documents provide former and current trustees and officers with a limited indemnification against liabilities arising in connection with the performance of their duties to the Fund. In the normal course of business, the Fund may also enter into contracts that provide general indemnifications. The Fund's maximum exposure under these arrangements is unknown as this would be dependent on future claims that may be made against the Fund. The risk of material loss from such claims is considered remote.
At the end of the period, the Fidelity Adviser Freedom Funds, the Fidelity Freedom Funds and the Fidelity Freedom K Funds were the owners of record in the aggregate of approximately 25% of the total outstanding shares of the Fund.
Annual Report
To the Trustees of Fidelity Securities Fund and Shareholders of Fidelity Blue Chip Growth Fund:
We have audited the accompanying statement of assets and liabilities of Fidelity Blue Chip Growth Fund (the Fund), a fund of Fidelity Securities Fund, including the schedule of investments, as of July 31, 2012, and the related statement of operations for the year then ended, the statement of changes in net assets for each of the two years in the period then ended, and the financial highlights for each of the five years in the period then ended. These financial statements and financial highlights are the responsibility of the Fund's management. Our responsibility is to express an opinion on these financial statements and financial highlights based on our audits.
We conducted our audits in accordance with the standards of the Public Company Accounting Oversight Board (United States). Those standards require that we plan and perform the audit to obtain reasonable assurance about whether the financial statements and financial highlights are free of material misstatement. The Fund is not required to have, nor were we engaged to perform, an audit of its internal control over financial reporting. Our audits included consideration of internal control over financial reporting as a basis for designing audit procedures that are appropriate in the circumstances, but not for the purpose of expressing an opinion on the effectiveness of the Fund's internal control over financial reporting. Accordingly, we express no such opinion. An audit also includes examining, on a test basis, evidence supporting the amounts and disclosures in the financial statements, assessing the accounting principles used and significant estimates made by management, as well as evaluating the overall financial statement presentation. Our procedures included confirmation of securities owned as of July 31, 2012, by correspondence with the custodians and brokers; where replies were not received from brokers, we performed other auditing procedures. We believe that our audits provide a reasonable basis for our opinion.
In our opinion, the financial statements and financial highlights referred to above present fairly, in all material respects, the financial position of Fidelity Blue Chip Growth Fund as of July 31, 2012, the results of its operations for the year then ended, the changes in its net assets for each of the two years in the period then ended, and the financial highlights for each of the five years in the period then ended, in conformity with accounting principles generally accepted in the United States of America.
DELOITTE & TOUCHE LLP
Boston, Massachusetts
September 12, 2012
Annual Report
The Trustees, Members of the Advisory Board, and executive officers of the trust and fund, as applicable, are listed below. The Board of Trustees governs the fund and is responsible for protecting the interests of shareholders. The Trustees are experienced executives who meet periodically throughout the year to oversee the fund's activities, review contractual arrangements with companies that provide services to the fund, oversee management of the risks associated with such activities and contractual arrangements, and review the fund's performance. Except for James C. Curvey, each of the Trustees oversees 228 funds advised by FMR or an affiliate. Mr. Curvey oversees 435 funds advised by FMR or an affiliate.
The Trustees hold office without limit in time except that (a) any Trustee may resign; (b) any Trustee may be removed by written instrument, signed by at least two-thirds of the number of Trustees prior to such removal; (c) any Trustee who requests to be retired or who has become incapacitated by illness or injury may be retired by written instrument signed by a majority of the other Trustees; and (d) any Trustee may be removed at any special meeting of shareholders by a two-thirds vote of the outstanding voting securities of the trust. Each Trustee who is not an interested person (as defined in the 1940 Act) (Independent Trustee), shall retire not later than the last day of the calendar year in which his or her 75th birthday occurs. The Independent Trustees may waive this mandatory retirement age policy with respect to individual Trustees. The executive officers and Advisory Board Members hold office without limit in time, except that any officer and Advisory Board Member may resign or may be removed by a vote of a majority of the Trustees at any regular meeting or any special meeting of the Trustees. Except as indicated, each individual has held the office shown or other offices in the same company for the past five years.
Experience, Skills, Attributes, and Qualifications of the Fund's Trustees. The Governance and Nominating Committee has adopted a statement of policy that describes the experience, qualifications, attributes, and skills that are necessary and desirable for potential Independent Trustee candidates (Statement of Policy). The Board believes that each Trustee satisfied at the time he or she was initially elected or appointed a Trustee, and continues to satisfy, the standards contemplated by the Statement of Policy. The Governance and Nominating Committee also engages professional search firms to help identify potential Independent Trustee candidates who have the experience, qualifications, attributes, and skills consistent with the Statement of Policy. From time to time, additional criteria based on the composition and skills of the current Independent Trustees, as well as experience or skills that may be appropriate in light of future changes to board composition, business conditions, and regulatory or other developments, have also been considered by the professional search firms and the Governance and Nominating Committee. In addition, the Board takes into account the Trustees' commitment and participation in Board and committee meetings, as well as their leadership of standing and ad hoc committees throughout their tenure.
In determining that a particular Trustee was and continues to be qualified to serve as a Trustee, the Board has considered a variety of criteria, none of which, in isolation, was controlling. The Board believes that, collectively, the Trustees have balanced and diverse experience, qualifications, attributes, and skills, which allow the Board to operate effectively in governing the fund and protecting the interests of shareholders. Information about the specific experience, skills, attributes, and qualifications of each Trustee, which in each case led to the Board's conclusion that the Trustee should serve (or continue to serve) as a trustee of the fund, is provided below.
Annual Report
Trustees and Officers - continued
Board Structure and Oversight Function. James C. Curvey is an interested person (as defined in the 1940 Act) and currently serves as Chairman. The Trustees have determined that an interested Chairman is appropriate and benefits shareholders because an interested Chairman has a personal and professional stake in the quality and continuity of services provided to the fund. Independent Trustees exercise their informed business judgment to appoint an individual of their choosing to serve as Chairman, regardless of whether the Trustee happens to be independent or a member of management. The Independent Trustees have determined that they can act independently and effectively without having an Independent Trustee serve as Chairman and that a key structural component for assuring that they are in a position to do so is for the Independent Trustees to constitute a substantial majority for the Board. The Independent Trustees also regularly meet in executive session. Ned C. Lautenbach serves as Chairman of the Independent Trustees and as such (i) acts as a liaison between the Independent Trustees and management with respect to matters important to the Independent Trustees and (ii) with management prepares agendas for Board meetings.
Fidelity funds are overseen by different Boards of Trustees. The fund's Board oversees Fidelity's equity and high income funds and another Board oversees Fidelity's investment-grade bond, money market, and asset allocation funds. The asset allocation funds may invest in Fidelity funds overseen by the fund's Board. The use of separate Boards, each with its own committee structure, allows the Trustees of each group of Fidelity funds to focus on the unique issues of the funds they oversee, including common research, investment, and operational issues. On occasion, the separate Boards establish joint committees to address issues of overlapping consequences for the Fidelity funds overseen by each Board.
The Trustees operate using a system of committees to facilitate the timely and efficient consideration of all matters of importance to the Trustees, the fund, and fund shareholders and to facilitate compliance with legal and regulatory requirements and oversight of the fund's activities and associated risks. The Board, acting through its committees, has charged FMR and its affiliates with (i) identifying events or circumstances the occurrence of which could have demonstrably adverse effects on the fund's business and/or reputation; (ii) implementing processes and controls to lessen the possibility that such events or circumstances occur or to mitigate the effects of such events or circumstances if they do occur; and (iii) creating and maintaining a system designed to evaluate continuously business and market conditions in order to facilitate the identification and implementation processes described in (i) and (ii) above. Because the day-to-day operations and activities of the fund are carried out by or through FMR, its affiliates and other service providers, the fund's exposure to risks is mitigated but not eliminated by the processes overseen by the Trustees. While each of the Board's committees has responsibility for overseeing different aspects of the fund's activities, oversight is exercised primarily through the Operations, Audit, and Compliance Committees. In addition, the Independent Trustees have worked with FMR to enhance the Board's oversight of investment and financial risks, legal and regulatory risks, technology risks, and operational risks, including the development of additional risk reporting to the Board. For example, a working group comprised of Independent Trustees and FMR has worked and continues to work to review the Fidelity funds' valuation-related activities, reporting and risk management. Appropriate personnel, including but not limited to the fund's Chief Compliance Officer (CCO), FMR's internal auditor, the independent accountants, the fund's Treasurer and portfolio management personnel, make periodic reports to the Board's committees, as appropriate, including an annual review of FMR's risk management program for the Fidelity funds. The responsibilities of each standing committee, including their oversight responsibilities, are described further under "Standing Committees of the Fund's Trustees."
Annual Report
The fund's Statement of Additional Information (SAI) includes more information about the Trustees. To request a free copy, call Fidelity at 1-800-544-8544.
Interested Trustees*:
Correspondence intended for each Trustee who is an interested person may be sent to Fidelity Investments, 82 Devonshire Street, Boston, Massachusetts 02109.
Name, Age; Principal Occupations and Other Relevant Experience+ |
James C. Curvey (77) |
| Year of Election or Appointment: 2007 Mr. Curvey is Trustee and Chairman of the Board of Trustees of certain Trusts. Mr. Curvey also serves as Trustee (2007-present) of other investment companies advised by FMR. Mr. Curvey is a Director of Fidelity Investments Money Management, Inc. (2009-present), Director of Fidelity Research & Analysis Co. (2009-present) and Director of FMR and FMR Co., Inc. (2007-present). Mr. Curvey is also Vice Chairman (2007-present) and Director of FMR LLC. In addition, Mr. Curvey serves as an Overseer for the Boston Symphony Orchestra and a member of the Trustees of Villanova University. Previously, Mr. Curvey was the Vice Chairman (2006-2007) and Director (2000-2007) of FMR Corp. |
Ronald P. O'Hanley (55) |
| Year of Election or Appointment: 2011 Mr. O'Hanley is Director of FMR Co., Inc. (2010-present), Director of Fidelity Investments Money Management, Inc. (2010-present), Director of Fidelity Research & Analysis Company (2010-present), President of Fidelity Asset Management and Corporate Services and a member of Fidelity's Executive Committee (2010-present). Previously, Mr. O'Hanley served as President and Chief Executive Officer of BNY Mellon Asset Management (2007-2010). Mr. O'Hanley also served as Vice Chairman of Bank New York Mellon Corp. and a member of that firm's Executive Committee. Prior to the 2007 merger of The Bank of New York and Mellon Financial Corporation, he was Vice Chairman of Mellon Financial Corporation and President and Chief Executive Officer of Mellon Asset Management. He joined Mellon in February 1997. Mr. O'Hanley currently serves as Chairman of the Boston Public Library Foundation Board of Directors and sits on the Board of Directors of Beth Israel Deaconess Medical Center, the Board of Trustees of the Marine Biological Laboratory and the Advisory Board of the Maxwell School of Citizenship and Public Administration at Syracuse University. Mr. O'Hanley also chairs the Council on Asset Management for the Financial Services Roundtable and is a member of the Board of Directors of Institutional Investor's U.S. Institute. |
* Trustees have been determined to be "Interested Trustees" by virtue of, among other things, their affiliation with the trust or various entities under common control with FMR.
+ The information above includes each Trustee's principal occupation during the last five years and other information relating to the experience, attributes, and skills relevant to each Trustee's qualifications to serve as a Trustee, which led to the conclusion that each Trustee should serve as a Trustee for the fund.
Annual Report
Independent Trustees:
Correspondence intended for each Independent Trustee (that is, the Trustees other than the Interested Trustees) may be sent to Fidelity Investments, P.O. Box 55235, Boston, Massachusetts 02205-5235.
Name, Age; Principal Occupations and Other Relevant Experience+ |
Dennis J. Dirks (64) |
| Year of Election or Appointment: 2005 Prior to his retirement in May 2003, Mr. Dirks was Chief Operating Officer and a member of the Board of The Depository Trust & Clearing Corporation (DTCC). He also served as President, Chief Operating Officer, and Board member of The Depository Trust Company (DTC) and President and Board member of the National Securities Clearing Corporation (NSCC). In addition, Mr. Dirks served as Chief Executive Officer and Board member of the Government Securities Clearing Corporation, Chief Executive Officer and Board member of the Mortgage-Backed Securities Clearing Corporation, as a Trustee and a member of the Finance Committee of Manhattan College (2005-2008), and as a Trustee and a member of the Finance Committee of AHRC of Nassau County (2006-2008). Mr. Dirks is a member of the Independent Directors Council (IDC) Governing Council (2010-present) and Board of Directors for The Brookville Center for Children's Services, Inc. (2009-present). |
Alan J. Lacy (58) |
| Year of Election or Appointment: 2008 Mr. Lacy serves as Senior Adviser (2007-present) of Oak Hill Capital Partners, L.P. (private equity). Mr. Lacy also served as Chief Executive Officer (2000-2005) and Vice Chairman (2005-2006) of Sears Holdings Corporation and Sears, Roebuck and Co. (retail). In addition, Mr. Lacy serves as a member of the Board of Directors of Dave & Buster's Entertainment, Inc. (restaurant and entertainment complexes, 2010-present), Earth Fare, Inc. (retail grocery, 2012-present), The Hillman Companies, Inc. (hardware wholesalers, 2010-present), and Bristol-Myers Squibb Company (global pharmaceuticals, 2007-present). Mr. Lacy is a member of the Board of Trustees of The National Parks Conservation Association (2006-present). Previously, Mr. Lacy served as Chairman of the Board of Trustees of the National Parks Conservation Association (2008-2011) and as a member of the Board of Directors for the Western Union Company (global money transfer, 2006-2011). |
Ned C. Lautenbach (68) |
| Year of Election or Appointment: 2000 Mr. Lautenbach is Chairman of the Independent Trustees of the Equity and High Income Funds (2006-present). Mr. Lautenbach currently serves as the Lead Director of the Eaton Corporation Board of Directors (diversified industrial, 1997-present). Mr. Lautenbach is Chairman of the Board of Directors of the Philharmonic Center for the Arts in Naples, Florida (2012-present) and a member of the Council on Foreign Relations (1994-present). Previously, Mr. Lautenbach was a Partner/Advisory Partner at Clayton, Dubilier & Rice, LLC (private equity investment, 1998-2010), as well as a Director of Sony Corporation (2006-2007). |
Joseph Mauriello (67) |
| Year of Election or Appointment: 2008 Prior to his retirement in January 2006, Mr. Mauriello served in numerous senior management positions including Deputy Chairman and Chief Operating Officer (2004-2005), and Vice Chairman of Financial Services (2002-2004) of KPMG LLP US (professional services, 1965-2005). Mr. Mauriello currently serves as a member of the Board of Directors of XL Group plc. (global insurance and re-insurance, 2006-present). Previously, Mr. Mauriello served as a Director of the Hamilton Funds of the Bank of New York (2006-2007) and of Arcadia Resources Inc. (health care services and products, 2007-2012). |
Robert W. Selander (61) |
| Year of Election or Appointment: 2011 Previously, Mr. Selander served as a Member of the Advisory Board of Fidelity's Equity and High Income Funds (2011), Executive Vice Chairman (2010), Chief Executive Officer (2009-2010), and President and Chief Executive Officer (1997-2009) of Mastercard, Inc. |
Cornelia M. Small (68) |
| Year of Election or Appointment: 2005 Ms. Small is a member of the Board of Directors of the Teagle Foundation (2009-present). Ms. Small is also a member of the Investment Committee, and Chair (2008-present) and a member of the Board of Trustees of Smith College. In addition, Ms. Small serves on the Investment Committee of the Berkshire Taconic Community Foundation (2008-present). Previously, Ms. Small served as Chairperson of the Investment Committee (2002-2008) of Smith College. In addition, Ms. Small served as Chief Investment Officer, Director of Global Equity Investments, and a member of the Board of Directors of Scudder, Stevens & Clark and Scudder Kemper Investments. |
William S. Stavropoulos (73) |
| Year of Election or Appointment: 2002 Mr. Stavropoulos is Vice Chairman of the Independent Trustees of the Equity and High Income Funds (2006-present). Mr. Stavropoulos serves as President and Founder of the Michigan Baseball Foundation, the Great Lakes Loons (2007-present). Mr. Stavropoulos is Chairman Emeritus of the Board of Directors of The Dow Chemical Company, where he previously served in numerous senior management positions, including President, CEO (1995-2000; 2002-2004), Chairman of the Executive Committee (2000-2006), and as a member of the Board of Directors (1990-2006). Currently, Mr. Stavropoulos is Chairman of Univar (global distributor of commodity and specialty chemicals, 2010-present), a Director of Teradata Corporation (data warehousing and technology solutions, 2008-present), Chemical Financial Corporation, Maersk Inc. (industrial conglomerate), Tyco International, Inc. (multinational manufacturing and services, 2007-present), and a member of the Advisory Board for Metalmark Capital (private equity investment, 2005-present). Mr. Stavropoulos is a special advisor to Clayton, Dubilier & Rice, LLC (private equity investment). In addition, Mr. Stavropoulos is a member of the University of Notre Dame Advisory Council for the College of Science. |
David M. Thomas (63) |
| Year of Election or Appointment: 2008 Previously, Mr. Thomas served as Executive Chairman (2005-2006) and Chairman and Chief Executive Officer (2000-2005) of IMS Health, Inc. (pharmaceutical and healthcare information solutions). In addition, Mr. Thomas serves as a member of the Board of Directors of Fortune Brands, Inc. (consumer products), and Interpublic Group of Companies, Inc. (marketing communication, 2004-present). |
Michael E. Wiley (61) |
| Year of Election or Appointment: 2008 Mr. Wiley also serves as a Director of Asia Pacific Exploration Consolidated (international oil and gas exploration and production, 2008-present). Mr. Wiley serves as a Director of Tesoro Corporation (independent oil refiner and marketer, 2005-present), and a Director of Bill Barrett Corporation (exploration and production, 2005-present). In addition, Mr. Wiley also serves as a Director of Post Oak Bank (privately-held bank, 2004-present). Previously, Mr. Wiley served as a member of the Board of Trustees of the University of Tulsa (2000-2006; 2007-2010), as a Senior Energy Advisor of Katzenbach Partners, LLC (consulting, 2006-2007), as an Advisory Director of Riverstone Holdings (private investment), Chairman, President, and CEO of Baker Hughes, Inc. (oilfield services, 2000-2004), and as Director of Spinnaker Exploration Company (exploration and production, 2001-2005). |
Annual Report
Trustees and Officers - continued
+ The information above includes each Trustee's principal occupation during the last five years and other information relating to the experience, attributes, and skills relevant to each Trustee's qualifications to serve as a Trustee, which led to the conclusion that each Trustee should serve as a Trustee for the fund.
Advisory Board Members and Executive Officers:
Correspondence intended for David A. Rosow and Garnett A. Smith may be sent to Fidelity Investments, P.O. Box 55235, Boston, Massachusetts 02205-5235. Correspondence intended for each executive officer, Edward C. Johnson 3d, and Peter S. Lynch may be sent to Fidelity Investments, 82 Devonshire Street, Boston, Massachusetts 02109.
Name, Age; Principal Occupation |
Edward C. Johnson 3d (82) |
| Year of Election or Appointment: 2011 Member of the Advisory Board of Fidelity's Equity and High Income Funds. Mr. Johnson serves as Chief Executive Officer, Chairman, and a Director of FMR LLC, and also serves as Chairman and Director of FIL Limited. Previously, Mr. Johnson served as a Trustee and Chairman of the Board of certain Fidelity Trusts, Chairman and a Director of FMR, Chairman and a Director of FMR Co., Inc., and President of FMR LLC (2006-2007). |
Peter S. Lynch (68) |
| Year of Election or Appointment: 2003 Member of the Advisory Board of Fidelity's Equity and High Income Funds. Mr. Lynch is Vice Chairman and a Director of FMR and FMR Co., Inc. In addition, Mr. Lynch serves as a Trustee of Boston College and as the Chairman of the Inner-City Scholarship Fund. Previously, Mr. Lynch served on the Special Olympics International Board of Directors (1997-2006). |
David A. Rosow (69) |
| Year of Election or Appointment: 2012 Member of the Advisory Board of Fidelity's Equity and High Income Funds. Chairman and Chief Executive Officer of International Golf Group, Inc. (golf course development, 1990-present). Previously, Mr. Rosow served as Chairman and Chief Executive Officer of Rosow & Company, Inc. (private investment company, 1989-2011), a Lead Director of Hudson United Bancorp (2001-2006) and as a Director of TD Banknorth (1996-2006). In addition, Mr. Rosow is a member (2008-present) and President (2009-present) of the Town Council of Palm Beach, Florida. |
Garnett A. Smith (64) |
| Year of Election or Appointment: 2012 Member of the Advisory Board of Fidelity's Equity and High Income Funds. Prior to Mr. Smith's retirement, he served as Chairman and Chief Executive Officer of Inbrand Corp. (manufacturer of personal absorbent products, 1990-1997). He also served as President (1986-1990) of Inbrand Corp. Prior to his employment with Inbrand Corp., he was employed by a retail fabric chain and North Carolina National Bank. In addition, Mr. Smith is a board member of the Jackson Hole Land Trust (2009-present). |
Kenneth B. Robins (42) |
| Year of Election or Appointment: 2008 President and Treasurer of Fidelity's Equity and High Income Funds. Mr. Robins also serves as President and Treasurer (2010-present) and Assistant Treasurer (2009-present) of other Fidelity funds and is an employee of Fidelity Investments (2004-present). Previously, Mr. Robins served as Deputy Treasurer of the Fidelity funds (2005-2008) and Treasurer and Chief Financial Officer of The North Carolina Capital Management Trust: Cash and Term Portfolios (2006-2008). |
Bruce T. Herring (46) |
| Year of Election or Appointment: 2006 Vice President of certain Equity Funds. Mr. Herring also serves as President of Fidelity Research & Analysis Company (2010-present), Chief Investment Officer and Director of Fidelity Management & Research (U.K.) Inc. (2010-present) and Group Chief Investment Officer of FMR. Previously, Mr. Herring served as Vice President (2005-2006) and Senior Vice President (2006-2007) of Fidelity Management & Research Company, Vice President of FMR Co., Inc. (2001-2007) and as a portfolio manager for Fidelity U.S. Equity Funds. |
Brian B. Hogan (47) |
| Year of Election or Appointment: 2009 Vice President of Equity and High Income Funds. Mr. Hogan also serves as President of FMR's Equity Division (2009-present). Previously, Mr. Hogan served as Senior Vice President, Equity Research of FMR (2006-2009) and as a portfolio manager. |
Scott C. Goebel (44) |
| Year of Election or Appointment: 2008 Secretary and Chief Legal Officer (CLO) of the Fidelity funds. Mr. Goebel also serves as Secretary of Fidelity Investments Money Management, Inc. (FIMM) (2010-present) and Fidelity Research and Analysis Company (FRAC) (2010-present); Secretary and CLO of The North Carolina Capital Management Trust: Cash and Term Portfolios (2008-present); General Counsel, Secretary, and Senior Vice President of FMR (2008-present) and FMR Co., Inc. (2008-present); employed by FMR LLC or an affiliate (2001-present); Chief Legal Officer of Fidelity Management & Research (Hong Kong) Limited (2008-present) and Assistant Secretary of Fidelity Management & Research (Japan) Inc. (2008-present), and Fidelity Management & Research (U.K.) Inc. (2008-present). Previously, Mr. Goebel served as Assistant Secretary of FIMM (2008-2010), FRAC (2008-2010), and the Funds (2007-2008) and as Vice President and Secretary of Fidelity Distributors Corporation (FDC) (2005-2007). |
William C. Coffey (43) |
| Year of Election or Appointment: 2009 Assistant Secretary of Fidelity's Equity and High Income Funds. Mr. Coffey also serves as Senior Vice President and Deputy General Counsel of FMR LLC (2010-present), and is an employee of Fidelity Investments. Previously, Mr. Coffey served as Vice President and Associate General Counsel of FMR LLC (2005-2009). |
Elizabeth Paige Baumann (44) |
| Year of Election or Appointment: 2012 Anti-Money Laundering (AML) Officer of the Fidelity funds. Ms. Baumann also serves as AML Officer of The North Carolina Capital Management Trust: Cash and Term Portfolios (2012-present), Chief AML Officer of FMR LLC (2012-present), and is an employee of Fidelity Investments. Previously, Ms. Baumann served as Vice President and Deputy Anti-Money Laundering Officer (2007-2012). |
Christine Reynolds (53) |
| Year of Election or Appointment: 2008 Chief Financial Officer of the Fidelity funds. Ms. Reynolds became President of Fidelity Pricing and Cash Management Services (FPCMS) in August 2008. Ms. Reynolds served as Chief Operating Officer of FPCMS (2007-2008). Previously, Ms. Reynolds served as President, Treasurer, and Anti-Money Laundering officer of the Fidelity funds (2004-2007). |
Joseph A. Hanlon (44) |
| Year of Election or Appointment: 2012 Chief Compliance Officer of Fidelity's Equity and High Income Funds. Mr. Hanlon serves as Compliance Officer of FMR, FMR Co., Inc., Fidelity Investments Money Management, Inc. (FIMM), Fidelity Research and Analysis Company (FRAC), Fidelity Management & Research (Japan) Inc., Fidelity Management & Research (U.K.) Inc., Fidelity Management & Research (Hong Kong), and Strategic Advisers, Inc. (2009-present), as Senior Vice President of the Fidelity Asset Management Division (2009-present), and is an employee of Fidelity Investments. |
Joseph F. Zambello (55) |
| Year of Election or Appointment: 2011 Deputy Treasurer of the Fidelity funds. Mr. Zambello is an employee of Fidelity Investments. Previously, Mr. Zambello served as Vice President of FMR's Program Management Group (2009-2011) and Vice President of the Transfer Agent Oversight Group (2005-2009). |
Adrien E. Deberghes (44) |
| Year of Election or Appointment: 2008 Deputy Treasurer of Fidelity's Equity and High Income Funds. Mr. Deberghes also serves as Vice President (2011-present) and Assistant Treasurer (2010-present) of other Fidelity funds, and is an employee of Fidelity Investments (2008-present). Previously, Mr. Deberghes served as Senior Vice President of Mutual Fund Administration at State Street Corporation (2007-2008), Senior Director of Mutual Fund Administration at Investors Bank & Trust (2005-2007), and Director of Finance for Dunkin' Brands (2000-2005). |
Stephanie J. Dorsey (43) |
| Year of Election or Appointment: 2010 Assistant Treasurer of Fidelity's Equity and High Income Funds. Ms. Dorsey also serves as Deputy Treasurer of other Fidelity funds (2008-present) and is an employee of Fidelity Investments (2008-present). Previously, Ms. Dorsey served as Treasurer (2004-2008) of the JPMorgan Mutual Funds and Vice President (2004-2008) of JPMorgan Chase Bank. |
John R. Hebble (54) |
| Year of Election or Appointment: 2009 Assistant Treasurer of Fidelity's Equity and High Income Funds. Mr. Hebble also serves as President (2011-present), Treasurer, and Chief Financial Officer of The North Carolina Capital Management Trust: Cash and Term Portfolios (2008-present), President and Treasurer of other Fidelity funds (2008-present) and is an employee of Fidelity Investments. |
Gary W. Ryan (54) |
| Year of Election or Appointment: 2005 Assistant Treasurer of the Fidelity funds. Mr. Ryan is an employee of Fidelity Investments. Previously, Mr. Ryan served as Vice President of Fund Reporting in Fidelity Pricing and Cash Management Services (FPCMS) (1999-2005). |
Jonathan Davis (44) |
| Year of Election or Appointment: 2010 Assistant Treasurer of the Fidelity funds. Mr. Davis is also Assistant Treasurer of Fidelity Rutland Square Trust II and Fidelity Commonwealth Trust II. Mr. Davis is an employee of Fidelity Investments. Previously, Mr. Davis served as Vice President and Associate General Counsel of FMR LLC (2003-2010). |
Annual Report
Blue Chip Growth designates 100% of the dividends distributed during the fiscal year as qualifying for the dividends-received deduction for corporate shareholders.
Blue Chip Growth designates 100% of the dividends distributed during the fiscal year as amounts which can be taken into account as a dividend for the purposes of the maximum rate under section 1(h)(11) of the Internal Revenue Code.
The fund will notify shareholders in January 2013 of amounts for use in preparing 2012 income tax returns.
Annual Report
Board Approval of Investment Advisory Contracts and Management Fees
Fidelity Blue Chip Growth Fund
Each year, the Board of Trustees, including the Independent Trustees (together, the Board), votes on the renewal of the management contract and sub-advisory agreements (together, the Advisory Contracts) for the fund. The Board, assisted by the advice of fund counsel and Independent Trustees' counsel, requests and considers a broad range of information relevant to the renewal of the Advisory Contracts throughout the year.
The Board meets regularly and, at each of its meetings, considers factors that are relevant to its annual consideration of the renewal of the fund's Advisory Contracts, including the services and support provided to the fund and its shareholders. The Board has established various standing committees, each composed of and chaired by Independent Trustees with varying backgrounds, to which the Board has assigned specific subject matter responsibilities in order to enhance effective decision-making by the Board. The Board, acting directly and through its Committees, requests and receives information concerning the annual consideration of the renewal of the fund's Advisory Contracts. The Board also meets as needed to consider matters specifically related to the Board's annual consideration of the renewal of Advisory Contracts. Members of the Board may also meet with trustees of other Fidelity funds through ad hoc joint committees to discuss certain matters relevant to the Fidelity funds.
At its July 2012 meeting, the Board of Trustees, including the Independent Trustees, unanimously determined to renew the fund's Advisory Contracts. In reaching its determination, the Board considered all factors it believed relevant, including (i) the nature, extent, and quality of the services to be provided to the fund and its shareholders (including the investment performance of the fund); (ii) the competitiveness of the fund's management fee and total expense ratio relative to peer funds; (iii) the total costs of the services to be provided by and the profits to be realized by Fidelity from its relationship with the fund; (iv) the extent to which economies of scale exist and would be realized as the fund grows; and (v) whether fee levels reflect these economies of scale, if any, for the benefit of fund shareholders.
In considering whether to renew the Advisory Contracts for the fund, the Board reached a determination, with the assistance of fund counsel and Independent Trustees' counsel and through the exercise of its business judgment, that the renewal of the Advisory Contracts is in the best interests of the fund and its shareholders and that the compensation payable under the Advisory Contracts is fair and reasonable. The Board's decision to renew the Advisory Contracts was not based on any single factor, but rather was based on a comprehensive consideration of all the information provided to the Board at its meetings throughout the year. The Board, in reaching its determination to renew the Advisory Contracts, is aware that shareholders in the fund have a broad range of investment choices available to them, including a wide choice among mutual funds offered by Fidelity's competitors, and that the fund's shareholders, who have the opportunity to review and weigh the disclosure provided by the fund in its prospectus and other public disclosures, have chosen to invest in this fund, managed by Fidelity.
Annual Report
Nature, Extent, and Quality of Services Provided. The Board considered the staffing within the investment adviser, FMR, and the sub-advisers (together, the Investment Advisers), including the backgrounds of the fund's investment personnel, and also considered the fund's investment objective, strategies, and related investment philosophy. The Independent Trustees also had discussions with senior management of Fidelity's investment operations and investment groups. The Board considered the structure of the portfolio manager compensation program and whether this structure provides appropriate incentives to act in the best interests of the fund.
Resources Dedicated to Investment Management and Support Services. The Board and the Fund Oversight and Research Committees reviewed the general qualifications and capabilities of the Investment Advisers' investment staff, including its size, education, experience, and resources, as well as the Investment Advisers' approach to recruiting, training, managing, and compensating investment personnel. The Board also noted that FMR has continued to increase the resources devoted to non-U.S. offices, including expansion of Fidelity's global investment organization. The Board noted that Fidelity's analysts have extensive resources, tools and capabilities that allow them to conduct sophisticated quantitative and fundamental analysis, as well as credit analysis of issuers, counterparties and guarantors. The Board also believes that Fidelity's investment professionals have sufficient access to global information and data so as to provide competitive investment results over time, and that those professionals also have access to sophisticated tools that permit them to assess portfolio construction and risk and performance attribution characteristics continuously, as well as to transmit new information and research conclusions rapidly around the world. Additionally, in its deliberations, the Board considered the Investment Advisers' trading and risk management capabilities and resources, which are an integral part of the investment management process.
Shareholder and Administrative Services. The Board considered (i) the nature, extent, quality, and cost of advisory, administrative, and shareholder services performed by the Investment Advisers and their affiliates under the Advisory Contracts and under separate agreements covering transfer agency, pricing and bookkeeping, and securities lending services for the fund; (ii) the nature and extent of the supervision of third party service providers, principally custodians and subcustodians; and (iii) the resources devoted to, and the record of compliance with, the fund's compliance policies and procedures. The Board also reviewed the allocation of fund brokerage, including allocations to brokers affiliated with the Investment Advisers, the use of brokerage commissions to pay fund expenses, and the use of "soft" commission dollars to pay for research services.
Annual Report
Board Approval of Investment Advisory Contracts and
Management Fees - continued
The Board noted that the growth of fund assets over time across the complex allows Fidelity to reinvest in the development of services designed to enhance the value or convenience of the Fidelity funds as investment vehicles. These services include 24-hour access to account information and market information through telephone representatives and over the Internet, investor education materials and asset allocation tools, and the expanded availability of Fidelity Investor Centers.
Investment in a Large Fund Family. The Board considered the benefits to shareholders of investing in a Fidelity fund, including the benefits of investing in a fund that is part of a large family of funds offering a variety of investment disciplines and providing a large variety of mutual fund investor services. The Board noted that Fidelity had taken, or had made recommendations that resulted in the Fidelity funds taking, a number of actions over the previous year that benefited particular funds, including (i) continuing to dedicate additional resources to investment research and support of the senior management team that oversees asset management; (ii) persisting in efforts to enhance Fidelity's research capabilities, in particular, international research; (iii) launching new funds and making other enhancements to meet client needs for global and income-oriented solutions; (iv) continuing to launch dedicated lower cost underlying funds to meet investment management's portfolio construction needs related to expanding underlying fund options, specifically for the Freedom Fund product lines; (v) adopting a "Stock Selector" sector neutral investment approach and employing a team of portfolio managers who are sector specialists to manage certain funds; (vi) rationalizing product lines and gaining increased efficiencies through the mergers of several funds into other funds; (vii) strengthening the Spartan Index Fund product line by adding new funds and/or new low-cost institutional share classes, restructuring fund expenses to accommodate new classes, and reducing investment minimums for certain classes of shares; (viii) modifying the eligibility criteria for Institutional Class shares to increase their appeal to government entities and charitable investors; and (ix) reducing certain transfer agent fee rates.
Investment Performance. The Board considered whether the fund has operated in accordance with its investment objective, as well as its record of compliance with its investment restrictions. It also reviewed the fund's absolute investment performance for each class, as well as the fund's relative investment performance for each class measured over multiple periods against (i) a broad-based securities market index, and (ii) a peer group of mutual funds deemed appropriate by Fidelity and reviewed by the Board. The following charts considered by the Board show, over the one-, three-, and five-year periods ended December 31, 2011, as available, the cumulative total returns of Class K and the retail class of the fund, the cumulative total returns of a broad-based securities market index ("benchmark"), and a range of cumulative total returns of a peer group of mutual funds identified by Morningstar, Inc. as having an investment style similar to that of the fund based on underlying portfolio holdings. The returns of Class K and the retail class show the performance of the highest and lowest performing classes, respectively (based on three-year performance). The box within each chart shows the 25th percentile return (top of box) and the 75th percentile return (bottom of box) of the peer group. Returns shown above the box are in the first quartile and returns shown below the box are in the fourth quartile. The percentage beaten numbers noted below each chart correspond to the percentile box and represent the percentage of funds in the peer group whose performance was equal to or lower than that of the class indicated.
Annual Report
Fidelity Blue Chip Growth Fund
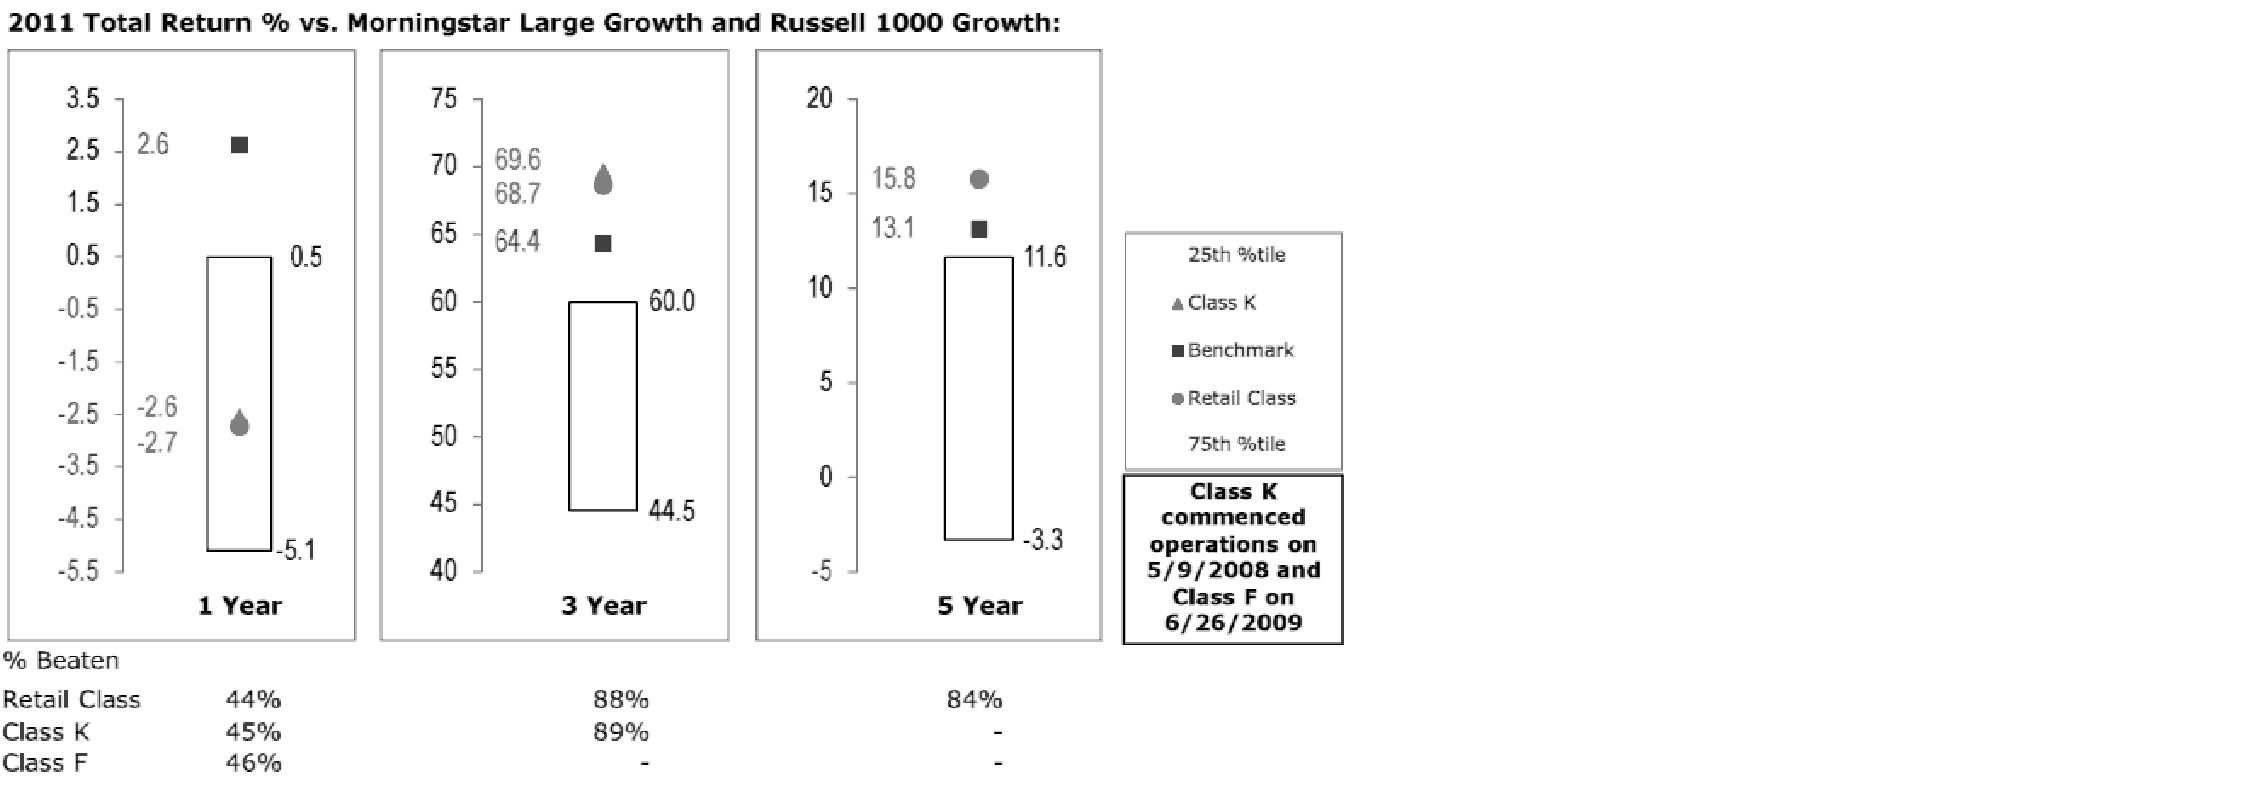
The Board reviewed the fund's relative investment performance against its peer group and noted that the performance of the retail class of the fund (the class with the longest performance record) was in the third quartile for the one-year period and the first quartile for the three- and five-year periods. The Board also noted that the investment performance of the retail class of the fund compared favorably to its benchmark for the three- and five-year periods, although the fund's one-year total return was lower than its benchmark. The Board considered that the variations in performance among the fund's classes reflect the variations in class expenses, which result in lower performance for higher expense classes. The Board also reviewed the fund's performance since inception as well as performance in the current year.
The Board also considered that the fund's management fee is subject to upward or downward adjustment depending upon whether, and to what extent, the fund's investment performance for the performance period exceeds, or is exceeded by, the record (over the same period) of a Board-approved performance adjustment index. The Board noted that the performance adjustment provides FMR with a strong economic incentive to seek to achieve superior performance for the fund's shareholders and helps to more closely align the interests of FMR and the fund's shareholders.
Annual Report
Board Approval of Investment Advisory Contracts and
Management Fees - continued
Based on its review, the Board concluded that the nature, extent, and quality of services provided to the fund under the Advisory Contracts should benefit the fund's shareholders.
Competitiveness of Management Fee and Total Expense Ratio. The Board considered the fund's management fee and total expense ratio compared to "mapped groups" of competitive funds and classes. Fidelity creates "mapped groups" by combining similar Lipper investment objective categories that have comparable management fee characteristics. Combining Lipper investment objective categories aids the Board's management fee and total expense ratio comparisons by broadening the competitive group used for comparison and by reducing the number of universes to which various Fidelity funds are compared.
Management Fee. The Board considered two proprietary management fee comparisons for the 12-month periods shown in the chart below. The group of Lipper funds used by the Board for management fee comparisons is referred to below as the "Total Mapped Group." The Total Mapped Group comparison focuses on a fund's standing relative to the total universe of comparable funds available to investors in terms of gross management fees before expense reimbursements or caps, and without giving effect to the fund's performance adjustment. "TMG %" represents the percentage of funds in the Total Mapped Group that had management fees that were lower than the fund's. For example, a TMG % of 10% means that 90% of the funds in the Total Mapped Group had higher management fees than the fund. The "Asset-Size Peer Group" (ASPG) comparison focuses on a fund's standing relative to non-Fidelity funds similar in size to the fund within the Total Mapped Group. The ASPG represents at least 15% of the funds in the Total Mapped Group with comparable asset size and management fee characteristics, subject to a minimum of 50 funds (or all funds in the Total Mapped Group if fewer than 50). Additional information, such as the ASPG quartile in which the fund's management fee ranked and the impact of the fund's performance adjustment, is also included in the chart and considered by the Board.
Annual Report
Fidelity Blue Chip Growth Fund
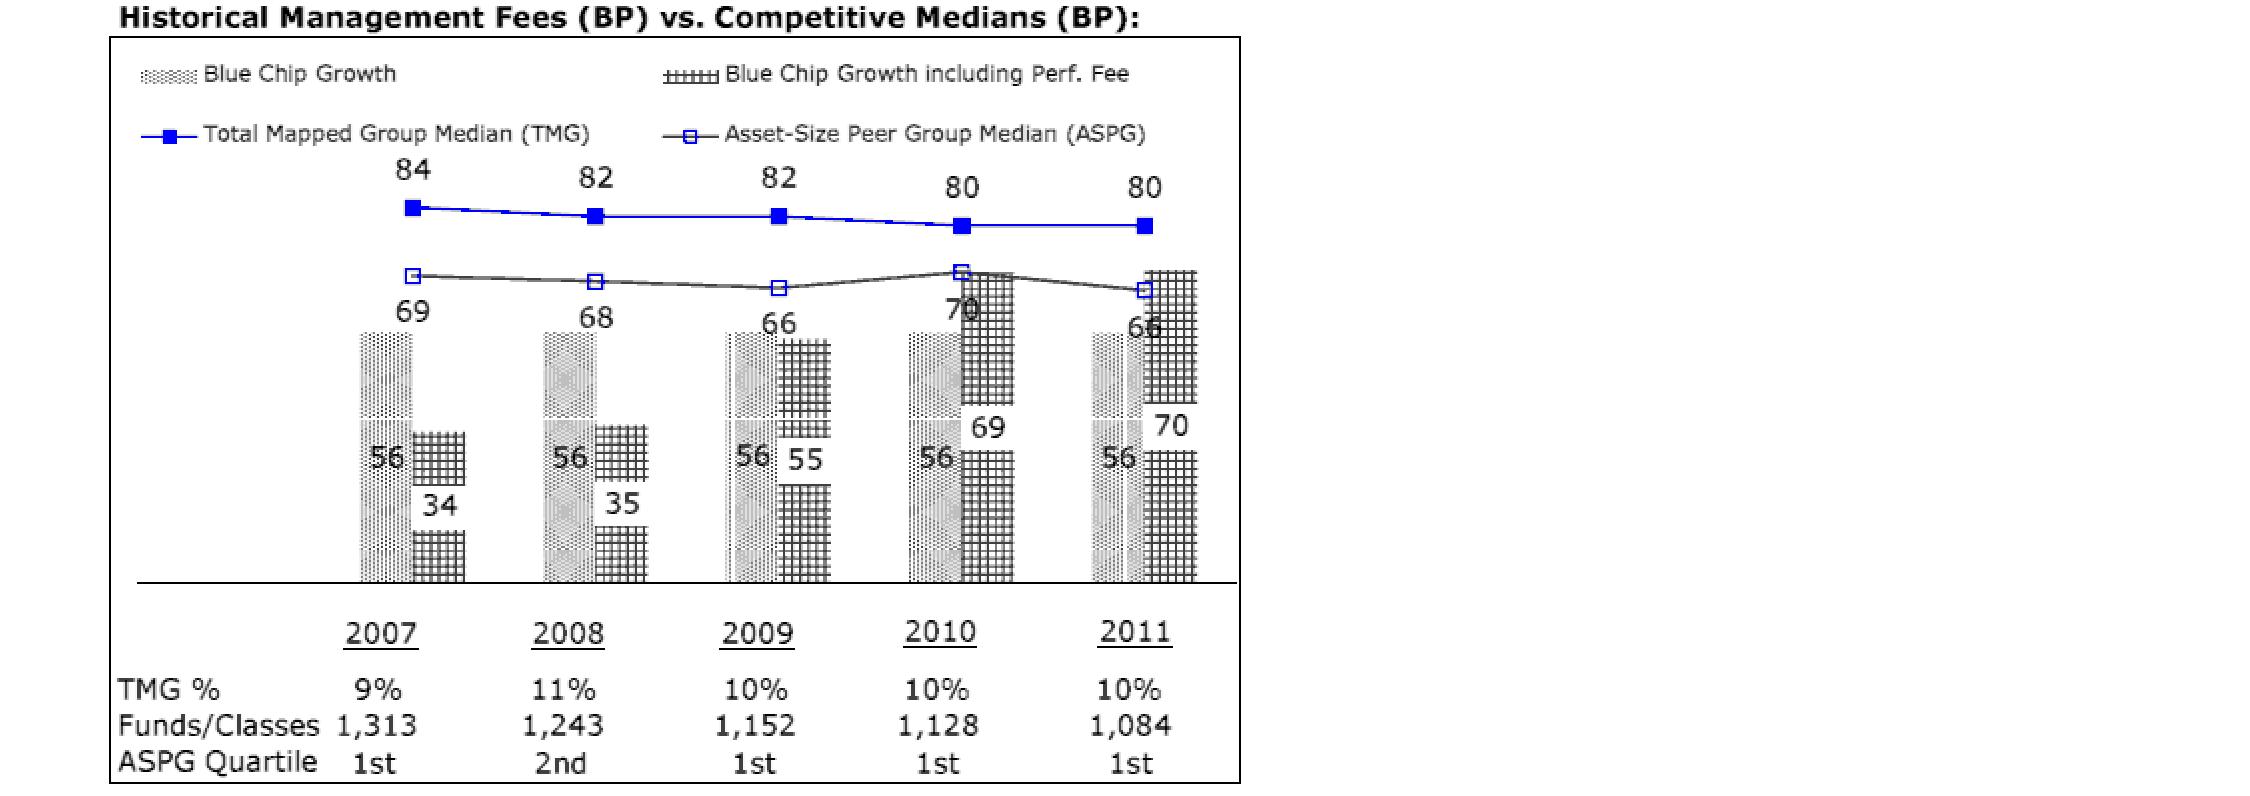
The Board noted that the fund's management fee ranked below the median of its Total Mapped Group and below the median of its ASPG for 2011. The Board also noted the effect of the fund's positive performance adjustment on the fund's management fee ranking. The Board noted that the performance adjustment for each year represents calculations for performance periods that differ from the periods shown in the performance charts above.
Furthermore, the Board considered that shareholders approved a prospective change in the index used to calculate the fund's performance adjustment beginning June 1, 2006. The Board also considered that, because the performance adjustment is based on a rolling 36-month measurement period, during a transition period the fund's performance is compared to a blended index return that reflects the performance of the former index for the portion of the measurement period prior to June 1, 2006 and the performance of the current index for the remainder of the measurement period. The Board noted that the fund's performance adjustments for 2007 through 2009 shown in the chart above reflect the effect of using the blended index return to calculate the fund's performance adjustment.
Based on its review, the Board concluded that the fund's management fee is fair and reasonable in light of the services that the fund receives and the other factors considered.
Total Expense Ratio. In its review of each class's total expense ratio, the Board considered the fund's management fee as well as other fund or class expenses, as applicable, such as transfer agent fees, pricing and bookkeeping fees, and custodial, legal, and audit fees. The Board also noted the effects of any waivers and reimbursements on fees and expenses, as well as the impact of the fund's performance adjustment. As part of its review, the Board also considered the current and historical total expense ratios of each class of the fund compared to competitive fund median expenses. Each class of the fund is compared to those funds and classes in the Total Mapped Group (used by the Board for management fee comparisons) that have a similar sales load structure.
Annual Report
Board Approval of Investment Advisory Contracts and
Management Fees - continued
The Board noted that the total expense ratio of each class ranked below its competitive median for 2011.
Fees Charged to Other Fidelity Clients. The Board also considered Fidelity fee structures and other information with respect to clients of FMR and its affiliates, such as other mutual funds advised or subadvised by FMR or its affiliates, pension plan clients, and other institutional clients. The Board noted the findings of the 2010 ad hoc joint committee (created with the board of other Fidelity funds), which reviewed and compared Fidelity's institutional investment advisory business with its business of providing services to the Fidelity funds, including the differences in services provided, fees charged, and costs incurred, as well as competition in their respective marketplaces.
Based on its review of total expense ratios and fees charged to other Fidelity clients, the Board concluded that the total expense ratio of each class of the fund was reasonable in light of the services that the fund and its shareholders receive and the other factors considered.
Costs of the Services and Profitability. The Board considered the revenues earned and the expenses incurred by Fidelity in conducting the business of developing, marketing, distributing, managing, administering and servicing the fund and its shareholders. The Board also considered the level of Fidelity's profits in respect of all the Fidelity funds.
On an annual basis, FMR presents to the Board Fidelity's profitability for the fund. Fidelity calculates the profitability for each fund, as well as aggregate profitability for groups of Fidelity funds and all Fidelity funds, using a series of detailed revenue and cost allocation methodologies which originate with the books and records of Fidelity on which Fidelity's audited financial statements are based. The Audit Committee of the Board reviews any significant changes from the prior year's methodologies.
PricewaterhouseCoopers LLP (PwC), independent registered public accounting firm and auditor to Fidelity and certain Fidelity funds, has been engaged annually by the Board as part of the Board's assessment of Fidelity's profitability analysis. PwC's engagement includes the review and assessment of Fidelity's methodologies used in determining the revenues and expenses attributable to Fidelity's mutual fund business, and completion of agreed-upon procedures surrounding the mathematical accuracy of fund profitability and its conformity to allocation methodologies. After considering PwC's reports issued under the engagement and information provided by Fidelity, the Board concluded that while other allocation methods may also be reasonable, Fidelity's profitability methodologies are reasonable in all material respects.
Annual Report
The Board also reviewed Fidelity's non-fund businesses and fall-out benefits related to the mutual fund business as well as cases where Fidelity's affiliates may benefit from or be related to the fund's business.
The Board considered the costs of the services provided by and the profits realized by Fidelity in connection with the operation of the fund and was satisfied that the profitability was not excessive in the circumstances.
Economies of Scale. The Board considered whether there have been economies of scale in respect of the management of the Fidelity funds, whether the Fidelity funds (including the fund) have appropriately benefited from any such economies of scale, and whether there is potential for realization of any further economies of scale. The Board considered the extent to which the fund will benefit from economies of scale through increased services to the fund, through waivers or reimbursements, or through fee or expense reductions. The Board also noted that in 2009, it and the board of other Fidelity funds created an ad hoc committee (the Economies of Scale Committee) to analyze whether FMR attains economies of scale in respect of the management and servicing of the Fidelity funds, whether the Fidelity funds have appropriately benefited from such economies of scale, and whether there is potential for realization of any further economies of scale.
The Board recognized that the fund's management contract incorporates a "group fee" structure, which provides for lower group fee rates as total fund assets under FMR's management increase, and for higher group fee rates as total fund assets under FMR's management decrease. FMR calculates the group fee rates based on a tiered asset "breakpoint" schedule that varies based on asset class. The Board considered that the group fee is designed to deliver the benefits of economies of scale to fund shareholders when total Fidelity fund assets increase, even if assets of any particular fund are unchanged or have declined, because some portion of Fidelity's costs are attributable to services provided to all Fidelity funds, and all funds benefit if those costs can be allocated among more assets. The Board concluded that, given the group fee structure, fund shareholders will benefit from lower management fees as assets under FMR's management increase at the fund complex level, regardless of whether Fidelity achieves any such economies of scale.
The Board concluded, taking into account the analysis of the Economies of Scale Committee, that economies of scale, if any, are being appropriately shared between fund shareholders and Fidelity.
Annual Report
Board Approval of Investment Advisory Contracts and
Management Fees - continued
Additional Information Requested by the Board. In order to develop fully the factual basis for consideration of the Fidelity funds' Advisory Contracts, the Board requested and received additional information on certain topics, including (i) fund performance trends, actions to be taken by FMR to improve certain funds' overall performance, and Fidelity's long-term strategies for certain funds; (ii) the potential to further rationalize the Fidelity fund lineup with the possibility of achieving savings for the funds and Fidelity; (iii) Fidelity's compensation structure for portfolio managers and other key investment personnel; (iv) the amount of the investment that each portfolio manager has made in the Fidelity fund(s) that he or she manages; (v) the realization of fall-out benefits in certain Fidelity business units; (vi) Fidelity's group fee structures, the potential impact of regulatory changes on such structures, and the rationale for the individual fee rates of certain funds; (vii) fund profitability methodology, including Fidelity's cost allocation methodology, and the impact of certain factors on fund profitability results; (viii) trends regarding industry use of performance fee structures and the possibility of implementing performance fee structures for additional funds; and (ix) the impact of net redemptions from the Fidelity funds.
Based on its evaluation of all of the conclusions noted above, and after considering all factors it believed relevant, the Board ultimately concluded that the advisory fee structures are fair and reasonable, and that the fund's Advisory Contracts should be renewed.
Annual Report
Investment Adviser
Fidelity Management & Research Company
Boston, MA
Investment Sub-Advisers
FMR Co., Inc.
Fidelity Management & Research
(U.K.) Inc.
Fidelity Management & Research
(Hong Kong) Limited
Fidelity Management & Research
(Japan) Inc.
General Distributor
Fidelity Distributors Corporation
Smithfield, RI
Transfer and Service Agents
Fidelity Investments Institutional
Operations Company, Inc.
Boston, MA
Fidelity Service Company, Inc.
Boston, MA
Custodian
Citibank, N.A.
New York, NY
The Fidelity Telephone Connection
Mutual Fund 24-Hour Service
Exchanges/Redemptions
and Account Assistance 1-800-544-6666
Product Information 1-800-544-6666
Retirement Accounts 1-800-544-4774
(8 a.m. - 9 p.m.)
TDD Service 1-800-544-0118
for the deaf and hearing impaired
(9 a.m. - 9 p.m. Eastern time)
Fidelity Automated Service
Telephone (FAST®)
1-800-544-5555
Automated line for quickest service
(Fidelity Investment logo)(registered trademark)
Corporate Headquarters
82 Devonshire St., Boston, MA 02109
www.fidelity.com
BCF-UANN-0912
1.789244.109
Fidelity®
Blue Chip Growth
Fund -
Class F
Annual Report
July 31, 2012
(Fidelity Cover Art)
Contents
Performance | (Click Here) | How the fund has done over time. |
Management's Discussion of Fund Performance | (Click Here) | The Portfolio Manager's review of fund performance and strategy. |
Shareholder Expense Example | (Click Here) | An example of shareholder expenses. |
Investment Changes | (Click Here) | A summary of major shifts in the fund's investments over the past six months. |
Investments | (Click Here) | A complete list of the fund's investments with their market values. |
Financial Statements | (Click Here) | Statements of assets and liabilities, operations, and changes in net assets, as well as financial highlights. |
Notes | (Click Here) | Notes to the financial statements. |
Report of Independent Registered Public Accounting Firm | (Click Here) | |
Trustees and Officers | (Click Here) | |
Distributions | (Click Here) | |
Board Approval of Investment Advisory Contracts and Management Fees | (Click Here) | |
To view a fund's proxy voting guidelines and proxy voting record for the 12-month period ended June 30, visit http://www.fidelity.com/proxyvotingresults or visit the Securities and Exchange Commission's (SEC) web site at http://www.sec.gov. You may also call 1-800-835-5092 to request a free copy of the proxy voting guidelines.
Standard & Poor's, S&P and S&P 500 are registered service marks of The McGraw-Hill Companies, Inc. and have been licensed for use by Fidelity Distributors Corporation.
Other third party marks appearing herein are the property of their respective owners.
All other marks appearing herein are registered or unregistered trademarks or service marks of FMR LLC or an affiliated company. © 2012 FMR LLC. All rights reserved.
Annual Report
This report and the financial statements contained herein are submitted for the general information of the shareholders of the fund. This report is not authorized for distribution to prospective investors in the fund unless preceded or accompanied by an effective prospectus.
A fund files its complete schedule of portfolio holdings with the SEC for the first and third quarters of each fiscal year on Form N-Q. Forms N-Q are available on the SEC's web site at http://www.sec.gov. A fund's Forms N-Q may be reviewed and copied at the SEC's Public Reference Room in Washington, DC. Information regarding the operation of the SEC's Public Reference Room may be obtained by calling 1-800-SEC-0330. For a complete list of a fund's portfolio holdings, view the most recent holdings listing, semiannual report, or annual report on Fidelity's web site at http://www.fidelity.com, http://www.advisor.fidelity.com, or http://www.401k.com, as applicable.
NOT FDIC INSURED • MAY LOSE VALUE • NO BANK GUARANTEE
Neither the fund nor Fidelity Distributors Corporation is a bank.
Annual Report
Average annual total return reflects the change in the value of an investment, assuming reinvestment of the class' distributions from dividend income and capital gains (the profits earned upon the sale of securities that have grown in value, if any) and assuming a constant rate of performance each year. The $10,000 table and the fund's returns do not reflect the deduction of taxes that a shareholder would pay on fund distributions or the redemption of fund shares. During periods of reimbursement by Fidelity, a fund's total return will be greater than it would be had the reimbursement not occurred. How a fund did yesterday is no guarantee of how it will do tomorrow.
Average Annual Total Returns
Periods ended July 31, 2012 | Past 1
year | Past 5
years | Past 10
years |
Class F A | 2.49% | 4.25% | 6.23% |
A The initial offering of Class F shares took place on June 26, 2009. Returns prior to June 26, 2009 are those of Fidelity® Blue Chip Growth Fund, the original class of the fund.
$10,000 Over 10 Years
Let's say hypothetically that $10,000 was invested in Fidelity® Blue Chip Growth Fund - Class F on July 31, 2002. The chart shows how the value of your investment would have changed, and also shows how the Russell 1000® Growth Index performed over the same period. The initial offering of Class F took place on June 26, 2009. See above for additional information regarding the performance of Class F.
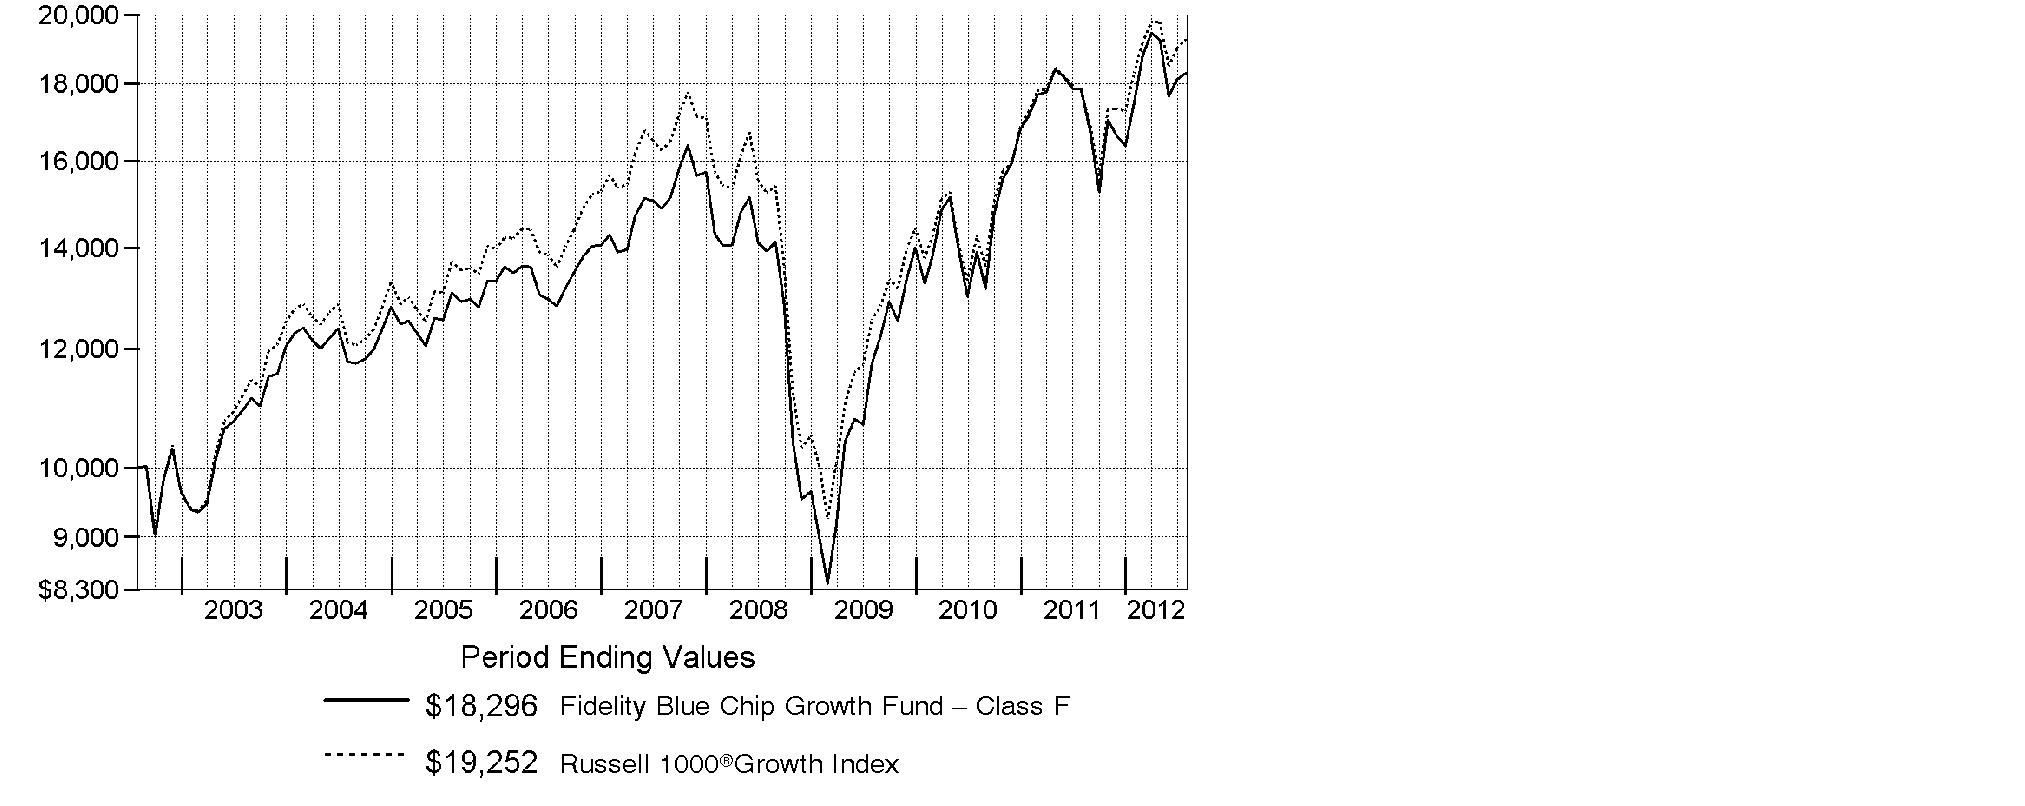
Annual Report
Market Recap: Major U.S. equity benchmarks posted solid gains for the year ending July 31, 2012, amid an uncertain investment environment. The broad-based S&P 500® Index returned 9.13%, while the blue-chip-laden Dow Jones Industrial AverageSM and technology-heavy Nasdaq Composite® Index gained 10.12% and 7.83%, respectively. Volatility spiked during the period's first half, as equities plummeted late last summer on Europe's debt woes, political wrangling over the U.S. debt ceiling and the sovereign credit-rating downgrade that followed. By October, a seemingly improved U.S. economy rejuvenated stocks, paving the way for major equity benchmarks to post their best first-quarter performance since 1998. However, more eurozone trouble, signs that the U.S. economy had turned sluggish and a slowdown in China caused stocks to slip in May, before a new wave of optimism took hold in June and July. Within the S&P 500®, more-defensive sectors such as telecommunication services (+30%) and consumer staples (+20%) fared best, while materials and energy significantly underperformed, returning -5%. Small- and mid-cap stocks trailed their less-volatile large-cap counterparts, with the Russell 2000® Index adding 0.19% and the Russell Midcap® Index rising 2.28%. Given turmoil and local currency weakness in Europe, foreign developed-markets stocks lost ground, with the MSCI® EAFE® Index returning -11.32%.
Comments from Sonu Kalra, Portfolio Manager of Fidelity® Blue Chip Growth Fund: For the year, the fund's Class F shares rose 2.49%, trailing the 8.26% gain of the Russell 1000® Growth Index. Picks in the food, beverage and tobacco segment of consumer staples hurt, primarily due to the fund's overweighted position in Green Mountain Coffee Roasters, by far the largest relative detractor. Investors began to worry that the maker of Keurig® single-cup coffee systems wouldn't be able to sustain its rapid growth, the company couldn't consistently meet expectations and some well-known hedge fund managers were openly critical about the stock. In May, Green Mountain overestimated the amount of demand for its products and reduced its revenue and earnings expectations. Leading U.S. coal producer Alpha Natural Resources - sold from the fund by period end - detracted, as did the fund's investments in foreign stocks, driven in part by a stronger U.S. dollar. Info tech was a bright spot, where overweighting giant Apple - by far the fund's largest holding - made the biggest overall contribution. Continued strong sales of the company's iPhone® 4S smartphone, personal computers and iPad® tablets boosted Apple's stock. Elsewhere, Hong Kong-based handbag maker Michael Kors Holdings was lifted by significant growth of its retail stores.
The views expressed above reflect those of the portfolio manager(s) only through the end of the period as stated on the cover of this report and do not necessarily represent the views of Fidelity or any other person in the Fidelity organization. Any such views are subject to change at any time based upon market or other conditions and Fidelity disclaims any responsibility to update such views. These views may not be relied on as investment advice and, because investment decisions for a Fidelity fund are based on numerous factors, may not be relied on as an indication of trading intent on behalf of any Fidelity fund.
Annual Report
Shareholder Expense Example
As a shareholder of the Fund, you incur two types of costs: (1) transaction costs, and (2) ongoing costs, including management fees and other Fund expenses. This Example is intended to help you understand your ongoing costs (in dollars) of investing in the Fund and to compare these costs with the ongoing costs of investing in other mutual funds.
The Example is based on an investment of $1,000 invested at the beginning of the period and held for the entire period (February 1, 2012 to July 31, 2012).
Actual Expenses
The first line of the accompanying table for each class of the Fund provides information about actual account values and actual expenses. You may use the information in this line, together with the amount you invested, to estimate the expenses that you paid over the period. Simply divide your account value by $1,000.00 (for example, an $8,600 account value divided by $1,000.00 = 8.6), then multiply the result by the number in the first line for a class of the Fund under the heading entitled "Expenses Paid During Period" to estimate the expenses you paid on your account during this period. A small balance maintenance fee of $12.00 that is charged once a year may apply for certain accounts with a value of less than $2,000. This fee is not included in the table below. If it was, the estimate of expenses you paid during the period would be higher, and your ending account value lower, by this amount. In addition, the Fund, as a shareholder in the underlying Fidelity Central Funds, will indirectly bear its pro-rata share of the fees and expenses incurred by the underlying Fidelity Central Funds. These fees and expenses are not included in the Fund's annualized expense ratio used to calculate the expense estimate in the table below.
Hypothetical Example for Comparison Purposes
The second line of the accompanying table for each class of the Fund provides information about hypothetical account values and hypothetical expenses based on a Class' actual expense ratio and an assumed rate of return of 5% per year before expenses, which is not the Class' actual return. The hypothetical account values and expenses may not be used to estimate the actual ending account balance or expenses you paid for the period. You may use this information to compare the ongoing costs of investing in the Fund and other funds. To do so, compare this 5% hypothetical example with the 5% hypothetical examples that appear in the shareholder reports of the other funds. A small balance maintenance fee of $12.00 that is charged once a year may apply for certain accounts with a value of less than $2,000. This fee is not included in the table below. If it was, the estimate of expenses you paid during the period would be higher, and your ending account value lower, by this amount. In addition, the Fund, as a shareholder in the underlying Fidelity Central Funds, will indirectly bear its pro-rata share of the fees and expenses incurred by the underlying Fidelity Central Funds. These fees and expenses are not included in the Fund's annualized expense ratio used to calculate the expense estimate in the table below.
Please note that the expenses shown in the table are meant to highlight your ongoing costs only and do not reflect any transaction costs. Therefore, the second line of the table is useful in comparing ongoing costs only, and will not help you determine the relative total costs of owning different funds.
Annual Report
| Annualized Expense Ratio | Beginning
Account Value
February 1, 2012 | Ending
Account Value
July 31, 2012 | Expenses Paid
During Period*
February 1, 2012 to
July 31, 2012 |
Blue Chip Growth | .88% | | | |
Actual | | $ 1,000.00 | $ 1,046.40 | $ 4.48 |
Hypothetical A | | $ 1,000.00 | $ 1,020.49 | $ 4.42 |
Class K | .73% | | | |
Actual | | $ 1,000.00 | $ 1,047.50 | $ 3.72 |
Hypothetical A | | $ 1,000.00 | $ 1,021.23 | $ 3.67 |
Class F | .68% | | | |
Actual | | $ 1,000.00 | $ 1,047.60 | $ 3.46 |
Hypothetical A | | $ 1,000.00 | $ 1,021.48 | $ 3.42 |
A 5% return per year before expenses
* Expenses are equal to each Class' annualized expense ratio, multiplied by the average account value over the period, multiplied by 182/366 (to reflect the one-half year period).
Annual Report
Investment Changes (Unaudited)
Top Ten Stocks as of July 31, 2012 |
| % of fund's
net assets | % of fund's net assets
6 months ago |
Apple, Inc. | 10.4 | 9.8 |
Google, Inc. Class A | 5.4 | 4.5 |
Amazon.com, Inc. | 2.1 | 1.7 |
QUALCOMM, Inc. | 2.1 | 2.1 |
The Coca-Cola Co. | 2.1 | 1.9 |
Microsoft Corp. | 1.9 | 1.2 |
Philip Morris International, Inc. | 1.6 | 1.4 |
Broadcom Corp. Class A | 1.5 | 1.0 |
MasterCard, Inc. Class A | 1.3 | 1.1 |
McDonald's Corp. | 1.3 | 2.2 |
| 29.7 | |
Top Five Market Sectors as of July 31, 2012 |
| % of fund's
net assets | % of fund's net assets
6 months ago |
Information Technology | 36.8 | 33.3 |
Consumer Discretionary | 21.1 | 19.8 |
Consumer Staples | 14.1 | 11.6 |
Health Care | 9.3 | 9.5 |
Industrials | 8.5 | 10.8 |
Asset Allocation (% of fund's net assets) |
As of July 31, 2012* | As of January 31, 2012** |
 | Stocks 99.8% | | | Stocks 100.3% | |
 | Convertible
Securities 0.0% | |  | Convertible
Securities 0.1% | |
 | Short-Term
Investments and
Net Other Assets (Liabilities) 0.2% | | | Short-Term
Investments and
Net Other Assets (Liabilities)† (0.4)% | |
* Foreign investments | 9.7% | | ** Foreign investments | 11.4% | |

† Short-term Investments and Net Other Assets (Liabilities) are not included in the pie chart. |
Annual Report
Investments July 31, 2012
Showing Percentage of Net Assets
Common Stocks - 99.3% |
| Shares | | Value (000s) |
CONSUMER DISCRETIONARY - 20.6% |
Auto Components - 0.3% |
Delphi Automotive PLC | 605,200 | | $ 17,182 |
The Goodyear Tire & Rubber Co. (a) | 739,100 | | 8,463 |
TRW Automotive Holdings Corp. (a) | 493,500 | | 19,395 |
| | 45,040 |
Automobiles - 0.7% |
Harley-Davidson, Inc. | 208,600 | | 9,018 |
Hyundai Motor Co. | 75,033 | | 15,728 |
Kia Motors Corp. | 152,660 | | 10,545 |
Tesla Motors, Inc. (a)(d) | 2,702,754 | | 74,110 |
| | 109,401 |
Hotels, Restaurants & Leisure - 4.6% |
Bravo Brio Restaurant Group, Inc. (a) | 740,800 | | 13,386 |
Chipotle Mexican Grill, Inc. (a) | 137,700 | | 40,254 |
Dunkin' Brands Group, Inc. | 533,300 | | 16,148 |
Hyatt Hotels Corp. Class A (a) | 316,497 | | 11,251 |
Jubilant Foodworks Ltd. (a) | 216,731 | | 4,387 |
Las Vegas Sands Corp. | 2,200,900 | | 80,157 |
McDonald's Corp. | 2,218,930 | | 198,284 |
Panera Bread Co. Class A (a) | 658,500 | | 103,707 |
Starbucks Corp. | 2,572,800 | | 116,496 |
Wyndham Worldwide Corp. | 340,985 | | 17,748 |
Yum! Brands, Inc. | 1,328,700 | | 86,153 |
| | 687,971 |
Household Durables - 1.1% |
Lennar Corp. Class A | 1,543,452 | | 45,084 |
SodaStream International Ltd. (a) | 286,400 | | 11,172 |
Toll Brothers, Inc. (a) | 1,176,800 | | 34,327 |
Whirlpool Corp. | 1,143,543 | | 77,258 |
| | 167,841 |
Internet & Catalog Retail - 3.3% |
Amazon.com, Inc. (a) | 1,356,600 | | 316,495 |
Expedia, Inc. (d) | 1,004,300 | | 57,235 |
Kayak Software Corp. | 15,300 | | 513 |
Priceline.com, Inc. (a) | 170,900 | | 113,091 |
| | 487,334 |
Media - 1.6% |
Comcast Corp. Class A | 4,174,700 | | 135,886 |
The Walt Disney Co. | 1,706,000 | | 83,833 |
Common Stocks - continued |
| Shares | | Value (000s) |
CONSUMER DISCRETIONARY - continued |
Media - continued |
Time Warner Cable, Inc. | 174,500 | | $ 14,820 |
Time Warner, Inc. | 113,500 | | 4,440 |
| | 238,979 |
Multiline Retail - 1.4% |
Dollar General Corp. (a) | 636,700 | | 32,478 |
Dollar Tree, Inc. (a) | 329,800 | | 16,602 |
Dollarama, Inc. | 420,234 | | 26,190 |
JCPenney Co., Inc. | 341,700 | | 7,692 |
Macy's, Inc. | 1,977,900 | | 70,888 |
Target Corp. | 883,700 | | 53,596 |
| | 207,446 |
Specialty Retail - 4.4% |
American Eagle Outfitters, Inc. | 142,800 | | 2,973 |
AutoZone, Inc. (a) | 33,600 | | 12,608 |
CarMax, Inc. (a) | 106,400 | | 2,961 |
Cia.Hering SA | 254,600 | | 5,027 |
Five Below, Inc. | 15,500 | | 455 |
Foot Locker, Inc. | 506,500 | | 16,725 |
Francescas Holdings Corp. (a) | 856,800 | | 26,912 |
GNC Holdings, Inc. | 569,900 | | 21,958 |
Home Depot, Inc. | 2,808,900 | | 146,568 |
Limited Brands, Inc. | 2,769,800 | | 131,704 |
Lowe's Companies, Inc. | 769,500 | | 19,522 |
Ross Stores, Inc. | 516,700 | | 34,330 |
TJX Companies, Inc. | 3,643,580 | | 161,338 |
Ulta Salon, Cosmetics & Fragrance, Inc. | 294,400 | | 24,989 |
Urban Outfitters, Inc. (a) | 1,228,400 | | 37,528 |
| | 645,598 |
Textiles, Apparel & Luxury Goods - 3.2% |
Arezzo Industria e Comercio SA | 1,681,000 | | 26,390 |
Brunello Cucinelli SpA | 561,900 | | 7,660 |
Coach, Inc. | 745,500 | | 36,776 |
Fifth & Pacific Companies, Inc. (a)(d) | 2,198,511 | | 24,360 |
Fossil, Inc. (a) | 644,319 | | 46,191 |
lululemon athletica, Inc. (a) | 446,180 | | 25,200 |
Michael Kors Holdings Ltd. | 2,825,537 | | 116,666 |
NIKE, Inc. Class B | 858,200 | | 80,113 |
Common Stocks - continued |
| Shares | | Value (000s) |
CONSUMER DISCRETIONARY - continued |
Textiles, Apparel & Luxury Goods - continued |
PVH Corp. | 954,900 | | $ 75,848 |
Under Armour, Inc. Class A (sub. vtg.) (a) | 511,418 | | 27,842 |
| | 467,046 |
TOTAL CONSUMER DISCRETIONARY | | 3,056,656 |
CONSUMER STAPLES - 14.1% |
Beverages - 4.8% |
Anheuser-Busch InBev SA NV ADR | 734,800 | | 58,211 |
Beam, Inc. | 285,100 | | 17,927 |
Constellation Brands, Inc. Class A (sub. vtg.) (a) | 366,600 | | 10,342 |
Diageo PLC sponsored ADR | 74,000 | | 7,911 |
Dr Pepper Snapple Group, Inc. | 862,000 | | 39,290 |
Monster Beverage Corp. (a) | 2,184,800 | | 145,224 |
PepsiCo, Inc. | 1,619,800 | | 117,808 |
SABMiller PLC | 181,900 | | 7,863 |
The Coca-Cola Co. | 3,773,800 | | 304,923 |
| | 709,499 |
Food & Staples Retailing - 2.7% |
Costco Wholesale Corp. | 759,900 | | 73,087 |
CVS Caremark Corp. | 2,692,800 | | 121,849 |
Fresh Market, Inc. (a) | 445,100 | | 26,212 |
Wal-Mart Stores, Inc. | 1,262,200 | | 93,946 |
Whole Foods Market, Inc. | 960,000 | | 88,109 |
| | 403,203 |
Food Products - 1.7% |
Annie's, Inc. (d) | 13,200 | | 538 |
Calbee, Inc. (d) | 386,000 | | 26,875 |
ConAgra Foods, Inc. | 347,800 | | 8,587 |
DE Master Blenders 1753 NV (a) | 821,500 | | 9,520 |
Green Mountain Coffee Roasters, Inc. (a)(d) | 3,782,299 | | 69,065 |
Kraft Foods, Inc. Class A | 678,200 | | 26,931 |
Mead Johnson Nutrition Co. Class A | 349,400 | | 25,492 |
The Hershey Co. | 1,014,500 | | 72,780 |
The J.M. Smucker Co. | 193,900 | | 14,892 |
| | 254,680 |
Household Products - 1.7% |
Colgate-Palmolive Co. | 500,300 | | 53,712 |
Kimberly-Clark Corp. | 1,046,600 | | 90,960 |
Common Stocks - continued |
| Shares | | Value (000s) |
CONSUMER STAPLES - continued |
Household Products - continued |
Procter & Gamble Co. | 1,337,400 | | $ 86,316 |
Reckitt Benckiser Group PLC | 275,100 | | 15,126 |
| | 246,114 |
Personal Products - 0.4% |
Herbalife Ltd. | 1,137,731 | | 62,450 |
Tobacco - 2.8% |
Altria Group, Inc. | 1,873,900 | | 67,404 |
British American Tobacco PLC (United Kingdom) | 146,800 | | 7,797 |
Lorillard, Inc. | 772,000 | | 99,310 |
Philip Morris International, Inc. | 2,640,600 | | 241,456 |
Souza Cruz SA | 202,200 | | 2,852 |
| | 418,819 |
TOTAL CONSUMER STAPLES | | 2,094,765 |
ENERGY - 5.5% |
Energy Equipment & Services - 2.0% |
Atwood Oceanics, Inc. (a) | 128,800 | | 5,735 |
Ensco PLC Class A | 270,400 | | 14,691 |
Halliburton Co. | 493,200 | | 16,340 |
National Oilwell Varco, Inc. | 1,343,500 | | 97,135 |
Schlumberger Ltd. | 1,886,000 | | 134,396 |
Seadrill Ltd. | 722,500 | | 28,026 |
| | 296,323 |
Oil, Gas & Consumable Fuels - 3.5% |
Anadarko Petroleum Corp. | 1,223,700 | | 84,974 |
Apache Corp. | 344,100 | | 29,634 |
Chevron Corp. | 794,500 | | 87,061 |
Concho Resources, Inc. (a) | 34,600 | | 2,950 |
EOG Resources, Inc. | 315,200 | | 30,893 |
Hess Corp. | 153,700 | | 7,248 |
Marathon Petroleum Corp. | 625,400 | | 29,581 |
Noble Energy, Inc. | 31,100 | | 2,719 |
Occidental Petroleum Corp. | 1,164,000 | | 101,303 |
Peabody Energy Corp. | 787,800 | | 16,449 |
Pioneer Natural Resources Co. | 438,300 | | 38,847 |
Plains Exploration & Production Co. (a) | 1,762,200 | | 70,418 |
Common Stocks - continued |
| Shares | | Value (000s) |
ENERGY - continued |
Oil, Gas & Consumable Fuels - continued |
SM Energy Co. | 439,000 | | $ 20,673 |
Valero Energy Corp. | 117,100 | | 3,220 |
| | 525,970 |
TOTAL ENERGY | | 822,293 |
FINANCIALS - 1.9% |
Capital Markets - 0.4% |
KKR & Co. LP | 623,200 | | 8,719 |
Morgan Stanley | 3,653,912 | | 49,912 |
| | 58,631 |
Commercial Banks - 0.2% |
ICICI Bank Ltd. | 666,777 | | 11,486 |
Wells Fargo & Co. | 366,800 | | 12,402 |
| | 23,888 |
Consumer Finance - 0.3% |
Discover Financial Services | 1,163,600 | | 41,843 |
Diversified Financial Services - 0.9% |
Citigroup, Inc. | 3,352,420 | | 90,951 |
JPMorgan Chase & Co. | 1,283,400 | | 46,202 |
| | 137,153 |
Real Estate Management & Development - 0.1% |
Parsvnath Developers Ltd. (a)(e) | 21,771,340 | | 15,302 |
TOTAL FINANCIALS | | 276,817 |
HEALTH CARE - 9.3% |
Biotechnology - 4.5% |
Alexion Pharmaceuticals, Inc. (a) | 665,000 | | 69,725 |
Alkermes PLC (a) | 917,100 | | 17,049 |
Alnylam Pharmaceuticals, Inc. (a) | 324,500 | | 6,065 |
Amgen, Inc. | 346,300 | | 28,604 |
ARIAD Pharmaceuticals, Inc. (a) | 1,698,200 | | 32,487 |
Biogen Idec, Inc. (a) | 894,800 | | 130,489 |
BioMarin Pharmaceutical, Inc. (a) | 107,500 | | 4,224 |
Clovis Oncology, Inc. | 195,300 | | 3,455 |
Exelixis, Inc. (a) | 3,425,500 | | 21,409 |
Gilead Sciences, Inc. (a) | 2,463,300 | | 133,831 |
Grifols SA (a) | 95,600 | | 2,981 |
Grifols SA ADR | 38,200 | | 853 |
Common Stocks - continued |
| Shares | | Value (000s) |
HEALTH CARE - continued |
Biotechnology - continued |
Ironwood Pharmaceuticals, Inc. Class A (a) | 473,000 | | $ 6,088 |
Medivation, Inc. (a) | 149,500 | | 14,905 |
Merrimack Pharmaceuticals, Inc. | 265,000 | | 2,112 |
Merrimack Pharmaceuticals, Inc. (f) | 2,142,858 | | 15,371 |
ONYX Pharmaceuticals, Inc. (a) | 256,300 | | 19,215 |
Regeneron Pharmaceuticals, Inc. (a) | 297,100 | | 40,005 |
Spectrum Pharmaceuticals, Inc. (a)(d) | 1,347,100 | | 18,846 |
Theravance, Inc. (a) | 437,314 | | 12,739 |
Vertex Pharmaceuticals, Inc. (a) | 1,669,800 | | 81,002 |
ZIOPHARM Oncology, Inc. (a) | 721,728 | | 4,063 |
| | 665,518 |
Health Care Equipment & Supplies - 1.0% |
Align Technology, Inc. (a) | 919,500 | | 31,226 |
Baxter International, Inc. | 132,600 | | 7,758 |
Covidien PLC | 215,000 | | 12,014 |
Insulet Corp. (a) | 310,600 | | 6,075 |
Intuitive Surgical, Inc. (a) | 44,400 | | 21,379 |
The Cooper Companies, Inc. | 730,272 | | 54,960 |
William Demant Holding A/S (a) | 126,000 | | 11,906 |
| | 145,318 |
Health Care Providers & Services - 1.2% |
Apollo Hospitals Enterprise Ltd. | 649,448 | | 7,366 |
Catamaran Corp. (a) | 102,300 | | 8,689 |
Express Scripts Holding Co. (a) | 2,168,727 | | 125,656 |
McKesson Corp. | 479,144 | | 43,473 |
| | 185,184 |
Health Care Technology - 0.1% |
athenahealth, Inc. (a)(d) | 154,575 | | 14,144 |
Pharmaceuticals - 2.5% |
Abbott Laboratories | 244,100 | | 16,186 |
Allergan, Inc. | 126,100 | | 10,349 |
AVANIR Pharmaceuticals Class A (a) | 2,885,556 | | 8,253 |
Bristol-Myers Squibb Co. | 2,435,100 | | 86,690 |
Elan Corp. PLC sponsored ADR (a) | 2,445,600 | | 28,247 |
Eli Lilly & Co. | 375,600 | | 16,538 |
Johnson & Johnson | 930,440 | | 64,405 |
Merck & Co., Inc. | 101,200 | | 4,470 |
Pfizer, Inc. | 1,839,600 | | 44,224 |
Questcor Pharmaceuticals, Inc. (a)(d) | 457,619 | | 16,872 |
Common Stocks - continued |
| Shares | | Value (000s) |
HEALTH CARE - continued |
Pharmaceuticals - continued |
Salix Pharmaceuticals Ltd. (a) | 446,500 | | $ 20,012 |
Valeant Pharmaceuticals International, Inc. (Canada) (a) | 1,073,200 | | 51,153 |
| | 367,399 |
TOTAL HEALTH CARE | | 1,377,563 |
INDUSTRIALS - 8.5% |
Aerospace & Defense - 2.8% |
Honeywell International, Inc. | 762,700 | | 44,275 |
Precision Castparts Corp. | 594,500 | | 92,480 |
The Boeing Co. | 2,057,200 | | 152,048 |
United Technologies Corp. | 1,767,400 | | 131,565 |
| | 420,368 |
Air Freight & Logistics - 0.8% |
United Parcel Service, Inc. Class B | 1,591,000 | | 120,296 |
Airlines - 0.3% |
United Continental Holdings, Inc. (a) | 2,038,600 | | 38,509 |
Building Products - 0.3% |
Armstrong World Industries, Inc. | 692,100 | | 26,750 |
Owens Corning (a) | 347,800 | | 9,342 |
| | 36,092 |
Commercial Services & Supplies - 0.0% |
Swisher Hygiene, Inc. (a) | 2,095,491 | | 3,790 |
Construction & Engineering - 0.2% |
Foster Wheeler AG (a) | 250,000 | | 4,510 |
Quanta Services, Inc. (a) | 961,400 | | 22,103 |
| | 26,613 |
Industrial Conglomerates - 1.2% |
Carlisle Companies, Inc. | 290,500 | | 14,667 |
Danaher Corp. | 2,579,900 | | 136,245 |
General Electric Co. | 1,505,100 | | 31,231 |
| | 182,143 |
Machinery - 1.8% |
Caterpillar, Inc. | 794,100 | | 66,871 |
Cummins, Inc. | 497,000 | | 47,662 |
Illinois Tool Works, Inc. | 256,300 | | 13,927 |
Ingersoll-Rand PLC | 1,293,700 | | 54,866 |
Common Stocks - continued |
| Shares | | Value (000s) |
INDUSTRIALS - continued |
Machinery - continued |
Joy Global, Inc. | 1,506,700 | | $ 78,258 |
Manitowoc Co., Inc. | 693,700 | | 8,324 |
| | 269,908 |
Professional Services - 0.1% |
Qualicorp SA (a) | 836,000 | | 7,445 |
Road & Rail - 0.9% |
Canadian Pacific | 390,000 | | 31,699 |
Norfolk Southern Corp. | 60,500 | | 4,480 |
Union Pacific Corp. | 787,000 | | 96,494 |
| | 132,673 |
Trading Companies & Distributors - 0.1% |
H&E Equipment Services, Inc. (a) | 463,290 | | 6,542 |
Mills Estruturas e Servicos de Engenharia SA | 827,400 | | 11,156 |
| | 17,698 |
TOTAL INDUSTRIALS | | 1,255,535 |
INFORMATION TECHNOLOGY - 36.8% |
Communications Equipment - 2.5% |
Finisar Corp. (a) | 613,500 | | 7,626 |
Juniper Networks, Inc. (a) | 1,887,500 | | 33,088 |
Motorola Solutions, Inc. | 208,700 | | 10,089 |
Palo Alto Networks, Inc. | 18,300 | | 1,046 |
QUALCOMM, Inc. | 5,298,100 | | 316,191 |
| | 368,040 |
Computers & Peripherals - 11.5% |
Apple, Inc. | 2,533,200 | | 1,547,175 |
EMC Corp. (a) | 2,121,200 | | 55,597 |
Fusion-io, Inc. (a) | 692,400 | | 13,239 |
Gemalto NV | 363,932 | | 27,892 |
NetApp, Inc. (a) | 1,903,000 | | 62,171 |
| | 1,706,074 |
Internet Software & Services - 7.9% |
Akamai Technologies, Inc. (a) | 1,556,600 | | 54,761 |
Baidu.com, Inc. sponsored ADR (a) | 386,000 | | 46,521 |
Dropbox, Inc. (f) | 1,003,814 | | 9,084 |
eBay, Inc. (a) | 2,122,700 | | 94,036 |
Facebook, Inc.: | | | |
Class A (d) | 1,256,300 | | 27,274 |
Common Stocks - continued |
| Shares | | Value (000s) |
INFORMATION TECHNOLOGY - continued |
Internet Software & Services - continued |
Facebook, Inc.: - continued | | | |
Class B (a)(f) | 636,167 | | $ 12,430 |
Google, Inc. Class A (a) | 1,255,867 | | 794,926 |
IAC/InterActiveCorp | 587,700 | | 30,919 |
LinkedIn Corp. (a) | 151,100 | | 15,510 |
SINA Corp. (a)(d) | 393,992 | | 17,891 |
Tencent Holdings Ltd. | 496,000 | | 14,826 |
Yahoo!, Inc. (a) | 3,051,200 | | 48,331 |
| | 1,166,509 |
IT Services - 3.2% |
Cognizant Technology Solutions Corp. Class A (a) | 1,643,500 | | 93,301 |
EPAM Systems, Inc. | 303,400 | | 4,867 |
IBM Corp. | 36,100 | | 7,075 |
MasterCard, Inc. Class A | 457,200 | | 199,600 |
Maximus, Inc. | 96,200 | | 4,858 |
Teradata Corp. (a) | 269,100 | | 18,197 |
The Western Union Co. | 433,100 | | 7,549 |
Visa, Inc. Class A | 1,103,500 | | 142,429 |
| | 477,876 |
Semiconductors & Semiconductor Equipment - 5.7% |
Altera Corp. | 2,107,500 | | 74,711 |
ASML Holding NV | 227,100 | | 13,058 |
Avago Technologies Ltd. | 2,168,600 | | 80,238 |
Broadcom Corp. Class A | 6,636,700 | | 224,851 |
Cirrus Logic, Inc. (a) | 1,162,528 | | 42,746 |
Cree, Inc. (a) | 768,200 | | 18,398 |
Freescale Semiconductor Holdings I Ltd. (a) | 5,697,958 | | 60,797 |
Mellanox Technologies Ltd. (a) | 380,700 | | 39,920 |
NVIDIA Corp. (a) | 7,619,673 | | 103,170 |
NXP Semiconductors NV (a) | 7,331,835 | | 165,626 |
Samsung Electronics Co. Ltd. | 7,550 | | 8,741 |
Skyworks Solutions, Inc. (a) | 516,400 | | 14,939 |
| | 847,195 |
Software - 6.0% |
Activision Blizzard, Inc. | 2,939,000 | | 35,356 |
Check Point Software Technologies Ltd. (a) | 1,030,400 | | 50,047 |
Citrix Systems, Inc. (a) | 1,550,100 | | 112,661 |
Guidewire Software, Inc. | 248,300 | | 6,371 |
Informatica Corp. (a) | 437,700 | | 12,917 |
Jive Software, Inc. | 533,500 | | 10,686 |
Common Stocks - continued |
| Shares | | Value (000s) |
INFORMATION TECHNOLOGY - continued |
Software - continued |
Microsoft Corp. | 9,327,700 | | $ 274,887 |
Oracle Corp. | 2,392,100 | | 72,241 |
QLIK Technologies, Inc. (a) | 767,063 | | 15,341 |
Red Hat, Inc. (a) | 1,020,700 | | 54,771 |
salesforce.com, Inc. (a) | 1,341,665 | | 166,849 |
ServiceNow, Inc. | 36,400 | | 983 |
Splunk, Inc. (d) | 196,000 | | 5,762 |
VMware, Inc. Class A (a) | 771,500 | | 70,021 |
| | 888,893 |
TOTAL INFORMATION TECHNOLOGY | | 5,454,587 |
MATERIALS - 2.4% |
Chemicals - 2.2% |
Albemarle Corp. | 856,400 | | 49,860 |
CF Industries Holdings, Inc. | 178,000 | | 34,845 |
E.I. du Pont de Nemours & Co. | 1,225,400 | | 60,902 |
Eastman Chemical Co. | 169,100 | | 8,841 |
LyondellBasell Industries NV Class A | 1,211,700 | | 53,957 |
Monsanto Co. | 763,800 | | 65,397 |
PetroLogistics LP | 883,200 | | 10,916 |
Sherwin-Williams Co. | 165,000 | | 22,168 |
Westlake Chemical Corp. (d) | 417,500 | | 24,783 |
| | 331,669 |
Containers & Packaging - 0.2% |
Rock-Tenn Co. Class A | 439,500 | | 25,588 |
TOTAL MATERIALS | | 357,257 |
TELECOMMUNICATION SERVICES - 0.2% |
Wireless Telecommunication Services - 0.2% |
Sprint Nextel Corp. (a) | 3,330,000 | | 14,519 |
Vodafone Group PLC sponsored ADR | 407,300 | | 11,710 |
| | 26,229 |
TOTAL COMMON STOCKS (Cost $11,025,400) |
14,721,702
|
Nonconvertible Preferred Stocks - 0.5% |
| Shares | | Value (000s) |
CONSUMER DISCRETIONARY - 0.5% |
Automobiles - 0.5% |
Volkswagen AG | 469,300 | | $ 80,262 |
TOTAL NONCONVERTIBLE PREFERRED STOCKS (Cost $52,053) |
80,262
|
Money Market Funds - 1.3% |
| | | |
Fidelity Cash Central Fund, 0.17% (b) | 12,339,372 | | 12,339 |
Fidelity Securities Lending Cash Central Fund, 0.18% (b)(c) | 173,924,939 | | 173,925 |
TOTAL MONEY MARKET FUNDS (Cost $186,264) |
186,264
|
TOTAL INVESTMENT PORTFOLIO - 101.1% (Cost $11,263,717) | | 14,988,228 |
NET OTHER ASSETS (LIABILITIES) - (1.1)% | | (168,514) |
NET ASSETS - 100% | $ 14,819,714 |
Legend |
(a) Non-income producing |
(b) Affiliated fund that is available only to investment companies and other accounts managed by Fidelity Investments. The rate quoted is the annualized seven-day yield of the fund at period end. A complete unaudited listing of the fund's holdings as of its most recent quarter end is available upon request. In addition, each Fidelity Central Fund's financial statements, which are not covered by the Fund's Report of Independent Registered Public Accounting Firm, are available on the SEC's website or upon request. |
(c) Investment made with cash collateral received from securities on loan. |
(d) Security or a portion of the security is on loan at period end. |
(e) Affiliated company |
(f) Restricted securities - Investment in securities not registered under the Securities Act of 1933 (excluding 144A issues). At the end of the period, the value of restricted securities (excluding 144A issues) amounted to $36,885,000 or 0.2% of net assets. |
Additional information on each restricted holding is as follows: |
Security | Acquisition Date | Acquisition
Cost (000s) |
Dropbox, Inc. | 5/2/12 | $ 9,084 |
Facebook, Inc. Class B | 3/31/11 - 5/19/11 | $ 15,909 |
Merrimack Pharmaceuticals, Inc. | 3/31/11 | $ 15,000 |
Affiliated Central Funds |
Information regarding fiscal year to date income earned by the Fund from investments in Fidelity Central Funds is as follows: |
Fund | Income earned
(Amounts in thousands) |
Fidelity Cash Central Fund | $ 55 |
Fidelity Securities Lending Cash Central Fund | 3,357 |
Total | $ 3,412 |
Other Affiliated Issuers |
An affiliated company is a company in which the Fund has ownership of at least 5% of the voting securities. Fiscal year to date transactions with companies which are or were affiliates are as follows: |
Affiliate
(Amounts in thousands) | Value, beginning of period | Purchases | Sales Proceeds | Dividend Income | Value,
end of
period |
Parsvnath Developers Ltd. | $ 22,924 | $ - | $ - | $ - | $ 15,302 |
Spectrum Pharmaceuticals, Inc. | - | 42,886 | 19,181 | - | - |
Total | $ 22,924 | $ 42,886 | $ 19,181 | $ - | $ 15,302 |
Other Information |
The following is a summary of the inputs used, as of July 31, 2012, involving the Fund's assets and liabilities carried at fair value. The inputs or methodology used for valuing securities may not be an indication of the risk associated with investing in those securities. For more information on valuation inputs, and their aggregation into the levels used in the table below, please refer to the Security Valuation section in the accompanying Notes to Financial Statements. |
Valuation Inputs at Reporting Date: |
Description
(Amounts in thousands) | Total | Level 1 | Level 2 | Level 3 |
Investments in Securities: | | | | |
Equities: | | | | |
Consumer Discretionary | $ 3,136,918 | $ 3,136,918 | $ - | $ - |
Consumer Staples | 2,094,765 | 2,060,093 | 34,672 | - |
Energy | 822,293 | 822,293 | - | - |
Financials | 276,817 | 265,331 | 11,486 | - |
Health Care | 1,377,563 | 1,362,192 | 15,371 | - |
Industrials | 1,255,535 | 1,251,745 | 3,790 | - |
Information Technology | 5,454,587 | 5,433,073 | 12,430 | 9,084 |
Materials | 357,257 | 357,257 | - | - |
Telecommunication Services | 26,229 | 26,229 | - | - |
Money Market Funds | 186,264 | 186,264 | - | - |
Total Investments in Securities: | $ 14,988,228 | $ 14,901,395 | $ 77,749 | $ 9,084 |
See accompanying notes which are an integral part of the financial statements.
Annual Report
Statement of Assets and Liabilities
Amounts in thousands (except per-share amounts) | July 31, 2012 |
| | |
Assets | | |
Investment in securities, at value (including securities loaned of $165,637) - See accompanying schedule: Unaffiliated issuers (cost $11,046,602) | $ 14,786,662 | |
Fidelity Central Funds (cost $186,264) | 186,264 | |
Other affiliated issuers (cost $30,851) | 15,302 | |
Total Investments (cost $11,263,717) | | $ 14,988,228 |
Foreign currency held at value (cost $2,675) | | 2,675 |
Receivable for investments sold | | 203,022 |
Receivable for fund shares sold | | 32,067 |
Dividends receivable | | 3,803 |
Distributions receivable from Fidelity Central Funds | | 286 |
Other receivables | | 749 |
Total assets | | 15,230,830 |
| | |
Liabilities | | |
Payable to custodian bank | $ 6 | |
Payable for investments purchased | 187,368 | |
Payable for fund shares redeemed | 40,039 | |
Accrued management fee | 7,123 | |
Other affiliated payables | 2,028 | |
Other payables and accrued expenses | 627 | |
Collateral on securities loaned, at value | 173,925 | |
Total liabilities | | 411,116 |
| | |
Net Assets | | $ 14,819,714 |
Net Assets consist of: | | |
Paid in capital | | $ 11,168,136 |
Undistributed net investment income | | 10,385 |
Accumulated undistributed net realized gain (loss) on investments and foreign currency transactions | | (83,290) |
Net unrealized appreciation (depreciation) on investments and assets and liabilities in foreign currencies | | 3,724,483 |
Net Assets | | $ 14,819,714 |
See accompanying notes which are an integral part of the financial statements.
Annual Report
Financial Statements - continued
Statement of Assets and Liabilities - continued
Amounts in thousands (except per-share amounts) | July 31, 2012 |
| | |
Blue Chip Growth:
Net Asset Value, offering price and redemption price per share ($10,595,343 ÷ 223,607 shares) | | $ 47.38 |
| | |
Class K:
Net Asset Value, offering price and redemption price per share ($2,467,455 ÷ 51,991 shares) | | $ 47.46 |
| | |
Class F:
Net Asset Value, offering price and redemption price per share ($1,756,916 ÷ 36,980 shares) | | $ 47.51 |
See accompanying notes which are an integral part of the financial statements.
Annual Report
Statement of Operations
Amounts in thousands | Year ended July 31, 2012 |
| | |
Investment Income | | |
Dividends | | $ 150,681 |
Interest | | 1 |
Income from Fidelity Central Funds | | 3,412 |
Total income | | 154,094 |
| | |
Expenses | | |
Management fee
Basic fee | $ 77,977 | |
Performance adjustment | 15,095 | |
Transfer agent fees | 23,533 | |
Accounting and security lending fees | 1,491 | |
Custodian fees and expenses | 585 | |
Independent trustees' compensation | 94 | |
Registration fees | 252 | |
Audit | 101 | |
Legal | 53 | |
Interest | 6 | |
Miscellaneous | 142 | |
Total expenses before reductions | 119,329 | |
Expense reductions | (618) | 118,711 |
Net investment income (loss) | | 35,383 |
Realized and Unrealized Gain (Loss) Net realized gain (loss) on: | | |
Investment securities: | | |
Unaffiliated issuers | (32,788) | |
Other affiliated issuers | (4,301) | |
Foreign currency transactions | (342) | |
Total net realized gain (loss) | | (37,431) |
Change in net unrealized appreciation (depreciation) on: Investment securities | 271,818 | |
Assets and liabilities in foreign currencies | (29) | |
Total change in net unrealized appreciation (depreciation) | | 271,789 |
Net gain (loss) | | 234,358 |
Net increase (decrease) in net assets resulting from operations | | $ 269,741 |
See accompanying notes which are an integral part of the financial statements.
Annual Report
Financial Statements - continued
Statement of Changes in Net Assets
Amounts in thousands | Year ended
July 31,
2012 | Year ended
July 31,
2011 |
Increase (Decrease) in Net Assets | | |
Operations | | |
Net investment income (loss) | $ 35,383 | $ (4,517) |
Net realized gain (loss) | (37,431) | 1,562,158 |
Change in net unrealized appreciation (depreciation) | 271,789 | 1,651,657 |
Net increase (decrease) in net assets resulting
from operations | 269,741 | 3,209,298 |
Distributions to shareholders from net investment income | (15,666) | (2,405) |
Distributions to shareholders from net realized gain | (480,841) | (12,451) |
Total distributions | (496,507) | (14,856) |
Share transactions - net increase (decrease) | 656,032 | (352,214) |
Total increase (decrease) in net assets | 429,266 | 2,842,228 |
| | |
Net Assets | | |
Beginning of period | 14,390,448 | 11,548,220 |
End of period (including undistributed net investment income of $10,385 and accumulated net investment loss of $7,667, respectively) | $ 14,819,714 | $ 14,390,448 |
See accompanying notes which are an integral part of the financial statements.
Annual Report
Financial Highlights - Blue Chip Growth
Years ended July 31, | 2012 | 2011 | 2010 | 2009 | 2008 |
Selected Per-Share Data | | | | | |
Net asset value, beginning of period | $ 48.17 | $ 37.63 | $ 31.97 | $ 39.06 | $ 46.88 |
Income from Investment Operations | | | | | |
Net investment income (loss) B | .10 | (.03) | .04 | .27 | .35 |
Net realized and unrealized gain (loss) | .75 | 10.61 | 5.80 | (6.36) | (2.89) |
Total from investment operations | .85 | 10.58 | 5.84 | (6.09) | (2.54) |
Distributions from net investment income | (.04) | (.00) F, G | (.18) | (.29) | (.33) |
Distributions from net realized gain | (1.60) | (.04) F | - | (.71) | (4.95) |
Total distributions | (1.64) | (.04) | (.18) | (1.00) | (5.28) |
Net asset value, end of period | $ 47.38 | $ 48.17 | $ 37.63 | $ 31.97 | $ 39.06 |
Total Return A | 2.27% | 28.12% | 18.29% | (15.85)% | (6.30)% |
Ratios to Average Net Assets C, E | | | | | |
Expenses before reductions | .90% | .94% | .94% | .76% | .58% |
Expenses net of fee waivers, if any | .90% | .94% | .94% | .76% | .58% |
Expenses net of all reductions | .89% | .92% | .93% | .76% | .57% |
Net investment income (loss) | .21% | (.06)% | .10% | .93% | .81% |
Supplemental Data | | | | | |
Net assets, end of period (in millions) | $ 10,595 | $ 12,024 | $ 10,295 | $ 9,691 | $ 13,349 |
Portfolio turnover rate D | 95% | 132% | 135% | 134% | 82% |
A Total returns would have been lower if certain expenses had not been reduced during the applicable periods shown.
B Calculated based on average shares outstanding during the period.
C Fees and expenses of any underlying Fidelity Central Funds are not included in the Fund's expense ratio. The Fund indirectly bears its proportionate share of the expenses of any underlying Fidelity Central Funds.
D Amount does not include the portfolio activity of any underlying Fidelity Central Funds.
E Expense ratios reflect operating expenses of the class. Expenses before reductions do not reflect amounts reimbursed by the investment adviser or reductions from brokerage service arrangements or reductions from other expense offset arrangements and do not represent the amount paid by the class during periods when reimbursements or reductions occur. Expenses net of fee waivers reflect expenses after reimbursement by the investment adviser but prior to reductions from brokerage service arrangements or other expense offset arrangements. Expenses net of all reductions represent the net expenses paid by the class.
F The amount shown reflects certain reclassifications related to book to tax differences.
G Amount represents less than $.01 per share.
See accompanying notes which are an integral part of the financial statements.
Annual Report
Financial Highlights - Class K
Years ended July 31, | 2012 | 2011 | 2010 | 2009 | 2008 G |
Selected Per-Share Data | | | | | |
Net asset value, beginning of period | $ 48.21 | $ 37.66 | $ 32.01 | $ 39.07 | $ 41.81 |
Income from Investment Operations | | | | | |
Net investment income (loss) D | .17 | .05 | .11 | .32 | .10 |
Net realized and unrealized gain (loss) | .75 | 10.62 | 5.79 | (6.33) | (2.84) |
Total from investment operations | .92 | 10.67 | 5.90 | (6.01) | (2.74) |
Distributions from net investment income | (.08) | (.05) I | (.25) | (.34) | - |
Distributions from net realized gain | (1.60) | (.07) I | - | (.71) | - |
Total distributions | (1.67) J | (.12) | (.25) | (1.05) | - |
Net asset value, end of period | $ 47.46 | $ 48.21 | $ 37.66 | $ 32.01 | $ 39.07 |
Total Return B, C | 2.43% | 28.37% | 18.48% | (15.61)% | (6.55)% |
Ratios to Average Net Assets E, H | | | | | |
Expenses before reductions | .74% | .77% | .75% | .53% | .41% A |
Expenses net of fee waivers, if any | .74% | .77% | .75% | .53% | .41% A |
Expenses net of all reductions | .73% | .76% | .74% | .52% | .41% A |
Net investment income (loss) | .37% | .11% | .30% | 1.16% | 1.09% A |
Supplemental Data | | | | | |
Net assets, end of period (000 omitted) | $ 2,467,455 | $ 1,454,854 | $ 931,601 | $ 590,673 | $ 93 |
Portfolio turnover rate F | 95% | 132% | 135% | 134% | 82% |
A Annualized
B Total returns for periods of less than one year are not annualized.
C Total returns would have been lower if certain expenses had not been reduced during the applicable periods shown.
D Calculated based on average shares outstanding during the period.
E Fees and expenses of any underlying Fidelity Central Funds are not included in the Fund's expense ratio. The Fund indirectly bears its proportionate share of the expenses of any underlying Fidelity Central Funds.
F Amount does not include the portfolio activity of any underlying Fidelity Central Funds.
G For the period May 9, 2008 (commencement of sale of shares) to July 31, 2008.
H Expense ratios reflect operating expenses of the class. Expenses before reductions do not reflect amounts reimbursed by the investment adviser or reductions from brokerage service arrangements or reductions from other expense offset arrangements and do not represent the amount paid by the class during periods when reimbursements or reductions occur. Expense ratios before reductions for start-up periods may not be representative of longer-term operating periods. Expenses net of fee waivers reflect expenses after reimbursement by the investment adviser but prior to reductions from brokerage service arrangements or other expense offset arrangements. Expenses net of all reductions represent the net expenses paid by the class.
I The amount shown reflects certain reclassifications related to book to tax differences.
J Total distributions of $1.67 per share is comprised of distributions from net investment income of $.076 and distributions from net realized gain of $1.598 per share.
See accompanying notes which are an integral part of the financial statements.
Annual Report
Financial Highlights - Class F
Years ended July 31, | 2012 | 2011 | 2010 | 2009 G |
Selected Per-Share Data | | | | |
Net asset value, beginning of period | $ 48.24 | $ 37.69 | $ 31.98 | $ 29.16 |
Income from Investment Operations | | | | |
Net investment income (loss) D | .19 | .07 | .13 | - I |
Net realized and unrealized gain (loss) | .76 | 10.61 | 5.80 | 2.82 |
Total from investment operations | .95 | 10.68 | 5.93 | 2.82 |
Distributions from net investment income | (.08) | (.06) J | (.22) | - |
Distributions from net realized gain | (1.60) | (.08) J | - | - |
Total distributions | (1.68) | (.13) K | (.22) | - |
Net asset value, end of period | $ 47.51 | $ 48.24 | $ 37.69 | $ 31.98 |
Total Return B, C | 2.49% | 28.41% | 18.59% | 9.67% |
Ratios to Average Net Assets E, H | | | | |
Expenses before reductions | .69% | .72% | .70% | .51% A |
Expenses net of fee waivers, if any | .69% | .72% | .70% | .51% A |
Expenses net of all reductions | .68% | .71% | .68% | .51% A |
Net investment income (loss) | .42% | .16% | .35% | (.05)% A |
Supplemental Data | | | | |
Net assets, end of period (000 omitted) | $ 1,756,916 | $ 911,556 | $ 321,409 | $ 261 |
Portfolio turnover rate F | 95% | 132% | 135% | 134% |
A Annualized
B Total returns for periods of less than one year are not annualized.
C Total returns would have been lower if certain expenses had not been reduced during the applicable periods shown.
D Calculated based on average shares outstanding during the period.
E Fees and expenses of any underlying Fidelity Central Funds are not included in the Fund's expense ratio. The Fund indirectly bears its proportionate share of the expenses of any underlying Fidelity Central Funds.
F Amount does not include the portfolio activity of any underlying Fidelity Central Funds.
G For the period June 26, 2009 (commencement of sale of shares) to July 31, 2009.
H Expense ratios reflect operating expenses of the class. Expenses before reductions do not reflect amounts reimbursed by the investment adviser or reductions from brokerage service arrangements or reductions from other expense offset arrangements and do not represent the amount paid by the class during periods when reimbursements or reductions occur. Expense ratios before reductions for start-up periods may not be representative of longer-term operating periods. Expenses net of fee waivers reflect expenses after reimbursement by the investment adviser but prior to reductions from brokerage service arrangements or other expense offset arrangements. Expenses net of all reductions represent the net expenses paid by the class.
I Amount represents less than $.01 per share.
J The amount shown reflects certain reclassifications related to book to tax differences.
K Total distributions of $.13 per share is comprised of distributions from net investment income of $.058 and distributions from net realized gain of $.076 per share.
See accompanying notes which are an integral part of the financial statements.
Annual Report
Notes to Financial Statements
For the period ended July 31, 2012
(Amounts in thousands except percentages)
1. Organization.
Fidelity® Blue Chip Growth Fund (the Fund) is a fund of Fidelity Securities Fund (the Trust) and is authorized to issue an unlimited number of shares. The Trust is registered under the Investment Company Act of 1940, as amended (the 1940 Act), as an open-end management investment company organized as a Massachusetts business trust. The Fund offers Blue Chip Growth, Class K and Class F shares, each of which has equal rights as to assets and voting privileges. Each class has exclusive voting rights with respect to matters that affect that class. Class F shares of the Fund are only available for purchase by mutual funds for which Fidelity Management & Research Company (FMR) or an affiliate serves as investment manager. Investment income, realized and unrealized capital gains and losses, the common expenses of the Fund, and certain fund-level expense reductions, if any, are allocated on a pro-rata basis to each class based on the relative net assets of each class to the total net assets of the Fund. Each class differs with respect to transfer agent fees incurred. Certain expense reductions may also differ by class.
2. Investments in Fidelity Central Funds.
The Fund invests in Fidelity Central Funds, which are open-end investment companies available only to other investment companies and accounts managed by FMR and its affiliates. The Fund's Schedule of Investments lists each of the Fidelity Central Funds held as of period end, if any, as an investment of the Fund, but does not include the underlying holdings of each Fidelity Central Fund. As an Investing Fund, the Fund indirectly bears its proportionate share of the expenses of the underlying Fidelity Central Funds.
The Money Market Central Funds seek preservation of capital and current income and are managed by Fidelity Investments Money Management, Inc. (FIMM), an affiliate of FMR.
A complete unaudited list of holdings for each Fidelity Central Fund is available upon request or at the Securities and Exchange Commission (the SEC) web site at www.sec.gov. In addition, the financial statements of the Fidelity Central Funds, which are not covered by the Fund's Report of Independent Registered Public Accounting Firm, are available on the SEC web site or upon request.
3. Significant Accounting Policies.
The financial statements have been prepared in conformity with accounting principles generally accepted in the United States of America (GAAP), which require management to make certain estimates and assumptions at the date of the financial statements. Actual results could differ from those estimates. Subsequent events, if any, through the date that the financial statements were issued have been evaluated in the preparation of the financial statements. The following summarizes the significant accounting policies of the Fund:
Annual Report
3. Significant Accounting Policies - continued
Security Valuation. Investments are valued as of 4:00 p.m. Eastern time on the last calendar day of the period. In accordance with valuation policies and procedures approved by the Board of Trustees (the Board), the Fund attempts to obtain prices from one or more third party pricing vendor or broker to value its investments. When current market prices, quotations or rates are not readily available or reliable, securities will be fair valued in good faith by the FMR Fair Value Committee (the Committee), in accordance with procedures adopted by the Fund's Board. Factors used in determining fair value vary by security type and may include market or security specific events. The frequency with which these procedures are used cannot be predicted and they may be utilized to a significant extent. The Committee oversees the Fund's valuation policies and procedures and is responsible for approving and reporting to the Board all fair value determinations.
The Fund categorizes the inputs to valuation techniques used to value its investments into a disclosure hierarchy consisting of three levels as shown below:
Level 1 - quoted prices in active markets for identical investments
Level 2 - other significant observable inputs (including quoted prices for similar investments, interest rates, prepayment speeds, etc.)
Level 3 - unobservable inputs (including the Fund's own assumptions based on the best information available)
Valuation techniques used to value the Fund's investments by major category are as follows:
Equity securities, including restricted securities, for which market quotations are readily available, are valued at the last reported sale price or official closing price as reported by a third party pricing vendor on the primary market or exchange on which they are traded and are categorized as Level 1 in the hierarchy. In the event there were no sales during the day or closing prices are not available, securities are valued at the last quoted bid price or may be valued using the last available price and are generally categorized as Level 2 in the hierarchy. For foreign equity securities, when significant market or security specific events arise, comparisons to the valuation of American Depositary Receipts (ADRs), futures contracts, Exchange-Traded Funds (ETFs) and certain indexes as well as quoted prices for similar securities are used and are categorized as Level 2 in the hierarchy. Utilizing these techniques may result in transfers between Level 1 and Level 2. For restricted equity securities and private placements where observable inputs are limited, assumptions about market activity and risk are used and these securities are categorized as Level 3 in the hierarchy.
Annual Report
Notes to Financial Statements - continued
(Amounts in thousands except percentages)
3. Significant Accounting Policies - continued
Security Valuation - continued
Investments in open-end mutual funds, including the Fidelity Central Funds, are valued at their closing net asset value each business day and are categorized as Level 1 in the hierarchy.
Changes in valuation techniques may result in transfers in or out of an assigned level within the disclosure hierarchy. The aggregate value of investments by input level, as of July 31, 2012, is included at the end of the Fund's Schedule of Investments.
Foreign Currency Translation. The Fund may use foreign currency contracts to facilitate transactions in foreign-denominated securities. Gains and losses from these transactions may arise from changes in the value of the foreign currency or if the counterparties do not perform under the contracts' terms.
Foreign-denominated assets, including investment securities, and liabilities are translated into U.S. dollars at the exchange rates at period end. Purchases and sales of investment securities, income and dividends received and expenses denominated in foreign currencies are translated into U.S. dollars at the exchange rate in effect on the transaction date.
The effects of exchange rate fluctuations on investments are included with the net realized and unrealized gain (loss) on investment securities. Other foreign currency transactions resulting in realized and unrealized gain (loss) are disclosed separately.
Investment Transactions and Income. For financial reporting purposes, the Fund's investment holdings and NAV include trades executed through the end of the last business day of the period. The NAV per share for processing shareholder transactions is calculated as of the close of business of the New York Stock Exchange (NYSE), normally 4:00 p.m. Eastern time and includes trades executed through the end of the prior business day. Gains and losses on securities sold are determined on the basis of identified cost and may include proceeds received from litigation. Dividend income is recorded on the ex-dividend date, except for certain dividends from foreign securities where the ex-dividend date may have passed, which are recorded as soon as the Fund is informed of the ex-dividend date. Non-cash dividends included in dividend income, if any, are recorded at the fair market value of the securities received. Distributions received on securities that represent a return of capital or capital gain are recorded as a reduction of cost of investments and/or as a realized gain. The Fund estimates the components of distributions received that may be considered return of capital distributions or capital gain distributions. Interest income and distributions from the Fidelity Central Funds are accrued as earned. Interest income includes coupon interest and amortization of premium and accretion of discount on debt securities. Investment income is recorded net of foreign taxes withheld where recovery of such taxes is uncertain.
Annual Report
3. Significant Accounting Policies - continued
Expenses. Expenses directly attributable to a fund are charged to that fund. Expenses attributable to more than one fund are allocated among the respective funds on the basis of relative net assets or other appropriate methods. Expense estimates are accrued in the period to which they relate and adjustments are made when actual amounts are known.
Deferred Trustee Compensation. Under a Deferred Compensation Plan (the Plan), independent Trustees may elect to defer receipt of a portion of their annual compensation. Deferred amounts are invested in a cross-section of Fidelity funds, are marked-to-market and remain in the Fund until distributed in accordance with the Plan. The investment of deferred amounts and the offsetting payable to the Trustees are included in the accompanying Statement of Assets and Liabilities.
Income Tax Information and Distributions to Shareholders. Each year, the Fund intends to qualify as a regulated investment company under Subchapter M of the Internal Revenue Code, including distributing substantially all of its taxable income and realized gains. As a result, no provision for income taxes is required. As of July 31, 2012, the Fund did not have any unrecognized tax benefits in the financial statements; nor is the Fund aware of any tax positions for which it is reasonably possible that the total amounts of unrecognized tax benefits will significantly change in the next twelve months. The Fund files a U.S. federal tax return, in addition to state and local tax returns as required. A fund's federal income tax returns are subject to examination by the Internal Revenue Service (IRS) for a period of three fiscal years after they are filed. State and local tax returns may be subject to examination for an additional fiscal year depending on the jurisdiction. Foreign taxes are provided for based on the Fund's understanding of the tax rules and rates that exist in the foreign markets in which it invests.
Distributions are declared and recorded on the ex-dividend date. Income dividends and capital gain distributions are declared separately for each class. Income and capital gain distributions are determined in accordance with income tax regulations, which may differ from GAAP. These differences resulted in distribution reclassifications. In addition, the Fund claimed a portion of the payment made to redeeming shareholders as a distribution for income tax purposes.
Capital accounts within the financial statements are adjusted for permanent book-tax differences. These adjustments have no impact on net assets or the results of operations. Temporary book-tax differences will reverse in a subsequent period.
Book-tax differences are primarily due to foreign currency transactions, passive foreign investment companies (PFIC), partnerships, deferred trustee compensation, capital loss carryforwards and losses deferred due to wash sales and excise tax regulations.
Annual Report
Notes to Financial Statements - continued
(Amounts in thousands except percentages)
3. Significant Accounting Policies - continued
Income Tax Information and Distributions to Shareholders - continued
The federal tax cost of investment securities and unrealized appreciation (depreciation) as of period end were as follows:
Gross unrealized appreciation | $ 4,132,802 |
Gross unrealized depreciation | (484,426) |
Net unrealized appreciation (depreciation) on securities and other investments | $ 3,648,376 |
| |
Tax Cost | $ 11,339,852 |
The tax-based components of distributable earnings as of period end were as follows:
Undistributed ordinary income | $ 10,887 |
Capital loss carryforward | $ (7,155) |
Net unrealized appreciation (depreciation) | $ 3,648,348 |
Capital loss carryforwards are only available to offset future capital gains of the Fund to the extent provided by regulations and may be limited. Under the Regulated Investment Company Modernization Act of 2010 (the Act), the Fund is permitted to carry forward capital losses incurred in taxable years beginning after December 22, 2010 for an unlimited period and such capital losses are required to be used prior to any losses that expire. Capital loss carryforwards were as follows:
Fiscal year of expiration | |
No expiration | |
Short-term | $ (7,155) |
The tax character of distributions paid was as follows:
| July 31, 2012 | July 31, 2011 |
Ordinary Income | $ 15,666 | $ 2,405 |
Long-term Capital Gains | 480,841 | 12,451 |
Total | $ 496,507 | $ 14,856 |
New Accounting Pronouncement. In December 2011, the Financial Accounting Standards Board issued Accounting Standard Update No. 2011-11, Disclosures about Offsetting Assets and Liabilities. The update creates new disclosure requirements requiring entities to disclose both gross and net information for derivatives and other financial instruments that are either offset in the Statement of Assets and Liabilities or
Annual Report
3. Significant Accounting Policies - continued
New Accounting Pronouncement - continued
subject to an enforceable master netting arrangement or similar agreement. The disclosure requirements are effective for interim and annual reporting periods beginning on or after January 1, 2013. Management is currently evaluating the impact of the update's adoption on the Fund's financial statement disclosures.
4. Operating Policies.
Restricted Securities. The Fund may invest in securities that are subject to legal or contractual restrictions on resale. These securities generally may be resold in transactions exempt from registration or to the public if the securities are registered. Disposal of these securities may involve time-consuming negotiations and expense, and prompt sale at an acceptable price may be difficult. Information regarding restricted securities is included at the end of the Fund's Schedule of Investments.
5. Purchases and Sales of Investments.
Purchases and sales of securities, other than short-term securities, aggregated $13,550,160 and $13,321,571, respectively.
6. Fees and Other Transactions with Affiliates.
Management Fee. FMR and its affiliates provide the Fund with investment management related services for which the Fund pays a monthly management fee. The management fee is the sum of an individual fund fee rate that is based on an annual rate of .30% of the Fund's average net assets and an annualized group fee rate that averaged .26% during the period. The group fee rate is based upon the average net assets of all the mutual funds advised by FMR. The group fee rate decreases as assets under management increase and increases as assets under management decrease. In addition, the management fee is subject to a performance adjustment (up to a maximum of ± .20% of the Fund's average net assets over a 36 month performance period). The upward or downward adjustment to the management fee is based on the relative investment performance of Blue Chip Growth as compared to an appropriate benchmark index. For the period, the total annual management fee rate, including the performance adjustment, was .67% of the Fund's average net assets.
Annual Report
Notes to Financial Statements - continued
(Amounts in thousands except percentages)
6. Fees and Other Transactions with Affiliates - continued
Transfer Agent Fees. Fidelity Investments Institutional Operations Company, Inc. (FIIOC), an affiliate of FMR, is the transfer, dividend disbursing and shareholder servicing agent for each class of the Fund. FIIOC receives account fees and asset-based fees that vary according to the account size and type of account of the shareholders of Blue Chip Growth FIIOC receives an asset-based fee of Class K's average net assets. FIIOC receives no fees for providing transfer agency services to Class F. FIIOC pays for typesetting, printing and mailing of shareholder reports, except proxy statements. For the period, transfer agent fees for each class were as follows:
| Amount | % of
Average
Net Assets |
Blue Chip Growth | $ 22,565 | .21 |
Class K | 968 | .05 |
| $ 23,533 | |
Accounting and Security Lending Fees. Fidelity Service Company, Inc. (FSC), an affiliate of FMR, maintains the Fund's accounting records. The accounting fee is based on the level of average net assets for each month. Under a separate contract, FSC administers the security lending program. The security lending fee is based on the number and duration of lending transactions.
Brokerage Commissions. The Fund placed a portion of its portfolio transactions with brokerage firms which are affiliates of the investment adviser. The commissions paid to these affiliated firms were $353 for the period.
Interfund Lending Program. Pursuant to an Exemptive Order issued by the SEC, the Fund, along with other registered investment companies having management contracts with FMR, may participate in an interfund lending program. This program provides an alternative credit facility allowing the funds to borrow from, or lend money to, other participating affiliated funds. The Fund's activity in this program during the period for which loans were outstanding was as follows:
Borrower or Lender | Average Loan
Balance | Weighted Average Interest Rate | Interest
Expense |
Borrower | $ 14,697 | .35% | $ 6 |
7. Committed Line of Credit.
The Fund participates with other funds managed by FMR or an affiliate in a $4.25 billion credit facility (the "line of credit") to be utilized for temporary or emergency purposes to fund shareholder redemptions or for other short-term liquidity purposes. The Fund has agreed to pay commitment fees on its pro-rata portion of the line of credit, which amounted to $39 and is reflected in Miscellaneous expenses on the Statement of Operations. During the period, there were no borrowings on this line of credit.
Annual Report
8. Security Lending.
The Fund lends portfolio securities through a lending agent from time to time in order to earn additional income. For equity securities, a lending agent is used and may loan securities to certain qualified borrowers, including Fidelity Capital Markets (FCM), a broker-dealer affiliated with the Fund. On the settlement date of the loan, the Fund receives collateral (in the form of U.S. Treasury obligations, letters of credit and/or cash) against the loaned securities and maintains collateral in an amount not less than 100% of the market value of the loaned securities during the period of the loan. The market value of the loaned securities is determined at the close of business of the Fund and any additional required collateral is delivered to the Fund on the next business day. If the borrower defaults on its obligation to return the securities loaned because of insolvency or other reasons, a fund could experience delays and costs in recovering the securities loaned or in gaining access to the collateral. Any cash collateral received is invested in the Fidelity Securities Lending Cash Central Fund. The value of loaned securities and cash collateral at period end are disclosed on the Fund's Statement of Assets and Liabilities. The value of securities loaned to FCM at period end was $3,016. Security lending income represents the income earned on investing cash collateral, less rebates paid to borrowers and any lending agent fees associated with the loan, plus any premium payments received for lending certain types of securities. Security lending income is presented in the Statement of Operations as a component of income from Fidelity Central Funds. Total security lending income during the period amounted to $3,357, including $95 from securities loaned to FCM.
9. Expense Reductions.
Many of the brokers with whom FMR places trades on behalf of the Fund provided services to the Fund in addition to trade execution. These services included payments of certain expenses on behalf of the Fund totaling $618 for the period.
10. Distributions to Shareholders.
Distributions to shareholders of each class were as follows:
Years ended July 31, | 2012 | 2011 |
From net investment income | | |
Blue Chip Growth | $ 10,644 | $ 670 |
Class K | 2,860 | 1,165 |
Class F | 2,162 | 570 |
Total | $ 15,666 | $ 2,405 |
From net realized gain | | |
Blue Chip Growth | $ 397,250 | $ 9,690 |
Class K | 51,295 | 1,750 |
Class F | 32,296 | 1,011 |
Total | $ 480,841 | $ 12,451 |
Annual Report
Notes to Financial Statements - continued
(Amounts in thousands except percentages)
11. Share Transactions.
Transactions for each class of shares were as follows:
| Shares | Dollars |
Years ended July 31, | 2012 | 2011 | 2012 | 2011 |
Blue Chip Growth | | | | |
Shares sold | 42,825 | 42,281 | $ 1,970,082 | $ 1,904,203 |
Reinvestment of distributions | 9,668 | 232 | 399,689 | 10,166 |
Shares redeemed | (78,498) | (66,514) | (3,530,347) | (2,974,498) |
Net increase (decrease) | (26,005) | (24,001) | $ (1,160,576) | $ (1,060,129) |
Class K | | | | |
Shares sold | 29,866 | 13,902 | $ 1,366,770 | $ 625,856 |
Reinvestment of distributions | 1,309 | 70 | 54,155 | 2,916 |
Shares redeemed | (9,363) | (8,528) | (426,597) | (379,087) |
Net increase (decrease) | 21,812 | 5,444 | $ 994,328 | $ 249,685 |
Class F | | | | |
Shares sold | 19,170 | 12,501 | $ 873,960 | $ 558,704 |
Reinvestment of distributions | 832 | 38 | 34,458 | 1,580 |
Shares redeemed | (1,918) | (2,171) | (86,138) | (102,054) |
Net increase (decrease) | 18,084 | 10,368 | $ 822,280 | $ 458,230 |
12. Other.
The Fund's organizational documents provide former and current trustees and officers with a limited indemnification against liabilities arising in connection with the performance of their duties to the Fund. In the normal course of business, the Fund may also enter into contracts that provide general indemnifications. The Fund's maximum exposure under these arrangements is unknown as this would be dependent on future claims that may be made against the Fund. The risk of material loss from such claims is considered remote.
At the end of the period, the Fidelity Adviser Freedom Funds, the Fidelity Freedom Funds and the Fidelity Freedom K Funds were the owners of record in the aggregate of approximately 25% of the total outstanding shares of the Fund.
Annual Report
To the Trustees of Fidelity Securities Fund and Shareholders of Fidelity Blue Chip Growth Fund:
We have audited the accompanying statement of assets and liabilities of Fidelity Blue Chip Growth Fund (the Fund), a fund of Fidelity Securities Fund, including the schedule of investments, as of July 31, 2012, and the related statement of operations for the year then ended, the statement of changes in net assets for each of the two years in the period then ended, and the financial highlights for each of the five years in the period then ended. These financial statements and financial highlights are the responsibility of the Fund's management. Our responsibility is to express an opinion on these financial statements and financial highlights based on our audits.
We conducted our audits in accordance with the standards of the Public Company Accounting Oversight Board (United States). Those standards require that we plan and perform the audit to obtain reasonable assurance about whether the financial statements and financial highlights are free of material misstatement. The Fund is not required to have, nor were we engaged to perform, an audit of its internal control over financial reporting. Our audits included consideration of internal control over financial reporting as a basis for designing audit procedures that are appropriate in the circumstances, but not for the purpose of expressing an opinion on the effectiveness of the Fund's internal control over financial reporting. Accordingly, we express no such opinion. An audit also includes examining, on a test basis, evidence supporting the amounts and disclosures in the financial statements, assessing the accounting principles used and significant estimates made by management, as well as evaluating the overall financial statement presentation. Our procedures included confirmation of securities owned as of July 31, 2012, by correspondence with the custodians and brokers; where replies were not received from brokers, we performed other auditing procedures. We believe that our audits provide a reasonable basis for our opinion.
In our opinion, the financial statements and financial highlights referred to above present fairly, in all material respects, the financial position of Fidelity Blue Chip Growth Fund as of July 31, 2012, the results of its operations for the year then ended, the changes in its net assets for each of the two years in the period then ended, and the financial highlights for each of the five years in the period then ended, in conformity with accounting principles generally accepted in the United States of America.
DELOITTE & TOUCHE LLP
Boston, Massachusetts
September 12, 2012
Annual Report
The Trustees, Members of the Advisory Board, and executive officers of the trust and fund, as applicable, are listed below. The Board of Trustees governs the fund and is responsible for protecting the interests of shareholders. The Trustees are experienced executives who meet periodically throughout the year to oversee the fund's activities, review contractual arrangements with companies that provide services to the fund, oversee management of the risks associated with such activities and contractual arrangements, and review the fund's performance. Except for James C. Curvey, each of the Trustees oversees 228 funds advised by FMR or an affiliate. Mr. Curvey oversees 435 funds advised by FMR or an affiliate.
The Trustees hold office without limit in time except that (a) any Trustee may resign; (b) any Trustee may be removed by written instrument, signed by at least two-thirds of the number of Trustees prior to such removal; (c) any Trustee who requests to be retired or who has become incapacitated by illness or injury may be retired by written instrument signed by a majority of the other Trustees; and (d) any Trustee may be removed at any special meeting of shareholders by a two-thirds vote of the outstanding voting securities of the trust. Each Trustee who is not an interested person (as defined in the 1940 Act) (Independent Trustee), shall retire not later than the last day of the calendar year in which his or her 75th birthday occurs. The Independent Trustees may waive this mandatory retirement age policy with respect to individual Trustees. The executive officers and Advisory Board Members hold office without limit in time, except that any officer and Advisory Board Member may resign or may be removed by a vote of a majority of the Trustees at any regular meeting or any special meeting of the Trustees. Except as indicated, each individual has held the office shown or other offices in the same company for the past five years.
Experience, Skills, Attributes, and Qualifications of the Fund's Trustees. The Governance and Nominating Committee has adopted a statement of policy that describes the experience, qualifications, attributes, and skills that are necessary and desirable for potential Independent Trustee candidates (Statement of Policy). The Board believes that each Trustee satisfied at the time he or she was initially elected or appointed a Trustee, and continues to satisfy, the standards contemplated by the Statement of Policy. The Governance and Nominating Committee also engages professional search firms to help identify potential Independent Trustee candidates who have the experience, qualifications, attributes, and skills consistent with the Statement of Policy. From time to time, additional criteria based on the composition and skills of the current Independent Trustees, as well as experience or skills that may be appropriate in light of future changes to board composition, business conditions, and regulatory or other developments, have also been considered by the professional search firms and the Governance and Nominating Committee. In addition, the Board takes into account the Trustees' commitment and participation in Board and committee meetings, as well as their leadership of standing and ad hoc committees throughout their tenure.
In determining that a particular Trustee was and continues to be qualified to serve as a Trustee, the Board has considered a variety of criteria, none of which, in isolation, was controlling. The Board believes that, collectively, the Trustees have balanced and diverse experience, qualifications, attributes, and skills, which allow the Board to operate effectively in governing the fund and protecting the interests of shareholders. Information about the specific experience, skills, attributes, and qualifications of each Trustee, which in each case led to the Board's conclusion that the Trustee should serve (or continue to serve) as a trustee of the fund, is provided below.
Annual Report
Trustees and Officers - continued
Board Structure and Oversight Function. James C. Curvey is an interested person (as defined in the 1940 Act) and currently serves as Chairman. The Trustees have determined that an interested Chairman is appropriate and benefits shareholders because an interested Chairman has a personal and professional stake in the quality and continuity of services provided to the fund. Independent Trustees exercise their informed business judgment to appoint an individual of their choosing to serve as Chairman, regardless of whether the Trustee happens to be independent or a member of management. The Independent Trustees have determined that they can act independently and effectively without having an Independent Trustee serve as Chairman and that a key structural component for assuring that they are in a position to do so is for the Independent Trustees to constitute a substantial majority for the Board. The Independent Trustees also regularly meet in executive session. Ned C. Lautenbach serves as Chairman of the Independent Trustees and as such (i) acts as a liaison between the Independent Trustees and management with respect to matters important to the Independent Trustees and (ii) with management prepares agendas for Board meetings.
Fidelity funds are overseen by different Boards of Trustees. The fund's Board oversees Fidelity's equity and high income funds and another Board oversees Fidelity's investment-grade bond, money market, and asset allocation funds. The asset allocation funds may invest in Fidelity funds overseen by the fund's Board. The use of separate Boards, each with its own committee structure, allows the Trustees of each group of Fidelity funds to focus on the unique issues of the funds they oversee, including common research, investment, and operational issues. On occasion, the separate Boards establish joint committees to address issues of overlapping consequences for the Fidelity funds overseen by each Board.
The Trustees operate using a system of committees to facilitate the timely and efficient consideration of all matters of importance to the Trustees, the fund, and fund shareholders and to facilitate compliance with legal and regulatory requirements and oversight of the fund's activities and associated risks. The Board, acting through its committees, has charged FMR and its affiliates with (i) identifying events or circumstances the occurrence of which could have demonstrably adverse effects on the fund's business and/or reputation; (ii) implementing processes and controls to lessen the possibility that such events or circumstances occur or to mitigate the effects of such events or circumstances if they do occur; and (iii) creating and maintaining a system designed to evaluate continuously business and market conditions in order to facilitate the identification and implementation processes described in (i) and (ii) above. Because the day-to-day operations and activities of the fund are carried out by or through FMR, its affiliates and other service providers, the fund's exposure to risks is mitigated but not eliminated by the processes overseen by the Trustees. While each of the Board's committees has responsibility for overseeing different aspects of the fund's activities, oversight is exercised primarily through the Operations, Audit, and Compliance Committees. In addition, the Independent Trustees have worked with FMR to enhance the Board's oversight of investment and financial risks, legal and regulatory risks, technology risks, and operational risks, including the development of additional risk reporting to the Board. For example, a working group comprised of Independent Trustees and FMR has worked and continues to work to review the Fidelity funds' valuation-related activities, reporting and risk management. Appropriate personnel, including but not limited to the fund's Chief Compliance Officer (CCO), FMR's internal auditor, the independent accountants, the fund's Treasurer and portfolio management personnel, make periodic reports to the Board's committees, as appropriate, including an annual review of FMR's risk management program for the Fidelity funds. The responsibilities of each standing committee, including their oversight responsibilities, are described further under "Standing Committees of the Fund's Trustees."
Annual Report
The fund's Statement of Additional Information (SAI) includes more information about the Trustees. To request a free copy, call Fidelity at 1-800-835-5092.
Interested Trustees*:
Correspondence intended for each Trustee who is an interested person may be sent to Fidelity Investments, 82 Devonshire Street, Boston, Massachusetts 02109.
Name, Age; Principal Occupations and Other Relevant Experience+ |
James C. Curvey (77) |
| Year of Election or Appointment: 2007 Mr. Curvey is Trustee and Chairman of the Board of Trustees of certain Trusts. Mr. Curvey also serves as Trustee (2007-present) of other investment companies advised by FMR. Mr. Curvey is a Director of Fidelity Investments Money Management, Inc. (2009-present), Director of Fidelity Research & Analysis Co. (2009-present) and Director of FMR and FMR Co., Inc. (2007-present). Mr. Curvey is also Vice Chairman (2007-present) and Director of FMR LLC. In addition, Mr. Curvey serves as an Overseer for the Boston Symphony Orchestra and a member of the Trustees of Villanova University. Previously, Mr. Curvey was the Vice Chairman (2006-2007) and Director (2000-2007) of FMR Corp. |
Ronald P. O'Hanley (55) |
| Year of Election or Appointment: 2011 Mr. O'Hanley is Director of FMR Co., Inc. (2010-present), Director of Fidelity Investments Money Management, Inc. (2010-present), Director of Fidelity Research & Analysis Company (2010-present), President of Fidelity Asset Management and Corporate Services and a member of Fidelity's Executive Committee (2010-present). Previously, Mr. O'Hanley served as President and Chief Executive Officer of BNY Mellon Asset Management (2007-2010). Mr. O'Hanley also served as Vice Chairman of Bank New York Mellon Corp. and a member of that firm's Executive Committee. Prior to the 2007 merger of The Bank of New York and Mellon Financial Corporation, he was Vice Chairman of Mellon Financial Corporation and President and Chief Executive Officer of Mellon Asset Management. He joined Mellon in February 1997. Mr. O'Hanley currently serves as Chairman of the Boston Public Library Foundation Board of Directors and sits on the Board of Directors of Beth Israel Deaconess Medical Center, the Board of Trustees of the Marine Biological Laboratory and the Advisory Board of the Maxwell School of Citizenship and Public Administration at Syracuse University. Mr. O'Hanley also chairs the Council on Asset Management for the Financial Services Roundtable and is a member of the Board of Directors of Institutional Investor's U.S. Institute. |
* Trustees have been determined to be "Interested Trustees" by virtue of, among other things, their affiliation with the trust or various entities under common control with FMR.
+ The information above includes each Trustee's principal occupation during the last five years and other information relating to the experience, attributes, and skills relevant to each Trustee's qualifications to serve as a Trustee, which led to the conclusion that each Trustee should serve as a Trustee for the fund.
Annual Report
Independent Trustees:
Correspondence intended for each Independent Trustee (that is, the Trustees other than the Interested Trustees) may be sent to Fidelity Investments, P.O. Box 55235, Boston, Massachusetts 02205-5235.
Name, Age; Principal Occupations and Other Relevant Experience+ |
Dennis J. Dirks (64) |
| Year of Election or Appointment: 2005 Prior to his retirement in May 2003, Mr. Dirks was Chief Operating Officer and a member of the Board of The Depository Trust & Clearing Corporation (DTCC). He also served as President, Chief Operating Officer, and Board member of The Depository Trust Company (DTC) and President and Board member of the National Securities Clearing Corporation (NSCC). In addition, Mr. Dirks served as Chief Executive Officer and Board member of the Government Securities Clearing Corporation, Chief Executive Officer and Board member of the Mortgage-Backed Securities Clearing Corporation, as a Trustee and a member of the Finance Committee of Manhattan College (2005-2008), and as a Trustee and a member of the Finance Committee of AHRC of Nassau County (2006-2008). Mr. Dirks is a member of the Independent Directors Council (IDC) Governing Council (2010-present) and Board of Directors for The Brookville Center for Children's Services, Inc. (2009-present). |
Alan J. Lacy (58) |
| Year of Election or Appointment: 2008 Mr. Lacy serves as Senior Adviser (2007-present) of Oak Hill Capital Partners, L.P. (private equity). Mr. Lacy also served as Chief Executive Officer (2000-2005) and Vice Chairman (2005-2006) of Sears Holdings Corporation and Sears, Roebuck and Co. (retail). In addition, Mr. Lacy serves as a member of the Board of Directors of Dave & Buster's Entertainment, Inc. (restaurant and entertainment complexes, 2010-present), Earth Fare, Inc. (retail grocery, 2012-present), The Hillman Companies, Inc. (hardware wholesalers, 2010-present), and Bristol-Myers Squibb Company (global pharmaceuticals, 2007-present). Mr. Lacy is a member of the Board of Trustees of The National Parks Conservation Association (2006-present). Previously, Mr. Lacy served as Chairman of the Board of Trustees of the National Parks Conservation Association (2008-2011) and as a member of the Board of Directors for the Western Union Company (global money transfer, 2006-2011). |
Ned C. Lautenbach (68) |
| Year of Election or Appointment: 2000 Mr. Lautenbach is Chairman of the Independent Trustees of the Equity and High Income Funds (2006-present). Mr. Lautenbach currently serves as the Lead Director of the Eaton Corporation Board of Directors (diversified industrial, 1997-present). Mr. Lautenbach is Chairman of the Board of Directors of the Philharmonic Center for the Arts in Naples, Florida (2012-present) and a member of the Council on Foreign Relations (1994-present). Previously, Mr. Lautenbach was a Partner/Advisory Partner at Clayton, Dubilier & Rice, LLC (private equity investment, 1998-2010), as well as a Director of Sony Corporation (2006-2007). |
Joseph Mauriello (67) |
| Year of Election or Appointment: 2008 Prior to his retirement in January 2006, Mr. Mauriello served in numerous senior management positions including Deputy Chairman and Chief Operating Officer (2004-2005), and Vice Chairman of Financial Services (2002-2004) of KPMG LLP US (professional services, 1965-2005). Mr. Mauriello currently serves as a member of the Board of Directors of XL Group plc. (global insurance and re-insurance, 2006-present). Previously, Mr. Mauriello served as a Director of the Hamilton Funds of the Bank of New York (2006-2007) and of Arcadia Resources Inc. (health care services and products, 2007-2012). |
Robert W. Selander (61) |
| Year of Election or Appointment: 2011 Previously, Mr. Selander served as a Member of the Advisory Board of Fidelity's Equity and High Income Funds (2011), Executive Vice Chairman (2010), Chief Executive Officer (2009-2010), and President and Chief Executive Officer (1997-2009) of Mastercard, Inc. |
Cornelia M. Small (68) |
| Year of Election or Appointment: 2005 Ms. Small is a member of the Board of Directors of the Teagle Foundation (2009-present). Ms. Small is also a member of the Investment Committee, and Chair (2008-present) and a member of the Board of Trustees of Smith College. In addition, Ms. Small serves on the Investment Committee of the Berkshire Taconic Community Foundation (2008-present). Previously, Ms. Small served as Chairperson of the Investment Committee (2002-2008) of Smith College. In addition, Ms. Small served as Chief Investment Officer, Director of Global Equity Investments, and a member of the Board of Directors of Scudder, Stevens & Clark and Scudder Kemper Investments. |
William S. Stavropoulos (73) |
| Year of Election or Appointment: 2002 Mr. Stavropoulos is Vice Chairman of the Independent Trustees of the Equity and High Income Funds (2006-present). Mr. Stavropoulos serves as President and Founder of the Michigan Baseball Foundation, the Great Lakes Loons (2007-present). Mr. Stavropoulos is Chairman Emeritus of the Board of Directors of The Dow Chemical Company, where he previously served in numerous senior management positions, including President, CEO (1995-2000; 2002-2004), Chairman of the Executive Committee (2000-2006), and as a member of the Board of Directors (1990-2006). Currently, Mr. Stavropoulos is Chairman of Univar (global distributor of commodity and specialty chemicals, 2010-present), a Director of Teradata Corporation (data warehousing and technology solutions, 2008-present), Chemical Financial Corporation, Maersk Inc. (industrial conglomerate), Tyco International, Inc. (multinational manufacturing and services, 2007-present), and a member of the Advisory Board for Metalmark Capital (private equity investment, 2005-present). Mr. Stavropoulos is a special advisor to Clayton, Dubilier & Rice, LLC (private equity investment). In addition, Mr. Stavropoulos is a member of the University of Notre Dame Advisory Council for the College of Science. |
David M. Thomas (63) |
| Year of Election or Appointment: 2008 Previously, Mr. Thomas served as Executive Chairman (2005-2006) and Chairman and Chief Executive Officer (2000-2005) of IMS Health, Inc. (pharmaceutical and healthcare information solutions). In addition, Mr. Thomas serves as a member of the Board of Directors of Fortune Brands, Inc. (consumer products), and Interpublic Group of Companies, Inc. (marketing communication, 2004-present). |
Michael E. Wiley (61) |
| Year of Election or Appointment: 2008 Mr. Wiley also serves as a Director of Asia Pacific Exploration Consolidated (international oil and gas exploration and production, 2008-present). Mr. Wiley serves as a Director of Tesoro Corporation (independent oil refiner and marketer, 2005-present), and a Director of Bill Barrett Corporation (exploration and production, 2005-present). In addition, Mr. Wiley also serves as a Director of Post Oak Bank (privately-held bank, 2004-present). Previously, Mr. Wiley served as a member of the Board of Trustees of the University of Tulsa (2000-2006; 2007-2010), as a Senior Energy Advisor of Katzenbach Partners, LLC (consulting, 2006-2007), as an Advisory Director of Riverstone Holdings (private investment), Chairman, President, and CEO of Baker Hughes, Inc. (oilfield services, 2000-2004), and as Director of Spinnaker Exploration Company (exploration and production, 2001-2005). |
Annual Report
Trustees and Officers - continued
+ The information above includes each Trustee's principal occupation during the last five years and other information relating to the experience, attributes, and skills relevant to each Trustee's qualifications to serve as a Trustee, which led to the conclusion that each Trustee should serve as a Trustee for the fund.
Advisory Board Members and Executive Officers:
Correspondence intended for David A. Rosow and Garnett A. Smith may be sent to Fidelity Investments, P.O. Box 55235, Boston, Massachusetts 02205-5235. Correspondence intended for each executive officer, Edward C. Johnson 3d, and Peter S. Lynch may be sent to Fidelity Investments, 82 Devonshire Street, Boston, Massachusetts 02109.
Name, Age; Principal Occupation |
Edward C. Johnson 3d (82) |
| Year of Election or Appointment: 2011 Member of the Advisory Board of Fidelity's Equity and High Income Funds. Mr. Johnson serves as Chief Executive Officer, Chairman, and a Director of FMR LLC, and also serves as Chairman and Director of FIL Limited. Previously, Mr. Johnson served as a Trustee and Chairman of the Board of certain Fidelity Trusts, Chairman and a Director of FMR, Chairman and a Director of FMR Co., Inc., and President of FMR LLC (2006-2007). |
Peter S. Lynch (68) |
| Year of Election or Appointment: 2003 Member of the Advisory Board of Fidelity's Equity and High Income Funds. Mr. Lynch is Vice Chairman and a Director of FMR and FMR Co., Inc. In addition, Mr. Lynch serves as a Trustee of Boston College and as the Chairman of the Inner-City Scholarship Fund. Previously, Mr. Lynch served on the Special Olympics International Board of Directors (1997-2006). |
David A. Rosow (69) |
| Year of Election or Appointment: 2012 Member of the Advisory Board of Fidelity's Equity and High Income Funds. Chairman and Chief Executive Officer of International Golf Group, Inc. (golf course development, 1990-present). Previously, Mr. Rosow served as Chairman and Chief Executive Officer of Rosow & Company, Inc. (private investment company, 1989-2011), a Lead Director of Hudson United Bancorp (2001-2006) and as a Director of TD Banknorth (1996-2006). In addition, Mr. Rosow is a member (2008-present) and President (2009-present) of the Town Council of Palm Beach, Florida. |
Garnett A. Smith (64) |
| Year of Election or Appointment: 2012 Member of the Advisory Board of Fidelity's Equity and High Income Funds. Prior to Mr. Smith's retirement, he served as Chairman and Chief Executive Officer of Inbrand Corp. (manufacturer of personal absorbent products, 1990-1997). He also served as President (1986-1990) of Inbrand Corp. Prior to his employment with Inbrand Corp., he was employed by a retail fabric chain and North Carolina National Bank. In addition, Mr. Smith is a board member of the Jackson Hole Land Trust (2009-present). |
Kenneth B. Robins (42) |
| Year of Election or Appointment: 2008 President and Treasurer of Fidelity's Equity and High Income Funds. Mr. Robins also serves as President and Treasurer (2010-present) and Assistant Treasurer (2009-present) of other Fidelity funds and is an employee of Fidelity Investments (2004-present). Previously, Mr. Robins served as Deputy Treasurer of the Fidelity funds (2005-2008) and Treasurer and Chief Financial Officer of The North Carolina Capital Management Trust: Cash and Term Portfolios (2006-2008). |
Bruce T. Herring (46) |
| Year of Election or Appointment: 2006 Vice President of certain Equity Funds. Mr. Herring also serves as President of Fidelity Research & Analysis Company (2010-present), Chief Investment Officer and Director of Fidelity Management & Research (U.K.) Inc. (2010-present) and Group Chief Investment Officer of FMR. Previously, Mr. Herring served as Vice President (2005-2006) and Senior Vice President (2006-2007) of Fidelity Management & Research Company, Vice President of FMR Co., Inc. (2001-2007) and as a portfolio manager for Fidelity U.S. Equity Funds. |
Brian B. Hogan (47) |
| Year of Election or Appointment: 2009 Vice President of Equity and High Income Funds. Mr. Hogan also serves as President of FMR's Equity Division (2009-present). Previously, Mr. Hogan served as Senior Vice President, Equity Research of FMR (2006-2009) and as a portfolio manager. |
Scott C. Goebel (44) |
| Year of Election or Appointment: 2008 Secretary and Chief Legal Officer (CLO) of the Fidelity funds. Mr. Goebel also serves as Secretary of Fidelity Investments Money Management, Inc. (FIMM) (2010-present) and Fidelity Research and Analysis Company (FRAC) (2010-present); Secretary and CLO of The North Carolina Capital Management Trust: Cash and Term Portfolios (2008-present); General Counsel, Secretary, and Senior Vice President of FMR (2008-present) and FMR Co., Inc. (2008-present); employed by FMR LLC or an affiliate (2001-present); Chief Legal Officer of Fidelity Management & Research (Hong Kong) Limited (2008-present) and Assistant Secretary of Fidelity Management & Research (Japan) Inc. (2008-present), and Fidelity Management & Research (U.K.) Inc. (2008-present). Previously, Mr. Goebel served as Assistant Secretary of FIMM (2008-2010), FRAC (2008-2010), and the Funds (2007-2008) and as Vice President and Secretary of Fidelity Distributors Corporation (FDC) (2005-2007). |
William C. Coffey (43) |
| Year of Election or Appointment: 2009 Assistant Secretary of Fidelity's Equity and High Income Funds. Mr. Coffey also serves as Senior Vice President and Deputy General Counsel of FMR LLC (2010-present), and is an employee of Fidelity Investments. Previously, Mr. Coffey served as Vice President and Associate General Counsel of FMR LLC (2005-2009). |
Elizabeth Paige Baumann (44) |
| Year of Election or Appointment: 2012 Anti-Money Laundering (AML) Officer of the Fidelity funds. Ms. Baumann also serves as AML Officer of The North Carolina Capital Management Trust: Cash and Term Portfolios (2012-present), Chief AML Officer of FMR LLC (2012-present), and is an employee of Fidelity Investments. Previously, Ms. Baumann served as Vice President and Deputy Anti-Money Laundering Officer (2007-2012). |
Christine Reynolds (53) |
| Year of Election or Appointment: 2008 Chief Financial Officer of the Fidelity funds. Ms. Reynolds became President of Fidelity Pricing and Cash Management Services (FPCMS) in August 2008. Ms. Reynolds served as Chief Operating Officer of FPCMS (2007-2008). Previously, Ms. Reynolds served as President, Treasurer, and Anti-Money Laundering officer of the Fidelity funds (2004-2007). |
Joseph A. Hanlon (44) |
| Year of Election or Appointment: 2012 Chief Compliance Officer of Fidelity's Equity and High Income Funds. Mr. Hanlon serves as Compliance Officer of FMR, FMR Co., Inc., Fidelity Investments Money Management, Inc. (FIMM), Fidelity Research and Analysis Company (FRAC), Fidelity Management & Research (Japan) Inc., Fidelity Management & Research (U.K.) Inc., Fidelity Management & Research (Hong Kong), and Strategic Advisers, Inc. (2009-present), as Senior Vice President of the Fidelity Asset Management Division (2009-present), and is an employee of Fidelity Investments. |
Joseph F. Zambello (55) |
| Year of Election or Appointment: 2011 Deputy Treasurer of the Fidelity funds. Mr. Zambello is an employee of Fidelity Investments. Previously, Mr. Zambello served as Vice President of FMR's Program Management Group (2009-2011) and Vice President of the Transfer Agent Oversight Group (2005-2009). |
Adrien E. Deberghes (44) |
| Year of Election or Appointment: 2008 Deputy Treasurer of Fidelity's Equity and High Income Funds. Mr. Deberghes also serves as Vice President (2011-present) and Assistant Treasurer (2010-present) of other Fidelity funds, and is an employee of Fidelity Investments (2008-present). Previously, Mr. Deberghes served as Senior Vice President of Mutual Fund Administration at State Street Corporation (2007-2008), Senior Director of Mutual Fund Administration at Investors Bank & Trust (2005-2007), and Director of Finance for Dunkin' Brands (2000-2005). |
Stephanie J. Dorsey (43) |
| Year of Election or Appointment: 2010 Assistant Treasurer of Fidelity's Equity and High Income Funds. Ms. Dorsey also serves as Deputy Treasurer of other Fidelity funds (2008-present) and is an employee of Fidelity Investments (2008-present). Previously, Ms. Dorsey served as Treasurer (2004-2008) of the JPMorgan Mutual Funds and Vice President (2004-2008) of JPMorgan Chase Bank. |
John R. Hebble (54) |
| Year of Election or Appointment: 2009 Assistant Treasurer of Fidelity's Equity and High Income Funds. Mr. Hebble also serves as President (2011-present), Treasurer, and Chief Financial Officer of The North Carolina Capital Management Trust: Cash and Term Portfolios (2008-present), President and Treasurer of other Fidelity funds (2008-present) and is an employee of Fidelity Investments. |
Gary W. Ryan (54) |
| Year of Election or Appointment: 2005 Assistant Treasurer of the Fidelity funds. Mr. Ryan is an employee of Fidelity Investments. Previously, Mr. Ryan served as Vice President of Fund Reporting in Fidelity Pricing and Cash Management Services (FPCMS) (1999-2005). |
Jonathan Davis (44) |
| Year of Election or Appointment: 2010 Assistant Treasurer of the Fidelity funds. Mr. Davis is also Assistant Treasurer of Fidelity Rutland Square Trust II and Fidelity Commonwealth Trust II. Mr. Davis is an employee of Fidelity Investments. Previously, Mr. Davis served as Vice President and Associate General Counsel of FMR LLC (2003-2010). |
Annual Report
Class F designates 100% of the dividends distributed during the fiscal year as qualifying for the dividends-received deduction for corporate shareholders.
Class F designates 100% of the dividends distributed during the fiscal year as amounts which can be taken into account as a dividend for the purposes of the maximum rate under section 1(h)(11) of the Internal Revenue Code.
The fund will notify shareholders in January 2013 of amounts for use in preparing 2012 income tax returns.
Annual Report
Board Approval of Investment Advisory Contracts and Management Fees
Fidelity Blue Chip Growth Fund
Each year, the Board of Trustees, including the Independent Trustees (together, the Board), votes on the renewal of the management contract and sub-advisory agreements (together, the Advisory Contracts) for the fund. The Board, assisted by the advice of fund counsel and Independent Trustees' counsel, requests and considers a broad range of information relevant to the renewal of the Advisory Contracts throughout the year.
The Board meets regularly and, at each of its meetings, considers factors that are relevant to its annual consideration of the renewal of the fund's Advisory Contracts, including the services and support provided to the fund and its shareholders. The Board has established various standing committees, each composed of and chaired by Independent Trustees with varying backgrounds, to which the Board has assigned specific subject matter responsibilities in order to enhance effective decision-making by the Board. The Board, acting directly and through its Committees, requests and receives information concerning the annual consideration of the renewal of the fund's Advisory Contracts. The Board also meets as needed to consider matters specifically related to the Board's annual consideration of the renewal of Advisory Contracts. Members of the Board may also meet with trustees of other Fidelity funds through ad hoc joint committees to discuss certain matters relevant to the Fidelity funds.
At its July 2012 meeting, the Board of Trustees, including the Independent Trustees, unanimously determined to renew the fund's Advisory Contracts. In reaching its determination, the Board considered all factors it believed relevant, including (i) the nature, extent, and quality of the services to be provided to the fund and its shareholders (including the investment performance of the fund); (ii) the competitiveness of the fund's management fee and total expense ratio relative to peer funds; (iii) the total costs of the services to be provided by and the profits to be realized by Fidelity from its relationship with the fund; (iv) the extent to which economies of scale exist and would be realized as the fund grows; and (v) whether fee levels reflect these economies of scale, if any, for the benefit of fund shareholders.
In considering whether to renew the Advisory Contracts for the fund, the Board reached a determination, with the assistance of fund counsel and Independent Trustees' counsel and through the exercise of its business judgment, that the renewal of the Advisory Contracts is in the best interests of the fund and its shareholders and that the compensation payable under the Advisory Contracts is fair and reasonable. The Board's decision to renew the Advisory Contracts was not based on any single factor, but rather was based on a comprehensive consideration of all the information provided to the Board at its meetings throughout the year. The Board, in reaching its determination to renew the Advisory Contracts, is aware that shareholders in the fund have a broad range of investment choices available to them, including a wide choice among mutual funds offered by Fidelity's competitors, and that the fund's shareholders, who have the opportunity to review and weigh the disclosure provided by the fund in its prospectus and other public disclosures, have chosen to invest in this fund, managed by Fidelity.
Annual Report
Nature, Extent, and Quality of Services Provided. The Board considered the staffing within the investment adviser, FMR, and the sub-advisers (together, the Investment Advisers), including the backgrounds of the fund's investment personnel, and also considered the fund's investment objective, strategies, and related investment philosophy. The Independent Trustees also had discussions with senior management of Fidelity's investment operations and investment groups. The Board considered the structure of the portfolio manager compensation program and whether this structure provides appropriate incentives to act in the best interests of the fund.
Resources Dedicated to Investment Management and Support Services. The Board and the Fund Oversight and Research Committees reviewed the general qualifications and capabilities of the Investment Advisers' investment staff, including its size, education, experience, and resources, as well as the Investment Advisers' approach to recruiting, training, managing, and compensating investment personnel. The Board also noted that FMR has continued to increase the resources devoted to non-U.S. offices, including expansion of Fidelity's global investment organization. The Board noted that Fidelity's analysts have extensive resources, tools and capabilities that allow them to conduct sophisticated quantitative and fundamental analysis, as well as credit analysis of issuers, counterparties and guarantors. The Board also believes that Fidelity's investment professionals have sufficient access to global information and data so as to provide competitive investment results over time, and that those professionals also have access to sophisticated tools that permit them to assess portfolio construction and risk and performance attribution characteristics continuously, as well as to transmit new information and research conclusions rapidly around the world. Additionally, in its deliberations, the Board considered the Investment Advisers' trading and risk management capabilities and resources, which are an integral part of the investment management process.
Shareholder and Administrative Services. The Board considered (i) the nature, extent, quality, and cost of advisory, administrative, and shareholder services performed by the Investment Advisers and their affiliates under the Advisory Contracts and under separate agreements covering transfer agency, pricing and bookkeeping, and securities lending services for the fund; (ii) the nature and extent of the supervision of third party service providers, principally custodians and subcustodians; and (iii) the resources devoted to, and the record of compliance with, the fund's compliance policies and procedures. The Board also reviewed the allocation of fund brokerage, including allocations to brokers affiliated with the Investment Advisers, the use of brokerage commissions to pay fund expenses, and the use of "soft" commission dollars to pay for research services.
Annual Report
Board Approval of Investment Advisory Contracts and
Management Fees - continued
The Board noted that the growth of fund assets over time across the complex allows Fidelity to reinvest in the development of services designed to enhance the value or convenience of the Fidelity funds as investment vehicles. These services include 24-hour access to account information and market information through telephone representatives and over the Internet, investor education materials and asset allocation tools, and the expanded availability of Fidelity Investor Centers.
Investment in a Large Fund Family. The Board considered the benefits to shareholders of investing in a Fidelity fund, including the benefits of investing in a fund that is part of a large family of funds offering a variety of investment disciplines and providing a large variety of mutual fund investor services. The Board noted that Fidelity had taken, or had made recommendations that resulted in the Fidelity funds taking, a number of actions over the previous year that benefited particular funds, including (i) continuing to dedicate additional resources to investment research and support of the senior management team that oversees asset management; (ii) persisting in efforts to enhance Fidelity's research capabilities, in particular, international research; (iii) launching new funds and making other enhancements to meet client needs for global and income-oriented solutions; (iv) continuing to launch dedicated lower cost underlying funds to meet investment management's portfolio construction needs related to expanding underlying fund options, specifically for the Freedom Fund product lines; (v) adopting a "Stock Selector" sector neutral investment approach and employing a team of portfolio managers who are sector specialists to manage certain funds; (vi) rationalizing product lines and gaining increased efficiencies through the mergers of several funds into other funds; (vii) strengthening the Spartan Index Fund product line by adding new funds and/or new low-cost institutional share classes, restructuring fund expenses to accommodate new classes, and reducing investment minimums for certain classes of shares; (viii) modifying the eligibility criteria for Institutional Class shares to increase their appeal to government entities and charitable investors; and (ix) reducing certain transfer agent fee rates.
Investment Performance. The Board considered whether the fund has operated in accordance with its investment objective, as well as its record of compliance with its investment restrictions. It also reviewed the fund's absolute investment performance for each class, as well as the fund's relative investment performance for each class measured over multiple periods against (i) a broad-based securities market index, and (ii) a peer group of mutual funds deemed appropriate by Fidelity and reviewed by the Board. The following charts considered by the Board show, over the one-, three-, and five-year periods ended December 31, 2011, as available, the cumulative total returns of Class K and the retail class of the fund, the cumulative total returns of a broad-based securities market index ("benchmark"), and a range of cumulative total returns of a peer group of mutual funds identified by Morningstar, Inc. as having an investment style similar to that of the fund based on underlying portfolio holdings. The returns of Class K and the retail class show the performance of the highest and lowest performing classes, respectively (based on three-year performance). The box within each chart shows the 25th percentile return (top of box) and the 75th percentile return (bottom of box) of the peer group. Returns shown above the box are in the first quartile and returns shown below the box are in the fourth quartile. The percentage beaten numbers noted below each chart correspond to the percentile box and represent the percentage of funds in the peer group whose performance was equal to or lower than that of the class indicated.
Annual Report
Fidelity Blue Chip Growth Fund

The Board reviewed the fund's relative investment performance against its peer group and noted that the performance of the retail class of the fund (the class with the longest performance record) was in the third quartile for the one-year period and the first quartile for the three- and five-year periods. The Board also noted that the investment performance of the retail class of the fund compared favorably to its benchmark for the three- and five-year periods, although the fund's one-year total return was lower than its benchmark. The Board considered that the variations in performance among the fund's classes reflect the variations in class expenses, which result in lower performance for higher expense classes. The Board also reviewed the fund's performance since inception as well as performance in the current year.
The Board also considered that the fund's management fee is subject to upward or downward adjustment depending upon whether, and to what extent, the fund's investment performance for the performance period exceeds, or is exceeded by, the record (over the same period) of a Board-approved performance adjustment index. The Board noted that the performance adjustment provides FMR with a strong economic incentive to seek to achieve superior performance for the fund's shareholders and helps to more closely align the interests of FMR and the fund's shareholders.
Annual Report
Board Approval of Investment Advisory Contracts and
Management Fees - continued
Based on its review, the Board concluded that the nature, extent, and quality of services provided to the fund under the Advisory Contracts should benefit the fund's shareholders.
Competitiveness of Management Fee and Total Expense Ratio. The Board considered the fund's management fee and total expense ratio compared to "mapped groups" of competitive funds and classes. Fidelity creates "mapped groups" by combining similar Lipper investment objective categories that have comparable management fee characteristics. Combining Lipper investment objective categories aids the Board's management fee and total expense ratio comparisons by broadening the competitive group used for comparison and by reducing the number of universes to which various Fidelity funds are compared.
Management Fee. The Board considered two proprietary management fee comparisons for the 12-month periods shown in the chart below. The group of Lipper funds used by the Board for management fee comparisons is referred to below as the "Total Mapped Group." The Total Mapped Group comparison focuses on a fund's standing relative to the total universe of comparable funds available to investors in terms of gross management fees before expense reimbursements or caps, and without giving effect to the fund's performance adjustment. "TMG %" represents the percentage of funds in the Total Mapped Group that had management fees that were lower than the fund's. For example, a TMG % of 10% means that 90% of the funds in the Total Mapped Group had higher management fees than the fund. The "Asset-Size Peer Group" (ASPG) comparison focuses on a fund's standing relative to non-Fidelity funds similar in size to the fund within the Total Mapped Group. The ASPG represents at least 15% of the funds in the Total Mapped Group with comparable asset size and management fee characteristics, subject to a minimum of 50 funds (or all funds in the Total Mapped Group if fewer than 50). Additional information, such as the ASPG quartile in which the fund's management fee ranked and the impact of the fund's performance adjustment, is also included in the chart and considered by the Board.
Annual Report
Fidelity Blue Chip Growth Fund

The Board noted that the fund's management fee ranked below the median of its Total Mapped Group and below the median of its ASPG for 2011. The Board also noted the effect of the fund's positive performance adjustment on the fund's management fee ranking. The Board noted that the performance adjustment for each year represents calculations for performance periods that differ from the periods shown in the performance charts above.
Furthermore, the Board considered that shareholders approved a prospective change in the index used to calculate the fund's performance adjustment beginning June 1, 2006. The Board also considered that, because the performance adjustment is based on a rolling 36-month measurement period, during a transition period the fund's performance is compared to a blended index return that reflects the performance of the former index for the portion of the measurement period prior to June 1, 2006 and the performance of the current index for the remainder of the measurement period. The Board noted that the fund's performance adjustments for 2007 through 2009 shown in the chart above reflect the effect of using the blended index return to calculate the fund's performance adjustment.
Based on its review, the Board concluded that the fund's management fee is fair and reasonable in light of the services that the fund receives and the other factors considered.
Total Expense Ratio. In its review of each class's total expense ratio, the Board considered the fund's management fee as well as other fund or class expenses, as applicable, such as transfer agent fees, pricing and bookkeeping fees, and custodial, legal, and audit fees. The Board also noted the effects of any waivers and reimbursements on fees and expenses, as well as the impact of the fund's performance adjustment. As part of its review, the Board also considered the current and historical total expense ratios of each class of the fund compared to competitive fund median expenses. Each class of the fund is compared to those funds and classes in the Total Mapped Group (used by the Board for management fee comparisons) that have a similar sales load structure.
Annual Report
Board Approval of Investment Advisory Contracts and
Management Fees - continued
The Board noted that the total expense ratio of each class ranked below its competitive median for 2011.
Fees Charged to Other Fidelity Clients. The Board also considered Fidelity fee structures and other information with respect to clients of FMR and its affiliates, such as other mutual funds advised or subadvised by FMR or its affiliates, pension plan clients, and other institutional clients. The Board noted the findings of the 2010 ad hoc joint committee (created with the board of other Fidelity funds), which reviewed and compared Fidelity's institutional investment advisory business with its business of providing services to the Fidelity funds, including the differences in services provided, fees charged, and costs incurred, as well as competition in their respective marketplaces.
Based on its review of total expense ratios and fees charged to other Fidelity clients, the Board concluded that the total expense ratio of each class of the fund was reasonable in light of the services that the fund and its shareholders receive and the other factors considered.
Costs of the Services and Profitability. The Board considered the revenues earned and the expenses incurred by Fidelity in conducting the business of developing, marketing, distributing, managing, administering and servicing the fund and its shareholders. The Board also considered the level of Fidelity's profits in respect of all the Fidelity funds.
On an annual basis, FMR presents to the Board Fidelity's profitability for the fund. Fidelity calculates the profitability for each fund, as well as aggregate profitability for groups of Fidelity funds and all Fidelity funds, using a series of detailed revenue and cost allocation methodologies which originate with the books and records of Fidelity on which Fidelity's audited financial statements are based. The Audit Committee of the Board reviews any significant changes from the prior year's methodologies.
PricewaterhouseCoopers LLP (PwC), independent registered public accounting firm and auditor to Fidelity and certain Fidelity funds, has been engaged annually by the Board as part of the Board's assessment of Fidelity's profitability analysis. PwC's engagement includes the review and assessment of Fidelity's methodologies used in determining the revenues and expenses attributable to Fidelity's mutual fund business, and completion of agreed-upon procedures surrounding the mathematical accuracy of fund profitability and its conformity to allocation methodologies. After considering PwC's reports issued under the engagement and information provided by Fidelity, the Board concluded that while other allocation methods may also be reasonable, Fidelity's profitability methodologies are reasonable in all material respects.
Annual Report
The Board also reviewed Fidelity's non-fund businesses and fall-out benefits related to the mutual fund business as well as cases where Fidelity's affiliates may benefit from or be related to the fund's business.
The Board considered the costs of the services provided by and the profits realized by Fidelity in connection with the operation of the fund and was satisfied that the profitability was not excessive in the circumstances.
Economies of Scale. The Board considered whether there have been economies of scale in respect of the management of the Fidelity funds, whether the Fidelity funds (including the fund) have appropriately benefited from any such economies of scale, and whether there is potential for realization of any further economies of scale. The Board considered the extent to which the fund will benefit from economies of scale through increased services to the fund, through waivers or reimbursements, or through fee or expense reductions. The Board also noted that in 2009, it and the board of other Fidelity funds created an ad hoc committee (the Economies of Scale Committee) to analyze whether FMR attains economies of scale in respect of the management and servicing of the Fidelity funds, whether the Fidelity funds have appropriately benefited from such economies of scale, and whether there is potential for realization of any further economies of scale.
The Board recognized that the fund's management contract incorporates a "group fee" structure, which provides for lower group fee rates as total fund assets under FMR's management increase, and for higher group fee rates as total fund assets under FMR's management decrease. FMR calculates the group fee rates based on a tiered asset "breakpoint" schedule that varies based on asset class. The Board considered that the group fee is designed to deliver the benefits of economies of scale to fund shareholders when total Fidelity fund assets increase, even if assets of any particular fund are unchanged or have declined, because some portion of Fidelity's costs are attributable to services provided to all Fidelity funds, and all funds benefit if those costs can be allocated among more assets. The Board concluded that, given the group fee structure, fund shareholders will benefit from lower management fees as assets under FMR's management increase at the fund complex level, regardless of whether Fidelity achieves any such economies of scale.
The Board concluded, taking into account the analysis of the Economies of Scale Committee, that economies of scale, if any, are being appropriately shared between fund shareholders and Fidelity.
Annual Report
Board Approval of Investment Advisory Contracts and
Management Fees - continued
Additional Information Requested by the Board. In order to develop fully the factual basis for consideration of the Fidelity funds' Advisory Contracts, the Board requested and received additional information on certain topics, including (i) fund performance trends, actions to be taken by FMR to improve certain funds' overall performance, and Fidelity's long-term strategies for certain funds; (ii) the potential to further rationalize the Fidelity fund lineup with the possibility of achieving savings for the funds and Fidelity; (iii) Fidelity's compensation structure for portfolio managers and other key investment personnel; (iv) the amount of the investment that each portfolio manager has made in the Fidelity fund(s) that he or she manages; (v) the realization of fall-out benefits in certain Fidelity business units; (vi) Fidelity's group fee structures, the potential impact of regulatory changes on such structures, and the rationale for the individual fee rates of certain funds; (vii) fund profitability methodology, including Fidelity's cost allocation methodology, and the impact of certain factors on fund profitability results; (viii) trends regarding industry use of performance fee structures and the possibility of implementing performance fee structures for additional funds; and (ix) the impact of net redemptions from the Fidelity funds.
Based on its evaluation of all of the conclusions noted above, and after considering all factors it believed relevant, the Board ultimately concluded that the advisory fee structures are fair and reasonable, and that the fund's Advisory Contracts should be renewed.
Annual Report
Investment Adviser
Fidelity Management & Research Company
Boston, MA
Investment Sub-Advisers
FMR Co., Inc.
Fidelity Management & Research
(U.K.) Inc.
Fidelity Management & Research
(Hong Kong) Limited
Fidelity Management & Research
(Japan) Inc.
General Distributor
Fidelity Distributors Corporation
Smithfield, RI
Transfer and Service Agents
Fidelity Investments Institutional
Operations Company, Inc.
Boston, MA
Fidelity Service Company, Inc.
Boston, MA
Custodian
Citibank, N.A.
New York, NY
(Fidelity Investment logo)(registered trademark)
Corporate Headquarters
82 Devonshire St., Boston, MA 02109
www.fidelity.com
BCF-F-ANN-0912
1.891663.103
Fidelity®
OTC
Portfolio -
Class K
Annual Report
July 31, 2012
(Fidelity Cover Art)
Contents
Performance | (Click Here) | How the fund has done over time. |
Management's Discussion of Fund Performance | (Click Here) | The Portfolio Manager's review of fund performance and strategy. |
Shareholder Expense Example | (Click Here) | An example of shareholder expenses. |
Investment Changes | (Click Here) | A summary of major shifts in the fund's investments over the past six months. |
Investments | (Click Here) | A complete list of the fund's investments with their market values. |
Financial Statements | (Click Here) | Statements of assets and liabilities, operations, and changes in net assets, as well as financial highlights. |
Notes | (Click Here) | Notes to the financial statements. |
Report of Independent Registered Public Accounting Firm | (Click Here) | |
Trustees and Officers | (Click Here) | |
Board Approval of Investment Advisory Contracts and Management Fees | (Click Here) | |
To view a fund's proxy voting guidelines and proxy voting record for the 12-month period ended June 30, visit http://www.fidelity.com/proxyvotingresults or visit the Securities and Exchange Commission's (SEC) web site at http://www.sec.gov. You may also call 1-800-835-5092 to request a free copy of the proxy voting guidelines.
Standard & Poor's, S&P and S&P 500 are registered service marks of The McGraw-Hill Companies, Inc. and have been licensed for use by Fidelity Distributors Corporation.
Other third party marks appearing herein are the property of their respective owners.
All other marks appearing herein are registered or unregistered trademarks or service marks of FMR LLC or an affiliated company. © 2012 FMR LLC. All rights reserved.
Annual Report
This report and the financial statements contained herein are submitted for the general information of the shareholders of the fund. This report is not authorized for distribution to prospective investors in the fund unless preceded or accompanied by an effective prospectus.
A fund files its complete schedule of portfolio holdings with the SEC for the first and third quarters of each fiscal year on Form N-Q. Forms N-Q are available on the SEC's web site at http://www.sec.gov. A fund's Forms N-Q may be reviewed and copied at the SEC's Public Reference Room in Washington, DC. Information regarding the operation of the SEC's Public Reference Room may be obtained by calling 1-800-SEC-0330. For a complete list of a fund's portfolio holdings, view the most recent holdings listing, semiannual report, or annual report on Fidelity's web site at http://www.fidelity.com, http://www.advisor.fidelity.com, or http://www.401k.com, as applicable.
NOT FDIC INSURED • MAY LOSE VALUE • NO BANK GUARANTEE
Neither the fund nor Fidelity Distributors Corporation is a bank.
Annual Report
Average annual total return reflects the change in the value of an investment, assuming reinvestment of the class' distributions from dividend income and capital gains (the profits earned upon the sale of securities that have grown in value, if any) and assuming a constant rate of performance each year. The $10,000 table and the fund's returns do not reflect the deduction of taxes that a shareholder would pay on fund distributions or the redemption of fund shares. During periods of reimbursement by Fidelity, a fund's total return will be greater than it would be had the reimbursement not occurred. How a fund did yesterday is no guarantee of how it will do tomorrow.
Average Annual Total Returns
Periods ended July 31, 2012 | Past 1
year | Past 5
years | Past 10
years |
Class KA | -2.80% | 4.23% | 9.59% |
A The initial offering of Class K shares took place on May 9, 2008. Returns prior to May 9, 2008, are those of Fidelity® OTC Portfolio, the original class of the fund.
$10,000 Over 10 Years
Let's say hypothetically that $10,000 was invested in Fidelity® OTC Portfolio - Class K on July 31, 2002. The chart shows how the value of your investment would have changed, and also shows how the Nasdaq Composite® Index performed over the same period. The initial offering of Class K took place on May 9, 2008. See above for additional information regarding the performance of Class K.
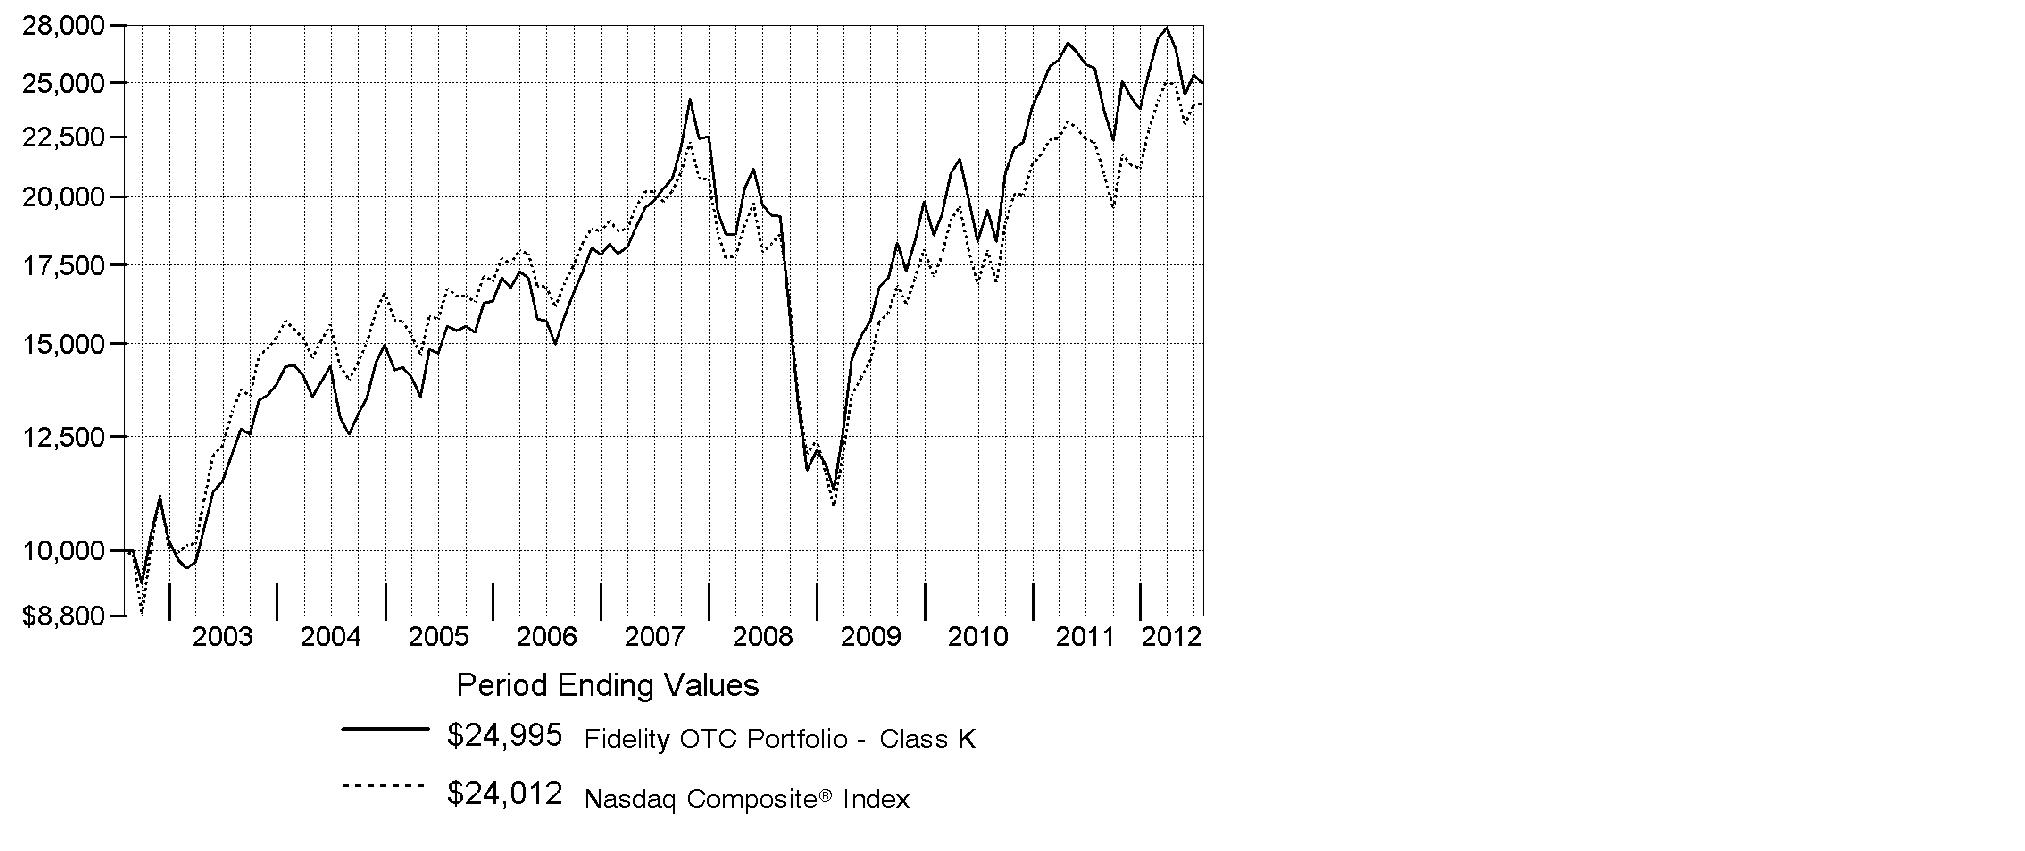
Annual Report
Market Recap: Major U.S. equity benchmarks posted solid gains for the year ending July 31, 2012, amid an uncertain investment environment. The broad-based S&P 500® Index returned 9.13%, while the blue-chip-laden Dow Jones Industrial AverageSM and technology-heavy Nasdaq Composite® Index gained 10.12% and 7.89%, respectively. Volatility spiked during the period's first half, as equities plummeted late last summer on Europe's debt woes, political wrangling over the U.S. debt ceiling and the sovereign credit-rating downgrade that followed. By October, a seemingly improved U.S. economy rejuvenated stocks, paving the way for major equity benchmarks to post their best first-quarter performance since 1998. However, more eurozone trouble, signs that the U.S. economy had turned sluggish and a slowdown in China caused stocks to slip in May, before a new wave of optimism took hold in June and July. Within the S&P 500®, more-defensive sectors such as telecommunication services (+30%) and consumer staples (+20%) fared best, while materials and energy significantly underperformed, returning -5%. Small- and mid-cap stocks trailed their less-volatile large-cap counterparts, with the Russell 2000® Index adding 0.19% and the Russell Midcap® Index rising 2.28%. Given turmoil and local currency weakness in Europe, foreign developed-markets stocks lost ground, with the MSCI® EAFE® Index returning -11.32%.
Comments from Gavin Baker, Portfolio Manager of Fidelity® OTC Portfolio: For the year, the fund's Class K shares returned -2.80%, considerably behind the Nasdaq Composite Index. Versus the index, the fund was primarily hurt by stock picking in health care, the food/beverage/tobacco segment of consumer staples, and telecommunication services. Green Mountain Coffee Roasters was the biggest individual detractor. Ballooning retailer inventories of the company's popular Keurig K-Cup® single-serving coffee packets, due in part to slackening overall demand for K-Cups®, was one factor hampering the stock. Performance also suffered because of a large overweighting in NII Holdings, a provider of cellular handsets and wireless service across Latin America, and a sizable out-of-benchmark stake in Accretive Health, which provides revenue-enhancement services and software for hospitals. Conversely, stock picking in the semiconductors/semiconductor equipment segment of information technology bolstered performance. One standout was Mellanox Technologies. This supplier of InfiniBand® interconnect technology for the server market blew away its financial guidance in April and July, causing its shares to surge higher. Apple also was a key contributor, riding robust sales of its iPhone® smartphone and iPad® tablet device.
The views expressed above reflect those of the portfolio manager(s) only through the end of the period as stated on the cover of this report and do not necessarily represent the views of Fidelity or any other person in the Fidelity organization. Any such views are subject to change at any time based upon market or other conditions and Fidelity disclaims any responsibility to update such views. These views may not be relied on as investment advice and, because investment decisions for a Fidelity fund are based on numerous factors, may not be relied on as an indication of trading intent on behalf of any Fidelity fund.
Annual Report
Shareholder Expense Example
As a shareholder of the Fund, you incur two types of costs: (1) transaction costs, and (2) ongoing costs, including management fees and other Fund expenses. This Example is intended to help you understand your ongoing costs (in dollars) of investing in the Fund and to compare these costs with the ongoing costs of investing in other mutual funds.
The Example is based on an investment of $1,000 invested at the beginning of the period and held for the entire period (February 1, 2012 to July 31, 2012).
Actual Expenses
The first line of the accompanying table for each class of the Fund provides information about actual account values and actual expenses. You may use the information in this line, together with the amount you invested, to estimate the expenses that you paid over the period. Simply divide your account value by $1,000.00 (for example, an $8,600 account value divided by $1,000.00 = 8.6), then multiply the result by the number in the first line for a class of the Fund under the heading entitled "Expenses Paid During Period" to estimate the expenses you paid on your account during this period. A small balance maintenance fee of $12.00 that is charged once a year may apply for certain accounts with a value of less than $2,000. This fee is not included in the table below. If it was, the estimate of expenses you paid during the period would be higher, and your ending account value lower, by this amount. In addition, the Fund, as a shareholder in the underlying Fidelity Central Funds, will indirectly bear its pro-rata share of the fees and expenses incurred by the underlying Fidelity Central Funds. These fees and expenses are not included in the Fund's annualized expense ratio used to calculate the expense estimate in the table below.
Hypothetical Example for Comparison Purposes
The second line of the accompanying table for each class of the Fund provides information about hypothetical account values and hypothetical expenses based on a Class' actual expense ratio and an assumed rate of return of 5% per year before expenses, which is not the Class' actual return. The hypothetical account values and expenses may not be used to estimate the actual ending account balance or expenses you paid for the period. You may use this information to compare the ongoing costs of investing in the Fund and other funds. To do so, compare this 5% hypothetical example with the 5% hypothetical examples that appear in the shareholder reports of the other funds. A small balance maintenance fee of $12.00 that is charged once a year may apply for certain accounts with a value of less than $2,000. This fee is not included in the table below. If it was, the estimate of expenses you paid during the period would be higher, and your ending account value lower, by this amount. In addition, the Fund, as a shareholder in the underlying Fidelity Central Funds, will indirectly bear its pro-rata share of the fees and expenses incurred by the underlying Fidelity Central Funds. These fees and expenses are not included in the Fund's annualized expense ratio used to calculate the expense estimate in the table below.
Please note that the expenses shown in the table are meant to highlight your ongoing costs only and do not reflect any transaction costs. Therefore, the second line of the table is useful in comparing ongoing costs only, and will not help you determine the relative total costs of owning different funds.
Annual Report
| Annualized
Expense Ratio | Beginning
Account Value
February 1, 2012 | Ending
Account Value
July 31, 2012 | Expenses Paid
During Period*
February 1, 2012
to July 31, 2012 |
OTC | .83% | | | |
Actual | | $ 1,000.00 | $ 977.20 | $ 4.08 |
HypotheticalA | | $ 1,000.00 | $ 1,020.74 | $ 4.17 |
Class K | .71% | | | |
Actual | | $ 1,000.00 | $ 978.10 | $ 3.49 |
HypotheticalA | | $ 1,000.00 | $ 1,021.33 | $ 3.57 |
A 5% return per year before expenses
* Expenses are equal to each Class' annualized expense ratio, multiplied by the average account value over the period, multiplied by 182/366 (to reflect the one-half year period).
Annual Report
Investment Changes (Unaudited)
Top Ten Stocks as of July 31, 2012 |
| % of fund's
net assets | % of fund's net assets
6 months ago |
Apple, Inc. | 13.4 | 13.3 |
Google, Inc. Class A | 8.0 | 5.8 |
Microsoft Corp. | 5.7 | 3.9 |
NVIDIA Corp. | 4.6 | 2.6 |
Questcor Pharmaceuticals, Inc. | 3.2 | 2.6 |
Amazon.com, Inc. | 2.8 | 2.1 |
Costco Wholesale Corp. | 2.3 | 0.0 |
Tesla Motors, Inc. | 2.0 | 1.9 |
Oracle Corp. | 2.0 | 2.6 |
Accretive Health, Inc. | 1.9 | 3.5 |
| 45.9 | |
Top Five Market Sectors as of July 31, 2012 |
| % of fund's
net assets | % of fund's net assets
6 months ago |
Information Technology | 55.9 | 55.9 |
Consumer Discretionary | 14.8 | 15.9 |
Health Care | 13.8 | 14.3 |
Consumer Staples | 4.7 | 3.1 |
Financials | 3.0 | 2.1 |
Asset Allocation (% of fund's net assets) |
As of July 31, 2012 * | As of January 31, 2012 ** |
 | Stocks 100.1% | | | Stocks 100.2% | |
 | Short-Term
Investments and
Net Other Assets
(Liabilities)† (0.1)% | | | Short-Term
Investments and
Net Other Assets
(Liabilities)† (0.2)% | |
* Foreign investments | 10.2% | | ** Foreign investments | 11.6% | |

† Short-Term Investments and Net Other Assets (Liabilities) are not included in the pie chart.
Annual Report
Investments July 31, 2012
Showing Percentage of Net Assets
Common Stocks - 100.1% |
| Shares | | Value (000s) |
CONSUMER DISCRETIONARY - 14.8% |
Auto Components - 0.0% |
Amerigon, Inc. (a) | 226,600 | | $ 2,549 |
Gentex Corp. | 19,200 | | 307 |
| | 2,856 |
Automobiles - 2.0% |
Tesla Motors, Inc. (a)(d) | 5,204,164 | | 142,698 |
Volkswagen AG sponsored ADR | 15,600 | | 497 |
| | 143,195 |
Hotels, Restaurants & Leisure - 1.0% |
Bravo Brio Restaurant Group, Inc. (a) | 543,625 | | 9,823 |
Chipotle Mexican Grill, Inc. (a) | 65,400 | | 19,118 |
Dunkin' Brands Group, Inc. | 37,400 | | 1,132 |
Las Vegas Sands Corp. | 9,200 | | 335 |
Starbucks Corp. | 860,700 | | 38,972 |
Texas Roadhouse, Inc. Class A | 37,625 | | 651 |
| | 70,031 |
Household Durables - 1.3% |
D.R. Horton, Inc. | 2,427,400 | | 42,795 |
iRobot Corp. (a) | 19,993 | | 455 |
Lennar Corp. Class A | 28,000 | | 818 |
PulteGroup, Inc. (a) | 80,100 | | 905 |
SodaStream International Ltd. (a)(d) | 228,258 | | 8,904 |
Toll Brothers, Inc. (a) | 1,246,100 | | 36,349 |
| | 90,226 |
Internet & Catalog Retail - 3.4% |
Amazon.com, Inc. (a) | 861,296 | | 200,940 |
ASOS PLC (a) | 16,200 | | 460 |
Groupon, Inc. Class A (a)(d) | 1,390,500 | | 9,261 |
Ocado Group PLC (a) | 276,465 | | 321 |
Start Today Co. Ltd. (d) | 2,507,400 | | 33,177 |
| | 244,159 |
Leisure Equipment & Products - 0.0% |
Brunswick Corp. | 170,400 | | 3,747 |
Media - 3.2% |
Comcast Corp. Class A | 2,856,300 | | 92,973 |
DIRECTV (a) | 775,100 | | 38,491 |
Discovery Communications, Inc. (a) | 463,900 | | 23,487 |
DISH Network Corp. Class A | 547,900 | | 16,853 |
Lions Gate Entertainment Corp. (a)(d) | 1,798,557 | | 24,191 |
Pandora Media, Inc. (a)(d) | 946,219 | | 9,339 |
Common Stocks - continued |
| Shares | | Value (000s) |
CONSUMER DISCRETIONARY - continued |
Media - continued |
Sirius XM Radio, Inc. (a)(d) | 10,514,884 | | $ 22,712 |
WPP PLC sponsored ADR | 7,500 | | 477 |
| | 228,523 |
Specialty Retail - 2.1% |
Barnes & Noble, Inc. (a)(d) | 751,094 | | 9,967 |
Bed Bath & Beyond, Inc. (a) | 134,451 | | 8,195 |
Five Below, Inc. | 7,500 | | 220 |
Francescas Holdings Corp. (a)(d) | 1,043,409 | | 32,773 |
Inditex SA | 9,212 | | 950 |
Lowe's Companies, Inc. | 2,832,100 | | 71,850 |
Monro Muffler Brake, Inc. | 133,900 | | 4,428 |
Urban Outfitters, Inc. (a) | 728,800 | | 22,265 |
| | 150,648 |
Textiles, Apparel & Luxury Goods - 1.8% |
Deckers Outdoor Corp. (a) | 14,530 | | 606 |
lululemon athletica, Inc. (a)(d) | 1,876,646 | | 105,993 |
Michael Kors Holdings Ltd. | 10,600 | | 438 |
Ralph Lauren Corp. | 3,100 | | 447 |
Steven Madden Ltd. (a) | 10,850 | | 439 |
Vera Bradley, Inc. (a) | 778,100 | | 17,733 |
| | 125,656 |
TOTAL CONSUMER DISCRETIONARY | | 1,059,041 |
CONSUMER STAPLES - 4.7% |
Beverages - 0.0% |
Monster Beverage Corp. (a) | 6,200 | | 412 |
Food & Staples Retailing - 2.3% |
Costco Wholesale Corp. | 1,736,100 | | 166,978 |
Whole Foods Market, Inc. | 4,500 | | 413 |
| | 167,391 |
Food Products - 2.4% |
Diamond Foods, Inc. (d) | 21,700 | | 353 |
Green Mountain Coffee Roasters, Inc. (a)(d) | 4,979,104 | | 90,918 |
Kraft Foods, Inc. Class A | 1,986,400 | | 78,880 |
| | 170,151 |
TOTAL CONSUMER STAPLES | | 337,954 |
Common Stocks - continued |
| Shares | | Value (000s) |
ENERGY - 1.1% |
Energy Equipment & Services - 0.6% |
Cameron International Corp. (a) | 23,600 | | $ 1,186 |
Halliburton Co. | 284,400 | | 9,422 |
Heckmann Corp. (a)(d) | 114,600 | | 353 |
National Oilwell Varco, Inc. | 293,400 | | 21,213 |
Ocean Rig UDW, Inc. (United States) | 677,900 | | 10,162 |
Schlumberger Ltd. | 53,600 | | 3,820 |
| | 46,156 |
Oil, Gas & Consumable Fuels - 0.5% |
Alpha Natural Resources, Inc. (a) | 221,921 | | 1,556 |
Amyris, Inc. (a)(d) | 275,982 | | 1,068 |
Cobalt International Energy, Inc. (a) | 696,298 | | 17,477 |
Gulfport Energy Corp. (a) | 82,320 | | 1,696 |
Kosmos Energy Ltd. (a) | 153,442 | | 1,464 |
Noble Energy, Inc. | 30,600 | | 2,675 |
Peabody Energy Corp. | 34,500 | | 720 |
Plains Exploration & Production Co. (a) | 25,400 | | 1,015 |
Rosetta Resources, Inc. (a) | 109,250 | | 4,558 |
Solazyme, Inc. (a)(d) | 42,541 | | 584 |
| | 32,813 |
TOTAL ENERGY | | 78,969 |
FINANCIALS - 3.0% |
Capital Markets - 0.2% |
WisdomTree Investments, Inc. (a) | 1,969,720 | | 13,177 |
Commercial Banks - 2.2% |
First Republic Bank | 428,400 | | 13,936 |
Fulton Financial Corp. | 40,200 | | 369 |
HDFC Bank Ltd. sponsored ADR | 18,700 | | 634 |
Huntington Bancshares, Inc. | 8,204,200 | | 50,989 |
National Penn Bancshares, Inc. | 45,900 | | 406 |
UMB Financial Corp. | 649,900 | | 31,234 |
Wells Fargo & Co. | 1,703,900 | | 57,609 |
| | 155,177 |
Consumer Finance - 0.6% |
Capital One Financial Corp. | 760,800 | | 42,978 |
Common Stocks - continued |
| Shares | | Value (000s) |
FINANCIALS - continued |
Diversified Financial Services - 0.0% |
CME Group, Inc. | 21,500 | | $ 1,120 |
NBH Holdings Corp. Class A (a)(f) | 110,800 | | 1,967 |
| | 3,087 |
TOTAL FINANCIALS | | 214,419 |
HEALTH CARE - 13.8% |
Biotechnology - 7.1% |
Achillion Pharmaceuticals, Inc. (a) | 1,191,200 | | 7,886 |
Alkermes PLC (a) | 796,636 | | 14,809 |
Alnylam Pharmaceuticals, Inc. (a)(d) | 224,000 | | 4,187 |
Amarin Corp. PLC ADR (a)(d) | 1,779,261 | | 20,835 |
Amgen, Inc. | 952,500 | | 78,677 |
ARIAD Pharmaceuticals, Inc. (a) | 26,300 | | 503 |
ArQule, Inc. (a) | 2,019,127 | | 12,216 |
Biogen Idec, Inc. (a) | 411,800 | | 60,053 |
BioMarin Pharmaceutical, Inc. (a) | 11,400 | | 448 |
Cepheid, Inc. (a) | 19,300 | | 618 |
Clovis Oncology, Inc. (d) | 378,748 | | 6,700 |
Genomic Health, Inc. (a) | 12,720 | | 427 |
Gilead Sciences, Inc. (a) | 1,941,000 | | 105,455 |
ImmunoGen, Inc. (a)(d) | 297,309 | | 4,799 |
InterMune, Inc. (a) | 619,020 | | 5,466 |
Ironwood Pharmaceuticals, Inc. Class A (a) | 1,489,100 | | 19,165 |
Isis Pharmaceuticals, Inc. (a)(d) | 80,849 | | 980 |
Medivation, Inc. (a) | 676,820 | | 67,479 |
Mesoblast Ltd. (a)(d) | 70,173 | | 464 |
NPS Pharmaceuticals, Inc. (a) | 337,200 | | 2,600 |
OncoGenex Pharmaceuticals, Inc. (a) | 392,682 | | 5,482 |
ONYX Pharmaceuticals, Inc. (a) | 219,400 | | 16,448 |
Seattle Genetics, Inc. (a) | 19,303 | | 505 |
Targacept, Inc. (a) | 156,349 | | 675 |
Theravance, Inc. (a) | 27,800 | | 810 |
Threshold Pharmaceuticals, Inc. (a) | 151,100 | | 1,049 |
Vertex Pharmaceuticals, Inc. (a) | 1,305,204 | | 63,315 |
Vical, Inc. (a) | 135,600 | | 469 |
ZIOPHARM Oncology, Inc. (a) | 340,900 | | 1,919 |
| | 504,439 |
Health Care Equipment & Supplies - 0.1% |
Abiomed, Inc. (a)(d) | 127,600 | | 2,877 |
Common Stocks - continued |
| Shares | | Value (000s) |
HEALTH CARE - continued |
Health Care Equipment & Supplies - continued |
DexCom, Inc. (a) | 56,400 | | $ 621 |
Endologix, Inc. (a) | 29,300 | | 344 |
Mako Surgical Corp. (a) | 135,863 | | 1,731 |
Masimo Corp. (a) | 17,600 | | 394 |
Volcano Corp. (a) | 18,400 | | 487 |
| | 6,454 |
Health Care Providers & Services - 2.5% |
Accretive Health, Inc. (a)(d)(e) | 9,934,802 | | 134,915 |
Catamaran Corp. (a) | 10,500 | | 892 |
Catamaran Corp. (a) | 224,300 | | 18,956 |
HMS Holdings Corp. (a) | 682,000 | | 23,468 |
| | 178,231 |
Health Care Technology - 0.0% |
athenahealth, Inc. (a) | 37,800 | | 3,459 |
Merge Healthcare, Inc. (a)(d) | 165,592 | | 490 |
| | 3,949 |
Life Sciences Tools & Services - 0.4% |
Fluidigm Corp. (a) | 27,183 | | 354 |
Life Technologies Corp. (a) | 589,100 | | 25,850 |
| | 26,204 |
Pharmaceuticals - 3.7% |
Elan Corp. PLC sponsored ADR (a) | 1,810,500 | | 20,911 |
Questcor Pharmaceuticals, Inc. (a)(d)(e) | 6,111,554 | | 225,333 |
Roche Holding AG sponsored ADR | 9,900 | | 439 |
Shire PLC sponsored ADR | 186,800 | | 16,098 |
| | 262,781 |
TOTAL HEALTH CARE | | 982,058 |
INDUSTRIALS - 1.9% |
Airlines - 0.9% |
Delta Air Lines, Inc. (a) | 3,992,000 | | 38,523 |
United Continental Holdings, Inc. (a) | 1,251,000 | | 23,631 |
| | 62,154 |
Building Products - 0.1% |
Quanex Building Products Corp. | 430,324 | | 7,272 |
Commercial Services & Supplies - 0.3% |
Stericycle, Inc. (a) | 241,200 | | 22,395 |
Common Stocks - continued |
| Shares | | Value (000s) |
INDUSTRIALS - continued |
Construction & Engineering - 0.0% |
Foster Wheeler AG (a) | 25,884 | | $ 467 |
Electrical Equipment - 0.0% |
II-VI, Inc. (a) | 88,100 | | 1,536 |
Machinery - 0.4% |
Edwards Group Ltd. ADR (a) | 77,900 | | 526 |
Stanley Black & Decker, Inc. | 56,400 | | 3,773 |
Westport Innovations, Inc. (a) | 710,748 | | 26,745 |
| | 31,044 |
Professional Services - 0.2% |
Qualicorp SA (a) | 1,275,000 | | 11,355 |
TOTAL INDUSTRIALS | | 136,223 |
INFORMATION TECHNOLOGY - 55.9% |
Communications Equipment - 2.4% |
Acme Packet, Inc. (a) | 54,775 | | 868 |
Aruba Networks, Inc. (a)(d) | 1,651,846 | | 23,423 |
Cisco Systems, Inc. | 975,300 | | 15,556 |
EchoStar Holding Corp. Class A (a) | 132,700 | | 3,822 |
Palo Alto Networks, Inc. | 8,900 | | 509 |
Polycom, Inc. (a) | 177,970 | | 1,555 |
QUALCOMM, Inc. | 1,591,009 | | 94,951 |
Ubiquiti Networks, Inc. (d) | 1,550,353 | | 21,922 |
ViaSat, Inc. (a) | 160,400 | | 6,143 |
| | 168,749 |
Computers & Peripherals - 15.2% |
Apple, Inc. | 1,562,100 | | 954,069 |
Cray, Inc. (a) | 313,800 | | 3,901 |
Dell, Inc. (a) | 907,300 | | 10,779 |
Fusion-io, Inc. (a)(d) | 2,082,866 | | 39,824 |
NetApp, Inc. (a) | 1,387,700 | | 45,336 |
SanDisk Corp. (a) | 547,250 | | 22,508 |
Silicon Graphics International Corp. (a)(d) | 1,177,474 | | 7,830 |
| | 1,084,247 |
Electronic Equipment & Components - 0.5% |
Audience, Inc. | 361,700 | | 6,529 |
E Ink Holdings, Inc. GDR (a)(f) | 31,400 | | 306 |
InvenSense, Inc. (d) | 941,400 | | 12,144 |
Common Stocks - continued |
| Shares | | Value (000s) |
INFORMATION TECHNOLOGY - continued |
Electronic Equipment & Components - continued |
Maxwell Technologies, Inc. (a)(d) | 54,243 | | $ 353 |
RealD, Inc. (a)(d) | 1,616,600 | | 15,681 |
| | 35,013 |
Internet Software & Services - 11.0% |
Active Network, Inc. (a) | 30,100 | | 427 |
Angie's List, Inc. (d) | 1,498,600 | | 19,482 |
Constant Contact, Inc. (a)(d)(e) | 1,957,036 | | 32,819 |
Dropbox, Inc. (g) | 331,524 | | 3,000 |
eBay, Inc. (a) | 2,748,000 | | 121,736 |
Facebook, Inc. Class B (a)(g) | 335,669 | | 6,559 |
Google, Inc. Class A (a) | 898,822 | | 568,927 |
LinkedIn Corp. (a) | 33,100 | | 3,398 |
Liquidity Services, Inc. (a) | 6,100 | | 279 |
LogMeIn, Inc. (a) | 161,406 | | 3,059 |
Mail.ru Group Ltd. GDR (a)(f) | 8,700 | | 264 |
Millennial Media, Inc. (d) | 574,200 | | 5,702 |
Rackspace Hosting, Inc. (a) | 9,456 | | 415 |
SINA Corp. (a) | 11,600 | | 527 |
Velti PLC (a)(d) | 1,787,551 | | 9,742 |
Web.com Group, Inc. (a) | 695,736 | | 10,784 |
| | 787,120 |
IT Services - 1.6% |
Cardtronics, Inc. (a) | 117,400 | | 3,641 |
Cognizant Technology Solutions Corp. Class A (a) | 942,545 | | 53,508 |
HiSoft Technology International Ltd. ADR (a) | 1,200,580 | | 13,543 |
MasterCard, Inc. Class A | 600 | | 262 |
ServiceSource International, Inc. (a)(d) | 3,637,336 | | 41,029 |
| | 111,983 |
Semiconductors & Semiconductor Equipment - 11.9% |
Altera Corp. | 1,966,000 | | 69,695 |
Applied Micro Circuits Corp. (a) | 464,000 | | 2,654 |
ASML Holding NV | 195,800 | | 11,259 |
Broadcom Corp. Class A | 1,244,300 | | 42,157 |
Cirrus Logic, Inc. (a) | 826,977 | | 30,408 |
Cree, Inc. (a)(d) | 433,600 | | 10,385 |
Inphi Corp. (a)(e) | 1,794,970 | | 19,745 |
LSI Corp. (a) | 575,300 | | 3,970 |
Maxim Integrated Products, Inc. | 966,900 | | 26,329 |
Mellanox Technologies Ltd. (a) | 1,279,651 | | 134,184 |
Monolithic Power Systems, Inc. (a) | 367,700 | | 7,126 |
Common Stocks - continued |
| Shares | | Value (000s) |
INFORMATION TECHNOLOGY - continued |
Semiconductors & Semiconductor Equipment - continued |
NVE Corp. (a)(e) | 463,657 | | $ 25,650 |
NVIDIA Corp. (a) | 24,231,212 | | 328,091 |
NXP Semiconductors NV (a) | 2,701,089 | | 61,018 |
RF Micro Devices, Inc. (a) | 1,728,300 | | 6,706 |
Skyworks Solutions, Inc. (a) | 1,376,000 | | 39,808 |
Volterra Semiconductor Corp. (a) | 1,206,500 | | 27,725 |
| | 846,910 |
Software - 13.3% |
Activision Blizzard, Inc. | 748,600 | | 9,006 |
BroadSoft, Inc. (a)(d) | 121,980 | | 2,995 |
Check Point Software Technologies Ltd. (a) | 1,550,800 | | 75,322 |
Comverse Technology, Inc. (a) | 38,689 | | 210 |
Envivio, Inc. | 938,100 | | 5,619 |
Fortinet, Inc. (a) | 17,300 | | 415 |
Gameloft (a)(e) | 7,764,787 | | 44,521 |
Guidewire Software, Inc. | 967,500 | | 24,826 |
Infoblox, Inc. | 29,800 | | 626 |
Informatica Corp. (a) | 9,700 | | 286 |
Jive Software, Inc. (d) | 477,800 | | 9,570 |
Microsoft Corp. | 13,848,565 | | 408,117 |
MicroStrategy, Inc. Class A (a) | 154,200 | | 17,958 |
Oracle Corp. | 4,620,300 | | 139,533 |
Proofpoint, Inc. (d) | 19,100 | | 264 |
QLIK Technologies, Inc. (a) | 665,800 | | 13,316 |
RealPage, Inc. (a)(d) | 684,700 | | 15,214 |
salesforce.com, Inc. (a) | 346,500 | | 43,091 |
Splunk, Inc. (d) | 192,539 | | 5,661 |
Synchronoss Technologies, Inc. (a)(e) | 3,850,927 | | 73,630 |
Take-Two Interactive Software, Inc. (a) | 209,500 | | 1,839 |
Ubisoft Entertainment SA (a)(e) | 8,920,800 | | 61,686 |
Ubisoft Entertainment SA warrants 10/10/13 (a)(e) | 6,470,130 | | 207 |
| | 953,912 |
TOTAL INFORMATION TECHNOLOGY | | 3,987,934 |
MATERIALS - 2.2% |
Chemicals - 0.3% |
Innophos Holdings, Inc. | 8,156 | | 473 |
Sherwin-Williams Co. | 180,500 | | 24,250 |
| | 24,723 |
Common Stocks - continued |
| Shares | | Value (000s) |
MATERIALS - continued |
Metals & Mining - 1.9% |
AngloGold Ashanti Ltd. sponsored ADR | 492,700 | | $ 16,757 |
Fortescue Metals Group Ltd. sponsored ADR | 50,950 | | 438 |
Randgold Resources Ltd. sponsored ADR | 753,933 | | 67,462 |
Royal Gold, Inc. | 637,800 | | 48,269 |
| | 132,926 |
TOTAL MATERIALS | | 157,649 |
TELECOMMUNICATION SERVICES - 2.7% |
Diversified Telecommunication Services - 0.9% |
Level 3 Communications, Inc. (a) | 3,336,900 | | 64,302 |
Wireless Telecommunication Services - 1.8% |
Clearwire Corp. Class A (a)(d) | 444,034 | | 506 |
NII Holdings, Inc. (a)(e) | 13,057,469 | | 88,138 |
Sprint Nextel Corp. (a) | 8,946,181 | | 39,005 |
| | 127,649 |
TOTAL TELECOMMUNICATION SERVICES | | 191,951 |
TOTAL COMMON STOCKS (Cost $6,552,415) |
7,146,198
|
Money Market Funds - 6.5% |
| | | |
Fidelity Cash Central Fund, 0.17% (b) | 13,290,837 | | 13,291 |
Fidelity Securities Lending Cash Central Fund, 0.18% (b)(c) | 454,081,914 | | 454,082 |
TOTAL MONEY MARKET FUNDS (Cost $467,373) |
467,373
|
TOTAL INVESTMENT PORTFOLIO - 106.6% (Cost $7,019,788) | | 7,613,571 |
NET OTHER ASSETS (LIABILITIES) - (6.6)% | | (470,851) |
NET ASSETS - 100% | $ 7,142,720 |
Legend |
(a) Non-income producing |
(b) Affiliated fund that is available only to investment companies and other accounts managed by Fidelity Investments. The rate quoted is the annualized seven-day yield of the fund at period end. A complete unaudited listing of the fund's holdings as of its most recent quarter end is available upon request. In addition, each Fidelity Central Fund's financial statements, which are not covered by the Fund's Report of Independent Registered Public Accounting Firm, are available on the SEC's website or upon request. |
(c) Investment made with cash collateral received from securities on loan. |
(d) Security or a portion of the security is on loan at period end. |
(e) Affiliated company |
(f) Security exempt from registration under Rule 144A of the Securities Act of 1933. These securities may be resold in transactions exempt from registration, normally to qualified institutional buyers. At the end of the period, the value of these securities amounted to $2,537,000 or 0.0% of net assets. |
(g) Restricted securities - Investment in securities not registered under the Securities Act of 1933 (excluding 144A issues). At the end of the period, the value of restricted securities (excluding 144A issues) amounted to $9,559,000 or 0.1% of net assets. |
Additional information on each restricted holding is as follows: |
Security | Acquisition
Date | Acquisition
Cost (000s) |
Dropbox, Inc. | 5/2/12 | $ 3,000 |
Facebook, Inc. Class B | 3/31/11 - 5/19/11 | $ 8,394 |
Affiliated Central Funds |
Information regarding fiscal year to date income earned by the Fund from investments in Fidelity Central Funds is as follows: |
Fund | Income earned
(Amounts in thousands) |
Fidelity Cash Central Fund | $ 59 |
Fidelity Securities Lending Cash Central Fund | 28,722 |
Total | $ 28,781 |
Other Affiliated Issuers |
An affiliated company is a company in which the Fund has ownership of at least 5% of the voting securities. Fiscal year to date transactions with companies which are or were affiliates are as follows: |
Affiliate
(Amounts in thousands) | Value,
beginning of
period | Purchases | Sales
Proceeds | Dividend
Income | Value,
end of
period |
Accretive Health, Inc. | $ 225,437 | $ 62,478 | $ 1,757 | $ - | $ 134,915 |
Aruba Networks, Inc. | 179,343 | 32,774 | 172,024 | - | - |
Barnes & Noble, Inc. | - | 120,214 | 114,091 | - | - |
Constant Contact, Inc. | - | 52,336 | 5,109 | - | 32,819 |
Gameloft | 51,802 | 1,667 | - | - | 44,521 |
Georesources, Inc. | 47,705 | - | 57,400 | - | - |
Inphi Corp. | - | 40,849 | 9,224 | - | 19,745 |
iRobot Corp. | 57,960 | 9,102 | 52,886 | - | - |
Meru Networks, Inc. | 8,324 | 3,822 | 8,935 | - | - |
MicroStrategy, Inc. Class A | 64,003 | 33,915 | 66,654 | - | - |
NII Holdings, Inc. | - | 293,854 | 30,310 | - | 88,138 |
NVE Corp. | - | 26,957 | 1,512 | - | 25,650 |
Petroleum Development Corp. | 44,294 | - | 40,509 | - | - |
Questcor Pharmaceuticals, Inc. | - | 225,603 | 44,267 | - | 225,333 |
Rackspace Hosting, Inc. | 228,165 | 40,271 | 322,371 | - | - |
Synchronoss Technologies, Inc. | 94,771 | 32,412 | 13,745 | - | 73,630 |
Ubisoft Entertainment SA | - | 63,047 | 1,513 | - | 61,686 |
Ubisoft Entertainment SA warrants 10/10/13 | - | - | - | - | 207 |
Vical, Inc. | 11,079 | 5,826 | 11,590 | - | - |
Total | $ 1,012,883 | $ 1,045,127 | $ 953,897 | $ - | $ 706,644 |
Other Information |
The following is a summary of the inputs used, as of July 31, 2012, involving the Fund's assets and liabilities carried at fair value. The inputs or methodology used for valuing securities may not be an indication of the risk associated with investing in those securities. For more information on valuation inputs, and their aggregation into the levels used in the table below, please refer to the Security Valuation section in the accompanying Notes to Financial Statements. |
Valuation Inputs at Reporting Date: |
Description
(Amounts in thousands) | Total | Level 1 | Level 2 | Level 3 |
Investments in Securities: | | | | |
Equities: | | | | |
Consumer Discretionary | $ 1,059,041 | $ 1,025,864 | $ 33,177 | $ - |
Consumer Staples | 337,954 | 337,954 | - | - |
Energy | 78,969 | 78,969 | - | - |
Financials | 214,419 | 212,452 | - | 1,967 |
Health Care | 982,058 | 982,058 | - | - |
Industrials | 136,223 | 136,223 | - | - |
Information Technology | 3,987,934 | 3,978,375 | 6,559 | 3,000 |
Materials | 157,649 | 157,649 | - | - |
Telecommunication Services | 191,951 | 191,951 | - | - |
Money Market Funds | 467,373 | 467,373 | - | - |
Total Investments in Securities: | $ 7,613,571 | $ 7,568,868 | $ 39,736 | $ 4,967 |
Distribution of investments by country or territory of incorporation, as a percentage of total net assets, is as follows. (Unaudited) |
United States of America | 89.8% |
Israel | 3.2% |
France | 1.5% |
Bailiwick of Jersey | 1.3% |
Canada | 1.1% |
Netherlands | 1.0% |
Others (Individually Less Than 1%) | 2.1% |
| 100.0% |
See accompanying notes which are an integral part of the financial statements.
Annual Report
Statement of Assets and Liabilities
Amounts in thousands (except per-share amounts) | July 31, 2012 |
| | |
Assets | | |
Investment in securities, at value (including securities loaned of $449,389) - See accompanying schedule: Unaffiliated issuers (cost $5,608,179) | $ 6,439,554 | |
Fidelity Central Funds (cost $467,373) | 467,373 | |
Other affiliated issuers (cost $944,236) | 706,644 | |
Total Investments (cost $7,019,788) | | $ 7,613,571 |
Cash | | 811 |
Receivable for investments sold | | 126,392 |
Receivable for fund shares sold | | 3,022 |
Dividends receivable | | 798 |
Distributions receivable from Fidelity Central Funds | | 2,193 |
Other receivables | | 452 |
Total assets | | 7,747,239 |
| | |
Liabilities | | |
Payable for investments purchased | $ 136,357 | |
Payable for fund shares redeemed | 9,762 | |
Accrued management fee | 2,984 | |
Other affiliated payables | 1,057 | |
Other payables and accrued expenses | 277 | |
Collateral on securities loaned, at value | 454,082 | |
Total liabilities | | 604,519 |
| | |
Net Assets | | $ 7,142,720 |
Net Assets consist of: | | |
Paid in capital | | $ 6,917,451 |
Accumulated net investment loss | | (2,569) |
Accumulated undistributed net realized gain (loss) on investments and foreign currency transactions | | (365,918) |
Net unrealized appreciation (depreciation) on investments and assets and liabilities in foreign currencies | | 593,756 |
Net Assets | | $ 7,142,720 |
See accompanying notes which are an integral part of the financial statements.
Annual Report
Statement of Assets and Liabilities - continued
Amounts in thousands (except per-share amounts) | July 31, 2012 |
| | |
OTC:
Net Asset Value, offering price and redemption price per share ($5,498,647 ÷ 95,574 shares) | | $ 57.53 |
| | |
Class K:
Net Asset Value, offering price and redemption price per share ($1,644,073 ÷ 28,377 shares) | | $ 57.94 |
See accompanying notes which are an integral part of the financial statements.
Annual Report
Financial Statements - continued
Statement of Operations
Amounts in thousands | Year ended July 31, 2012 |
| | |
Investment Income | | |
Dividends | | $ 23,210 |
Special dividends | | 4,466 |
Interest | | 52 |
Income from Fidelity Central Funds (including $28,722 from security lending) | | 28,781 |
Total income | | 56,509 |
| | |
Expenses | | |
Management fee
Basic fee | $ 45,510 | |
Performance adjustment | 6,446 | |
Transfer agent fees | 12,189 | |
Accounting and security lending fees | 1,278 | |
Custodian fees and expenses | 267 | |
Independent trustees' compensation | 50 | |
Registration fees | 217 | |
Audit | 70 | |
Legal | 27 | |
Interest | 6 | |
Miscellaneous | 80 | |
Total expenses before reductions | 66,140 | |
Expense reductions | (1,184) | 64,956 |
Net investment income (loss) | | (8,447) |
Realized and Unrealized Gain (Loss) Net realized gain (loss) on: | | |
Investment securities: | | |
Unaffiliated issuers | (26,799) | |
Other affiliated issuers | 131,175 | |
Foreign currency transactions | (235) | |
Total net realized gain (loss) | | 104,141 |
Change in net unrealized appreciation (depreciation) on: Investment securities | (349,475) | |
Assets and liabilities in foreign currencies | 2 | |
Total change in net unrealized appreciation (depreciation) | | (349,473) |
Net gain (loss) | | (245,332) |
Net increase (decrease) in net assets resulting from operations | | $ (253,779) |
See accompanying notes which are an integral part of the financial statements.
Annual Report
Statement of Changes in Net Assets
Amounts in thousands | Year ended
July 31,
2012 | Year ended
July 31,
2011 |
Increase (Decrease) in Net Assets | | |
Operations | | |
Net investment income (loss) | $ (8,447) | $ (32,610) |
Net realized gain (loss) | 104,141 | 893,317 |
Change in net unrealized appreciation (depreciation) | (349,473) | 918,202 |
Net increase (decrease) in net assets resulting
from operations | (253,779) | 1,778,909 |
Share transactions - net increase (decrease) | (340,677) | (58,129) |
Total increase (decrease) in net assets | (594,456) | 1,720,780 |
| | |
Net Assets | | |
Beginning of period | 7,737,176 | 6,016,396 |
End of period (including accumulated net investment loss of $2,569 and accumulated net investment loss of $134, respectively) | $ 7,142,720 | $ 7,737,176 |
See accompanying notes which are an integral part of the financial statements.
Annual Report
Financial Highlights - OTC
Years ended July 31, | 2012 | 2011 | 2010 | 2009 | 2008 |
Selected Per-Share Data | | | | |
Net asset value, beginning of period | $ 59.28 | $ 45.00 | $ 38.73 | $ 44.66 | $ 47.09 |
Income from Investment Operations | | | | | |
Net investment income (loss) B | (.08) E | (.27) | (.23) | (.12) | (.20) |
Net realized and unrealized gain (loss) | (1.67) | 14.55 | 6.50 | (5.81) | (2.23) |
Total from investment operations | (1.75) | 14.28 | 6.27 | (5.93) | (2.43) |
Net asset value, end of period | $ 57.53 | $ 59.28 | $ 45.00 | $ 38.73 | $ 44.66 |
Total Return A | (2.95)% | 31.73% | 16.19% | (13.28)% | (5.16)% |
Ratios to Average Net Assets C, F | | | | |
Expenses before reductions | .91% | .94% | 1.06% | 1.13% | 1.06% |
Expenses net of fee waivers, if any | .91% | .94% | 1.06% | 1.13% | 1.06% |
Expenses net of all reductions | .90% | .92% | 1.04% | 1.13% | 1.05% |
Net investment income (loss) | (.14)% E | (.49)% | (.51)% | (.37)% | (.42)% |
Supplemental Data | | | | |
Net assets, end of period (in millions) | $ 5,499 | $ 6,374 | $ 5,080 | $ 4,677 | $ 6,871 |
Portfolio turnover rate D | 149% | 158% | 163% | 151% | 145% |
A Total returns would have been lower if certain expenses had not been reduced during the applicable periods shown.
B Calculated based on average shares outstanding during the period.
C Fees and expenses of any underlying Fidelity Central Funds are not included in the Fund's expense ratio. The Fund indirectly bears its proportionate share of the expenses of any underlying Fidelity Central Funds.
D Amount does not include the portfolio activity of any underlying Fidelity Central Funds.
E Investment income per share reflects a large, non-recurring dividend which amounted to $.03 per share. Excluding this non-recurring dividend, the ratio of net investment income (loss) to average net assets would have been (.20)%.
F Expense ratios reflect operating expenses of the class. Expenses before reductions do not reflect amounts reimbursed by the investment adviser or reductions from brokerage service arrangements or reductions from other expense offset arrangements and do not represent the amount paid by the class during periods when reimbursements or reductions occur. Expenses net of fee waivers reflect expenses after reimbursement by the investment adviser but prior to reductions from brokerage service arrangements or other expense offset arrangements. Expenses net of all reductions represent the net expenses paid by the class.
See accompanying notes which are an integral part of the financial statements.
Annual Report
Financial Highlights - Class K
Years ended July 31, | 2012 | 2011 | 2010 | 2009 | 2008 I |
Selected Per-Share Data | | | | |
Net asset value, beginning of period | $ 59.61 | $ 45.19 | $ 38.83 | $ 44.68 | $ 47.79 |
Income from Investment Operations | | | | | |
Net investment income (loss) D | - H, K | (.19) | (.16) | (.05) | (.05) |
Net realized and unrealized gain (loss) | (1.67) | 14.61 | 6.52 | (5.80) | (3.06) |
Total from investment operations | (1.67) | 14.42 | 6.36 | (5.85) | (3.11) |
Net asset value, end of period | $ 57.94 | $ 59.61 | $ 45.19 | $ 38.83 | $ 44.68 |
Total Return B, C | (2.80)% | 31.91% | 16.38% | (13.09)% | (6.51)% |
Ratios to Average Net Assets E, J | | | | |
Expenses before reductions | .77% | .80% | .90% | .92% | .91% A |
Expenses net of fee waivers, if any | .77% | .80% | .90% | .92% | .91% A |
Expenses net of all reductions | .76% | .78% | .88% | .92% | .91% A |
Net investment income (loss) | -% G, H | (.35)% | (.35)% | (.17)% | (.47)% A |
Supplemental Data | | | | |
Net assets, end of period (000 omitted) | $ 1,644,073 | $ 1,363,389 | $ 936,256 | $ 488,683 | $ 93 |
Portfolio turnover rate F | 149% | 158% | 163% | 151% | 145% |
A Annualized
B Total returns for periods of less than one year are not annualized.
C Total returns would have been lower if certain expenses had not been reduced during the applicable periods shown.
D Calculated based on average shares outstanding during the period.
E Fees and expenses of any underlying Fidelity Central Funds are not included in the Fund's expense ratio. The Fund indirectly bears its proportionate share of the expenses of any underlying Fidelity Central Funds.
F Amount does not include the portfolio activity of any underlying Fidelity Central Funds.
G Amount represents less than .01%.
H Investment income per share reflects a large, non-recurring dividend which amounted to $.03 per share. Excluding this non-recurring dividend, the ratio of net investment income (loss) to average net assets would have been (.06)%.
I For the period May 9, 2008 (commencement of sale of shares) to July 31, 2008.
J Expense ratios reflect operating expenses of the class. Expenses before reductions do not reflect amounts reimbursed by the investment adviser or reductions from brokerage service arrangements or reductions from other expense offset arrangements and do not represent the amount paid by the class during periods when reimbursements or reductions occur. Expense ratios before reductions for start-up periods may not be representative of longer-term operating periods. Expenses net of fee waivers reflect expenses after reimbursement by the investment adviser but prior to reductions from brokerage service arrangements or other expense offset arrangements. Expenses net of all reductions represent the net expenses paid by the class.
K Amount represents less than $.01 per share.
See accompanying notes which are an integral part of the financial statements.
Annual Report
Notes to Financial Statements
For the period ended July 31, 2012
(Amounts in thousands except percentages)
1. Organization.
Fidelity OTC Portfolio (the Fund) is a non-diversified fund of Fidelity Securities Fund (the Trust) and is authorized to issue an unlimited number of shares. The Trust is registered under the Investment Company Act of 1940, as amended (the 1940 Act), as an open-end management investment company organized as a Massachusetts business trust. The Fund offers OTC and Class K shares, each of which has equal rights as to assets and voting privileges. Each class has exclusive voting rights with respect to matters that affect that class. Investment income, realized and unrealized capital gains and losses, the common expenses of the Fund, and certain fund-level expense reductions, if any, are allocated on a pro-rata basis to each class based on the relative net assets of each class to the total net assets of the Fund. Each class differs with respect to transfer agent fees incurred. Certain expense reductions may also differ by class.
2. Investments in Fidelity Central Funds.
The Fund invests in Fidelity Central Funds, which are open-end investment companies available only to other investment companies and accounts managed by Fidelity Management & Research Company (FMR) and its affiliates. The Fund's Schedule of Investments lists each of the Fidelity Central Funds held as of period end, if any, as an investment of the Fund, but does not include the underlying holdings of each Fidelity Central Fund. As an Investing Fund, the Fund indirectly bears its proportionate share of the expenses of the underlying Fidelity Central Funds.
The Money Market Central Funds seek preservation of capital and current income and are managed by Fidelity Investments Money Management, Inc. (FIMM), an affiliate of FMR.
A complete unaudited list of holdings for each Fidelity Central Fund is available upon request or at the Securities and Exchange Commission (the SEC) web site at www.sec.gov. In addition, the financial statements of the Fidelity Central Funds, which are not covered by the Fund's Report of Independent Registered Public Accounting Firm, are available on the SEC web site or upon request.
3. Significant Accounting Policies.
The financial statements have been prepared in conformity with accounting principles generally accepted in the United States of America (GAAP), which require management to make certain estimates and assumptions at the date of the financial statements. Actual results could differ from those estimates. Subsequent events, if any, through the date that the financial statements were issued have been evaluated in the preparation of the financial statements. The following summarizes the significant accounting policies of the Fund:
Annual Report
3. Significant Accounting Policies - continued
Security Valuation. Investments are valued as of 4:00 p.m. Eastern time on the last calendar day of the period. In accordance with valuation policies and procedures approved by the Board of Trustees (the Board), the Fund attempts to obtain prices from one or more third party pricing vendor or broker to value its investments. When current market prices, quotations or rates are not readily available or reliable, securities will be fair valued in good faith by the FMR Fair Value Committee (the Committee), in accordance with procedures adopted by the Fund's Board. Factors used in determining fair value vary by security type and may include market or security specific events. The frequency with which these procedures are used cannot be predicted and they may be utilized to a significant extent. The Committee oversees the Fund's valuation policies and procedures and is responsible for approving and reporting to the Board all fair value determinations.
The Fund categorizes the inputs to valuation techniques used to value its investments into a disclosure hierarchy consisting of three levels as shown below:
Level 1 - quoted prices in active markets for identical investments
Level 2 - other significant observable inputs (including quoted prices for similar investments, interest rates, prepayment speeds, etc.)
Level 3 - unobservable inputs (including the Fund's own assumptions based on the best information available)
Valuation techniques used to value the Fund's investments by major category are as follows:
Equity securities, including restricted securities, for which market quotations are readily available, are valued at the last reported sale price or official closing price as reported by a third party pricing vendor on the primary market or exchange on which they are traded and are categorized as Level 1 in the hierarchy. In the event there were no sales during the day or closing prices are not available, securities are valued at the last quoted bid price or may be valued using the last available price and are generally categorized as Level 2 in the hierarchy. For foreign equity securities, when significant market or security specific events arise, comparisons to the valuation of American Depositary Receipts (ADRs), futures contracts, Exchange-Traded Funds (ETFs) and certain indexes as well as quoted prices for similar securities are used and are categorized as Level 2 in the hierarchy. Utilizing these techniques may result in transfers between Level 1 and Level 2. For restricted equity securities and private placements where observable inputs are limited, assumptions about market activity and risk are used and these securities are categorized as Level 3 in the hierarchy.
Annual Report
Notes to Financial Statements - continued
(Amounts in thousands except percentages)
3. Significant Accounting Policies - continued
Security Valuation - continued
Investments in open-end mutual funds, including the Fidelity Central Funds, are valued at their closing net asset value each business day and are categorized as Level 1 in the hierarchy.
Changes in valuation techniques may result in transfers in or out of an assigned level within the disclosure hierarchy. The aggregate value of investments by input level, as of July 31, 2012, is included at the end of the Fund's Schedule of Investments.
Foreign Currency Translation. The Fund may use foreign currency contracts to facilitate transactions in foreign-denominated securities. Gains and losses from these transactions may arise from changes in the value of the foreign currency or if the counterparties do not perform under the contracts' terms.
Foreign-denominated assets, including investment securities, and liabilities are translated into U.S. dollars at the exchange rates at period end. Purchases and sales of investment securities, income and dividends received and expenses denominated in foreign currencies are translated into U.S. dollars at the exchange rate in effect on the transaction date.
The effects of exchange rate fluctuations on investments are included with the net realized and unrealized gain (loss) on investment securities. Other foreign currency transactions resulting in realized and unrealized gain (loss) are disclosed separately.
Investment Transactions and Income. For financial reporting purposes, the Fund's investment holdings and NAV include trades executed through the end of the last business day of the period. The NAV per share for processing shareholder transactions is calculated as of the close of business of the New York Stock Exchange (NYSE), normally 4:00 p.m. Eastern time and includes trades executed through the end of the prior business day. Gains and losses on securities sold are determined on the basis of identified cost and may include proceeds received from litigation. Dividend income is recorded on the ex-dividend date, except for certain dividends from foreign securities where the ex-dividend date may have passed, which are recorded as soon as the Fund is informed of the ex-dividend date. Non-cash dividends included in dividend income, if any, are recorded at the fair market value of the securities received. Distributions received on securities that represent a return of capital or capital gain are recorded as a reduction of cost of investments and/or as a realized gain. The Fund estimates the components of distributions received that may be considered return of capital distributions or capital gain distributions. Large, non-recurring dividends recognized by the Fund are presented separately on the Statement of Operations as "Special Dividends" and the impact of these dividends is presented in the Financial Highlights. Interest income and distributions from the Fidelity Central Funds are accrued as earned. Interest income includes coupon
Annual Report
3. Significant Accounting Policies - continued
Investment Transactions and Income - continued
interest and amortization of premium and accretion of discount on debt securities. Investment income is recorded net of foreign taxes withheld where recovery of such taxes is uncertain.
Expenses. Expenses directly attributable to a fund are charged to that fund. Expenses attributable to more than one fund are allocated among the respective funds on the basis of relative net assets or other appropriate methods. Expense estimates are accrued in the period to which they relate and adjustments are made when actual amounts are known.
Deferred Trustee Compensation. Under a Deferred Compensation Plan (the Plan), independent Trustees may elect to defer receipt of a portion of their annual compensation. Deferred amounts are invested in a cross-section of Fidelity funds, are marked-to-market and remain in the Fund until distributed in accordance with the Plan. The investment of deferred amounts and the offsetting payable to the Trustees are included in the accompanying Statement of Assets and Liabilities.
Income Tax Information and Distributions to Shareholders. Each year, the Fund intends to qualify as a regulated investment company under Subchapter M of the Internal Revenue Code, including distributing substantially all of its taxable income and realized gains. As a result, no provision for income taxes is required. As of July 31, 2012, the Fund did not have any unrecognized tax benefits in the financial statements; nor is the Fund aware of any tax positions for which it is reasonably possible that the total amounts of unrecognized tax benefits will significantly change in the next twelve months. The Fund files a U.S. federal tax return, in addition to state and local tax returns as required. A fund's federal income tax returns are subject to examination by the Internal Revenue Service (IRS) for a period of three fiscal years after they are filed. State and local tax returns may be subject to examination for an additional fiscal year depending on the jurisdiction. Foreign taxes are provided for based on the Fund's understanding of the tax rules and rates that exist in the foreign markets in which it invests.
Distributions are declared and recorded on the ex-dividend date. Income dividends and capital gain distributions are declared separately for each class. Income and capital gain distributions are determined in accordance with income tax regulations, which may differ from GAAP.
Capital accounts within the financial statements are adjusted for permanent book-tax differences. These adjustments have no impact on net assets or the results of operations. Temporary book-tax differences will reverse in a subsequent period.
Annual Report
Notes to Financial Statements - continued
(Amounts in thousands except percentages)
3. Significant Accounting Policies - continued
Income Tax Information and Distributions to Shareholders - continued
Book-tax differences are primarily due to foreign currency transactions, deferred trustees compensation, net operating losses, capital loss carryforwards and losses deferred due to wash sales and excise tax regulations.
The federal tax cost of investment securities and unrealized appreciation (depreciation) as of period end were as follows:
Gross unrealized appreciation | $ 1,256,997 |
Gross unrealized depreciation | (820,877) |
Net unrealized appreciation (depreciation) on securities and other investments | $ 436,120 |
| |
Tax Cost | $ 7,177,451 |
The tax-based components of distributable earnings as of period end were as follows:
Net unrealized appreciation (depreciation) | $ 436,093 |
The Fund intends to elect to defer to its fiscal year ending July 31, 2013 approximately $208,254 of capital losses recognized during the period November 1, 2011 to July 31, 2012.
New Accounting Pronouncement. In December 2011, the Financial Accounting Standards Board issued Accounting Standard Update No. 2011-11, Disclosures about Offsetting Assets and Liabilities. The update creates new disclosure requirements requiring entities to disclose both gross and net information for derivatives and other financial instruments that are either offset in the Statement of Assets and Liabilities or subject to an enforceable master netting arrangement or similar agreement. The disclosure requirements are effective for interim and annual reporting periods beginning on or after January 1, 2013. Management is currently evaluating the impact of the update's adoption on the Fund's financial statement disclosures.
4. Operating Policies.
Restricted Securities. The Fund may invest in securities that are subject to legal or contractual restrictions on resale. These securities generally may be resold in transactions exempt from registration or to the public if the securities are registered. Disposal of these securities may involve time-consuming negotiations and expense, and prompt sale at an acceptable price may be difficult. Information regarding restricted securities is included at the end of the Fund's Schedule of Investments.
Annual Report
5. Purchases and Sales of Investments.
Purchases and sales of securities, other than short-term securities, aggregated $11,131,870 and $11,443,769, respectively.
6. Fees and Other Transactions with Affiliates.
Management Fee. FMR and its affiliates provide the Fund with investment management related services for which the Fund pays a monthly management fee. The management fee is the sum of an individual fund fee rate that is based on an annual rate of .35% of the Fund's average net assets and an annualized group fee rate that averaged .26% during the period. The group fee rate is based upon the average net assets of all the mutual funds advised by FMR. The group fee rate decreases as assets under management increase and increases as assets under management decrease. In addition, the management fee is subject to a performance adjustment (up to a maximum of ± .20% of the Fund's average net assets over a 36 month performance period). The upward or downward adjustment to the management fee is based on the relative investment performance of OTC as compared to an appropriate benchmark index. For the period, the total annual management fee rate, including the performance adjustment, was .70% of the Fund's average net assets.
Transfer Agent Fees. Fidelity Investments Institutional Operations Company, Inc. (FIIOC), an affiliate of FMR, is the transfer, dividend disbursing and shareholder servicing agent for each class of the Fund. FIIOC receives account fees and asset-based fees that vary according to the account size and type of account of the shareholders of OTC. FIIOC receives an asset-based fee of Class K's average net assets. FIIOC pays for typesetting, printing and mailing of shareholder reports, except proxy statements. For the period, transfer agent fees for each class were as follows:
| Amount | % of
Average
Net Assets |
OTC | 11,410 | .19 |
Class K | 779 | .05 |
| $ 12,189 | |
Accounting and Security Lending Fees. Fidelity Service Company, Inc. (FSC), an affiliate of FMR, maintains the Fund's accounting records. The accounting fee is based on the level of average net assets for each month. Under a separate contract, FSC administers the security lending program. The security lending fee is based on the number and duration of lending transactions.
Annual Report
Notes to Financial Statements - continued
(Amounts in thousands except percentages)
6. Fees and Other Transactions with Affiliates - continued
Brokerage Commissions. The Fund placed a portion of its portfolio transactions with brokerage firms which are affiliates of the investment adviser. The commissions paid to these affiliated firms were $754 for the period.
Interfund Lending Program. Pursuant to an Exemptive Order issued by the SEC, the Fund, along with other registered investment companies having management contracts with FMR, may participate in an interfund lending program. This program provides an alternative credit facility allowing the funds to borrow from, or lend money to, other participating affiliated funds. At period end, there were no interfund loans outstanding. The Fund's activity in this program during the period for which loans were outstanding was as follows:
Borrower or Lender | Average Loan
Balance | Weighted Average
Interest Rate | Interest
Expense |
Borrower | $ 15,256 | .38% | $ 6 |
7. Committed Line of Credit.
The Fund participates with other funds managed by FMR or an affiliate in a $4.25 billion credit facility (the "line of credit") to be utilized for temporary or emergency purposes to fund shareholder redemptions or for other short-term liquidity purposes. The Fund has agreed to pay commitment fees on its pro-rata portion of the line of credit, which amounted to $21 and is reflected in Miscellaneous expenses on the Statement of Operations. During the period, there were no borrowings on this line of credit.
8. Security Lending.
The Fund lends portfolio securities through a lending agent from time to time in order to earn additional income. For equity securities, a lending agent is used and may loan securities to certain qualified borrowers, including Fidelity Capital Markets (FCM), a broker-dealer affiliated with the Fund. On the settlement date of the loan, the Fund receives collateral (in the form of U.S. Treasury obligations, letters of credit and/or cash) against the loaned securities and maintains collateral in an amount not less than 100% of the market value of the loaned securities during the period of the loan. The market value of the loaned securities is determined at the close of business of the Fund and any additional required collateral is delivered to the Fund on the next business day. If the borrower defaults on its obligation to return the securities loaned because of insolvency or other reasons, a fund could experience delays and costs in recovering the securities loaned or in gaining access to the collateral. Any cash collateral received is invested in the Fidelity Securities Lending Cash Central Fund. The value of loaned securities and cash collateral at period end are disclosed on the Fund's Statement of Assets and
Annual Report
8. Security Lending - continued
Liabilities. The value of securities loaned to FCM at period end was $23,266. Security lending income represents the income earned on investing cash collateral, less rebates paid to borrowers and any lending agent fees associated with the loan, plus any premium payments received for lending certain types of securities. Security lending income is presented in the Statement of Operations as a component of income from Fidelity Central Funds, and includes $2,194 from securities loaned to FCM.
9. Expense Reductions.
Many of the brokers with whom FMR places trades on behalf of the Fund provided services to the Fund in addition to trade execution. These services included payments of certain expenses on behalf of the Fund totaling $1,184 for the period.
10. Share Transactions.
Transactions for each class of shares were as follows:
| Shares | Dollars |
Years ended July 31, | 2012 | 2011 | 2012 | 2011 |
OTC | | | | |
Shares sold | 24,727 | 24,641 | $ 1,432,210 | $ 1,408,789 |
Shares redeemed | (36,677) | (29,999) | (2,097,412) | (1,594,260) |
Net increase (decrease) | (11,950) | (5,358) | $ (665,202) | $ (185,471) |
Class K | | | | |
Shares sold | 15,671 | 7,657 | $ 918,563 | $ 426,960 |
Shares redeemed | (10,166) | (5,502) | (594,038) | (299,618) |
Net increase (decrease) | 5,505 | 2,155 | $ 324,525 | $ 127,342 |
11. Other.
The Fund's organizational documents provide former and current trustees and officers with a limited indemnification against liabilities arising in connection with the performance of their duties to the Fund. In the normal course of business, the Fund may also enter into contracts that provide general indemnifications. The Fund's maximum exposure under these arrangements is unknown as this would be dependent on future claims that may be made against the Fund. The risk of material loss from such claims is considered remote.
Annual Report
To the Trustees of Fidelity Securities Fund and Shareholders of Fidelity OTC Portfolio:
We have audited the accompanying statement of assets and liabilities of Fidelity OTC Portfolio (the Fund), a fund of Fidelity Securities Fund, including the schedule of investments, as of July 31, 2012, and the related statement of operations for the year then ended, the statement of changes in net assets for each of the two years in the period then ended, and the financial highlights for each of the five years in the period then ended. These financial statements and financial highlights are the responsibility of the Fund's management. Our responsibility is to express an opinion on these financial statements and financial highlights based on our audits.
We conducted our audits in accordance with the standards of the Public Company Accounting Oversight Board (United States). Those standards require that we plan and perform the audit to obtain reasonable assurance about whether the financial statements and financial highlights are free of material misstatement. The Fund is not required to have, nor were we engaged to perform, an audit of its internal control over financial reporting. Our audits included consideration of internal control over financial reporting as a basis for designing audit procedures that are appropriate in the circumstances, but not for the purpose of expressing an opinion on the effectiveness of the Fund's internal control over financial reporting. Accordingly, we express no such opinion. An audit also includes examining, on a test basis, evidence supporting the amounts and disclosures in the financial statements, assessing the accounting principles used and significant estimates made by management, as well as evaluating the overall financial statement presentation. Our procedures included confirmation of securities owned as of July 31, 2012, by correspondence with the custodians and brokers; where replies were not received from brokers, we performed other auditing procedures. We believe that our audits provide a reasonable basis for our opinion.
In our opinion, the financial statements and financial highlights referred to above present fairly, in all material respects, the financial position of Fidelity OTC Portfolio as of July 31, 2012, the results of its operations for the year then ended, the changes in its net assets for each of the two years in the period then ended, and the financial highlights for each of the five years in the period then ended, in conformity with accounting principles generally accepted in the United States of America.
DELOITTE & TOUCHE LLP
Boston, Massachusetts
September 12, 2012
Annual Report
The Trustees, Members of the Advisory Board, and executive officers of the trust and fund, as applicable, are listed below. The Board of Trustees governs the fund and is responsible for protecting the interests of shareholders. The Trustees are experienced executives who meet periodically throughout the year to oversee the fund's activities, review contractual arrangements with companies that provide services to the fund, oversee management of the risks associated with such activities and contractual arrangements, and review the fund's performance. Except for James C. Curvey, each of the Trustees oversees 228 funds advised by FMR or an affiliate. Mr. Curvey oversees 435 funds advised by FMR or an affiliate.
The Trustees hold office without limit in time except that (a) any Trustee may resign; (b) any Trustee may be removed by written instrument, signed by at least two-thirds of the number of Trustees prior to such removal; (c) any Trustee who requests to be retired or who has become incapacitated by illness or injury may be retired by written instrument signed by a majority of the other Trustees; and (d) any Trustee may be removed at any special meeting of shareholders by a two-thirds vote of the outstanding voting securities of the trust. Each Trustee who is not an interested person (as defined in the 1940 Act) (Independent Trustee), shall retire not later than the last day of the calendar year in which his or her 75th birthday occurs. The Independent Trustees may waive this mandatory retirement age policy with respect to individual Trustees. The executive officers and Advisory Board Members hold office without limit in time, except that any officer and Advisory Board Member may resign or may be removed by a vote of a majority of the Trustees at any regular meeting or any special meeting of the Trustees. Except as indicated, each individual has held the office shown or other offices in the same company for the past five years.
Experience, Skills, Attributes, and Qualifications of the Fund's Trustees. The Governance and Nominating Committee has adopted a statement of policy that describes the experience, qualifications, attributes, and skills that are necessary and desirable for potential Independent Trustee candidates (Statement of Policy). The Board believes that each Trustee satisfied at the time he or she was initially elected or appointed a Trustee, and continues to satisfy, the standards contemplated by the Statement of Policy. The Governance and Nominating Committee also engages professional search firms to help identify potential Independent Trustee candidates who have the experience, qualifications, attributes, and skills consistent with the Statement of Policy. From time to time, additional criteria based on the composition and skills of the current Independent Trustees, as well as experience or skills that may be appropriate in light of future changes to board composition, business conditions, and regulatory or other developments, have also been considered by the professional search firms and the Governance and Nominating Committee. In addition, the Board takes into account the Trustees' commitment and participation in Board and committee meetings, as well as their leadership of standing and ad hoc committees throughout their tenure.
In determining that a particular Trustee was and continues to be qualified to serve as a Trustee, the Board has considered a variety of criteria, none of which, in isolation, was controlling. The Board believes that, collectively, the Trustees have balanced and diverse experience, qualifications, attributes, and skills, which allow the Board to operate effectively in governing the fund and protecting the interests of shareholders. Information about the specific experience, skills, attributes, and qualifications of each Trustee, which in each case led to the Board's conclusion that the Trustee should serve (or continue to serve) as a trustee of the fund, is provided below.
Annual Report
Trustees and Officers - continued
Board Structure and Oversight Function. James C. Curvey is an interested person (as defined in the 1940 Act) and currently serves as Chairman. The Trustees have determined that an interested Chairman is appropriate and benefits shareholders because an interested Chairman has a personal and professional stake in the quality and continuity of services provided to the fund. Independent Trustees exercise their informed business judgment to appoint an individual of their choosing to serve as Chairman, regardless of whether the Trustee happens to be independent or a member of management. The Independent Trustees have determined that they can act independently and effectively without having an Independent Trustee serve as Chairman and that a key structural component for assuring that they are in a position to do so is for the Independent Trustees to constitute a substantial majority for the Board. The Independent Trustees also regularly meet in executive session. Ned C. Lautenbach serves as Chairman of the Independent Trustees and as such (i) acts as a liaison between the Independent Trustees and management with respect to matters important to the Independent Trustees and (ii) with management prepares agendas for Board meetings.
Fidelity funds are overseen by different Boards of Trustees. The fund's Board oversees Fidelity's equity and high income funds and another Board oversees Fidelity's investment-grade bond, money market, and asset allocation funds. The asset allocation funds may invest in Fidelity funds overseen by the fund's Board. The use of separate Boards, each with its own committee structure, allows the Trustees of each group of Fidelity funds to focus on the unique issues of the funds they oversee, including common research, investment, and operational issues. On occasion, the separate Boards establish joint committees to address issues of overlapping consequences for the Fidelity funds overseen by each Board.
The Trustees operate using a system of committees to facilitate the timely and efficient consideration of all matters of importance to the Trustees, the fund, and fund shareholders and to facilitate compliance with legal and regulatory requirements and oversight of the fund's activities and associated risks. The Board, acting through its committees, has charged FMR and its affiliates with (i) identifying events or circumstances the occurrence of which could have demonstrably adverse effects on the fund's business and/or reputation; (ii) implementing processes and controls to lessen the possibility that such events or circumstances occur or to mitigate the effects of such events or circumstances if they do occur; and (iii) creating and maintaining a system designed to evaluate continuously business and market conditions in order to facilitate the identification and implementation processes described in (i) and (ii) above. Because the day-to-day operations and activities of the fund are carried out by or through FMR, its affiliates and other service providers, the fund's exposure to risks is mitigated but not eliminated by the processes overseen by the Trustees. While each of the Board's committees has responsibility for overseeing different aspects of the fund's activities, oversight is exercised primarily through the Operations, Audit, and Compliance Committees. In addition, the Independent Trustees have worked with FMR to enhance the Board's oversight of investment and financial risks, legal and regulatory risks, technology risks, and operational risks, including the development of additional risk reporting to the Board. For example, a working group comprised of Independent Trustees and FMR has worked and continues to work to review the Fidelity funds' valuation-related activities, reporting and risk management. Appropriate personnel, including but not limited to the fund's Chief Compliance Officer (CCO), FMR's internal auditor, the independent accountants, the fund's Treasurer and portfolio management personnel, make periodic reports to the Board's committees, as appropriate, including an annual review of FMR's risk management program for the Fidelity funds. The responsibilities of each standing committee, including their oversight responsibilities, are described further under "Standing Committees of the Fund's Trustees."
Annual Report
The fund's Statement of Additional Information (SAI) includes more information about the Trustees. To request a free copy, call Fidelity at 1-800-835-5092.
Interested Trustees*:
Correspondence intended for each Trustee who is an interested person may be sent to Fidelity Investments, 82 Devonshire Street, Boston, Massachusetts 02109.
Name, Age; Principal Occupations and Other Relevant Experience+ |
James C. Curvey (77) |
| Year of Election or Appointment: 2007 Mr. Curvey is Trustee and Chairman of the Board of Trustees of certain Trusts. Mr. Curvey also serves as Trustee (2007-present) of other investment companies advised by FMR. Mr. Curvey is a Director of Fidelity Investments Money Management, Inc. (2009-present), Director of Fidelity Research & Analysis Co. (2009-present) and Director of FMR and FMR Co., Inc. (2007-present). Mr. Curvey is also Vice Chairman (2007-present) and Director of FMR LLC. In addition, Mr. Curvey serves as an Overseer for the Boston Symphony Orchestra and a member of the Trustees of Villanova University. Previously, Mr. Curvey was the Vice Chairman (2006-2007) and Director (2000-2007) of FMR Corp. |
Ronald P. O'Hanley (55) |
| Year of Election or Appointment: 2011 Mr. O'Hanley is Director of FMR Co., Inc. (2010-present), Director of Fidelity Investments Money Management, Inc. (2010-present), Director of Fidelity Research & Analysis Company (2010-present), President of Fidelity Asset Management and Corporate Services and a member of Fidelity's Executive Committee (2010-present). Previously, Mr. O'Hanley served as President and Chief Executive Officer of BNY Mellon Asset Management (2007-2010). Mr. O'Hanley also served as Vice Chairman of Bank New York Mellon Corp. and a member of that firm's Executive Committee. Prior to the 2007 merger of The Bank of New York and Mellon Financial Corporation, he was Vice Chairman of Mellon Financial Corporation and President and Chief Executive Officer of Mellon Asset Management. He joined Mellon in February 1997. Mr. O'Hanley currently serves as Chairman of the Boston Public Library Foundation Board of Directors and sits on the Board of Directors of Beth Israel Deaconess Medical Center, the Board of Trustees of the Marine Biological Laboratory and the Advisory Board of the Maxwell School of Citizenship and Public Administration at Syracuse University. Mr. O'Hanley also chairs the Council on Asset Management for the Financial Services Roundtable and is a member of the Board of Directors of Institutional Investor's U.S. Institute. |
* Trustees have been determined to be "Interested Trustees" by virtue of, among other things, their affiliation with the trust or various entities under common control with FMR.
+ The information above includes each Trustee's principal occupation during the last five years and other information relating to the experience, attributes, and skills relevant to each Trustee's qualifications to serve as a Trustee, which led to the conclusion that each Trustee should serve as a Trustee for the fund.
Annual Report
Independent Trustees:
Correspondence intended for each Independent Trustee (that is, the Trustees other than the Interested Trustees) may be sent to Fidelity Investments, P.O. Box 55235, Boston, Massachusetts 02205-5235.
Name, Age; Principal Occupations and Other Relevant Experience+ |
Dennis J. Dirks (64) |
| Year of Election or Appointment: 2005 Prior to his retirement in May 2003, Mr. Dirks was Chief Operating Officer and a member of the Board of The Depository Trust & Clearing Corporation (DTCC). He also served as President, Chief Operating Officer, and Board member of The Depository Trust Company (DTC) and President and Board member of the National Securities Clearing Corporation (NSCC). In addition, Mr. Dirks served as Chief Executive Officer and Board member of the Government Securities Clearing Corporation, Chief Executive Officer and Board member of the Mortgage-Backed Securities Clearing Corporation, as a Trustee and a member of the Finance Committee of Manhattan College (2005-2008), and as a Trustee and a member of the Finance Committee of AHRC of Nassau County (2006-2008). Mr. Dirks is a member of the Independent Directors Council (IDC) Governing Council (2010-present) and Board of Directors for The Brookville Center for Children's Services, Inc. (2009-present). |
Alan J. Lacy (58) |
| Year of Election or Appointment: 2008 Mr. Lacy serves as Senior Adviser (2007-present) of Oak Hill Capital Partners, L.P. (private equity). Mr. Lacy also served as Chief Executive Officer (2000-2005) and Vice Chairman (2005-2006) of Sears Holdings Corporation and Sears, Roebuck and Co. (retail). In addition, Mr. Lacy serves as a member of the Board of Directors of Dave & Buster's Entertainment, Inc. (restaurant and entertainment complexes, 2010- present), Earth Fare, Inc. (retail grocery, 2012-present), The Hillman Companies, Inc. (hardware wholesalers, 2010-present), and Bristol-Myers Squibb Company (global pharmaceuticals, 2007-present). Mr. Lacy is a member of the Board of Trustees of The National Parks Conservation Association (2006-present). Previously, Mr. Lacy served as Chairman of the Board of Trustees of the National Parks Conservation Association (2008-2011) and as a member of the Board of Directors for the Western Union Company (global money transfer, 2006-2011). |
Ned C. Lautenbach (68) |
| Year of Election or Appointment: 2000 Mr. Lautenbach is Chairman of the Independent Trustees of the Equity and High Income Funds (2006-present). Mr. Lautenbach currently serves as the Lead Director of the Eaton Corporation Board of Directors (diversified industrial, 1997-present). Mr. Lautenbach is Chairman of the Board of Directors of the Philharmonic Center for the Arts in Naples, Florida (2012-present) and a member of the Council on Foreign Relations (1994-present). Previously, Mr. Lautenbach was a Partner/Advisory Partner at Clayton, Dubilier & Rice, LLC (private equity investment, 1998-2010), as well as a Director of Sony Corporation (2006-2007). |
Joseph Mauriello (67) |
| Year of Election or Appointment: 2008 Prior to his retirement in January 2006, Mr. Mauriello served in numerous senior management positions including Deputy Chairman and Chief Operating Officer (2004-2005), and Vice Chairman of Financial Services (2002-2004) of KPMG LLP US (professional services, 1965-2005). Mr. Mauriello currently serves as a member of the Board of Directors of XL Group plc. (global insurance and re-insurance, 2006-present). Previously, Mr. Mauriello served as a Director of the Hamilton Funds of the Bank of New York (2006-2007) and of Arcadia Resources Inc. (health care services and products, 2007-2012). |
Robert W. Selander (61) |
| Year of Election or Appointment: 2011 Previously, Mr. Selander served as a Member of the Advisory Board of Fidelity's Equity and High Income Funds (2011), Executive Vice Chairman (2010), Chief Executive Officer (2009-2010), and President and Chief Executive Officer (1997-2009) of Mastercard, Inc. |
Cornelia M. Small (68) |
| Year of Election or Appointment: 2005 Ms. Small is a member of the Board of Directors of the Teagle Foundation (2009-present). Ms. Small is also a member of the Investment Committee, and Chair (2008-present) and a member of the Board of Trustees of Smith College. In addition, Ms. Small serves on the Investment Committee of the Berkshire Taconic Community Foundation (2008-present). Previously, Ms. Small served as Chairperson of the Investment Committee (2002-2008) of Smith College. In addition, Ms. Small served as Chief Investment Officer, Director of Global Equity Investments, and a member of the Board of Directors of Scudder, Stevens & Clark and Scudder Kemper Investments. |
William S. Stavropoulos (73) |
| Year of Election or Appointment: 2001 Mr. Stavropoulos is Vice Chairman of the Independent Trustees of the Equity and High Income Funds (2006-present). Mr. Stavropoulos serves as President and Founder of the Michigan Baseball Foundation, the Great Lakes Loons (2007-present). Mr. Stavropoulos is Chairman Emeritus of the Board of Directors of The Dow Chemical Company, where he previously served in numerous senior management positions, including President, CEO (1995-2000; 2002-2004), Chairman of the Executive Committee (2000-2006), and as a member of the Board of Directors (1990-2006). Currently, Mr. Stavropoulos is Chairman of Univar (global distributor of commodity and specialty chemicals, 2010-present), a Director of Teradata Corporation (data warehousing and technology solutions, 2008-present), Chemical Financial Corporation, Maersk Inc. (industrial conglomerate), Tyco International, Inc. (multinational manufacturing and services, 2007-present), and a member of the Advisory Board for Metalmark Capital (private equity investment, 2005-present). Mr. Stavropoulos is a special advisor to Clayton, Dubilier & Rice, LLC (private equity investment). In addition, Mr. Stavropoulos is a member of the University of Notre Dame Advisory Council for the College of Science. |
David M. Thomas (63) |
| Year of Election or Appointment: 2008 Previously, Mr. Thomas served as Executive Chairman (2005-2006) and Chairman and Chief Executive Officer (2000-2005) of IMS Health, Inc. (pharmaceutical and healthcare information solutions). In addition, Mr. Thomas serves as a member of the Board of Directors of Fortune Brands, Inc. (consumer products), and Interpublic Group of Companies, Inc. (marketing communication, 2004-present). |
Michael E. Wiley (61) |
| Year of Election or Appointment: 2008 Mr. Wiley also serves as a Director of Asia Pacific Exploration Consolidated (international oil and gas exploration and production, 2008-present). Mr. Wiley serves as a Director of Tesoro Corporation (independent oil refiner and marketer, 2005-present), and a Director of Bill Barrett Corporation (exploration and production, 2005-present). In addition, Mr. Wiley also serves as a Director of Post Oak Bank (privately-held bank, 2004-present). Previously, Mr. Wiley served as a member of the Board of Trustees of the University of Tulsa (2000-2006; 2007-2010), as a Senior Energy Advisor of Katzenbach Partners, LLC (consulting, 2006-2007), as an Advisory Director of Riverstone Holdings (private investment), Chairman, President, and CEO of Baker Hughes, Inc. (oilfield services, 2000-2004), and as Director of Spinnaker Exploration Company (exploration and production, 2001-2005). |
Annual Report
Trustees and Officers - continued
+ The information above includes each Trustee's principal occupation during the last five years and other information relating to the experience, attributes, and skills relevant to each Trustee's qualifications to serve as a Trustee, which led to the conclusion that each Trustee should serve as a Trustee for the fund.
Advisory Board Members and Executive Officers:
Correspondence intended for each executive officer, Edward C. Johnson 3d, Peter S. Lynch, David A. Rosow, and Garnett A. Smith may be sent to Fidelity Investments, 82 Devonshire Street, Boston, Massachusetts 02109.
Name, Age; Principal Occupation |
Edward C. Johnson 3d (82) |
| Year of Election or Appointment: 2011 Member of the Advisory Board of Fidelity's Equity and High Income Funds. Mr. Johnson serves as Chief Executive Officer, Chairman, and a Director of FMR LLC, and also serves as Chairman and Director of FIL Limited. Previously, Mr. Johnson served as a Trustee and Chairman of the Board of certain Fidelity Trusts, Chairman and a Director of FMR, Chairman and a Director of FMR Co., Inc., and President of FMR LLC (2006-2007). |
Peter S. Lynch (68) |
| Year of Election or Appointment: 2003 Member of the Advisory Board of Fidelity's Equity and High Income Funds. Mr. Lynch is Vice Chairman and a Director of FMR and FMR Co., Inc. In addition, Mr. Lynch serves as a Trustee of Boston College and as the Chairman of the Inner-City Scholarship Fund. Previously, Mr. Lynch served on the Special Olympics International Board of Directors (1997-2006). |
David A. Rosow (69) |
| Year of Election or Appointment: 2012 Member of the Advisory Board of Fidelity's Equity and High Income Funds. Chairman and Chief Executive Officer of International Golf Group, Inc. (golf course development, 1990-present). Previously, Mr. Rosow served as Chairman and Chief Executive Officer of Rosow & Company, Inc. (private investment company, 1989-2011), a Lead Director of Hudson United Bancorp (2001-2006) and as a Director of TD Banknorth (1996-2006). In addition, Mr. Rosow is a member (2008-present) and President (2009-present) of the Town Council of Palm Beach, Florida. |
Garnett A. Smith (64) |
| Year of Election or Appointment: 2012 Member of the Advisory Board of Fidelity's Equity and High Income Funds. Prior to Mr. Smith's retirement, he served as Chairman and Chief Executive Officer of Inbrand Corp. (manufacturer of personal absorbent products, 1990-1997). He also served as President (1986-1990) of Inbrand Corp. Prior to his employment with Inbrand Corp., he was employed by a retail fabric chain and North Carolina National Bank. In addition, Mr. Smith is a board member of the Jackson Hole Land Trust (2009-present). |
Kenneth B. Robins (42) |
| Year of Election or Appointment: 2008 President and Treasurer of Fidelity's Equity and High Income Funds. Mr. Robins also serves as President and Treasurer (2010-present) and Assistant Treasurer (2009-present) of other Fidelity funds and is an employee of Fidelity Investments (2004-present). Previously, Mr. Robins served as Deputy Treasurer of the Fidelity funds (2005-2008) and Treasurer and Chief Financial Officer of The North Carolina Capital Management Trust: Cash and Term Portfolios (2006-2008). |
Bruce T. Herring (46) |
| Year of Election or Appointment: 2006 Vice President of certain Equity Funds. Mr. Herring also serves as President of Fidelity Research & Analysis Company (2010-present), Chief Investment Officer and Director of Fidelity Management & Research (U.K.) Inc. (2010-present) and Group Chief Investment Officer of FMR. Previously, Mr. Herring served as Vice President (2005-2006) and Senior Vice President (2006-2007) of Fidelity Management & Research Company, Vice President of FMR Co., Inc. (2001-2007) and as a portfolio manager for Fidelity U.S. Equity Funds. |
Brian B. Hogan (47) |
| Year of Election or Appointment: 2009 Vice President of Equity and High Income Funds. Mr. Hogan also serves as President of FMR's Equity Division (2009-present). Previously, Mr. Hogan served as Senior Vice President, Equity Research of FMR (2006-2009) and as a portfolio manager. |
Scott C. Goebel (44) |
| Year of Election or Appointment: 2008 Secretary and Chief Legal Officer (CLO) of the Fidelity funds. Mr. Goebel also serves as Secretary of Fidelity Investments Money Management, Inc. (FIMM) (2010-present) and Fidelity Research and Analysis Company (FRAC) (2010-present); Secretary and CLO of The North Carolina Capital Management Trust: Cash and Term Portfolios (2008-present); General Counsel, Secretary, and Senior Vice President of FMR (2008-present) and FMR Co., Inc. (2008-present); employed by FMR LLC or an affiliate (2001-present); Chief Legal Officer of Fidelity Management & Research (Hong Kong) Limited (2008-present) and Assistant Secretary of Fidelity Management & Research (Japan) Inc. (2008-present), and Fidelity Management & Research (U.K.) Inc. (2008-present). Previously, Mr. Goebel served as Assistant Secretary of FIMM (2008-2010), FRAC (2008-2010), and the Funds (2007-2008) and as Vice President and Secretary of Fidelity Distributors Corporation (FDC) (2005-2007). |
William C. Coffey (43) |
| Year of Election or Appointment: 2009 Assistant Secretary of Fidelity's Equity and High Income Funds. Mr. Coffey also serves as Senior Vice President and Deputy General Counsel of FMR LLC (2010-present), and is an employee of Fidelity Investments. Previously, Mr. Coffey served as Vice President and Associate General Counsel of FMR LLC (2005-2009). |
Elizabeth Paige Baumann (44) |
| Year of Election or Appointment: 2012 Anti-Money Laundering (AML) Officer of the Fidelity funds. Ms. Baumann also serves as AML Officer of The North Carolina Capital Management Trust: Cash and Term Portfolios (2012-present), Chief AML Officer of FMR LLC (2012-present), and is an employee of Fidelity Investments. Previously, Ms. Baumann served as Vice President and Deputy Anti-Money Laundering Officer (2007-2012). |
Christine Reynolds (53) |
| Year of Election or Appointment: 2008 Chief Financial Officer of the Fidelity funds. Ms. Reynolds became President of Fidelity Pricing and Cash Management Services (FPCMS) in August 2008. Ms. Reynolds served as Chief Operating Officer of FPCMS (2007-2008). Previously, Ms. Reynolds served as President, Treasurer, and Anti-Money Laundering officer of the Fidelity funds (2004-2007). |
Joseph A. Hanlon (44) |
| Year of Election or Appointment: 2012 Chief Compliance Officer of Fidelity's Equity and High Income Funds. Mr. Hanlon serves as Compliance Officer of FMR, FMR Co., Inc., Fidelity Investments Money Management, Inc. (FIMM), Fidelity Research and Analysis Company (FRAC), Fidelity Management & Research (Japan) Inc., Fidelity Management & Research (U.K.) Inc., Fidelity Management & Research (Hong Kong), and Strategic Advisers, Inc. (2009-present), as Senior Vice President of the Fidelity Asset Management Division (2009-present), and is an employee of Fidelity Investments. |
Joseph F. Zambello (55) |
| Year of Election or Appointment: 2011 Deputy Treasurer of the Fidelity funds. Mr. Zambello is an employee of Fidelity Investments. Previously, Mr. Zambello served as Vice President of FMR's Program Management Group (2009-2011) and Vice President of the Transfer Agent Oversight Group (2005-2009). |
Adrien E. Deberghes (44) |
| Year of Election or Appointment: 2008 Deputy Treasurer of Fidelity's Equity and High Income Funds. Mr. Deberghes also serves as Vice President (2011-present) and Assistant Treasurer (2010-present) of other Fidelity funds, and is an employee of Fidelity Investments (2008-present). Previously, Mr. Deberghes served as Senior Vice President of Mutual Fund Administration at State Street Corporation (2007-2008), Senior Director of Mutual Fund Administration at Investors Bank & Trust (2005-2007), and Director of Finance for Dunkin' Brands (2000-2005). |
Stephanie J. Dorsey (43) |
| Year of Election or Appointment: 2010 Assistant Treasurer of Fidelity's Equity and High Income Funds. Ms. Dorsey also serves as Deputy Treasurer of other Fidelity funds (2008-present) and is an employee of Fidelity Investments (2008-present). Previously, Ms. Dorsey served as Treasurer (2004-2008) of the JPMorgan Mutual Funds and Vice President (2004-2008) of JPMorgan Chase Bank. |
John R. Hebble (54) |
| Year of Election or Appointment: 2009 Assistant Treasurer of Fidelity's Equity and High Income Funds. Mr. Hebble also serves as President (2011-present), Treasurer, and Chief Financial Officer of The North Carolina Capital Management Trust: Cash and Term Portfolios (2008-present), President and Treasurer of other Fidelity funds (2008-present) and is an employee of Fidelity Investments. |
Gary W. Ryan (53) |
| Year of Election or Appointment: 2005 Assistant Treasurer of the Fidelity funds. Mr. Ryan is an employee of Fidelity Investments. Previously, Mr. Ryan served as Vice President of Fund Reporting in Fidelity Pricing and Cash Management Services (FPCMS) (1999-2005). |
Jonathan Davis (44) |
| Year of Election or Appointment: 2010 Assistant Treasurer of the Fidelity funds. Mr. Davis is also Assistant Treasurer of Fidelity Rutland Square Trust II and Fidelity Commonwealth Trust II. Mr. Davis is an employee of Fidelity Investments. Previously, Mr. Davis served as Vice President and Associate General Counsel of FMR LLC (2003-2010). |
Annual Report
Board Approval of Investment Advisory Contracts and Management Fees
Fidelity OTC Portfolio
Each year, the Board of Trustees, including the Independent Trustees (together, the Board), votes on the renewal of the management contract and sub-advisory agreements (together, the Advisory Contracts) for the fund. The Board, assisted by the advice of fund counsel and Independent Trustees' counsel, requests and considers a broad range of information relevant to the renewal of the Advisory Contracts throughout the year.
The Board meets regularly and, at each of its meetings, considers factors that are relevant to its annual consideration of the renewal of the fund's Advisory Contracts, including the services and support provided to the fund and its shareholders. The Board has established various standing committees, each composed of and chaired by Independent Trustees with varying backgrounds, to which the Board has assigned specific subject matter responsibilities in order to enhance effective decision-making by the Board. The Board, acting directly and through its Committees, requests and receives information concerning the annual consideration of the renewal of the fund's Advisory Contracts. The Board also meets as needed to consider matters specifically related to the Board's annual consideration of the renewal of Advisory Contracts. Members of the Board may also meet with trustees of other Fidelity funds through ad hoc joint committees to discuss certain matters relevant to the Fidelity funds.
At its July 2012 meeting, the Board of Trustees, including the Independent Trustees, unanimously determined to renew the fund's Advisory Contracts. In reaching its determination, the Board considered all factors it believed relevant, including (i) the nature, extent, and quality of the services to be provided to the fund and its shareholders (including the investment performance of the fund); (ii) the competitiveness of the fund's management fee and total expense ratio relative to peer funds; (iii) the total costs of the services to be provided by and the profits to be realized by Fidelity from its relationship with the fund; (iv) the extent to which economies of scale exist and would be realized as the fund grows; and (v) whether fee levels reflect these economies of scale, if any, for the benefit of fund shareholders.
In considering whether to renew the Advisory Contracts for the fund, the Board reached a determination, with the assistance of fund counsel and Independent Trustees' counsel and through the exercise of its business judgment, that the renewal of the Advisory Contracts is in the best interests of the fund and its shareholders and that the compensation payable under the Advisory Contracts is fair and reasonable. The Board's decision to renew the Advisory Contracts was not based on any single factor, but rather was based on a comprehensive consideration of all the information provided to the Board at its meetings throughout the year. The Board, in reaching its determination to renew the Advisory Contracts, is aware that shareholders in the fund have a broad range of investment choices available to them, including a wide choice among mutual funds offered by Fidelity's competitors, and that the fund's shareholders, who have the opportunity to review and weigh the disclosure provided by the fund in its prospectus and other public disclosures, have chosen to invest in this fund, managed by Fidelity.
Annual Report
Board Approval of Investment Advisory Contracts and
Management Fees - continued
Nature, Extent, and Quality of Services Provided. The Board considered the staffing within the investment adviser, FMR, and the sub-advisers (together, the Investment Advisers), including the backgrounds of the fund's investment personnel, and also considered the fund's investment objective, strategies, and related investment philosophy. The Independent Trustees also had discussions with senior management of Fidelity's investment operations and investment groups. The Board considered the structure of the portfolio manager compensation program and whether this structure provides appropriate incentives to act in the best interests of the fund.
Resources Dedicated to Investment Management and Support Services. The Board and the Fund Oversight and Research Committees reviewed the general qualifications and capabilities of the Investment Advisers' investment staff, including its size, education, experience, and resources, as well as the Investment Advisers' approach to recruiting, training, managing, and compensating investment personnel. The Board also noted that FMR has continued to increase the resources devoted to non-U.S. offices, including expansion of Fidelity's global investment organization. The Board noted that Fidelity's analysts have extensive resources, tools and capabilities that allow them to conduct sophisticated quantitative and fundamental analysis, as well as credit analysis of issuers, counterparties and guarantors. The Board also believes that Fidelity's investment professionals have sufficient access to global information and data so as to provide competitive investment results over time, and that those professionals also have access to sophisticated tools that permit them to assess portfolio construction and risk and performance attribution characteristics continuously, as well as to transmit new information and research conclusions rapidly around the world. Additionally, in its deliberations, the Board considered the Investment Advisers' trading and risk management capabilities and resources, which are an integral part of the investment management process.
Shareholder and Administrative Services. The Board considered (i) the nature, extent, quality, and cost of advisory, administrative, and shareholder services performed by the Investment Advisers and their affiliates under the Advisory Contracts and under separate agreements covering transfer agency, pricing and bookkeeping, and securities lending services for the fund; (ii) the nature and extent of the supervision of third party service providers, principally custodians and subcustodians; and (iii) the resources devoted to, and the record of compliance with, the fund's compliance policies and procedures. The Board also reviewed the allocation of fund brokerage, including allocations to brokers affiliated with the Investment Advisers, the use of brokerage commissions to pay fund expenses, and the use of "soft" commission dollars to pay for research services.
Annual Report
The Board noted that the growth of fund assets over time across the complex allows Fidelity to reinvest in the development of services designed to enhance the value or convenience of the Fidelity funds as investment vehicles. These services include 24-hour access to account information and market information through telephone representatives and over the Internet, investor education materials and asset allocation tools, and the expanded availability of Fidelity Investor Centers.
Investment in a Large Fund Family. The Board considered the benefits to shareholders of investing in a Fidelity fund, including the benefits of investing in a fund that is part of a large family of funds offering a variety of investment disciplines and providing a large variety of mutual fund investor services. The Board noted that Fidelity had taken, or had made recommendations that resulted in the Fidelity funds taking, a number of actions over the previous year that benefited particular funds, including (i) continuing to dedicate additional resources to investment research and support of the senior management team that oversees asset management; (ii) persisting in efforts to enhance Fidelity's research capabilities, in particular, international research; (iii) launching new funds and making other enhancements to meet client needs for global and income-oriented solutions; (iv) continuing to launch dedicated lower cost underlying funds to meet investment management's portfolio construction needs related to expanding underlying fund options, specifically for the Freedom Fund product lines; (v) adopting a "Stock Selector" sector neutral investment approach and employing a team of portfolio managers who are sector specialists to manage certain funds; (vi) rationalizing product lines and gaining increased efficiencies through the mergers of several funds into other funds; (vii) strengthening the Spartan Index Fund product line by adding new funds and/or new low-cost institutional share classes, restructuring fund expenses to accommodate new classes, and reducing investment minimums for certain classes of shares; (viii) modifying the eligibility criteria for Institutional Class shares to increase their appeal to government entities and charitable investors; and (ix) reducing certain transfer agent fee rates.
Investment Performance. The Board considered whether the fund has operated in accordance with its investment objective, as well as its record of compliance with its investment restrictions. It also reviewed the fund's absolute investment performance for each class, as well as the fund's relative investment performance for each class measured over multiple periods against a broad-based securities market index. The Board noted that FMR believes that no meaningful peer group exists for the fund principally because most other funds in the fund's third-party peer group have different and/or broader investment mandates than the fund's more specialized strategies. The following charts considered by the Board show, over the one-, three-, and five-year periods ended December 31, 2011, as available, the cumulative total returns of Class K and the retail class of the fund and the cumulative total returns of a broad-based securities market index ("benchmark").
Annual Report
Board Approval of Investment Advisory Contracts and
Management Fees - continued
Fidelity OTC Portfolio
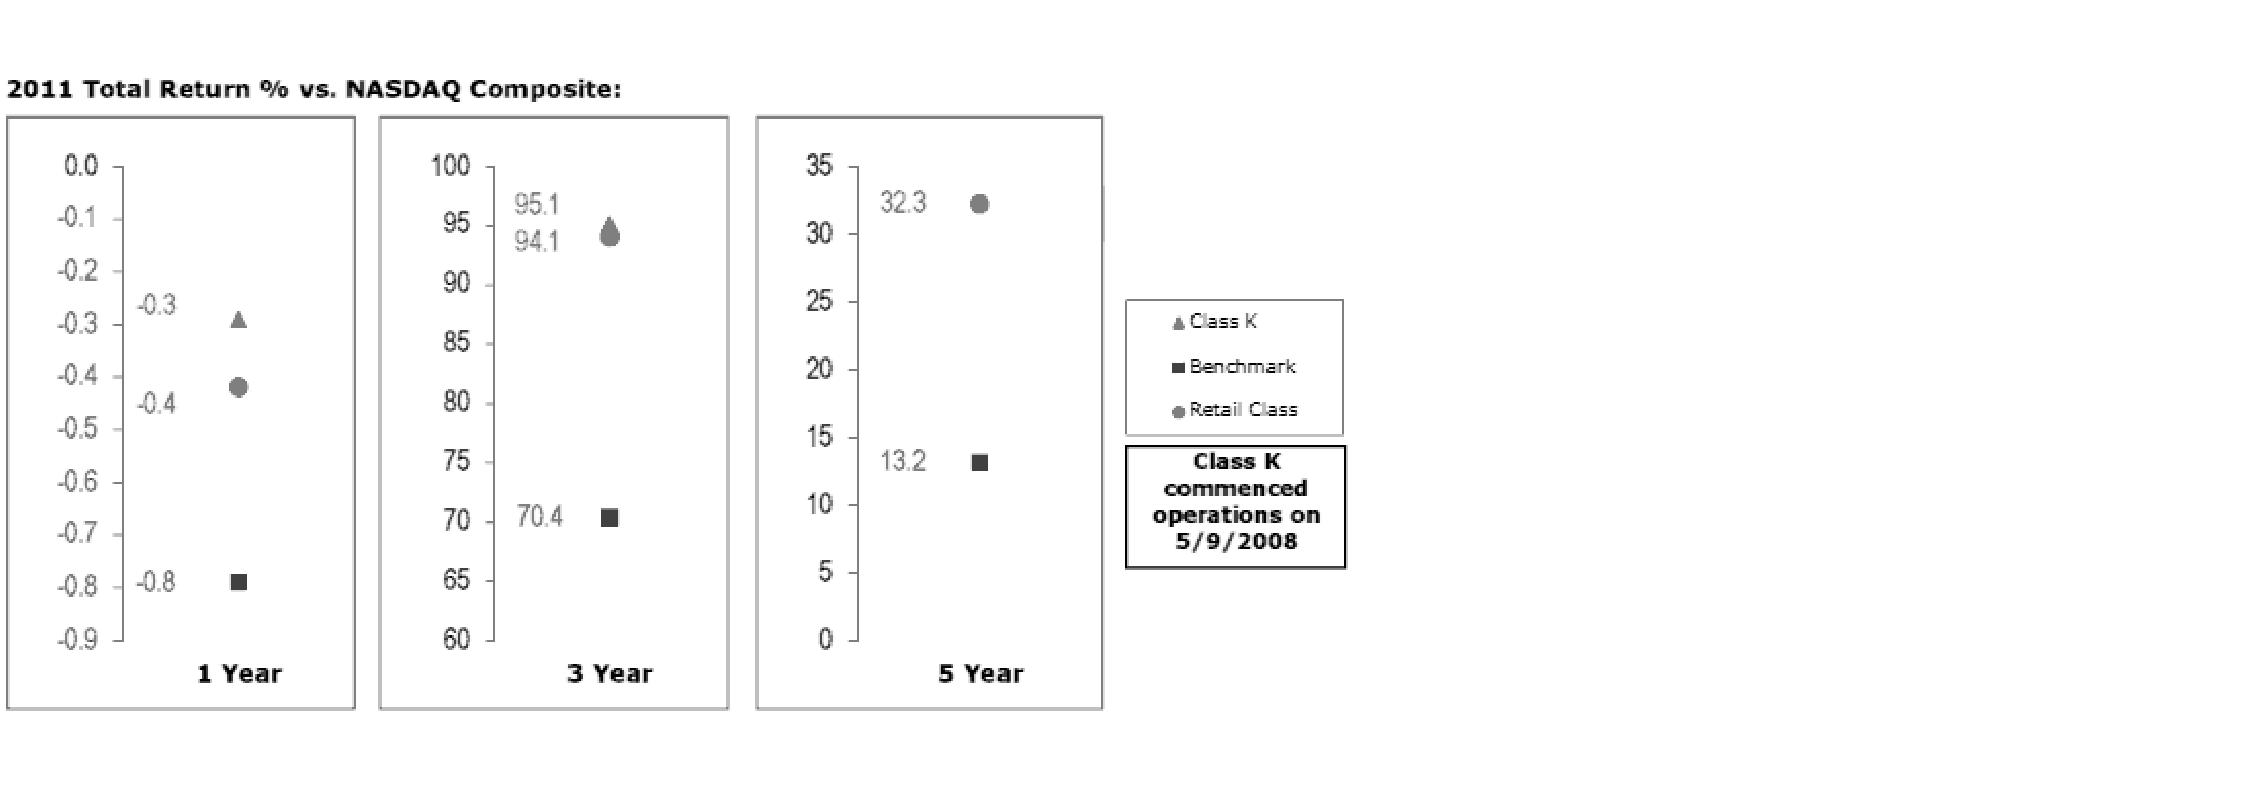
The Board noted that the investment performance of the retail class of the fund (the class with the longer performance record) compared favorably to its benchmark for all the periods shown. The Board considered that the variations in performance between the fund's classes reflect the variations in class expenses, which result in lower performance for the higher expense class. The Board also reviewed the fund's performance since inception as well as performance in the current year.
The Board also considered that the fund's management fee is subject to upward or downward adjustment depending upon whether, and to what extent, the fund's investment performance for the performance period exceeds, or is exceeded by, the record (over the same period) of a Board-approved performance adjustment index. The Board noted that the performance adjustment provides FMR with a strong economic incentive to seek to achieve superior performance for the fund's shareholders and helps to more closely align the interests of FMR and the fund's shareholders.
Based on its review, the Board concluded that the nature, extent, and quality of services provided to the fund under the Advisory Contracts should benefit the fund's shareholders.
Competitiveness of Management Fee and Total Expense Ratio. The Board considered the fund's management fee and total expense ratio compared to "mapped groups" of competitive funds and classes. Fidelity creates "mapped groups" by combining similar Lipper investment objective categories that have comparable management fee characteristics. Combining Lipper investment objective categories aids the Board's management fee and total expense ratio comparisons by broadening the competitive group used for comparison and by reducing the number of universes to which various Fidelity funds are compared.
Annual Report
Management Fee. The Board considered two proprietary management fee comparisons for the 12-month periods shown in the chart below. The group of Lipper funds used by the Board for management fee comparisons is referred to below as the "Total Mapped Group." The Total Mapped Group comparison focuses on a fund's standing relative to the total universe of comparable funds available to investors in terms of gross management fees before expense reimbursements or caps, and without giving effect to the fund's performance adjustment. "TMG %" represents the percentage of funds in the Total Mapped Group that had management fees that were lower than the fund's. For example, a TMG % of 18% means that 82% of the funds in the Total Mapped Group had higher management fees than the fund. The "Asset-Size Peer Group" (ASPG) comparison focuses on a fund's standing relative to non-Fidelity funds similar in size to the fund within the Total Mapped Group. The ASPG represents at least 15% of the funds in the Total Mapped Group with comparable asset size and management fee characteristics, subject to a minimum of 50 funds (or all funds in the Total Mapped Group if fewer than 50). Additional information, such as the ASPG quartile in which the fund's management fee ranked and the impact of the fund's performance adjustment, is also included in the chart and considered by the Board.
Fidelity OTC Portfolio

The Board noted that the fund's management fee ranked below the median of its Total Mapped Group and below the median of its ASPG for 2011. The Board also noted the effect of the fund's positive performance adjustment on the fund's management fee ranking. The Board noted that the performance adjustment for each year represents calculations for performance periods that differ from the periods shown in the performance charts above.
Annual Report
Board Approval of Investment Advisory Contracts and
Management Fees - continued
Based on its review, the Board concluded that the fund's management fee is fair and reasonable in light of the services that the fund receives and the other factors considered.
Total Expense Ratio. In its review of each class's total expense ratio, the Board considered the fund's management fee as well as other fund or class expenses, as applicable, such as transfer agent fees, pricing and bookkeeping fees, and custodial, legal, and audit fees. The Board also noted the effects of any waivers and reimbursements on fees and expenses, as well as the impact of the fund's performance adjustment. As part of its review, the Board also considered the current and historical total expense ratios of each class of the fund compared to competitive fund median expenses. Each class of the fund is compared to those funds and classes in the Total Mapped Group (used by the Board for management fee comparisons) that have a similar sales load structure.
The Board noted that the total expense ratio of each class ranked below its competitive median for 2011.
Fees Charged to Other Fidelity Clients. The Board also considered Fidelity fee structures and other information with respect to clients of FMR and its affiliates, such as other mutual funds advised or subadvised by FMR or its affiliates, pension plan clients, and other institutional clients. The Board noted the findings of the 2010 ad hoc joint committee (created with the board of other Fidelity funds), which reviewed and compared Fidelity's institutional investment advisory business with its business of providing services to the Fidelity funds, including the differences in services provided, fees charged, and costs incurred, as well as competition in their respective marketplaces.
Based on its review of total expense ratios and fees charged to other Fidelity clients, the Board concluded that the total expense ratio of each class of the fund was reasonable in light of the services that the fund and its shareholders receive and the other factors considered.
Costs of the Services and Profitability. The Board considered the revenues earned and the expenses incurred by Fidelity in conducting the business of developing, marketing, distributing, managing, administering and servicing the fund and its shareholders. The Board also considered the level of Fidelity's profits in respect of all the Fidelity funds.
On an annual basis, FMR presents to the Board Fidelity's profitability for the fund. Fidelity calculates the profitability for each fund, as well as aggregate profitability for groups of Fidelity funds and all Fidelity funds, using a series of detailed revenue and cost allocation methodologies which originate with the books and records of Fidelity on which Fidelity's audited financial statements are based. The Audit Committee of the Board reviews any significant changes from the prior year's methodologies.
Annual Report
PricewaterhouseCoopers LLP (PwC), independent registered public accounting firm and auditor to Fidelity and certain Fidelity funds, has been engaged annually by the Board as part of the Board's assessment of Fidelity's profitability analysis. PwC's engagement includes the review and assessment of Fidelity's methodologies used in determining the revenues and expenses attributable to Fidelity's mutual fund business, and completion of agreed-upon procedures surrounding the mathematical accuracy of fund profitability and its conformity to allocation methodologies. After considering PwC's reports issued under the engagement and information provided by Fidelity, the Board concluded that while other allocation methods may also be reasonable, Fidelity's profitability methodologies are reasonable in all material respects.
The Board also reviewed Fidelity's non-fund businesses and fall-out benefits related to the mutual fund business as well as cases where Fidelity's affiliates may benefit from or be related to the fund's business.
The Board considered the costs of the services provided by and the profits realized by Fidelity in connection with the operation of the fund and was satisfied that the profitability was not excessive in the circumstances.
Economies of Scale. The Board considered whether there have been economies of scale in respect of the management of the Fidelity funds, whether the Fidelity funds (including the fund) have appropriately benefited from any such economies of scale, and whether there is potential for realization of any further economies of scale. The Board considered the extent to which the fund will benefit from economies of scale through increased services to the fund, through waivers or reimbursements, or through fee or expense reductions. The Board also noted that in 2009, it and the board of other Fidelity funds created an ad hoc committee (the Economies of Scale Committee) to analyze whether FMR attains economies of scale in respect of the management and servicing of the Fidelity funds, whether the Fidelity funds have appropriately benefited from such economies of scale, and whether there is potential for realization of any further economies of scale.
The Board recognized that the fund's management contract incorporates a "group fee" structure, which provides for lower group fee rates as total fund assets under FMR's management increase, and for higher group fee rates as total fund assets under FMR's management decrease. FMR calculates the group fee rates based on a tiered asset "breakpoint" schedule that varies based on asset class. The Board considered that the group fee is designed to deliver the benefits of economies of scale to fund shareholders when total Fidelity fund assets increase, even if assets of any particular fund are unchanged or have declined, because some portion of Fidelity's costs are attributable to services provided to all Fidelity funds, and all funds benefit if those costs can be allocated among more assets. The Board concluded that, given the group fee structure, fund shareholders will benefit from lower management fees as assets under FMR's management increase at the fund complex level, regardless of whether Fidelity achieves any such economies of scale.
Annual Report
Board Approval of Investment Advisory Contracts and
Management Fees - continued
The Board concluded, taking into account the analysis of the Economies of Scale Committee, that economies of scale, if any, are being appropriately shared between fund shareholders and Fidelity.
Additional Information Requested by the Board. In order to develop fully the factual basis for consideration of the Fidelity funds' Advisory Contracts, the Board requested and received additional information on certain topics, including (i) fund performance trends, actions to be taken by FMR to improve certain funds' overall performance, and Fidelity's long-term strategies for certain funds; (ii) the potential to further rationalize the Fidelity fund lineup with the possibility of achieving savings for the funds and Fidelity; (iii) Fidelity's compensation structure for portfolio managers and other key investment personnel; (iv) the amount of the investment that each portfolio manager has made in the Fidelity fund(s) that he or she manages; (v) the realization of fall-out benefits in certain Fidelity business units; (vi) Fidelity's group fee structures, the potential impact of regulatory changes on such structures, and the rationale for the individual fee rates of certain funds; (vii) fund profitability methodology, including Fidelity's cost allocation methodology, and the impact of certain factors on fund profitability results; (viii) trends regarding industry use of performance fee structures and the possibility of implementing performance fee structures for additional funds; and (ix) the impact of net redemptions from the Fidelity funds.
Based on its evaluation of all of the conclusions noted above, and after considering all factors it believed relevant, the Board ultimately concluded that the advisory fee structures are fair and reasonable, and that the fund's Advisory Contracts should be renewed.
Annual Report
Investment Adviser
Fidelity Management & Research Company
Boston, MA
Investment Sub-Advisers
FMR Co., Inc.
Fidelity Management & Research
(U.K.) Inc.
Fidelity Management & Research
(Hong Kong) Limited
Fidelity Management & Research
(Japan) Inc.
General Distributor
Fidelity Distributors Corporation
Smithfield, RI
Transfer and Service Agents
Fidelity Investments Institutional
Operations Company, Inc.
Boston, MA
Fidelity Service Company, Inc.
Boston, MA
Custodian
The Northern Trust Company
Chicago, IL
(Fidelity Investment logo)(registered trademark)
Corporate Headquarters
82 Devonshire St., Boston, MA 02109
www.fidelity.com
OTC-K-UANN-0912
1.863303.103
Fidelity®
OTC
Portfolio
Annual Report
July 31, 2012
(Fidelity Cover Art)
Contents
Performance | (Click Here) | How the fund has done over time. |
Management's Discussion of Fund Performance | (Click Here) | The Portfolio Manager's review of fund performance and strategy. |
Shareholder Expense Example | (Click Here) | An example of shareholder expenses. |
Investment Changes | (Click Here) | A summary of major shifts in the fund's investments over the past six months. |
Investments | (Click Here) | A complete list of the fund's investments with their market values. |
Financial Statements | (Click Here) | Statements of assets and liabilities, operations, and changes in net assets, as well as financial highlights. |
Notes | (Click Here) | Notes to the financial statements. |
Report of Independent Registered Public Accounting Firm | (Click Here) | |
Trustees and Officers | (Click Here) | |
Board Approval of Investment Advisory Contracts and Management Fees | (Click Here) | |
To view a fund's proxy voting guidelines and proxy voting record for the 12-month period ended June 30, visit http://www.fidelity.com/proxyvotingresults or visit the Securities and Exchange Commission's (SEC) web site at http://www.sec.gov. You may also call 1-800-544-8544 to request a free copy of the proxy voting guidelines.
Standard & Poor's, S&P and S&P 500 are registered service marks of The McGraw-Hill Companies, Inc. and have been licensed for use by Fidelity Distributors Corporation.
Other third party marks appearing herein are the property of their respective owners.
All other marks appearing herein are registered or unregistered trademarks or service marks of FMR LLC or an affiliated company. © 2012 FMR LLC. All rights reserved.
Annual Report
This report and the financial statements contained herein are submitted for the general information of the shareholders of the fund. This report is not authorized for distribution to prospective investors in the fund unless preceded or accompanied by an effective prospectus.
A fund files its complete schedule of portfolio holdings with the SEC for the first and third quarters of each fiscal year on Form N-Q. Forms N-Q are available on the SEC's web site at http://www.sec.gov. A fund's Forms N-Q may be reviewed and copied at the SEC's Public Reference Room in Washington, DC. Information regarding the operation of the SEC's Public Reference Room may be obtained by calling 1-800-SEC-0330. For a complete list of a fund's portfolio holdings, view the most recent holdings listing, semiannual report, or annual report on Fidelity's web site at http://www.fidelity.com, http://www.advisor.fidelity.com, or http://www.401k.com, as applicable.
NOT FDIC INSURED • MAY LOSE VALUE • NO BANK GUARANTEE
Neither the fund nor Fidelity Distributors Corporation is a bank.
Annual Report
Average annual total return reflects the change in the value of an investment, assuming reinvestment of the class' distributions from dividend income and capital gains (the profits earned upon the sale of securities that have grown in value, if any) and assuming a constant rate of performance each year. The $10,000 table and the fund's returns do not reflect the deduction of taxes that a shareholder would pay on fund distributions or the redemption of fund shares. During periods of reimbursement by Fidelity, a fund's total return will be greater than it would be had the reimbursement not occurred. How a fund did yesterday is no guarantee of how it will do tomorrow.
Average Annual Total Returns
Periods ended July 31, 2012 | Past 1
year | Past 5
years | Past 10
years |
Fidelity® OTC Portfolio | -2.95% | 4.09% | 9.52% |
$10,000 Over 10 Years
Let's say hypothetically that $10,000 was invested in Fidelity® OTC Portfolio, a class of the fund, on July 31, 2002. The chart shows how the value of your investment would have changed, and also shows how the Nasdaq Composite® Index performed over the same period.
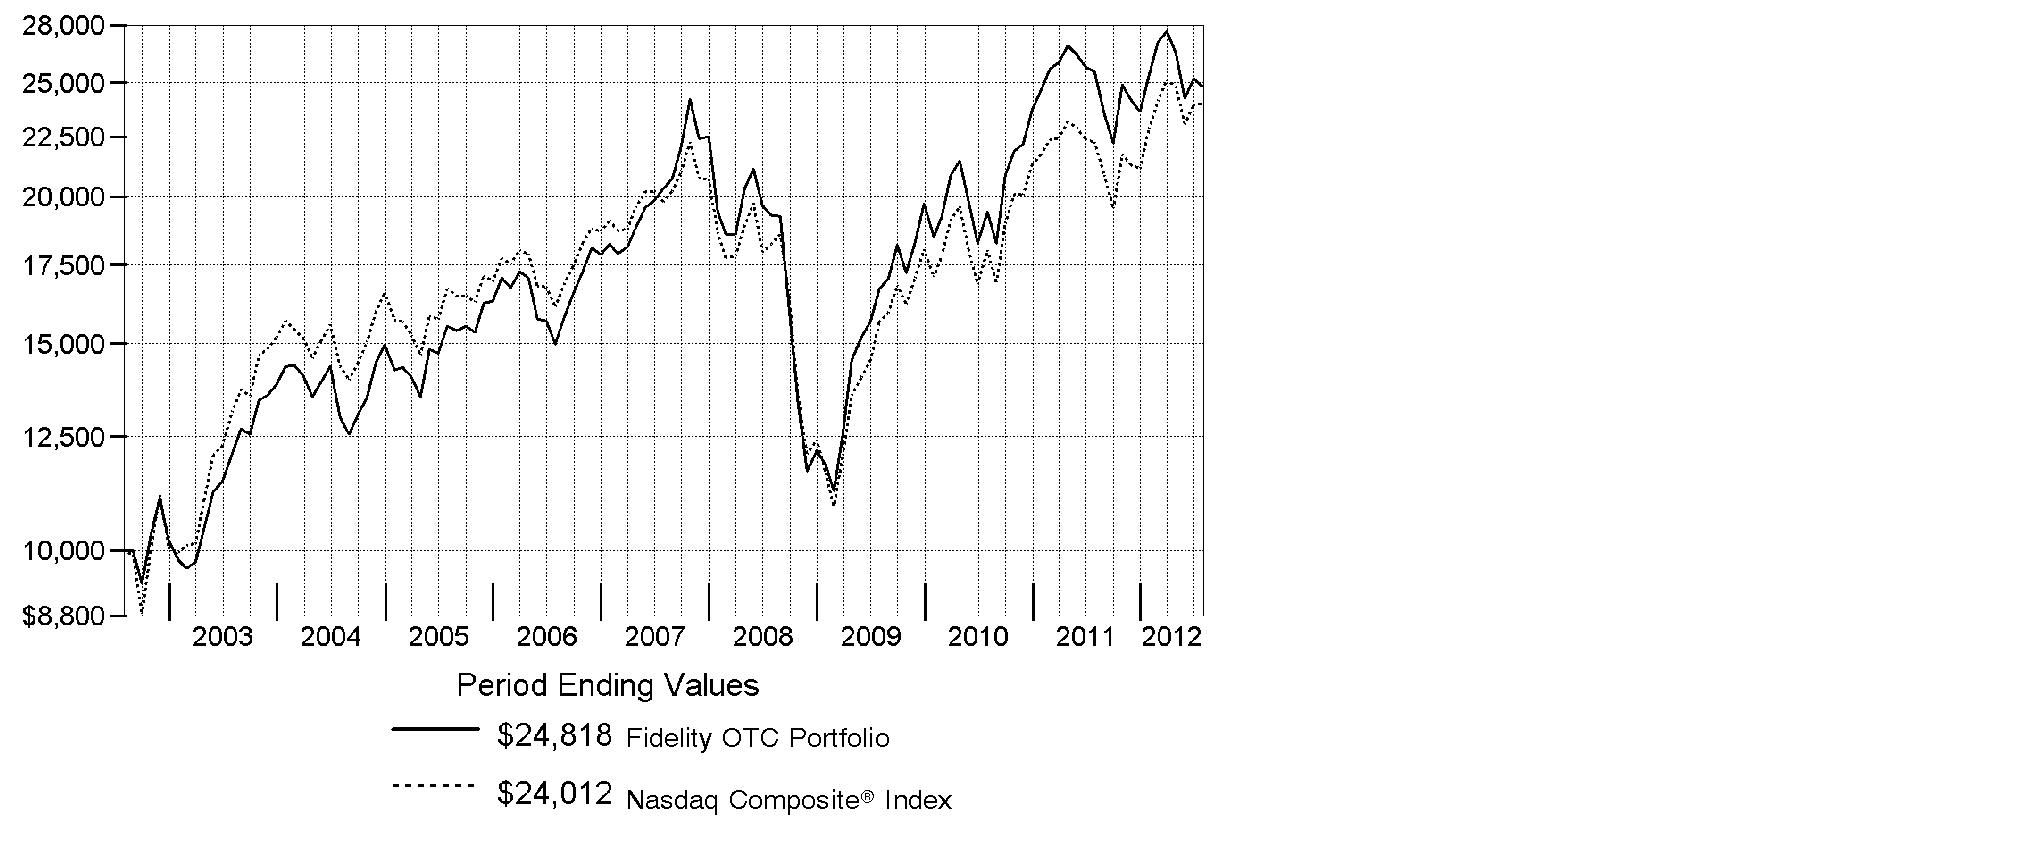
Annual Report
Market Recap: Major U.S. equity benchmarks posted solid gains for the year ending July 31, 2012, amid an uncertain investment environment. The broad-based S&P 500® Index returned 9.13%, while the blue-chip-laden Dow Jones Industrial AverageSM and technology-heavy Nasdaq Composite® Index gained 10.12% and 7.89%, respectively. Volatility spiked during the period's first half, as equities plummeted late last summer on Europe's debt woes, political wrangling over the U.S. debt ceiling and the sovereign credit-rating downgrade that followed. By October, a seemingly improved U.S. economy rejuvenated stocks, paving the way for major equity benchmarks to post their best first-quarter performance since 1998. However, more eurozone trouble, signs that the U.S. economy had turned sluggish and a slowdown in China caused stocks to slip in May, before a new wave of optimism took hold in June and July. Within the S&P 500®, more-defensive sectors such as telecommunication services (+30%) and consumer staples (+20%) fared best, while materials and energy significantly underperformed, returning -5%. Small- and mid-cap stocks trailed their less-volatile large-cap counterparts, with the Russell 2000® Index adding 0.19% and the Russell Midcap® Index rising 2.28%. Given turmoil and local currency weakness in Europe, foreign developed-markets stocks lost ground, with the MSCI® EAFE® Index returning -11.32%.
Comments from Gavin Baker, Portfolio Manager of Fidelity® OTC Portfolio: For the year, the fund's Retail Class shares returned -2.95%, considerably behind the Nasdaq Composite Index. Versus the index, the fund was primarily hurt by stock picking in health care, the food/beverage/tobacco segment of consumer staples, and telecommunication services. Green Mountain Coffee Roasters was the biggest individual detractor. Ballooning retailer inventories of the company's popular Keurig K-Cup® single-serving coffee packets, due in part to slackening overall demand for K-Cups®, was one factor hampering the stock. Performance also suffered because of a large overweighting in NII Holdings, a provider of cellular handsets and wireless service across Latin America, and a sizable out-of-benchmark stake in Accretive Health, which provides revenue-enhancement services and software for hospitals. Conversely, stock picking in the semiconductors/semiconductor equipment segment of information technology bolstered performance. One standout was Mellanox Technologies. This supplier of InfiniBand® interconnect technology for the server market blew away its financial guidance in April and July, causing its shares to surge higher. Apple also was a key contributor, riding robust sales of its iPhone® smartphone and iPad® tablet device.
The views expressed above reflect those of the portfolio manager(s) only through the end of the period as stated on the cover of this report and do not necessarily represent the views of Fidelity or any other person in the Fidelity organization. Any such views are subject to change at any time based upon market or other conditions and Fidelity disclaims any responsibility to update such views. These views may not be relied on as investment advice and, because investment decisions for a Fidelity fund are based on numerous factors, may not be relied on as an indication of trading intent on behalf of any Fidelity fund.
Annual Report
Shareholder Expense Example
As a shareholder of the Fund, you incur two types of costs: (1) transaction costs, and (2) ongoing costs, including management fees and other Fund expenses. This Example is intended to help you understand your ongoing costs (in dollars) of investing in the Fund and to compare these costs with the ongoing costs of investing in other mutual funds.
The Example is based on an investment of $1,000 invested at the beginning of the period and held for the entire period (February 1, 2012 to July 31, 2012).
Actual Expenses
The first line of the accompanying table for each class of the Fund provides information about actual account values and actual expenses. You may use the information in this line, together with the amount you invested, to estimate the expenses that you paid over the period. Simply divide your account value by $1,000.00 (for example, an $8,600 account value divided by $1,000.00 = 8.6), then multiply the result by the number in the first line for a class of the Fund under the heading entitled "Expenses Paid During Period" to estimate the expenses you paid on your account during this period. A small balance maintenance fee of $12.00 that is charged once a year may apply for certain accounts with a value of less than $2,000. This fee is not included in the table below. If it was, the estimate of expenses you paid during the period would be higher, and your ending account value lower, by this amount. In addition, the Fund, as a shareholder in the underlying Fidelity Central Funds, will indirectly bear its pro-rata share of the fees and expenses incurred by the underlying Fidelity Central Funds. These fees and expenses are not included in the Fund's annualized expense ratio used to calculate the expense estimate in the table below.
Hypothetical Example for Comparison Purposes
The second line of the accompanying table for each class of the Fund provides information about hypothetical account values and hypothetical expenses based on a Class' actual expense ratio and an assumed rate of return of 5% per year before expenses, which is not the Class' actual return. The hypothetical account values and expenses may not be used to estimate the actual ending account balance or expenses you paid for the period. You may use this information to compare the ongoing costs of investing in the Fund and other funds. To do so, compare this 5% hypothetical example with the 5% hypothetical examples that appear in the shareholder reports of the other funds. A small balance maintenance fee of $12.00 that is charged once a year may apply for certain accounts with a value of less than $2,000. This fee is not included in the table below. If it was, the estimate of expenses you paid during the period would be higher, and your ending account value lower, by this amount. In addition, the Fund, as a shareholder in the underlying Fidelity Central Funds, will indirectly bear its pro-rata share of the fees and expenses incurred by the underlying Fidelity Central Funds. These fees and expenses are not included in the Fund's annualized expense ratio used to calculate the expense estimate in the table below.
Please note that the expenses shown in the table are meant to highlight your ongoing costs only and do not reflect any transaction costs. Therefore, the second line of the table is useful in comparing ongoing costs only, and will not help you determine the relative total costs of owning different funds.
Annual Report
Shareholder Expense Example - continued
| Annualized
Expense Ratio | Beginning
Account Value
February 1, 2012 | Ending
Account Value
July 31, 2012 | Expenses Paid
During Period*
February 1, 2012
to July 31, 2012 |
OTC | .83% | | | |
Actual | | $ 1,000.00 | $ 977.20 | $ 4.08 |
HypotheticalA | | $ 1,000.00 | $ 1,020.74 | $ 4.17 |
Class K | .71% | | | |
Actual | | $ 1,000.00 | $ 978.10 | $ 3.49 |
HypotheticalA | | $ 1,000.00 | $ 1,021.33 | $ 3.57 |
A 5% return per year before expenses
* Expenses are equal to each Class' annualized expense ratio, multiplied by the average account value over the period, multiplied by 182/366 (to reflect the one-half year period).
Annual Report
Investment Changes (Unaudited)
Top Ten Stocks as of July 31, 2012 |
| % of fund's
net assets | % of fund's net assets
6 months ago |
Apple, Inc. | 13.4 | 13.3 |
Google, Inc. Class A | 8.0 | 5.8 |
Microsoft Corp. | 5.7 | 3.9 |
NVIDIA Corp. | 4.6 | 2.6 |
Questcor Pharmaceuticals, Inc. | 3.2 | 2.6 |
Amazon.com, Inc. | 2.8 | 2.1 |
Costco Wholesale Corp. | 2.3 | 0.0 |
Tesla Motors, Inc. | 2.0 | 1.9 |
Oracle Corp. | 2.0 | 2.6 |
Accretive Health, Inc. | 1.9 | 3.5 |
| 45.9 | |
Top Five Market Sectors as of July 31, 2012 |
| % of fund's
net assets | % of fund's net assets
6 months ago |
Information Technology | 55.9 | 55.9 |
Consumer Discretionary | 14.8 | 15.9 |
Health Care | 13.8 | 14.3 |
Consumer Staples | 4.7 | 3.1 |
Financials | 3.0 | 2.1 |
Asset Allocation (% of fund's net assets) |
As of July 31, 2012 * | As of January 31, 2012 ** |
 | Stocks 100.1% | | | Stocks 100.2% | |
 | Short-Term
Investments and
Net Other Assets
(Liabilities)† (0.1)% | | | Short-Term
Investments and
Net Other Assets
(Liabilities)† (0.2)% | |
* Foreign investments | 10.2% | | ** Foreign investments | 11.6% | |

† Short-Term Investments and Net Other Assets (Liabilities) are not included in the pie chart.
Annual Report
Investments July 31, 2012
Showing Percentage of Net Assets
Common Stocks - 100.1% |
| Shares | | Value (000s) |
CONSUMER DISCRETIONARY - 14.8% |
Auto Components - 0.0% |
Amerigon, Inc. (a) | 226,600 | | $ 2,549 |
Gentex Corp. | 19,200 | | 307 |
| | 2,856 |
Automobiles - 2.0% |
Tesla Motors, Inc. (a)(d) | 5,204,164 | | 142,698 |
Volkswagen AG sponsored ADR | 15,600 | | 497 |
| | 143,195 |
Hotels, Restaurants & Leisure - 1.0% |
Bravo Brio Restaurant Group, Inc. (a) | 543,625 | | 9,823 |
Chipotle Mexican Grill, Inc. (a) | 65,400 | | 19,118 |
Dunkin' Brands Group, Inc. | 37,400 | | 1,132 |
Las Vegas Sands Corp. | 9,200 | | 335 |
Starbucks Corp. | 860,700 | | 38,972 |
Texas Roadhouse, Inc. Class A | 37,625 | | 651 |
| | 70,031 |
Household Durables - 1.3% |
D.R. Horton, Inc. | 2,427,400 | | 42,795 |
iRobot Corp. (a) | 19,993 | | 455 |
Lennar Corp. Class A | 28,000 | | 818 |
PulteGroup, Inc. (a) | 80,100 | | 905 |
SodaStream International Ltd. (a)(d) | 228,258 | | 8,904 |
Toll Brothers, Inc. (a) | 1,246,100 | | 36,349 |
| | 90,226 |
Internet & Catalog Retail - 3.4% |
Amazon.com, Inc. (a) | 861,296 | | 200,940 |
ASOS PLC (a) | 16,200 | | 460 |
Groupon, Inc. Class A (a)(d) | 1,390,500 | | 9,261 |
Ocado Group PLC (a) | 276,465 | | 321 |
Start Today Co. Ltd. (d) | 2,507,400 | | 33,177 |
| | 244,159 |
Leisure Equipment & Products - 0.0% |
Brunswick Corp. | 170,400 | | 3,747 |
Media - 3.2% |
Comcast Corp. Class A | 2,856,300 | | 92,973 |
DIRECTV (a) | 775,100 | | 38,491 |
Discovery Communications, Inc. (a) | 463,900 | | 23,487 |
DISH Network Corp. Class A | 547,900 | | 16,853 |
Lions Gate Entertainment Corp. (a)(d) | 1,798,557 | | 24,191 |
Pandora Media, Inc. (a)(d) | 946,219 | | 9,339 |
Common Stocks - continued |
| Shares | | Value (000s) |
CONSUMER DISCRETIONARY - continued |
Media - continued |
Sirius XM Radio, Inc. (a)(d) | 10,514,884 | | $ 22,712 |
WPP PLC sponsored ADR | 7,500 | | 477 |
| | 228,523 |
Specialty Retail - 2.1% |
Barnes & Noble, Inc. (a)(d) | 751,094 | | 9,967 |
Bed Bath & Beyond, Inc. (a) | 134,451 | | 8,195 |
Five Below, Inc. | 7,500 | | 220 |
Francescas Holdings Corp. (a)(d) | 1,043,409 | | 32,773 |
Inditex SA | 9,212 | | 950 |
Lowe's Companies, Inc. | 2,832,100 | | 71,850 |
Monro Muffler Brake, Inc. | 133,900 | | 4,428 |
Urban Outfitters, Inc. (a) | 728,800 | | 22,265 |
| | 150,648 |
Textiles, Apparel & Luxury Goods - 1.8% |
Deckers Outdoor Corp. (a) | 14,530 | | 606 |
lululemon athletica, Inc. (a)(d) | 1,876,646 | | 105,993 |
Michael Kors Holdings Ltd. | 10,600 | | 438 |
Ralph Lauren Corp. | 3,100 | | 447 |
Steven Madden Ltd. (a) | 10,850 | | 439 |
Vera Bradley, Inc. (a) | 778,100 | | 17,733 |
| | 125,656 |
TOTAL CONSUMER DISCRETIONARY | | 1,059,041 |
CONSUMER STAPLES - 4.7% |
Beverages - 0.0% |
Monster Beverage Corp. (a) | 6,200 | | 412 |
Food & Staples Retailing - 2.3% |
Costco Wholesale Corp. | 1,736,100 | | 166,978 |
Whole Foods Market, Inc. | 4,500 | | 413 |
| | 167,391 |
Food Products - 2.4% |
Diamond Foods, Inc. (d) | 21,700 | | 353 |
Green Mountain Coffee Roasters, Inc. (a)(d) | 4,979,104 | | 90,918 |
Kraft Foods, Inc. Class A | 1,986,400 | | 78,880 |
| | 170,151 |
TOTAL CONSUMER STAPLES | | 337,954 |
Common Stocks - continued |
| Shares | | Value (000s) |
ENERGY - 1.1% |
Energy Equipment & Services - 0.6% |
Cameron International Corp. (a) | 23,600 | | $ 1,186 |
Halliburton Co. | 284,400 | | 9,422 |
Heckmann Corp. (a)(d) | 114,600 | | 353 |
National Oilwell Varco, Inc. | 293,400 | | 21,213 |
Ocean Rig UDW, Inc. (United States) | 677,900 | | 10,162 |
Schlumberger Ltd. | 53,600 | | 3,820 |
| | 46,156 |
Oil, Gas & Consumable Fuels - 0.5% |
Alpha Natural Resources, Inc. (a) | 221,921 | | 1,556 |
Amyris, Inc. (a)(d) | 275,982 | | 1,068 |
Cobalt International Energy, Inc. (a) | 696,298 | | 17,477 |
Gulfport Energy Corp. (a) | 82,320 | | 1,696 |
Kosmos Energy Ltd. (a) | 153,442 | | 1,464 |
Noble Energy, Inc. | 30,600 | | 2,675 |
Peabody Energy Corp. | 34,500 | | 720 |
Plains Exploration & Production Co. (a) | 25,400 | | 1,015 |
Rosetta Resources, Inc. (a) | 109,250 | | 4,558 |
Solazyme, Inc. (a)(d) | 42,541 | | 584 |
| | 32,813 |
TOTAL ENERGY | | 78,969 |
FINANCIALS - 3.0% |
Capital Markets - 0.2% |
WisdomTree Investments, Inc. (a) | 1,969,720 | | 13,177 |
Commercial Banks - 2.2% |
First Republic Bank | 428,400 | | 13,936 |
Fulton Financial Corp. | 40,200 | | 369 |
HDFC Bank Ltd. sponsored ADR | 18,700 | | 634 |
Huntington Bancshares, Inc. | 8,204,200 | | 50,989 |
National Penn Bancshares, Inc. | 45,900 | | 406 |
UMB Financial Corp. | 649,900 | | 31,234 |
Wells Fargo & Co. | 1,703,900 | | 57,609 |
| | 155,177 |
Consumer Finance - 0.6% |
Capital One Financial Corp. | 760,800 | | 42,978 |
Common Stocks - continued |
| Shares | | Value (000s) |
FINANCIALS - continued |
Diversified Financial Services - 0.0% |
CME Group, Inc. | 21,500 | | $ 1,120 |
NBH Holdings Corp. Class A (a)(f) | 110,800 | | 1,967 |
| | 3,087 |
TOTAL FINANCIALS | | 214,419 |
HEALTH CARE - 13.8% |
Biotechnology - 7.1% |
Achillion Pharmaceuticals, Inc. (a) | 1,191,200 | | 7,886 |
Alkermes PLC (a) | 796,636 | | 14,809 |
Alnylam Pharmaceuticals, Inc. (a)(d) | 224,000 | | 4,187 |
Amarin Corp. PLC ADR (a)(d) | 1,779,261 | | 20,835 |
Amgen, Inc. | 952,500 | | 78,677 |
ARIAD Pharmaceuticals, Inc. (a) | 26,300 | | 503 |
ArQule, Inc. (a) | 2,019,127 | | 12,216 |
Biogen Idec, Inc. (a) | 411,800 | | 60,053 |
BioMarin Pharmaceutical, Inc. (a) | 11,400 | | 448 |
Cepheid, Inc. (a) | 19,300 | | 618 |
Clovis Oncology, Inc. (d) | 378,748 | | 6,700 |
Genomic Health, Inc. (a) | 12,720 | | 427 |
Gilead Sciences, Inc. (a) | 1,941,000 | | 105,455 |
ImmunoGen, Inc. (a)(d) | 297,309 | | 4,799 |
InterMune, Inc. (a) | 619,020 | | 5,466 |
Ironwood Pharmaceuticals, Inc. Class A (a) | 1,489,100 | | 19,165 |
Isis Pharmaceuticals, Inc. (a)(d) | 80,849 | | 980 |
Medivation, Inc. (a) | 676,820 | | 67,479 |
Mesoblast Ltd. (a)(d) | 70,173 | | 464 |
NPS Pharmaceuticals, Inc. (a) | 337,200 | | 2,600 |
OncoGenex Pharmaceuticals, Inc. (a) | 392,682 | | 5,482 |
ONYX Pharmaceuticals, Inc. (a) | 219,400 | | 16,448 |
Seattle Genetics, Inc. (a) | 19,303 | | 505 |
Targacept, Inc. (a) | 156,349 | | 675 |
Theravance, Inc. (a) | 27,800 | | 810 |
Threshold Pharmaceuticals, Inc. (a) | 151,100 | | 1,049 |
Vertex Pharmaceuticals, Inc. (a) | 1,305,204 | | 63,315 |
Vical, Inc. (a) | 135,600 | | 469 |
ZIOPHARM Oncology, Inc. (a) | 340,900 | | 1,919 |
| | 504,439 |
Health Care Equipment & Supplies - 0.1% |
Abiomed, Inc. (a)(d) | 127,600 | | 2,877 |
Common Stocks - continued |
| Shares | | Value (000s) |
HEALTH CARE - continued |
Health Care Equipment & Supplies - continued |
DexCom, Inc. (a) | 56,400 | | $ 621 |
Endologix, Inc. (a) | 29,300 | | 344 |
Mako Surgical Corp. (a) | 135,863 | | 1,731 |
Masimo Corp. (a) | 17,600 | | 394 |
Volcano Corp. (a) | 18,400 | | 487 |
| | 6,454 |
Health Care Providers & Services - 2.5% |
Accretive Health, Inc. (a)(d)(e) | 9,934,802 | | 134,915 |
Catamaran Corp. (a) | 10,500 | | 892 |
Catamaran Corp. (a) | 224,300 | | 18,956 |
HMS Holdings Corp. (a) | 682,000 | | 23,468 |
| | 178,231 |
Health Care Technology - 0.0% |
athenahealth, Inc. (a) | 37,800 | | 3,459 |
Merge Healthcare, Inc. (a)(d) | 165,592 | | 490 |
| | 3,949 |
Life Sciences Tools & Services - 0.4% |
Fluidigm Corp. (a) | 27,183 | | 354 |
Life Technologies Corp. (a) | 589,100 | | 25,850 |
| | 26,204 |
Pharmaceuticals - 3.7% |
Elan Corp. PLC sponsored ADR (a) | 1,810,500 | | 20,911 |
Questcor Pharmaceuticals, Inc. (a)(d)(e) | 6,111,554 | | 225,333 |
Roche Holding AG sponsored ADR | 9,900 | | 439 |
Shire PLC sponsored ADR | 186,800 | | 16,098 |
| | 262,781 |
TOTAL HEALTH CARE | | 982,058 |
INDUSTRIALS - 1.9% |
Airlines - 0.9% |
Delta Air Lines, Inc. (a) | 3,992,000 | | 38,523 |
United Continental Holdings, Inc. (a) | 1,251,000 | | 23,631 |
| | 62,154 |
Building Products - 0.1% |
Quanex Building Products Corp. | 430,324 | | 7,272 |
Commercial Services & Supplies - 0.3% |
Stericycle, Inc. (a) | 241,200 | | 22,395 |
Common Stocks - continued |
| Shares | | Value (000s) |
INDUSTRIALS - continued |
Construction & Engineering - 0.0% |
Foster Wheeler AG (a) | 25,884 | | $ 467 |
Electrical Equipment - 0.0% |
II-VI, Inc. (a) | 88,100 | | 1,536 |
Machinery - 0.4% |
Edwards Group Ltd. ADR (a) | 77,900 | | 526 |
Stanley Black & Decker, Inc. | 56,400 | | 3,773 |
Westport Innovations, Inc. (a) | 710,748 | | 26,745 |
| | 31,044 |
Professional Services - 0.2% |
Qualicorp SA (a) | 1,275,000 | | 11,355 |
TOTAL INDUSTRIALS | | 136,223 |
INFORMATION TECHNOLOGY - 55.9% |
Communications Equipment - 2.4% |
Acme Packet, Inc. (a) | 54,775 | | 868 |
Aruba Networks, Inc. (a)(d) | 1,651,846 | | 23,423 |
Cisco Systems, Inc. | 975,300 | | 15,556 |
EchoStar Holding Corp. Class A (a) | 132,700 | | 3,822 |
Palo Alto Networks, Inc. | 8,900 | | 509 |
Polycom, Inc. (a) | 177,970 | | 1,555 |
QUALCOMM, Inc. | 1,591,009 | | 94,951 |
Ubiquiti Networks, Inc. (d) | 1,550,353 | | 21,922 |
ViaSat, Inc. (a) | 160,400 | | 6,143 |
| | 168,749 |
Computers & Peripherals - 15.2% |
Apple, Inc. | 1,562,100 | | 954,069 |
Cray, Inc. (a) | 313,800 | | 3,901 |
Dell, Inc. (a) | 907,300 | | 10,779 |
Fusion-io, Inc. (a)(d) | 2,082,866 | | 39,824 |
NetApp, Inc. (a) | 1,387,700 | | 45,336 |
SanDisk Corp. (a) | 547,250 | | 22,508 |
Silicon Graphics International Corp. (a)(d) | 1,177,474 | | 7,830 |
| | 1,084,247 |
Electronic Equipment & Components - 0.5% |
Audience, Inc. | 361,700 | | 6,529 |
E Ink Holdings, Inc. GDR (a)(f) | 31,400 | | 306 |
InvenSense, Inc. (d) | 941,400 | | 12,144 |
Common Stocks - continued |
| Shares | | Value (000s) |
INFORMATION TECHNOLOGY - continued |
Electronic Equipment & Components - continued |
Maxwell Technologies, Inc. (a)(d) | 54,243 | | $ 353 |
RealD, Inc. (a)(d) | 1,616,600 | | 15,681 |
| | 35,013 |
Internet Software & Services - 11.0% |
Active Network, Inc. (a) | 30,100 | | 427 |
Angie's List, Inc. (d) | 1,498,600 | | 19,482 |
Constant Contact, Inc. (a)(d)(e) | 1,957,036 | | 32,819 |
Dropbox, Inc. (g) | 331,524 | | 3,000 |
eBay, Inc. (a) | 2,748,000 | | 121,736 |
Facebook, Inc. Class B (a)(g) | 335,669 | | 6,559 |
Google, Inc. Class A (a) | 898,822 | | 568,927 |
LinkedIn Corp. (a) | 33,100 | | 3,398 |
Liquidity Services, Inc. (a) | 6,100 | | 279 |
LogMeIn, Inc. (a) | 161,406 | | 3,059 |
Mail.ru Group Ltd. GDR (a)(f) | 8,700 | | 264 |
Millennial Media, Inc. (d) | 574,200 | | 5,702 |
Rackspace Hosting, Inc. (a) | 9,456 | | 415 |
SINA Corp. (a) | 11,600 | | 527 |
Velti PLC (a)(d) | 1,787,551 | | 9,742 |
Web.com Group, Inc. (a) | 695,736 | | 10,784 |
| | 787,120 |
IT Services - 1.6% |
Cardtronics, Inc. (a) | 117,400 | | 3,641 |
Cognizant Technology Solutions Corp. Class A (a) | 942,545 | | 53,508 |
HiSoft Technology International Ltd. ADR (a) | 1,200,580 | | 13,543 |
MasterCard, Inc. Class A | 600 | | 262 |
ServiceSource International, Inc. (a)(d) | 3,637,336 | | 41,029 |
| | 111,983 |
Semiconductors & Semiconductor Equipment - 11.9% |
Altera Corp. | 1,966,000 | | 69,695 |
Applied Micro Circuits Corp. (a) | 464,000 | | 2,654 |
ASML Holding NV | 195,800 | | 11,259 |
Broadcom Corp. Class A | 1,244,300 | | 42,157 |
Cirrus Logic, Inc. (a) | 826,977 | | 30,408 |
Cree, Inc. (a)(d) | 433,600 | | 10,385 |
Inphi Corp. (a)(e) | 1,794,970 | | 19,745 |
LSI Corp. (a) | 575,300 | | 3,970 |
Maxim Integrated Products, Inc. | 966,900 | | 26,329 |
Mellanox Technologies Ltd. (a) | 1,279,651 | | 134,184 |
Monolithic Power Systems, Inc. (a) | 367,700 | | 7,126 |
Common Stocks - continued |
| Shares | | Value (000s) |
INFORMATION TECHNOLOGY - continued |
Semiconductors & Semiconductor Equipment - continued |
NVE Corp. (a)(e) | 463,657 | | $ 25,650 |
NVIDIA Corp. (a) | 24,231,212 | | 328,091 |
NXP Semiconductors NV (a) | 2,701,089 | | 61,018 |
RF Micro Devices, Inc. (a) | 1,728,300 | | 6,706 |
Skyworks Solutions, Inc. (a) | 1,376,000 | | 39,808 |
Volterra Semiconductor Corp. (a) | 1,206,500 | | 27,725 |
| | 846,910 |
Software - 13.3% |
Activision Blizzard, Inc. | 748,600 | | 9,006 |
BroadSoft, Inc. (a)(d) | 121,980 | | 2,995 |
Check Point Software Technologies Ltd. (a) | 1,550,800 | | 75,322 |
Comverse Technology, Inc. (a) | 38,689 | | 210 |
Envivio, Inc. | 938,100 | | 5,619 |
Fortinet, Inc. (a) | 17,300 | | 415 |
Gameloft (a)(e) | 7,764,787 | | 44,521 |
Guidewire Software, Inc. | 967,500 | | 24,826 |
Infoblox, Inc. | 29,800 | | 626 |
Informatica Corp. (a) | 9,700 | | 286 |
Jive Software, Inc. (d) | 477,800 | | 9,570 |
Microsoft Corp. | 13,848,565 | | 408,117 |
MicroStrategy, Inc. Class A (a) | 154,200 | | 17,958 |
Oracle Corp. | 4,620,300 | | 139,533 |
Proofpoint, Inc. (d) | 19,100 | | 264 |
QLIK Technologies, Inc. (a) | 665,800 | | 13,316 |
RealPage, Inc. (a)(d) | 684,700 | | 15,214 |
salesforce.com, Inc. (a) | 346,500 | | 43,091 |
Splunk, Inc. (d) | 192,539 | | 5,661 |
Synchronoss Technologies, Inc. (a)(e) | 3,850,927 | | 73,630 |
Take-Two Interactive Software, Inc. (a) | 209,500 | | 1,839 |
Ubisoft Entertainment SA (a)(e) | 8,920,800 | | 61,686 |
Ubisoft Entertainment SA warrants 10/10/13 (a)(e) | 6,470,130 | | 207 |
| | 953,912 |
TOTAL INFORMATION TECHNOLOGY | | 3,987,934 |
MATERIALS - 2.2% |
Chemicals - 0.3% |
Innophos Holdings, Inc. | 8,156 | | 473 |
Sherwin-Williams Co. | 180,500 | | 24,250 |
| | 24,723 |
Common Stocks - continued |
| Shares | | Value (000s) |
MATERIALS - continued |
Metals & Mining - 1.9% |
AngloGold Ashanti Ltd. sponsored ADR | 492,700 | | $ 16,757 |
Fortescue Metals Group Ltd. sponsored ADR | 50,950 | | 438 |
Randgold Resources Ltd. sponsored ADR | 753,933 | | 67,462 |
Royal Gold, Inc. | 637,800 | | 48,269 |
| | 132,926 |
TOTAL MATERIALS | | 157,649 |
TELECOMMUNICATION SERVICES - 2.7% |
Diversified Telecommunication Services - 0.9% |
Level 3 Communications, Inc. (a) | 3,336,900 | | 64,302 |
Wireless Telecommunication Services - 1.8% |
Clearwire Corp. Class A (a)(d) | 444,034 | | 506 |
NII Holdings, Inc. (a)(e) | 13,057,469 | | 88,138 |
Sprint Nextel Corp. (a) | 8,946,181 | | 39,005 |
| | 127,649 |
TOTAL TELECOMMUNICATION SERVICES | | 191,951 |
TOTAL COMMON STOCKS (Cost $6,552,415) |
7,146,198
|
Money Market Funds - 6.5% |
| | | |
Fidelity Cash Central Fund, 0.17% (b) | 13,290,837 | | 13,291 |
Fidelity Securities Lending Cash Central Fund, 0.18% (b)(c) | 454,081,914 | | 454,082 |
TOTAL MONEY MARKET FUNDS (Cost $467,373) |
467,373
|
TOTAL INVESTMENT PORTFOLIO - 106.6% (Cost $7,019,788) | | 7,613,571 |
NET OTHER ASSETS (LIABILITIES) - (6.6)% | | (470,851) |
NET ASSETS - 100% | $ 7,142,720 |
Legend |
(a) Non-income producing |
(b) Affiliated fund that is available only to investment companies and other accounts managed by Fidelity Investments. The rate quoted is the annualized seven-day yield of the fund at period end. A complete unaudited listing of the fund's holdings as of its most recent quarter end is available upon request. In addition, each Fidelity Central Fund's financial statements, which are not covered by the Fund's Report of Independent Registered Public Accounting Firm, are available on the SEC's website or upon request. |
(c) Investment made with cash collateral received from securities on loan. |
(d) Security or a portion of the security is on loan at period end. |
(e) Affiliated company |
(f) Security exempt from registration under Rule 144A of the Securities Act of 1933. These securities may be resold in transactions exempt from registration, normally to qualified institutional buyers. At the end of the period, the value of these securities amounted to $2,537,000 or 0.0% of net assets. |
(g) Restricted securities - Investment in securities not registered under the Securities Act of 1933 (excluding 144A issues). At the end of the period, the value of restricted securities (excluding 144A issues) amounted to $9,559,000 or 0.1% of net assets. |
Additional information on each restricted holding is as follows: |
Security | Acquisition
Date | Acquisition
Cost (000s) |
Dropbox, Inc. | 5/2/12 | $ 3,000 |
Facebook, Inc. Class B | 3/31/11 - 5/19/11 | $ 8,394 |
Affiliated Central Funds |
Information regarding fiscal year to date income earned by the Fund from investments in Fidelity Central Funds is as follows: |
Fund | Income earned
(Amounts in thousands) |
Fidelity Cash Central Fund | $ 59 |
Fidelity Securities Lending Cash Central Fund | 28,722 |
Total | $ 28,781 |
Other Affiliated Issuers |
An affiliated company is a company in which the Fund has ownership of at least 5% of the voting securities. Fiscal year to date transactions with companies which are or were affiliates are as follows: |
Affiliate
(Amounts in thousands) | Value,
beginning of
period | Purchases | Sales
Proceeds | Dividend
Income | Value,
end of
period |
Accretive Health, Inc. | $ 225,437 | $ 62,478 | $ 1,757 | $ - | $ 134,915 |
Aruba Networks, Inc. | 179,343 | 32,774 | 172,024 | - | - |
Barnes & Noble, Inc. | - | 120,214 | 114,091 | - | - |
Constant Contact, Inc. | - | 52,336 | 5,109 | - | 32,819 |
Gameloft | 51,802 | 1,667 | - | - | 44,521 |
Georesources, Inc. | 47,705 | - | 57,400 | - | - |
Inphi Corp. | - | 40,849 | 9,224 | - | 19,745 |
iRobot Corp. | 57,960 | 9,102 | 52,886 | - | - |
Meru Networks, Inc. | 8,324 | 3,822 | 8,935 | - | - |
MicroStrategy, Inc. Class A | 64,003 | 33,915 | 66,654 | - | - |
NII Holdings, Inc. | - | 293,854 | 30,310 | - | 88,138 |
NVE Corp. | - | 26,957 | 1,512 | - | 25,650 |
Petroleum Development Corp. | 44,294 | - | 40,509 | - | - |
Questcor Pharmaceuticals, Inc. | - | 225,603 | 44,267 | - | 225,333 |
Rackspace Hosting, Inc. | 228,165 | 40,271 | 322,371 | - | - |
Synchronoss Technologies, Inc. | 94,771 | 32,412 | 13,745 | - | 73,630 |
Ubisoft Entertainment SA | - | 63,047 | 1,513 | - | 61,686 |
Ubisoft Entertainment SA warrants 10/10/13 | - | - | - | - | 207 |
Vical, Inc. | 11,079 | 5,826 | 11,590 | - | - |
Total | $ 1,012,883 | $ 1,045,127 | $ 953,897 | $ - | $ 706,644 |
Other Information |
The following is a summary of the inputs used, as of July 31, 2012, involving the Fund's assets and liabilities carried at fair value. The inputs or methodology used for valuing securities may not be an indication of the risk associated with investing in those securities. For more information on valuation inputs, and their aggregation into the levels used in the table below, please refer to the Security Valuation section in the accompanying Notes to Financial Statements. |
Valuation Inputs at Reporting Date: |
Description
(Amounts in thousands) | Total | Level 1 | Level 2 | Level 3 |
Investments in Securities: | | | | |
Equities: | | | | |
Consumer Discretionary | $ 1,059,041 | $ 1,025,864 | $ 33,177 | $ - |
Consumer Staples | 337,954 | 337,954 | - | - |
Energy | 78,969 | 78,969 | - | - |
Financials | 214,419 | 212,452 | - | 1,967 |
Health Care | 982,058 | 982,058 | - | - |
Industrials | 136,223 | 136,223 | - | - |
Information Technology | 3,987,934 | 3,978,375 | 6,559 | 3,000 |
Materials | 157,649 | 157,649 | - | - |
Telecommunication Services | 191,951 | 191,951 | - | - |
Money Market Funds | 467,373 | 467,373 | - | - |
Total Investments in Securities: | $ 7,613,571 | $ 7,568,868 | $ 39,736 | $ 4,967 |
Distribution of investments by country or territory of incorporation, as a percentage of total net assets, is as follows. (Unaudited) |
United States of America | 89.8% |
Israel | 3.2% |
France | 1.5% |
Bailiwick of Jersey | 1.3% |
Canada | 1.1% |
Netherlands | 1.0% |
Others (Individually Less Than 1%) | 2.1% |
| 100.0% |
See accompanying notes which are an integral part of the financial statements.
Annual Report
Statement of Assets and Liabilities
Amounts in thousands (except per-share amounts) | July 31, 2012 |
| | |
Assets | | |
Investment in securities, at value (including securities loaned of $449,389) - See accompanying schedule: Unaffiliated issuers (cost $5,608,179) | $ 6,439,554 | |
Fidelity Central Funds (cost $467,373) | 467,373 | |
Other affiliated issuers (cost $944,236) | 706,644 | |
Total Investments (cost $7,019,788) | | $ 7,613,571 |
Cash | | 811 |
Receivable for investments sold | | 126,392 |
Receivable for fund shares sold | | 3,022 |
Dividends receivable | | 798 |
Distributions receivable from Fidelity Central Funds | | 2,193 |
Other receivables | | 452 |
Total assets | | 7,747,239 |
| | |
Liabilities | | |
Payable for investments purchased | $ 136,357 | |
Payable for fund shares redeemed | 9,762 | |
Accrued management fee | 2,984 | |
Other affiliated payables | 1,057 | |
Other payables and accrued expenses | 277 | |
Collateral on securities loaned, at value | 454,082 | |
Total liabilities | | 604,519 |
| | |
Net Assets | | $ 7,142,720 |
Net Assets consist of: | | |
Paid in capital | | $ 6,917,451 |
Accumulated net investment loss | | (2,569) |
Accumulated undistributed net realized gain (loss) on investments and foreign currency transactions | | (365,918) |
Net unrealized appreciation (depreciation) on investments and assets and liabilities in foreign currencies | | 593,756 |
Net Assets | | $ 7,142,720 |
See accompanying notes which are an integral part of the financial statements.
Annual Report
Financial Statements - continued
Statement of Assets and Liabilities - continued
Amounts in thousands (except per-share amounts) | July 31, 2012 |
| | |
OTC:
Net Asset Value, offering price and redemption price per share ($5,498,647 ÷ 95,574 shares) | | $ 57.53 |
| | |
Class K:
Net Asset Value, offering price and redemption price per share ($1,644,073 ÷ 28,377 shares) | | $ 57.94 |
See accompanying notes which are an integral part of the financial statements.
Annual Report
Statement of Operations
Amounts in thousands | Year ended July 31, 2012 |
| | |
Investment Income | | |
Dividends | | $ 23,210 |
Special dividends | | 4,466 |
Interest | | 52 |
Income from Fidelity Central Funds (including $28,722 from security lending) | | 28,781 |
Total income | | 56,509 |
| | |
Expenses | | |
Management fee
Basic fee | $ 45,510 | |
Performance adjustment | 6,446 | |
Transfer agent fees | 12,189 | |
Accounting and security lending fees | 1,278 | |
Custodian fees and expenses | 267 | |
Independent trustees' compensation | 50 | |
Registration fees | 217 | |
Audit | 70 | |
Legal | 27 | |
Interest | 6 | |
Miscellaneous | 80 | |
Total expenses before reductions | 66,140 | |
Expense reductions | (1,184) | 64,956 |
Net investment income (loss) | | (8,447) |
Realized and Unrealized Gain (Loss) Net realized gain (loss) on: | | |
Investment securities: | | |
Unaffiliated issuers | (26,799) | |
Other affiliated issuers | 131,175 | |
Foreign currency transactions | (235) | |
Total net realized gain (loss) | | 104,141 |
Change in net unrealized appreciation (depreciation) on: Investment securities | (349,475) | |
Assets and liabilities in foreign currencies | 2 | |
Total change in net unrealized appreciation (depreciation) | | (349,473) |
Net gain (loss) | | (245,332) |
Net increase (decrease) in net assets resulting from operations | | $ (253,779) |
See accompanying notes which are an integral part of the financial statements.
Annual Report
Financial Statements - continued
Statement of Changes in Net Assets
Amounts in thousands | Year ended
July 31,
2012 | Year ended
July 31,
2011 |
Increase (Decrease) in Net Assets | | |
Operations | | |
Net investment income (loss) | $ (8,447) | $ (32,610) |
Net realized gain (loss) | 104,141 | 893,317 |
Change in net unrealized appreciation (depreciation) | (349,473) | 918,202 |
Net increase (decrease) in net assets resulting
from operations | (253,779) | 1,778,909 |
Share transactions - net increase (decrease) | (340,677) | (58,129) |
Total increase (decrease) in net assets | (594,456) | 1,720,780 |
| | |
Net Assets | | |
Beginning of period | 7,737,176 | 6,016,396 |
End of period (including accumulated net investment loss of $2,569 and accumulated net investment loss of $134, respectively) | $ 7,142,720 | $ 7,737,176 |
See accompanying notes which are an integral part of the financial statements.
Annual Report
Financial Highlights - OTC
Years ended July 31, | 2012 | 2011 | 2010 | 2009 | 2008 |
Selected Per-Share Data | | | | |
Net asset value, beginning of period | $ 59.28 | $ 45.00 | $ 38.73 | $ 44.66 | $ 47.09 |
Income from Investment Operations | | | | | |
Net investment income (loss) B | (.08) E | (.27) | (.23) | (.12) | (.20) |
Net realized and unrealized gain (loss) | (1.67) | 14.55 | 6.50 | (5.81) | (2.23) |
Total from investment operations | (1.75) | 14.28 | 6.27 | (5.93) | (2.43) |
Net asset value, end of period | $ 57.53 | $ 59.28 | $ 45.00 | $ 38.73 | $ 44.66 |
Total Return A | (2.95)% | 31.73% | 16.19% | (13.28)% | (5.16)% |
Ratios to Average Net Assets C, F | | | | |
Expenses before reductions | .91% | .94% | 1.06% | 1.13% | 1.06% |
Expenses net of fee waivers, if any | .91% | .94% | 1.06% | 1.13% | 1.06% |
Expenses net of all reductions | .90% | .92% | 1.04% | 1.13% | 1.05% |
Net investment income (loss) | (.14)% E | (.49)% | (.51)% | (.37)% | (.42)% |
Supplemental Data | | | | |
Net assets, end of period (in millions) | $ 5,499 | $ 6,374 | $ 5,080 | $ 4,677 | $ 6,871 |
Portfolio turnover rate D | 149% | 158% | 163% | 151% | 145% |
A Total returns would have been lower if certain expenses had not been reduced during the applicable periods shown.
B Calculated based on average shares outstanding during the period.
C Fees and expenses of any underlying Fidelity Central Funds are not included in the Fund's expense ratio. The Fund indirectly bears its proportionate share of the expenses of any underlying Fidelity Central Funds.
D Amount does not include the portfolio activity of any underlying Fidelity Central Funds.
E Investment income per share reflects a large, non-recurring dividend which amounted to $.03 per share. Excluding this non-recurring dividend, the ratio of net investment income (loss) to average net assets would have been (.20)%.
F Expense ratios reflect operating expenses of the class. Expenses before reductions do not reflect amounts reimbursed by the investment adviser or reductions from brokerage service arrangements or reductions from other expense offset arrangements and do not represent the amount paid by the class during periods when reimbursements or reductions occur. Expenses net of fee waivers reflect expenses after reimbursement by the investment adviser but prior to reductions from brokerage service arrangements or other expense offset arrangements. Expenses net of all reductions represent the net expenses paid by the class.
See accompanying notes which are an integral part of the financial statements.
Annual Report
Financial Highlights - Class K
Years ended July 31, | 2012 | 2011 | 2010 | 2009 | 2008 I |
Selected Per-Share Data | | | | |
Net asset value, beginning of period | $ 59.61 | $ 45.19 | $ 38.83 | $ 44.68 | $ 47.79 |
Income from Investment Operations | | | | | |
Net investment income (loss) D | - H, K | (.19) | (.16) | (.05) | (.05) |
Net realized and unrealized gain (loss) | (1.67) | 14.61 | 6.52 | (5.80) | (3.06) |
Total from investment operations | (1.67) | 14.42 | 6.36 | (5.85) | (3.11) |
Net asset value, end of period | $ 57.94 | $ 59.61 | $ 45.19 | $ 38.83 | $ 44.68 |
Total Return B, C | (2.80)% | 31.91% | 16.38% | (13.09)% | (6.51)% |
Ratios to Average Net Assets E, J | | | | |
Expenses before reductions | .77% | .80% | .90% | .92% | .91% A |
Expenses net of fee waivers, if any | .77% | .80% | .90% | .92% | .91% A |
Expenses net of all reductions | .76% | .78% | .88% | .92% | .91% A |
Net investment income (loss) | -% G, H | (.35)% | (.35)% | (.17)% | (.47)% A |
Supplemental Data | | | | |
Net assets, end of period (000 omitted) | $ 1,644,073 | $ 1,363,389 | $ 936,256 | $ 488,683 | $ 93 |
Portfolio turnover rate F | 149% | 158% | 163% | 151% | 145% |
A Annualized
B Total returns for periods of less than one year are not annualized.
C Total returns would have been lower if certain expenses had not been reduced during the applicable periods shown.
D Calculated based on average shares outstanding during the period.
E Fees and expenses of any underlying Fidelity Central Funds are not included in the Fund's expense ratio. The Fund indirectly bears its proportionate share of the expenses of any underlying Fidelity Central Funds.
F Amount does not include the portfolio activity of any underlying Fidelity Central Funds.
G Amount represents less than .01%.
H Investment income per share reflects a large, non-recurring dividend which amounted to $.03 per share. Excluding this non-recurring dividend, the ratio of net investment income (loss) to average net assets would have been (.06)%.
I For the period May 9, 2008 (commencement of sale of shares) to July 31, 2008.
J Expense ratios reflect operating expenses of the class. Expenses before reductions do not reflect amounts reimbursed by the investment adviser or reductions from brokerage service arrangements or reductions from other expense offset arrangements and do not represent the amount paid by the class during periods when reimbursements or reductions occur. Expense ratios before reductions for start-up periods may not be representative of longer-term operating periods. Expenses net of fee waivers reflect expenses after reimbursement by the investment adviser but prior to reductions from brokerage service arrangements or other expense offset arrangements. Expenses net of all reductions represent the net expenses paid by the class.
K Amount represents less than $.01 per share.
See accompanying notes which are an integral part of the financial statements.
Annual Report
Notes to Financial Statements
For the period ended July 31, 2012
(Amounts in thousands except percentages)
1. Organization.
Fidelity OTC Portfolio (the Fund) is a non-diversified fund of Fidelity Securities Fund (the Trust) and is authorized to issue an unlimited number of shares. The Trust is registered under the Investment Company Act of 1940, as amended (the 1940 Act), as an open-end management investment company organized as a Massachusetts business trust. The Fund offers OTC and Class K shares, each of which has equal rights as to assets and voting privileges. Each class has exclusive voting rights with respect to matters that affect that class. Investment income, realized and unrealized capital gains and losses, the common expenses of the Fund, and certain fund-level expense reductions, if any, are allocated on a pro-rata basis to each class based on the relative net assets of each class to the total net assets of the Fund. Each class differs with respect to transfer agent fees incurred. Certain expense reductions may also differ by class.
2. Investments in Fidelity Central Funds.
The Fund invests in Fidelity Central Funds, which are open-end investment companies available only to other investment companies and accounts managed by Fidelity Management & Research Company (FMR) and its affiliates. The Fund's Schedule of Investments lists each of the Fidelity Central Funds held as of period end, if any, as an investment of the Fund, but does not include the underlying holdings of each Fidelity Central Fund. As an Investing Fund, the Fund indirectly bears its proportionate share of the expenses of the underlying Fidelity Central Funds.
The Money Market Central Funds seek preservation of capital and current income and are managed by Fidelity Investments Money Management, Inc. (FIMM), an affiliate of FMR.
A complete unaudited list of holdings for each Fidelity Central Fund is available upon request or at the Securities and Exchange Commission (the SEC) web site at www.sec.gov. In addition, the financial statements of the Fidelity Central Funds, which are not covered by the Fund's Report of Independent Registered Public Accounting Firm, are available on the SEC web site or upon request.
3. Significant Accounting Policies.
The financial statements have been prepared in conformity with accounting principles generally accepted in the United States of America (GAAP), which require management to make certain estimates and assumptions at the date of the financial statements. Actual results could differ from those estimates. Subsequent events, if any, through the date that the financial statements were issued have been evaluated in the preparation of the financial statements. The following summarizes the significant accounting policies of the Fund:
Annual Report
3. Significant Accounting Policies - continued
Security Valuation. Investments are valued as of 4:00 p.m. Eastern time on the last calendar day of the period. In accordance with valuation policies and procedures approved by the Board of Trustees (the Board), the Fund attempts to obtain prices from one or more third party pricing vendor or broker to value its investments. When current market prices, quotations or rates are not readily available or reliable, securities will be fair valued in good faith by the FMR Fair Value Committee (the Committee), in accordance with procedures adopted by the Fund's Board. Factors used in determining fair value vary by security type and may include market or security specific events. The frequency with which these procedures are used cannot be predicted and they may be utilized to a significant extent. The Committee oversees the Fund's valuation policies and procedures and is responsible for approving and reporting to the Board all fair value determinations.
The Fund categorizes the inputs to valuation techniques used to value its investments into a disclosure hierarchy consisting of three levels as shown below:
Level 1 - quoted prices in active markets for identical investments
Level 2 - other significant observable inputs (including quoted prices for similar investments, interest rates, prepayment speeds, etc.)
Level 3 - unobservable inputs (including the Fund's own assumptions based on the best information available)
Valuation techniques used to value the Fund's investments by major category are as follows:
Equity securities, including restricted securities, for which market quotations are readily available, are valued at the last reported sale price or official closing price as reported by a third party pricing vendor on the primary market or exchange on which they are traded and are categorized as Level 1 in the hierarchy. In the event there were no sales during the day or closing prices are not available, securities are valued at the last quoted bid price or may be valued using the last available price and are generally categorized as Level 2 in the hierarchy. For foreign equity securities, when significant market or security specific events arise, comparisons to the valuation of American Depositary Receipts (ADRs), futures contracts, Exchange-Traded Funds (ETFs) and certain indexes as well as quoted prices for similar securities are used and are categorized as Level 2 in the hierarchy. Utilizing these techniques may result in transfers between Level 1 and Level 2. For restricted equity securities and private placements where observable inputs are limited, assumptions about market activity and risk are used and these securities are categorized as Level 3 in the hierarchy.
Annual Report
Notes to Financial Statements - continued
(Amounts in thousands except percentages)
3. Significant Accounting Policies - continued
Security Valuation - continued
Investments in open-end mutual funds, including the Fidelity Central Funds, are valued at their closing net asset value each business day and are categorized as Level 1 in the hierarchy.
Changes in valuation techniques may result in transfers in or out of an assigned level within the disclosure hierarchy. The aggregate value of investments by input level, as of July 31, 2012, is included at the end of the Fund's Schedule of Investments.
Foreign Currency Translation. The Fund may use foreign currency contracts to facilitate transactions in foreign-denominated securities. Gains and losses from these transactions may arise from changes in the value of the foreign currency or if the counterparties do not perform under the contracts' terms.
Foreign-denominated assets, including investment securities, and liabilities are translated into U.S. dollars at the exchange rates at period end. Purchases and sales of investment securities, income and dividends received and expenses denominated in foreign currencies are translated into U.S. dollars at the exchange rate in effect on the transaction date.
The effects of exchange rate fluctuations on investments are included with the net realized and unrealized gain (loss) on investment securities. Other foreign currency transactions resulting in realized and unrealized gain (loss) are disclosed separately.
Investment Transactions and Income. For financial reporting purposes, the Fund's investment holdings and NAV include trades executed through the end of the last business day of the period. The NAV per share for processing shareholder transactions is calculated as of the close of business of the New York Stock Exchange (NYSE), normally 4:00 p.m. Eastern time and includes trades executed through the end of the prior business day. Gains and losses on securities sold are determined on the basis of identified cost and may include proceeds received from litigation. Dividend income is recorded on the ex-dividend date, except for certain dividends from foreign securities where the ex-dividend date may have passed, which are recorded as soon as the Fund is informed of the ex-dividend date. Non-cash dividends included in dividend income, if any, are recorded at the fair market value of the securities received. Distributions received on securities that represent a return of capital or capital gain are recorded as a reduction of cost of investments and/or as a realized gain. The Fund estimates the components of distributions received that may be considered return of capital distributions or capital gain distributions. Large, non-recurring dividends recognized by the Fund are presented separately on the Statement of Operations as "Special Dividends" and the impact of these dividends is presented in the Financial Highlights. Interest income and distributions from the Fidelity Central Funds are accrued as earned. Interest income includes coupon
Annual Report
3. Significant Accounting Policies - continued
Investment Transactions and Income - continued
interest and amortization of premium and accretion of discount on debt securities. Investment income is recorded net of foreign taxes withheld where recovery of such taxes is uncertain.
Expenses. Expenses directly attributable to a fund are charged to that fund. Expenses attributable to more than one fund are allocated among the respective funds on the basis of relative net assets or other appropriate methods. Expense estimates are accrued in the period to which they relate and adjustments are made when actual amounts are known.
Deferred Trustee Compensation. Under a Deferred Compensation Plan (the Plan), independent Trustees may elect to defer receipt of a portion of their annual compensation. Deferred amounts are invested in a cross-section of Fidelity funds, are marked-to-market and remain in the Fund until distributed in accordance with the Plan. The investment of deferred amounts and the offsetting payable to the Trustees are included in the accompanying Statement of Assets and Liabilities.
Income Tax Information and Distributions to Shareholders. Each year, the Fund intends to qualify as a regulated investment company under Subchapter M of the Internal Revenue Code, including distributing substantially all of its taxable income and realized gains. As a result, no provision for income taxes is required. As of July 31, 2012, the Fund did not have any unrecognized tax benefits in the financial statements; nor is the Fund aware of any tax positions for which it is reasonably possible that the total amounts of unrecognized tax benefits will significantly change in the next twelve months. The Fund files a U.S. federal tax return, in addition to state and local tax returns as required. A fund's federal income tax returns are subject to examination by the Internal Revenue Service (IRS) for a period of three fiscal years after they are filed. State and local tax returns may be subject to examination for an additional fiscal year depending on the jurisdiction. Foreign taxes are provided for based on the Fund's understanding of the tax rules and rates that exist in the foreign markets in which it invests.
Distributions are declared and recorded on the ex-dividend date. Income dividends and capital gain distributions are declared separately for each class. Income and capital gain distributions are determined in accordance with income tax regulations, which may differ from GAAP.
Capital accounts within the financial statements are adjusted for permanent book-tax differences. These adjustments have no impact on net assets or the results of operations. Temporary book-tax differences will reverse in a subsequent period.
Annual Report
Notes to Financial Statements - continued
(Amounts in thousands except percentages)
3. Significant Accounting Policies - continued
Income Tax Information and Distributions to Shareholders - continued
Book-tax differences are primarily due to foreign currency transactions, deferred trustees compensation, net operating losses, capital loss carryforwards and losses deferred due to wash sales and excise tax regulations.
The federal tax cost of investment securities and unrealized appreciation (depreciation) as of period end were as follows:
Gross unrealized appreciation | $ 1,256,997 |
Gross unrealized depreciation | (820,877) |
Net unrealized appreciation (depreciation) on securities and other investments | $ 436,120 |
| |
Tax Cost | $ 7,177,451 |
The tax-based components of distributable earnings as of period end were as follows:
Net unrealized appreciation (depreciation) | $ 436,093 |
The Fund intends to elect to defer to its fiscal year ending July 31, 2013 approximately $208,254 of capital losses recognized during the period November 1, 2011 to July 31, 2012.
New Accounting Pronouncement. In December 2011, the Financial Accounting Standards Board issued Accounting Standard Update No. 2011-11, Disclosures about Offsetting Assets and Liabilities. The update creates new disclosure requirements requiring entities to disclose both gross and net information for derivatives and other financial instruments that are either offset in the Statement of Assets and Liabilities or subject to an enforceable master netting arrangement or similar agreement. The disclosure requirements are effective for interim and annual reporting periods beginning on or after January 1, 2013. Management is currently evaluating the impact of the update's adoption on the Fund's financial statement disclosures.
4. Operating Policies.
Restricted Securities. The Fund may invest in securities that are subject to legal or contractual restrictions on resale. These securities generally may be resold in transactions exempt from registration or to the public if the securities are registered. Disposal of these securities may involve time-consuming negotiations and expense, and prompt sale at an acceptable price may be difficult. Information regarding restricted securities is included at the end of the Fund's Schedule of Investments.
Annual Report
5. Purchases and Sales of Investments.
Purchases and sales of securities, other than short-term securities, aggregated $11,131,870 and $11,443,769, respectively.
6. Fees and Other Transactions with Affiliates.
Management Fee. FMR and its affiliates provide the Fund with investment management related services for which the Fund pays a monthly management fee. The management fee is the sum of an individual fund fee rate that is based on an annual rate of .35% of the Fund's average net assets and an annualized group fee rate that averaged .26% during the period. The group fee rate is based upon the average net assets of all the mutual funds advised by FMR. The group fee rate decreases as assets under management increase and increases as assets under management decrease. In addition, the management fee is subject to a performance adjustment (up to a maximum of ± .20% of the Fund's average net assets over a 36 month performance period). The upward or downward adjustment to the management fee is based on the relative investment performance of OTC as compared to an appropriate benchmark index. For the period, the total annual management fee rate, including the performance adjustment, was .70% of the Fund's average net assets.
Transfer Agent Fees. Fidelity Investments Institutional Operations Company, Inc. (FIIOC), an affiliate of FMR, is the transfer, dividend disbursing and shareholder servicing agent for each class of the Fund. FIIOC receives account fees and asset-based fees that vary according to the account size and type of account of the shareholders of OTC. FIIOC receives an asset-based fee of Class K's average net assets. FIIOC pays for typesetting, printing and mailing of shareholder reports, except proxy statements. For the period, transfer agent fees for each class were as follows:
| Amount | % of
Average
Net Assets |
OTC | 11,410 | .19 |
Class K | 779 | .05 |
| $ 12,189 | |
Accounting and Security Lending Fees. Fidelity Service Company, Inc. (FSC), an affiliate of FMR, maintains the Fund's accounting records. The accounting fee is based on the level of average net assets for each month. Under a separate contract, FSC administers the security lending program. The security lending fee is based on the number and duration of lending transactions.
Annual Report
Notes to Financial Statements - continued
(Amounts in thousands except percentages)
6. Fees and Other Transactions with Affiliates - continued
Brokerage Commissions. The Fund placed a portion of its portfolio transactions with brokerage firms which are affiliates of the investment adviser. The commissions paid to these affiliated firms were $754 for the period.
Interfund Lending Program. Pursuant to an Exemptive Order issued by the SEC, the Fund, along with other registered investment companies having management contracts with FMR, may participate in an interfund lending program. This program provides an alternative credit facility allowing the funds to borrow from, or lend money to, other participating affiliated funds. At period end, there were no interfund loans outstanding. The Fund's activity in this program during the period for which loans were outstanding was as follows:
Borrower or Lender | Average Loan
Balance | Weighted Average
Interest Rate | Interest
Expense |
Borrower | $ 15,256 | .38% | $ 6 |
7. Committed Line of Credit.
The Fund participates with other funds managed by FMR or an affiliate in a $4.25 billion credit facility (the "line of credit") to be utilized for temporary or emergency purposes to fund shareholder redemptions or for other short-term liquidity purposes. The Fund has agreed to pay commitment fees on its pro-rata portion of the line of credit, which amounted to $21 and is reflected in Miscellaneous expenses on the Statement of Operations. During the period, there were no borrowings on this line of credit.
8. Security Lending.
The Fund lends portfolio securities through a lending agent from time to time in order to earn additional income. For equity securities, a lending agent is used and may loan securities to certain qualified borrowers, including Fidelity Capital Markets (FCM), a broker-dealer affiliated with the Fund. On the settlement date of the loan, the Fund receives collateral (in the form of U.S. Treasury obligations, letters of credit and/or cash) against the loaned securities and maintains collateral in an amount not less than 100% of the market value of the loaned securities during the period of the loan. The market value of the loaned securities is determined at the close of business of the Fund and any additional required collateral is delivered to the Fund on the next business day. If the borrower defaults on its obligation to return the securities loaned because of insolvency or other reasons, a fund could experience delays and costs in recovering the securities loaned or in gaining access to the collateral. Any cash collateral received is invested in the Fidelity Securities Lending Cash Central Fund. The value of loaned securities and cash collateral at period end are disclosed on the Fund's Statement of Assets and
Annual Report
8. Security Lending - continued
Liabilities. The value of securities loaned to FCM at period end was $23,266. Security lending income represents the income earned on investing cash collateral, less rebates paid to borrowers and any lending agent fees associated with the loan, plus any premium payments received for lending certain types of securities. Security lending income is presented in the Statement of Operations as a component of income from Fidelity Central Funds, and includes $2,194 from securities loaned to FCM.
9. Expense Reductions.
Many of the brokers with whom FMR places trades on behalf of the Fund provided services to the Fund in addition to trade execution. These services included payments of certain expenses on behalf of the Fund totaling $1,184 for the period.
10. Share Transactions.
Transactions for each class of shares were as follows:
| Shares | Dollars |
Years ended July 31, | 2012 | 2011 | 2012 | 2011 |
OTC | | | | |
Shares sold | 24,727 | 24,641 | $ 1,432,210 | $ 1,408,789 |
Shares redeemed | (36,677) | (29,999) | (2,097,412) | (1,594,260) |
Net increase (decrease) | (11,950) | (5,358) | $ (665,202) | $ (185,471) |
Class K | | | | |
Shares sold | 15,671 | 7,657 | $ 918,563 | $ 426,960 |
Shares redeemed | (10,166) | (5,502) | (594,038) | (299,618) |
Net increase (decrease) | 5,505 | 2,155 | $ 324,525 | $ 127,342 |
11. Other.
The Fund's organizational documents provide former and current trustees and officers with a limited indemnification against liabilities arising in connection with the performance of their duties to the Fund. In the normal course of business, the Fund may also enter into contracts that provide general indemnifications. The Fund's maximum exposure under these arrangements is unknown as this would be dependent on future claims that may be made against the Fund. The risk of material loss from such claims is considered remote.
Annual Report
To the Trustees of Fidelity Securities Fund and Shareholders of Fidelity OTC Portfolio:
We have audited the accompanying statement of assets and liabilities of Fidelity OTC Portfolio (the Fund), a fund of Fidelity Securities Fund, including the schedule of investments, as of July 31, 2012, and the related statement of operations for the year then ended, the statement of changes in net assets for each of the two years in the period then ended, and the financial highlights for each of the five years in the period then ended. These financial statements and financial highlights are the responsibility of the Fund's management. Our responsibility is to express an opinion on these financial statements and financial highlights based on our audits.
We conducted our audits in accordance with the standards of the Public Company Accounting Oversight Board (United States). Those standards require that we plan and perform the audit to obtain reasonable assurance about whether the financial statements and financial highlights are free of material misstatement. The Fund is not required to have, nor were we engaged to perform, an audit of its internal control over financial reporting. Our audits included consideration of internal control over financial reporting as a basis for designing audit procedures that are appropriate in the circumstances, but not for the purpose of expressing an opinion on the effectiveness of the Fund's internal control over financial reporting. Accordingly, we express no such opinion. An audit also includes examining, on a test basis, evidence supporting the amounts and disclosures in the financial statements, assessing the accounting principles used and significant estimates made by management, as well as evaluating the overall financial statement presentation. Our procedures included confirmation of securities owned as of July 31, 2012, by correspondence with the custodians and brokers; where replies were not received from brokers, we performed other auditing procedures. We believe that our audits provide a reasonable basis for our opinion.
In our opinion, the financial statements and financial highlights referred to above present fairly, in all material respects, the financial position of Fidelity OTC Portfolio as of July 31, 2012, the results of its operations for the year then ended, the changes in its net assets for each of the two years in the period then ended, and the financial highlights for each of the five years in the period then ended, in conformity with accounting principles generally accepted in the United States of America.
DELOITTE & TOUCHE LLP
Boston, Massachusetts
September 12, 2012
Annual Report
The Trustees, Members of the Advisory Board, and executive officers of the trust and fund, as applicable, are listed below. The Board of Trustees governs the fund and is responsible for protecting the interests of shareholders. The Trustees are experienced executives who meet periodically throughout the year to oversee the fund's activities, review contractual arrangements with companies that provide services to the fund, oversee management of the risks associated with such activities and contractual arrangements, and review the fund's performance. Except for James C. Curvey, each of the Trustees oversees 228 funds advised by FMR or an affiliate. Mr. Curvey oversees 435 funds advised by FMR or an affiliate.
The Trustees hold office without limit in time except that (a) any Trustee may resign; (b) any Trustee may be removed by written instrument, signed by at least two-thirds of the number of Trustees prior to such removal; (c) any Trustee who requests to be retired or who has become incapacitated by illness or injury may be retired by written instrument signed by a majority of the other Trustees; and (d) any Trustee may be removed at any special meeting of shareholders by a two-thirds vote of the outstanding voting securities of the trust. Each Trustee who is not an interested person (as defined in the 1940 Act) (Independent Trustee), shall retire not later than the last day of the calendar year in which his or her 75th birthday occurs. The Independent Trustees may waive this mandatory retirement age policy with respect to individual Trustees. The executive officers and Advisory Board Members hold office without limit in time, except that any officer and Advisory Board Member may resign or may be removed by a vote of a majority of the Trustees at any regular meeting or any special meeting of the Trustees. Except as indicated, each individual has held the office shown or other offices in the same company for the past five years.
Experience, Skills, Attributes, and Qualifications of the Fund's Trustees. The Governance and Nominating Committee has adopted a statement of policy that describes the experience, qualifications, attributes, and skills that are necessary and desirable for potential Independent Trustee candidates (Statement of Policy). The Board believes that each Trustee satisfied at the time he or she was initially elected or appointed a Trustee, and continues to satisfy, the standards contemplated by the Statement of Policy. The Governance and Nominating Committee also engages professional search firms to help identify potential Independent Trustee candidates who have the experience, qualifications, attributes, and skills consistent with the Statement of Policy. From time to time, additional criteria based on the composition and skills of the current Independent Trustees, as well as experience or skills that may be appropriate in light of future changes to board composition, business conditions, and regulatory or other developments, have also been considered by the professional search firms and the Governance and Nominating Committee. In addition, the Board takes into account the Trustees' commitment and participation in Board and committee meetings, as well as their leadership of standing and ad hoc committees throughout their tenure.
In determining that a particular Trustee was and continues to be qualified to serve as a Trustee, the Board has considered a variety of criteria, none of which, in isolation, was controlling. The Board believes that, collectively, the Trustees have balanced and diverse experience, qualifications, attributes, and skills, which allow the Board to operate effectively in governing the fund and protecting the interests of shareholders. Information about the specific experience, skills, attributes, and qualifications of each Trustee, which in each case led to the Board's conclusion that the Trustee should serve (or continue to serve) as a trustee of the fund, is provided below.
Annual Report
Trustees and Officers - continued
Board Structure and Oversight Function. James C. Curvey is an interested person (as defined in the 1940 Act) and currently serves as Chairman. The Trustees have determined that an interested Chairman is appropriate and benefits shareholders because an interested Chairman has a personal and professional stake in the quality and continuity of services provided to the fund. Independent Trustees exercise their informed business judgment to appoint an individual of their choosing to serve as Chairman, regardless of whether the Trustee happens to be independent or a member of management. The Independent Trustees have determined that they can act independently and effectively without having an Independent Trustee serve as Chairman and that a key structural component for assuring that they are in a position to do so is for the Independent Trustees to constitute a substantial majority for the Board. The Independent Trustees also regularly meet in executive session. Ned C. Lautenbach serves as Chairman of the Independent Trustees and as such (i) acts as a liaison between the Independent Trustees and management with respect to matters important to the Independent Trustees and (ii) with management prepares agendas for Board meetings.
Fidelity funds are overseen by different Boards of Trustees. The fund's Board oversees Fidelity's equity and high income funds and another Board oversees Fidelity's investment-grade bond, money market, and asset allocation funds. The asset allocation funds may invest in Fidelity funds overseen by the fund's Board. The use of separate Boards, each with its own committee structure, allows the Trustees of each group of Fidelity funds to focus on the unique issues of the funds they oversee, including common research, investment, and operational issues. On occasion, the separate Boards establish joint committees to address issues of overlapping consequences for the Fidelity funds overseen by each Board.
The Trustees operate using a system of committees to facilitate the timely and efficient consideration of all matters of importance to the Trustees, the fund, and fund shareholders and to facilitate compliance with legal and regulatory requirements and oversight of the fund's activities and associated risks. The Board, acting through its committees, has charged FMR and its affiliates with (i) identifying events or circumstances the occurrence of which could have demonstrably adverse effects on the fund's business and/or reputation; (ii) implementing processes and controls to lessen the possibility that such events or circumstances occur or to mitigate the effects of such events or circumstances if they do occur; and (iii) creating and maintaining a system designed to evaluate continuously business and market conditions in order to facilitate the identification and implementation processes described in (i) and (ii) above. Because the day-to-day operations and activities of the fund are carried out by or through FMR, its affiliates and other service providers, the fund's exposure to risks is mitigated but not eliminated by the processes overseen by the Trustees. While each of the Board's committees has responsibility for overseeing different aspects of the fund's activities, oversight is exercised primarily through the Operations, Audit, and Compliance Committees. In addition, the Independent Trustees have worked with FMR to enhance the Board's oversight of investment and financial risks, legal and regulatory risks, technology risks, and operational risks, including the development of additional risk reporting to the Board. For example, a working group comprised of Independent Trustees and FMR has worked and continues to work to review the Fidelity funds' valuation-related activities, reporting and risk management. Appropriate personnel, including but not limited to the fund's Chief Compliance Officer (CCO), FMR's internal auditor, the independent accountants, the fund's Treasurer and portfolio management personnel, make periodic reports to the Board's committees, as appropriate, including an annual review of FMR's risk management program for the Fidelity funds. The responsibilities of each standing committee, including their oversight responsibilities, are described further under "Standing Committees of the Fund's Trustees."
Annual Report
The fund's Statement of Additional Information (SAI) includes more information about the Trustees. To request a free copy, call Fidelity at 1-800-544-8544.
Interested Trustees*:
Correspondence intended for each Trustee who is an interested person may be sent to Fidelity Investments, 82 Devonshire Street, Boston, Massachusetts 02109.
Name, Age; Principal Occupations and Other Relevant Experience+ |
James C. Curvey (77) |
| Year of Election or Appointment: 2007 Mr. Curvey is Trustee and Chairman of the Board of Trustees of certain Trusts. Mr. Curvey also serves as Trustee (2007-present) of other investment companies advised by FMR. Mr. Curvey is a Director of Fidelity Investments Money Management, Inc. (2009-present), Director of Fidelity Research & Analysis Co. (2009-present) and Director of FMR and FMR Co., Inc. (2007-present). Mr. Curvey is also Vice Chairman (2007-present) and Director of FMR LLC. In addition, Mr. Curvey serves as an Overseer for the Boston Symphony Orchestra and a member of the Trustees of Villanova University. Previously, Mr. Curvey was the Vice Chairman (2006-2007) and Director (2000-2007) of FMR Corp. |
Ronald P. O'Hanley (55) |
| Year of Election or Appointment: 2011 Mr. O'Hanley is Director of FMR Co., Inc. (2010-present), Director of Fidelity Investments Money Management, Inc. (2010-present), Director of Fidelity Research & Analysis Company (2010-present), President of Fidelity Asset Management and Corporate Services and a member of Fidelity's Executive Committee (2010-present). Previously, Mr. O'Hanley served as President and Chief Executive Officer of BNY Mellon Asset Management (2007-2010). Mr. O'Hanley also served as Vice Chairman of Bank New York Mellon Corp. and a member of that firm's Executive Committee. Prior to the 2007 merger of The Bank of New York and Mellon Financial Corporation, he was Vice Chairman of Mellon Financial Corporation and President and Chief Executive Officer of Mellon Asset Management. He joined Mellon in February 1997. Mr. O'Hanley currently serves as Chairman of the Boston Public Library Foundation Board of Directors and sits on the Board of Directors of Beth Israel Deaconess Medical Center, the Board of Trustees of the Marine Biological Laboratory and the Advisory Board of the Maxwell School of Citizenship and Public Administration at Syracuse University. Mr. O'Hanley also chairs the Council on Asset Management for the Financial Services Roundtable and is a member of the Board of Directors of Institutional Investor's U.S. Institute. |
* Trustees have been determined to be "Interested Trustees" by virtue of, among other things, their affiliation with the trust or various entities under common control with FMR.
+ The information above includes each Trustee's principal occupation during the last five years and other information relating to the experience, attributes, and skills relevant to each Trustee's qualifications to serve as a Trustee, which led to the conclusion that each Trustee should serve as a Trustee for the fund.
Annual Report
Independent Trustees:
Correspondence intended for each Independent Trustee (that is, the Trustees other than the Interested Trustees) may be sent to Fidelity Investments, P.O. Box 55235, Boston, Massachusetts 02205-5235.
Name, Age; Principal Occupations and Other Relevant Experience+ |
Dennis J. Dirks (64) |
| Year of Election or Appointment: 2005 Prior to his retirement in May 2003, Mr. Dirks was Chief Operating Officer and a member of the Board of The Depository Trust & Clearing Corporation (DTCC). He also served as President, Chief Operating Officer, and Board member of The Depository Trust Company (DTC) and President and Board member of the National Securities Clearing Corporation (NSCC). In addition, Mr. Dirks served as Chief Executive Officer and Board member of the Government Securities Clearing Corporation, Chief Executive Officer and Board member of the Mortgage-Backed Securities Clearing Corporation, as a Trustee and a member of the Finance Committee of Manhattan College (2005-2008), and as a Trustee and a member of the Finance Committee of AHRC of Nassau County (2006-2008). Mr. Dirks is a member of the Independent Directors Council (IDC) Governing Council (2010-present) and Board of Directors for The Brookville Center for Children's Services, Inc. (2009-present). |
Alan J. Lacy (58) |
| Year of Election or Appointment: 2008 Mr. Lacy serves as Senior Adviser (2007-present) of Oak Hill Capital Partners, L.P. (private equity). Mr. Lacy also served as Chief Executive Officer (2000-2005) and Vice Chairman (2005-2006) of Sears Holdings Corporation and Sears, Roebuck and Co. (retail). In addition, Mr. Lacy serves as a member of the Board of Directors of Dave & Buster's Entertainment, Inc. (restaurant and entertainment complexes, 2010-present), Earth Fare, Inc. (retail grocery, 2012-present), The Hillman Companies, Inc. (hardware wholesalers, 2010-present), and Bristol-Myers Squibb Company (global pharmaceuticals, 2007-present). Mr. Lacy is a member of the Board of Trustees of The National Parks Conservation Association (2006-present). Previously, Mr. Lacy served as Chairman of the Board of Trustees of the National Parks Conservation Association (2008-2011) and as a member of the Board of Directors for the Western Union Company (global money transfer, 2006-2011). |
Ned C. Lautenbach (68) |
| Year of Election or Appointment: 2000 Mr. Lautenbach is Chairman of the Independent Trustees of the Equity and High Income Funds (2006-present). Mr. Lautenbach currently serves as the Lead Director of the Eaton Corporation Board of Directors (diversified industrial, 1997-present). Mr. Lautenbach is Chairman of the Board of Directors of the Philharmonic Center for the Arts in Naples, Florida (2012-present) and a member of the Council on Foreign Relations (1994-present). Previously, Mr. Lautenbach was a Partner/Advisory Partner at Clayton, Dubilier & Rice, LLC (private equity investment, 1998-2010), as well as a Director of Sony Corporation (2006-2007). |
Joseph Mauriello (67) |
| Year of Election or Appointment: 2008 Prior to his retirement in January 2006, Mr. Mauriello served in numerous senior management positions including Deputy Chairman and Chief Operating Officer (2004-2005), and Vice Chairman of Financial Services (2002-2004) of KPMG LLP US (professional services, 1965-2005). Mr. Mauriello currently serves as a member of the Board of Directors of XL Group plc. (global insurance and re-insurance, 2006-present). Previously, Mr. Mauriello served as a Director of the Hamilton Funds of the Bank of New York (2006-2007) and of Arcadia Resources Inc. (health care services and products, 2007-2012). |
Robert W. Selander (61) |
| Year of Election or Appointment: 2011 Previously, Mr. Selander served as a Member of the Advisory Board of Fidelity's Equity and High Income Funds (2011), Executive Vice Chairman (2010), Chief Executive Officer (2009-2010), and President and Chief Executive Officer (1997-2009) of Mastercard, Inc. |
Cornelia M. Small (68) |
| Year of Election or Appointment: 2005 Ms. Small is a member of the Board of Directors of the Teagle Foundation (2009-present). Ms. Small is also a member of the Investment Committee, and Chair (2008-present) and a member of the Board of Trustees of Smith College. In addition, Ms. Small serves on the Investment Committee of the Berkshire Taconic Community Foundation (2008-present). Previously, Ms. Small served as Chairperson of the Investment Committee (2002-2008) of Smith College. In addition, Ms. Small served as Chief Investment Officer, Director of Global Equity Investments, and a member of the Board of Directors of Scudder, Stevens & Clark and Scudder Kemper Investments. |
William S. Stavropoulos (73) |
| Year of Election or Appointment: 2001 Mr. Stavropoulos is Vice Chairman of the Independent Trustees of the Equity and High Income Funds (2006-present). Mr. Stavropoulos serves as President and Founder of the Michigan Baseball Foundation, the Great Lakes Loons (2007-present). Mr. Stavropoulos is Chairman Emeritus of the Board of Directors of The Dow Chemical Company, where he previously served in numerous senior management positions, including President, CEO (1995-2000; 2002-2004), Chairman of the Executive Committee (2000-2006), and as a member of the Board of Directors (1990-2006). Currently, Mr. Stavropoulos is Chairman of Univar (global distributor of commodity and specialty chemicals, 2010-present), a Director of Teradata Corporation (data warehousing and technology solutions, 2008-present), Chemical Financial Corporation, Maersk Inc. (industrial conglomerate), Tyco International, Inc. (multinational manufacturing and services, 2007-present), and a member of the Advisory Board for Metalmark Capital (private equity investment, 2005-present). Mr. Stavropoulos is a special advisor to Clayton, Dubilier & Rice, LLC (private equity investment). In addition, Mr. Stavropoulos is a member of the University of Notre Dame Advisory Council for the College of Science. |
David M. Thomas (63) |
| Year of Election or Appointment: 2008 Previously, Mr. Thomas served as Executive Chairman (2005-2006) and Chairman and Chief Executive Officer (2000-2005) of IMS Health, Inc. (pharmaceutical and healthcare information solutions). In addition, Mr. Thomas serves as a member of the Board of Directors of Fortune Brands, Inc. (consumer products), and Interpublic Group of Companies, Inc. (marketing communication, 2004-present). |
Michael E. Wiley (61) |
| Year of Election or Appointment: 2008 Mr. Wiley also serves as a Director of Asia Pacific Exploration Consolidated (international oil and gas exploration and production, 2008-present). Mr. Wiley serves as a Director of Tesoro Corporation (independent oil refiner and marketer, 2005-present), and a Director of Bill Barrett Corporation (exploration and production, 2005-present). In addition, Mr. Wiley also serves as a Director of Post Oak Bank (privately-held bank, 2004-present). Previously, Mr. Wiley served as a member of the Board of Trustees of the University of Tulsa (2000-2006; 2007-2010), as a Senior Energy Advisor of Katzenbach Partners, LLC (consulting, 2006-2007), as an Advisory Director of Riverstone Holdings (private investment), Chairman, President, and CEO of Baker Hughes, Inc. (oilfield services, 2000-2004), and as Director of Spinnaker Exploration Company (exploration and production, 2001-2005). |
Annual Report
Trustees and Officers - continued
+ The information above includes each Trustee's principal occupation during the last five years and other information relating to the experience, attributes, and skills relevant to each Trustee's qualifications to serve as a Trustee, which led to the conclusion that each Trustee should serve as a Trustee for the fund.
Advisory Board Members and Executive Officers:
Correspondence intended for each executive officer, Edward C. Johnson 3d, Peter S. Lynch, David A. Rosow, and Garnett A. Smith may be sent to Fidelity Investments, 82 Devonshire Street, Boston, Massachusetts 02109.
Name, Age; Principal Occupation |
Edward C. Johnson 3d (82) |
| Year of Election or Appointment: 2011 Member of the Advisory Board of Fidelity's Equity and High Income Funds. Mr. Johnson serves as Chief Executive Officer, Chairman, and a Director of FMR LLC, and also serves as Chairman and Director of FIL Limited. Previously, Mr. Johnson served as a Trustee and Chairman of the Board of certain Fidelity Trusts, Chairman and a Director of FMR, Chairman and a Director of FMR Co., Inc., and President of FMR LLC (2006-2007). |
Peter S. Lynch (68) |
| Year of Election or Appointment: 2003 Member of the Advisory Board of Fidelity's Equity and High Income Funds. Mr. Lynch is Vice Chairman and a Director of FMR and FMR Co., Inc. In addition, Mr. Lynch serves as a Trustee of Boston College and as the Chairman of the Inner-City Scholarship Fund. Previously, Mr. Lynch served on the Special Olympics International Board of Directors (1997-2006). |
David A. Rosow (69) |
| Year of Election or Appointment: 2012 Member of the Advisory Board of Fidelity's Equity and High Income Funds. Chairman and Chief Executive Officer of International Golf Group, Inc. (golf course development, 1990-present). Previously, Mr. Rosow served as Chairman and Chief Executive Officer of Rosow & Company, Inc. (private investment company, 1989-2011), a Lead Director of Hudson United Bancorp (2001-2006) and as a Director of TD Banknorth (1996-2006). In addition, Mr. Rosow is a member (2008-present) and President (2009-present) of the Town Council of Palm Beach, Florida. |
Garnett A. Smith (64) |
| Year of Election or Appointment: 2012 Member of the Advisory Board of Fidelity's Equity and High Income Funds. Prior to Mr. Smith's retirement, he served as Chairman and Chief Executive Officer of Inbrand Corp. (manufacturer of personal absorbent products, 1990-1997). He also served as President (1986-1990) of Inbrand Corp. Prior to his employment with Inbrand Corp., he was employed by a retail fabric chain and North Carolina National Bank. In addition, Mr. Smith is a board member of the Jackson Hole Land Trust (2009-present). |
Kenneth B. Robins (42) |
| Year of Election or Appointment: 2008 President and Treasurer of Fidelity's Equity and High Income Funds. Mr. Robins also serves as President and Treasurer (2010-present) and Assistant Treasurer (2009-present) of other Fidelity funds and is an employee of Fidelity Investments (2004-present). Previously, Mr. Robins served as Deputy Treasurer of the Fidelity funds (2005-2008) and Treasurer and Chief Financial Officer of The North Carolina Capital Management Trust: Cash and Term Portfolios (2006-2008). |
Bruce T. Herring (46) |
| Year of Election or Appointment: 2006 Vice President of certain Equity Funds. Mr. Herring also serves as President of Fidelity Research & Analysis Company (2010-present), Chief Investment Officer and Director of Fidelity Management & Research (U.K.) Inc. (2010-present) and Group Chief Investment Officer of FMR. Previously, Mr. Herring served as Vice President (2005-2006) and Senior Vice President (2006-2007) of Fidelity Management & Research Company, Vice President of FMR Co., Inc. (2001-2007) and as a portfolio manager for Fidelity U.S. Equity Funds. |
Brian B. Hogan (47) |
| Year of Election or Appointment: 2009 Vice President of Equity and High Income Funds. Mr. Hogan also serves as President of FMR's Equity Division (2009-present). Previously, Mr. Hogan served as Senior Vice President, Equity Research of FMR (2006-2009) and as a portfolio manager. |
Scott C. Goebel (44) |
| Year of Election or Appointment: 2008 Secretary and Chief Legal Officer (CLO) of the Fidelity funds. Mr. Goebel also serves as Secretary of Fidelity Investments Money Management, Inc. (FIMM) (2010-present) and Fidelity Research and Analysis Company (FRAC) (2010-present); Secretary and CLO of The North Carolina Capital Management Trust: Cash and Term Portfolios (2008-present); General Counsel, Secretary, and Senior Vice President of FMR (2008-present) and FMR Co., Inc. (2008-present); employed by FMR LLC or an affiliate (2001-present); Chief Legal Officer of Fidelity Management & Research (Hong Kong) Limited (2008-present) and Assistant Secretary of Fidelity Management & Research (Japan) Inc. (2008-present), and Fidelity Management & Research (U.K.) Inc. (2008-present). Previously, Mr. Goebel served as Assistant Secretary of FIMM (2008-2010), FRAC (2008-2010), and the Funds (2007-2008) and as Vice President and Secretary of Fidelity Distributors Corporation (FDC) (2005-2007). |
William C. Coffey (43) |
| Year of Election or Appointment: 2009 Assistant Secretary of Fidelity's Equity and High Income Funds. Mr. Coffey also serves as Senior Vice President and Deputy General Counsel of FMR LLC (2010-present), and is an employee of Fidelity Investments. Previously, Mr. Coffey served as Vice President and Associate General Counsel of FMR LLC (2005-2009). |
Elizabeth Paige Baumann (44) |
| Year of Election or Appointment: 2012 Anti-Money Laundering (AML) Officer of the Fidelity funds. Ms. Baumann also serves as AML Officer of The North Carolina Capital Management Trust: Cash and Term Portfolios (2012-present), Chief AML Officer of FMR LLC (2012-present), and is an employee of Fidelity Investments. Previously, Ms. Baumann served as Vice President and Deputy Anti-Money Laundering Officer (2007-2012). |
Christine Reynolds (53) |
| Year of Election or Appointment: 2008 Chief Financial Officer of the Fidelity funds. Ms. Reynolds became President of Fidelity Pricing and Cash Management Services (FPCMS) in August 2008. Ms. Reynolds served as Chief Operating Officer of FPCMS (2007-2008). Previously, Ms. Reynolds served as President, Treasurer, and Anti-Money Laundering officer of the Fidelity funds (2004-2007). |
Joseph A. Hanlon (44) |
| Year of Election or Appointment: 2012 Chief Compliance Officer of Fidelity's Equity and High Income Funds. Mr. Hanlon serves as Compliance Officer of FMR, FMR Co., Inc., Fidelity Investments Money Management, Inc. (FIMM), Fidelity Research and Analysis Company (FRAC), Fidelity Management & Research (Japan) Inc., Fidelity Management & Research (U.K.) Inc., Fidelity Management & Research (Hong Kong), and Strategic Advisers, Inc. (2009-present), as Senior Vice President of the Fidelity Asset Management Division (2009-present), and is an employee of Fidelity Investments. |
Joseph F. Zambello (55) |
| Year of Election or Appointment: 2011 Deputy Treasurer of the Fidelity funds. Mr. Zambello is an employee of Fidelity Investments. Previously, Mr. Zambello served as Vice President of FMR's Program Management Group (2009-2011) and Vice President of the Transfer Agent Oversight Group (2005-2009). |
Adrien E. Deberghes (44) |
| Year of Election or Appointment: 2008 Deputy Treasurer of Fidelity's Equity and High Income Funds. Mr. Deberghes also serves as Vice President (2011-present) and Assistant Treasurer (2010-present) of other Fidelity funds, and is an employee of Fidelity Investments (2008-present). Previously, Mr. Deberghes served as Senior Vice President of Mutual Fund Administration at State Street Corporation (2007-2008), Senior Director of Mutual Fund Administration at Investors Bank & Trust (2005-2007), and Director of Finance for Dunkin' Brands (2000-2005). |
Stephanie J. Dorsey (43) |
| Year of Election or Appointment: 2010 Assistant Treasurer of Fidelity's Equity and High Income Funds. Ms. Dorsey also serves as Deputy Treasurer of other Fidelity funds (2008-present) and is an employee of Fidelity Investments (2008-present). Previously, Ms. Dorsey served as Treasurer (2004-2008) of the JPMorgan Mutual Funds and Vice President (2004-2008) of JPMorgan Chase Bank. |
John R. Hebble (54) |
| Year of Election or Appointment: 2009 Assistant Treasurer of Fidelity's Equity and High Income Funds. Mr. Hebble also serves as President (2011-present), Treasurer, and Chief Financial Officer of The North Carolina Capital Management Trust: Cash and Term Portfolios (2008-present), President and Treasurer of other Fidelity funds (2008-present) and is an employee of Fidelity Investments. |
Gary W. Ryan (53) |
| Year of Election or Appointment: 2005 Assistant Treasurer of the Fidelity funds. Mr. Ryan is an employee of Fidelity Investments. Previously, Mr. Ryan served as Vice President of Fund Reporting in Fidelity Pricing and Cash Management Services (FPCMS) (1999-2005). |
Jonathan Davis (44) |
| Year of Election or Appointment: 2010 Assistant Treasurer of the Fidelity funds. Mr. Davis is also Assistant Treasurer of Fidelity Rutland Square Trust II and Fidelity Commonwealth Trust II. Mr. Davis is an employee of Fidelity Investments. Previously, Mr. Davis served as Vice President and Associate General Counsel of FMR LLC (2003-2010). |
Annual Report
Board Approval of Investment Advisory Contracts and Management Fees
Fidelity OTC Portfolio
Each year, the Board of Trustees, including the Independent Trustees (together, the Board), votes on the renewal of the management contract and sub-advisory agreements (together, the Advisory Contracts) for the fund. The Board, assisted by the advice of fund counsel and Independent Trustees' counsel, requests and considers a broad range of information relevant to the renewal of the Advisory Contracts throughout the year.
The Board meets regularly and, at each of its meetings, considers factors that are relevant to its annual consideration of the renewal of the fund's Advisory Contracts, including the services and support provided to the fund and its shareholders. The Board has established various standing committees, each composed of and chaired by Independent Trustees with varying backgrounds, to which the Board has assigned specific subject matter responsibilities in order to enhance effective decision-making by the Board. The Board, acting directly and through its Committees, requests and receives information concerning the annual consideration of the renewal of the fund's Advisory Contracts. The Board also meets as needed to consider matters specifically related to the Board's annual consideration of the renewal of Advisory Contracts. Members of the Board may also meet with trustees of other Fidelity funds through ad hoc joint committees to discuss certain matters relevant to the Fidelity funds.
At its July 2012 meeting, the Board of Trustees, including the Independent Trustees, unanimously determined to renew the fund's Advisory Contracts. In reaching its determination, the Board considered all factors it believed relevant, including (i) the nature, extent, and quality of the services to be provided to the fund and its shareholders (including the investment performance of the fund); (ii) the competitiveness of the fund's management fee and total expense ratio relative to peer funds; (iii) the total costs of the services to be provided by and the profits to be realized by Fidelity from its relationship with the fund; (iv) the extent to which economies of scale exist and would be realized as the fund grows; and (v) whether fee levels reflect these economies of scale, if any, for the benefit of fund shareholders.
In considering whether to renew the Advisory Contracts for the fund, the Board reached a determination, with the assistance of fund counsel and Independent Trustees' counsel and through the exercise of its business judgment, that the renewal of the Advisory Contracts is in the best interests of the fund and its shareholders and that the compensation payable under the Advisory Contracts is fair and reasonable. The Board's decision to renew the Advisory Contracts was not based on any single factor, but rather was based on a comprehensive consideration of all the information provided to the Board at its meetings throughout the year. The Board, in reaching its determination to renew the Advisory Contracts, is aware that shareholders in the fund have a broad range of investment choices available to them, including a wide choice among mutual funds offered by Fidelity's competitors, and that the fund's shareholders, who have the opportunity to review and weigh the disclosure provided by the fund in its prospectus and other public disclosures, have chosen to invest in this fund, managed by Fidelity.
Annual Report
Board Approval of Investment Advisory Contracts and
Management Fees - continued
Nature, Extent, and Quality of Services Provided. The Board considered the staffing within the investment adviser, FMR, and the sub-advisers (together, the Investment Advisers), including the backgrounds of the fund's investment personnel, and also considered the fund's investment objective, strategies, and related investment philosophy. The Independent Trustees also had discussions with senior management of Fidelity's investment operations and investment groups. The Board considered the structure of the portfolio manager compensation program and whether this structure provides appropriate incentives to act in the best interests of the fund.
Resources Dedicated to Investment Management and Support Services. The Board and the Fund Oversight and Research Committees reviewed the general qualifications and capabilities of the Investment Advisers' investment staff, including its size, education, experience, and resources, as well as the Investment Advisers' approach to recruiting, training, managing, and compensating investment personnel. The Board also noted that FMR has continued to increase the resources devoted to non-U.S. offices, including expansion of Fidelity's global investment organization. The Board noted that Fidelity's analysts have extensive resources, tools and capabilities that allow them to conduct sophisticated quantitative and fundamental analysis, as well as credit analysis of issuers, counterparties and guarantors. The Board also believes that Fidelity's investment professionals have sufficient access to global information and data so as to provide competitive investment results over time, and that those professionals also have access to sophisticated tools that permit them to assess portfolio construction and risk and performance attribution characteristics continuously, as well as to transmit new information and research conclusions rapidly around the world. Additionally, in its deliberations, the Board considered the Investment Advisers' trading and risk management capabilities and resources, which are an integral part of the investment management process.
Shareholder and Administrative Services. The Board considered (i) the nature, extent, quality, and cost of advisory, administrative, and shareholder services performed by the Investment Advisers and their affiliates under the Advisory Contracts and under separate agreements covering transfer agency, pricing and bookkeeping, and securities lending services for the fund; (ii) the nature and extent of the supervision of third party service providers, principally custodians and subcustodians; and (iii) the resources devoted to, and the record of compliance with, the fund's compliance policies and procedures. The Board also reviewed the allocation of fund brokerage, including allocations to brokers affiliated with the Investment Advisers, the use of brokerage commissions to pay fund expenses, and the use of "soft" commission dollars to pay for research services.
Annual Report
The Board noted that the growth of fund assets over time across the complex allows Fidelity to reinvest in the development of services designed to enhance the value or convenience of the Fidelity funds as investment vehicles. These services include 24-hour access to account information and market information through telephone representatives and over the Internet, investor education materials and asset allocation tools, and the expanded availability of Fidelity Investor Centers.
Investment in a Large Fund Family. The Board considered the benefits to shareholders of investing in a Fidelity fund, including the benefits of investing in a fund that is part of a large family of funds offering a variety of investment disciplines and providing a large variety of mutual fund investor services. The Board noted that Fidelity had taken, or had made recommendations that resulted in the Fidelity funds taking, a number of actions over the previous year that benefited particular funds, including (i) continuing to dedicate additional resources to investment research and support of the senior management team that oversees asset management; (ii) persisting in efforts to enhance Fidelity's research capabilities, in particular, international research; (iii) launching new funds and making other enhancements to meet client needs for global and income-oriented solutions; (iv) continuing to launch dedicated lower cost underlying funds to meet investment management's portfolio construction needs related to expanding underlying fund options, specifically for the Freedom Fund product lines; (v) adopting a "Stock Selector" sector neutral investment approach and employing a team of portfolio managers who are sector specialists to manage certain funds; (vi) rationalizing product lines and gaining increased efficiencies through the mergers of several funds into other funds; (vii) strengthening the Spartan Index Fund product line by adding new funds and/or new low-cost institutional share classes, restructuring fund expenses to accommodate new classes, and reducing investment minimums for certain classes of shares; (viii) modifying the eligibility criteria for Institutional Class shares to increase their appeal to government entities and charitable investors; and (ix) reducing certain transfer agent fee rates.
Investment Performance. The Board considered whether the fund has operated in accordance with its investment objective, as well as its record of compliance with its investment restrictions. It also reviewed the fund's absolute investment performance for each class, as well as the fund's relative investment performance for each class measured over multiple periods against a broad-based securities market index. The Board noted that FMR believes that no meaningful peer group exists for the fund principally because most other funds in the fund's third-party peer group have different and/or broader investment mandates than the fund's more specialized strategies. The following charts considered by the Board show, over the one-, three-, and five-year periods ended December 31, 2011, as available, the cumulative total returns of Class K and the retail class of the fund and the cumulative total returns of a broad-based securities market index ("benchmark").
Annual Report
Board Approval of Investment Advisory Contracts and
Management Fees - continued
Fidelity OTC Portfolio

The Board noted that the investment performance of the retail class of the fund (the class with the longer performance record) compared favorably to its benchmark for all the periods shown. The Board considered that the variations in performance between the fund's classes reflect the variations in class expenses, which result in lower performance for the higher expense class. The Board also reviewed the fund's performance since inception as well as performance in the current year.
The Board also considered that the fund's management fee is subject to upward or downward adjustment depending upon whether, and to what extent, the fund's investment performance for the performance period exceeds, or is exceeded by, the record (over the same period) of a Board-approved performance adjustment index. The Board noted that the performance adjustment provides FMR with a strong economic incentive to seek to achieve superior performance for the fund's shareholders and helps to more closely align the interests of FMR and the fund's shareholders.
Based on its review, the Board concluded that the nature, extent, and quality of services provided to the fund under the Advisory Contracts should benefit the fund's shareholders.
Competitiveness of Management Fee and Total Expense Ratio. The Board considered the fund's management fee and total expense ratio compared to "mapped groups" of competitive funds and classes. Fidelity creates "mapped groups" by combining similar Lipper investment objective categories that have comparable management fee characteristics. Combining Lipper investment objective categories aids the Board's management fee and total expense ratio comparisons by broadening the competitive group used for comparison and by reducing the number of universes to which various Fidelity funds are compared.
Annual Report
Management Fee. The Board considered two proprietary management fee comparisons for the 12-month periods shown in the chart below. The group of Lipper funds used by the Board for management fee comparisons is referred to below as the "Total Mapped Group." The Total Mapped Group comparison focuses on a fund's standing relative to the total universe of comparable funds available to investors in terms of gross management fees before expense reimbursements or caps, and without giving effect to the fund's performance adjustment. "TMG %" represents the percentage of funds in the Total Mapped Group that had management fees that were lower than the fund's. For example, a TMG % of 18% means that 82% of the funds in the Total Mapped Group had higher management fees than the fund. The "Asset-Size Peer Group" (ASPG) comparison focuses on a fund's standing relative to non-Fidelity funds similar in size to the fund within the Total Mapped Group. The ASPG represents at least 15% of the funds in the Total Mapped Group with comparable asset size and management fee characteristics, subject to a minimum of 50 funds (or all funds in the Total Mapped Group if fewer than 50). Additional information, such as the ASPG quartile in which the fund's management fee ranked and the impact of the fund's performance adjustment, is also included in the chart and considered by the Board.
Fidelity OTC Portfolio
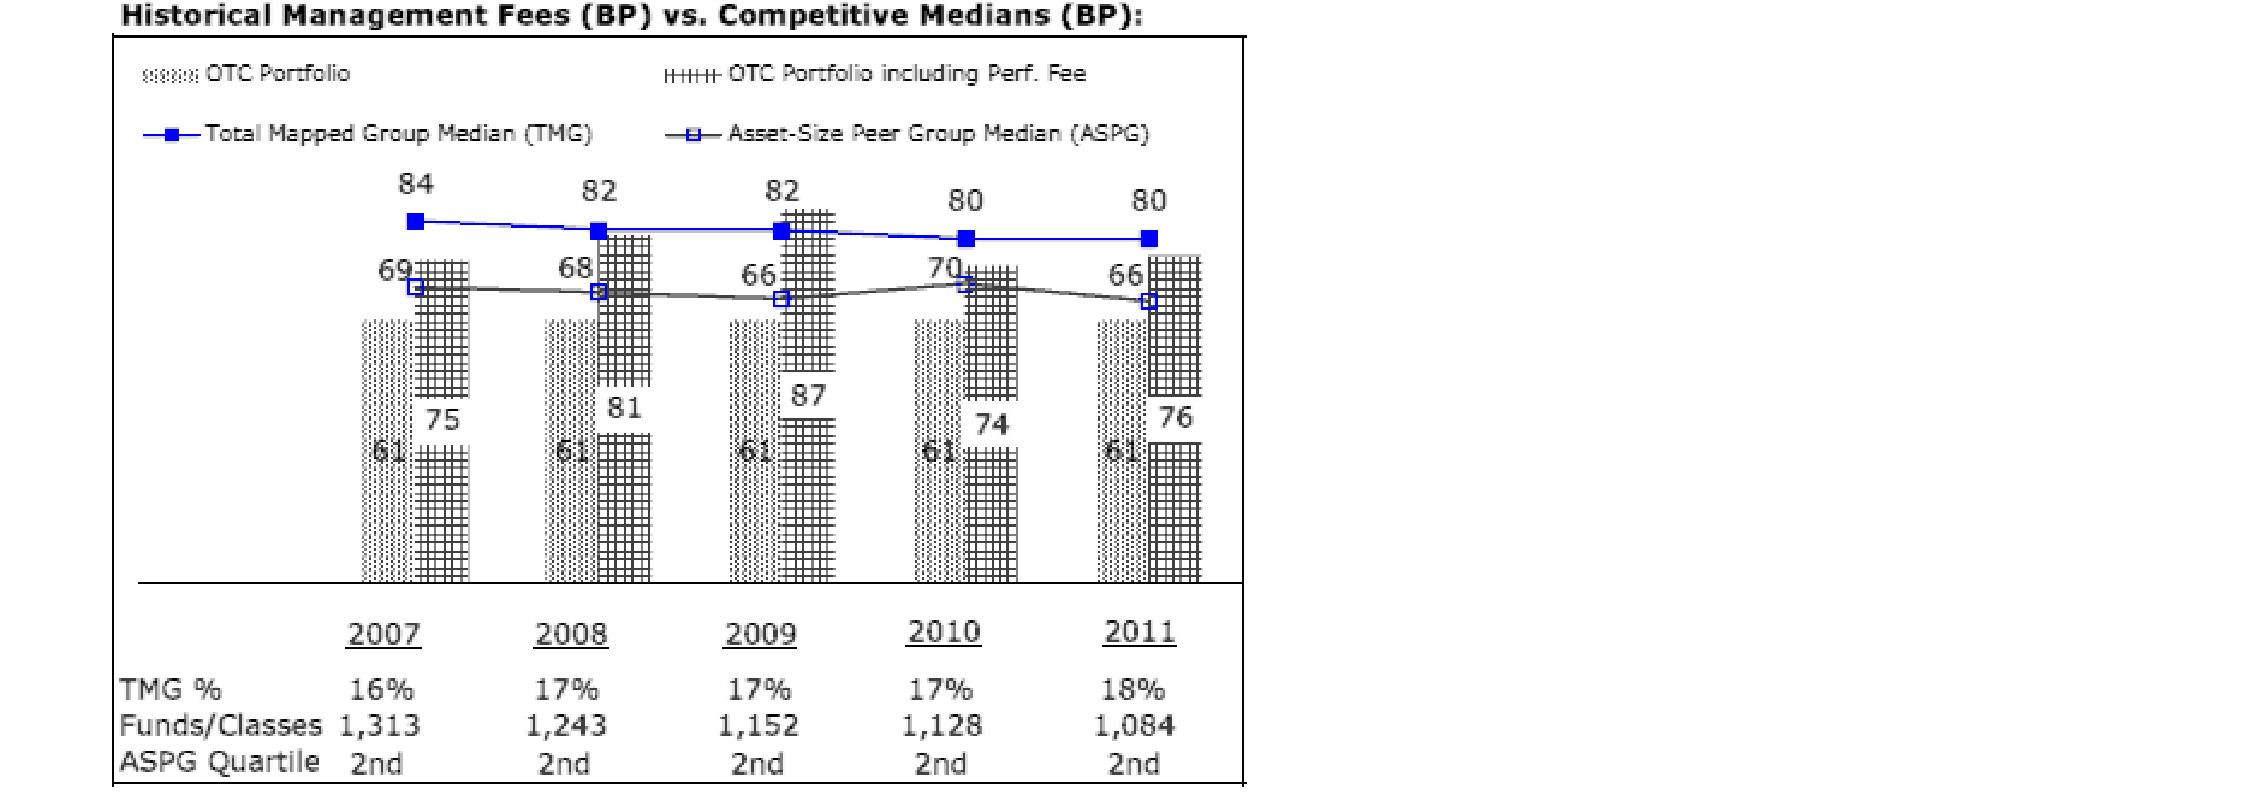
The Board noted that the fund's management fee ranked below the median of its Total Mapped Group and below the median of its ASPG for 2011. The Board also noted the effect of the fund's positive performance adjustment on the fund's management fee ranking. The Board noted that the performance adjustment for each year represents calculations for performance periods that differ from the periods shown in the performance charts above.
Annual Report
Board Approval of Investment Advisory Contracts and
Management Fees - continued
Based on its review, the Board concluded that the fund's management fee is fair and reasonable in light of the services that the fund receives and the other factors considered.
Total Expense Ratio. In its review of each class's total expense ratio, the Board considered the fund's management fee as well as other fund or class expenses, as applicable, such as transfer agent fees, pricing and bookkeeping fees, and custodial, legal, and audit fees. The Board also noted the effects of any waivers and reimbursements on fees and expenses, as well as the impact of the fund's performance adjustment. As part of its review, the Board also considered the current and historical total expense ratios of each class of the fund compared to competitive fund median expenses. Each class of the fund is compared to those funds and classes in the Total Mapped Group (used by the Board for management fee comparisons) that have a similar sales load structure.
The Board noted that the total expense ratio of each class ranked below its competitive median for 2011.
Fees Charged to Other Fidelity Clients. The Board also considered Fidelity fee structures and other information with respect to clients of FMR and its affiliates, such as other mutual funds advised or subadvised by FMR or its affiliates, pension plan clients, and other institutional clients. The Board noted the findings of the 2010 ad hoc joint committee (created with the board of other Fidelity funds), which reviewed and compared Fidelity's institutional investment advisory business with its business of providing services to the Fidelity funds, including the differences in services provided, fees charged, and costs incurred, as well as competition in their respective marketplaces.
Based on its review of total expense ratios and fees charged to other Fidelity clients, the Board concluded that the total expense ratio of each class of the fund was reasonable in light of the services that the fund and its shareholders receive and the other factors considered.
Costs of the Services and Profitability. The Board considered the revenues earned and the expenses incurred by Fidelity in conducting the business of developing, marketing, distributing, managing, administering and servicing the fund and its shareholders. The Board also considered the level of Fidelity's profits in respect of all the Fidelity funds.
On an annual basis, FMR presents to the Board Fidelity's profitability for the fund. Fidelity calculates the profitability for each fund, as well as aggregate profitability for groups of Fidelity funds and all Fidelity funds, using a series of detailed revenue and cost allocation methodologies which originate with the books and records of Fidelity on which Fidelity's audited financial statements are based. The Audit Committee of the Board reviews any significant changes from the prior year's methodologies.
Annual Report
PricewaterhouseCoopers LLP (PwC), independent registered public accounting firm and auditor to Fidelity and certain Fidelity funds, has been engaged annually by the Board as part of the Board's assessment of Fidelity's profitability analysis. PwC's engagement includes the review and assessment of Fidelity's methodologies used in determining the revenues and expenses attributable to Fidelity's mutual fund business, and completion of agreed-upon procedures surrounding the mathematical accuracy of fund profitability and its conformity to allocation methodologies. After considering PwC's reports issued under the engagement and information provided by Fidelity, the Board concluded that while other allocation methods may also be reasonable, Fidelity's profitability methodologies are reasonable in all material respects.
The Board also reviewed Fidelity's non-fund businesses and fall-out benefits related to the mutual fund business as well as cases where Fidelity's affiliates may benefit from or be related to the fund's business.
The Board considered the costs of the services provided by and the profits realized by Fidelity in connection with the operation of the fund and was satisfied that the profitability was not excessive in the circumstances.
Economies of Scale. The Board considered whether there have been economies of scale in respect of the management of the Fidelity funds, whether the Fidelity funds (including the fund) have appropriately benefited from any such economies of scale, and whether there is potential for realization of any further economies of scale. The Board considered the extent to which the fund will benefit from economies of scale through increased services to the fund, through waivers or reimbursements, or through fee or expense reductions. The Board also noted that in 2009, it and the board of other Fidelity funds created an ad hoc committee (the Economies of Scale Committee) to analyze whether FMR attains economies of scale in respect of the management and servicing of the Fidelity funds, whether the Fidelity funds have appropriately benefited from such economies of scale, and whether there is potential for realization of any further economies of scale.
The Board recognized that the fund's management contract incorporates a "group fee" structure, which provides for lower group fee rates as total fund assets under FMR's management increase, and for higher group fee rates as total fund assets under FMR's management decrease. FMR calculates the group fee rates based on a tiered asset "breakpoint" schedule that varies based on asset class. The Board considered that the group fee is designed to deliver the benefits of economies of scale to fund shareholders when total Fidelity fund assets increase, even if assets of any particular fund are unchanged or have declined, because some portion of Fidelity's costs are attributable to services provided to all Fidelity funds, and all funds benefit if those costs can be allocated among more assets. The Board concluded that, given the group fee structure, fund shareholders will benefit from lower management fees as assets under FMR's management increase at the fund complex level, regardless of whether Fidelity achieves any such economies of scale.
Annual Report
Board Approval of Investment Advisory Contracts and
Management Fees - continued
The Board concluded, taking into account the analysis of the Economies of Scale Committee, that economies of scale, if any, are being appropriately shared between fund shareholders and Fidelity.
Additional Information Requested by the Board. In order to develop fully the factual basis for consideration of the Fidelity funds' Advisory Contracts, the Board requested and received additional information on certain topics, including (i) fund performance trends, actions to be taken by FMR to improve certain funds' overall performance, and Fidelity's long-term strategies for certain funds; (ii) the potential to further rationalize the Fidelity fund lineup with the possibility of achieving savings for the funds and Fidelity; (iii) Fidelity's compensation structure for portfolio managers and other key investment personnel; (iv) the amount of the investment that each portfolio manager has made in the Fidelity fund(s) that he or she manages; (v) the realization of fall-out benefits in certain Fidelity business units; (vi) Fidelity's group fee structures, the potential impact of regulatory changes on such structures, and the rationale for the individual fee rates of certain funds; (vii) fund profitability methodology, including Fidelity's cost allocation methodology, and the impact of certain factors on fund profitability results; (viii) trends regarding industry use of performance fee structures and the possibility of implementing performance fee structures for additional funds; and (ix) the impact of net redemptions from the Fidelity funds.
Based on its evaluation of all of the conclusions noted above, and after considering all factors it believed relevant, the Board ultimately concluded that the advisory fee structures are fair and reasonable, and that the fund's Advisory Contracts should be renewed.
Annual Report
Investment Adviser
Fidelity Management & Research Company
Boston, MA
Investment Sub-Advisers
FMR Co., Inc.
Fidelity Management & Research
(U.K.) Inc.
Fidelity Management & Research
(Hong Kong) Limited
Fidelity Management & Research
(Japan) Inc.
General Distributor
Fidelity Distributors Corporation
Smithfield, RI
Transfer and Service Agents
Fidelity Investments Institutional
Operations Company, Inc.
Boston, MA
Fidelity Service Company, Inc.
Boston, MA
Custodian
The Northern Trust Company
Chicago, IL
The Fidelity Telephone Connection
Mutual Fund 24-Hour Service
Exchanges/Redemptions
and Account Assistance 1-800-544-6666
Product Information 1-800-544-6666
Retirement Accounts 1-800-544-4774
(8 a.m. - 9 p.m.)
TDD Service 1-800-544-0118
for the deaf and hearing impaired
(9 a.m. - 9 p.m. Eastern time)
Fidelity Automated Service
Telephone (FAST®)
1-800-544-5555
Automated line for quickest service
(Fidelity Investment logo)(registered trademark)
Corporate Headquarters
82 Devonshire St., Boston, MA 02109
www.fidelity.com
OTC-UANN-0912
1.789250.109
Fidelity®
Small Cap Growth
Fund
Annual Report
July 31, 2012
(Fidelity Cover Art)
Contents
Performance | (Click Here) | How the fund has done over time. |
Management's Discussion of Fund Performance | (Click Here) | The Portfolio Manager's review of fund performance and strategy. |
Shareholder Expense Example | (Click Here) | An example of shareholder expenses. |
Investment Changes | (Click Here) | A summary of major shifts in the fund's investments over the past six months. |
Investments | (Click Here) | A complete list of the fund's investments with their market values. |
Financial Statements | (Click Here) | Statements of assets and liabilities, operations, and changes in net assets, as well as financial highlights. |
Notes | (Click Here) | Notes to the financial statements. |
Report of Independent Registered Public Accounting Firm | (Click Here) | |
Trustees and Officers | (Click Here) | |
Distributions | (Click Here) | |
Board Approval of Investment Advisory Contracts and Management Fees | (Click Here) | |
To view a fund's proxy voting guidelines and proxy voting record for the 12-month period ended June 30, visit http://www.fidelity.com/proxyvotingresults or visit the Securities and Exchange Commission's (SEC) web site at http://www.sec.gov. You may also call 1-800-544-8544 to request a free copy of the proxy voting guidelines.
Standard & Poor's, S&P and S&P 500 are registered service marks of The McGraw-Hill Companies, Inc. and have been licensed for use by Fidelity Distributors Corporation.
Other third party marks appearing herein are the property of their respective owners.
All other marks appearing herein are registered or unregistered trademarks or service marks of FMR LLC or an affiliated company. © 2012 FMR LLC. All rights reserved.
Annual Report
This report and the financial statements contained herein are submitted for the general information of the shareholders of the fund. This report is not authorized for distribution to prospective investors in the fund unless preceded or accompanied by an effective prospectus.
A fund files its complete schedule of portfolio holdings with the SEC for the first and third quarters of each fiscal year on Form N-Q. Forms N-Q are available on the SEC's web site at http://www.sec.gov. A fund's Forms N-Q may be reviewed and copied at the SEC's Public Reference Room in Washington, DC. Information regarding the operation of the SEC's Public Reference Room may be obtained by calling 1-800-SEC-0330. For a complete list of a fund's portfolio holdings, view the fund's most recent holdings listing, semiannual report, or annual report on Fidelity's web site at http://www.fidelity.com, http://www.advisor.fidelity.com, or http://www.401k.com, as applicable.
NOT FDIC INSURED • MAY LOSE VALUE • NO BANK GUARANTEE
Neither the fund nor Fidelity Distributors Corporation is a bank.
Annual Report
Average annual total return reflects the change in the value of an investment, assuming reinvestment of the class' distributions from dividend income and capital gains (the profits earned upon the sale of securities that have grown in value, if any) and assuming a constant rate of performance each year. The $10,000 table and the fund's returns do not reflect the deduction of taxes that a shareholder would pay on fund distributions or the redemption of fund shares. During periods of reimbursement by Fidelity, a fund's total return will be greater than it would be had the reimbursement not occurred. How a fund did yesterday is no guarantee of how it will do tomorrow.
Average Annual Total Returns
Periods ended July 31, 2012 | Past 1
year | Past 5
years | Life of
fund A |
Fidelity® Small Cap Growth Fund | -0.88% | 1.83% | 7.93% |
A From November 3, 2004.
$10,000 Over Life of Fund
Let's say hypothetically that $10,000 was invested in Fidelity® Small Cap Growth Fund, a class of the fund, on November 3, 2004, when the fund started. The chart shows how the value of your investment would have changed, and also shows how the Russell 2000® Growth Index performed over the same period.
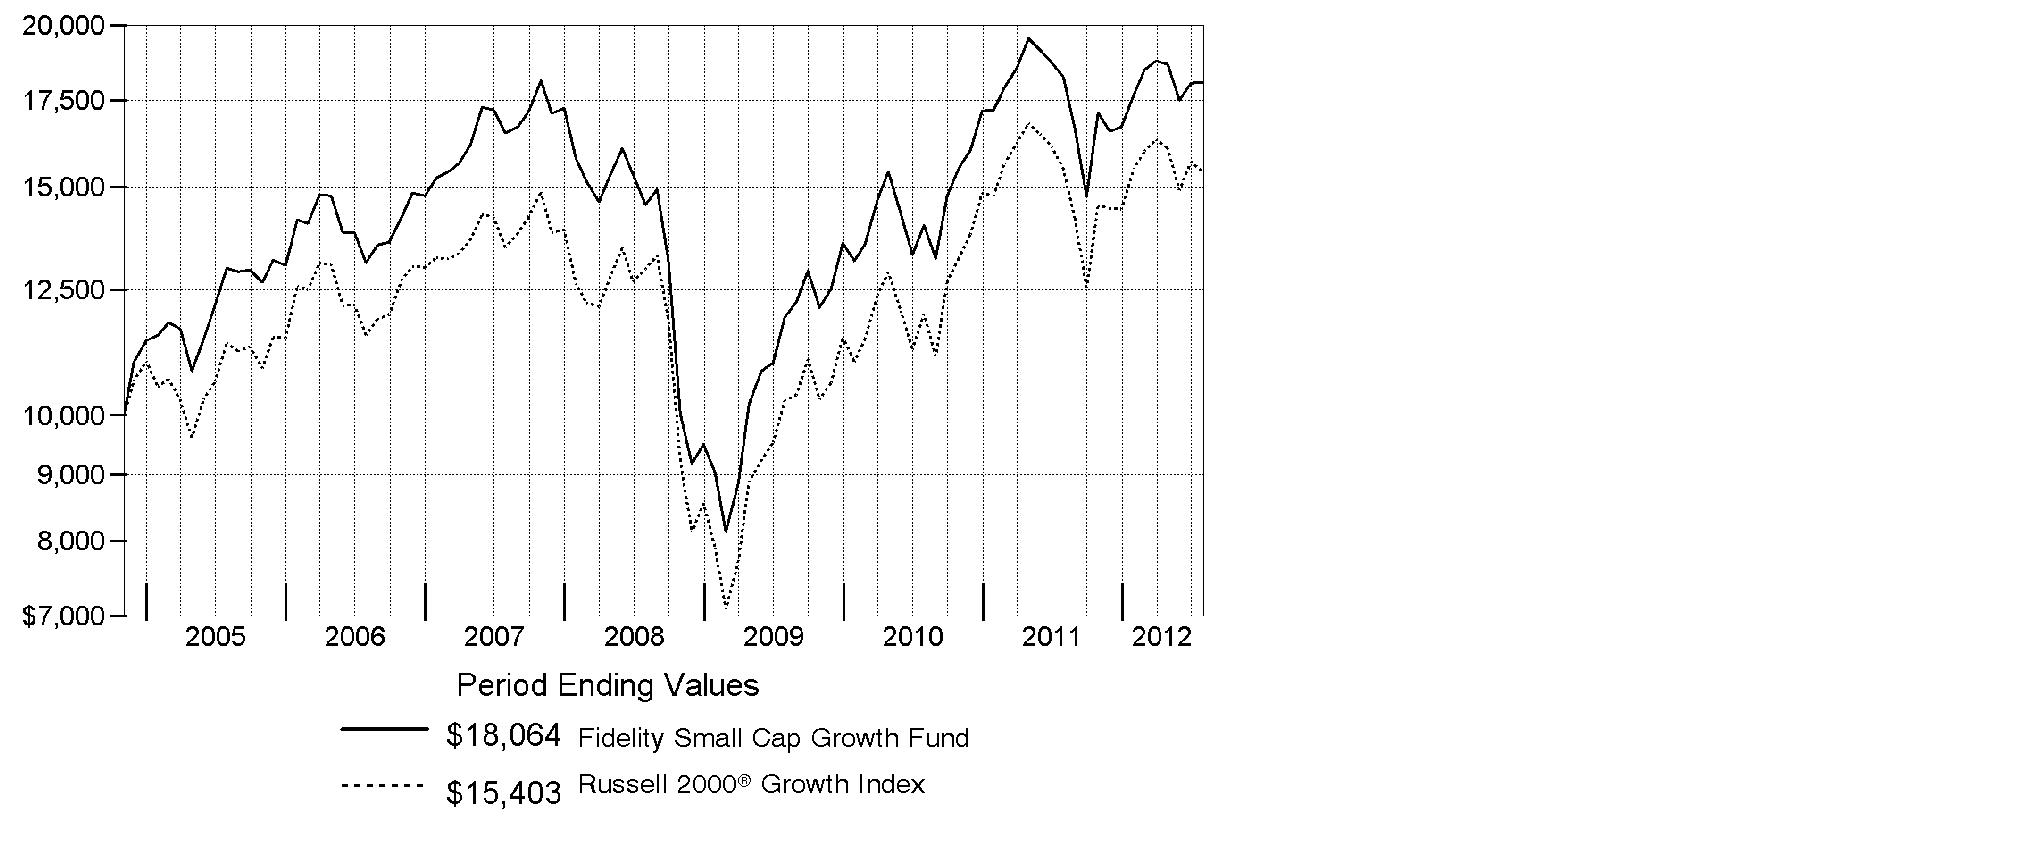
Annual Report
Market Recap: Major U.S. equity benchmarks posted solid gains for the year ending July 31, 2012, amid an uncertain investment environment. The broad-based S&P 500® Index returned 9.13%, while the blue-chip-laden Dow Jones Industrial AverageSM and technology-heavy Nasdaq Composite® Index gained 10.12% and 7.83%, respectively. Volatility spiked during the period's first half, as equities plummeted late last summer on Europe's debt woes, political wrangling over the U.S. debt ceiling and the sovereign credit-rating downgrade that followed. By October, a seemingly improved U.S. economy rejuvenated stocks, paving the way for major equity benchmarks to post their best first-quarter performance since 1998. However, more eurozone trouble, signs that the U.S. economy had turned sluggish and a slowdown in China caused stocks to slip in May, before a new wave of optimism took hold in June and July. Within the S&P 500®, more-defensive sectors such as telecommunication services (+30%) and consumer staples (+20%) fared best, while materials and energy significantly underperformed, returning -5%. Small- and mid-cap stocks trailed their less-volatile large-cap counterparts, with the Russell 2000® Index adding 0.19% and the Russell Midcap® Index rising 2.28%. Given turmoil and local currency weakness in Europe, foreign developed-markets stocks lost ground, with the MSCI® EAFE® Index returning -11.32%.
Comments from Patrick Venanzi, who became Portfolio Manager of Fidelity® Small Cap Growth Fund on November 17, 2011: For the year, the fund's Retail Class shares returned -0.88%, slightly lagging the Russell 2000® Growth Index, which returned -0.51%. Poor positioning in health care was the main reason for the underperformance, with picks and an underweighting in the pharmaceuticals/biotechnology/life science industry particularly challenging. My choices within the software/services, health care equipment/services and automobiles/components industries also were letdowns. Our foreign holdings hurt overall, due in part to a stronger U.S. dollar. Individually, the biggest blow came from Polycom, a video and voice conferencing company, while Sohu.com, China's largest Internet company, and untimely ownership of medical device company Integra LifeSciences Holdings also hurt. Polycom, Sohu.com and Integra were not held at period end. Conversely, picks within industrials, tech hardware/equipment and materials were additive. At the stock level, specialty retailer Sally Beauty Holdings and Canadian discount store operator Dollarama were winners, as was a position in biopharmaceutical firm Amylin Pharmaceuticals. All of the names mentioned, except Integra, were not in the benchmark.
The views expressed above reflect those of the portfolio manager(s) only through the end of the period as stated on the cover of this report and do not necessarily represent the views of Fidelity or any other person in the Fidelity organization. Any such views are subject to change at any time based upon market or other conditions and Fidelity disclaims any responsibility to update such views. These views may not be relied on as investment advice and, because investment decisions for a Fidelity fund are based on numerous factors, may not be relied on as an indication of trading intent on behalf of any Fidelity fund.
Annual Report
Shareholder Expense Example
As a shareholder of the Fund, you incur two types of costs: (1) transaction costs, including sales charges (loads) on purchase payments or redemption proceeds, redemption fees and (2) ongoing costs, including management fees, distribution and/or service (12b-1) fees and other Fund expenses. This Example is intended to help you understand your ongoing costs (in dollars) of investing in the Fund and to compare these costs with the ongoing costs of investing in other mutual funds.
The Example is based on an investment of $1,000 invested at the beginning of the period and held for the entire period (February 1, 2012 to July 31, 2012).
Actual Expenses
The first line of the accompanying table for each class of the Fund provides information about actual account values and actual expenses. You may use the information in this line, together with the amount you invested, to estimate the expenses that you paid over the period. Simply divide your account value by $1,000.00 (for example, an $8,600 account value divided by $1,000.00 = 8.6), then multiply the result by the number in the first line for a class of the Fund under the heading entitled "Expenses Paid During Period" to estimate the expenses you paid on your account during this period. A small balance maintenance fee of $12.00 that is charged once a year may apply for certain accounts with a value of less than $2,000. This fee is not included in the table below. If it was, the estimate of expenses you paid during the period would be higher, and your ending account value lower, by this amount. In addition, the Fund, as a shareholder in the underlying Fidelity Central Funds, will indirectly bear its pro-rata share of the fees and expenses incurred by the underlying Fidelity Central Funds. These fees and expenses are not included in the Fund's annualized expense ratio used to calculate the expense estimate in the table below.
Hypothetical Example for Comparison Purposes
The second line of the accompanying table for each class of the Fund provides information about hypothetical account values and hypothetical expenses based on a Class' actual expense ratio and an assumed rate of return of 5% per year before expenses, which is not the Class' actual return. The hypothetical account values and expenses may not be used to estimate the actual ending account balance or expenses you paid for the period. You may use this information to compare the ongoing costs of investing in the Fund and other funds. To do so, compare this 5% hypothetical example with the 5% hypothetical examples that appear in the shareholder reports of the other funds. A small balance maintenance fee of $12.00 that is charged once a year may apply for certain accounts with a value of less than $2,000. This fee is not included in the table below. If it was, the estimate of expenses you paid during the period would be higher, and your ending account value lower, by this amount. In addition, the Fund, as a shareholder in the underlying Fidelity Central Funds, will indirectly bear its pro-rata share of the fees and expenses incurred by the underlying Fidelity Central Funds. These fees and expenses are not included in the Fund's annualized expense ratio used to calculate the expense estimate in the table below.
Please note that the expenses shown in the table are meant to highlight your ongoing costs only and do not reflect any transaction costs. Therefore, the second line of the table is useful in comparing ongoing costs only, and will not help you determine the relative total costs of owning different funds. In addition, if these transactional costs were included, your costs would have been higher.
Annual Report
| Annualized
Expense Ratio | Beginning
Account Value
February 1, 2012 | Ending
Account Value
July 31, 2012 | Expenses Paid
During Period*
February 1, 2012
to July 31, 2012 |
Class A | 1.31% | | | |
Actual | | $ 1,000.00 | $ 1,021.20 | $ 6.58 |
Hypothetical A | | $ 1,000.00 | $ 1,018.35 | $ 6.57 |
Class T | 1.57% | | | |
Actual | | $ 1,000.00 | $ 1,019.50 | $ 7.88 |
Hypothetical A | | $ 1,000.00 | $ 1,017.06 | $ 7.87 |
Class B | 2.06% | | | |
Actual | | $ 1,000.00 | $ 1,016.70 | $ 10.33 |
Hypothetical A | | $ 1,000.00 | $ 1,014.62 | $ 10.32 |
Class C | 2.07% | | | |
Actual | | $ 1,000.00 | $ 1,016.80 | $ 10.38 |
Hypothetical A | | $ 1,000.00 | $ 1,014.57 | $ 10.37 |
Small Cap Growth | .98% | | | |
Actual | | $ 1,000.00 | $ 1,022.20 | $ 4.93 |
Hypothetical A | | $ 1,000.00 | $ 1,019.99 | $ 4.92 |
Class F | .77% | | | |
Actual | | $ 1,000.00 | $ 1,023.30 | $ 3.87 |
Hypothetical A | | $ 1,000.00 | $ 1,021.03 | $ 3.87 |
Institutional Class | 1.00% | | | |
Actual | | $ 1,000.00 | $ 1,022.80 | $ 5.03 |
Hypothetical A | | $ 1,000.00 | $ 1,019.89 | $ 5.02 |
A 5% return per year before expenses
* Expenses are equal to each Class' annualized expense ratio, multiplied by the average account value over the period, multiplied by 182/366 (to reflect the one-half year period).
Annual Report
Investment Changes (Unaudited)
Top Ten Stocks as of July 31, 2012 |
| % of fund's
net assets | % of fund's net assets
6 months ago |
Vitamin Shoppe, Inc. | 1.5 | 0.9 |
Life Time Fitness, Inc. | 1.4 | 0.7 |
Hibbett Sports, Inc. | 1.4 | 0.8 |
Align Technology, Inc. | 1.4 | 0.0 |
Susser Holdings Corp. | 1.3 | 0.0 |
Ascena Retail Group, Inc. | 1.3 | 1.1 |
Liquidity Services, Inc. | 1.3 | 0.0 |
HMS Holdings Corp. | 1.3 | 0.9 |
Aspen Technology, Inc. | 1.3 | 0.7 |
Sally Beauty Holdings, Inc. | 1.2 | 1.2 |
| 13.4 | |
Top Five Market Sectors as of July 31, 2012 |
| % of fund's
net assets | % of fund's net assets
6 months ago |
Health Care | 21.2 | 14.2 |
Information Technology | 20.6 | 24.4 |
Consumer Discretionary | 17.5 | 16.5 |
Industrials | 14.6 | 17.8 |
Financials | 9.6 | 6.8 |
Asset Allocation (% of fund's net assets) |
As of July 31, 2012* | As of January 31, 2012** |
 | Stocks 96.9% | | | Stocks and Equity
Futures 98.4% | |
 | Short-Term
Investments and
Net Other Assets (Liabilities) 3.1% | | | Short-Term
Investments and
Net Other Assets (Liabilities) 1.6% | |
* Foreign investments | 9.1% | | ** Foreign investments | 12.4% | |

Annual Report
Investments July 31, 2012
Showing Percentage of Net Assets
Common Stocks - 96.9% |
| Shares | | Value |
CONSUMER DISCRETIONARY - 17.5% |
Auto Components - 0.6% |
Tenneco, Inc. (a) | 394,600 | | $ 11,557,834 |
Hotels, Restaurants & Leisure - 4.9% |
AFC Enterprises, Inc. (a) | 600,000 | | 13,254,000 |
Chuys Holdings, Inc. | 17,700 | | 308,157 |
Cracker Barrel Old Country Store, Inc. | 278,800 | | 17,469,608 |
Interval Leisure Group, Inc. | 1,120,000 | | 20,540,800 |
Life Time Fitness, Inc. (a) | 577,600 | | 26,228,816 |
Texas Roadhouse, Inc. Class A | 701,900 | | 12,149,889 |
| | 89,951,270 |
Household Durables - 1.9% |
Jarden Corp. | 290,000 | | 13,108,000 |
Lennar Corp. Class A | 303,800 | | 8,873,998 |
Toll Brothers, Inc. (a) | 461,300 | | 13,456,121 |
| | 35,438,119 |
Multiline Retail - 1.0% |
Dollarama, Inc. | 214,900 | | 13,393,080 |
The Bon-Ton Stores, Inc. | 700,000 | | 4,620,000 |
| | 18,013,080 |
Specialty Retail - 6.6% |
Ascena Retail Group, Inc. (a) | 1,334,800 | | 24,480,232 |
Conn's, Inc. (a) | 170,916 | | 3,050,851 |
DSW, Inc. Class A | 326,300 | | 19,290,856 |
Hibbett Sports, Inc. (a) | 430,000 | | 26,131,100 |
Sally Beauty Holdings, Inc. (a) | 801,000 | | 21,162,420 |
Vitamin Shoppe, Inc. (a) | 492,300 | | 27,037,116 |
| | 121,152,575 |
Textiles, Apparel & Luxury Goods - 2.5% |
Hanesbrands, Inc. (a) | 450,000 | | 13,509,000 |
PVH Corp. | 139,459 | | 11,077,228 |
Steven Madden Ltd. (a) | 331,400 | | 13,398,502 |
Ted Baker PLC | 591,073 | | 8,196,784 |
| | 46,181,514 |
TOTAL CONSUMER DISCRETIONARY | | 322,294,392 |
CONSUMER STAPLES - 5.8% |
Food & Staples Retailing - 1.3% |
Susser Holdings Corp. (a) | 678,155 | | 24,488,177 |
Common Stocks - continued |
| Shares | | Value |
CONSUMER STAPLES - continued |
Food Products - 3.0% |
Calavo Growers, Inc. (d) | 495,299 | | $ 13,363,167 |
Hain Celestial Group, Inc. (a) | 295,000 | | 16,428,550 |
J&J Snack Foods Corp. | 250,000 | | 14,447,500 |
Post Holdings, Inc. (a) | 400,000 | | 11,840,000 |
| | 56,079,217 |
Household Products - 0.9% |
WD-40 Co. | 322,566 | | 15,499,296 |
Personal Products - 0.6% |
Elizabeth Arden, Inc. (a) | 275,000 | | 10,727,750 |
TOTAL CONSUMER STAPLES | | 106,794,440 |
ENERGY - 4.5% |
Energy Equipment & Services - 2.2% |
Essential Energy Services Ltd. | 5,166,700 | | 10,973,796 |
Tesco Corp. (a) | 750,000 | | 8,692,500 |
Western Energy Services Corp. (a) | 1,530,000 | | 10,740,589 |
Xtreme Drilling & Coil Services Corp. (a)(e) | 4,100,000 | | 6,786,658 |
Zedi, Inc. (a)(e) | 5,020,900 | | 3,905,172 |
| | 41,098,715 |
Oil, Gas & Consumable Fuels - 2.3% |
Cabot Oil & Gas Corp. | 250,000 | | 10,547,500 |
Delek US Holdings, Inc. | 81,100 | | 1,600,914 |
Stone Energy Corp. (a) | 516,300 | | 13,558,038 |
Targa Resources Corp. | 379,300 | | 16,708,165 |
| | 42,414,617 |
TOTAL ENERGY | | 83,513,332 |
FINANCIALS - 9.6% |
Commercial Banks - 3.1% |
Banco Pine SA | 1,658,287 | | 10,868,043 |
BBCN Bancorp, Inc. (a) | 1,640,000 | | 18,597,600 |
Columbia Banking Systems, Inc. | 579,043 | | 10,451,726 |
Texas Capital Bancshares, Inc. (a) | 400,000 | | 17,236,000 |
| | 57,153,369 |
Insurance - 2.4% |
Allied World Assurance Co. Holdings Ltd. | 194,800 | | 14,693,764 |
Common Stocks - continued |
| Shares | | Value |
FINANCIALS - continued |
Insurance - continued |
Amerisafe, Inc. (a) | 464,900 | | $ 11,606,229 |
ProAssurance Corp. | 210,000 | | 18,809,700 |
| | 45,109,693 |
Real Estate Investment Trusts - 3.3% |
Highwoods Properties, Inc. (SBI) | 419,000 | | 14,191,530 |
LTC Properties, Inc. | 430,000 | | 15,351,000 |
Rayonier, Inc. | 285,000 | | 13,591,650 |
Sovran Self Storage, Inc. | 300,000 | | 17,130,000 |
| | 60,264,180 |
Real Estate Management & Development - 0.8% |
Altisource Portfolio Solutions SA (a) | 185,000 | | 14,348,600 |
TOTAL FINANCIALS | | 176,875,842 |
HEALTH CARE - 21.2% |
Biotechnology - 6.8% |
Alkermes PLC (a) | 175,500 | | 3,262,545 |
Amarin Corp. PLC ADR (a)(d) | 900,000 | | 10,539,000 |
Amylin Pharmaceuticals, Inc. (a) | 556,700 | | 17,140,793 |
ARIAD Pharmaceuticals, Inc. (a) | 400,000 | | 7,652,000 |
ArQule, Inc. (a) | 900,000 | | 5,445,000 |
BioMarin Pharmaceutical, Inc. (a) | 190,000 | | 7,465,100 |
Infinity Pharmaceuticals, Inc. (a) | 205,536 | | 3,588,659 |
Isis Pharmaceuticals, Inc. (a) | 437,257 | | 5,299,555 |
Medivation, Inc. (a) | 140,000 | | 13,958,000 |
OncoGenex Pharmaceuticals, Inc. (a)(d) | 570,000 | | 7,957,200 |
Pharmacyclics, Inc. (a)(d) | 150,000 | | 7,981,500 |
Seattle Genetics, Inc. (a) | 330,000 | | 8,632,800 |
Targacept, Inc. (a) | 500,000 | | 2,160,000 |
Theravance, Inc. (a)(d) | 379,000 | | 11,040,270 |
Threshold Pharmaceuticals, Inc. (a) | 880,000 | | 6,107,200 |
XOMA Corp. (a)(d) | 2,200,000 | | 7,986,000 |
| | 126,215,622 |
Health Care Equipment & Supplies - 5.8% |
Abiomed, Inc. (a)(d) | 600,000 | | 13,530,000 |
Align Technology, Inc. (a) | 764,398 | | 25,958,956 |
Cyberonics, Inc. (a) | 322,000 | | 13,942,600 |
ICU Medical, Inc. (a) | 380,000 | | 20,265,400 |
Sirona Dental Systems, Inc. (a) | 195,000 | | 8,429,850 |
Common Stocks - continued |
| Shares | | Value |
HEALTH CARE - continued |
Health Care Equipment & Supplies - continued |
The Cooper Companies, Inc. | 151,900 | | $ 11,431,994 |
The Spectranetics Corp. (a) | 1,130,000 | | 13,334,000 |
| | 106,892,800 |
Health Care Providers & Services - 5.5% |
Air Methods Corp. (a) | 151,000 | | 16,463,530 |
Catamaran Corp. (a) | 100,807 | | 8,562,338 |
Centene Corp. (a) | 330,000 | | 12,553,200 |
Corvel Corp. (a) | 202,592 | | 9,347,595 |
Health Net, Inc. (a) | 302,482 | | 6,660,654 |
HMS Holdings Corp. (a) | 683,500 | | 23,519,235 |
MEDNAX, Inc. (a) | 172,900 | | 11,433,877 |
MWI Veterinary Supply, Inc. (a) | 148,400 | | 13,517,756 |
| | 102,058,185 |
Health Care Technology - 0.9% |
athenahealth, Inc. (a)(d) | 120,000 | | 10,980,000 |
Epocrates, Inc. (a) | 672,706 | | 5,072,203 |
| | 16,052,203 |
Life Sciences Tools & Services - 0.8% |
Furiex Pharmaceuticals, Inc. (a) | 200,000 | | 3,844,000 |
Luminex Corp. (a) | 620,000 | | 10,620,600 |
| | 14,464,600 |
Pharmaceuticals - 1.4% |
Cadence Pharmaceuticals, Inc. (a) | 767,693 | | 3,255,018 |
Impax Laboratories, Inc. (a) | 640,200 | | 14,225,244 |
ViroPharma, Inc. (a) | 410,000 | | 8,901,100 |
| | 26,381,362 |
TOTAL HEALTH CARE | | 392,064,772 |
INDUSTRIALS - 14.6% |
Aerospace & Defense - 1.7% |
Teledyne Technologies, Inc. (a) | 235,700 | | 14,684,110 |
TransDigm Group, Inc. (a) | 138,183 | | 17,046,255 |
| | 31,730,365 |
Building Products - 0.9% |
Armstrong World Industries, Inc. | 260,000 | | 10,049,000 |
US Home Systems, Inc. (e) | 725,000 | | 6,604,750 |
| | 16,653,750 |
Common Stocks - continued |
| Shares | | Value |
INDUSTRIALS - continued |
Electrical Equipment - 2.1% |
Generac Holdings, Inc. | 450,000 | | $ 10,269,000 |
Hubbell, Inc. Class B | 161,800 | | 13,312,904 |
II-VI, Inc. (a) | 815,000 | | 14,213,600 |
| | 37,795,504 |
Industrial Conglomerates - 0.8% |
Carlisle Companies, Inc. | 290,000 | | 14,642,100 |
Machinery - 2.9% |
Actuant Corp. Class A | 383,100 | | 10,903,026 |
Blount International, Inc. (a) | 774,000 | | 11,006,280 |
TriMas Corp. (a) | 335,298 | | 7,289,379 |
Valmont Industries, Inc. | 75,000 | | 9,291,000 |
Wabtec Corp. | 197,300 | | 15,622,214 |
| | 54,111,899 |
Marine - 0.6% |
Kirby Corp. (a) | 200,000 | | 10,554,000 |
Professional Services - 3.0% |
Advisory Board Co. (a) | 421,005 | | 18,941,015 |
MISTRAS Group, Inc. (a) | 315,721 | | 7,097,408 |
Nielsen Holdings B.V. (a) | 650,000 | | 18,525,000 |
Nihon M&A Center, Inc. | 385,512 | | 11,389,587 |
| | 55,953,010 |
Road & Rail - 0.6% |
Genesee & Wyoming, Inc. Class A (a) | 180,000 | | 11,170,800 |
Trading Companies & Distributors - 2.0% |
DXP Enterprises, Inc. (a) | 214,719 | | 9,490,580 |
Watsco, Inc. | 289,000 | | 19,634,660 |
WESCO International, Inc. (a) | 145,000 | | 8,077,950 |
| | 37,203,190 |
TOTAL INDUSTRIALS | | 269,814,618 |
INFORMATION TECHNOLOGY - 20.6% |
Communications Equipment - 0.9% |
Parrot SA (a) | 368,100 | | 11,209,528 |
Telular Corp. | 500,000 | | 4,715,000 |
| | 15,924,528 |
Computers & Peripherals - 0.7% |
Super Micro Computer, Inc. (a) | 979,923 | | 12,160,844 |
Common Stocks - continued |
| Shares | | Value |
INFORMATION TECHNOLOGY - continued |
Electronic Equipment & Components - 2.1% |
Insight Enterprises, Inc. (a) | 377,400 | | $ 6,325,224 |
InvenSense, Inc. | 137,076 | | 1,768,280 |
Neonode, Inc. (a)(d) | 1,380,000 | | 6,969,000 |
OSI Systems, Inc. (a) | 164,000 | | 10,584,560 |
Parametric Sound Corp. (a) | 249,068 | | 2,428,413 |
Zygo Corp. (a) | 619,600 | | 11,078,448 |
| | 39,153,925 |
Internet Software & Services - 7.4% |
Active Network, Inc. (a) | 870,000 | | 12,345,300 |
Bankrate, Inc. (a)(d) | 600,000 | | 9,570,000 |
Blucora, Inc. (a) | 1,111,100 | | 16,944,275 |
Cornerstone OnDemand, Inc. (a) | 674,037 | | 16,028,600 |
Demand Media, Inc. (a)(d) | 1,743,000 | | 19,382,160 |
Liquidity Services, Inc. (a) | 523,400 | | 23,929,848 |
LivePerson, Inc. (a) | 963,426 | | 18,016,066 |
QuinStreet, Inc. (a)(d) | 1,350,000 | | 12,244,500 |
VeriSign, Inc. (a) | 200,000 | | 8,884,000 |
| | 137,344,749 |
IT Services - 2.2% |
Euronet Worldwide, Inc. (a) | 500,000 | | 9,140,000 |
Maximus, Inc. | 320,000 | | 16,160,000 |
ServiceSource International, Inc. (a) | 336,399 | | 3,794,581 |
Total System Services, Inc. | 500,000 | | 11,825,000 |
| | 40,919,581 |
Semiconductors & Semiconductor Equipment - 1.3% |
Cymer, Inc. (a) | 278,201 | | 15,915,879 |
Entegris, Inc. (a) | 1,056,500 | | 8,504,825 |
| | 24,420,704 |
Software - 6.0% |
Aspen Technology, Inc. (a) | 992,200 | | 23,197,636 |
BroadSoft, Inc. (a)(d) | 456,600 | | 11,209,530 |
CommVault Systems, Inc. (a) | 360,000 | | 17,467,200 |
Deltek, Inc. (a) | 1,030,000 | | 13,410,600 |
Ebix, Inc. (d) | 575,610 | | 12,484,981 |
MICROS Systems, Inc. (a) | 260,312 | | 12,427,295 |
Parametric Technology Corp. (a) | 980,000 | | 21,109,200 |
| | 111,306,442 |
TOTAL INFORMATION TECHNOLOGY | | 381,230,773 |
Common Stocks - continued |
| Shares | | Value |
MATERIALS - 2.4% |
Chemicals - 0.6% |
Albemarle Corp. | 200,300 | | $ 11,661,466 |
Containers & Packaging - 0.8% |
Myers Industries, Inc. | 850,000 | | 13,974,000 |
Metals & Mining - 1.0% |
Commercial Metals Co. | 809,800 | | 10,438,322 |
Compass Minerals International, Inc. | 120,000 | | 8,680,800 |
| | 19,119,122 |
TOTAL MATERIALS | | 44,754,588 |
UTILITIES - 0.7% |
Electric Utilities - 0.7% |
Cleco Corp. | 280,000 | | 12,252,800 |
TOTAL COMMON STOCKS (Cost $1,609,099,061) |
1,789,595,557
|
Money Market Funds - 6.6% |
| | | |
Fidelity Cash Central Fund, 0.17% (b) | 50,560,836 | | 50,560,836 |
Fidelity Securities Lending Cash Central Fund, 0.18% (b)(c) | 71,793,425 | | 71,793,425 |
TOTAL MONEY MARKET FUNDS (Cost $122,354,261) |
122,354,261
|
TOTAL INVESTMENT PORTFOLIO - 103.5% (Cost $1,731,453,322) | | 1,911,949,818 |
NET OTHER ASSETS (LIABILITIES) - (3.5)% | | (64,777,614) |
NET ASSETS - 100% | $ 1,847,172,204 |
Legend |
(a) Non-income producing |
(b) Affiliated fund that is available only to investment companies and other accounts managed by Fidelity Investments. The rate quoted is the annualized seven-day yield of the fund at period end. A complete unaudited listing of the fund's holdings as of its most recent quarter end is available upon request. In addition, each Fidelity Central Fund's financial statements, which are not covered by the Fund's Report of Independent Registered Public Accounting Firm, are available on the SEC's website or upon request. |
(c) Investment made with cash collateral received from securities on loan. |
(d) Security or a portion of the security is on loan at period end. |
(e) Affiliated company |
Affiliated Central Funds |
Information regarding fiscal year to date income earned by the Fund from investments in Fidelity Central Funds is as follows: |
Fund | Income earned |
Fidelity Cash Central Fund | $ 79,275 |
Fidelity Securities Lending Cash Central Fund | 3,071,956 |
Total | $ 3,151,231 |
Other Affiliated Issuers |
An affiliated company is a company in which the Fund has ownership of at least 5% of the voting securities. Fiscal year to date transactions with companies which are or were affiliates are as follows: |
Affiliate | Value, beginning of period | Purchases | Sales Proceeds | Dividend Income | Value,
end of
period |
Calavo Growers, Inc. | $ 16,826,331 | $ 13,436,045 | $ 19,540,642 | $ 307,289 | $ - |
Perficient, Inc. | 17,202,205 | 4,361,057 | 22,322,908 | - | - |
US Home Systems, Inc. | - | 8,770,904 | - | 43,500 | 6,604,750 |
Xtreme Drilling & Coil Services Corp. (formerly Xtreme Coil Drilling Corp.) | - | 12,099,252 | - | - | 6,786,658 |
Zedi, Inc. | - | 3,695,906 | - | - | 3,905,172 |
Total | $ 34,028,536 | $ 42,363,164 | $ 41,863,550 | $ 350,789 | $ 17,296,580 |
Other Information |
The following is a summary of the inputs used, as of July 31, 2012, involving the Fund's assets and liabilities carried at fair value. The inputs or methodology used for valuing securities may not be an indication of the risk associated with investing in those securities. For more information on valuation inputs, and their aggregation into the levels used in the table below, please refer to the Security Valuation section in the accompanying Notes to Financial Statements. |
Valuation Inputs at Reporting Date: |
Description | Total | Level 1 | Level 2 | Level 3 |
Investments in Securities: | | | | |
Equities: | | | | |
Consumer Discretionary | $ 322,294,392 | $ 322,294,392 | $ - | $ - |
Consumer Staples | 106,794,440 | 106,794,440 | - | - |
Energy | 83,513,332 | 83,513,332 | - | - |
Financials | 176,875,842 | 176,875,842 | - | - |
Health Care | 392,064,772 | 392,064,772 | - | - |
Industrials | 269,814,618 | 258,425,031 | 11,389,587 | - |
Information Technology | 381,230,773 | 381,230,773 | - | - |
Materials | 44,754,588 | 44,754,588 | - | - |
Utilities | 12,252,800 | 12,252,800 | - | - |
Money Market Funds | 122,354,261 | 122,354,261 | - | - |
Total Investments in Securities: | $ 1,911,949,818 | $ 1,900,560,231 | $ 11,389,587 | $ - |
See accompanying notes which are an integral part of the financial statements.
Annual Report
Statement of Assets and Liabilities
| July 31, 2012 |
| | |
Assets | | |
Investment in securities, at value (including securities loaned of $69,355,870) - See accompanying schedule: Unaffiliated issuers (cost $1,584,533,000) | $ 1,772,298,977 | |
Fidelity Central Funds (cost $122,354,261) | 122,354,261 | |
Other affiliated issuers (cost $24,566,061) | 17,296,580 | |
Total Investments (cost $1,731,453,322) | | $ 1,911,949,818 |
Cash | | 465,902 |
Receivable for investments sold | | 36,822,778 |
Receivable for fund shares sold | | 1,053,361 |
Dividends receivable | | 442,749 |
Distributions receivable from Fidelity Central Funds | | 49,171 |
Other receivables | | 85,041 |
Total assets | | 1,950,868,820 |
| | |
Liabilities | | |
Payable for investments purchased | $ 29,150,268 | |
Payable for fund shares redeemed | 1,206,971 | |
Accrued management fee | 1,131,791 | |
Distribution and service plan fees payable | 47,878 | |
Other affiliated payables | 299,993 | |
Other payables and accrued expenses | 66,290 | |
Collateral on securities loaned, at value | 71,793,425 | |
Total liabilities | | 103,696,616 |
| | |
Net Assets | | $ 1,847,172,204 |
Net Assets consist of: | | |
Paid in capital | | $ 1,604,527,390 |
Accumulated net investment loss | | (1,442,758) |
Accumulated undistributed net realized gain (loss) on investments and foreign currency transactions | | 63,602,071 |
Net unrealized appreciation (depreciation) on investments and assets and liabilities in foreign currencies | | 180,485,501 |
Net Assets | | $ 1,847,172,204 |
See accompanying notes which are an integral part of the financial statements.
Annual Report
Financial Statements - continued
Statement of Assets and Liabilities - continued
| July 31, 2012 |
| | |
Calculation of Maximum Offering Price Class A:
Net Asset Value and redemption price per share ($59,684,141 ÷ 3,761,625 shares) | | $ 15.87 |
| | |
Maximum offering price per share (100/94.25 of $15.87) | | $ 16.84 |
Class T:
Net Asset Value and redemption price per share ($27,657,540 ÷ 1,764,218 shares) | | $ 15.68 |
| | |
Maximum offering price per share (100/96.50 of $15.68) | | $ 16.25 |
Class B:
Net Asset Value and offering price per share ($4,123,211 ÷ 271,428 shares)A | | $ 15.19 |
| | |
Class C:
Net Asset Value and offering price per share ($24,682,877 ÷ 1,627,852 shares)A | | $ 15.16 |
| | |
Small Cap Growth:
Net Asset Value, offering price and redemption price per share ($1,166,101,377 ÷ 72,239,706 shares) | | $ 16.14 |
| | |
Class F:
Net Asset Value, offering price and redemption price per share ($528,229,315 ÷ 32,483,605 shares) | | $ 16.26 |
| | |
Institutional Class:
Net Asset Value, offering price and redemption price per share ($36,693,743 ÷ 2,269,537 shares) | | $ 16.17 |
A Redemption price per share is equal to net asset value less any applicable contingent deferred sales charge.
See accompanying notes which are an integral part of the financial statements.
Annual Report
Statement of Operations
| Year ended July 31, 2012 |
| | |
Investment Income | | |
Dividends (including $350,789 earned from other affiliated issuers) | | $ 10,164,089 |
Special dividends | | 1,530,000 |
Interest | | 2,005 |
Income from Fidelity Central Funds (including $3,071,956 from security lending) | | 3,151,231 |
Total income | | 14,847,325 |
| | |
Expenses | | |
Management fee
Basic fee | $ 12,271,775 | |
Performance adjustment | 827,912 | |
Transfer agent fees | 3,165,497 | |
Distribution and service plan fees | 563,361 | |
Accounting and security lending fees | 550,873 | |
Custodian fees and expenses | 30,254 | |
Independent trustees' compensation | 11,394 | |
Registration fees | 99,536 | |
Audit | 58,667 | |
Legal | 5,590 | |
Miscellaneous | 18,436 | |
Total expenses before reductions | 17,603,295 | |
Expense reductions | (174,685) | 17,428,610 |
Net investment income (loss) | | (2,581,285) |
Realized and Unrealized Gain (Loss) Net realized gain (loss) on: | | |
Investment securities: | | |
Unaffiliated issuers | 77,468,956 | |
Other affiliated issuers | 1,136,369 | |
Foreign currency transactions | (232,876) | |
Futures contracts | 5,787,075 | |
Total net realized gain (loss) | | 84,159,524 |
Change in net unrealized appreciation (depreciation) on: Investment securities | (104,787,928) | |
Assets and liabilities in foreign currencies | (14,661) | |
Total change in net unrealized appreciation (depreciation) | | (104,802,589) |
Net gain (loss) | | (20,643,065) |
Net increase (decrease) in net assets resulting from operations | | $ (23,224,350) |
See accompanying notes which are an integral part of the financial statements.
Annual Report
Financial Statements - continued
Statement of Changes in Net Assets
| Year ended
July 31,
2012 | Year ended
July 31,
2011 |
Increase (Decrease) in Net Assets | | |
Operations | | |
Net investment income (loss) | $ (2,581,285) | $ (3,102,614) |
Net realized gain (loss) | 84,159,524 | 221,065,530 |
Change in net unrealized appreciation (depreciation) | (104,802,589) | 210,253,368 |
Net increase (decrease) in net assets resulting
from operations | (23,224,350) | 428,216,284 |
Distributions to shareholders from net realized gain | (34,799,429) | (3,013,255) |
Share transactions - net increase (decrease) | 61,802,637 | (17,486,495) |
Redemption fees | 255,125 | 229,000 |
Total increase (decrease) in net assets | 4,033,983 | 407,945,534 |
| | |
Net Assets | | |
Beginning of period | 1,843,138,221 | 1,435,192,687 |
End of period (including accumulated net investment loss of $1,442,758 and accumulated net investment loss of $848,304, respectively) | $ 1,847,172,204 | $ 1,843,138,221 |
See accompanying notes which are an integral part of the financial statements.
Annual Report
Financial Highlights - Class A
Years ended July 31, | 2012 | 2011 | 2010 | 2009 | 2008 |
Selected Per-Share Data | | | | | |
Net asset value, beginning of period | $ 16.42 | $ 12.66 | $ 10.79 | $ 13.20 | $ 16.06 |
Income from Investment Operations | | | | | |
Net investment income (loss) C | (.07) F | (.07) G | (.07) H | (.06) | (.11) |
Net realized and unrealized gain (loss) | (.16) | 3.84 | 1.94 | (2.35) | (1.73) |
Total from investment operations | (.23) | 3.77 | 1.87 | (2.41) | (1.84) |
Distributions from net realized gain | (.32) | (.01) K | - | - | (1.02) |
Redemption fees added to paid in capital C,J | - | - | - | - | - |
Net asset value, end of period | $ 15.87 | $ 16.42 | $ 12.66 | $ 10.79 | $ 13.20 |
Total Return A,B | (1.14)% | 29.78% | 17.33% | (18.26)% | (12.26)% |
Ratios to Average Net Assets D,I | | | | | |
Expenses before reductions | 1.35% | 1.25% | 1.35% | 1.33% | 1.40% |
Expenses net of fee waivers, if any | 1.35% | 1.25% | 1.35% | 1.33% | 1.40% |
Expenses net of all reductions | 1.34% | 1.23% | 1.34% | 1.33% | 1.39% |
Net investment income (loss) | (.49)% F | (.47)% G | (.56)% H | (.64)% | (.74)% |
Supplemental Data | | | | | |
Net assets, end of period (000 omitted) | $ 59,684 | $ 67,272 | $ 50,620 | $ 40,211 | $ 42,187 |
Portfolio turnover rate E | 150% | 106% | 105% | 150% | 113% |
A Total returns would have been lower if certain expenses had not been reduced during the applicable periods shown.
B Total returns do not include the effect of the sales charges.
C Calculated based on average shares outstanding during the period.
D Fees and expenses of any underlying Fidelity Central Funds are not included in the Fund's expense ratio. The Fund indirectly bears its proportionate share of the expenses of any underlying Fidelity Central Funds.
E Amount does not include the portfolio activity of any underlying Fidelity Central Funds.
F Investment income per share reflects a large, non-recurring dividend which amounted to $.01 per share. Excluding this non-recurring dividend, the ratio of net investment income (loss) to average net assets would have been (.57)%.
G Investment income per share reflects a large, non-recurring dividend which amounted to $.02 per share. Excluding this non-recurring dividend, the ratio of net investment income (loss) to average net assets would have been (.61)%.
H Investment income per share reflects a large, non-recurring dividend which amounted to $.01 per share. Excluding this non-recurring dividend, the ratio of net investment income (loss) to average net assets would have been (.67)%.
I Expense ratios reflect operating expenses of the class. Expenses before reductions do not reflect amounts reimbursed by the investment adviser or reductions from brokerage service arrangements or reductions from other expense offset arrangements and do not represent the amount paid by the class during periods when reimbursements or reductions occur. Expenses net of fee waivers reflect expenses after reimbursement by the investment adviser but prior to reductions from brokerage service arrangements or other expense offset arrangements. Expenses net of all reductions represent the net expenses paid by the class.
J Amount represents less than $.01 per share.
K The amount shown reflects certain reclassifications related to book to tax differences.
See accompanying notes which are an integral part of the financial statements.
Annual Report
Financial Highlights - Class T
Years ended July 31, | 2012 | 2011 | 2010 | 2009 | 2008 |
Selected Per-Share Data | | | | | |
Net asset value, beginning of period | $ 16.27 | $ 12.57 | $ 10.74 | $ 13.17 | $ 16.01 |
Income from Investment Operations | | | | | |
Net investment income (loss) C | (.11) F | (.11) G | (.10) H | (.09) | (.15) |
Net realized and unrealized gain (loss) | (.16) | 3.81 | 1.93 | (2.34) | (1.73) |
Total from investment operations | (.27) | 3.70 | 1.83 | (2.43) | (1.88) |
Distributions from net realized gain | (.32) | - | - | - | (.96) |
Redemption fees added to paid in capital C,J | - | - | - | - | - |
Net asset value, end of period | $ 15.68 | $ 16.27 | $ 12.57 | $ 10.74 | $ 13.17 |
Total Return A,B | (1.41)% | 29.44% | 17.04% | (18.45)% | (12.50)% |
Ratios to Average Net AssetsD,I | | | | | |
Expenses before reductions | 1.61% | 1.50% | 1.61% | 1.60% | 1.65% |
Expenses net of fee waivers, if any | 1.61% | 1.50% | 1.61% | 1.60% | 1.65% |
Expenses net of all reductions | 1.60% | 1.49% | 1.60% | 1.59% | 1.65% |
Net investment income (loss) | (.74)% F | (.73)% G | (.82)% H | (.91)% | (.99)% |
Supplemental Data | | | | | |
Net assets, end of period (000 omitted) | $ 27,658 | $ 30,764 | $ 23,930 | $ 21,533 | $ 21,754 |
Portfolio turnover rate E | 150% | 106% | 105% | 150% | 113% |
A Total returns would have been lower if certain expenses had not been reduced during the applicable periods shown.
B Total returns do not include the effect of the sales charges.
C Calculated based on average shares outstanding during the period.
D Fees and expenses of any underlying Fidelity Central Funds are not included in the Fund's expense ratio. The Fund indirectly bears its proportionate share of the expenses of any underlying Fidelity Central Funds.
E Amount does not include the portfolio activity of any underlying Fidelity Central Funds.
F Investment income per share reflects a large, non-recurring dividend which amounted to $.01 per share. Excluding this non-recurring dividend, the ratio of net investment income (loss) to average net assets would have been (.83)%.
G Investment income per share reflects a large, non-recurring dividend which amounted to $.02 per share. Excluding this non-recurring dividend, the ratio of net investment income (loss) to average net assets would have been (.86)%.
H Investment income per share reflects a large, non-recurring dividend which amounted to $.01 per share. Excluding this non-recurring dividend, the ratio of net investment income (loss) to average net assets would have been (.93)%.
I Expense ratios reflect operating expenses of the class. Expenses before reductions do not reflect amounts reimbursed by the investment adviser or reductions from brokerage service arrangements or reductions from other expense offset arrangements and do not represent the amount paid by the class during periods when reimbursements or reductions occur. Expenses net of fee waivers reflect expenses after reimbursement by the investment adviser but prior to reductions from brokerage service arrangements or other expense offset arrangements. Expenses net of all reductions represent the net expenses paid by the class.
J Amount represents less than $.01 per share.
See accompanying notes which are an integral part of the financial statements.
Annual Report
Financial Highlights - Class B
Years ended July 31, | 2012 | 2011 | 2010 | 2009 | 2008 |
Selected Per-Share Data | | | | | |
Net asset value, beginning of period | $ 15.86 | $ 12.30 | $ 10.57 | $ 13.03 | $ 15.85 |
Income from Investment Operations | | | | | |
Net investment income (loss) C | (.18) F | (.18) G | (.16) H | (.13) | (.22) |
Net realized and unrealized gain (loss) | (.17) | 3.74 | 1.89 | (2.33) | (1.71) |
Total from investment operations | (.35) | 3.56 | 1.73 | (2.46) | (1.93) |
Distributions from net realized gain | (.32) | - | - | - | (.89) |
Redemption fees added to paid in capital C,J | - | - | - | - | - |
Net asset value, end of period | $ 15.19 | $ 15.86 | $ 12.30 | $ 10.57 | $ 13.03 |
Total Return A,B | (1.96)% | 28.94% | 16.37% | (18.88)% | (12.92)% |
Ratios to Average Net Assets D,I | | | | | |
Expenses before reductions | 2.10% | 2.00% | 2.11% | 2.08% | 2.15% |
Expenses net of fee waivers, if any | 2.10% | 2.00% | 2.11% | 2.08% | 2.15% |
Expenses net of all reductions | 2.09% | 1.98% | 2.09% | 2.08% | 2.15% |
Net investment income (loss) | (1.23)% F | (1.22)% G | (1.32)% H | (1.39)% | (1.49)% |
Supplemental Data | | | | | |
Net assets, end of period (000 omitted) | $ 4,123 | $ 5,295 | $ 5,142 | $ 4,171 | $ 5,517 |
Portfolio turnover rate E | 150% | 106% | 105% | 150% | 113% |
A Total returns would have been lower if certain expenses had not been reduced during the applicable periods shown.
B Total returns do not include the effect of the contingent deferred sales charge.
C Calculated based on average shares outstanding during the period.
D Fees and expenses of any underlying Fidelity Central Funds are not included in the Fund's expense ratio. The Fund indirectly bears its proportionate share of the expenses of any underlying Fidelity Central Funds.
E Amount does not include the portfolio activity of any underlying Fidelity Central Funds.
F Investment income per share reflects a large, non-recurring dividend which amounted to $.01 per share. Excluding this non-recurring dividend, the ratio of net investment income (loss) to average net assets would have been (1.32)%.
G Investment income per share reflects a large, non-recurring dividend which amounted to $.02 per share. Excluding this non-recurring dividend, the ratio of net investment income (loss) to average net assets would have been (1.36)%.
H Investment income per share reflects a large, non-recurring dividend which amounted to $.01 per share. Excluding this non-recurring dividend, the ratio of net investment income (loss) to average net assets would have been (1.42)%.
I Expense ratios reflect operating expenses of the class. Expenses before reductions do not reflect amounts reimbursed by the investment adviser or reductions from brokerage service arrangements or reductions from other expense offset arrangements and do not represent the amount paid by the class during periods when reimbursements or reductions occur. Expenses net of fee waivers reflect expenses after reimbursement by the investment adviser but prior to reductions from brokerage service arrangements or other expense offset arrangements. Expenses net of all reductions represent the net expenses paid by the class.
J Amount represents less than $.01 per share.
See accompanying notes which are an integral part of the financial statements.
Annual Report
Financial Highlights - Class C
Years ended July 31, | 2012 | 2011 | 2010 | 2009 | 2008 |
Selected Per-Share Data | | | | | |
Net asset value, beginning of period | $ 15.83 | $ 12.28 | $ 10.55 | $ 13.00 | $ 15.84 |
Income from Investment Operations | | | | | |
Net investment income (loss) C | (.18) F | (.18) G | (.16) H | (.13) | (.22) |
Net realized and unrealized gain (loss) | (.17) | 3.73 | 1.89 | (2.32) | (1.71) |
Total from investment operations | (.35) | 3.55 | 1.73 | (2.45) | (1.93) |
Distributions from net realized gain | (.32) | - | - | - | (.91) |
Redemption fees added to paid in capital C,J | - | - | - | - | - |
Net asset value, end of period | $ 15.16 | $ 15.83 | $ 12.28 | $ 10.55 | $ 13.00 |
Total Return A,B | (1.96)% | 28.91% | 16.40% | (18.85)% | (12.94)% |
Ratios to Average Net Assets D,I | | | | | |
Expenses before reductions | 2.10% | 2.00% | 2.11% | 2.08% | 2.15% |
Expenses net of fee waivers, if any | 2.10% | 2.00% | 2.11% | 2.08% | 2.15% |
Expenses net of all reductions | 2.09% | 1.98% | 2.09% | 2.07% | 2.14% |
Net investment income (loss) | (1.24)% F | (1.22)% G | (1.32)% H | (1.39)% | (1.49)% |
Supplemental Data | | | | | |
Net assets, end of period (000 omitted) | $ 24,683 | $ 24,914 | $ 18,091 | $ 14,267 | $ 15,946 |
Portfolio turnover rate E | 150% | 106% | 105% | 150% | 113% |
A Total returns would have been lower if certain expenses had not been reduced during the applicable periods shown.
B Total returns do not include the effect of the contingent deferred sales charge.
C Calculated based on average shares outstanding during the period.
D Fees and expenses of any underlying Fidelity Central Funds are not included in the Fund's expense ratio. The Fund indirectly bears its proportionate share of the expenses of any underlying Fidelity Central Funds.
E Amount does not include the portfolio activity of any underlying Fidelity Central Funds.
F Investment income per share reflects a large, non-recurring dividend which amounted to $.01 per share. Excluding this non-recurring dividend, the ratio of net investment income (loss) to average net assets would have been (1.32)%.
G Investment income per share reflects a large, non-recurring dividend which amounted to $.02 per share. Excluding this non-recurring dividend, the ratio of net investment income (loss) to average net assets would have been (1.36)%.
H Investment income per share reflects a large, non-recurring dividend which amounted to $.01 per share. Excluding this non-recurring dividend, the ratio of net investment income (loss) to average net assets would have been (1.42)%.
I Expense ratios reflect operating expenses of the class. Expenses before reductions do not reflect amounts reimbursed by the investment adviser or reductions from brokerage service arrangements or reductions from other expense offset arrangements and do not represent the amount paid by the class during periods when reimbursements or reductions occur. Expenses net of fee waivers reflect expenses after reimbursement by the investment adviser but prior to reductions from brokerage service arrangements or other expense offset arrangements. Expenses net of all reductions represent the net expenses paid by the class.
J Amount represents less than $.01 per share.
See accompanying notes which are an integral part of the financial statements.
Annual Report
Financial Highlights - Small Cap Growth
Years ended July 31, | 2012 | 2011 | 2010 | 2009 | 2008 |
Selected Per-Share Data | | | | | |
Net asset value, beginning of period | $ 16.65 | $ 12.81 | $ 10.89 | $ 13.29 | $ 16.15 |
Income from Investment Operations | | | | | |
Net investment income (loss) B | (.03) E | (.03) F | (.04) G | (.04) | (.07) |
Net realized and unrealized gain (loss) | (.16) | 3.90 | 1.96 | (2.36) | (1.74) |
Total from investment operations | (.19) | 3.87 | 1.92 | (2.40) | (1.81) |
Distributions from net realized gain | (.32) | (.03) J | - | - | (1.05) |
Redemption fees added to paid in capital B,I | - | - | - | - | - |
Net asset value, end of period | $ 16.14 | $ 16.65 | $ 12.81 | $ 10.89 | $ 13.29 |
Total Return A | (.88)% | 30.20% | 17.63% | (18.06)% | (11.98)% |
Ratios to Average Net Assets C,H | | | | |
Expenses before reductions | 1.03% | .95% | 1.08% | 1.08% | 1.11% |
Expenses net of fee waivers, if any | 1.03% | .95% | 1.08% | 1.08% | 1.11% |
Expenses net of all reductions | 1.02% | .93% | 1.07% | 1.08% | 1.10% |
Net investment income (loss) | (.16)% E | (.17)% F | (.29)% G | (.39)% | (.45)% |
Supplemental Data | | | | | |
Net assets, end of period (000 omitted) | $ 1,166,101 | $ 1,382,688 | $ 1,204,818 | $ 1,085,184 | $ 1,217,520 |
Portfolio turnover rate D | 150% | 106% | 105% | 150% | 113% |
A Total returns would have been lower if certain expenses had not been reduced during the applicable periods shown.
B Calculated based on average shares outstanding during the period.
C Fees and expenses of any underlying Fidelity Central Funds are not included in the Fund's expense ratio. The Fund indirectly bears its proportionate share of the expenses of any underlying Fidelity Central Funds.
D Amount does not include the portfolio activity of any underlying Fidelity Central Funds.
E Investment income per share reflects a large, non-recurring dividend which amounted to $.01 per share. Excluding this non-recurring dividend, the ratio of net investment income (loss) to average net assets would have been (.25)%.
F Investment income per share reflects a large, non-recurring dividend which amounted to $.02 per share. Excluding this non-recurring dividend, the ratio of net investment income (loss) to average net assets would have been (.31)%.
G Investment income per share reflects a large, non-recurring dividend which amounted to $.01 per share. Excluding this non-recurring dividend, the ratio of net investment income (loss) to average net assets would have been (.39)%.
H Expense ratios reflect operating expenses of the class. Expenses before reductions do not reflect amounts reimbursed by the investment adviser or reductions from brokerage service arrangements or reductions from other expense offset arrangements and do not represent the amount paid by the class during periods when reimbursements or reductions occur. Expenses net of fee waivers reflect expenses after reimbursement by the investment adviser but prior to reductions from brokerage service arrangements or other expense offset arrangements. Expenses net of all reductions represent the net expenses paid by the class.
I Amount represents less than $.01 per share.
J The amount shown reflects certain reclassifications related to book to tax differences.
See accompanying notes which are an integral part of the financial statements.
Annual Report
Financial Highlights - Class F
Years ended July 31, | 2012 | 2011 | 2010 | 2009 K |
Selected Per-Share Data | | | | |
Net asset value, beginning of period | $ 16.73 | $ 12.85 | $ 10.90 | $ 10.03 |
Income from Investment Operations | | | | |
Net investment income (loss) D | .01 H | .01 I | -J,M | (.01) |
Net realized and unrealized gain (loss) | (.16) | 3.91 | 1.95 | .88 |
Total from investment operations | (.15) | 3.92 | 1.95 | .87 |
Distributions from net realized gain | (.32) | (.04) N | - | - |
Redemption fees added to paid in capital D,M | - | - | - | - |
Net asset value, end of period | $ 16.26 | $ 16.73 | $ 12.85 | $ 10.90 |
Total Return B,C | (.64)% | 30.56% | 17.89% | 8.67% |
Ratios to Average Net Assets E,L | | | | |
Expenses before reductions | .80% | .70% | .78% | .74% A |
Expenses net of fee waivers, if any | .80% | .70% | .78% | .74% A |
Expenses net of all reductions | .79% | .68% | .77% | .73% A |
Net investment income (loss) | .07% H | .08% I | -% G,J | (.54)% A |
Supplemental Data | | | | |
Net assets, end of period (000 omitted) | $ 528,229 | $ 290,765 | $ 106,941 | $ 159 |
Portfolio turnover rate F | 150% | 106% | 105% | 150% |
A Annualized
B Total returns for periods of less than one year are not annualized.
C Total returns would have been lower if certain expenses had not been reduced during the applicable periods shown.
D Calculated based on average shares outstanding during the period.
E Fees and expenses of any underlying Fidelity Central Funds are not included in the Fund's expense ratio. The Fund indirectly bears its proportionate share of the expenses of any underlying Fidelity Central Funds.
F Amount does not include the portfolio activity of any underlying Fidelity Central Funds.
G Amount represents less than .01%.
H Investment income per share reflects a large, non-recurring dividend which amounted to $.01 per share. Excluding this non-recurring dividend, the ratio of net investment income (loss) to average net assets would have been (.02)%.
I Investment income per share reflects a large, non-recurring dividend which amounted to $.02 per share. Excluding this non-recurring dividend, the ratio of net investment income (loss) to average net assets would have been (.06)%.
J Investment income per share reflects a large, non-recurring dividend which amounted to $.01 per share. Excluding this non-recurring dividend, the ratio of net investment income (loss) to average net assets would have been (.10)%.
K For the period June 26, 2009 (commencement of sale of shares) to July 31, 2009.
L Expense ratios reflect operating expenses of the class. Expenses before reductions do not reflect amounts reimbursed by the investment adviser or reductions from brokerage service arrangements or reductions from other expense offset arrangements and do no represent the amount paid by the class during periods when reimbursements or reductions occur. Expense ratios before reductions for start-up periods may not be representative of longer-term operating periods. Expenses net of fee waivers reflect expenses after reimbursement by the investment adviser but prior to reductions from brokerage service arrangements or other expense offset arrangements. Expenses net of all reductions represent the net expenses paid by the class.
M Amount represents less than $.01 per share.
N The amount shown reflects certain reclassifications related to book to tax differences.
See accompanying notes which are an integral part of the financial statements.
Annual Report
Financial Highlights - Institutional Class
Years ended July 31, | 2012 | 2011 | 2010 | 2009 | 2008 |
Selected Per-Share Data | | | | | |
Net asset value, beginning of period | $ 16.68 | $ 12.83 | $ 10.91 | $ 13.30 | $ 16.15 |
Income from Investment Operations | | | | | |
Net investment income (loss) B | (.03) E | (.03) F | (.03) G | (.03) | (.06) |
Net realized and unrealized gain (loss) | (.16) | 3.91 | 1.95 | (2.36) | (1.74) |
Total from investment operations | (.19) | 3.88 | 1.92 | (2.39) | (1.80) |
Distributions from net realized gain | (.32) | (.03) J | - | - | (1.05) |
Redemption fees added to paid in capital B,I | - | - | - | - | - |
Net asset value, end of period | $ 16.17 | $ 16.68 | $ 12.83 | $ 10.91 | $ 13.30 |
Total Return A | (.88)% | �� 30.24% | 17.60% | (17.97)% | (11.93)% |
Ratios to Average Net Assets C,H | | | | |
Expenses before reductions | 1.06% | .94% | 1.03% | 1.05% | 1.04% |
Expenses net of fee waivers, if any | 1.06% | .94% | 1.03% | 1.05% | 1.04% |
Expenses net of all reductions | 1.05% | .93% | 1.02% | 1.04% | 1.03% |
Net investment income (loss) | (.19)% E | (.17)% F | (.24)% G | (.36)% | (.38)% |
Supplemental Data | | | | | |
Net assets, end of period (000 omitted) | $ 36,694 | $ 41,440 | $ 25,650 | $ 19,204 | $ 22,444 |
Portfolio turnover rate D | 150% | 106% | 105% | 150% | 113% |
A Total returns would have been lower if certain expenses had not been reduced during the applicable periods shown.
B Calculated based on average shares outstanding during the period.
C Fees and expenses of any underlying Fidelity Central Funds are not included in the Fund's expense ratio. The Fund indirectly bears its proportionate share of the expenses of any underlying Fidelity Central Funds.
D Amount does not include the portfolio activity of any underlying Fidelity Central Funds.
E Investment income per share reflects a large, non-recurring dividend which amounted to $.01 per share. Excluding this non-recurring dividend, the ratio of net investment income (loss) to average net assets would have been (.28)%.
F Investment income per share reflects a large, non-recurring dividend which amounted to $.02 per share. Excluding this non-recurring dividend, the ratio of net investment income (loss) to average net assets would have been (.30)%.
G Investment income per share reflects a large, non-recurring dividend which amounted to $.01 per share. Excluding this non-recurring dividend, the ratio of net investment income (loss) to average net assets would have been (.34)%.
H Expense ratios reflect operating expenses of the class. Expenses before reductions do not reflect amounts reimbursed by the investment adviser or reductions from brokerage service arrangements or reductions from other expense offset arrangements and do not represent the amount paid by the class during periods when reimbursements or reductions occur. Expenses net of fee waivers reflect expenses after reimbursement by the investment adviser but prior to reductions from brokerage service arrangements or other expense offset arrangements. Expenses net of all reductions represent the net expenses paid by the class.
I Amount represents less than $.01 per share.
J The amount shown reflects certain reclassifications related to book to tax differences.
See accompanying notes which are an integral part of the financial statements.
Annual Report
Notes to Financial Statements
For the period ended July 31, 2012
1. Organization.
Fidelity Small Cap Growth Fund (the Fund) is a fund of Fidelity Securities Fund (the Trust) and is authorized to issue an unlimited number of shares. The Trust is registered under the Investment Company Act of 1940, as amended (the 1940 Act), as an open-end management investment company organized as a Massachusetts business trust. The Fund offers Class A, Class T, Class C, Small Cap Growth, Class F and Institutional Class shares, each of which, along with Class B shares, has equal rights as to assets and voting privileges. Effective after the close of business on September 1, 2010, Class B shares were closed to new accounts and additional purchases, except for exchanges and reinvestments. Each class has exclusive voting rights with respect to matters that affect that class. Class F shares of the Fund are only available for purchase by mutual funds for which Fidelity Management & Research Company (FMR) or an affiliate serves as investment manager. Class B shares will automatically convert to Class A shares after a holding period of seven years from the initial date of purchase. Investment income, realized and unrealized capital gains and losses, the common expenses of the Fund, and certain fund-level expense reductions, if any, are allocated on a pro-rata basis to each class based on the relative net assets of each class to the total net assets of the Fund. Each class differs with respect to transfer agent and distribution and service plan fees incurred. Certain expense reductions may also differ by class.
2. Investments in Fidelity Central Funds.
The Fund invests in Fidelity Central Funds, which are open-end investment companies available only to other investment companies and accounts managed by FMR and its affiliates. The Fund's Schedule of Investments lists each of the Fidelity Central Funds held as of period end, if any, as an investment of the Fund, but does not include the underlying holdings of each Fidelity Central Fund. As an Investing Fund, the Fund indirectly bears its proportionate share of the expenses of the underlying Fidelity Central Funds.
The Money Market Central Funds seek preservation of capital and current income and are managed by Fidelity Investments Money Management, Inc. (FIMM), an affiliate of FMR.
A complete unaudited list of holdings for each Fidelity Central Fund is available upon request or at the Securities and Exchange Commission (the SEC) web site at www.sec.gov. In addition, the financial statements of the Fidelity Central Funds, which are not covered by the Fund's Report of Independent Registered Public Accounting Firm, are available on the SEC web site or upon request.
Annual Report
Notes to Financial Statements - continued
3. Significant Accounting Policies.
The financial statements have been prepared in conformity with accounting principles generally accepted in the United States of America (GAAP), which require management to make certain estimates and assumptions at the date of the financial statements. Actual results could differ from those estimates. Subsequent events, if any, through the date that the financial statements were issued have been evaluated in the preparation of the financial statements. The following summarizes the significant accounting policies of the Fund:
Security Valuation. Investments are valued as of 4:00 p.m. Eastern time on the last calendar day of the period. In accordance with valuation policies and procedures approved by the Board of Trustees (the Board), the Fund attempts to obtain prices from one or more third party pricing vendor or broker to value its investments. When current market prices, quotations or rates are not readily available or reliable, securities will be fair valued in good faith by the FMR Fair Value Committee (the Committee), in accordance with procedures adopted by the Fund's Board. Factors used in determining fair value vary by security type and may include market or security specific events. The frequency with which these procedures are used cannot be predicted and they may be utilized to a significant extent. The Committee oversees the Fund's valuation policies and procedures and is responsible for approving and reporting to the Board all fair value determinations.
The Fund categorizes the inputs to valuation techniques used to value its investments into a disclosure hierarchy consisting of three levels as shown below:
Level 1 - quoted prices in active markets for identical investments
Level 2 - other significant observable inputs (including quoted prices for similar investments, interest rates, prepayment speeds, etc.)
Level 3 - unobservable inputs (including the Fund's own assumptions based on the best information available)
Valuation techniques used to value the Fund's investments by major category are as follows:
Equity securities, including restricted securities, for which market quotations are readily available, are valued at the last reported sale price or official closing price as reported by a third party pricing vendor on the primary market or exchange on which they are traded and are categorized as Level 1 in the hierarchy. In the event there were no sales during the day or closing prices are not available, securities are valued at the last quoted bid price or may be valued using the last available price and are generally categorized as Level 2 in the hierarchy. For foreign equity securities, when significant market or security specific events arise, comparisons to the valuation of American Depositary Receipts
Annual Report
3. Significant Accounting Policies - continued
Security Valuation - continued
(ADRs), futures contracts, Exchange-Traded Funds (ETFs) and certain indexes as well as quoted prices for similar securities are used and are categorized as Level 2 in the hierarchy. Utilizing these techniques may result in transfers between Level 1 and Level 2.
Investments in open-end mutual funds, including the Fidelity Central Funds, are valued at their closing net asset value each business day and are categorized as Level 1 in the hierarchy.
Changes in valuation techniques may result in transfers in or out of an assigned level within the disclosure hierarchy. The aggregate value of investments by input level, as of July 31, 2012, is included at the end of the Fund's Schedule of Investments.
Foreign Currency Translation. The Fund may use foreign currency contracts to facilitate transactions in foreign-denominated securities. Gains and losses from these transactions may arise from changes in the value of the foreign currency or if the counterparties do not perform under the contracts' terms.
Foreign-denominated assets, including investment securities, and liabilities are translated into U.S. dollars at the exchange rate at period end. Purchases and sales of investment securities, income and dividends received and expenses denominated in foreign currencies are translated into U.S. dollars at the exchange rate in effect on the transaction date.
The effects of exchange rate fluctuations on investments are included with the net realized and unrealized gain (loss) on investment securities. Other foreign currency transactions resulting in realized and unrealized gain (loss) are disclosed separately.
Investment Transactions and Income. For financial reporting purposes, the Fund's investment holdings and NAV include trades executed through the end of the last business day of the period. The NAV per share for processing shareholder transactions is calculated as of the close of business of the New York Stock Exchange (NYSE), normally 4:00 p.m. Eastern time and includes trades executed through the end of the prior business day. Gains and losses on securities sold are determined on the basis of identified cost and may include proceeds received from litigation. Dividend income is recorded on the ex-dividend date, except for certain dividends from foreign securities where the ex-dividend date may have passed, which are recorded as soon as the Fund is informed of the ex-dividend date. Non-cash dividends included in dividend income, if any, are recorded at the fair market value of the securities received. Distributions received on securities that represent a return of capital or capital gain are recorded as a reduction of cost of investments and/or as a realized gain. The Fund estimates the components of distributions received that may be considered return of capital distributions or capital
Annual Report
Notes to Financial Statements - continued
3. Significant Accounting Policies - continued
Investment Transactions and Income - continued
gain distributions. Large, non-recurring dividends recognized by the Fund are presented separately on the Statement of Operations as "Special Dividends" and the impact of these dividends is presented in the Financial Highlights. Interest income and distributions from the Fidelity Central Funds are accrued as earned. Interest income includes coupon interest and amortization of premium and accretion of discount on debt securities. Investment income is recorded net of foreign taxes withheld where recovery of such taxes is uncertain.
Expenses. Expenses directly attributable to a fund are charged to that fund. Expenses attributable to more than one fund are allocated among the respective funds on the basis of relative net assets or other appropriate methods. Expense estimates are accrued in the period to which they relate and adjustments are made when actual amounts are known.
Income Tax Information and Distributions to Shareholders. Each year, the Fund intends to qualify as a regulated investment company under Subchapter M of the Internal Revenue Code, including distributing substantially all of its taxable income and realized gains. As a result, no provision for income taxes is required. As of July 31, 2012, the Fund did not have any unrecognized tax benefits in the financial statements; nor is the Fund aware of any tax positions for which it is reasonably possible that the total amounts of unrecognized tax benefits will significantly change in the next twelve months. The Fund files a U.S. federal tax return, in addition to state and local tax returns as required. A fund's federal income tax returns are subject to examination by the Internal Revenue Service (IRS) for a period of three fiscal years after they are filed. State and local tax returns may be subject to examination for an additional fiscal year depending on the jurisdiction. Foreign taxes are provided for based on the Fund's understanding of the tax rules and rates that exist in the foreign markets in which it invests.
Distributions are declared and recorded on the ex-dividend date. Income dividends and capital gain distributions are declared separately for each class. Income and capital gain distributions are determined in accordance with income tax regulations, which may differ from GAAP. These differences resulted in distribution reclassifications for the period ended July 31, 2011. In addition, the Fund claimed a portion of the payment made to redeeming shareholders as a distribution for income tax purposes.
Capital accounts within the financial statements are adjusted for permanent book-tax differences. These adjustments have no impact on net assets or the results of operations. Temporary book-tax differences will reverse in a subsequent period.
Annual Report
3. Significant Accounting Policies - continued
Income Tax Information and Distributions to Shareholders - continued
Book-tax differences are primarily due to foreign currency transactions, net operating losses, future transactions, and losses deferred due to wash sales and excise tax regulations.
The federal tax cost of investment securities and unrealized appreciation (depreciation) as of period end were as follows:
Gross unrealized appreciation | $ 262,984,526 |
Gross unrealized depreciation | (85,038,817) |
Net unrealized appreciation (depreciation) on securities and other investments | $ 177,945,709 |
| |
Tax Cost | $ 1,734,004,109 |
The tax-based components of distributable earnings as of period end were as follows:
Undistributed long-term capital gain | $ 66,152,857 |
Net unrealized appreciation (depreciation) | $ 177,934,714 |
The tax character of distributions paid was as follows:
| July 31, 2012 | July 31, 2011 |
Long-term Capital Gains | $ 34,799,429 | $ 3,013,255 |
Short-Term Trading (Redemption) Fees. Shares held by investors in the Fund less than 90 days are subject to a redemption fee equal to 1.50% of the net asset value of shares redeemed. All redemption fees, which reduce the proceeds of the shareholder redemption, are retained by the Fund and accounted for as an addition to paid in capital.
New Accounting Pronouncement. In December 2011, the Financial Accounting Standards Board issued Accounting Standard Update No. 2011-11, Disclosures about Offsetting Assets and Liabilities. The update creates new disclosure requirements requiring entities to disclose both gross and net information for derivatives and other financial instruments that are either offset in the Statement of Assets and Liabilities or subject to an enforceable master netting arrangement or similar agreement. The disclosure requirements are effective for interim and annual reporting periods beginning on or after January 1, 2013. Management is currently evaluating the impact of the update's adoption on the Fund's financial statement disclosures.
Annual Report
Notes to Financial Statements - continued
4. Derivative Instruments.
Risk Exposures and the Use of Derivative Instruments. The Fund's investment objectives allow the Fund to enter into various types of derivative contracts, including futures contracts. Derivatives are investments whose value is derived from underlying assets, indices or reference rates and may be transacted on an exchange or over-the-counter (OTC). Derivatives may involve a future commitment to buy or sell a specified instrument based on specified terms, or to exchange future cash flows at periodic intervals based on a notional principal amount. The Fund used derivatives to increase returns and to manage exposure to certain risks as defined below. The success of any strategy involving derivatives depends on analysis of numerous economic factors, and if the strategies for investment do not work as intended, the Fund may not achieve its objectives.
The Fund's use of derivatives increased or decreased its exposure to the following risk:
Equity Risk | Equity risk relates to the fluctuations in the value of financial instruments as a result of changes in market prices (other than those arising from interest rate risk or foreign exchange risk), whether caused by factors specific to an individual investment, its issuer, or all factors affecting all instruments traded in a market or market segment. |
The Fund is also exposed to additional risks from investing in derivatives, such as liquidity risk and counterparty credit risk. Liquidity risk is the risk that the Fund will be unable to close out the derivative in the open market in a timely manner. Counterparty credit risk is the risk that the counterparty will not be able to fulfill its obligation to the Fund. Counterparty credit risk related to exchange-traded futures contracts is minimal because of the protection provided by the exchange on which they trade. Investing in derivatives may involve greater risks than investing in the underlying assets directly and, to varying degrees, involves risk of loss in excess of the initial investment, if any, collateral received and amounts recognized in the Statement of Assets and Liabilities. In addition, for futures contracts, there is the risk that the change in value of the derivative contract may not correspond to the change in value of the underlying instrument.
Futures Contracts. A futures contract is an agreement between two parties to buy or sell a specified underlying instrument for a fixed price at a specified future date. The Fund used futures contracts to manage its exposure to the stock market.
Upon entering into a futures contract, a fund is required to deposit either cash or securities (initial margin) with a clearing broker in an amount equal to a certain percentage of the face value of the contract. Futures contracts are marked-to-market daily and subsequent payments are made or received by a fund depending on the daily fluctuations in the value of the futures contracts and are recorded as unrealized appreciation or (depreciation). This receivable and/or payable is included in daily variation margin on
Annual Report
4. Derivative Instruments - continued
Futures Contracts - continued
futures contracts in the Statement of Assets and Liabilities. Realized gain or (loss) is recorded upon the expiration or closing of a futures contract.
Any open futures contracts at period end are shown in the Schedule of Investments under the caption "Futures Contracts." The underlying face amount at value reflects each contract's exposure to the underlying instrument at period end.
During the period the Fund recognized net realized gain (loss) of $5,787,075 related to its investment in futures contracts. This amount is included in the Statement of Operations.
5. Purchases and Sales of Investments.
Purchases and sales of securities, other than short-term securities, aggregated $2,541,649,453 and $2,542,251,432, respectively.
6. Fees and Other Transactions with Affiliates.
Management Fee. FMR and its affiliates provide the Fund with investment management related services for which the Fund pays a monthly management fee. The management fee is the sum of an individual fund fee rate that is based on an annual rate of .45% of the Fund's average net assets and an annualized group fee rate that averaged .26% during the period. The group fee rate is based upon the average net assets of all the mutual funds advised by FMR. The group fee rate decreases as assets under management increase and increases as assets under management decrease. In addition, the management fee is subject to a performance adjustment (up to a maximum of ± .20% of the Fund's average net assets over a 36 month performance period). The upward or downward adjustment to the management fee is based on the relative investment performance of Small Cap Growth as compared to an appropriate benchmark index. For the period, the total annual management fee rate, including the performance adjustment, was .76% of the Fund's average net assets.
Distribution and Service Plan Fees. In accordance with Rule 12b-1 of the 1940 Act, the Fund has adopted separate Distribution and Service Plans for each class of shares. Certain classes pay Fidelity Distributors Corporation (FDC), an affiliate of FMR, separate Distribution and Service Fees, each of which is based on an annual percentage of each class' average net assets. In addition, FDC may pay financial intermediaries for selling shares of the Fund and providing shareholder support services. For the period,
Annual Report
Notes to Financial Statements - continued
6. Fees and Other Transactions with Affiliates - continued
Distribution and Service Plan Fees - continued
the Distribution and Service Fee rates, total fees and amounts retained by FDC were as follows:
| Distribution
Fee | Service
Fee | Total Fees | Retained
by FDC |
Class A | -% | .25% | $ 149,665 | $ 2,982 |
Class T | .25% | .25% | 135,654 | 40 |
Class B | .75% | .25% | 44,856 | 33,711 |
Class C | .75% | .25% | 233,186 | 40,343 |
| | | $ 563,361 | $ 77,076 |
Sales Load. FDC may receive a front-end sales charge of up to 5.75% for selling Class A shares and 3.50% for selling Class T shares, some of which is paid to financial intermediaries for selling shares of the Fund. Depending on the holding period, FDC may receive contingent deferred sales charges levied on Class A, Class T, Class B, and Class C redemptions. The deferred sales charges range from 5.00% to 1.00% for Class B shares, 1.00% for Class C shares, 1.00% for certain purchases of Class A shares and .25% for certain purchases of Class T shares.
For the period, sales charge amounts retained by FDC were as follows:
| Retained
by FDC |
Class A | $ 18,734 |
Class T | 6,727 |
Class B* | 6,869 |
Class C* | 3,375 |
| $ 35,705 |
* When Class B and Class C shares are initially sold, FDC pays commissions from its own resources to financial intermediaries through which the sales are made.
Transfer Agent Fees. Fidelity Investments Institutional Operations Company, Inc. (FIIOC), an affiliate of FMR, is the transfer, dividend disbursing and shareholder servicing agent for each class of the Fund. FIIOC receives account fees and asset-based fees that vary according to the account size and type of account of the shareholders of the respective classes of the Fund, except for Class F. FIIOC receives no fees for providing transfer agency services to Class F. FIIOC pays for typesetting, printing and mailing of
Annual Report
6. Fees and Other Transactions with Affiliates - continued
Transfer Agent Fees - continued
shareholder reports, except proxy statements. For the period, transfer agent fees for each class were as follows:
| Amount | % of
Average
Net Assets |
Class A | $ 180,619 | .30 |
Class T | 83,964 | .31 |
Class B | 13,505 | .30 |
Class C | 70,300 | .30 |
Small Cap Growth | 2,720,942 | .23 |
Institutional Class | 96,167 | .26 |
| $ 3,165,497 | |
Accounting and Security Lending Fees. Fidelity Service Company, Inc. (FSC), an affiliate of FMR, maintains the Fund's accounting records. The accounting fee is based on the level of average net assets for each month. Under a separate contract, FSC administers the security lending program. The security lending fee is based on the number and duration of lending transactions.
Brokerage Commissions. The Fund placed a portion of its portfolio transactions with brokerage firms which are affiliates of the investment adviser. The commissions paid to these affiliated firms were $106,659 for the period.
7. Committed Line of Credit.
The Fund participates with other funds managed by FMR or an affiliate in a $4.25 billion credit facility (the "line of credit") to be utilized for temporary or emergency purposes to fund shareholder redemptions or for other short-term liquidity purposes. The Fund has agreed to pay commitment fees on its pro-rata portion of the line of credit, which amounted to $4,901 and is reflected in Miscellaneous expenses on the Statement of Operations. During the period, there were no borrowings on this line of credit.
8. Security Lending.
The Fund lends portfolio securities through a lending agent from time to time in order to earn additional income. For equity securities, a lending agent is used and may loan securities to certain qualified borrowers, including Fidelity Capital Markets (FCM), a broker-dealer affiliated with the Fund. On the settlement date of the loan, the Fund receives collateral (in the form of U.S. Treasury obligations, letters of credit and/or cash)
Annual Report
Notes to Financial Statements - continued
8. Security Lending - continued
against the loaned securities and maintains collateral in an amount not less than 100% of the market value of the loaned securities during the period of the loan. The market value of the loaned securities is determined at the close of business of the Fund and any additional required collateral is delivered to the Fund on the next business day. If the borrower defaults on its obligation to return the securities loaned because of insolvency or other reasons, a fund could experience delays and costs in recovering the securities loaned or in gaining access to the collateral. Any cash collateral received is invested in the Fidelity Securities Lending Cash Central Fund. The value of loaned securities and cash collateral at period end are disclosed on the Fund's Statement of Assets and Liabilities. The value of securities loaned to FCM at period end was $3,791,412. Security lending income represents the income earned on investing cash collateral, less rebates paid to borrowers and any lending agent fees associated with the loan, plus any premium payments received for lending certain types of securities. Security lending income is presented in the Statement of Operations as a component of income from Fidelity Central Funds, and includes $75,770 from securities loaned to FCM.
9. Expense Reductions.
Many of the brokers with whom FMR places trades on behalf of the Fund provided services to the Fund in addition to trade execution. These services included payments of certain expenses on behalf of the Fund totaling $174,463 for the period. In addition, through arrangements with the Fund's custodian, credits realized as a result of uninvested cash balances were used to reduce the Fund's expenses. During the period, these credits reduced the Fund's custody expenses by $222.
10. Distributions to Shareholders.
Distributions to shareholders of each class were as follows:
Years ended July 31, | 2012 | 2011 |
From net realized gain | | |
Class A | $ 1,262,924 | $ 40,130 |
Class T | 573,407 | - |
Class B | 101,910 | - |
Class C | 481,854 | - |
Small Cap Growth | 25,434,274 | 2,420,020 |
Class F | 6,152,820 | 492,928 |
Institutional Class | 792,240 | 60,177 |
Total | $ 34,799,429 | $ 3,013,255 |
Annual Report
11. Share Transactions.
Transactions for each class of shares were as follows:
| Shares | Dollars |
Years ended July 31, | 2012 | 2011 | 2012 | 2011 |
Class A | | | | |
Shares sold | 986,718 | 1,459,436 | $ 14,926,996 | $ 22,640,692 |
Reinvestment of distributions | 85,896 | 2,323 | 1,194,285 | 36,172 |
Shares redeemed | (1,407,222) | (1,364,690) | (21,375,353) | (20,977,078) |
Net increase (decrease) | (334,608) | 97,069 | $ (5,254,072) | $ 1,699,786 |
Class T | | | | |
Shares sold | 358,193 | 420,613 | $ 5,456,756 | $ 6,491,294 |
Reinvestment of distributions | 38,774 | - | 533,890 | - |
Shares redeemed | (523,310) | (434,512) | (7,812,853) | (6,714,256) |
Net increase (decrease) | (126,343) | (13,899) | $ (1,822,207) | $ (222,962) |
Class B | | | | |
Shares sold | 11,810 | 25,204 | $ 172,624 | $ 366,276 |
Reinvestment of distributions | 7,173 | - | 96,091 | - |
Shares redeemed | (81,516) | (109,118) | (1,196,288) | (1,597,390) |
Net increase (decrease) | (62,533) | (83,914) | $ (927,573) | $ (1,231,114) |
Class C | | | | |
Shares sold | 405,451 | 469,568 | $ 5,976,693 | $ 7,154,653 |
Reinvestment of distributions | 33,110 | - | 443,092 | - |
Shares redeemed | (384,855) | (368,398) | (5,527,477) | (5,494,248) |
Net increase (decrease) | 53,706 | 101,170 | $ 892,308 | $ 1,660,405 |
Small Cap Growth | | | | |
Shares sold | 14,552,522 | 19,971,507 | $ 226,496,807 | $ 315,167,556 |
Reinvestment of distributions | 1,774,167 | 153,921 | 25,022,882 | 2,384,001 |
Shares redeemed | (27,135,724) | (31,144,660) | (414,348,619) | (483,710,319) |
Net increase (decrease) | (10,809,035) | (11,019,232) | $ (162,828,930) | $ (166,158,762) |
Class F | | | | |
Shares sold | 16,430,240 | 11,382,202 | $ 255,874,632 | $ 176,012,143 |
Reinvestment of distributions | 432,802 | 31,816 | 6,152,820 | 492,928 |
Shares redeemed | (1,757,546) | (2,356,621) | (26,811,905) | (37,493,486) |
Net increase (decrease) | 15,105,496 | 9,057,397 | $ 235,215,547 | $ 139,011,585 |
Institutional Class | | | | |
Shares sold | 819,623 | 1,038,111 | $ 12,520,738 | $ 16,415,657 |
Reinvestment of distributions | 44,186 | 2,532 | 624,723 | 39,301 |
Shares redeemed | (1,078,752) | (555,221) | (16,617,897) | (8,700,391) |
Net increase (decrease) | (214,943) | 485,422 | $ (3,472,436) | $ 7,754,567 |
Annual Report
Notes to Financial Statements - continued
12. Other.
The Fund's organizational documents provide former and current trustees and officers with a limited indemnification against liabilities arising in connection with the performance of their duties to the Fund. In the normal course of business, the Fund may also enter into contracts that provide general indemnifications. The Fund's maximum exposure under these arrangements is unknown as this would be dependent on future claims that may be made against the Fund. The risk of material loss from such claims is considered remote.
At the end of the period, the Fidelity Advisor Freedom Funds, the Fidelity Freedom Funds and the Fidelity Freedom K Funds were the owners of record, in the aggregate, of approximately 60% of the total outstanding shares of the Fund.
Annual Report
To the Trustees of Fidelity Securities Fund and the Shareholders of Fidelity Small Cap Growth Fund:
In our opinion, the accompanying statement of assets and liabilities, including the schedule of investments, and the related statements of operations and of changes in net assets and the financial highlights present fairly, in all material respects, the financial position of Fidelity Small Cap Growth Fund (a fund of Fidelity Securities Fund) at July 31, 2012, the results of its operations for the year then ended, the changes in its net assets for each of the two years in the period then ended and the financial highlights for each of the periods indicated, in conformity with accounting principles generally accepted in the United States of America. These financial statements and financial highlights (hereafter referred to as "financial statements") are the responsibility of the Fidelity Small Cap Growth Fund's management. Our responsibility is to express an opinion on these financial statements based on our audits. We conducted our audits of these financial statements in accordance with the standards of the Public Company Accounting Oversight Board (United States). Those standards require that we plan and perform the audit to obtain reasonable assurance about whether the financial statements are free of material misstatement. An audit includes examining, on a test basis, evidence supporting the amounts and disclosures in the financial statements, assessing the accounting principles used and significant estimates made by management, and evaluating the overall financial statement presentation. We believe that our audits, which included confirmation of securities at July 31, 2012 by correspondence with the custodian brokers and transfer agent, provide a reasonable basis for our opinion.
PricewaterhouseCoopers LLP
Boston, Massachusetts
September 12, 2012
Annual Report
The Trustees, Members of the Advisory Board, and executive officers of the trust and fund, as applicable, are listed below. The Board of Trustees governs the fund and is responsible for protecting the interests of shareholders. The Trustees are experienced executives who meet periodically throughout the year to oversee the fund's activities, review contractual arrangements with companies that provide services to the fund, oversee management of the risks associated with such activities and contractual arrangements, and review the fund's performance. Except for James C. Curvey, each of the Trustees oversees 228 funds advised by FMR or an affiliate. Mr. Curvey oversees 435 funds advised by FMR or an affiliate.
The Trustees hold office without limit in time except that (a) any Trustee may resign; (b) any Trustee may be removed by written instrument, signed by at least two-thirds of the number of Trustees prior to such removal; (c) any Trustee who requests to be retired or who has become incapacitated by illness or injury may be retired by written instrument signed by a majority of the other Trustees; and (d) any Trustee may be removed at any special meeting of shareholders by a two-thirds vote of the outstanding voting securities of the trust. Each Trustee who is not an interested person (as defined in the 1940 Act) (Independent Trustee), shall retire not later than the last day of the calendar year in which his or her 75th birthday occurs. The Independent Trustees may waive this mandatory retirement age policy with respect to individual Trustees. The executive officers and Advisory Board Members hold office without limit in time, except that any officer and Advisory Board Member may resign or may be removed by a vote of a majority of the Trustees at any regular meeting or any special meeting of the Trustees. Except as indicated, each individual has held the office shown or other offices in the same company for the past five years.
Experience, Skills, Attributes, and Qualifications of the Fund's Trustees. The Governance and Nominating Committee has adopted a statement of policy that describes the experience, qualifications, attributes, and skills that are necessary and desirable for potential Independent Trustee candidates (Statement of Policy). The Board believes that each Trustee satisfied at the time he or she was initially elected or appointed a Trustee, and continues to satisfy, the standards contemplated by the Statement of Policy. The Governance and Nominating Committee also engages professional search firms to help identify potential Independent Trustee candidates who have the experience, qualifications, attributes, and skills consistent with the Statement of Policy. From time to time, additional criteria based on the composition and skills of the current Independent Trustees, as well as experience or skills that may be appropriate in light of future changes to board composition, business conditions, and regulatory or other developments, have also been considered by the professional search firms and the Governance and Nominating Committee. In addition, the Board takes into account the Trustees' commitment and participation in Board and committee meetings, as well as their leadership of standing and ad hoc committees throughout their tenure.
In determining that a particular Trustee was and continues to be qualified to serve as a Trustee, the Board has considered a variety of criteria, none of which, in isolation, was controlling. The Board believes that, collectively, the Trustees have balanced and diverse experience, qualifications, attributes, and skills, which allow the Board to operate effectively in governing the fund and protecting the interests of shareholders. Information about the specific experience, skills, attributes, and qualifications of each Trustee, which in each case led to the Board's conclusion that the Trustee should serve (or continue to serve) as a trustee of the fund, is provided below.
Annual Report
Board Structure and Oversight Function. James C. Curvey is an interested person (as defined in the 1940 Act) and currently serves as Chairman. The Trustees have determined that an interested Chairman is appropriate and benefits shareholders because an interested Chairman has a personal and professional stake in the quality and continuity of services provided to the fund. Independent Trustees exercise their informed business judgment to appoint an individual of their choosing to serve as Chairman, regardless of whether the Trustee happens to be independent or a member of management. The Independent Trustees have determined that they can act independently and effectively without having an Independent Trustee serve as Chairman and that a key structural component for assuring that they are in a position to do so is for the Independent Trustees to constitute a substantial majority for the Board. The Independent Trustees also regularly meet in executive session. Ned C. Lautenbach serves as Chairman of the Independent Trustees and as such (i) acts as a liaison between the Independent Trustees and management with respect to matters important to the Independent Trustees and (ii) with management prepares agendas for Board meetings.
Fidelity funds are overseen by different Boards of Trustees. The fund's Board oversees Fidelity's equity and high income funds and another Board oversees Fidelity's investment-grade bond, money market, and asset allocation funds. The asset allocation funds may invest in Fidelity funds overseen by the fund's Board. The use of separate Boards, each with its own committee structure, allows the Trustees of each group of Fidelity funds to focus on the unique issues of the funds they oversee, including common research, investment, and operational issues. On occasion, the separate Boards establish joint committees to address issues of overlapping consequences for the Fidelity funds overseen by each Board.
The Trustees operate using a system of committees to facilitate the timely and efficient consideration of all matters of importance to the Trustees, the fund, and fund shareholders and to facilitate compliance with legal and regulatory requirements and oversight of the fund's activities and associated risks. The Board, acting through its committees, has charged FMR and its affiliates with (i) identifying events or circumstances the occurrence of which could have demonstrably adverse effects on the fund's business and/or reputation; (ii) implementing processes and controls to lessen the possibility that such events or circumstances occur or to mitigate the effects of such events or circumstances if they do occur; and (iii) creating and maintaining a system designed to evaluate continuously business and market conditions in order to facilitate the identification and implementation processes described in (i) and (ii) above. Because the day-to-day operations and activities of the fund are carried out by or through FMR, its affiliates and other service providers, the fund's exposure to risks is mitigated but not eliminated by the processes overseen by the Trustees. While each of the Board's committees has responsibility for overseeing different aspects of the fund's activities, oversight is exercised primarily through the Operations, Audit, and Compliance Committees. In addition, the Independent Trustees have worked with FMR to enhance the Board's oversight of investment and financial risks, legal and regulatory risks, technology risks, and operational risks, including the development of additional risk reporting to the Board. For example, a working group comprised of Independent Trustees and FMR has worked and continues to work to review the Fidelity funds' valuation-related activities, reporting and risk management. Appropriate personnel, including but not limited to the fund's Chief Compliance Officer (CCO), FMR's internal auditor, the independent accountants, the fund's Treasurer and portfolio management personnel, make periodic reports to the Board's committees, as appropriate, including an annual review of FMR's risk management program for the Fidelity funds. The responsibilities of each standing committee, including their oversight responsibilities, are described further under "Standing Committees of the Fund's Trustees."
Annual Report
Trustees and Officers - continued
The fund's Statement of Additional Information (SAI) includes more information about the Trustees. To request a free copy, call Fidelity at 1-800-544-8544.
Interested Trustees*:
Correspondence intended for each Trustee who is an interested person may be sent to Fidelity Investments, 82 Devonshire Street, Boston, Massachusetts 02109.
Name, Age; Principal Occupations and Other Relevant Experience+ |
James C. Curvey (77) |
| Year of Election or Appointment: 2007 Mr. Curvey is Trustee and Chairman of the Board of Trustees of certain Trusts. Mr. Curvey also serves as Trustee (2007-present) of other investment companies advised by FMR. Mr. Curvey is a Director of Fidelity Investments Money Management, Inc. (2009-present), Director of Fidelity Research & Analysis Co. (2009-present) and Director of FMR and FMR Co., Inc. (2007-present). Mr. Curvey is also Vice Chairman (2007-present) and Director of FMR LLC. In addition, Mr. Curvey serves as an Overseer for the Boston Symphony Orchestra and a member of the Trustees of Villanova University. Previously, Mr. Curvey was the Vice Chairman (2006-2007) and Director (2000-2007) of FMR Corp. |
Ronald P. O'Hanley (55) |
| Year of Election or Appointment: 2011 Mr. O'Hanley is Director of FMR Co., Inc. (2010-present), Director of Fidelity Investments Money Management, Inc. (2010-present), Director of Fidelity Research & Analysis Company (2010-present), President of Fidelity Asset Management and Corporate Services and a member of Fidelity's Executive Committee (2010-present). Previously, Mr. O'Hanley served as President and Chief Executive Officer of BNY Mellon Asset Management (2007-2010). Mr. O'Hanley also served as Vice Chairman of Bank New York Mellon Corp. and a member of that firm's Executive Committee. Prior to the 2007 merger of The Bank of New York and Mellon Financial Corporation, he was Vice Chairman of Mellon Financial Corporation and President and Chief Executive Officer of Mellon Asset Management. He joined Mellon in February 1997. Mr. O'Hanley currently serves as Chairman of the Boston Public Library Foundation Board of Directors and sits on the Board of Directors of Beth Israel Deaconess Medical Center, the Board of Trustees of the Marine Biological Laboratory and the Advisory Board of the Maxwell School of Citizenship and Public Administration at Syracuse University. Mr. O'Hanley also chairs the Council on Asset Management for the Financial Services Roundtable and is a member of the Board of Directors of Institutional Investor's U.S. Institute. |
* Trustees have been determined to be "Interested Trustees" by virtue of, among other things, their affiliation with the trust or various entities under common control with FMR.
+ The information above includes each Trustee's principal occupation during the last five years and other information relating to the experience, attributes, and skills relevant to each Trustee's qualifications to serve as a Trustee, which led to the conclusion that each Trustee should serve as a Trustee for the fund.
Annual Report
Trustees and Officers - continued
Independent Trustees:
Correspondence intended for each Independent Trustee (that is, the Trustees other than the Interested Trustees) may be sent to Fidelity Investments, P.O. Box 55235, Boston, Massachusetts 02205-5235.
Name, Age; Principal Occupations and Other Relevant Experience+ |
Dennis J. Dirks (64) |
| Year of Election or Appointment: 2005 Prior to his retirement in May 2003, Mr. Dirks was Chief Operating Officer and a member of the Board of The Depository Trust & Clearing Corporation (DTCC). He also served as President, Chief Operating Officer, and Board member of The Depository Trust Company (DTC) and President and Board member of the National Securities Clearing Corporation (NSCC). In addition, Mr. Dirks served as Chief Executive Officer and Board member of the Government Securities Clearing Corporation, Chief Executive Officer and Board member of the Mortgage-Backed Securities Clearing Corporation, as a Trustee and a member of the Finance Committee of Manhattan College (2005-2008), and as a Trustee and a member of the Finance Committee of AHRC of Nassau County (2006-2008). Mr. Dirks is a member of the Independent Directors Council (IDC) Governing Council (2010-present) and Board of Directors for The Brookville Center for Children's Services, Inc. (2009-present). |
Alan J. Lacy (58) |
| Year of Election or Appointment: 2008 Mr. Lacy serves as Senior Adviser (2007-present) of Oak Hill Capital Partners, L.P. (private equity). Mr. Lacy also served as Chief Executive Officer (2000-2005) and Vice Chairman (2005-2006) of Sears Holdings Corporation and Sears, Roebuck and Co. (retail). In addition, Mr. Lacy serves as a member of the Board of Directors of Dave & Buster's Entertainment, Inc. (restaurant and entertainment complexes, 2010-present), Earth Fare, Inc. (retail grocery, 2012-present), The Hillman Companies, Inc. (hardware wholesalers, 2010-present), and Bristol-Myers Squibb Company (global pharmaceuticals, 2007-present). Mr. Lacy is a member of the Board of Trustees of The National Parks Conservation Association (2006-present). Previously, Mr. Lacy served as Chairman of the Board of Trustees of the National Parks Conservation Association (2008-2011) and as a member of the Board of Directors for the Western Union Company (global money transfer, 2006-2011). |
Ned C. Lautenbach (68) |
| Year of Election or Appointment: 2000 Mr. Lautenbach is Chairman of the Independent Trustees of the Equity and High Income Funds (2006-present). Mr. Lautenbach currently serves as the Lead Director of the Eaton Corporation Board of Directors (diversified industrial, 1997-present). Mr. Lautenbach is Chairman of the Board of Directors of the Philharmonic Center for the Arts in Naples, Florida (2012-present) and a member of the Council on Foreign Relations (1994-present). Previously, Mr. Lautenbach was a Partner/Advisory Partner at Clayton, Dubilier & Rice, LLC (private equity investment, 1998-2010), as well as a Director of Sony Corporation (2006-2007). |
Joseph Mauriello (67) |
| Year of Election or Appointment: 2008 Prior to his retirement in January 2006, Mr. Mauriello served in numerous senior management positions including Deputy Chairman and Chief Operating Officer (2004-2005), and Vice Chairman of Financial Services (2002-2004) of KPMG LLP US (professional services, 1965-2005). Mr. Mauriello currently serves as a member of the Board of Directors of XL Group plc. (global insurance and re-insurance, 2006-present). Previously, Mr. Mauriello served as a Director of the Hamilton Funds of the Bank of New York (2006-2007) and of Arcadia Resources Inc. (health care services and products, 2007-2012). |
Robert W. Selander (61) |
| Year of Election or Appointment: 2011 Previously, Mr. Selander served as a Member of the Advisory Board of Fidelity's Equity and High Income Funds (2011), Executive Vice Chairman (2010), Chief Executive Officer (2009-2010), and President and Chief Executive Officer (1997-2009) of Mastercard, Inc. |
Cornelia M. Small (68) |
| Year of Election or Appointment: 2005 Ms. Small is a member of the Board of Directors of the Teagle Foundation (2009-present). Ms. Small is also a member of the Investment Committee, and Chair (2008-present) and a member of the Board of Trustees of Smith College. In addition, Ms. Small serves on the Investment Committee of the Berkshire Taconic Community Foundation (2008-present). Previously, Ms. Small served as Chairperson of the Investment Committee (2002-2008) of Smith College. In addition, Ms. Small served as Chief Investment Officer, Director of Global Equity Investments, and a member of the Board of Directors of Scudder, Stevens & Clark and Scudder Kemper Investments. |
William S. Stavropoulos (73) |
| Year of Election or Appointment: 2002 Mr. Stavropoulos is Vice Chairman of the Independent Trustees of the Equity and High Income Funds (2006-present). Mr. Stavropoulos serves as President and Founder of the Michigan Baseball Foundation, the Great Lakes Loons (2007-present). Mr. Stavropoulos is Chairman Emeritus of the Board of Directors of The Dow Chemical Company, where he previously served in numerous senior management positions, including President, CEO (1995-2000; 2002-2004), Chairman of the Executive Committee (2000-2006), and as a member of the Board of Directors (1990-2006). Currently, Mr. Stavropoulos is Chairman of Univar (global distributor of commodity and specialty chemicals, 2010-present), a Director of Teradata Corporation (data warehousing and technology solutions, 2008-present), Chemical Financial Corporation, Maersk Inc. (industrial conglomerate), Tyco International, Inc. (multinational manufacturing and services, 2007-present), and a member of the Advisory Board for Metalmark Capital (private equity investment, 2005-present). Mr. Stavropoulos is a special advisor to Clayton, Dubilier & Rice, LLC (private equity investment). In addition, Mr. Stavropoulos is a member of the University of Notre Dame Advisory Council for the College of Science. |
David M. Thomas (63) |
| Year of Election or Appointment: 2008 Previously, Mr. Thomas served as Executive Chairman (2005-2006) and Chairman and Chief Executive Officer (2000-2005) of IMS Health, Inc. (pharmaceutical and healthcare information solutions). In addition, Mr. Thomas serves as a member of the Board of Directors of Fortune Brands, Inc. (consumer products), and Interpublic Group of Companies, Inc. (marketing communication, 2004-present). |
Michael E. Wiley (61) |
| Year of Election or Appointment: 2008 Mr. Wiley also serves as a Director of Asia Pacific Exploration Consolidated (international oil and gas exploration and production, 2008-present). Mr. Wiley serves as a Director of Tesoro Corporation (independent oil refiner and marketer, 2005-present), and a Director of Bill Barrett Corporation (exploration and production, 2005-present). In addition, Mr. Wiley also serves as a Director of Post Oak Bank (privately-held bank, 2004-present). Previously, Mr. Wiley served as a member of the Board of Trustees of the University of Tulsa (2000-2006; 2007-2010), as a Senior Energy Advisor of Katzenbach Partners, LLC (consulting, 2006-2007), as an Advisory Director of Riverstone Holdings (private investment), Chairman, President, and CEO of Baker Hughes, Inc. (oilfield services, 2000-2004), and as Director of Spinnaker Exploration Company (exploration and production, 2001-2005). |
Annual Report
+ The information above includes each Trustee's principal occupation during the last five years and other information relating to the experience, attributes, and skills relevant to each Trustee's qualifications to serve as a Trustee, which led to the conclusion that each Trustee should serve as a Trustee for the fund.
Advisory Board Members and Executive Officers:
Correspondence intended for David A. Rosow and Garnett A. Smith may be sent to Fidelity Investments, P.O. Box 55235, Boston, Massachusetts 02205-5235. Correspondence intended for each executive officer, Edward C. Johnson 3d, and Peter S. Lynch may be sent to Fidelity Investments, 82 Devonshire Street, Boston, Massachusetts 02109.
Name, Age; Principal Occupation |
Edward C. Johnson 3d (82) |
| Year of Election or Appointment: 2011 Member of the Advisory Board of Fidelity's Equity and High Income Funds. Mr. Johnson serves as Chief Executive Officer, Chairman, and a Director of FMR LLC, and also serves as Chairman and Director of FIL Limited. Previously, Mr. Johnson served as a Trustee and Chairman of the Board of certain Fidelity Trusts, Chairman and a Director of FMR, Chairman and a Director of FMR Co., Inc., and President of FMR LLC (2006-2007). |
Peter S. Lynch (68) |
| Year of Election or Appointment: 2003 Member of the Advisory Board of Fidelity's Equity and High Income Funds. Mr. Lynch is Vice Chairman and a Director of FMR and FMR Co., Inc. In addition, Mr. Lynch serves as a Trustee of Boston College and as the Chairman of the Inner-City Scholarship Fund. Previously, Mr. Lynch served on the Special Olympics International Board of Directors (1997-2006). |
David A. Rosow (69) |
| Year of Election or Appointment: 2012 Member of the Advisory Board of Fidelity's Equity and High Income Funds. Chairman and Chief Executive Officer of International Golf Group, Inc. (golf course development, 1990-present). Previously, Mr. Rosow served as Chairman and Chief Executive Officer of Rosow & Company, Inc. (private investment company, 1989-2011), a Lead Director of Hudson United Bancorp (2001-2006) and as a Director of TD Banknorth (1996-2006). In addition, Mr. Rosow is a member (2008-present) and President (2009-present) of the Town Council of Palm Beach, Florida. |
Garnett A. Smith (64) |
| Year of Election or Appointment: 2012 Member of the Advisory Board of Fidelity's Equity and High Income Funds. Prior to Mr. Smith's retirement, he served as Chairman and Chief Executive Officer of Inbrand Corp. (manufacturer of personal absorbent products, 1990-1997). He also served as President (1986-1990) of Inbrand Corp. Prior to his employment with Inbrand Corp., he was employed by a retail fabric chain and North Carolina National Bank. In addition, Mr. Smith is a board member of the Jackson Hole Land Trust (2009-present). |
Kenneth B. Robins (42) |
| Year of Election or Appointment: 2008 President and Treasurer of Fidelity's Equity and High Income Funds. Mr. Robins also serves as President and Treasurer (2010-present) and Assistant Treasurer (2009-present) of other Fidelity funds and is an employee of Fidelity Investments (2004-present). Previously, Mr. Robins served as Deputy Treasurer of the Fidelity funds (2005-2008) and Treasurer and Chief Financial Officer of The North Carolina Capital Management Trust: Cash and Term Portfolios (2006-2008). |
Brian B. Hogan (47) |
| Year of Election or Appointment: 2009 Vice President of Equity and High Income Funds. Mr. Hogan also serves as President of FMR's Equity Division (2009-present). Previously, Mr. Hogan served as Senior Vice President, Equity Research of FMR (2006-2009) and as a portfolio manager. |
Thomas C. Hense (48) |
| Year of Election or Appointment: 2008 or 2010 Vice President of Fidelity's High Income (2008), Small Cap (2008), and Value (2010) Funds. Previously, Mr. Hense served as a portfolio manager for Fidelity's Institutional Money Management Group (Pyramis) (2003-2008). |
Scott C. Goebel (44) |
| Year of Election or Appointment: 2008 Secretary and Chief Legal Officer (CLO) of the Fidelity funds. Mr. Goebel also serves as Secretary of Fidelity Investments Money Management, Inc. (FIMM) (2010-present) and Fidelity Research and Analysis Company (FRAC) (2010-present); Secretary and CLO of The North Carolina Capital Management Trust: Cash and Term Portfolios (2008-present); General Counsel, Secretary, and Senior Vice President of FMR (2008-present) and FMR Co., Inc. (2008-present); employed by FMR LLC or an affiliate (2001-present); Chief Legal Officer of Fidelity Management & Research (Hong Kong) Limited (2008-present) and Assistant Secretary of Fidelity Management & Research (Japan) Inc. (2008-present), and Fidelity Management & Research (U.K.) Inc. (2008-present). Previously, Mr. Goebel served as Assistant Secretary of FIMM (2008-2010), FRAC (2008-2010), and the Funds (2007-2008) and as Vice President and Secretary of Fidelity Distributors Corporation (FDC) (2005-2007). |
William C. Coffey (43) |
| Year of Election or Appointment: 2009 Assistant Secretary of Fidelity's Equity and High Income Funds. Mr. Coffey also serves as Senior Vice President and Deputy General Counsel of FMR LLC (2010-present), and is an employee of Fidelity Investments. Previously, Mr. Coffey served as Vice President and Associate General Counsel of FMR LLC (2005-2009). |
Elizabeth Paige Baumann (44) |
| Year of Election or Appointment: 2012 Anti-Money Laundering (AML) Officer of the Fidelity funds. Ms. Baumann also serves as AML Officer of The North Carolina Capital Management Trust: Cash and Term Portfolios (2012-present), Chief AML Officer of FMR LLC (2012-present), and is an employee of Fidelity Investments. Previously, Ms. Baumann served as Vice President and Deputy Anti-Money Laundering Officer (2007-2012). |
Christine Reynolds (53) |
| Year of Election or Appointment: 2008 Chief Financial Officer of the Fidelity funds. Ms. Reynolds became President of Fidelity Pricing and Cash Management Services (FPCMS) in August 2008. Ms. Reynolds served as Chief Operating Officer of FPCMS (2007-2008). Previously, Ms. Reynolds served as President, Treasurer, and Anti-Money Laundering officer of the Fidelity funds (2004-2007). |
Joseph A. Hanlon (44) |
| Year of Election or Appointment: 2012 Chief Compliance Officer of Fidelity's Equity and High Income Funds. Mr. Hanlon serves as Compliance Officer of FMR, FMR Co., Inc., Fidelity Investments Money Management, Inc. (FIMM), Fidelity Research and Analysis Company (FRAC), Fidelity Management & Research (Japan) Inc., Fidelity Management & Research (U.K.) Inc., Fidelity Management & Research (Hong Kong), and Strategic Advisers, Inc. (2009-present), as Senior Vice President of the Fidelity Asset Management Division (2009-present), and is an employee of Fidelity Investments. |
Joseph F. Zambello (55) |
| Year of Election or Appointment: 2011 Deputy Treasurer of the Fidelity funds. Mr. Zambello is an employee of Fidelity Investments. Previously, Mr. Zambello served as Vice Presidentof FMR's Program Management Group (2009-2011) and Vice President of the Transfer Agent Oversight Group (2005-2009). |
Adrien E. Deberghes (44) |
| Year of Election or Appointment: 2008 Deputy Treasurer of Fidelity's Equity and High Income Funds. Mr. Deberghes also serves as Vice President (2011-present) and Assistant Treasurer (2010-present) of other Fidelity funds, and is an employee of Fidelity Investments (2008-present). Previously, Mr. Deberghes served as Senior Vice President of Mutual Fund Administration at State Street Corporation (2007-2008), Senior Director of Mutual Fund Administration at Investors Bank & Trust (2005-2007), and Director of Finance for Dunkin' Brands (2000-2005). |
Stephanie J. Dorsey (43) |
| Year of Election or Appointment: 2010 Assistant Treasurer of Fidelity's Equity and High Income Funds. Ms. Dorsey also serves as Deputy Treasurer of other Fidelity funds (2008-present) and is an employee of Fidelity Investments (2008-present). Previously, Ms. Dorsey served as Treasurer (2004-2008) of the JPMorgan Mutual Funds and Vice President (2004-2008) of JPMorgan Chase Bank. |
John R. Hebble (54) |
| Year of Election or Appointment: 2009 Assistant Treasurer of Fidelity's Equity and High Income Funds. Mr. Hebble also serves as President (2011-present), Treasurer, and Chief Financial Officer of The North Carolina Capital Management Trust: Cash and Term Portfolios (2008-present), President and Treasurer of other Fidelity funds (2008-present) and is an employee of Fidelity Investments. |
Gary W. Ryan (53) |
| Year of Election or Appointment: 2005 Assistant Treasurer of the Fidelity funds. Mr. Ryan is an employee of Fidelity Investments. Previously, Mr. Ryan served as Vice President of Fund Reporting in Fidelity Pricing and Cash Management Services (FPCMS) (1999-2005). |
Jonathan Davis (44) |
| Year of Election or Appointment: 2010 Assistant Treasurer of the Fidelity funds. Mr. Davis is also Assistant Treasurer of Fidelity Rutland Square Trust II and Fidelity Commonwealth Trust II. Mr. Davis is an employee of Fidelity Investments. Previously, Mr. Davis served as Vice President and Associate General Counsel of FMR LLC (2003-2010). |
Annual Report
The Board of Trustees of Fidelity Small Cap Growth Fund voted to pay on September 10, 2012, to shareholders of record at the opening of business on September 7, 2012, a distribution of $0.582 per share derived from capital gains realized from sales of portfolio securities.
The fund hereby designates as a capital gain dividend with respect to the taxable year ended July 31,2012, $80,163,961, or, if subsequently determined to be different, the net capital gain of such year.
The fund will notify shareholders in January 2013 of amounts for use in preparing 2012 income tax returns.
Annual Report
Board Approval of Investment Advisory Contracts and Management Fees
Fidelity Small Cap Growth Fund
Each year, the Board of Trustees, including the Independent Trustees (together, the Board), votes on the renewal of the management contract and sub-advisory agreements (together, the Advisory Contracts) for the fund. The Board, assisted by the advice of fund counsel and Independent Trustees' counsel, requests and considers a broad range of information relevant to the renewal of the Advisory Contracts throughout the year.
The Board meets regularly and, at each of its meetings, considers factors that are relevant to its annual consideration of the renewal of the fund's Advisory Contracts, including the services and support provided to the fund and its shareholders. The Board has established various standing committees, each composed of and chaired by Independent Trustees with varying backgrounds, to which the Board has assigned specific subject matter responsibilities in order to enhance effective decision-making by the Board. The Board, acting directly and through its Committees, requests and receives information concerning the annual consideration of the renewal of the fund's Advisory Contracts. The Board also meets as needed to consider matters specifically related to the Board's annual consideration of the renewal of Advisory Contracts. Members of the Board may also meet with trustees of other Fidelity funds through ad hoc joint committees to discuss certain matters relevant to the Fidelity funds.
At its July 2012 meeting, the Board of Trustees, including the Independent Trustees, unanimously determined to renew the fund's Advisory Contracts. In reaching its determination, the Board considered all factors it believed relevant, including (i) the nature, extent, and quality of the services to be provided to the fund and its shareholders (including the investment performance of the fund); (ii) the competitiveness of the fund's management fee and total expense ratio relative to peer funds; (iii) the total costs of the services to be provided by and the profits to be realized by Fidelity from its relationship with the fund; (iv) the extent to which economies of scale exist and would be realized as the fund grows; and (v) whether fee levels reflect these economies of scale, if any, for the benefit of fund shareholders.
In considering whether to renew the Advisory Contracts for the fund, the Board reached a determination, with the assistance of fund counsel and Independent Trustees' counsel and through the exercise of its business judgment, that the renewal of the Advisory Contracts is in the best interests of the fund and its shareholders and that the compensation payable under the Advisory Contracts is fair and reasonable. The Board's decision to renew the Advisory Contracts was not based on any single factor, but rather was based on a comprehensive consideration of all the information provided to the Board at its meetings throughout the year. The Board, in reaching its determination to renew the Advisory Contracts, is aware that shareholders in the fund have a broad range of investment choices available to them, including a wide choice among mutual funds offered by Fidelity's competitors, and that the fund's shareholders, who have the opportunity to review and weigh the disclosure provided by the fund in its prospectus and other public disclosures, have chosen to invest in this fund, managed by Fidelity.
Annual Report
Board Approval of Investment Advisory Contracts and
Management Fees - continued
Nature, Extent, and Quality of Services Provided. The Board considered the staffing within the investment adviser, FMR, and the sub-advisers (together, the Investment Advisers), including the backgrounds of the fund's investment personnel, and also considered the fund's investment objective, strategies, and related investment philosophy. The Independent Trustees also had discussions with senior management of Fidelity's investment operations and investment groups. The Board considered the structure of the portfolio manager compensation program and whether this structure provides appropriate incentives to act in the best interests of the fund.
Resources Dedicated to Investment Management and Support Services. The Board and the Fund Oversight and Research Committees reviewed the general qualifications and capabilities of the Investment Advisers' investment staff, including its size, education, experience, and resources, as well as the Investment Advisers' approach to recruiting, training, managing, and compensating investment personnel. The Board also noted that FMR has continued to increase the resources devoted to non-U.S. offices, including expansion of Fidelity's global investment organization. The Board noted that Fidelity's analysts have extensive resources, tools and capabilities that allow them to conduct sophisticated quantitative and fundamental analysis, as well as credit analysis of issuers, counterparties and guarantors. The Board also believes that Fidelity's investment professionals have sufficient access to global information and data so as to provide competitive investment results over time, and that those professionals also have access to sophisticated tools that permit them to assess portfolio construction and risk and performance attribution characteristics continuously, as well as to transmit new information and research conclusions rapidly around the world. Additionally, in its deliberations, the Board considered the Investment Advisers' trading and risk management capabilities and resources, which are an integral part of the investment management process.
Shareholder and Administrative Services. The Board considered (i) the nature, extent, quality, and cost of advisory, administrative, and shareholder services performed by the Investment Advisers and their affiliates under the Advisory Contracts and under separate agreements covering transfer agency, pricing and bookkeeping, and securities lending services for the fund; (ii) the nature and extent of the supervision of third party service providers, principally custodians and subcustodians; and (iii) the resources devoted to, and the record of compliance with, the fund's compliance policies and procedures. The Board also reviewed the allocation of fund brokerage, including allocations to brokers affiliated with the Investment Advisers, the use of brokerage commissions to pay fund expenses, and the use of "soft" commission dollars to pay for research services.
Annual Report
The Board noted that the growth of fund assets over time across the complex allows Fidelity to reinvest in the development of services designed to enhance the value or convenience of the Fidelity funds as investment vehicles. These services include 24-hour access to account information and market information through telephone representatives and over the Internet, investor education materials and asset allocation tools, and the expanded availability of Fidelity Investor Centers.
Investment in a Large Fund Family. The Board considered the benefits to shareholders of investing in a Fidelity fund, including the benefits of investing in a fund that is part of a large family of funds offering a variety of investment disciplines and providing a large variety of mutual fund investor services. The Board noted that Fidelity had taken, or had made recommendations that resulted in the Fidelity funds taking, a number of actions over the previous year that benefited particular funds, including (i) continuing to dedicate additional resources to investment research and support of the senior management team that oversees asset management; (ii) persisting in efforts to enhance Fidelity's research capabilities, in particular, international research; (iii) launching new funds and making other enhancements to meet client needs for global and income-oriented solutions; (iv) continuing to launch dedicated lower cost underlying funds to meet investment management's portfolio construction needs related to expanding underlying fund options, specifically for the Freedom Fund product lines; (v) adopting a "Stock Selector" sector neutral investment approach and employing a team of portfolio managers who are sector specialists to manage certain funds; (vi) rationalizing product lines and gaining increased efficiencies through the mergers of several funds into other funds; (vii) strengthening the Spartan Index Fund product line by adding new funds and/or new low-cost institutional share classes, restructuring fund expenses to accommodate new classes, and reducing investment minimums for certain classes of shares; (viii) modifying the eligibility criteria for Institutional Class shares to increase their appeal to government entities and charitable investors; and (ix) reducing certain transfer agent fee rates.
Investment Performance. The Board considered whether the fund has operated in accordance with its investment objective, as well as its record of compliance with its investment restrictions. It also reviewed the fund's absolute investment performance for each class, as well as the fund's relative investment performance for each class measured over multiple periods against (i) a broad-based securities market index, and (ii) a peer group of mutual funds deemed appropriate by Fidelity and reviewed by the Board. The following charts considered by the Board show, over the one-, three-, and five-year periods ended December 31, 2011, the cumulative total returns of Institutional Class (Class I) and Class B of the fund, the cumulative total returns of a broad-based securities market index ("benchmark"), and a range of cumulative total returns of a peer group of mutual funds identified by Morningstar, Inc. as having an investment style similar to that of the fund based on underlying portfolio holdings. The returns of Institutional Class (Class I) and Class B show the performance of the highest and lowest performing classes, respectively (based on five-year performance). The box within each chart shows the 25th percentile return (top of box) and the 75th percentile return (bottom of box) of the peer group. Returns shown above the box are in the first quartile and returns shown below the box are in the fourth quartile. The percentage beaten numbers noted below each chart correspond to the percentile box and represent the percentage of funds in the peer group whose performance was equal to or lower than that of the class indicated.
Annual Report
Board Approval of Investment Advisory Contracts and
Management Fees - continued
Fidelity Small Cap Growth Fund
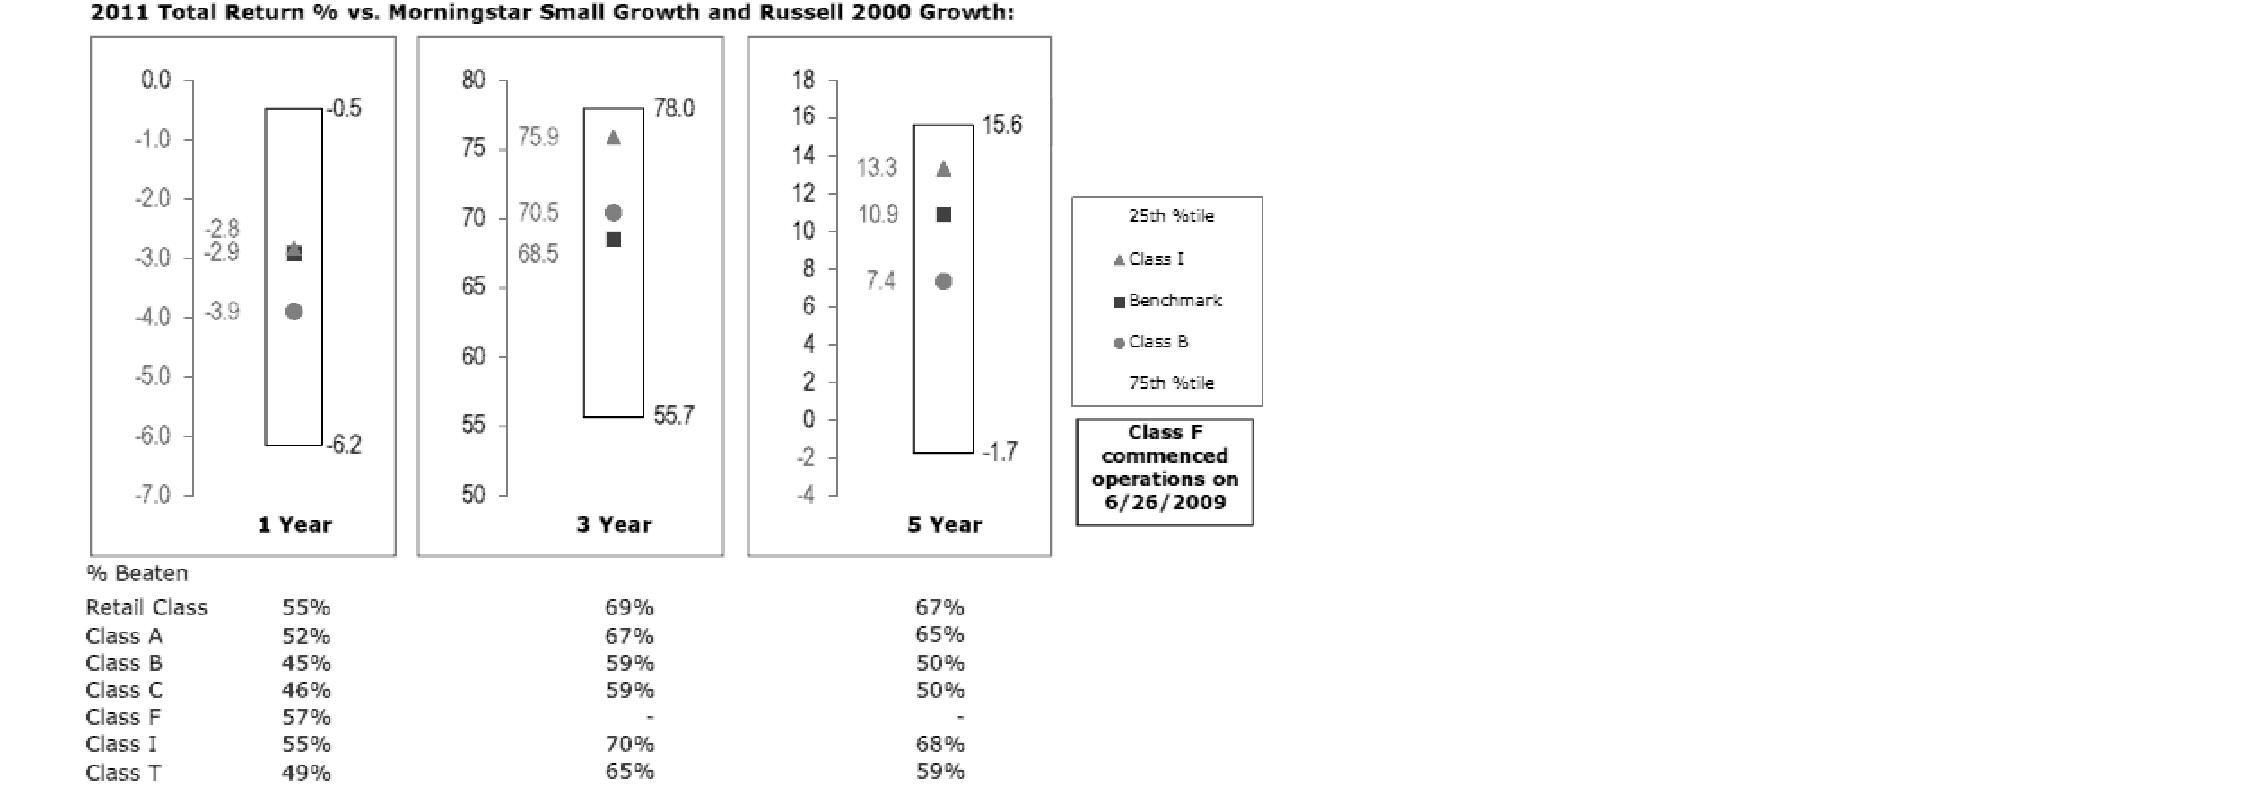
The Board reviewed the fund's relative investment performance against its peer group and noted that the performance of Institutional Class (Class I) of the fund was in the second quartile for all the periods shown. The Board also noted that the investment performance of Institutional Class (Class I) of the fund compared favorably to its benchmark for all the periods shown. The Board considered that the variations in performance among the fund's classes reflect the variations in class expenses, which result in lower performance for higher expense classes. The Board noted that there was a portfolio management change for the fund in November 2011. The Board also reviewed the fund's performance since inception as well as performance in the current year.
The Board also considered that the fund's management fee is subject to upward or downward adjustment depending upon whether, and to what extent, the fund's investment performance for the performance period exceeds, or is exceeded by, the record (over the same period) of a Board-approved performance adjustment index. The Board noted that the performance adjustment provides FMR with a strong economic incentive to seek to achieve superior performance for the fund's shareholders and helps to more closely align the interests of FMR and the fund's shareholders.
Annual Report
Based on its review, the Board concluded that the nature, extent, and quality of services provided to the fund under the Advisory Contracts should benefit the fund's shareholders.
Competitiveness of Management Fee and Total Expense Ratio. The Board considered the fund's management fee and total expense ratio compared to "mapped groups" of competitive funds and classes. Fidelity creates "mapped groups" by combining similar Lipper investment objective categories that have comparable management fee characteristics. Combining Lipper investment objective categories aids the Board's management fee and total expense ratio comparisons by broadening the competitive group used for comparison and by reducing the number of universes to which various Fidelity funds are compared.
Management Fee. The Board considered two proprietary management fee comparisons for the 12-month periods shown in the chart below. The group of Lipper funds used by the Board for management fee comparisons is referred to below as the "Total Mapped Group." The Total Mapped Group comparison focuses on a fund's standing relative to the total universe of comparable funds available to investors in terms of gross management fees before expense reimbursements or caps, and without giving effect to the fund's performance adjustment. "TMG %" represents the percentage of funds in the Total Mapped Group that had management fees that were lower than the fund's. For example, a TMG % of 13% means that 87% of the funds in the Total Mapped Group had higher management fees than the fund. The "Asset-Size Peer Group" (ASPG) comparison focuses on a fund's standing relative to non-Fidelity funds similar in size to the fund within the Total Mapped Group. The ASPG represents at least 15% of the funds in the Total Mapped Group with comparable asset size and management fee characteristics, subject to a minimum of 50 funds (or all funds in the Total Mapped Group if fewer than 50). Additional information, such as the ASPG quartile in which the fund's management fee ranked and the impact of the fund's performance adjustment, is also included in the chart and considered by the Board.
Annual Report
Board Approval of Investment Advisory Contracts and
Management Fees - continued
Fidelity Small Cap Growth Fund

The Board noted that the fund's management fee ranked below the median of its Total Mapped Group and below the median of its ASPG for 2011. The Board also noted the effect of the fund's performance adjustment on the fund's management fee ranking. The Board noted that the performance adjustment for each year represents calculations for performance periods that differ from the periods shown in the performance charts above.
Based on its review, the Board concluded that the fund's management fee is fair and reasonable in light of the services that the fund receives and the other factors considered.
Total Expense Ratio. In its review of each class's total expense ratio, the Board considered the fund's management fee as well as other fund or class expenses, as applicable, such as transfer agent fees, pricing and bookkeeping fees, fund-paid 12b-1 fees, and custodial, legal, and audit fees. The Board also noted the effects of any waivers and reimbursements on fees and expenses, as well as the impact of the fund's performance adjustment. As part of its review, the Board also considered the current and historical total expense ratios of each class of the fund compared to competitive fund median expenses. Each class of the fund is compared to those funds and classes in the Total Mapped Group (used by the Board for management fee comparisons) that have a similar sales load structure.
The Board noted that the total expense ratio of each of Class A, Class B, Class C, Institutional Class, the retail class, and Class F ranked below its competitive median for 2011 and the total expense ratio of Class T ranked above its competitive median for 2011. The Board considered that various factors, including 12b-1 fees, positive or negative performance adjustments, and relatively higher other expenses in the case of small fund size, can affect total expense ratios. The Board noted that the total expense ratio of Class T was above the competitive median primarily because of higher 12b-1 fees on Class T. Class T has a higher 12b-1 fee, but a lower front-end sales charge, than traditionally priced front-end sales charge classes. The Board considered that Class T is primarily sold load-waived in the retirement plan market where its 0.50% 12b-1 fee is comparable to competing no-load, higher 12b-1 fee classes designed specifically for retirement plans. The Board noted that the fund offers multiple classes, each of which has a different sales load and 12b-1 fee structure, and that the multiple structures are intended to offer a range of pricing options for the intermediary market. The Board also noted that the total expense ratios of the classes vary primarily by the level of their 12b-1 fees, although differences in transfer agent fees may also cause expenses to vary from class to class.
Annual Report
Fees Charged to Other Fidelity Clients. The Board also considered Fidelity fee structures and other information with respect to clients of FMR and its affiliates, such as other mutual funds advised or subadvised by FMR or its affiliates, pension plan clients, and other institutional clients. The Board noted the findings of the 2010 ad hoc joint committee (created with the board of other Fidelity funds), which reviewed and compared Fidelity's institutional investment advisory business with its business of providing services to the Fidelity funds, including the differences in services provided, fees charged, and costs incurred, as well as competition in their respective marketplaces.
Based on its review of total expense ratios and fees charged to other Fidelity clients, the Board concluded that the total expense ratio of each class of the fund was reasonable, although Class T was above the median of the universe presented for comparison, in light of the services that the fund and its shareholders receive and the other factors considered.
Costs of the Services and Profitability. The Board considered the revenues earned and the expenses incurred by Fidelity in conducting the business of developing, marketing, distributing, managing, administering and servicing the fund and its shareholders. The Board also considered the level of Fidelity's profits in respect of all the Fidelity funds.
On an annual basis, FMR presents to the Board Fidelity's profitability for the fund. Fidelity calculates the profitability for each fund, as well as aggregate profitability for groups of Fidelity funds and all Fidelity funds, using a series of detailed revenue and cost allocation methodologies which originate with the books and records of Fidelity on which Fidelity's audited financial statements are based. The Audit Committee of the Board reviews any significant changes from the prior year's methodologies.
PricewaterhouseCoopers LLP (PwC), independent registered public accounting firm and auditor to Fidelity and certain Fidelity funds, has been engaged annually by the Board as part of the Board's assessment of Fidelity's profitability analysis. PwC's engagement includes the review and assessment of Fidelity's methodologies used in determining the revenues and expenses attributable to Fidelity's mutual fund business, and completion of agreed-upon procedures surrounding the mathematical accuracy of fund profitability and its conformity to allocation methodologies. After considering PwC's reports issued under the engagement and information provided by Fidelity, the Board concluded that while other allocation methods may also be reasonable, Fidelity's profitability methodologies are reasonable in all material respects.
Annual Report
Board Approval of Investment Advisory Contracts and
Management Fees - continued
The Board also reviewed Fidelity's non-fund businesses and fall-out benefits related to the mutual fund business as well as cases where Fidelity's affiliates may benefit from or be related to the fund's business.
The Board considered the costs of the services provided by and the profits realized by Fidelity in connection with the operation of the fund and was satisfied that the profitability was not excessive in the circumstances.
Economies of Scale. The Board considered whether there have been economies of scale in respect of the management of the Fidelity funds, whether the Fidelity funds (including the fund) have appropriately benefited from any such economies of scale, and whether there is potential for realization of any further economies of scale. The Board considered the extent to which the fund will benefit from economies of scale through increased services to the fund, through waivers or reimbursements, or through fee or expense reductions. The Board also noted that in 2009, it and the board of other Fidelity funds created an ad hoc committee (the Economies of Scale Committee) to analyze whether FMR attains economies of scale in respect of the management and servicing of the Fidelity funds, whether the Fidelity funds have appropriately benefited from such economies of scale, and whether there is potential for realization of any further economies of scale.
The Board recognized that the fund's management contract incorporates a "group fee" structure, which provides for lower group fee rates as total fund assets under FMR's management increase, and for higher group fee rates as total fund assets under FMR's management decrease. FMR calculates the group fee rates based on a tiered asset "breakpoint" schedule that varies based on asset class. The Board considered that the group fee is designed to deliver the benefits of economies of scale to fund shareholders when total Fidelity fund assets increase, even if assets of any particular fund are unchanged or have declined, because some portion of Fidelity's costs are attributable to services provided to all Fidelity funds, and all funds benefit if those costs can be allocated among more assets. The Board concluded that, given the group fee structure, fund shareholders will benefit from lower management fees as assets under FMR's management increase at the fund complex level, regardless of whether Fidelity achieves any such economies of scale.
Annual Report
The Board concluded, taking into account the analysis of the Economies of Scale Committee, that economies of scale, if any, are being appropriately shared between fund shareholders and Fidelity.
Additional Information Requested by the Board. In order to develop fully the factual basis for consideration of the Fidelity funds' Advisory Contracts, the Board requested and received additional information on certain topics, including (i) fund performance trends, actions to be taken by FMR to improve certain funds' overall performance, and Fidelity's long-term strategies for certain funds; (ii) the potential to further rationalize the Fidelity fund lineup with the possibility of achieving savings for the funds and Fidelity; (iii) Fidelity's compensation structure for portfolio managers and other key investment personnel; (iv) the amount of the investment that each portfolio manager has made in the Fidelity fund(s) that he or she manages; (v) the realization of fall-out benefits in certain Fidelity business units; (vi) Fidelity's group fee structures, the potential impact of regulatory changes on such structures, and the rationale for the individual fee rates of certain funds; (vii) fund profitability methodology, including Fidelity's cost allocation methodology, and the impact of certain factors on fund profitability results; (viii) trends regarding industry use of performance fee structures and the possibility of implementing performance fee structures for additional funds; and (ix) the impact of net redemptions from the Fidelity funds.
Based on its evaluation of all of the conclusions noted above, and after considering all factors it believed relevant, the Board ultimately concluded that the advisory fee structures are fair and reasonable, and that the fund's Advisory Contracts should be renewed.
Annual Report
Investment Adviser
Fidelity Management & Research Company
Boston, MA
Investment Sub-Advisers
FMR Co., Inc.
Fidelity Management & Research
(U.K.) Inc.
Fidelity Management & Research
(Hong Kong) Limited
Fidelity Management & Research
(Japan) Inc.
General Distributor
Fidelity Distributors Corporation
Smithfield, RI
Transfer and Service Agents
Fidelity Investments Institutional
Operations Company, Inc.
Boston, MA
Fidelity Service Company, Inc.
Boston, MA
Custodian
Citibank, N.A.
New York, NY
The Fidelity Telephone Connection
Mutual Fund 24-Hour Service
Exchanges/Redemptions
and Account Assistance 1-800-544-6666
Product Information 1-800-544-6666
Retirement Accounts 1-800-544-4774
(8 a.m. - 9 p.m.)
TDD Service 1-800-544-0118
for the deaf and hearing impaired
(9 a.m. - 9 p.m. Eastern time)
Fidelity Automated Service
Telephone (FAST®)
1-800-544-5555
Automated line for quickest service
(Fidelity Investment logo)(registered trademark)
Corporate Headquarters
82 Devonshire St., Boston, MA 02109
www.fidelity.com
SCP-UANN-0912
1.803694.107
Fidelity®
Small Cap Growth
Fund
Class F
Annual Report
July 31, 2012
(Fidelity Cover Art)
Contents
Performance | (Click Here) | How the fund has done over time. |
Management's Discussion of Fund Performance | (Click Here) | The Portfolio Manager's review of fund performance and strategy. |
Shareholder Expense Example | (Click Here) | An example of shareholder expenses. |
Investment Changes | (Click Here) | A summary of major shifts in the fund's investments over the past six months. |
Investments | (Click Here) | A complete list of the fund's investments with their market values. |
Financial Statements | (Click Here) | Statements of assets and liabilities, operations, and changes in net assets, as well as financial highlights. |
Notes | (Click Here) | Notes to the financial statements. |
Report of Independent Registered Public Accounting Firm | (Click Here) | |
Trustees and Officers | (Click Here) | |
Distributions | (Click Here) | |
Board Approval of Investment Advisory Contracts and Management Fees | (Click Here) | |
To view a fund's proxy voting guidelines and proxy voting record for the 12-month period ended June 30, visit http://www.fidelity.com/proxyvotingresults or visit the Securities and Exchange Commission's (SEC) web site at http://www.sec.gov. You may also call 1-800-835-5092 to request a free copy of the proxy voting guidelines.
Standard & Poor's, S&P and S&P 500 are registered service marks of The McGraw-Hill Companies, Inc. and have been licensed for use by Fidelity Distributors Corporation.
Other third party marks appearing herein are the property of their respective owners.
All other marks appearing herein are registered or unregistered trademarks or service marks of FMR LLC or an affiliated company. © 2012 FMR LLC. All rights reserved.
Annual Report
p20
This report and the financial statements contained herein are submitted for the general information of the shareholders of the fund. This report is not authorized for distribution to prospective investors in the fund unless preceded or accompanied by an effective prospectus.
A fund files its complete schedule of portfolio holdings with the SEC for the first and third quarters of each fiscal year on Form N-Q. Forms N-Q are available on the SEC's web site at http://www.sec.gov. A fund's Forms N-Q may be reviewed and copied at the SEC's Public Reference Room in Washington, DC. Information regarding the operation of the SEC's Public Reference Room may be obtained by calling 1-800-SEC-0330. For a complete list of a fund's portfolio holdings, view the fund's most recent holdings listing, semiannual report, or annual report on Fidelity's web site at http://www.fidelity.com, http://www.advisor.fidelity.com, or http://www.401k.com, as applicable.
NOT FDIC INSURED • MAY LOSE VALUE • NO BANK GUARANTEE
Neither the fund nor Fidelity Distributors Corporation is a bank.
Annual Report
Average annual total return reflects the change in the value of an investment, assuming reinvestment of the class' distributions from dividend income and capital gains (the profits earned upon the sale of securities that have grown in value, if any) and assuming a constant rate of performance each year. The $10,000 table and the fund's returns do not reflect the deduction of taxes that a shareholder would pay on fund distributions or the redemption of fund shares. During periods of reimbursement by Fidelity, a fund's total return will be greater than it would be had the reimbursement not occurred. How a fund did yesterday is no guarantee of how it will do tomorrow.
Average Annual Total Returns
Periods ended July 31, 2012 | | Past 1
year | Past 5
years | Life of
fund A |
Class F B | | -0.64% | 2.00% | 8.05% |
A From November 3, 2004.
B The initial offering of Class F shares took place on June 26, 2009. Returns prior to June 26, 2009 are those of Fidelity® Small Cap Growth Fund, the original class of the fund.
$10,000 Over Life of Fund
Let's say hypothetically that $10,000 was invested in Fidelity® Small Cap Growth Fund - Class F on November 3, 2004, when the fund started. The chart shows how the value of your investment would have changed, and also shows how the Russell 2000® Growth Index performed over the same period. The initial offering of Class F took place on June 26, 2009. See above for additional information regarding the performance of Class F.
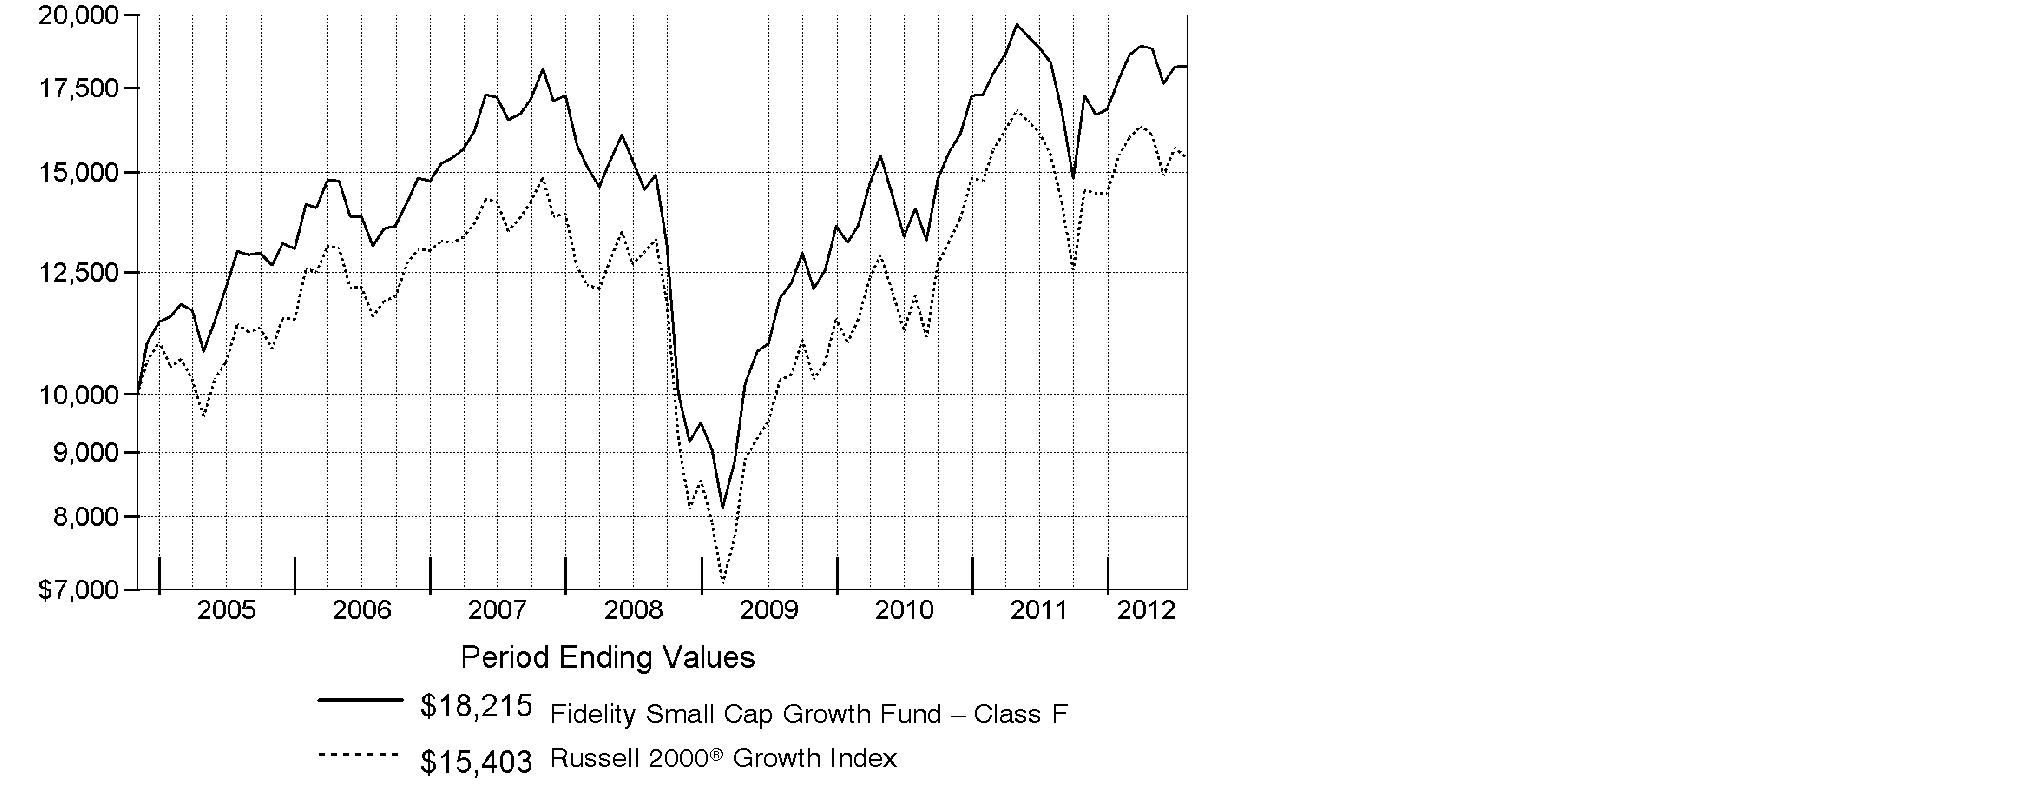
Annual Report
Market Recap: Major U.S. equity benchmarks posted solid gains for the year ending July 31, 2012, amid an uncertain investment environment. The broad-based S&P 500® Index returned 9.13%, while the blue-chip-laden Dow Jones Industrial AverageSM and technology-heavy Nasdaq Composite® Index gained 10.12% and 7.83%, respectively. Volatility spiked during the period's first half, as equities plummeted late last summer on Europe's debt woes, political wrangling over the U.S. debt ceiling and the sovereign credit-rating downgrade that followed. By October, a seemingly improved U.S. economy rejuvenated stocks, paving the way for major equity benchmarks to post their best first-quarter performance since 1998. However, more eurozone trouble, signs that the U.S. economy had turned sluggish and a slowdown in China caused stocks to slip in May, before a new wave of optimism took hold in June and July. Within the S&P 500®, more-defensive sectors such as telecommunication services (+30%) and consumer staples (+20%) fared best, while materials and energy significantly underperformed, returning -5%. Small- and mid-cap stocks trailed their less-volatile large-cap counterparts, with the Russell 2000® Index adding 0.19% and the Russell Midcap® Index rising 2.28%. Given turmoil and local currency weakness in Europe, foreign developed-markets stocks lost ground, with the MSCI® EAFE® Index returning -11.32%.
Comments from Patrick Venanzi, who became Portfolio Manager of Fidelity® Small Cap Growth Fund on November 17, 2011: For the year, the fund's Class F shares returned -0.64%, slightly lagging the Russell 2000® Growth Index, which returned -0.51%. Poor positioning in health care was the main reason for the underperformance, with picks and an underweighting in the pharmaceuticals/biotechnology/life science industry particularly challenging. My choices within the software/services, health care equipment/services and automobiles/components industries also were letdowns. Our foreign holdings hurt overall, due in part to a stronger U.S. dollar. Individually, the biggest blow came from Polycom, a video and voice conferencing company, while Sohu.com, China's largest Internet company, and untimely ownership of medical device company Integra LifeSciences Holdings also hurt. Polycom, Sohu.com and Integra were not held at period end. Conversely, picks within industrials, tech hardware/equipment and materials were additive. At the stock level, specialty retailer Sally Beauty Holdings and Canadian discount store operator Dollarama were winners, as was a position in biopharmaceutical firm Amylin Pharmaceuticals. All of the names mentioned, except Integra, were not in the benchmark.
The views expressed above reflect those of the portfolio manager(s) only through the end of the period as stated on the cover of this report and do not necessarily represent the views of Fidelity or any other person in the Fidelity organization. Any such views are subject to change at any time based upon market or other conditions and Fidelity disclaims any responsibility to update such views. These views may not be relied on as investment advice and, because investment decisions for a Fidelity fund are based on numerous factors, may not be relied on as an indication of trading intent on behalf of any Fidelity fund.
Annual Report
Shareholder Expense Example
As a shareholder of the Fund, you incur two types of costs: (1) transaction costs, including sales charges (loads) on purchase payments or redemption proceeds, redemption fees and (2) ongoing costs, including management fees, distribution and/or service (12b-1) fees and other Fund expenses. This Example is intended to help you understand your ongoing costs (in dollars) of investing in the Fund and to compare these costs with the ongoing costs of investing in other mutual funds.
The Example is based on an investment of $1,000 invested at the beginning of the period and held for the entire period (February 1, 2012 to July 31, 2012).
Actual Expenses
The first line of the accompanying table for each class of the Fund provides information about actual account values and actual expenses. You may use the information in this line, together with the amount you invested, to estimate the expenses that you paid over the period. Simply divide your account value by $1,000.00 (for example, an $8,600 account value divided by $1,000.00 = 8.6), then multiply the result by the number in the first line for a class of the Fund under the heading entitled "Expenses Paid During Period" to estimate the expenses you paid on your account during this period. A small balance maintenance fee of $12.00 that is charged once a year may apply for certain accounts with a value of less than $2,000. This fee is not included in the table below. If it was, the estimate of expenses you paid during the period would be higher, and your ending account value lower, by this amount. In addition, the Fund, as a shareholder in the underlying Fidelity Central Funds, will indirectly bear its pro-rata share of the fees and expenses incurred by the underlying Fidelity Central Funds. These fees and expenses are not included in the Fund's annualized expense ratio used to calculate the expense estimate in the table below.
Hypothetical Example for Comparison Purposes
The second line of the accompanying table for each class of the Fund provides information about hypothetical account values and hypothetical expenses based on a Class' actual expense ratio and an assumed rate of return of 5% per year before expenses, which is not the Class' actual return. The hypothetical account values and expenses may not be used to estimate the actual ending account balance or expenses you paid for the period. You may use this information to compare the ongoing costs of investing in the Fund and other funds. To do so, compare this 5% hypothetical example with the 5% hypothetical examples that appear in the shareholder reports of the other funds. A small balance maintenance fee of $12.00 that is charged once a year may apply for certain accounts with a value of less than $2,000. This fee is not included in the table below. If it was, the estimate of expenses you paid during the period would be higher, and your ending account value lower, by this amount. In addition, the Fund, as a shareholder in the underlying Fidelity Central Funds, will indirectly bear its pro-rata share of the fees and expenses incurred by the underlying Fidelity Central Funds. These fees and expenses are not included in the Fund's annualized expense ratio used to calculate the expense estimate in the table below.
Please note that the expenses shown in the table are meant to highlight your ongoing costs only and do not reflect any transaction costs. Therefore, the second line of the table is useful in comparing ongoing costs only, and will not help you determine the relative total costs of owning different funds. In addition, if these transactional costs were included, your costs would have been higher.
Annual Report
| Annualized
Expense Ratio | Beginning
Account Value
February 1, 2012 | Ending
Account Value
July 31, 2012 | Expenses Paid
During Period*
February 1, 2012
to July 31, 2012 |
Class A | 1.31% | | | |
Actual | | $ 1,000.00 | $ 1,021.20 | $ 6.58 |
Hypothetical A | | $ 1,000.00 | $ 1,018.35 | $ 6.57 |
Class T | 1.57% | | | |
Actual | | $ 1,000.00 | $ 1,019.50 | $ 7.88 |
Hypothetical A | | $ 1,000.00 | $ 1,017.06 | $ 7.87 |
Class B | 2.06% | | | |
Actual | | $ 1,000.00 | $ 1,016.70 | $ 10.33 |
Hypothetical A | | $ 1,000.00 | $ 1,014.62 | $ 10.32 |
Class C | 2.07% | | | |
Actual | | $ 1,000.00 | $ 1,016.80 | $ 10.38 |
Hypothetical A | | $ 1,000.00 | $ 1,014.57 | $ 10.37 |
Small Cap Growth | .98% | | | |
Actual | | $ 1,000.00 | $ 1,022.20 | $ 4.93 |
Hypothetical A | | $ 1,000.00 | $ 1,019.99 | $ 4.92 |
Class F | .77% | | | |
Actual | | $ 1,000.00 | $ 1,023.30 | $ 3.87 |
Hypothetical A | | $ 1,000.00 | $ 1,021.03 | $ 3.87 |
Institutional Class | 1.00% | | | |
Actual | | $ 1,000.00 | $ 1,022.80 | $ 5.03 |
Hypothetical A | | $ 1,000.00 | $ 1,019.89 | $ 5.02 |
A 5% return per year before expenses
* Expenses are equal to each Class' annualized expense ratio, multiplied by the average account value over the period, multiplied by 182/366 (to reflect the one-half year period).
Annual Report
Investment Changes (Unaudited)
Top Ten Stocks as of July 31, 2012 |
| % of fund's
net assets | % of fund's net assets
6 months ago |
Vitamin Shoppe, Inc. | 1.5 | 0.9 |
Life Time Fitness, Inc. | 1.4 | 0.7 |
Hibbett Sports, Inc. | 1.4 | 0.8 |
Align Technology, Inc. | 1.4 | 0.0 |
Susser Holdings Corp. | 1.3 | 0.0 |
Ascena Retail Group, Inc. | 1.3 | 1.1 |
Liquidity Services, Inc. | 1.3 | 0.0 |
HMS Holdings Corp. | 1.3 | 0.9 |
Aspen Technology, Inc. | 1.3 | 0.7 |
Sally Beauty Holdings, Inc. | 1.2 | 1.2 |
| 13.4 | |
Top Five Market Sectors as of July 31, 2012 |
| % of fund's
net assets | % of fund's net assets
6 months ago |
Health Care | 21.2 | 14.2 |
Information Technology | 20.6 | 24.4 |
Consumer Discretionary | 17.5 | 16.5 |
Industrials | 14.6 | 17.8 |
Financials | 9.6 | 6.8 |
Asset Allocation (% of fund's net assets) |
As of July 31, 2012* | As of January 31, 2012** |
 | Stocks 96.9% | | | Stocks and Equity
Futures 98.4% | |
 | Short-Term
Investments and
Net Other Assets (Liabilities) 3.1% | | | Short-Term
Investments and
Net Other Assets (Liabilities) 1.6% | |
* Foreign investments | 9.1% | | ** Foreign investments | 12.4% | |

Annual Report
Investments July 31, 2012
Showing Percentage of Net Assets
Common Stocks - 96.9% |
| Shares | | Value |
CONSUMER DISCRETIONARY - 17.5% |
Auto Components - 0.6% |
Tenneco, Inc. (a) | 394,600 | | $ 11,557,834 |
Hotels, Restaurants & Leisure - 4.9% |
AFC Enterprises, Inc. (a) | 600,000 | | 13,254,000 |
Chuys Holdings, Inc. | 17,700 | | 308,157 |
Cracker Barrel Old Country Store, Inc. | 278,800 | | 17,469,608 |
Interval Leisure Group, Inc. | 1,120,000 | | 20,540,800 |
Life Time Fitness, Inc. (a) | 577,600 | | 26,228,816 |
Texas Roadhouse, Inc. Class A | 701,900 | | 12,149,889 |
| | 89,951,270 |
Household Durables - 1.9% |
Jarden Corp. | 290,000 | | 13,108,000 |
Lennar Corp. Class A | 303,800 | | 8,873,998 |
Toll Brothers, Inc. (a) | 461,300 | | 13,456,121 |
| | 35,438,119 |
Multiline Retail - 1.0% |
Dollarama, Inc. | 214,900 | | 13,393,080 |
The Bon-Ton Stores, Inc. | 700,000 | | 4,620,000 |
| | 18,013,080 |
Specialty Retail - 6.6% |
Ascena Retail Group, Inc. (a) | 1,334,800 | | 24,480,232 |
Conn's, Inc. (a) | 170,916 | | 3,050,851 |
DSW, Inc. Class A | 326,300 | | 19,290,856 |
Hibbett Sports, Inc. (a) | 430,000 | | 26,131,100 |
Sally Beauty Holdings, Inc. (a) | 801,000 | | 21,162,420 |
Vitamin Shoppe, Inc. (a) | 492,300 | | 27,037,116 |
| | 121,152,575 |
Textiles, Apparel & Luxury Goods - 2.5% |
Hanesbrands, Inc. (a) | 450,000 | | 13,509,000 |
PVH Corp. | 139,459 | | 11,077,228 |
Steven Madden Ltd. (a) | 331,400 | | 13,398,502 |
Ted Baker PLC | 591,073 | | 8,196,784 |
| | 46,181,514 |
TOTAL CONSUMER DISCRETIONARY | | 322,294,392 |
CONSUMER STAPLES - 5.8% |
Food & Staples Retailing - 1.3% |
Susser Holdings Corp. (a) | 678,155 | | 24,488,177 |
Common Stocks - continued |
| Shares | | Value |
CONSUMER STAPLES - continued |
Food Products - 3.0% |
Calavo Growers, Inc. (d) | 495,299 | | $ 13,363,167 |
Hain Celestial Group, Inc. (a) | 295,000 | | 16,428,550 |
J&J Snack Foods Corp. | 250,000 | | 14,447,500 |
Post Holdings, Inc. (a) | 400,000 | | 11,840,000 |
| | 56,079,217 |
Household Products - 0.9% |
WD-40 Co. | 322,566 | | 15,499,296 |
Personal Products - 0.6% |
Elizabeth Arden, Inc. (a) | 275,000 | | 10,727,750 |
TOTAL CONSUMER STAPLES | | 106,794,440 |
ENERGY - 4.5% |
Energy Equipment & Services - 2.2% |
Essential Energy Services Ltd. | 5,166,700 | | 10,973,796 |
Tesco Corp. (a) | 750,000 | | 8,692,500 |
Western Energy Services Corp. (a) | 1,530,000 | | 10,740,589 |
Xtreme Drilling & Coil Services Corp. (a)(e) | 4,100,000 | | 6,786,658 |
Zedi, Inc. (a)(e) | 5,020,900 | | 3,905,172 |
| | 41,098,715 |
Oil, Gas & Consumable Fuels - 2.3% |
Cabot Oil & Gas Corp. | 250,000 | | 10,547,500 |
Delek US Holdings, Inc. | 81,100 | | 1,600,914 |
Stone Energy Corp. (a) | 516,300 | | 13,558,038 |
Targa Resources Corp. | 379,300 | | 16,708,165 |
| | 42,414,617 |
TOTAL ENERGY | | 83,513,332 |
FINANCIALS - 9.6% |
Commercial Banks - 3.1% |
Banco Pine SA | 1,658,287 | | 10,868,043 |
BBCN Bancorp, Inc. (a) | 1,640,000 | | 18,597,600 |
Columbia Banking Systems, Inc. | 579,043 | | 10,451,726 |
Texas Capital Bancshares, Inc. (a) | 400,000 | | 17,236,000 |
| | 57,153,369 |
Insurance - 2.4% |
Allied World Assurance Co. Holdings Ltd. | 194,800 | | 14,693,764 |
Common Stocks - continued |
| Shares | | Value |
FINANCIALS - continued |
Insurance - continued |
Amerisafe, Inc. (a) | 464,900 | | $ 11,606,229 |
ProAssurance Corp. | 210,000 | | 18,809,700 |
| | 45,109,693 |
Real Estate Investment Trusts - 3.3% |
Highwoods Properties, Inc. (SBI) | 419,000 | | 14,191,530 |
LTC Properties, Inc. | 430,000 | | 15,351,000 |
Rayonier, Inc. | 285,000 | | 13,591,650 |
Sovran Self Storage, Inc. | 300,000 | | 17,130,000 |
| | 60,264,180 |
Real Estate Management & Development - 0.8% |
Altisource Portfolio Solutions SA (a) | 185,000 | | 14,348,600 |
TOTAL FINANCIALS | | 176,875,842 |
HEALTH CARE - 21.2% |
Biotechnology - 6.8% |
Alkermes PLC (a) | 175,500 | | 3,262,545 |
Amarin Corp. PLC ADR (a)(d) | 900,000 | | 10,539,000 |
Amylin Pharmaceuticals, Inc. (a) | 556,700 | | 17,140,793 |
ARIAD Pharmaceuticals, Inc. (a) | 400,000 | | 7,652,000 |
ArQule, Inc. (a) | 900,000 | | 5,445,000 |
BioMarin Pharmaceutical, Inc. (a) | 190,000 | | 7,465,100 |
Infinity Pharmaceuticals, Inc. (a) | 205,536 | | 3,588,659 |
Isis Pharmaceuticals, Inc. (a) | 437,257 | | 5,299,555 |
Medivation, Inc. (a) | 140,000 | | 13,958,000 |
OncoGenex Pharmaceuticals, Inc. (a)(d) | 570,000 | | 7,957,200 |
Pharmacyclics, Inc. (a)(d) | 150,000 | | 7,981,500 |
Seattle Genetics, Inc. (a) | 330,000 | | 8,632,800 |
Targacept, Inc. (a) | 500,000 | | 2,160,000 |
Theravance, Inc. (a)(d) | 379,000 | | 11,040,270 |
Threshold Pharmaceuticals, Inc. (a) | 880,000 | | 6,107,200 |
XOMA Corp. (a)(d) | 2,200,000 | | 7,986,000 |
| | 126,215,622 |
Health Care Equipment & Supplies - 5.8% |
Abiomed, Inc. (a)(d) | 600,000 | | 13,530,000 |
Align Technology, Inc. (a) | 764,398 | | 25,958,956 |
Cyberonics, Inc. (a) | 322,000 | | 13,942,600 |
ICU Medical, Inc. (a) | 380,000 | | 20,265,400 |
Sirona Dental Systems, Inc. (a) | 195,000 | | 8,429,850 |
Common Stocks - continued |
| Shares | | Value |
HEALTH CARE - continued |
Health Care Equipment & Supplies - continued |
The Cooper Companies, Inc. | 151,900 | | $ 11,431,994 |
The Spectranetics Corp. (a) | 1,130,000 | | 13,334,000 |
| | 106,892,800 |
Health Care Providers & Services - 5.5% |
Air Methods Corp. (a) | 151,000 | | 16,463,530 |
Catamaran Corp. (a) | 100,807 | | 8,562,338 |
Centene Corp. (a) | 330,000 | | 12,553,200 |
Corvel Corp. (a) | 202,592 | | 9,347,595 |
Health Net, Inc. (a) | 302,482 | | 6,660,654 |
HMS Holdings Corp. (a) | 683,500 | | 23,519,235 |
MEDNAX, Inc. (a) | 172,900 | | 11,433,877 |
MWI Veterinary Supply, Inc. (a) | 148,400 | | 13,517,756 |
| | 102,058,185 |
Health Care Technology - 0.9% |
athenahealth, Inc. (a)(d) | 120,000 | | 10,980,000 |
Epocrates, Inc. (a) | 672,706 | | 5,072,203 |
| | 16,052,203 |
Life Sciences Tools & Services - 0.8% |
Furiex Pharmaceuticals, Inc. (a) | 200,000 | | 3,844,000 |
Luminex Corp. (a) | 620,000 | | 10,620,600 |
| | 14,464,600 |
Pharmaceuticals - 1.4% |
Cadence Pharmaceuticals, Inc. (a) | 767,693 | | 3,255,018 |
Impax Laboratories, Inc. (a) | 640,200 | | 14,225,244 |
ViroPharma, Inc. (a) | 410,000 | | 8,901,100 |
| | 26,381,362 |
TOTAL HEALTH CARE | | 392,064,772 |
INDUSTRIALS - 14.6% |
Aerospace & Defense - 1.7% |
Teledyne Technologies, Inc. (a) | 235,700 | | 14,684,110 |
TransDigm Group, Inc. (a) | 138,183 | | 17,046,255 |
| | 31,730,365 |
Building Products - 0.9% |
Armstrong World Industries, Inc. | 260,000 | | 10,049,000 |
US Home Systems, Inc. (e) | 725,000 | | 6,604,750 |
| | 16,653,750 |
Common Stocks - continued |
| Shares | | Value |
INDUSTRIALS - continued |
Electrical Equipment - 2.1% |
Generac Holdings, Inc. | 450,000 | | $ 10,269,000 |
Hubbell, Inc. Class B | 161,800 | | 13,312,904 |
II-VI, Inc. (a) | 815,000 | | 14,213,600 |
| | 37,795,504 |
Industrial Conglomerates - 0.8% |
Carlisle Companies, Inc. | 290,000 | | 14,642,100 |
Machinery - 2.9% |
Actuant Corp. Class A | 383,100 | | 10,903,026 |
Blount International, Inc. (a) | 774,000 | | 11,006,280 |
TriMas Corp. (a) | 335,298 | | 7,289,379 |
Valmont Industries, Inc. | 75,000 | | 9,291,000 |
Wabtec Corp. | 197,300 | | 15,622,214 |
| | 54,111,899 |
Marine - 0.6% |
Kirby Corp. (a) | 200,000 | | 10,554,000 |
Professional Services - 3.0% |
Advisory Board Co. (a) | 421,005 | | 18,941,015 |
MISTRAS Group, Inc. (a) | 315,721 | | 7,097,408 |
Nielsen Holdings B.V. (a) | 650,000 | | 18,525,000 |
Nihon M&A Center, Inc. | 385,512 | | 11,389,587 |
| | 55,953,010 |
Road & Rail - 0.6% |
Genesee & Wyoming, Inc. Class A (a) | 180,000 | | 11,170,800 |
Trading Companies & Distributors - 2.0% |
DXP Enterprises, Inc. (a) | 214,719 | | 9,490,580 |
Watsco, Inc. | 289,000 | | 19,634,660 |
WESCO International, Inc. (a) | 145,000 | | 8,077,950 |
| | 37,203,190 |
TOTAL INDUSTRIALS | | 269,814,618 |
INFORMATION TECHNOLOGY - 20.6% |
Communications Equipment - 0.9% |
Parrot SA (a) | 368,100 | | 11,209,528 |
Telular Corp. | 500,000 | | 4,715,000 |
| | 15,924,528 |
Computers & Peripherals - 0.7% |
Super Micro Computer, Inc. (a) | 979,923 | | 12,160,844 |
Common Stocks - continued |
| Shares | | Value |
INFORMATION TECHNOLOGY - continued |
Electronic Equipment & Components - 2.1% |
Insight Enterprises, Inc. (a) | 377,400 | | $ 6,325,224 |
InvenSense, Inc. | 137,076 | | 1,768,280 |
Neonode, Inc. (a)(d) | 1,380,000 | | 6,969,000 |
OSI Systems, Inc. (a) | 164,000 | | 10,584,560 |
Parametric Sound Corp. (a) | 249,068 | | 2,428,413 |
Zygo Corp. (a) | 619,600 | | 11,078,448 |
| | 39,153,925 |
Internet Software & Services - 7.4% |
Active Network, Inc. (a) | 870,000 | | 12,345,300 |
Bankrate, Inc. (a)(d) | 600,000 | | 9,570,000 |
Blucora, Inc. (a) | 1,111,100 | | 16,944,275 |
Cornerstone OnDemand, Inc. (a) | 674,037 | | 16,028,600 |
Demand Media, Inc. (a)(d) | 1,743,000 | | 19,382,160 |
Liquidity Services, Inc. (a) | 523,400 | | 23,929,848 |
LivePerson, Inc. (a) | 963,426 | | 18,016,066 |
QuinStreet, Inc. (a)(d) | 1,350,000 | | 12,244,500 |
VeriSign, Inc. (a) | 200,000 | | 8,884,000 |
| | 137,344,749 |
IT Services - 2.2% |
Euronet Worldwide, Inc. (a) | 500,000 | | 9,140,000 |
Maximus, Inc. | 320,000 | | 16,160,000 |
ServiceSource International, Inc. (a) | 336,399 | | 3,794,581 |
Total System Services, Inc. | 500,000 | | 11,825,000 |
| | 40,919,581 |
Semiconductors & Semiconductor Equipment - 1.3% |
Cymer, Inc. (a) | 278,201 | | 15,915,879 |
Entegris, Inc. (a) | 1,056,500 | | 8,504,825 |
| | 24,420,704 |
Software - 6.0% |
Aspen Technology, Inc. (a) | 992,200 | | 23,197,636 |
BroadSoft, Inc. (a)(d) | 456,600 | | 11,209,530 |
CommVault Systems, Inc. (a) | 360,000 | | 17,467,200 |
Deltek, Inc. (a) | 1,030,000 | | 13,410,600 |
Ebix, Inc. (d) | 575,610 | | 12,484,981 |
MICROS Systems, Inc. (a) | 260,312 | | 12,427,295 |
Parametric Technology Corp. (a) | 980,000 | | 21,109,200 |
| | 111,306,442 |
TOTAL INFORMATION TECHNOLOGY | | 381,230,773 |
Common Stocks - continued |
| Shares | | Value |
MATERIALS - 2.4% |
Chemicals - 0.6% |
Albemarle Corp. | 200,300 | | $ 11,661,466 |
Containers & Packaging - 0.8% |
Myers Industries, Inc. | 850,000 | | 13,974,000 |
Metals & Mining - 1.0% |
Commercial Metals Co. | 809,800 | | 10,438,322 |
Compass Minerals International, Inc. | 120,000 | | 8,680,800 |
| | 19,119,122 |
TOTAL MATERIALS | | 44,754,588 |
UTILITIES - 0.7% |
Electric Utilities - 0.7% |
Cleco Corp. | 280,000 | | 12,252,800 |
TOTAL COMMON STOCKS (Cost $1,609,099,061) |
1,789,595,557
|
Money Market Funds - 6.6% |
| | | |
Fidelity Cash Central Fund, 0.17% (b) | 50,560,836 | | 50,560,836 |
Fidelity Securities Lending Cash Central Fund, 0.18% (b)(c) | 71,793,425 | | 71,793,425 |
TOTAL MONEY MARKET FUNDS (Cost $122,354,261) |
122,354,261
|
TOTAL INVESTMENT PORTFOLIO - 103.5% (Cost $1,731,453,322) | | 1,911,949,818 |
NET OTHER ASSETS (LIABILITIES) - (3.5)% | | (64,777,614) |
NET ASSETS - 100% | $ 1,847,172,204 |
Legend |
(a) Non-income producing |
(b) Affiliated fund that is available only to investment companies and other accounts managed by Fidelity Investments. The rate quoted is the annualized seven-day yield of the fund at period end. A complete unaudited listing of the fund's holdings as of its most recent quarter end is available upon request. In addition, each Fidelity Central Fund's financial statements, which are not covered by the Fund's Report of Independent Registered Public Accounting Firm, are available on the SEC's website or upon request. |
(c) Investment made with cash collateral received from securities on loan. |
(d) Security or a portion of the security is on loan at period end. |
(e) Affiliated company |
Affiliated Central Funds |
Information regarding fiscal year to date income earned by the Fund from investments in Fidelity Central Funds is as follows: |
Fund | Income earned |
Fidelity Cash Central Fund | $ 79,275 |
Fidelity Securities Lending Cash Central Fund | 3,071,956 |
Total | $ 3,151,231 |
Other Affiliated Issuers |
An affiliated company is a company in which the Fund has ownership of at least 5% of the voting securities. Fiscal year to date transactions with companies which are or were affiliates are as follows: |
Affiliate | Value, beginning of period | Purchases | Sales Proceeds | Dividend Income | Value,
end of
period |
Calavo Growers, Inc. | $ 16,826,331 | $ 13,436,045 | $ 19,540,642 | $ 307,289 | $ - |
Perficient, Inc. | 17,202,205 | 4,361,057 | 22,322,908 | - | - |
US Home Systems, Inc. | - | 8,770,904 | - | 43,500 | 6,604,750 |
Xtreme Drilling & Coil Services Corp. (formerly Xtreme Coil Drilling Corp.) | - | 12,099,252 | - | - | 6,786,658 |
Zedi, Inc. | - | 3,695,906 | - | - | 3,905,172 |
Total | $ 34,028,536 | $ 42,363,164 | $ 41,863,550 | $ 350,789 | $ 17,296,580 |
Other Information |
The following is a summary of the inputs used, as of July 31, 2012, involving the Fund's assets and liabilities carried at fair value. The inputs or methodology used for valuing securities may not be an indication of the risk associated with investing in those securities. For more information on valuation inputs, and their aggregation into the levels used in the table below, please refer to the Security Valuation section in the accompanying Notes to Financial Statements. |
Valuation Inputs at Reporting Date: |
Description | Total | Level 1 | Level 2 | Level 3 |
Investments in Securities: | | | | |
Equities: | | | | |
Consumer Discretionary | $ 322,294,392 | $ 322,294,392 | $ - | $ - |
Consumer Staples | 106,794,440 | 106,794,440 | - | - |
Energy | 83,513,332 | 83,513,332 | - | - |
Financials | 176,875,842 | 176,875,842 | - | - |
Health Care | 392,064,772 | 392,064,772 | - | - |
Industrials | 269,814,618 | 258,425,031 | 11,389,587 | - |
Information Technology | 381,230,773 | 381,230,773 | - | - |
Materials | 44,754,588 | 44,754,588 | - | - |
Utilities | 12,252,800 | 12,252,800 | - | - |
Money Market Funds | 122,354,261 | 122,354,261 | - | - |
Total Investments in Securities: | $ 1,911,949,818 | $ 1,900,560,231 | $ 11,389,587 | $ - |
See accompanying notes which are an integral part of the financial statements.
Annual Report
Statement of Assets and Liabilities
| July 31, 2012 |
| | |
Assets | | |
Investment in securities, at value (including securities loaned of $69,355,870) - See accompanying schedule: Unaffiliated issuers (cost $1,584,533,000) | $ 1,772,298,977 | |
Fidelity Central Funds (cost $122,354,261) | 122,354,261 | |
Other affiliated issuers (cost $24,566,061) | 17,296,580 | |
Total Investments (cost $1,731,453,322) | | $ 1,911,949,818 |
Cash | | 465,902 |
Receivable for investments sold | | 36,822,778 |
Receivable for fund shares sold | | 1,053,361 |
Dividends receivable | | 442,749 |
Distributions receivable from Fidelity Central Funds | | 49,171 |
Other receivables | | 85,041 |
Total assets | | 1,950,868,820 |
| | |
Liabilities | | |
Payable for investments purchased | $ 29,150,268 | |
Payable for fund shares redeemed | 1,206,971 | |
Accrued management fee | 1,131,791 | |
Distribution and service plan fees payable | 47,878 | |
Other affiliated payables | 299,993 | |
Other payables and accrued expenses | 66,290 | |
Collateral on securities loaned, at value | 71,793,425 | |
Total liabilities | | 103,696,616 |
| | |
Net Assets | | $ 1,847,172,204 |
Net Assets consist of: | | |
Paid in capital | | $ 1,604,527,390 |
Accumulated net investment loss | | (1,442,758) |
Accumulated undistributed net realized gain (loss) on investments and foreign currency transactions | | 63,602,071 |
Net unrealized appreciation (depreciation) on investments and assets and liabilities in foreign currencies | | 180,485,501 |
Net Assets | | $ 1,847,172,204 |
See accompanying notes which are an integral part of the financial statements.
Annual Report
Financial Statements - continued
Statement of Assets and Liabilities - continued
| July 31, 2012 |
| | |
Calculation of Maximum Offering Price Class A:
Net Asset Value and redemption price per share ($59,684,141 ÷ 3,761,625 shares) | | $ 15.87 |
| | |
Maximum offering price per share (100/94.25 of $15.87) | | $ 16.84 |
Class T:
Net Asset Value and redemption price per share ($27,657,540 ÷ 1,764,218 shares) | | $ 15.68 |
| | |
Maximum offering price per share (100/96.50 of $15.68) | | $ 16.25 |
Class B:
Net Asset Value and offering price per share ($4,123,211 ÷ 271,428 shares)A | | $ 15.19 |
| | |
Class C:
Net Asset Value and offering price per share ($24,682,877 ÷ 1,627,852 shares)A | | $ 15.16 |
| | |
Small Cap Growth:
Net Asset Value, offering price and redemption price per share ($1,166,101,377 ÷ 72,239,706 shares) | | $ 16.14 |
| | |
Class F:
Net Asset Value, offering price and redemption price per share ($528,229,315 ÷ 32,483,605 shares) | | $ 16.26 |
| | |
Institutional Class:
Net Asset Value, offering price and redemption price per share ($36,693,743 ÷ 2,269,537 shares) | | $ 16.17 |
A Redemption price per share is equal to net asset value less any applicable contingent deferred sales charge.
See accompanying notes which are an integral part of the financial statements.
Annual Report
Statement of Operations
| Year ended July 31, 2012 |
| | |
Investment Income | | |
Dividends (including $350,789 earned from other affiliated issuers) | | $ 10,164,089 |
Special dividends | | 1,530,000 |
Interest | | 2,005 |
Income from Fidelity Central Funds (including $3,071,956 from security lending) | | 3,151,231 |
Total income | | 14,847,325 |
| | |
Expenses | | |
Management fee
Basic fee | $ 12,271,775 | |
Performance adjustment | 827,912 | |
Transfer agent fees | 3,165,497 | |
Distribution and service plan fees | 563,361 | |
Accounting and security lending fees | 550,873 | |
Custodian fees and expenses | 30,254 | |
Independent trustees' compensation | 11,394 | |
Registration fees | 99,536 | |
Audit | 58,667 | |
Legal | 5,590 | |
Miscellaneous | 18,436 | |
Total expenses before reductions | 17,603,295 | |
Expense reductions | (174,685) | 17,428,610 |
Net investment income (loss) | | (2,581,285) |
Realized and Unrealized Gain (Loss) Net realized gain (loss) on: | | |
Investment securities: | | |
Unaffiliated issuers | 77,468,956 | |
Other affiliated issuers | 1,136,369 | |
Foreign currency transactions | (232,876) | |
Futures contracts | 5,787,075 | |
Total net realized gain (loss) | | 84,159,524 |
Change in net unrealized appreciation (depreciation) on: Investment securities | (104,787,928) | |
Assets and liabilities in foreign currencies | (14,661) | |
Total change in net unrealized appreciation (depreciation) | | (104,802,589) |
Net gain (loss) | | (20,643,065) |
Net increase (decrease) in net assets resulting from operations | | $ (23,224,350) |
See accompanying notes which are an integral part of the financial statements.
Annual Report
Financial Statements - continued
Statement of Changes in Net Assets
| Year ended
July 31,
2012 | Year ended
July 31,
2011 |
Increase (Decrease) in Net Assets | | |
Operations | | |
Net investment income (loss) | $ (2,581,285) | $ (3,102,614) |
Net realized gain (loss) | 84,159,524 | 221,065,530 |
Change in net unrealized appreciation (depreciation) | (104,802,589) | 210,253,368 |
Net increase (decrease) in net assets resulting
from operations | (23,224,350) | 428,216,284 |
Distributions to shareholders from net realized gain | (34,799,429) | (3,013,255) |
Share transactions - net increase (decrease) | 61,802,637 | (17,486,495) |
Redemption fees | 255,125 | 229,000 |
Total increase (decrease) in net assets | 4,033,983 | 407,945,534 |
| | |
Net Assets | | |
Beginning of period | 1,843,138,221 | 1,435,192,687 |
End of period (including accumulated net investment loss of $1,442,758 and accumulated net investment loss of $848,304, respectively) | $ 1,847,172,204 | $ 1,843,138,221 |
See accompanying notes which are an integral part of the financial statements.
Annual Report
Financial Highlights - Class A
Years ended July 31, | 2012 | 2011 | 2010 | 2009 | 2008 |
Selected Per-Share Data | | | | | |
Net asset value, beginning of period | $ 16.42 | $ 12.66 | $ 10.79 | $ 13.20 | $ 16.06 |
Income from Investment Operations | | | | | |
Net investment income (loss) C | (.07) F | (.07) G | (.07) H | (.06) | (.11) |
Net realized and unrealized gain (loss) | (.16) | 3.84 | 1.94 | (2.35) | (1.73) |
Total from investment operations | (.23) | 3.77 | 1.87 | (2.41) | (1.84) |
Distributions from net realized gain | (.32) | (.01) K | - | - | (1.02) |
Redemption fees added to paid in capital C,J | - | - | - | - | - |
Net asset value, end of period | $ 15.87 | $ 16.42 | $ 12.66 | $ 10.79 | $ 13.20 |
Total Return A,B | (1.14)% | 29.78% | 17.33% | (18.26)% | (12.26)% |
Ratios to Average Net Assets D,I | | | | | |
Expenses before reductions | 1.35% | 1.25% | 1.35% | 1.33% | 1.40% |
Expenses net of fee waivers, if any | 1.35% | 1.25% | 1.35% | 1.33% | 1.40% |
Expenses net of all reductions | 1.34% | 1.23% | 1.34% | 1.33% | 1.39% |
Net investment income (loss) | (.49)% F | (.47)% G | (.56)% H | (.64)% | (.74)% |
Supplemental Data | | | | | |
Net assets, end of period (000 omitted) | $ 59,684 | $ 67,272 | $ 50,620 | $ 40,211 | $ 42,187 |
Portfolio turnover rate E | 150% | 106% | 105% | 150% | 113% |
A Total returns would have been lower if certain expenses had not been reduced during the applicable periods shown.
B Total returns do not include the effect of the sales charges.
C Calculated based on average shares outstanding during the period.
D Fees and expenses of any underlying Fidelity Central Funds are not included in the Fund's expense ratio. The Fund indirectly bears its proportionate share of the expenses of any underlying Fidelity Central Funds.
E Amount does not include the portfolio activity of any underlying Fidelity Central Funds.
F Investment income per share reflects a large, non-recurring dividend which amounted to $.01 per share. Excluding this non-recurring dividend, the ratio of net investment income (loss) to average net assets would have been (.57)%.
G Investment income per share reflects a large, non-recurring dividend which amounted to $.02 per share. Excluding this non-recurring dividend, the ratio of net investment income (loss) to average net assets would have been (.61)%.
H Investment income per share reflects a large, non-recurring dividend which amounted to $.01 per share. Excluding this non-recurring dividend, the ratio of net investment income (loss) to average net assets would have been (.67)%.
I Expense ratios reflect operating expenses of the class. Expenses before reductions do not reflect amounts reimbursed by the investment adviser or reductions from brokerage service arrangements or reductions from other expense offset arrangements and do not represent the amount paid by the class during periods when reimbursements or reductions occur. Expenses net of fee waivers reflect expenses after reimbursement by the investment adviser but prior to reductions from brokerage service arrangements or other expense offset arrangements. Expenses net of all reductions represent the net expenses paid by the class.
J Amount represents less than $.01 per share.
K The amount shown reflects certain reclassifications related to book to tax differences.
See accompanying notes which are an integral part of the financial statements.
Annual Report
Financial Highlights - Class T
Years ended July 31, | 2012 | 2011 | 2010 | 2009 | 2008 |
Selected Per-Share Data | | | | | |
Net asset value, beginning of period | $ 16.27 | $ 12.57 | $ 10.74 | $ 13.17 | $ 16.01 |
Income from Investment Operations | | | | | |
Net investment income (loss) C | (.11) F | (.11) G | (.10) H | (.09) | (.15) |
Net realized and unrealized gain (loss) | (.16) | 3.81 | 1.93 | (2.34) | (1.73) |
Total from investment operations | (.27) | 3.70 | 1.83 | (2.43) | (1.88) |
Distributions from net realized gain | (.32) | - | - | - | (.96) |
Redemption fees added to paid in capital C,J | - | - | - | - | - |
Net asset value, end of period | $ 15.68 | $ 16.27 | $ 12.57 | $ 10.74 | $ 13.17 |
Total Return A,B | (1.41)% | 29.44% | 17.04% | (18.45)% | (12.50)% |
Ratios to Average Net AssetsD,I | | | | | |
Expenses before reductions | 1.61% | 1.50% | 1.61% | 1.60% | 1.65% |
Expenses net of fee waivers, if any | 1.61% | 1.50% | 1.61% | 1.60% | 1.65% |
Expenses net of all reductions | 1.60% | 1.49% | 1.60% | 1.59% | 1.65% |
Net investment income (loss) | (.74)% F | (.73)% G | (.82)% H | (.91)% | (.99)% |
Supplemental Data | | | | | |
Net assets, end of period (000 omitted) | $ 27,658 | $ 30,764 | $ 23,930 | $ 21,533 | $ 21,754 |
Portfolio turnover rate E | 150% | 106% | 105% | 150% | 113% |
A Total returns would have been lower if certain expenses had not been reduced during the applicable periods shown.
B Total returns do not include the effect of the sales charges.
C Calculated based on average shares outstanding during the period.
D Fees and expenses of any underlying Fidelity Central Funds are not included in the Fund's expense ratio. The Fund indirectly bears its proportionate share of the expenses of any underlying Fidelity Central Funds.
E Amount does not include the portfolio activity of any underlying Fidelity Central Funds.
F Investment income per share reflects a large, non-recurring dividend which amounted to $.01 per share. Excluding this non-recurring dividend, the ratio of net investment income (loss) to average net assets would have been (.83)%.
G Investment income per share reflects a large, non-recurring dividend which amounted to $.02 per share. Excluding this non-recurring dividend, the ratio of net investment income (loss) to average net assets would have been (.86)%.
H Investment income per share reflects a large, non-recurring dividend which amounted to $.01 per share. Excluding this non-recurring dividend, the ratio of net investment income (loss) to average net assets would have been (.93)%.
I Expense ratios reflect operating expenses of the class. Expenses before reductions do not reflect amounts reimbursed by the investment adviser or reductions from brokerage service arrangements or reductions from other expense offset arrangements and do not represent the amount paid by the class during periods when reimbursements or reductions occur. Expenses net of fee waivers reflect expenses after reimbursement by the investment adviser but prior to reductions from brokerage service arrangements or other expense offset arrangements. Expenses net of all reductions represent the net expenses paid by the class.
J Amount represents less than $.01 per share.
See accompanying notes which are an integral part of the financial statements.
Annual Report
Financial Highlights - Class B
Years ended July 31, | 2012 | 2011 | 2010 | 2009 | 2008 |
Selected Per-Share Data | | | | | |
Net asset value, beginning of period | $ 15.86 | $ 12.30 | $ 10.57 | $ 13.03 | $ 15.85 |
Income from Investment Operations | | | | | |
Net investment income (loss) C | (.18) F | (.18) G | (.16) H | (.13) | (.22) |
Net realized and unrealized gain (loss) | (.17) | 3.74 | 1.89 | (2.33) | (1.71) |
Total from investment operations | (.35) | 3.56 | 1.73 | (2.46) | (1.93) |
Distributions from net realized gain | (.32) | - | - | - | (.89) |
Redemption fees added to paid in capital C,J | - | - | - | - | - |
Net asset value, end of period | $ 15.19 | $ 15.86 | $ 12.30 | $ 10.57 | $ 13.03 |
Total Return A,B | (1.96)% | 28.94% | 16.37% | (18.88)% | (12.92)% |
Ratios to Average Net Assets D,I | | | | | |
Expenses before reductions | 2.10% | 2.00% | 2.11% | 2.08% | 2.15% |
Expenses net of fee waivers, if any | 2.10% | 2.00% | 2.11% | 2.08% | 2.15% |
Expenses net of all reductions | 2.09% | 1.98% | 2.09% | 2.08% | 2.15% |
Net investment income (loss) | (1.23)% F | (1.22)% G | (1.32)% H | (1.39)% | (1.49)% |
Supplemental Data | | | | | |
Net assets, end of period (000 omitted) | $ 4,123 | $ 5,295 | $ 5,142 | $ 4,171 | $ 5,517 |
Portfolio turnover rate E | 150% | 106% | 105% | 150% | 113% |
A Total returns would have been lower if certain expenses had not been reduced during the applicable periods shown.
B Total returns do not include the effect of the contingent deferred sales charge.
C Calculated based on average shares outstanding during the period.
D Fees and expenses of any underlying Fidelity Central Funds are not included in the Fund's expense ratio. The Fund indirectly bears its proportionate share of the expenses of any underlying Fidelity Central Funds.
E Amount does not include the portfolio activity of any underlying Fidelity Central Funds.
F Investment income per share reflects a large, non-recurring dividend which amounted to $.01 per share. Excluding this non-recurring dividend, the ratio of net investment income (loss) to average net assets would have been (1.32)%.
G Investment income per share reflects a large, non-recurring dividend which amounted to $.02 per share. Excluding this non-recurring dividend, the ratio of net investment income (loss) to average net assets would have been (1.36)%.
H Investment income per share reflects a large, non-recurring dividend which amounted to $.01 per share. Excluding this non-recurring dividend, the ratio of net investment income (loss) to average net assets would have been (1.42)%.
I Expense ratios reflect operating expenses of the class. Expenses before reductions do not reflect amounts reimbursed by the investment adviser or reductions from brokerage service arrangements or reductions from other expense offset arrangements and do not represent the amount paid by the class during periods when reimbursements or reductions occur. Expenses net of fee waivers reflect expenses after reimbursement by the investment adviser but prior to reductions from brokerage service arrangements or other expense offset arrangements. Expenses net of all reductions represent the net expenses paid by the class.
J Amount represents less than $.01 per share.
See accompanying notes which are an integral part of the financial statements.
Annual Report
Financial Highlights - Class C
Years ended July 31, | 2012 | 2011 | 2010 | 2009 | 2008 |
Selected Per-Share Data | | | | | |
Net asset value, beginning of period | $ 15.83 | $ 12.28 | $ 10.55 | $ 13.00 | $ 15.84 |
Income from Investment Operations | | | | | |
Net investment income (loss) C | (.18) F | (.18) G | (.16) H | (.13) | (.22) |
Net realized and unrealized gain (loss) | (.17) | 3.73 | 1.89 | (2.32) | (1.71) |
Total from investment operations | (.35) | 3.55 | 1.73 | (2.45) | (1.93) |
Distributions from net realized gain | (.32) | - | - | - | (.91) |
Redemption fees added to paid in capital C,J | - | - | - | - | - |
Net asset value, end of period | $ 15.16 | $ 15.83 | $ 12.28 | $ 10.55 | $ 13.00 |
Total Return A,B | (1.96)% | 28.91% | 16.40% | (18.85)% | (12.94)% |
Ratios to Average Net Assets D,I | | | | | |
Expenses before reductions | 2.10% | 2.00% | 2.11% | 2.08% | 2.15% |
Expenses net of fee waivers, if any | 2.10% | 2.00% | 2.11% | 2.08% | 2.15% |
Expenses net of all reductions | 2.09% | 1.98% | 2.09% | 2.07% | 2.14% |
Net investment income (loss) | (1.24)% F | (1.22)% G | (1.32)% H | (1.39)% | (1.49)% |
Supplemental Data | | | | | |
Net assets, end of period (000 omitted) | $ 24,683 | $ 24,914 | $ 18,091 | $ 14,267 | $ 15,946 |
Portfolio turnover rate E | 150% | 106% | 105% | 150% | 113% |
A Total returns would have been lower if certain expenses had not been reduced during the applicable periods shown.
B Total returns do not include the effect of the contingent deferred sales charge.
C Calculated based on average shares outstanding during the period.
D Fees and expenses of any underlying Fidelity Central Funds are not included in the Fund's expense ratio. The Fund indirectly bears its proportionate share of the expenses of any underlying Fidelity Central Funds.
E Amount does not include the portfolio activity of any underlying Fidelity Central Funds.
F Investment income per share reflects a large, non-recurring dividend which amounted to $.01 per share. Excluding this non-recurring dividend, the ratio of net investment income (loss) to average net assets would have been (1.32)%.
G Investment income per share reflects a large, non-recurring dividend which amounted to $.02 per share. Excluding this non-recurring dividend, the ratio of net investment income (loss) to average net assets would have been (1.36)%.
H Investment income per share reflects a large, non-recurring dividend which amounted to $.01 per share. Excluding this non-recurring dividend, the ratio of net investment income (loss) to average net assets would have been (1.42)%.
I Expense ratios reflect operating expenses of the class. Expenses before reductions do not reflect amounts reimbursed by the investment adviser or reductions from brokerage service arrangements or reductions from other expense offset arrangements and do not represent the amount paid by the class during periods when reimbursements or reductions occur. Expenses net of fee waivers reflect expenses after reimbursement by the investment adviser but prior to reductions from brokerage service arrangements or other expense offset arrangements. Expenses net of all reductions represent the net expenses paid by the class.
J Amount represents less than $.01 per share.
See accompanying notes which are an integral part of the financial statements.
Annual Report
Financial Highlights - Small Cap Growth
Years ended July 31, | 2012 | 2011 | 2010 | 2009 | 2008 |
Selected Per-Share Data | | | | | |
Net asset value, beginning of period | $ 16.65 | $ 12.81 | $ 10.89 | $ 13.29 | $ 16.15 |
Income from Investment Operations | | | | | |
Net investment income (loss) B | (.03) E | (.03) F | (.04) G | (.04) | (.07) |
Net realized and unrealized gain (loss) | (.16) | 3.90 | 1.96 | (2.36) | (1.74) |
Total from investment operations | (.19) | 3.87 | 1.92 | (2.40) | (1.81) |
Distributions from net realized gain | (.32) | (.03) J | - | - | (1.05) |
Redemption fees added to paid in capital B,I | - | - | - | - | - |
Net asset value, end of period | $ 16.14 | $ 16.65 | $ 12.81 | $ 10.89 | $ 13.29 |
Total Return A | (.88)% | 30.20% | 17.63% | (18.06)% | (11.98)% |
Ratios to Average Net Assets C,H | | | | |
Expenses before reductions | 1.03% | .95% | 1.08% | 1.08% | 1.11% |
Expenses net of fee waivers, if any | 1.03% | .95% | 1.08% | 1.08% | 1.11% |
Expenses net of all reductions | 1.02% | .93% | 1.07% | 1.08% | 1.10% |
Net investment income (loss) | (.16)% E | (.17)% F | (.29)% G | (.39)% | (.45)% |
Supplemental Data | | | | | |
Net assets, end of period (000 omitted) | $ 1,166,101 | $ 1,382,688 | $ 1,204,818 | $ 1,085,184 | $ 1,217,520 |
Portfolio turnover rate D | 150% | 106% | 105% | 150% | 113% |
A Total returns would have been lower if certain expenses had not been reduced during the applicable periods shown.
B Calculated based on average shares outstanding during the period.
C Fees and expenses of any underlying Fidelity Central Funds are not included in the Fund's expense ratio. The Fund indirectly bears its proportionate share of the expenses of any underlying Fidelity Central Funds.
D Amount does not include the portfolio activity of any underlying Fidelity Central Funds.
E Investment income per share reflects a large, non-recurring dividend which amounted to $.01 per share. Excluding this non-recurring dividend, the ratio of net investment income (loss) to average net assets would have been (.25)%.
F Investment income per share reflects a large, non-recurring dividend which amounted to $.02 per share. Excluding this non-recurring dividend, the ratio of net investment income (loss) to average net assets would have been (.31)%.
G Investment income per share reflects a large, non-recurring dividend which amounted to $.01 per share. Excluding this non-recurring dividend, the ratio of net investment income (loss) to average net assets would have been (.39)%.
H Expense ratios reflect operating expenses of the class. Expenses before reductions do not reflect amounts reimbursed by the investment adviser or reductions from brokerage service arrangements or reductions from other expense offset arrangements and do not represent the amount paid by the class during periods when reimbursements or reductions occur. Expenses net of fee waivers reflect expenses after reimbursement by the investment adviser but prior to reductions from brokerage service arrangements or other expense offset arrangements. Expenses net of all reductions represent the net expenses paid by the class.
I Amount represents less than $.01 per share.
J The amount shown reflects certain reclassifications related to book to tax differences.
See accompanying notes which are an integral part of the financial statements.
Annual Report
Financial Highlights - Class F
Years ended July 31, | 2012 | 2011 | 2010 | 2009 K |
Selected Per-Share Data | | | | |
Net asset value, beginning of period | $ 16.73 | $ 12.85 | $ 10.90 | $ 10.03 |
Income from Investment Operations | | | | |
Net investment income (loss) D | .01 H | .01 I | -J,M | (.01) |
Net realized and unrealized gain (loss) | (.16) | 3.91 | 1.95 | .88 |
Total from investment operations | (.15) | 3.92 | 1.95 | .87 |
Distributions from net realized gain | (.32) | (.04) N | - | - |
Redemption fees added to paid in capital D,M | - | - | - | - |
Net asset value, end of period | $ 16.26 | $ 16.73 | $ 12.85 | $ 10.90 |
Total Return B,C | (.64)% | 30.56% | 17.89% | 8.67% |
Ratios to Average Net Assets E,L | | | | |
Expenses before reductions | .80% | .70% | .78% | .74% A |
Expenses net of fee waivers, if any | .80% | .70% | .78% | .74% A |
Expenses net of all reductions | .79% | .68% | .77% | .73% A |
Net investment income (loss) | .07% H | .08% I | -% G,J | (.54)% A |
Supplemental Data | | | | |
Net assets, end of period (000 omitted) | $ 528,229 | $ 290,765 | $ 106,941 | $ 159 |
Portfolio turnover rate F | 150% | 106% | 105% | 150% |
A Annualized
B Total returns for periods of less than one year are not annualized.
C Total returns would have been lower if certain expenses had not been reduced during the applicable periods shown.
D Calculated based on average shares outstanding during the period.
E Fees and expenses of any underlying Fidelity Central Funds are not included in the Fund's expense ratio. The Fund indirectly bears its proportionate share of the expenses of any underlying Fidelity Central Funds.
F Amount does not include the portfolio activity of any underlying Fidelity Central Funds.
G Amount represents less than .01%.
H Investment income per share reflects a large, non-recurring dividend which amounted to $.01 per share. Excluding this non-recurring dividend, the ratio of net investment income (loss) to average net assets would have been (.02)%.
I Investment income per share reflects a large, non-recurring dividend which amounted to $.02 per share. Excluding this non-recurring dividend, the ratio of net investment income (loss) to average net assets would have been (.06)%.
J Investment income per share reflects a large, non-recurring dividend which amounted to $.01 per share. Excluding this non-recurring dividend, the ratio of net investment income (loss) to average net assets would have been (.10)%.
K For the period June 26, 2009 (commencement of sale of shares) to July 31, 2009.
L Expense ratios reflect operating expenses of the class. Expenses before reductions do not reflect amounts reimbursed by the investment adviser or reductions from brokerage service arrangements or reductions from other expense offset arrangements and do no represent the amount paid by the class during periods when reimbursements or reductions occur. Expense ratios before reductions for start-up periods may not be representative of longer-term operating periods. Expenses net of fee waivers reflect expenses after reimbursement by the investment adviser but prior to reductions from brokerage service arrangements or other expense offset arrangements. Expenses net of all reductions represent the net expenses paid by the class.
M Amount represents less than $.01 per share.
N The amount shown reflects certain reclassifications related to book to tax differences.
See accompanying notes which are an integral part of the financial statements.
Annual Report
Financial Highlights - Institutional Class
Years ended July 31, | 2012 | 2011 | 2010 | 2009 | 2008 |
Selected Per-Share Data | | | | | |
Net asset value, beginning of period | $ 16.68 | $ 12.83 | $ 10.91 | $ 13.30 | $ 16.15 |
Income from Investment Operations | | | | | |
Net investment income (loss) B | (.03) E | (.03) F | (.03) G | (.03) | (.06) |
Net realized and unrealized gain (loss) | (.16) | 3.91 | 1.95 | (2.36) | (1.74) |
Total from investment operations | (.19) | 3.88 | 1.92 | (2.39) | (1.80) |
Distributions from net realized gain | (.32) | (.03) J | - | - | (1.05) |
Redemption fees added to paid in capital B,I | - | - | - | - | - |
Net asset value, end of period | $ 16.17 | $ 16.68 | $ 12.83 | $ 10.91 | $ 13.30 |
Total Return A | (.88)% | 30.24% | 17.60% | (17.97)% | (11.93)% |
Ratios to Average Net Assets C,H | | | | |
Expenses before reductions | 1.06% | .94% | 1.03% | 1.05% | 1.04% |
Expenses net of fee waivers, if any | 1.06% | .94% | 1.03% | 1.05% | 1.04% |
Expenses net of all reductions | 1.05% | .93% | 1.02% | 1.04% | 1.03% |
Net investment income (loss) | (.19)% E | (.17)% F | (.24)% G | (.36)% | (.38)% |
Supplemental Data | | | | | |
Net assets, end of period (000 omitted) | $ 36,694 | $ 41,440 | $ 25,650 | $ 19,204 | $ 22,444 |
Portfolio turnover rate D | 150% | 106% | 105% | 150% | 113% |
A Total returns would have been lower if certain expenses had not been reduced during the applicable periods shown.
B Calculated based on average shares outstanding during the period.
C Fees and expenses of any underlying Fidelity Central Funds are not included in the Fund's expense ratio. The Fund indirectly bears its proportionate share of the expenses of any underlying Fidelity Central Funds.
D Amount does not include the portfolio activity of any underlying Fidelity Central Funds.
E Investment income per share reflects a large, non-recurring dividend which amounted to $.01 per share. Excluding this non-recurring dividend, the ratio of net investment income (loss) to average net assets would have been (.28)%.
F Investment income per share reflects a large, non-recurring dividend which amounted to $.02 per share. Excluding this non-recurring dividend, the ratio of net investment income (loss) to average net assets would have been (.30)%.
G Investment income per share reflects a large, non-recurring dividend which amounted to $.01 per share. Excluding this non-recurring dividend, the ratio of net investment income (loss) to average net assets would have been (.34)%.
H Expense ratios reflect operating expenses of the class. Expenses before reductions do not reflect amounts reimbursed by the investment adviser or reductions from brokerage service arrangements or reductions from other expense offset arrangements and do not represent the amount paid by the class during periods when reimbursements or reductions occur. Expenses net of fee waivers reflect expenses after reimbursement by the investment adviser but prior to reductions from brokerage service arrangements or other expense offset arrangements. Expenses net of all reductions represent the net expenses paid by the class.
I Amount represents less than $.01 per share.
J The amount shown reflects certain reclassifications related to book to tax differences.
See accompanying notes which are an integral part of the financial statements.
Annual Report
Notes to Financial Statements
For the period ended July 31, 2012
1. Organization.
Fidelity Small Cap Growth Fund (the Fund) is a fund of Fidelity Securities Fund (the Trust) and is authorized to issue an unlimited number of shares. The Trust is registered under the Investment Company Act of 1940, as amended (the 1940 Act), as an open-end management investment company organized as a Massachusetts business trust. The Fund offers Class A, Class T, Class C, Small Cap Growth, Class F and Institutional Class shares, each of which, along with Class B shares, has equal rights as to assets and voting privileges. Effective after the close of business on September 1, 2010, Class B shares were closed to new accounts and additional purchases, except for exchanges and reinvestments. Each class has exclusive voting rights with respect to matters that affect that class. Class F shares of the Fund are only available for purchase by mutual funds for which Fidelity Management & Research Company (FMR) or an affiliate serves as investment manager. Class B shares will automatically convert to Class A shares after a holding period of seven years from the initial date of purchase. Investment income, realized and unrealized capital gains and losses, the common expenses of the Fund, and certain fund-level expense reductions, if any, are allocated on a pro-rata basis to each class based on the relative net assets of each class to the total net assets of the Fund. Each class differs with respect to transfer agent and distribution and service plan fees incurred. Certain expense reductions may also differ by class.
2. Investments in Fidelity Central Funds.
The Fund invests in Fidelity Central Funds, which are open-end investment companies available only to other investment companies and accounts managed by FMR and its affiliates. The Fund's Schedule of Investments lists each of the Fidelity Central Funds held as of period end, if any, as an investment of the Fund, but does not include the underlying holdings of each Fidelity Central Fund. As an Investing Fund, the Fund indirectly bears its proportionate share of the expenses of the underlying Fidelity Central Funds.
The Money Market Central Funds seek preservation of capital and current income and are managed by Fidelity Investments Money Management, Inc. (FIMM), an affiliate of FMR.
A complete unaudited list of holdings for each Fidelity Central Fund is available upon request or at the Securities and Exchange Commission (the SEC) web site at www.sec.gov. In addition, the financial statements of the Fidelity Central Funds, which are not covered by the Fund's Report of Independent Registered Public Accounting Firm, are available on the SEC web site or upon request.
Annual Report
Notes to Financial Statements - continued
3. Significant Accounting Policies.
The financial statements have been prepared in conformity with accounting principles generally accepted in the United States of America (GAAP), which require management to make certain estimates and assumptions at the date of the financial statements. Actual results could differ from those estimates. Subsequent events, if any, through the date that the financial statements were issued have been evaluated in the preparation of the financial statements. The following summarizes the significant accounting policies of the Fund:
Security Valuation. Investments are valued as of 4:00 p.m. Eastern time on the last calendar day of the period. In accordance with valuation policies and procedures approved by the Board of Trustees (the Board), the Fund attempts to obtain prices from one or more third party pricing vendor or broker to value its investments. When current market prices, quotations or rates are not readily available or reliable, securities will be fair valued in good faith by the FMR Fair Value Committee (the Committee), in accordance with procedures adopted by the Fund's Board. Factors used in determining fair value vary by security type and may include market or security specific events. The frequency with which these procedures are used cannot be predicted and they may be utilized to a significant extent. The Committee oversees the Fund's valuation policies and procedures and is responsible for approving and reporting to the Board all fair value determinations.
The Fund categorizes the inputs to valuation techniques used to value its investments into a disclosure hierarchy consisting of three levels as shown below:
Level 1 - quoted prices in active markets for identical investments
Level 2 - other significant observable inputs (including quoted prices for similar investments, interest rates, prepayment speeds, etc.)
Level 3 - unobservable inputs (including the Fund's own assumptions based on the best information available)
Valuation techniques used to value the Fund's investments by major category are as follows:
Equity securities, including restricted securities, for which market quotations are readily available, are valued at the last reported sale price or official closing price as reported by a third party pricing vendor on the primary market or exchange on which they are traded and are categorized as Level 1 in the hierarchy. In the event there were no sales during the day or closing prices are not available, securities are valued at the last quoted bid price or may be valued using the last available price and are generally categorized as Level 2 in the hierarchy. For foreign equity securities, when significant market or security specific events arise, comparisons to the valuation of American Depositary Receipts
Annual Report
3. Significant Accounting Policies - continued
Security Valuation - continued
(ADRs), futures contracts, Exchange-Traded Funds (ETFs) and certain indexes as well as quoted prices for similar securities are used and are categorized as Level 2 in the hierarchy. Utilizing these techniques may result in transfers between Level 1 and Level 2.
Investments in open-end mutual funds, including the Fidelity Central Funds, are valued at their closing net asset value each business day and are categorized as Level 1 in the hierarchy.
Changes in valuation techniques may result in transfers in or out of an assigned level within the disclosure hierarchy. The aggregate value of investments by input level, as of July 31, 2012, is included at the end of the Fund's Schedule of Investments.
Foreign Currency Translation. The Fund may use foreign currency contracts to facilitate transactions in foreign-denominated securities. Gains and losses from these transactions may arise from changes in the value of the foreign currency or if the counterparties do not perform under the contracts' terms.
Foreign-denominated assets, including investment securities, and liabilities are translated into U.S. dollars at the exchange rate at period end. Purchases and sales of investment securities, income and dividends received and expenses denominated in foreign currencies are translated into U.S. dollars at the exchange rate in effect on the transaction date.
The effects of exchange rate fluctuations on investments are included with the net realized and unrealized gain (loss) on investment securities. Other foreign currency transactions resulting in realized and unrealized gain (loss) are disclosed separately.
Investment Transactions and Income. For financial reporting purposes, the Fund's investment holdings and NAV include trades executed through the end of the last business day of the period. The NAV per share for processing shareholder transactions is calculated as of the close of business of the New York Stock Exchange (NYSE), normally 4:00 p.m. Eastern time and includes trades executed through the end of the prior business day. Gains and losses on securities sold are determined on the basis of identified cost and may include proceeds received from litigation. Dividend income is recorded on the ex-dividend date, except for certain dividends from foreign securities where the ex-dividend date may have passed, which are recorded as soon as the Fund is informed of the ex-dividend date. Non-cash dividends included in dividend income, if any, are recorded at the fair market value of the securities received. Distributions received on securities that represent a return of capital or capital gain are recorded as a reduction of cost of investments and/or as a realized gain. The Fund estimates the components of distributions received that may be considered return of capital distributions or capital
Annual Report
Notes to Financial Statements - continued
3. Significant Accounting Policies - continued
Investment Transactions and Income - continued
gain distributions. Large, non-recurring dividends recognized by the Fund are presented separately on the Statement of Operations as "Special Dividends" and the impact of these dividends is presented in the Financial Highlights. Interest income and distributions from the Fidelity Central Funds are accrued as earned. Interest income includes coupon interest and amortization of premium and accretion of discount on debt securities. Investment income is recorded net of foreign taxes withheld where recovery of such taxes is uncertain.
Expenses. Expenses directly attributable to a fund are charged to that fund. Expenses attributable to more than one fund are allocated among the respective funds on the basis of relative net assets or other appropriate methods. Expense estimates are accrued in the period to which they relate and adjustments are made when actual amounts are known.
Income Tax Information and Distributions to Shareholders. Each year, the Fund intends to qualify as a regulated investment company under Subchapter M of the Internal Revenue Code, including distributing substantially all of its taxable income and realized gains. As a result, no provision for income taxes is required. As of July 31, 2012, the Fund did not have any unrecognized tax benefits in the financial statements; nor is the Fund aware of any tax positions for which it is reasonably possible that the total amounts of unrecognized tax benefits will significantly change in the next twelve months. The Fund files a U.S. federal tax return, in addition to state and local tax returns as required. A fund's federal income tax returns are subject to examination by the Internal Revenue Service (IRS) for a period of three fiscal years after they are filed. State and local tax returns may be subject to examination for an additional fiscal year depending on the jurisdiction. Foreign taxes are provided for based on the Fund's understanding of the tax rules and rates that exist in the foreign markets in which it invests.
Distributions are declared and recorded on the ex-dividend date. Income dividends and capital gain distributions are declared separately for each class. Income and capital gain distributions are determined in accordance with income tax regulations, which may differ from GAAP. These differences resulted in distribution reclassifications for the period ended July 31, 2011. In addition, the Fund claimed a portion of the payment made to redeeming shareholders as a distribution for income tax purposes.
Capital accounts within the financial statements are adjusted for permanent book-tax differences. These adjustments have no impact on net assets or the results of operations. Temporary book-tax differences will reverse in a subsequent period.
Annual Report
3. Significant Accounting Policies - continued
Income Tax Information and Distributions to Shareholders - continued
Book-tax differences are primarily due to foreign currency transactions, net operating losses, future transactions, and losses deferred due to wash sales and excise tax regulations.
The federal tax cost of investment securities and unrealized appreciation (depreciation) as of period end were as follows:
Gross unrealized appreciation | $ 262,984,526 |
Gross unrealized depreciation | (85,038,817) |
Net unrealized appreciation (depreciation) on securities and other investments | $ 177,945,709 |
| |
Tax Cost | $ 1,734,004,109 |
The tax-based components of distributable earnings as of period end were as follows:
Undistributed long-term capital gain | $ 66,152,857 |
Net unrealized appreciation (depreciation) | $ 177,934,714 |
The tax character of distributions paid was as follows:
| July 31, 2012 | July 31, 2011 |
Long-term Capital Gains | $ 34,799,429 | $ 3,013,255 |
Short-Term Trading (Redemption) Fees. Shares held by investors in the Fund less than 90 days are subject to a redemption fee equal to 1.50% of the net asset value of shares redeemed. All redemption fees, which reduce the proceeds of the shareholder redemption, are retained by the Fund and accounted for as an addition to paid in capital.
New Accounting Pronouncement. In December 2011, the Financial Accounting Standards Board issued Accounting Standard Update No. 2011-11, Disclosures about Offsetting Assets and Liabilities. The update creates new disclosure requirements requiring entities to disclose both gross and net information for derivatives and other financial instruments that are either offset in the Statement of Assets and Liabilities or subject to an enforceable master netting arrangement or similar agreement. The disclosure requirements are effective for interim and annual reporting periods beginning on or after January 1, 2013. Management is currently evaluating the impact of the update's adoption on the Fund's financial statement disclosures.
Annual Report
Notes to Financial Statements - continued
4. Derivative Instruments.
Risk Exposures and the Use of Derivative Instruments. The Fund's investment objectives allow the Fund to enter into various types of derivative contracts, including futures contracts. Derivatives are investments whose value is derived from underlying assets, indices or reference rates and may be transacted on an exchange or over-the-counter (OTC). Derivatives may involve a future commitment to buy or sell a specified instrument based on specified terms, or to exchange future cash flows at periodic intervals based on a notional principal amount. The Fund used derivatives to increase returns and to manage exposure to certain risks as defined below. The success of any strategy involving derivatives depends on analysis of numerous economic factors, and if the strategies for investment do not work as intended, the Fund may not achieve its objectives.
The Fund's use of derivatives increased or decreased its exposure to the following risk:
Equity Risk | Equity risk relates to the fluctuations in the value of financial instruments as a result of changes in market prices (other than those arising from interest rate risk or foreign exchange risk), whether caused by factors specific to an individual investment, its issuer, or all factors affecting all instruments traded in a market or market segment. |
The Fund is also exposed to additional risks from investing in derivatives, such as liquidity risk and counterparty credit risk. Liquidity risk is the risk that the Fund will be unable to close out the derivative in the open market in a timely manner. Counterparty credit risk is the risk that the counterparty will not be able to fulfill its obligation to the Fund. Counterparty credit risk related to exchange-traded futures contracts is minimal because of the protection provided by the exchange on which they trade. Investing in derivatives may involve greater risks than investing in the underlying assets directly and, to varying degrees, involves risk of loss in excess of the initial investment, if any, collateral received and amounts recognized in the Statement of Assets and Liabilities. In addition, for futures contracts, there is the risk that the change in value of the derivative contract may not correspond to the change in value of the underlying instrument.
Futures Contracts. A futures contract is an agreement between two parties to buy or sell a specified underlying instrument for a fixed price at a specified future date. The Fund used futures contracts to manage its exposure to the stock market.
Upon entering into a futures contract, a fund is required to deposit either cash or securities (initial margin) with a clearing broker in an amount equal to a certain percentage of the face value of the contract. Futures contracts are marked-to-market daily and subsequent payments are made or received by a fund depending on the daily fluctuations in the value of the futures contracts and are recorded as unrealized appreciation or (depreciation). This receivable and/or payable is included in daily variation margin on
Annual Report
4. Derivative Instruments - continued
Futures Contracts - continued
futures contracts in the Statement of Assets and Liabilities. Realized gain or (loss) is recorded upon the expiration or closing of a futures contract.
Any open futures contracts at period end are shown in the Schedule of Investments under the caption "Futures Contracts." The underlying face amount at value reflects each contract's exposure to the underlying instrument at period end.
During the period the Fund recognized net realized gain (loss) of $5,787,075 related to its investment in futures contracts. This amount is included in the Statement of Operations.
5. Purchases and Sales of Investments.
Purchases and sales of securities, other than short-term securities, aggregated $2,541,649,453 and $2,542,251,432, respectively.
6. Fees and Other Transactions with Affiliates.
Management Fee. FMR and its affiliates provide the Fund with investment management related services for which the Fund pays a monthly management fee. The management fee is the sum of an individual fund fee rate that is based on an annual rate of .45% of the Fund's average net assets and an annualized group fee rate that averaged .26% during the period. The group fee rate is based upon the average net assets of all the mutual funds advised by FMR. The group fee rate decreases as assets under management increase and increases as assets under management decrease. In addition, the management fee is subject to a performance adjustment (up to a maximum of ± .20% of the Fund's average net assets over a 36 month performance period). The upward or downward adjustment to the management fee is based on the relative investment performance of Small Cap Growth as compared to an appropriate benchmark index. For the period, the total annual management fee rate, including the performance adjustment, was .76% of the Fund's average net assets.
Distribution and Service Plan Fees. In accordance with Rule 12b-1 of the 1940 Act, the Fund has adopted separate Distribution and Service Plans for each class of shares. Certain classes pay Fidelity Distributors Corporation (FDC), an affiliate of FMR, separate Distribution and Service Fees, each of which is based on an annual percentage of each class' average net assets. In addition, FDC may pay financial intermediaries for selling shares of the Fund and providing shareholder support services. For the period,
Annual Report
Notes to Financial Statements - continued
6. Fees and Other Transactions with Affiliates - continued
Distribution and Service Plan Fees - continued
the Distribution and Service Fee rates, total fees and amounts retained by FDC were as follows:
| Distribution
Fee | Service
Fee | Total Fees | Retained
by FDC |
Class A | -% | .25% | $ 149,665 | $ 2,982 |
Class T | .25% | .25% | 135,654 | 40 |
Class B | .75% | .25% | 44,856 | 33,711 |
Class C | .75% | .25% | 233,186 | 40,343 |
| | | $ 563,361 | $ 77,076 |
Sales Load. FDC may receive a front-end sales charge of up to 5.75% for selling Class A shares and 3.50% for selling Class T shares, some of which is paid to financial intermediaries for selling shares of the Fund. Depending on the holding period, FDC may receive contingent deferred sales charges levied on Class A, Class T, Class B, and Class C redemptions. The deferred sales charges range from 5.00% to 1.00% for Class B shares, 1.00% for Class C shares, 1.00% for certain purchases of Class A shares and .25% for certain purchases of Class T shares.
For the period, sales charge amounts retained by FDC were as follows:
| Retained
by FDC |
Class A | $ 18,734 |
Class T | 6,727 |
Class B* | 6,869 |
Class C* | 3,375 |
| $ 35,705 |
* When Class B and Class C shares are initially sold, FDC pays commissions from its own resources to financial intermediaries through which the sales are made.
Transfer Agent Fees. Fidelity Investments Institutional Operations Company, Inc. (FIIOC), an affiliate of FMR, is the transfer, dividend disbursing and shareholder servicing agent for each class of the Fund. FIIOC receives account fees and asset-based fees that vary according to the account size and type of account of the shareholders of the respective classes of the Fund, except for Class F. FIIOC receives no fees for providing transfer agency services to Class F. FIIOC pays for typesetting, printing and mailing of
Annual Report
6. Fees and Other Transactions with Affiliates - continued
Transfer Agent Fees - continued
shareholder reports, except proxy statements. For the period, transfer agent fees for each class were as follows:
| Amount | % of
Average
Net Assets |
Class A | $ 180,619 | .30 |
Class T | 83,964 | .31 |
Class B | 13,505 | .30 |
Class C | 70,300 | .30 |
Small Cap Growth | 2,720,942 | .23 |
Institutional Class | 96,167 | .26 |
| $ 3,165,497 | |
Accounting and Security Lending Fees. Fidelity Service Company, Inc. (FSC), an affiliate of FMR, maintains the Fund's accounting records. The accounting fee is based on the level of average net assets for each month. Under a separate contract, FSC administers the security lending program. The security lending fee is based on the number and duration of lending transactions.
Brokerage Commissions. The Fund placed a portion of its portfolio transactions with brokerage firms which are affiliates of the investment adviser. The commissions paid to these affiliated firms were $106,659 for the period.
7. Committed Line of Credit.
The Fund participates with other funds managed by FMR or an affiliate in a $4.25 billion credit facility (the "line of credit") to be utilized for temporary or emergency purposes to fund shareholder redemptions or for other short-term liquidity purposes. The Fund has agreed to pay commitment fees on its pro-rata portion of the line of credit, which amounted to $4,901 and is reflected in Miscellaneous expenses on the Statement of Operations. During the period, there were no borrowings on this line of credit.
8. Security Lending.
The Fund lends portfolio securities through a lending agent from time to time in order to earn additional income. For equity securities, a lending agent is used and may loan securities to certain qualified borrowers, including Fidelity Capital Markets (FCM), a broker-dealer affiliated with the Fund. On the settlement date of the loan, the Fund receives collateral (in the form of U.S. Treasury obligations, letters of credit and/or cash)
Annual Report
Notes to Financial Statements - continued
8. Security Lending - continued
against the loaned securities and maintains collateral in an amount not less than 100% of the market value of the loaned securities during the period of the loan. The market value of the loaned securities is determined at the close of business of the Fund and any additional required collateral is delivered to the Fund on the next business day. If the borrower defaults on its obligation to return the securities loaned because of insolvency or other reasons, a fund could experience delays and costs in recovering the securities loaned or in gaining access to the collateral. Any cash collateral received is invested in the Fidelity Securities Lending Cash Central Fund. The value of loaned securities and cash collateral at period end are disclosed on the Fund's Statement of Assets and Liabilities. The value of securities loaned to FCM at period end was $3,791,412. Security lending income represents the income earned on investing cash collateral, less rebates paid to borrowers and any lending agent fees associated with the loan, plus any premium payments received for lending certain types of securities. Security lending income is presented in the Statement of Operations as a component of income from Fidelity Central Funds, and includes $75,770 from securities loaned to FCM.
9. Expense Reductions.
Many of the brokers with whom FMR places trades on behalf of the Fund provided services to the Fund in addition to trade execution. These services included payments of certain expenses on behalf of the Fund totaling $174,463 for the period. In addition, through arrangements with the Fund's custodian, credits realized as a result of uninvested cash balances were used to reduce the Fund's expenses. During the period, these credits reduced the Fund's custody expenses by $222.
10. Distributions to Shareholders.
Distributions to shareholders of each class were as follows:
Years ended July 31, | 2012 | 2011 |
From net realized gain | | |
Class A | $ 1,262,924 | $ 40,130 |
Class T | 573,407 | - |
Class B | 101,910 | - |
Class C | 481,854 | - |
Small Cap Growth | 25,434,274 | 2,420,020 |
Class F | 6,152,820 | 492,928 |
Institutional Class | 792,240 | 60,177 |
Total | $ 34,799,429 | $ 3,013,255 |
Annual Report
11. Share Transactions.
Transactions for each class of shares were as follows:
| Shares | Dollars |
Years ended July 31, | 2012 | 2011 | 2012 | 2011 |
Class A | | | | |
Shares sold | 986,718 | 1,459,436 | $ 14,926,996 | $ 22,640,692 |
Reinvestment of distributions | 85,896 | 2,323 | 1,194,285 | 36,172 |
Shares redeemed | (1,407,222) | (1,364,690) | (21,375,353) | (20,977,078) |
Net increase (decrease) | (334,608) | 97,069 | $ (5,254,072) | $ 1,699,786 |
Class T | | | | |
Shares sold | 358,193 | 420,613 | $ 5,456,756 | $ 6,491,294 |
Reinvestment of distributions | 38,774 | - | 533,890 | - |
Shares redeemed | (523,310) | (434,512) | (7,812,853) | (6,714,256) |
Net increase (decrease) | (126,343) | (13,899) | $ (1,822,207) | $ (222,962) |
Class B | | | | |
Shares sold | 11,810 | 25,204 | $ 172,624 | $ 366,276 |
Reinvestment of distributions | 7,173 | - | 96,091 | - |
Shares redeemed | (81,516) | (109,118) | (1,196,288) | (1,597,390) |
Net increase (decrease) | (62,533) | (83,914) | $ (927,573) | $ (1,231,114) |
Class C | | | | |
Shares sold | 405,451 | 469,568 | $ 5,976,693 | $ 7,154,653 |
Reinvestment of distributions | 33,110 | - | 443,092 | - |
Shares redeemed | (384,855) | (368,398) | (5,527,477) | (5,494,248) |
Net increase (decrease) | 53,706 | 101,170 | $ 892,308 | $ 1,660,405 |
Small Cap Growth | | | | |
Shares sold | 14,552,522 | 19,971,507 | $ 226,496,807 | $ 315,167,556 |
Reinvestment of distributions | 1,774,167 | 153,921 | 25,022,882 | 2,384,001 |
Shares redeemed | (27,135,724) | (31,144,660) | (414,348,619) | (483,710,319) |
Net increase (decrease) | (10,809,035) | (11,019,232) | $ (162,828,930) | $ (166,158,762) |
Class F | | | | |
Shares sold | 16,430,240 | 11,382,202 | $ 255,874,632 | $ 176,012,143 |
Reinvestment of distributions | 432,802 | 31,816 | 6,152,820 | 492,928 |
Shares redeemed | (1,757,546) | (2,356,621) | (26,811,905) | (37,493,486) |
Net increase (decrease) | 15,105,496 | 9,057,397 | $ 235,215,547 | $ 139,011,585 |
Institutional Class | | | | |
Shares sold | 819,623 | 1,038,111 | $ 12,520,738 | $ 16,415,657 |
Reinvestment of distributions | 44,186 | 2,532 | 624,723 | 39,301 |
Shares redeemed | (1,078,752) | (555,221) | (16,617,897) | (8,700,391) |
Net increase (decrease) | (214,943) | 485,422 | $ (3,472,436) | $ 7,754,567 |
Annual Report
Notes to Financial Statements - continued
12. Other.
The Fund's organizational documents provide former and current trustees and officers with a limited indemnification against liabilities arising in connection with the performance of their duties to the Fund. In the normal course of business, the Fund may also enter into contracts that provide general indemnifications. The Fund's maximum exposure under these arrangements is unknown as this would be dependent on future claims that may be made against the Fund. The risk of material loss from such claims is considered remote.
At the end of the period, the Fidelity Advisor Freedom Funds, the Fidelity Freedom Funds and the Fidelity Freedom K Funds were the owners of record, in the aggregate, of approximately 60% of the total outstanding shares of the Fund.
Annual Report
To the Trustees of Fidelity Securities Fund and the Shareholders of Fidelity Small Cap Growth Fund:
In our opinion, the accompanying statement of assets and liabilities, including the schedule of investments, and the related statements of operations and of changes in net assets and the financial highlights present fairly, in all material respects, the financial position of Fidelity Small Cap Growth Fund (a fund of Fidelity Securities Fund) at July 31, 2012, the results of its operations for the year then ended, the changes in its net assets for each of the two years in the period then ended and the financial highlights for each of the periods indicated, in conformity with accounting principles generally accepted in the United States of America. These financial statements and financial highlights (hereafter referred to as "financial statements") are the responsibility of the Fidelity Small Cap Growth Fund's management. Our responsibility is to express an opinion on these financial statements based on our audits. We conducted our audits of these financial statements in accordance with the standards of the Public Company Accounting Oversight Board (United States). Those standards require that we plan and perform the audit to obtain reasonable assurance about whether the financial statements are free of material misstatement. An audit includes examining, on a test basis, evidence supporting the amounts and disclosures in the financial statements, assessing the accounting principles used and significant estimates made by management, and evaluating the overall financial statement presentation. We believe that our audits, which included confirmation of securities at July 31, 2012 by correspondence with the custodian brokers and transfer agent, provide a reasonable basis for our opinion.
PricewaterhouseCoopers LLP
Boston, Massachusetts
September 12, 2012
Annual Report
The Trustees, Members of the Advisory Board, and executive officers of the trust and fund, as applicable, are listed below. The Board of Trustees governs the fund and is responsible for protecting the interests of shareholders. The Trustees are experienced executives who meet periodically throughout the year to oversee the fund's activities, review contractual arrangements with companies that provide services to the fund, oversee management of the risks associated with such activities and contractual arrangements, and review the fund's performance. Except for James C. Curvey, each of the Trustees oversees 228 funds advised by FMR or an affiliate. Mr. Curvey oversees 435 funds advised by FMR or an affiliate.
The Trustees hold office without limit in time except that (a) any Trustee may resign; (b) any Trustee may be removed by written instrument, signed by at least two-thirds of the number of Trustees prior to such removal; (c) any Trustee who requests to be retired or who has become incapacitated by illness or injury may be retired by written instrument signed by a majority of the other Trustees; and (d) any Trustee may be removed at any special meeting of shareholders by a two-thirds vote of the outstanding voting securities of the trust. Each Trustee who is not an interested person (as defined in the 1940 Act) (Independent Trustee), shall retire not later than the last day of the calendar year in which his or her 75th birthday occurs. The Independent Trustees may waive this mandatory retirement age policy with respect to individual Trustees. The executive officers and Advisory Board Members hold office without limit in time, except that any officer and Advisory Board Member may resign or may be removed by a vote of a majority of the Trustees at any regular meeting or any special meeting of the Trustees. Except as indicated, each individual has held the office shown or other offices in the same company for the past five years.
Experience, Skills, Attributes, and Qualifications of the Fund's Trustees. The Governance and Nominating Committee has adopted a statement of policy that describes the experience, qualifications, attributes, and skills that are necessary and desirable for potential Independent Trustee candidates (Statement of Policy). The Board believes that each Trustee satisfied at the time he or she was initially elected or appointed a Trustee, and continues to satisfy, the standards contemplated by the Statement of Policy. The Governance and Nominating Committee also engages professional search firms to help identify potential Independent Trustee candidates who have the experience, qualifications, attributes, and skills consistent with the Statement of Policy. From time to time, additional criteria based on the composition and skills of the current Independent Trustees, as well as experience or skills that may be appropriate in light of future changes to board composition, business conditions, and regulatory or other developments, have also been considered by the professional search firms and the Governance and Nominating Committee. In addition, the Board takes into account the Trustees' commitment and participation in Board and committee meetings, as well as their leadership of standing and ad hoc committees throughout their tenure.
In determining that a particular Trustee was and continues to be qualified to serve as a Trustee, the Board has considered a variety of criteria, none of which, in isolation, was controlling. The Board believes that, collectively, the Trustees have balanced and diverse experience, qualifications, attributes, and skills, which allow the Board to operate effectively in governing the fund and protecting the interests of shareholders. Information about the specific experience, skills, attributes, and qualifications of each Trustee, which in each case led to the Board's conclusion that the Trustee should serve (or continue to serve) as a trustee of the fund, is provided below.
Annual Report
Board Structure and Oversight Function. James C. Curvey is an interested person (as defined in the 1940 Act) and currently serves as Chairman. The Trustees have determined that an interested Chairman is appropriate and benefits shareholders because an interested Chairman has a personal and professional stake in the quality and continuity of services provided to the fund. Independent Trustees exercise their informed business judgment to appoint an individual of their choosing to serve as Chairman, regardless of whether the Trustee happens to be independent or a member of management. The Independent Trustees have determined that they can act independently and effectively without having an Independent Trustee serve as Chairman and that a key structural component for assuring that they are in a position to do so is for the Independent Trustees to constitute a substantial majority for the Board. The Independent Trustees also regularly meet in executive session. Ned C. Lautenbach serves as Chairman of the Independent Trustees and as such (i) acts as a liaison between the Independent Trustees and management with respect to matters important to the Independent Trustees and (ii) with management prepares agendas for Board meetings.
Fidelity funds are overseen by different Boards of Trustees. The fund's Board oversees Fidelity's equity and high income funds and another Board oversees Fidelity's investment-grade bond, money market, and asset allocation funds. The asset allocation funds may invest in Fidelity funds overseen by the fund's Board. The use of separate Boards, each with its own committee structure, allows the Trustees of each group of Fidelity funds to focus on the unique issues of the funds they oversee, including common research, investment, and operational issues. On occasion, the separate Boards establish joint committees to address issues of overlapping consequences for the Fidelity funds overseen by each Board.
The Trustees operate using a system of committees to facilitate the timely and efficient consideration of all matters of importance to the Trustees, the fund, and fund shareholders and to facilitate compliance with legal and regulatory requirements and oversight of the fund's activities and associated risks. The Board, acting through its committees, has charged FMR and its affiliates with (i) identifying events or circumstances the occurrence of which could have demonstrably adverse effects on the fund's business and/or reputation; (ii) implementing processes and controls to lessen the possibility that such events or circumstances occur or to mitigate the effects of such events or circumstances if they do occur; and (iii) creating and maintaining a system designed to evaluate continuously business and market conditions in order to facilitate the identification and implementation processes described in (i) and (ii) above. Because the day-to-day operations and activities of the fund are carried out by or through FMR, its affiliates and other service providers, the fund's exposure to risks is mitigated but not eliminated by the processes overseen by the Trustees. While each of the Board's committees has responsibility for overseeing different aspects of the fund's activities, oversight is exercised primarily through the Operations, Audit, and Compliance Committees. In addition, the Independent Trustees have worked with FMR to enhance the Board's oversight of investment and financial risks, legal and regulatory risks, technology risks, and operational risks, including the development of additional risk reporting to the Board. For example, a working group comprised of Independent Trustees and FMR has worked and continues to work to review the Fidelity funds' valuation-related activities, reporting and risk management. Appropriate personnel, including but not limited to the fund's Chief Compliance Officer (CCO), FMR's internal auditor, the independent accountants, the fund's Treasurer and portfolio management personnel, make periodic reports to the Board's committees, as appropriate, including an annual review of FMR's risk management program for the Fidelity funds. The responsibilities of each standing committee, including their oversight responsibilities, are described further under "Standing Committees of the Fund's Trustees."
Annual Report
Trustees and Officers - continued
The fund's Statement of Additional Information (SAI) includes more information about the Trustees. To request a free copy, call Fidelity at 1-800-835-5092.
Interested Trustees*:
Correspondence intended for each Trustee who is an interested person may be sent to Fidelity Investments, 82 Devonshire Street, Boston, Massachusetts 02109.
Name, Age; Principal Occupations and Other Relevant Experience+ |
James C. Curvey (77) |
| Year of Election or Appointment: 2007 Mr. Curvey is Trustee and Chairman of the Board of Trustees of certain Trusts. Mr. Curvey also serves as Trustee (2007-present) of other investment companies advised by FMR. Mr. Curvey is a Director of Fidelity Investments Money Management, Inc. (2009-present), Director of Fidelity Research & Analysis Co. (2009-present) and Director of FMR and FMR Co., Inc. (2007-present). Mr. Curvey is also Vice Chairman (2007-present) and Director of FMR LLC. In addition, Mr. Curvey serves as an Overseer for the Boston Symphony Orchestra and a member of the Trustees of Villanova University. Previously, Mr. Curvey was the Vice Chairman (2006-2007) and Director (2000-2007) of FMR Corp. |
Ronald P. O'Hanley (55) |
| Year of Election or Appointment: 2011 Mr. O'Hanley is Director of FMR Co., Inc. (2010-present), Director of Fidelity Investments Money Management, Inc. (2010-present), Director of Fidelity Research & Analysis Company (2010-present), President of Fidelity Asset Management and Corporate Services and a member of Fidelity's Executive Committee (2010-present). Previously, Mr. O'Hanley served as President and Chief Executive Officer of BNY Mellon Asset Management (2007-2010). Mr. O'Hanley also served as Vice Chairman of Bank New York Mellon Corp. and a member of that firm's Executive Committee. Prior to the 2007 merger of The Bank of New York and Mellon Financial Corporation, he was Vice Chairman of Mellon Financial Corporation and President and Chief Executive Officer of Mellon Asset Management. He joined Mellon in February 1997. Mr. O'Hanley currently serves as Chairman of the Boston Public Library Foundation Board of Directors and sits on the Board of Directors of Beth Israel Deaconess Medical Center, the Board of Trustees of the Marine Biological Laboratory and the Advisory Board of the Maxwell School of Citizenship and Public Administration at Syracuse University. Mr. O'Hanley also chairs the Council on Asset Management for the Financial Services Roundtable and is a member of the Board of Directors of Institutional Investor's U.S. Institute. |
* Trustees have been determined to be "Interested Trustees" by virtue of, among other things, their affiliation with the trusts or various entities under common control with FMR.
+ The information above includes each Trustee's principal occupation during the last five years and other information relating to the experience, attributes, and skills relevant to each Trustee's qualifications to serve as a Trustee, which led to the conclusion that each Trustee should serve as a Trustee for the fund.
Annual Report
Trustees and Officers - continued
Independent Trustees:
Correspondence intended for each Independent Trustee (that is, the Trustees other than the Interested Trustees) may be sent to Fidelity Investments, P.O. Box 55235, Boston, Massachusetts 02205-5235.
Name, Age; Principal Occupations and Other Relevant Experience+ |
Dennis J. Dirks (64) |
| Year of Election or Appointment: 2005 Prior to his retirement in May 2003, Mr. Dirks was Chief Operating Officer and a member of the Board of The Depository Trust & Clearing Corporation (DTCC). He also served as President, Chief Operating Officer, and Board member of The Depository Trust Company (DTC) and President and Board member of the National Securities Clearing Corporation (NSCC). In addition, Mr. Dirks served as Chief Executive Officer and Board member of the Government Securities Clearing Corporation, Chief Executive Officer and Board member of the Mortgage-Backed Securities Clearing Corporation, as a Trustee and a member of the Finance Committee of Manhattan College (2005-2008), and as a Trustee and a member of the Finance Committee of AHRC of Nassau County (2006-2008). Mr. Dirks is a member of the Independent Directors Council (IDC) Governing Council (2010-present) and Board of Directors for The Brookville Center for Children's Services, Inc. (2009-present). |
Alan J. Lacy (58) |
| Year of Election or Appointment: 2008 Mr. Lacy serves as Senior Adviser (2007-present) of Oak Hill Capital Partners, L.P. (private equity). Mr. Lacy also served as Chief Executive Officer (2000-2005) and Vice Chairman (2005-2006) of Sears Holdings Corporation and Sears, Roebuck and Co. (retail). In addition, Mr. Lacy serves as a member of the Board of Directors of Dave & Buster's Entertainment, Inc. (restaurant and entertainment complexes, 2010-present), Earth Fare, Inc. (retail grocery, 2012-present), The Hillman Companies, Inc. (hardware wholesalers, 2010-present), and Bristol-Myers Squibb Company (global pharmaceuticals, 2007-present). Mr. Lacy is a member of the Board of Trustees of The National Parks Conservation Association (2006-present). Previously, Mr. Lacy served as Chairman of the Board of Trustees of the National Parks Conservation Association (2008-2011) and as a member of the Board of Directors for the Western Union Company (global money transfer, 2006-2011). |
Ned C. Lautenbach (68) |
| Year of Election or Appointment: 2000 Mr. Lautenbach is Chairman of the Independent Trustees of the Equity and High Income Funds (2006-present). Mr. Lautenbach currently serves as the Lead Director of the Eaton Corporation Board of Directors (diversified industrial, 1997-present). Mr. Lautenbach is Chairman of the Board of Directors of the Philharmonic Center for the Arts in Naples, Florida (2012-present) and a member of the Council on Foreign Relations (1994-present). Previously, Mr. Lautenbach was a Partner/Advisory Partner at Clayton, Dubilier & Rice, LLC (private equity investment, 1998-2010), as well as a Director of Sony Corporation (2006-2007). |
Joseph Mauriello (67) |
| Year of Election or Appointment: 2008 Prior to his retirement in January 2006, Mr. Mauriello served in numerous senior management positions including Deputy Chairman and Chief Operating Officer (2004-2005), and Vice Chairman of Financial Services (2002-2004) of KPMG LLP US (professional services, 1965-2005). Mr. Mauriello currently serves as a member of the Board of Directors of XL Group plc. (global insurance and re-insurance, 2006-present). Previously, Mr. Mauriello served as a Director of the Hamilton Funds of the Bank of New York (2006-2007) and of Arcadia Resources Inc. (health care services and products, 2007-2012). |
Robert W. Selander (61) |
| Year of Election or Appointment: 2011 Previously, Mr. Selander served as a Member of the Advisory Board of Fidelity's Equity and High Income Funds (2011), Executive Vice Chairman (2010), Chief Executive Officer (2009-2010), and President and Chief Executive Officer (1997-2009) of Mastercard, Inc. |
Cornelia M. Small (68) |
| Year of Election or Appointment: 2005 Ms. Small is a member of the Board of Directors of the Teagle Foundation (2009-present). Ms. Small is also a member of the Investment Committee, and Chair (2008-present) and a member of the Board of Trustees of Smith College. In addition, Ms. Small serves on the Investment Committee of the Berkshire Taconic Community Foundation (2008-present). Previously, Ms. Small served as Chairperson of the Investment Committee (2002-2008) of Smith College. In addition, Ms. Small served as Chief Investment Officer, Director of Global Equity Investments, and a member of the Board of Directors of Scudder, Stevens & Clark and Scudder Kemper Investments. |
William S. Stavropoulos (73) |
| Year of Election or Appointment: 2002 Mr. Stavropoulos is Vice Chairman of the Independent Trustees of the Equity and High Income Funds (2006-present). Mr. Stavropoulos serves as President and Founder of the Michigan Baseball Foundation, the Great Lakes Loons (2007-present). Mr. Stavropoulos is Chairman Emeritus of the Board of Directors of The Dow Chemical Company, where he previously served in numerous senior management positions, including President, CEO (1995-2000; 2002-2004), Chairman of the Executive Committee (2000-2006), and as a member of the Board of Directors (1990-2006). Currently, Mr. Stavropoulos is Chairman of Univar (global distributor of commodity and specialty chemicals, 2010-present), a Director of Teradata Corporation (data warehousing and technology solutions, 2008-present), Chemical Financial Corporation, Maersk Inc. (industrial conglomerate), Tyco International, Inc. (multinational manufacturing and services, 2007-present), and a member of the Advisory Board for Metalmark Capital (private equity investment, 2005-present). Mr. Stavropoulos is a special advisor to Clayton, Dubilier & Rice, LLC (private equity investment). In addition, Mr. Stavropoulos is a member of the University of Notre Dame Advisory Council for the College of Science. |
David M. Thomas (63) |
| Year of Election or Appointment: 2008 Previously, Mr. Thomas served as Executive Chairman (2005-2006) and Chairman and Chief Executive Officer (2000-2005) of IMS Health, Inc. (pharmaceutical and healthcare information solutions). In addition, Mr. Thomas serves as a member of the Board of Directors of Fortune Brands, Inc. (consumer products), and Interpublic Group of Companies, Inc. (marketing communication, 2004-present). |
Michael E. Wiley (61) |
| Year of Election or Appointment: 2008 Mr. Wiley also serves as a Director of Asia Pacific Exploration Consolidated (international oil and gas exploration and production, 2008-present). Mr. Wiley serves as a Director of Tesoro Corporation (independent oil refiner and marketer, 2005-present), and a Director of Bill Barrett Corporation (exploration and production, 2005-present). In addition, Mr. Wiley also serves as a Director of Post Oak Bank (privately-held bank, 2004-present). Previously, Mr. Wiley served as a member of the Board of Trustees of the University of Tulsa (2000-2006; 2007-2010), as a Senior Energy Advisor of Katzenbach Partners, LLC (consulting, 2006-2007), as an Advisory Director of Riverstone Holdings (private investment), Chairman, President, and CEO of Baker Hughes, Inc. (oilfield services, 2000-2004), and as Director of Spinnaker Exploration Company (exploration and production, 2001-2005). |
Annual Report
+ The information above includes each Trustee's principal occupation during the last five years and other information relating to the experience, attributes, and skills relevant to each Trustee's qualifications to serve as a Trustee, which led to the conclusion that each Trustee should serve as a Trustee for the fund.
Advisory Board Members and Executive Officers:
Correspondence intended for David A. Rosow and Garnett A. Smith may be sent to Fidelity Investments, P.O. Box 55235, Boston, Massachusetts 02205-5235. Correspondence intended for each executive officer, Edward C. Johnson 3d, and Peter S. Lynch may be sent to Fidelity Investments, 82 Devonshire Street, Boston, Massachusetts 02109.
Name, Age; Principal Occupation |
Edward C. Johnson 3d (82) |
| Year of Election or Appointment: 2011 Member of the Advisory Board of Fidelity's Equity and High Income Funds. Mr. Johnson serves as Chief Executive Officer, Chairman, and a Director of FMR LLC, and also serves as Chairman and Director of FIL Limited. Previously, Mr. Johnson served as a Trustee and Chairman of the Board of certain Fidelity Trusts, Chairman and a Director of FMR, Chairman and a Director of FMR Co., Inc., and President of FMR LLC (2006-2007). |
Peter S. Lynch (68) |
| Year of Election or Appointment: 2003 Member of the Advisory Board of Fidelity's Equity and High Income Funds. Mr. Lynch is Vice Chairman and a Director of FMR and FMR Co., Inc. In addition, Mr. Lynch serves as a Trustee of Boston College and as the Chairman of the Inner-City Scholarship Fund. Previously, Mr. Lynch served on the Special Olympics International Board of Directors (1997-2006). |
David A. Rosow (69) |
| Year of Election or Appointment: 2012 Member of the Advisory Board of Fidelity's Equity and High Income Funds. Chairman and Chief Executive Officer of International Golf Group, Inc. (golf course development, 1990-present). Previously, Mr. Rosow served as Chairman and Chief Executive Officer of Rosow & Company, Inc. (private investment company, 1989-2011), a Lead Director of Hudson United Bancorp (2001-2006) and as a Director of TD Banknorth (1996-2006). In addition, Mr. Rosow is a member (2008-present) and President (2009-present) of the Town Council of Palm Beach, Florida. |
Garnett A. Smith (64) |
| Year of Election or Appointment: 2012 Member of the Advisory Board of Fidelity's Equity and High Income Funds. Prior to Mr. Smith's retirement, he served as Chairman and Chief Executive Officer of Inbrand Corp. (manufacturer of personal absorbent products, 1990-1997). He also served as President (1986-1990) of Inbrand Corp. Prior to his employment with Inbrand Corp., he was employed by a retail fabric chain and North Carolina National Bank. In addition, Mr. Smith is a board member of the Jackson Hole Land Trust (2009-present). |
Kenneth B. Robins (42) |
| Year of Election or Appointment: 2008 President and Treasurer of Fidelity's Equity and High Income Funds. Mr. Robins also serves as President and Treasurer (2010-present) and Assistant Treasurer (2009-present) of other Fidelity funds and is an employee of Fidelity Investments (2004-present). Previously, Mr. Robins served as Deputy Treasurer of the Fidelity funds (2005-2008) and Treasurer and Chief Financial Officer of The North Carolina Capital Management Trust: Cash and Term Portfolios (2006-2008). |
Brian B. Hogan (47) |
| Year of Election or Appointment: 2009 Vice President of Equity and High Income Funds. Mr. Hogan also serves as President of FMR's Equity Division (2009-present). Previously, Mr. Hogan served as Senior Vice President, Equity Research of FMR (2006-2009) and as a portfolio manager. |
Thomas C. Hense (48) |
| Year of Election or Appointment: 2008 or 2010 Vice President of Fidelity's High Income (2008), Small Cap (2008), and Value (2010) Funds. Previously, Mr. Hense served as a portfolio manager for Fidelity's Institutional Money Management Group (Pyramis) (2003-2008). |
Scott C. Goebel (44) |
| Year of Election or Appointment: 2008 Secretary and Chief Legal Officer (CLO) of the Fidelity funds. Mr. Goebel also serves as Secretary of Fidelity Investments Money Management, Inc. (FIMM) (2010-present) and Fidelity Research and Analysis Company (FRAC) (2010-present); Secretary and CLO of The North Carolina Capital Management Trust: Cash and Term Portfolios (2008-present); General Counsel, Secretary, and Senior Vice President of FMR (2008-present) and FMR Co., Inc. (2008-present); employed by FMR LLC or an affiliate (2001-present); Chief Legal Officer of Fidelity Management & Research (Hong Kong) Limited (2008-present) and Assistant Secretary of Fidelity Management & Research (Japan) Inc. (2008-present), and Fidelity Management & Research (U.K.) Inc. (2008-present). Previously, Mr. Goebel served as Assistant Secretary of FIMM (2008-2010), FRAC (2008-2010), and the Funds (2007-2008) and as Vice President and Secretary of Fidelity Distributors Corporation (FDC) (2005-2007). |
William C. Coffey (43) |
| Year of Election or Appointment: 2009 Assistant Secretary of Fidelity's Equity and High Income Funds. Mr. Coffey also serves as Senior Vice President and Deputy General Counsel of FMR LLC (2010-present), and is an employee of Fidelity Investments. Previously, Mr. Coffey served as Vice President and Associate General Counsel of FMR LLC (2005-2009). |
Elizabeth Paige Baumann (44) |
| Year of Election or Appointment: 2012 Anti-Money Laundering (AML) Officer of the Fidelity funds. Ms. Baumann also serves as AML Officer of The North Carolina Capital Management Trust: Cash and Term Portfolios (2012-present), Chief AML Officer of FMR LLC (2012-present), and is an employee of Fidelity Investments. Previously, Ms. Baumann served as Vice President and Deputy Anti-Money Laundering Officer (2007-2012). |
Christine Reynolds (53) |
| Year of Election or Appointment: 2008 Chief Financial Officer of the Fidelity funds. Ms. Reynolds became President of Fidelity Pricing and Cash Management Services (FPCMS) in August 2008. Ms. Reynolds served as Chief Operating Officer of FPCMS (2007-2008). Previously, Ms. Reynolds served as President, Treasurer, and Anti-Money Laundering officer of the Fidelity funds (2004-2007). |
Joseph A. Hanlon (44) |
| Year of Election or Appointment: 2012 Chief Compliance Officer of Fidelity's Equity and High Income Funds. Mr. Hanlon serves as Compliance Officer of FMR, FMR Co., Inc., Fidelity Investments Money Management, Inc. (FIMM), Fidelity Research and Analysis Company (FRAC), Fidelity Management & Research (Japan) Inc., Fidelity Management & Research (U.K.) Inc., Fidelity Management & Research (Hong Kong), and Strategic Advisers, Inc. (2009-present), as Senior Vice President of the Fidelity Asset Management Division (2009-present), and is an employee of Fidelity Investments. |
Joseph F. Zambello (55) |
| Year of Election or Appointment: 2011 Deputy Treasurer of the Fidelity funds. Mr. Zambello is an employee of Fidelity Investments. Previously, Mr. Zambello served as Vice Presidentof FMR's Program Management Group (2009-2011) and Vice President of the Transfer Agent Oversight Group (2005-2009). |
Adrien E. Deberghes (44) |
| Year of Election or Appointment: 2008 Deputy Treasurer of Fidelity's Equity and High Income Funds. Mr. Deberghes also serves as Vice President (2011-present) and Assistant Treasurer (2010-present) of other Fidelity funds, and is an employee of Fidelity Investments (2008-present). Previously, Mr. Deberghes served as Senior Vice President of Mutual Fund Administration at State Street Corporation (2007-2008), Senior Director of Mutual Fund Administration at Investors Bank & Trust (2005-2007), and Director of Finance for Dunkin' Brands (2000-2005). |
Stephanie J. Dorsey (43) |
| Year of Election or Appointment: 2010 Assistant Treasurer of Fidelity's Equity and High Income Funds. Ms. Dorsey also serves as Deputy Treasurer of other Fidelity funds (2008-present) and is an employee of Fidelity Investments (2008-present). Previously, Ms. Dorsey served as Treasurer (2004-2008) of the JPMorgan Mutual Funds and Vice President (2004-2008) of JPMorgan Chase Bank. |
John R. Hebble (54) |
| Year of Election or Appointment: 2009 Assistant Treasurer of Fidelity's Equity and High Income Funds. Mr. Hebble also serves as President (2011-present), Treasurer, and Chief Financial Officer of The North Carolina Capital Management Trust: Cash and Term Portfolios (2008-present), President and Treasurer of other Fidelity funds (2008-present) and is an employee of Fidelity Investments. |
Gary W. Ryan (53) |
| Year of Election or Appointment: 2005 Assistant Treasurer of the Fidelity funds. Mr. Ryan is an employee of Fidelity Investments. Previously, Mr. Ryan served as Vice President of Fund Reporting in Fidelity Pricing and Cash Management Services (FPCMS) (1999-2005). |
Jonathan Davis (44) |
| Year of Election or Appointment: 2010 Assistant Treasurer of the Fidelity funds. Mr. Davis is also Assistant Treasurer of Fidelity Rutland Square Trust II and Fidelity Commonwealth Trust II. Mr. Davis is an employee of Fidelity Investments. Previously, Mr. Davis served as Vice President and Associate General Counsel of FMR LLC (2003-2010). |
Annual Report
The Board of Trustees of Fidelity Small Cap Growth Fund voted to pay to shareholders of record at the opening of business, the following distributions per share derived from capital gains realized from sales of portfolio securities, and dividends derived from net investment income:
| Pay Date | Record Date | Capital Gains |
Class F | 09/10/12 | 09/07/12 | $0.582 |
The fund hereby designates as a capital gain dividend with respect to the taxable year ended July 31,2012, $80,163,961, or, if subsequently determined to be different, the net capital gain of such year.
The fund will notify shareholders in January 2013 of amounts for use in preparing 2012 income tax returns.
Annual Report
Board Approval of Investment Advisory Contracts and Management Fees
Fidelity Small Cap Growth Fund
Each year, the Board of Trustees, including the Independent Trustees (together, the Board), votes on the renewal of the management contract and sub-advisory agreements (together, the Advisory Contracts) for the fund. The Board, assisted by the advice of fund counsel and Independent Trustees' counsel, requests and considers a broad range of information relevant to the renewal of the Advisory Contracts throughout the year.
The Board meets regularly and, at each of its meetings, considers factors that are relevant to its annual consideration of the renewal of the fund's Advisory Contracts, including the services and support provided to the fund and its shareholders. The Board has established various standing committees, each composed of and chaired by Independent Trustees with varying backgrounds, to which the Board has assigned specific subject matter responsibilities in order to enhance effective decision-making by the Board. The Board, acting directly and through its Committees, requests and receives information concerning the annual consideration of the renewal of the fund's Advisory Contracts. The Board also meets as needed to consider matters specifically related to the Board's annual consideration of the renewal of Advisory Contracts. Members of the Board may also meet with trustees of other Fidelity funds through ad hoc joint committees to discuss certain matters relevant to the Fidelity funds.
At its July 2012 meeting, the Board of Trustees, including the Independent Trustees, unanimously determined to renew the fund's Advisory Contracts. In reaching its determination, the Board considered all factors it believed relevant, including (i) the nature, extent, and quality of the services to be provided to the fund and its shareholders (including the investment performance of the fund); (ii) the competitiveness of the fund's management fee and total expense ratio relative to peer funds; (iii) the total costs of the services to be provided by and the profits to be realized by Fidelity from its relationship with the fund; (iv) the extent to which economies of scale exist and would be realized as the fund grows; and (v) whether fee levels reflect these economies of scale, if any, for the benefit of fund shareholders.
In considering whether to renew the Advisory Contracts for the fund, the Board reached a determination, with the assistance of fund counsel and Independent Trustees' counsel and through the exercise of its business judgment, that the renewal of the Advisory Contracts is in the best interests of the fund and its shareholders and that the compensation payable under the Advisory Contracts is fair and reasonable. The Board's decision to renew the Advisory Contracts was not based on any single factor, but rather was based on a comprehensive consideration of all the information provided to the Board at its meetings throughout the year. The Board, in reaching its determination to renew the Advisory Contracts, is aware that shareholders in the fund have a broad range of investment choices available to them, including a wide choice among mutual funds offered by Fidelity's competitors, and that the fund's shareholders, who have the opportunity to review and weigh the disclosure provided by the fund in its prospectus and other public disclosures, have chosen to invest in this fund, managed by Fidelity.
Annual Report
Board Approval of Investment Advisory Contracts and
Management Fees - continued
Nature, Extent, and Quality of Services Provided. The Board considered the staffing within the investment adviser, FMR, and the sub-advisers (together, the Investment Advisers), including the backgrounds of the fund's investment personnel, and also considered the fund's investment objective, strategies, and related investment philosophy. The Independent Trustees also had discussions with senior management of Fidelity's investment operations and investment groups. The Board considered the structure of the portfolio manager compensation program and whether this structure provides appropriate incentives to act in the best interests of the fund.
Resources Dedicated to Investment Management and Support Services. The Board and the Fund Oversight and Research Committees reviewed the general qualifications and capabilities of the Investment Advisers' investment staff, including its size, education, experience, and resources, as well as the Investment Advisers' approach to recruiting, training, managing, and compensating investment personnel. The Board also noted that FMR has continued to increase the resources devoted to non-U.S. offices, including expansion of Fidelity's global investment organization. The Board noted that Fidelity's analysts have extensive resources, tools and capabilities that allow them to conduct sophisticated quantitative and fundamental analysis, as well as credit analysis of issuers, counterparties and guarantors. The Board also believes that Fidelity's investment professionals have sufficient access to global information and data so as to provide competitive investment results over time, and that those professionals also have access to sophisticated tools that permit them to assess portfolio construction and risk and performance attribution characteristics continuously, as well as to transmit new information and research conclusions rapidly around the world. Additionally, in its deliberations, the Board considered the Investment Advisers' trading and risk management capabilities and resources, which are an integral part of the investment management process.
Shareholder and Administrative Services. The Board considered (i) the nature, extent, quality, and cost of advisory, administrative, and shareholder services performed by the Investment Advisers and their affiliates under the Advisory Contracts and under separate agreements covering transfer agency, pricing and bookkeeping, and securities lending services for the fund; (ii) the nature and extent of the supervision of third party service providers, principally custodians and subcustodians; and (iii) the resources devoted to, and the record of compliance with, the fund's compliance policies and procedures. The Board also reviewed the allocation of fund brokerage, including allocations to brokers affiliated with the Investment Advisers, the use of brokerage commissions to pay fund expenses, and the use of "soft" commission dollars to pay for research services.
Annual Report
The Board noted that the growth of fund assets over time across the complex allows Fidelity to reinvest in the development of services designed to enhance the value or convenience of the Fidelity funds as investment vehicles. These services include 24-hour access to account information and market information through telephone representatives and over the Internet, investor education materials and asset allocation tools, and the expanded availability of Fidelity Investor Centers.
Investment in a Large Fund Family. The Board considered the benefits to shareholders of investing in a Fidelity fund, including the benefits of investing in a fund that is part of a large family of funds offering a variety of investment disciplines and providing a large variety of mutual fund investor services. The Board noted that Fidelity had taken, or had made recommendations that resulted in the Fidelity funds taking, a number of actions over the previous year that benefited particular funds, including (i) continuing to dedicate additional resources to investment research and support of the senior management team that oversees asset management; (ii) persisting in efforts to enhance Fidelity's research capabilities, in particular, international research; (iii) launching new funds and making other enhancements to meet client needs for global and income-oriented solutions; (iv) continuing to launch dedicated lower cost underlying funds to meet investment management's portfolio construction needs related to expanding underlying fund options, specifically for the Freedom Fund product lines; (v) adopting a "Stock Selector" sector neutral investment approach and employing a team of portfolio managers who are sector specialists to manage certain funds; (vi) rationalizing product lines and gaining increased efficiencies through the mergers of several funds into other funds; (vii) strengthening the Spartan Index Fund product line by adding new funds and/or new low-cost institutional share classes, restructuring fund expenses to accommodate new classes, and reducing investment minimums for certain classes of shares; (viii) modifying the eligibility criteria for Institutional Class shares to increase their appeal to government entities and charitable investors; and (ix) reducing certain transfer agent fee rates.
Investment Performance. The Board considered whether the fund has operated in accordance with its investment objective, as well as its record of compliance with its investment restrictions. It also reviewed the fund's absolute investment performance for each class, as well as the fund's relative investment performance for each class measured over multiple periods against (i) a broad-based securities market index, and (ii) a peer group of mutual funds deemed appropriate by Fidelity and reviewed by the Board. The following charts considered by the Board show, over the one-, three-, and five-year periods ended December 31, 2011, the cumulative total returns of Institutional Class (Class I) and Class B of the fund, the cumulative total returns of a broad-based securities market index ("benchmark"), and a range of cumulative total returns of a peer group of mutual funds identified by Morningstar, Inc. as having an investment style similar to that of the fund based on underlying portfolio holdings. The returns of Institutional Class (Class I) and Class B show the performance of the highest and lowest performing classes, respectively (based on five-year performance). The box within each chart shows the 25th percentile return (top of box) and the 75th percentile return (bottom of box) of the peer group. Returns shown above the box are in the first quartile and returns shown below the box are in the fourth quartile. The percentage beaten numbers noted below each chart correspond to the percentile box and represent the percentage of funds in the peer group whose performance was equal to or lower than that of the class indicated.
Annual Report
Board Approval of Investment Advisory Contracts and
Management Fees - continued
Fidelity Small Cap Growth Fund

The Board reviewed the fund's relative investment performance against its peer group and noted that the performance of Institutional Class (Class I) of the fund was in the second quartile for all the periods shown. The Board also noted that the investment performance of Institutional Class (Class I) of the fund compared favorably to its benchmark for all the periods shown. The Board considered that the variations in performance among the fund's classes reflect the variations in class expenses, which result in lower performance for higher expense classes. The Board noted that there was a portfolio management change for the fund in November 2011. The Board also reviewed the fund's performance since inception as well as performance in the current year.
The Board also considered that the fund's management fee is subject to upward or downward adjustment depending upon whether, and to what extent, the fund's investment performance for the performance period exceeds, or is exceeded by, the record (over the same period) of a Board-approved performance adjustment index. The Board noted that the performance adjustment provides FMR with a strong economic incentive to seek to achieve superior performance for the fund's shareholders and helps to more closely align the interests of FMR and the fund's shareholders.
Annual Report
Based on its review, the Board concluded that the nature, extent, and quality of services provided to the fund under the Advisory Contracts should benefit the fund's shareholders.
Competitiveness of Management Fee and Total Expense Ratio. The Board considered the fund's management fee and total expense ratio compared to "mapped groups" of competitive funds and classes. Fidelity creates "mapped groups" by combining similar Lipper investment objective categories that have comparable management fee characteristics. Combining Lipper investment objective categories aids the Board's management fee and total expense ratio comparisons by broadening the competitive group used for comparison and by reducing the number of universes to which various Fidelity funds are compared.
Management Fee. The Board considered two proprietary management fee comparisons for the 12-month periods shown in the chart below. The group of Lipper funds used by the Board for management fee comparisons is referred to below as the "Total Mapped Group." The Total Mapped Group comparison focuses on a fund's standing relative to the total universe of comparable funds available to investors in terms of gross management fees before expense reimbursements or caps, and without giving effect to the fund's performance adjustment. "TMG %" represents the percentage of funds in the Total Mapped Group that had management fees that were lower than the fund's. For example, a TMG % of 13% means that 87% of the funds in the Total Mapped Group had higher management fees than the fund. The "Asset-Size Peer Group" (ASPG) comparison focuses on a fund's standing relative to non-Fidelity funds similar in size to the fund within the Total Mapped Group. The ASPG represents at least 15% of the funds in the Total Mapped Group with comparable asset size and management fee characteristics, subject to a minimum of 50 funds (or all funds in the Total Mapped Group if fewer than 50). Additional information, such as the ASPG quartile in which the fund's management fee ranked and the impact of the fund's performance adjustment, is also included in the chart and considered by the Board.
Annual Report
Board Approval of Investment Advisory Contracts and
Management Fees - continued
Fidelity Small Cap Growth Fund

The Board noted that the fund's management fee ranked below the median of its Total Mapped Group and below the median of its ASPG for 2011. The Board also noted the effect of the fund's performance adjustment on the fund's management fee ranking. The Board noted that the performance adjustment for each year represents calculations for performance periods that differ from the periods shown in the performance charts above.
Based on its review, the Board concluded that the fund's management fee is fair and reasonable in light of the services that the fund receives and the other factors considered.
Total Expense Ratio. In its review of each class's total expense ratio, the Board considered the fund's management fee as well as other fund or class expenses, as applicable, such as transfer agent fees, pricing and bookkeeping fees, fund-paid 12b-1 fees, and custodial, legal, and audit fees. The Board also noted the effects of any waivers and reimbursements on fees and expenses, as well as the impact of the fund's performance adjustment. As part of its review, the Board also considered the current and historical total expense ratios of each class of the fund compared to competitive fund median expenses. Each class of the fund is compared to those funds and classes in the Total Mapped Group (used by the Board for management fee comparisons) that have a similar sales load structure.
The Board noted that the total expense ratio of each of Class A, Class B, Class C, Institutional Class, the retail class, and Class F ranked below its competitive median for 2011 and the total expense ratio of Class T ranked above its competitive median for 2011. The Board considered that various factors, including 12b-1 fees, positive or negative performance adjustments, and relatively higher other expenses in the case of small fund size, can affect total expense ratios. The Board noted that the total expense ratio of Class T was above the competitive median primarily because of higher 12b-1 fees on Class T. Class T has a higher 12b-1 fee, but a lower front-end sales charge, than traditionally priced front-end sales charge classes. The Board considered that Class T is primarily sold load-waived in the retirement plan market where its 0.50% 12b-1 fee is comparable to competing no-load, higher 12b-1 fee classes designed specifically for retirement plans. The Board noted that the fund offers multiple classes, each of which has a different sales load and 12b-1 fee structure, and that the multiple structures are intended to offer a range of pricing options for the intermediary market. The Board also noted that the total expense ratios of the classes vary primarily by the level of their 12b-1 fees, although differences in transfer agent fees may also cause expenses to vary from class to class.
Annual Report
Fees Charged to Other Fidelity Clients. The Board also considered Fidelity fee structures and other information with respect to clients of FMR and its affiliates, such as other mutual funds advised or subadvised by FMR or its affiliates, pension plan clients, and other institutional clients. The Board noted the findings of the 2010 ad hoc joint committee (created with the board of other Fidelity funds), which reviewed and compared Fidelity's institutional investment advisory business with its business of providing services to the Fidelity funds, including the differences in services provided, fees charged, and costs incurred, as well as competition in their respective marketplaces.
Based on its review of total expense ratios and fees charged to other Fidelity clients, the Board concluded that the total expense ratio of each class of the fund was reasonable, although Class T was above the median of the universe presented for comparison, in light of the services that the fund and its shareholders receive and the other factors considered.
Costs of the Services and Profitability. The Board considered the revenues earned and the expenses incurred by Fidelity in conducting the business of developing, marketing, distributing, managing, administering and servicing the fund and its shareholders. The Board also considered the level of Fidelity's profits in respect of all the Fidelity funds.
On an annual basis, FMR presents to the Board Fidelity's profitability for the fund. Fidelity calculates the profitability for each fund, as well as aggregate profitability for groups of Fidelity funds and all Fidelity funds, using a series of detailed revenue and cost allocation methodologies which originate with the books and records of Fidelity on which Fidelity's audited financial statements are based. The Audit Committee of the Board reviews any significant changes from the prior year's methodologies.
PricewaterhouseCoopers LLP (PwC), independent registered public accounting firm and auditor to Fidelity and certain Fidelity funds, has been engaged annually by the Board as part of the Board's assessment of Fidelity's profitability analysis. PwC's engagement includes the review and assessment of Fidelity's methodologies used in determining the revenues and expenses attributable to Fidelity's mutual fund business, and completion of agreed-upon procedures surrounding the mathematical accuracy of fund profitability and its conformity to allocation methodologies. After considering PwC's reports issued under the engagement and information provided by Fidelity, the Board concluded that while other allocation methods may also be reasonable, Fidelity's profitability methodologies are reasonable in all material respects.
Annual Report
Board Approval of Investment Advisory Contracts and
Management Fees - continued
The Board also reviewed Fidelity's non-fund businesses and fall-out benefits related to the mutual fund business as well as cases where Fidelity's affiliates may benefit from or be related to the fund's business.
The Board considered the costs of the services provided by and the profits realized by Fidelity in connection with the operation of the fund and was satisfied that the profitability was not excessive in the circumstances.
Economies of Scale. The Board considered whether there have been economies of scale in respect of the management of the Fidelity funds, whether the Fidelity funds (including the fund) have appropriately benefited from any such economies of scale, and whether there is potential for realization of any further economies of scale. The Board considered the extent to which the fund will benefit from economies of scale through increased services to the fund, through waivers or reimbursements, or through fee or expense reductions. The Board also noted that in 2009, it and the board of other Fidelity funds created an ad hoc committee (the Economies of Scale Committee) to analyze whether FMR attains economies of scale in respect of the management and servicing of the Fidelity funds, whether the Fidelity funds have appropriately benefited from such economies of scale, and whether there is potential for realization of any further economies of scale.
The Board recognized that the fund's management contract incorporates a "group fee" structure, which provides for lower group fee rates as total fund assets under FMR's management increase, and for higher group fee rates as total fund assets under FMR's management decrease. FMR calculates the group fee rates based on a tiered asset "breakpoint" schedule that varies based on asset class. The Board considered that the group fee is designed to deliver the benefits of economies of scale to fund shareholders when total Fidelity fund assets increase, even if assets of any particular fund are unchanged or have declined, because some portion of Fidelity's costs are attributable to services provided to all Fidelity funds, and all funds benefit if those costs can be allocated among more assets. The Board concluded that, given the group fee structure, fund shareholders will benefit from lower management fees as assets under FMR's management increase at the fund complex level, regardless of whether Fidelity achieves any such economies of scale.
Annual Report
The Board concluded, taking into account the analysis of the Economies of Scale Committee, that economies of scale, if any, are being appropriately shared between fund shareholders and Fidelity.
Additional Information Requested by the Board. In order to develop fully the factual basis for consideration of the Fidelity funds' Advisory Contracts, the Board requested and received additional information on certain topics, including (i) fund performance trends, actions to be taken by FMR to improve certain funds' overall performance, and Fidelity's long-term strategies for certain funds; (ii) the potential to further rationalize the Fidelity fund lineup with the possibility of achieving savings for the funds and Fidelity; (iii) Fidelity's compensation structure for portfolio managers and other key investment personnel; (iv) the amount of the investment that each portfolio manager has made in the Fidelity fund(s) that he or she manages; (v) the realization of fall-out benefits in certain Fidelity business units; (vi) Fidelity's group fee structures, the potential impact of regulatory changes on such structures, and the rationale for the individual fee rates of certain funds; (vii) fund profitability methodology, including Fidelity's cost allocation methodology, and the impact of certain factors on fund profitability results; (viii) trends regarding industry use of performance fee structures and the possibility of implementing performance fee structures for additional funds; and (ix) the impact of net redemptions from the Fidelity funds.
Based on its evaluation of all of the conclusions noted above, and after considering all factors it believed relevant, the Board ultimately concluded that the advisory fee structures are fair and reasonable, and that the fund's Advisory Contracts should be renewed.
Annual Report
Investment Adviser
Fidelity Management & Research Company
Boston, MA
Investment Sub-Advisers
FMR Co., Inc.
Fidelity Management & Research
(U.K.) Inc.
Fidelity Management & Research
(Hong Kong) Limited
Fidelity Management & Research
(Japan) Inc.
General Distributor
Fidelity Distributors Corporation
Smithfield, RI
Transfer and Service Agents
Fidelity Investments Institutional
Operations Company, Inc.
Boston, MA
Fidelity Service Company, Inc.
Boston, MA
Custodian
Citibank, N.A.
New York, NY
(Fidelity Investment logo)(registered trademark)
Corporate Headquarters
82 Devonshire St., Boston, MA 02109
www.fidelity.com
SCP-F-ANN-0912
1.891906.103
(Fidelity Investment logo)(registered trademark)
Fidelity Advisor®
Small Cap Growth
Fund - Institutional Class
Annual Report
July 31, 2012
(Fidelity Cover Art)
Institutional Class
is a class of Fidelity®
Small Cap Growth
Fund
Contents
Performance | (Click Here) | How the fund has done over time. |
Management's Discussion of Fund Performance | (Click Here) | The Portfolio Manager's review of fund performance and strategy. |
Shareholder Expense Example | (Click Here) | An example of shareholder expenses. |
Investment Changes | (Click Here) | A summary of major shifts in the fund's investments over the past six months. |
Investments | (Click Here) | A complete list of the fund's investments with their market values. |
Financial Statements | (Click Here) | Statements of assets and liabilities, operations, and changes in net assets, as well as financial highlights. |
Notes | (Click Here) | Notes to the financial statements. |
Report of Independent Registered Public Accounting Firm | (Click Here) | |
Trustees and Officers | (Click Here) | |
Distributions | (Click Here) | |
Board Approval of Investment Advisory Contracts and Management Fees | (Click Here) | |
To view a fund's proxy voting guidelines and proxy voting record for the 12-month period ended June 30, visit http://www.fidelity.com/proxyvotingresults or visit the Securities and Exchange Commission's (SEC) web site at http://www.sec.gov. You may also call 1-877-208-0098 to request a free copy of the proxy voting guidelines.
Standard & Poor's, S&P and S&P 500 are registered service marks of The McGraw-Hill Companies, Inc. and have been licensed for use by Fidelity Distributors Corporation.
Other third party marks appearing herein are the property of their respective owners.
All other marks appearing herein are registered or unregistered trademarks or service marks of FMR LLC or an affiliated company. © 2012 FMR LLC. All rights reserved.
Annual Report
This report and the financial statements contained herein are submitted for the general information of the shareholders of the fund. This report is not authorized for distribution to prospective investors in the fund unless preceded or accompanied by an effective prospectus.
A fund files its complete schedule of portfolio holdings with the SEC for the first and third quarters of each fiscal year on Form N-Q. Forms N-Q are available on the SEC's web site at http://www.sec.gov. A fund's Forms N-Q may be reviewed and copied at the SEC's Public Reference Room in Washington, DC. Information regarding the operation of the SEC's Public Reference Room may be obtained by calling 1-800-SEC-0330. For a complete list of a fund's portfolio holdings, view the most recent holdings listing, semiannual report, or annual report on Fidelity's web site at http://www.fidelity.com, http://www.advisor.fidelity.com, or http://www.401k.com, as applicable.
NOT FDIC INSURED • MAY LOSE VALUE • NO BANK GUARANTEE
Neither the fund nor Fidelity Distributors Corporation is a bank.
Annual Report
Average annual total return reflects the change in the value of an investment, assuming reinvestment of the class' distributions from dividend income and capital gains (the profits earned upon the sale of securities that have grown in value, if any) and assuming a constant rate of performance each year. The $10,000 table and the fund's returns do not reflect the deduction of taxes that a shareholder would pay on fund distributions or the redemption of fund shares. During periods of reimbursement by Fidelity, a fund's total return will be greater than it would be had the reimbursement not occurred. How a fund did yesterday is no guarantee of how it will do tomorrow.
Average Annual Total Returns
Periods ended July 31, 2012 | Past 1
year | Past 5
years | Life of
fund A |
Institutional Class | -0.88% | 1.86% | 7.96% |
A From November 3, 2004.
$10,000 Over Life of Fund
Let's say hypothetically that $10,000 was invested in Fidelity Advisor® Small Cap Growth Fund - Institutional Class on November 3, 2004, when the fund started. The chart shows how the value of your investment would have changed, and also shows how the Russell 2000® Growth Index performed over the same period.
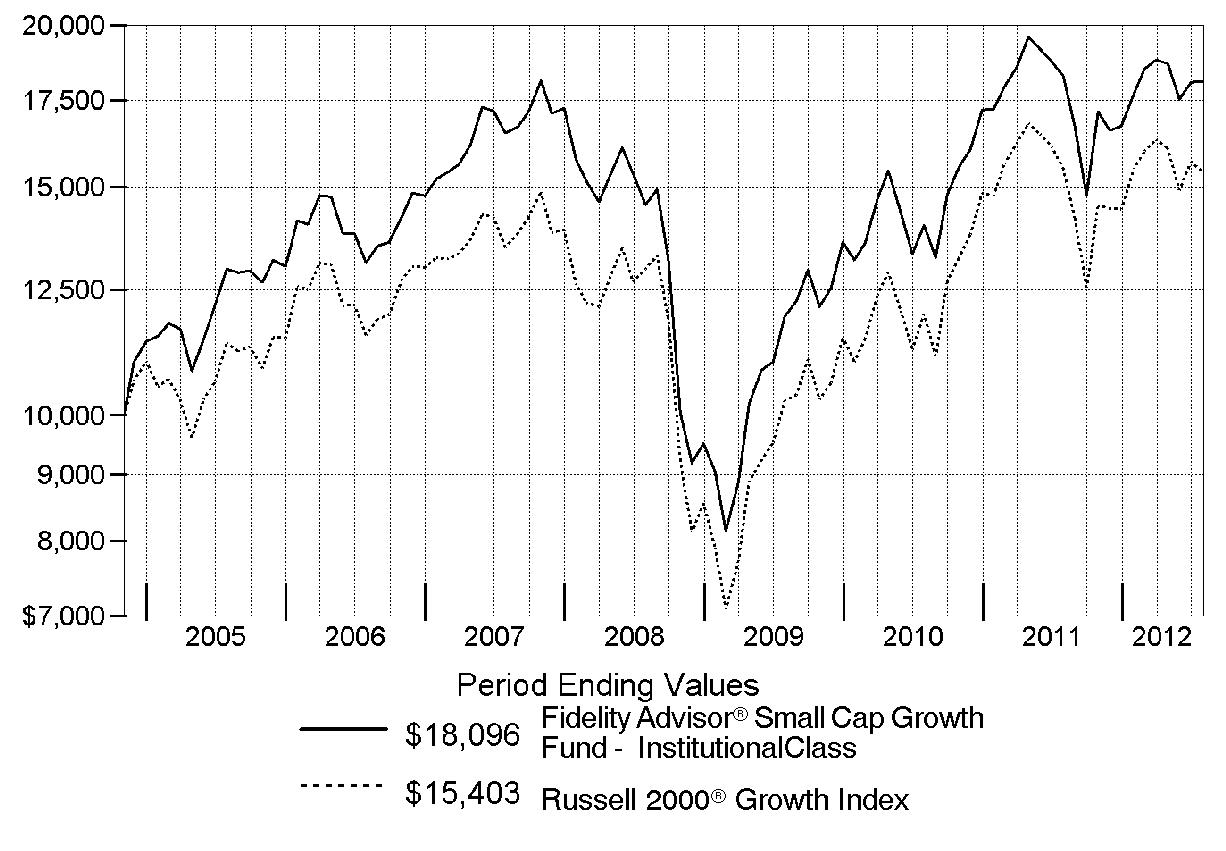
Annual Report
Market Recap: Major U.S. equity benchmarks posted solid gains for the year ending July 31, 2012, amid an uncertain investment environment. The broad-based S&P 500® Index returned 9.13%, while the blue-chip-laden Dow Jones Industrial AverageSM and technology-heavy Nasdaq Composite® Index gained 10.12% and 7.83%, respectively. Volatility spiked during the period's first half, as equities plummeted late last summer on Europe's debt woes, political wrangling over the U.S. debt ceiling and the sovereign credit-rating downgrade that followed. By October, a seemingly improved U.S. economy rejuvenated stocks, paving the way for major equity benchmarks to post their best first-quarter performance since 1998. However, more eurozone trouble, signs that the U.S. economy had turned sluggish and a slowdown in China caused stocks to slip in May, before a new wave of optimism took hold in June and July. Within the S&P 500®, more-defensive sectors such as telecommunication services (+30%) and consumer staples (+20%) fared best, while materials and energy significantly underperformed, returning -5%. Small- and mid-cap stocks trailed their less-volatile large-cap counterparts, with the Russell 2000® Index adding 0.19% and the Russell Midcap® Index rising 2.28%. Given turmoil and local currency weakness in Europe, foreign developed-markets stocks lost ground, with the MSCI® EAFE® Index returning -11.32%.
Comments from Patrick Venanzi, who became Portfolio Manager of Fidelity Advisor® Small Cap Growth Fund on November 17, 2011: For the year, the fund's Institutional Class shares returned -0.88%, lagging the Russell 2000® Growth Index, which returned -0.51%. Poor positioning in health care was the main reason for the underperformance, with picks and an underweighting in the pharmaceuticals/biotechnology/life science industry particularly challenging. My choices within the software/services, health care equipment/services and automobiles/components industries also were letdowns. Our foreign holdings hurt overall, due in part to a stronger U.S. dollar. Individually, the biggest blow came from Polycom, a video and voice conferencing company, while Sohu.com, China's largest Internet company, and untimely ownership of medical device company Integra LifeSciences Holdings also hurt. Polycom, Sohu.com and Integra were not held at period end. Conversely, picks within industrials, tech hardware/equipment and materials were additive. At the stock level, specialty retailer Sally Beauty Holdings and Canadian discount store operator Dollarama were winners, as was a position in biopharmaceutical firm Amylin Pharmaceuticals. All of the names mentioned, except Integra, were not in the benchmark.
The views expressed above reflect those of the portfolio manager(s) only through the end of the period as stated on the cover of this report and do not necessarily represent the views of Fidelity or any other person in the Fidelity organization. Any such views are subject to change at any time based upon market or other conditions and Fidelity disclaims any responsibility to update such views. These views may not be relied on as investment advice and, because investment decisions for a Fidelity fund are based on numerous factors, may not be relied on as an indication of trading intent on behalf of any Fidelity fund.
Annual Report
Shareholder Expense Example
As a shareholder of the Fund, you incur two types of costs: (1) transaction costs, including sales charges (loads) on purchase payments or redemption proceeds, redemption fees and (2) ongoing costs, including management fees, distribution and/or service (12b-1) fees and other Fund expenses. This Example is intended to help you understand your ongoing costs (in dollars) of investing in the Fund and to compare these costs with the ongoing costs of investing in other mutual funds.
The Example is based on an investment of $1,000 invested at the beginning of the period and held for the entire period (February 1, 2012 to July 31, 2012).
Actual Expenses
The first line of the accompanying table for each class of the Fund provides information about actual account values and actual expenses. You may use the information in this line, together with the amount you invested, to estimate the expenses that you paid over the period. Simply divide your account value by $1,000.00 (for example, an $8,600 account value divided by $1,000.00 = 8.6), then multiply the result by the number in the first line for a class of the Fund under the heading entitled "Expenses Paid During Period" to estimate the expenses you paid on your account during this period. A small balance maintenance fee of $12.00 that is charged once a year may apply for certain accounts with a value of less than $2,000. This fee is not included in the table below. If it was, the estimate of expenses you paid during the period would be higher, and your ending account value lower, by this amount. In addition, the Fund, as a shareholder in the underlying Fidelity Central Funds, will indirectly bear its pro-rata share of the fees and expenses incurred by the underlying Fidelity Central Funds. These fees and expenses are not included in the Fund's annualized expense ratio used to calculate the expense estimate in the table below.
Hypothetical Example for Comparison Purposes
The second line of the accompanying table for each class of the Fund provides information about hypothetical account values and hypothetical expenses based on a Class' actual expense ratio and an assumed rate of return of 5% per year before expenses, which is not the Class' actual return. The hypothetical account values and expenses may not be used to estimate the actual ending account balance or expenses you paid for the period. You may use this information to compare the ongoing costs of investing in the Fund and other funds. To do so, compare this 5% hypothetical example with the 5% hypothetical examples that appear in the shareholder reports of the other funds. A small balance maintenance fee of $12.00 that is charged once a year may apply for certain accounts with a value of less than $2,000. This fee is not included in the table below. If it was, the estimate of expenses you paid during the period would be higher, and your ending account value lower, by this amount. In addition, the Fund, as a shareholder in the underlying Fidelity Central Funds, will indirectly bear its pro-rata share of the fees and expenses incurred by the underlying Fidelity Central Funds. These fees and expenses are not included in the Fund's annualized expense ratio used to calculate the expense estimate in the table below.
Please note that the expenses shown in the table are meant to highlight your ongoing costs only and do not reflect any transaction costs. Therefore, the second line of the table is useful in comparing ongoing costs only, and will not help you determine the relative total costs of owning different funds. In addition, if these transactional costs were included, your costs would have been higher.
Annual Report
| Annualized
Expense Ratio | Beginning
Account Value
February 1, 2012 | Ending
Account Value
July 31, 2012 | Expenses Paid
During Period*
February 1, 2012
to July 31, 2012 |
Class A | 1.31% | | | |
Actual | | $ 1,000.00 | $ 1,021.20 | $ 6.58 |
Hypothetical A | | $ 1,000.00 | $ 1,018.35 | $ 6.57 |
Class T | 1.57% | | | |
Actual | | $ 1,000.00 | $ 1,019.50 | $ 7.88 |
Hypothetical A | | $ 1,000.00 | $ 1,017.06 | $ 7.87 |
Class B | 2.06% | | | |
Actual | | $ 1,000.00 | $ 1,016.70 | $ 10.33 |
Hypothetical A | | $ 1,000.00 | $ 1,014.62 | $ 10.32 |
Class C | 2.07% | | | |
Actual | | $ 1,000.00 | $ 1,016.80 | $ 10.38 |
Hypothetical A | | $ 1,000.00 | $ 1,014.57 | $ 10.37 |
Small Cap Growth | .98% | | | |
Actual | | $ 1,000.00 | $ 1,022.20 | $ 4.93 |
Hypothetical A | | $ 1,000.00 | $ 1,019.99 | $ 4.92 |
Class F | .77% | | | |
Actual | | $ 1,000.00 | $ 1,023.30 | $ 3.87 |
Hypothetical A | | $ 1,000.00 | $ 1,021.03 | $ 3.87 |
Institutional Class | 1.00% | | | |
Actual | | $ 1,000.00 | $ 1,022.80 | $ 5.03 |
Hypothetical A | | $ 1,000.00 | $ 1,019.89 | $ 5.02 |
A 5% return per year before expenses
* Expenses are equal to each Class' annualized expense ratio, multiplied by the average account value over the period, multiplied by 182/366 (to reflect the one-half year period).
Annual Report
Investment Changes (Unaudited)
Top Ten Stocks as of July 31, 2012 |
| % of fund's
net assets | % of fund's net assets
6 months ago |
Vitamin Shoppe, Inc. | 1.5 | 0.9 |
Life Time Fitness, Inc. | 1.4 | 0.7 |
Hibbett Sports, Inc. | 1.4 | 0.8 |
Align Technology, Inc. | 1.4 | 0.0 |
Susser Holdings Corp. | 1.3 | 0.0 |
Ascena Retail Group, Inc. | 1.3 | 1.1 |
Liquidity Services, Inc. | 1.3 | 0.0 |
HMS Holdings Corp. | 1.3 | 0.9 |
Aspen Technology, Inc. | 1.3 | 0.7 |
Sally Beauty Holdings, Inc. | 1.2 | 1.2 |
| 13.4 | |
Top Five Market Sectors as of July 31, 2012 |
| % of fund's
net assets | % of fund's net assets
6 months ago |
Health Care | 21.2 | 14.2 |
Information Technology | 20.6 | 24.4 |
Consumer Discretionary | 17.5 | 16.5 |
Industrials | 14.6 | 17.8 |
Financials | 9.6 | 6.8 |
Asset Allocation (% of fund's net assets) |
As of July 31, 2012* | As of January 31, 2012** |
 | Stocks 96.9% | | | Stocks and Equity
Futures 98.4% | |
 | Short-Term
Investments and
Net Other Assets (Liabilities) 3.1% | | | Short-Term
Investments and
Net Other Assets (Liabilities) 1.6% | |
* Foreign investments | 9.1% | | ** Foreign investments | 12.4% | |

Annual Report
Investments July 31, 2012
Showing Percentage of Net Assets
Common Stocks - 96.9% |
| Shares | | Value |
CONSUMER DISCRETIONARY - 17.5% |
Auto Components - 0.6% |
Tenneco, Inc. (a) | 394,600 | | $ 11,557,834 |
Hotels, Restaurants & Leisure - 4.9% |
AFC Enterprises, Inc. (a) | 600,000 | | 13,254,000 |
Chuys Holdings, Inc. | 17,700 | | 308,157 |
Cracker Barrel Old Country Store, Inc. | 278,800 | | 17,469,608 |
Interval Leisure Group, Inc. | 1,120,000 | | 20,540,800 |
Life Time Fitness, Inc. (a) | 577,600 | | 26,228,816 |
Texas Roadhouse, Inc. Class A | 701,900 | | 12,149,889 |
| | 89,951,270 |
Household Durables - 1.9% |
Jarden Corp. | 290,000 | | 13,108,000 |
Lennar Corp. Class A | 303,800 | | 8,873,998 |
Toll Brothers, Inc. (a) | 461,300 | | 13,456,121 |
| | 35,438,119 |
Multiline Retail - 1.0% |
Dollarama, Inc. | 214,900 | | 13,393,080 |
The Bon-Ton Stores, Inc. | 700,000 | | 4,620,000 |
| | 18,013,080 |
Specialty Retail - 6.6% |
Ascena Retail Group, Inc. (a) | 1,334,800 | | 24,480,232 |
Conn's, Inc. (a) | 170,916 | | 3,050,851 |
DSW, Inc. Class A | 326,300 | | 19,290,856 |
Hibbett Sports, Inc. (a) | 430,000 | | 26,131,100 |
Sally Beauty Holdings, Inc. (a) | 801,000 | | 21,162,420 |
Vitamin Shoppe, Inc. (a) | 492,300 | | 27,037,116 |
| | 121,152,575 |
Textiles, Apparel & Luxury Goods - 2.5% |
Hanesbrands, Inc. (a) | 450,000 | | 13,509,000 |
PVH Corp. | 139,459 | | 11,077,228 |
Steven Madden Ltd. (a) | 331,400 | | 13,398,502 |
Ted Baker PLC | 591,073 | | 8,196,784 |
| | 46,181,514 |
TOTAL CONSUMER DISCRETIONARY | | 322,294,392 |
CONSUMER STAPLES - 5.8% |
Food & Staples Retailing - 1.3% |
Susser Holdings Corp. (a) | 678,155 | | 24,488,177 |
Common Stocks - continued |
| Shares | | Value |
CONSUMER STAPLES - continued |
Food Products - 3.0% |
Calavo Growers, Inc. (d) | 495,299 | | $ 13,363,167 |
Hain Celestial Group, Inc. (a) | 295,000 | | 16,428,550 |
J&J Snack Foods Corp. | 250,000 | | 14,447,500 |
Post Holdings, Inc. (a) | 400,000 | | 11,840,000 |
| | 56,079,217 |
Household Products - 0.9% |
WD-40 Co. | 322,566 | | 15,499,296 |
Personal Products - 0.6% |
Elizabeth Arden, Inc. (a) | 275,000 | | 10,727,750 |
TOTAL CONSUMER STAPLES | | 106,794,440 |
ENERGY - 4.5% |
Energy Equipment & Services - 2.2% |
Essential Energy Services Ltd. | 5,166,700 | | 10,973,796 |
Tesco Corp. (a) | 750,000 | | 8,692,500 |
Western Energy Services Corp. (a) | 1,530,000 | | 10,740,589 |
Xtreme Drilling & Coil Services Corp. (a)(e) | 4,100,000 | | 6,786,658 |
Zedi, Inc. (a)(e) | 5,020,900 | | 3,905,172 |
| | 41,098,715 |
Oil, Gas & Consumable Fuels - 2.3% |
Cabot Oil & Gas Corp. | 250,000 | | 10,547,500 |
Delek US Holdings, Inc. | 81,100 | | 1,600,914 |
Stone Energy Corp. (a) | 516,300 | | 13,558,038 |
Targa Resources Corp. | 379,300 | | 16,708,165 |
| | 42,414,617 |
TOTAL ENERGY | | 83,513,332 |
FINANCIALS - 9.6% |
Commercial Banks - 3.1% |
Banco Pine SA | 1,658,287 | | 10,868,043 |
BBCN Bancorp, Inc. (a) | 1,640,000 | | 18,597,600 |
Columbia Banking Systems, Inc. | 579,043 | | 10,451,726 |
Texas Capital Bancshares, Inc. (a) | 400,000 | | 17,236,000 |
| | 57,153,369 |
Insurance - 2.4% |
Allied World Assurance Co. Holdings Ltd. | 194,800 | | 14,693,764 |
Common Stocks - continued |
| Shares | | Value |
FINANCIALS - continued |
Insurance - continued |
Amerisafe, Inc. (a) | 464,900 | | $ 11,606,229 |
ProAssurance Corp. | 210,000 | | 18,809,700 |
| | 45,109,693 |
Real Estate Investment Trusts - 3.3% |
Highwoods Properties, Inc. (SBI) | 419,000 | | 14,191,530 |
LTC Properties, Inc. | 430,000 | | 15,351,000 |
Rayonier, Inc. | 285,000 | | 13,591,650 |
Sovran Self Storage, Inc. | 300,000 | | 17,130,000 |
| | 60,264,180 |
Real Estate Management & Development - 0.8% |
Altisource Portfolio Solutions SA (a) | 185,000 | | 14,348,600 |
TOTAL FINANCIALS | | 176,875,842 |
HEALTH CARE - 21.2% |
Biotechnology - 6.8% |
Alkermes PLC (a) | 175,500 | | 3,262,545 |
Amarin Corp. PLC ADR (a)(d) | 900,000 | | 10,539,000 |
Amylin Pharmaceuticals, Inc. (a) | 556,700 | | 17,140,793 |
ARIAD Pharmaceuticals, Inc. (a) | 400,000 | | 7,652,000 |
ArQule, Inc. (a) | 900,000 | | 5,445,000 |
BioMarin Pharmaceutical, Inc. (a) | 190,000 | | 7,465,100 |
Infinity Pharmaceuticals, Inc. (a) | 205,536 | | 3,588,659 |
Isis Pharmaceuticals, Inc. (a) | 437,257 | | 5,299,555 |
Medivation, Inc. (a) | 140,000 | | 13,958,000 |
OncoGenex Pharmaceuticals, Inc. (a)(d) | 570,000 | | 7,957,200 |
Pharmacyclics, Inc. (a)(d) | 150,000 | | 7,981,500 |
Seattle Genetics, Inc. (a) | 330,000 | | 8,632,800 |
Targacept, Inc. (a) | 500,000 | | 2,160,000 |
Theravance, Inc. (a)(d) | 379,000 | | 11,040,270 |
Threshold Pharmaceuticals, Inc. (a) | 880,000 | | 6,107,200 |
XOMA Corp. (a)(d) | 2,200,000 | | 7,986,000 |
| | 126,215,622 |
Health Care Equipment & Supplies - 5.8% |
Abiomed, Inc. (a)(d) | 600,000 | | 13,530,000 |
Align Technology, Inc. (a) | 764,398 | | 25,958,956 |
Cyberonics, Inc. (a) | 322,000 | | 13,942,600 |
ICU Medical, Inc. (a) | 380,000 | | 20,265,400 |
Sirona Dental Systems, Inc. (a) | 195,000 | | 8,429,850 |
Common Stocks - continued |
| Shares | | Value |
HEALTH CARE - continued |
Health Care Equipment & Supplies - continued |
The Cooper Companies, Inc. | 151,900 | | $ 11,431,994 |
The Spectranetics Corp. (a) | 1,130,000 | | 13,334,000 |
| | 106,892,800 |
Health Care Providers & Services - 5.5% |
Air Methods Corp. (a) | 151,000 | | 16,463,530 |
Catamaran Corp. (a) | 100,807 | | 8,562,338 |
Centene Corp. (a) | 330,000 | | 12,553,200 |
Corvel Corp. (a) | 202,592 | | 9,347,595 |
Health Net, Inc. (a) | 302,482 | | 6,660,654 |
HMS Holdings Corp. (a) | 683,500 | | 23,519,235 |
MEDNAX, Inc. (a) | 172,900 | | 11,433,877 |
MWI Veterinary Supply, Inc. (a) | 148,400 | | 13,517,756 |
| | 102,058,185 |
Health Care Technology - 0.9% |
athenahealth, Inc. (a)(d) | 120,000 | | 10,980,000 |
Epocrates, Inc. (a) | 672,706 | | 5,072,203 |
| | 16,052,203 |
Life Sciences Tools & Services - 0.8% |
Furiex Pharmaceuticals, Inc. (a) | 200,000 | | 3,844,000 |
Luminex Corp. (a) | 620,000 | | 10,620,600 |
| | 14,464,600 |
Pharmaceuticals - 1.4% |
Cadence Pharmaceuticals, Inc. (a) | 767,693 | | 3,255,018 |
Impax Laboratories, Inc. (a) | 640,200 | | 14,225,244 |
ViroPharma, Inc. (a) | 410,000 | | 8,901,100 |
| | 26,381,362 |
TOTAL HEALTH CARE | | 392,064,772 |
INDUSTRIALS - 14.6% |
Aerospace & Defense - 1.7% |
Teledyne Technologies, Inc. (a) | 235,700 | | 14,684,110 |
TransDigm Group, Inc. (a) | 138,183 | | 17,046,255 |
| | 31,730,365 |
Building Products - 0.9% |
Armstrong World Industries, Inc. | 260,000 | | 10,049,000 |
US Home Systems, Inc. (e) | 725,000 | | 6,604,750 |
| | 16,653,750 |
Common Stocks - continued |
| Shares | | Value |
INDUSTRIALS - continued |
Electrical Equipment - 2.1% |
Generac Holdings, Inc. | 450,000 | | $ 10,269,000 |
Hubbell, Inc. Class B | 161,800 | | 13,312,904 |
II-VI, Inc. (a) | 815,000 | | 14,213,600 |
| | 37,795,504 |
Industrial Conglomerates - 0.8% |
Carlisle Companies, Inc. | 290,000 | | 14,642,100 |
Machinery - 2.9% |
Actuant Corp. Class A | 383,100 | | 10,903,026 |
Blount International, Inc. (a) | 774,000 | | 11,006,280 |
TriMas Corp. (a) | 335,298 | | 7,289,379 |
Valmont Industries, Inc. | 75,000 | | 9,291,000 |
Wabtec Corp. | 197,300 | | 15,622,214 |
| | 54,111,899 |
Marine - 0.6% |
Kirby Corp. (a) | 200,000 | | 10,554,000 |
Professional Services - 3.0% |
Advisory Board Co. (a) | 421,005 | | 18,941,015 |
MISTRAS Group, Inc. (a) | 315,721 | | 7,097,408 |
Nielsen Holdings B.V. (a) | 650,000 | | 18,525,000 |
Nihon M&A Center, Inc. | 385,512 | | 11,389,587 |
| | 55,953,010 |
Road & Rail - 0.6% |
Genesee & Wyoming, Inc. Class A (a) | 180,000 | | 11,170,800 |
Trading Companies & Distributors - 2.0% |
DXP Enterprises, Inc. (a) | 214,719 | | 9,490,580 |
Watsco, Inc. | 289,000 | | 19,634,660 |
WESCO International, Inc. (a) | 145,000 | | 8,077,950 |
| | 37,203,190 |
TOTAL INDUSTRIALS | | 269,814,618 |
INFORMATION TECHNOLOGY - 20.6% |
Communications Equipment - 0.9% |
Parrot SA (a) | 368,100 | | 11,209,528 |
Telular Corp. | 500,000 | | 4,715,000 |
| | 15,924,528 |
Computers & Peripherals - 0.7% |
Super Micro Computer, Inc. (a) | 979,923 | | 12,160,844 |
Common Stocks - continued |
| Shares | | Value |
INFORMATION TECHNOLOGY - continued |
Electronic Equipment & Components - 2.1% |
Insight Enterprises, Inc. (a) | 377,400 | | $ 6,325,224 |
InvenSense, Inc. | 137,076 | | 1,768,280 |
Neonode, Inc. (a)(d) | 1,380,000 | | 6,969,000 |
OSI Systems, Inc. (a) | 164,000 | | 10,584,560 |
Parametric Sound Corp. (a) | 249,068 | | 2,428,413 |
Zygo Corp. (a) | 619,600 | | 11,078,448 |
| | 39,153,925 |
Internet Software & Services - 7.4% |
Active Network, Inc. (a) | 870,000 | | 12,345,300 |
Bankrate, Inc. (a)(d) | 600,000 | | 9,570,000 |
Blucora, Inc. (a) | 1,111,100 | | 16,944,275 |
Cornerstone OnDemand, Inc. (a) | 674,037 | | 16,028,600 |
Demand Media, Inc. (a)(d) | 1,743,000 | | 19,382,160 |
Liquidity Services, Inc. (a) | 523,400 | | 23,929,848 |
LivePerson, Inc. (a) | 963,426 | | 18,016,066 |
QuinStreet, Inc. (a)(d) | 1,350,000 | | 12,244,500 |
VeriSign, Inc. (a) | 200,000 | | 8,884,000 |
| | 137,344,749 |
IT Services - 2.2% |
Euronet Worldwide, Inc. (a) | 500,000 | | 9,140,000 |
Maximus, Inc. | 320,000 | | 16,160,000 |
ServiceSource International, Inc. (a) | 336,399 | | 3,794,581 |
Total System Services, Inc. | 500,000 | | 11,825,000 |
| | 40,919,581 |
Semiconductors & Semiconductor Equipment - 1.3% |
Cymer, Inc. (a) | 278,201 | | 15,915,879 |
Entegris, Inc. (a) | 1,056,500 | | 8,504,825 |
| | 24,420,704 |
Software - 6.0% |
Aspen Technology, Inc. (a) | 992,200 | | 23,197,636 |
BroadSoft, Inc. (a)(d) | 456,600 | | 11,209,530 |
CommVault Systems, Inc. (a) | 360,000 | | 17,467,200 |
Deltek, Inc. (a) | 1,030,000 | | 13,410,600 |
Ebix, Inc. (d) | 575,610 | | 12,484,981 |
MICROS Systems, Inc. (a) | 260,312 | | 12,427,295 |
Parametric Technology Corp. (a) | 980,000 | | 21,109,200 |
| | 111,306,442 |
TOTAL INFORMATION TECHNOLOGY | | 381,230,773 |
Common Stocks - continued |
| Shares | | Value |
MATERIALS - 2.4% |
Chemicals - 0.6% |
Albemarle Corp. | 200,300 | | $ 11,661,466 |
Containers & Packaging - 0.8% |
Myers Industries, Inc. | 850,000 | | 13,974,000 |
Metals & Mining - 1.0% |
Commercial Metals Co. | 809,800 | | 10,438,322 |
Compass Minerals International, Inc. | 120,000 | | 8,680,800 |
| | 19,119,122 |
TOTAL MATERIALS | | 44,754,588 |
UTILITIES - 0.7% |
Electric Utilities - 0.7% |
Cleco Corp. | 280,000 | | 12,252,800 |
TOTAL COMMON STOCKS (Cost $1,609,099,061) |
1,789,595,557
|
Money Market Funds - 6.6% |
| | | |
Fidelity Cash Central Fund, 0.17% (b) | 50,560,836 | | 50,560,836 |
Fidelity Securities Lending Cash Central Fund, 0.18% (b)(c) | 71,793,425 | | 71,793,425 |
TOTAL MONEY MARKET FUNDS (Cost $122,354,261) |
122,354,261
|
TOTAL INVESTMENT PORTFOLIO - 103.5% (Cost $1,731,453,322) | | 1,911,949,818 |
NET OTHER ASSETS (LIABILITIES) - (3.5)% | | (64,777,614) |
NET ASSETS - 100% | $ 1,847,172,204 |
Legend |
(a) Non-income producing |
(b) Affiliated fund that is available only to investment companies and other accounts managed by Fidelity Investments. The rate quoted is the annualized seven-day yield of the fund at period end. A complete unaudited listing of the fund's holdings as of its most recent quarter end is available upon request. In addition, each Fidelity Central Fund's financial statements, which are not covered by the Fund's Report of Independent Registered Public Accounting Firm, are available on the SEC's website or upon request. |
(c) Investment made with cash collateral received from securities on loan. |
(d) Security or a portion of the security is on loan at period end. |
(e) Affiliated company |
Affiliated Central Funds |
Information regarding fiscal year to date income earned by the Fund from investments in Fidelity Central Funds is as follows: |
Fund | Income earned |
Fidelity Cash Central Fund | $ 79,275 |
Fidelity Securities Lending Cash Central Fund | 3,071,956 |
Total | $ 3,151,231 |
Other Affiliated Issuers |
An affiliated company is a company in which the Fund has ownership of at least 5% of the voting securities. Fiscal year to date transactions with companies which are or were affiliates are as follows: |
Affiliate | Value, beginning of period | Purchases | Sales Proceeds | Dividend Income | Value,
end of
period |
Calavo Growers, Inc. | $ 16,826,331 | $ 13,436,045 | $ 19,540,642 | $ 307,289 | $ - |
Perficient, Inc. | 17,202,205 | 4,361,057 | 22,322,908 | - | - |
US Home Systems, Inc. | - | 8,770,904 | - | 43,500 | 6,604,750 |
Xtreme Drilling & Coil Services Corp. (formerly Xtreme Coil Drilling Corp.) | - | 12,099,252 | - | - | 6,786,658 |
Zedi, Inc. | - | 3,695,906 | - | - | 3,905,172 |
Total | $ 34,028,536 | $ 42,363,164 | $ 41,863,550 | $ 350,789 | $ 17,296,580 |
Other Information |
The following is a summary of the inputs used, as of July 31, 2012, involving the Fund's assets and liabilities carried at fair value. The inputs or methodology used for valuing securities may not be an indication of the risk associated with investing in those securities. For more information on valuation inputs, and their aggregation into the levels used in the table below, please refer to the Security Valuation section in the accompanying Notes to Financial Statements. |
Valuation Inputs at Reporting Date: |
Description | Total | Level 1 | Level 2 | Level 3 |
Investments in Securities: | | | | |
Equities: | | | | |
Consumer Discretionary | $ 322,294,392 | $ 322,294,392 | $ - | $ - |
Consumer Staples | 106,794,440 | 106,794,440 | - | - |
Energy | 83,513,332 | 83,513,332 | - | - |
Financials | 176,875,842 | 176,875,842 | - | - |
Health Care | 392,064,772 | 392,064,772 | - | - |
Industrials | 269,814,618 | 258,425,031 | 11,389,587 | - |
Information Technology | 381,230,773 | 381,230,773 | - | - |
Materials | 44,754,588 | 44,754,588 | - | - |
Utilities | 12,252,800 | 12,252,800 | - | - |
Money Market Funds | 122,354,261 | 122,354,261 | - | - |
Total Investments in Securities: | $ 1,911,949,818 | $ 1,900,560,231 | $ 11,389,587 | $ - |
See accompanying notes which are an integral part of the financial statements.
Annual Report
Statement of Assets and Liabilities
| July 31, 2012 |
| | |
Assets | | |
Investment in securities, at value (including securities loaned of $69,355,870) - See accompanying schedule: Unaffiliated issuers (cost $1,584,533,000) | $ 1,772,298,977 | |
Fidelity Central Funds (cost $122,354,261) | 122,354,261 | |
Other affiliated issuers (cost $24,566,061) | 17,296,580 | |
Total Investments (cost $1,731,453,322) | | $ 1,911,949,818 |
Cash | | 465,902 |
Receivable for investments sold | | 36,822,778 |
Receivable for fund shares sold | | 1,053,361 |
Dividends receivable | | 442,749 |
Distributions receivable from Fidelity Central Funds | | 49,171 |
Other receivables | | 85,041 |
Total assets | | 1,950,868,820 |
| | |
Liabilities | | |
Payable for investments purchased | $ 29,150,268 | |
Payable for fund shares redeemed | 1,206,971 | |
Accrued management fee | 1,131,791 | |
Distribution and service plan fees payable | 47,878 | |
Other affiliated payables | 299,993 | |
Other payables and accrued expenses | 66,290 | |
Collateral on securities loaned, at value | 71,793,425 | |
Total liabilities | | 103,696,616 |
| | |
Net Assets | | $ 1,847,172,204 |
Net Assets consist of: | | |
Paid in capital | | $ 1,604,527,390 |
Accumulated net investment loss | | (1,442,758) |
Accumulated undistributed net realized gain (loss) on investments and foreign currency transactions | | 63,602,071 |
Net unrealized appreciation (depreciation) on investments and assets and liabilities in foreign currencies | | 180,485,501 |
Net Assets | | $ 1,847,172,204 |
See accompanying notes which are an integral part of the financial statements.
Annual Report
Financial Statements - continued
Statement of Assets and Liabilities - continued
| July 31, 2012 |
| | |
Calculation of Maximum Offering Price Class A:
Net Asset Value and redemption price per share ($59,684,141 ÷ 3,761,625 shares) | | $ 15.87 |
| | |
Maximum offering price per share (100/94.25 of $15.87) | | $ 16.84 |
Class T:
Net Asset Value and redemption price per share ($27,657,540 ÷ 1,764,218 shares) | | $ 15.68 |
| | |
Maximum offering price per share (100/96.50 of $15.68) | | $ 16.25 |
Class B:
Net Asset Value and offering price per share ($4,123,211 ÷ 271,428 shares)A | | $ 15.19 |
| | |
Class C:
Net Asset Value and offering price per share ($24,682,877 ÷ 1,627,852 shares)A | | $ 15.16 |
| | |
Small Cap Growth:
Net Asset Value, offering price and redemption price per share ($1,166,101,377 ÷ 72,239,706 shares) | | $ 16.14 |
| | |
Class F:
Net Asset Value, offering price and redemption price per share ($528,229,315 ÷ 32,483,605 shares) | | $ 16.26 |
| | |
Institutional Class:
Net Asset Value, offering price and redemption price per share ($36,693,743 ÷ 2,269,537 shares) | | $ 16.17 |
A Redemption price per share is equal to net asset value less any applicable contingent deferred sales charge.
See accompanying notes which are an integral part of the financial statements.
Annual Report
Statement of Operations
| Year ended July 31, 2012 |
| | |
Investment Income | | |
Dividends (including $350,789 earned from other affiliated issuers) | | $ 10,164,089 |
Special dividends | | 1,530,000 |
Interest | | 2,005 |
Income from Fidelity Central Funds (including $3,071,956 from security lending) | | 3,151,231 |
Total income | | 14,847,325 |
| | |
Expenses | | |
Management fee
Basic fee | $ 12,271,775 | |
Performance adjustment | 827,912 | |
Transfer agent fees | 3,165,497 | |
Distribution and service plan fees | 563,361 | |
Accounting and security lending fees | 550,873 | |
Custodian fees and expenses | 30,254 | |
Independent trustees' compensation | 11,394 | |
Registration fees | 99,536 | |
Audit | 58,667 | |
Legal | 5,590 | |
Miscellaneous | 18,436 | |
Total expenses before reductions | 17,603,295 | |
Expense reductions | (174,685) | 17,428,610 |
Net investment income (loss) | | (2,581,285) |
Realized and Unrealized Gain (Loss) Net realized gain (loss) on: | | |
Investment securities: | | |
Unaffiliated issuers | 77,468,956 | |
Other affiliated issuers | 1,136,369 | |
Foreign currency transactions | (232,876) | |
Futures contracts | 5,787,075 | |
Total net realized gain (loss) | | 84,159,524 |
Change in net unrealized appreciation (depreciation) on: Investment securities | (104,787,928) | |
Assets and liabilities in foreign currencies | (14,661) | |
Total change in net unrealized appreciation (depreciation) | | (104,802,589) |
Net gain (loss) | | (20,643,065) |
Net increase (decrease) in net assets resulting from operations | | $ (23,224,350) |
See accompanying notes which are an integral part of the financial statements.
Annual Report
Financial Statements - continued
Statement of Changes in Net Assets
| Year ended
July 31,
2012 | Year ended
July 31,
2011 |
Increase (Decrease) in Net Assets | | |
Operations | | |
Net investment income (loss) | $ (2,581,285) | $ (3,102,614) |
Net realized gain (loss) | 84,159,524 | 221,065,530 |
Change in net unrealized appreciation (depreciation) | (104,802,589) | 210,253,368 |
Net increase (decrease) in net assets resulting
from operations | (23,224,350) | 428,216,284 |
Distributions to shareholders from net realized gain | (34,799,429) | (3,013,255) |
Share transactions - net increase (decrease) | 61,802,637 | (17,486,495) |
Redemption fees | 255,125 | 229,000 |
Total increase (decrease) in net assets | 4,033,983 | 407,945,534 |
| | |
Net Assets | | |
Beginning of period | 1,843,138,221 | 1,435,192,687 |
End of period (including accumulated net investment loss of $1,442,758 and accumulated net investment loss of $848,304, respectively) | $ 1,847,172,204 | $ 1,843,138,221 |
See accompanying notes which are an integral part of the financial statements.
Annual Report
Financial Highlights - Class A
Years ended July 31, | 2012 | 2011 | 2010 | 2009 | 2008 |
Selected Per-Share Data | | | | | |
Net asset value, beginning of period | $ 16.42 | $ 12.66 | $ 10.79 | $ 13.20 | $ 16.06 |
Income from Investment Operations | | | | | |
Net investment income (loss) C | (.07) F | (.07) G | (.07) H | (.06) | (.11) |
Net realized and unrealized gain (loss) | (.16) | 3.84 | 1.94 | (2.35) | (1.73) |
Total from investment operations | (.23) | 3.77 | 1.87 | (2.41) | (1.84) |
Distributions from net realized gain | (.32) | (.01) K | - | - | (1.02) |
Redemption fees added to paid in capital C,J | - | - | - | - | - |
Net asset value, end of period | $ 15.87 | $ 16.42 | $ 12.66 | $ 10.79 | $ 13.20 |
Total Return A,B | (1.14)% | 29.78% | 17.33% | (18.26)% | (12.26)% |
Ratios to Average Net Assets D,I | | | | | |
Expenses before reductions | 1.35% | 1.25% | 1.35% | 1.33% | 1.40% |
Expenses net of fee waivers, if any | 1.35% | 1.25% | 1.35% | 1.33% | 1.40% |
Expenses net of all reductions | 1.34% | 1.23% | 1.34% | 1.33% | 1.39% |
Net investment income (loss) | (.49)% F | (.47)% G | (.56)% H | (.64)% | (.74)% |
Supplemental Data | | | | | |
Net assets, end of period (000 omitted) | $ 59,684 | $ 67,272 | $ 50,620 | $ 40,211 | $ 42,187 |
Portfolio turnover rate E | 150% | 106% | 105% | 150% | 113% |
A Total returns would have been lower if certain expenses had not been reduced during the applicable periods shown.
B Total returns do not include the effect of the sales charges.
C Calculated based on average shares outstanding during the period.
D Fees and expenses of any underlying Fidelity Central Funds are not included in the Fund's expense ratio. The Fund indirectly bears its proportionate share of the expenses of any underlying Fidelity Central Funds.
E Amount does not include the portfolio activity of any underlying Fidelity Central Funds.
F Investment income per share reflects a large, non-recurring dividend which amounted to $.01 per share. Excluding this non-recurring dividend, the ratio of net investment income (loss) to average net assets would have been (.57)%.
G Investment income per share reflects a large, non-recurring dividend which amounted to $.02 per share. Excluding this non-recurring dividend, the ratio of net investment income (loss) to average net assets would have been (.61)%.
H Investment income per share reflects a large, non-recurring dividend which amounted to $.01 per share. Excluding this non-recurring dividend, the ratio of net investment income (loss) to average net assets would have been (.67)%.
I Expense ratios reflect operating expenses of the class. Expenses before reductions do not reflect amounts reimbursed by the investment adviser or reductions from brokerage service arrangements or reductions from other expense offset arrangements and do not represent the amount paid by the class during periods when reimbursements or reductions occur. Expenses net of fee waivers reflect expenses after reimbursement by the investment adviser but prior to reductions from brokerage service arrangements or other expense offset arrangements. Expenses net of all reductions represent the net expenses paid by the class.
J Amount represents less than $.01 per share.
K The amount shown reflects certain reclassifications related to book to tax differences.
See accompanying notes which are an integral part of the financial statements.
Annual Report
Financial Highlights - Class T
Years ended July 31, | 2012 | 2011 | 2010 | 2009 | 2008 |
Selected Per-Share Data | | | | | |
Net asset value, beginning of period | $ 16.27 | $ 12.57 | $ 10.74 | $ 13.17 | $ 16.01 |
Income from Investment Operations | | | | | |
Net investment income (loss) C | (.11) F | (.11) G | (.10) H | (.09) | (.15) |
Net realized and unrealized gain (loss) | (.16) | 3.81 | 1.93 | (2.34) | (1.73) |
Total from investment operations | (.27) | 3.70 | 1.83 | (2.43) | (1.88) |
Distributions from net realized gain | (.32) | - | - | - | (.96) |
Redemption fees added to paid in capital C,J | - | - | - | - | - |
Net asset value, end of period | $ 15.68 | $ 16.27 | $ 12.57 | $ 10.74 | $ 13.17 |
Total Return A,B | (1.41)% | 29.44% | 17.04% | (18.45)% | (12.50)% |
Ratios to Average Net AssetsD,I | | | | | |
Expenses before reductions | 1.61% | 1.50% | 1.61% | 1.60% | 1.65% |
Expenses net of fee waivers, if any | 1.61% | 1.50% | 1.61% | 1.60% | 1.65% |
Expenses net of all reductions | 1.60% | 1.49% | 1.60% | 1.59% | 1.65% |
Net investment income (loss) | (.74)% F | (.73)% G | (.82)% H | (.91)% | (.99)% |
Supplemental Data | | | | | |
Net assets, end of period (000 omitted) | $ 27,658 | $ 30,764 | $ 23,930 | $ 21,533 | $ 21,754 |
Portfolio turnover rate E | 150% | 106% | 105% | 150% | 113% |
A Total returns would have been lower if certain expenses had not been reduced during the applicable periods shown.
B Total returns do not include the effect of the sales charges.
C Calculated based on average shares outstanding during the period.
D Fees and expenses of any underlying Fidelity Central Funds are not included in the Fund's expense ratio. The Fund indirectly bears its proportionate share of the expenses of any underlying Fidelity Central Funds.
E Amount does not include the portfolio activity of any underlying Fidelity Central Funds.
F Investment income per share reflects a large, non-recurring dividend which amounted to $.01 per share. Excluding this non-recurring dividend, the ratio of net investment income (loss) to average net assets would have been (.83)%.
G Investment income per share reflects a large, non-recurring dividend which amounted to $.02 per share. Excluding this non-recurring dividend, the ratio of net investment income (loss) to average net assets would have been (.86)%.
H Investment income per share reflects a large, non-recurring dividend which amounted to $.01 per share. Excluding this non-recurring dividend, the ratio of net investment income (loss) to average net assets would have been (.93)%.
I Expense ratios reflect operating expenses of the class. Expenses before reductions do not reflect amounts reimbursed by the investment adviser or reductions from brokerage service arrangements or reductions from other expense offset arrangements and do not represent the amount paid by the class during periods when reimbursements or reductions occur. Expenses net of fee waivers reflect expenses after reimbursement by the investment adviser but prior to reductions from brokerage service arrangements or other expense offset arrangements. Expenses net of all reductions represent the net expenses paid by the class.
J Amount represents less than $.01 per share.
See accompanying notes which are an integral part of the financial statements.
Annual Report
Financial Highlights - Class B
Years ended July 31, | 2012 | 2011 | 2010 | 2009 | 2008 |
Selected Per-Share Data | | | | | |
Net asset value, beginning of period | $ 15.86 | $ 12.30 | $ 10.57 | $ 13.03 | $ 15.85 |
Income from Investment Operations | | | | | |
Net investment income (loss) C | (.18) F | (.18) G | (.16) H | (.13) | (.22) |
Net realized and unrealized gain (loss) | (.17) | 3.74 | 1.89 | (2.33) | (1.71) |
Total from investment operations | (.35) | 3.56 | 1.73 | (2.46) | (1.93) |
Distributions from net realized gain | (.32) | - | - | - | (.89) |
Redemption fees added to paid in capital C,J | - | - | - | - | - |
Net asset value, end of period | $ 15.19 | $ 15.86 | $ 12.30 | $ 10.57 | $ 13.03 |
Total Return A,B | (1.96)% | 28.94% | 16.37% | (18.88)% | (12.92)% |
Ratios to Average Net Assets D,I | | | | | |
Expenses before reductions | 2.10% | 2.00% | 2.11% | 2.08% | 2.15% |
Expenses net of fee waivers, if any | 2.10% | 2.00% | 2.11% | 2.08% | 2.15% |
Expenses net of all reductions | 2.09% | 1.98% | 2.09% | 2.08% | 2.15% |
Net investment income (loss) | (1.23)% F | (1.22)% G | (1.32)% H | (1.39)% | (1.49)% |
Supplemental Data | | | | | |
Net assets, end of period (000 omitted) | $ 4,123 | $ 5,295 | $ 5,142 | $ 4,171 | $ 5,517 |
Portfolio turnover rate E | 150% | 106% | 105% | 150% | 113% |
A Total returns would have been lower if certain expenses had not been reduced during the applicable periods shown.
B Total returns do not include the effect of the contingent deferred sales charge.
C Calculated based on average shares outstanding during the period.
D Fees and expenses of any underlying Fidelity Central Funds are not included in the Fund's expense ratio. The Fund indirectly bears its proportionate share of the expenses of any underlying Fidelity Central Funds.
E Amount does not include the portfolio activity of any underlying Fidelity Central Funds.
F Investment income per share reflects a large, non-recurring dividend which amounted to $.01 per share. Excluding this non-recurring dividend, the ratio of net investment income (loss) to average net assets would have been (1.32)%.
G Investment income per share reflects a large, non-recurring dividend which amounted to $.02 per share. Excluding this non-recurring dividend, the ratio of net investment income (loss) to average net assets would have been (1.36)%.
H Investment income per share reflects a large, non-recurring dividend which amounted to $.01 per share. Excluding this non-recurring dividend, the ratio of net investment income (loss) to average net assets would have been (1.42)%.
I Expense ratios reflect operating expenses of the class. Expenses before reductions do not reflect amounts reimbursed by the investment adviser or reductions from brokerage service arrangements or reductions from other expense offset arrangements and do not represent the amount paid by the class during periods when reimbursements or reductions occur. Expenses net of fee waivers reflect expenses after reimbursement by the investment adviser but prior to reductions from brokerage service arrangements or other expense offset arrangements. Expenses net of all reductions represent the net expenses paid by the class.
J Amount represents less than $.01 per share.
See accompanying notes which are an integral part of the financial statements.
Annual Report
Financial Highlights - Class C
Years ended July 31, | 2012 | 2011 | 2010 | 2009 | 2008 |
Selected Per-Share Data | | | | | |
Net asset value, beginning of period | $ 15.83 | $ 12.28 | $ 10.55 | $ 13.00 | $ 15.84 |
Income from Investment Operations | | | | | |
Net investment income (loss) C | (.18) F | (.18) G | (.16) H | (.13) | (.22) |
Net realized and unrealized gain (loss) | (.17) | 3.73 | 1.89 | (2.32) | (1.71) |
Total from investment operations | (.35) | 3.55 | 1.73 | (2.45) | (1.93) |
Distributions from net realized gain | (.32) | - | - | - | (.91) |
Redemption fees added to paid in capital C,J | - | - | - | - | - |
Net asset value, end of period | $ 15.16 | $ 15.83 | $ 12.28 | $ 10.55 | $ 13.00 |
Total Return A,B | (1.96)% | 28.91% | 16.40% | (18.85)% | (12.94)% |
Ratios to Average Net Assets D,I | | | | | |
Expenses before reductions | 2.10% | 2.00% | 2.11% | 2.08% | 2.15% |
Expenses net of fee waivers, if any | 2.10% | 2.00% | 2.11% | 2.08% | 2.15% |
Expenses net of all reductions | 2.09% | 1.98% | 2.09% | 2.07% | 2.14% |
Net investment income (loss) | (1.24)% F | (1.22)% G | (1.32)% H | (1.39)% | (1.49)% |
Supplemental Data | | | | | |
Net assets, end of period (000 omitted) | $ 24,683 | $ 24,914 | $ 18,091 | $ 14,267 | $ 15,946 |
Portfolio turnover rate E | 150% | 106% | 105% | 150% | 113% |
A Total returns would have been lower if certain expenses had not been reduced during the applicable periods shown.
B Total returns do not include the effect of the contingent deferred sales charge.
C Calculated based on average shares outstanding during the period.
D Fees and expenses of any underlying Fidelity Central Funds are not included in the Fund's expense ratio. The Fund indirectly bears its proportionate share of the expenses of any underlying Fidelity Central Funds.
E Amount does not include the portfolio activity of any underlying Fidelity Central Funds.
F Investment income per share reflects a large, non-recurring dividend which amounted to $.01 per share. Excluding this non-recurring dividend, the ratio of net investment income (loss) to average net assets would have been (1.32)%.
G Investment income per share reflects a large, non-recurring dividend which amounted to $.02 per share. Excluding this non-recurring dividend, the ratio of net investment income (loss) to average net assets would have been (1.36)%.
H Investment income per share reflects a large, non-recurring dividend which amounted to $.01 per share. Excluding this non-recurring dividend, the ratio of net investment income (loss) to average net assets would have been (1.42)%.
I Expense ratios reflect operating expenses of the class. Expenses before reductions do not reflect amounts reimbursed by the investment adviser or reductions from brokerage service arrangements or reductions from other expense offset arrangements and do not represent the amount paid by the class during periods when reimbursements or reductions occur. Expenses net of fee waivers reflect expenses after reimbursement by the investment adviser but prior to reductions from brokerage service arrangements or other expense offset arrangements. Expenses net of all reductions represent the net expenses paid by the class.
J Amount represents less than $.01 per share.
See accompanying notes which are an integral part of the financial statements.
Annual Report
Financial Highlights - Small Cap Growth
Years ended July 31, | 2012 | 2011 | 2010 | 2009 | 2008 |
Selected Per-Share Data | | | | | |
Net asset value, beginning of period | $ 16.65 | $ 12.81 | $ 10.89 | $ 13.29 | $ 16.15 |
Income from Investment Operations | | | | | |
Net investment income (loss) B | (.03) E | (.03) F | (.04) G | (.04) | (.07) |
Net realized and unrealized gain (loss) | (.16) | 3.90 | 1.96 | (2.36) | (1.74) |
Total from investment operations | (.19) | 3.87 | 1.92 | (2.40) | (1.81) |
Distributions from net realized gain | (.32) | (.03) J | - | - | (1.05) |
Redemption fees added to paid in capital B,I | - | - | - | - | - |
Net asset value, end of period | $ 16.14 | $ 16.65 | $ 12.81 | $ 10.89 | $ 13.29 |
Total Return A | (.88)% | 30.20% | 17.63% | (18.06)% | (11.98)% |
Ratios to Average Net Assets C,H | | | | |
Expenses before reductions | 1.03% | .95% | 1.08% | 1.08% | 1.11% |
Expenses net of fee waivers, if any | 1.03% | .95% | 1.08% | 1.08% | 1.11% |
Expenses net of all reductions | 1.02% | .93% | 1.07% | 1.08% | 1.10% |
Net investment income (loss) | (.16)% E | (.17)% F | (.29)% G | (.39)% | (.45)% |
Supplemental Data | | | | | |
Net assets, end of period (000 omitted) | $ 1,166,101 | $ 1,382,688 | $ 1,204,818 | $ 1,085,184 | $ 1,217,520 |
Portfolio turnover rate D | 150% | 106% | 105% | 150% | 113% |
A Total returns would have been lower if certain expenses had not been reduced during the applicable periods shown.
B Calculated based on average shares outstanding during the period.
C Fees and expenses of any underlying Fidelity Central Funds are not included in the Fund's expense ratio. The Fund indirectly bears its proportionate share of the expenses of any underlying Fidelity Central Funds.
D Amount does not include the portfolio activity of any underlying Fidelity Central Funds.
E Investment income per share reflects a large, non-recurring dividend which amounted to $.01 per share. Excluding this non-recurring dividend, the ratio of net investment income (loss) to average net assets would have been (.25)%.
F Investment income per share reflects a large, non-recurring dividend which amounted to $.02 per share. Excluding this non-recurring dividend, the ratio of net investment income (loss) to average net assets would have been (.31)%.
G Investment income per share reflects a large, non-recurring dividend which amounted to $.01 per share. Excluding this non-recurring dividend, the ratio of net investment income (loss) to average net assets would have been (.39)%.
H Expense ratios reflect operating expenses of the class. Expenses before reductions do not reflect amounts reimbursed by the investment adviser or reductions from brokerage service arrangements or reductions from other expense offset arrangements and do not represent the amount paid by the class during periods when reimbursements or reductions occur. Expenses net of fee waivers reflect expenses after reimbursement by the investment adviser but prior to reductions from brokerage service arrangements or other expense offset arrangements. Expenses net of all reductions represent the net expenses paid by the class.
I Amount represents less than $.01 per share.
J The amount shown reflects certain reclassifications related to book to tax differences.
See accompanying notes which are an integral part of the financial statements.
Annual Report
Financial Highlights - Class F
Years ended July 31, | 2012 | 2011 | 2010 | 2009 K |
Selected Per-Share Data | | | | |
Net asset value, beginning of period | $ 16.73 | $ 12.85 | $ 10.90 | $ 10.03 |
Income from Investment Operations | | | | |
Net investment income (loss) D | .01 H | .01 I | -J,M | (.01) |
Net realized and unrealized gain (loss) | (.16) | 3.91 | 1.95 | .88 |
Total from investment operations | (.15) | 3.92 | 1.95 | .87 |
Distributions from net realized gain | (.32) | (.04) N | - | - |
Redemption fees added to paid in capital D,M | - | - | - | - |
Net asset value, end of period | $ 16.26 | $ 16.73 | $ 12.85 | $ 10.90 |
Total Return B,C | (.64)% | 30.56% | 17.89% | 8.67% |
Ratios to Average Net Assets E,L | | | | |
Expenses before reductions | .80% | .70% | .78% | .74% A |
Expenses net of fee waivers, if any | .80% | .70% | .78% | .74% A |
Expenses net of all reductions | .79% | .68% | .77% | .73% A |
Net investment income (loss) | .07% H | .08% I | -% G,J | (.54)% A |
Supplemental Data | | | | |
Net assets, end of period (000 omitted) | $ 528,229 | $ 290,765 | $ 106,941 | $ 159 |
Portfolio turnover rate F | 150% | 106% | 105% | 150% |
A Annualized
B Total returns for periods of less than one year are not annualized.
C Total returns would have been lower if certain expenses had not been reduced during the applicable periods shown.
D Calculated based on average shares outstanding during the period.
E Fees and expenses of any underlying Fidelity Central Funds are not included in the Fund's expense ratio. The Fund indirectly bears its proportionate share of the expenses of any underlying Fidelity Central Funds.
F Amount does not include the portfolio activity of any underlying Fidelity Central Funds.
G Amount represents less than .01%.
H Investment income per share reflects a large, non-recurring dividend which amounted to $.01 per share. Excluding this non-recurring dividend, the ratio of net investment income (loss) to average net assets would have been (.02)%.
I Investment income per share reflects a large, non-recurring dividend which amounted to $.02 per share. Excluding this non-recurring dividend, the ratio of net investment income (loss) to average net assets would have been (.06)%.
J Investment income per share reflects a large, non-recurring dividend which amounted to $.01 per share. Excluding this non-recurring dividend, the ratio of net investment income (loss) to average net assets would have been (.10)%.
K For the period June 26, 2009 (commencement of sale of shares) to July 31, 2009.
L Expense ratios reflect operating expenses of the class. Expenses before reductions do not reflect amounts reimbursed by the investment adviser or reductions from brokerage service arrangements or reductions from other expense offset arrangements and do no represent the amount paid by the class during periods when reimbursements or reductions occur. Expense ratios before reductions for start-up periods may not be representative of longer-term operating periods. Expenses net of fee waivers reflect expenses after reimbursement by the investment adviser but prior to reductions from brokerage service arrangements or other expense offset arrangements. Expenses net of all reductions represent the net expenses paid by the class.
M Amount represents less than $.01 per share.
N The amount shown reflects certain reclassifications related to book to tax differences.
See accompanying notes which are an integral part of the financial statements.
Annual Report
Financial Highlights - Institutional Class
Years ended July 31, | 2012 | 2011 | 2010 | 2009 | 2008 |
Selected Per-Share Data | | | | | |
Net asset value, beginning of period | $ 16.68 | $ 12.83 | $ 10.91 | $ 13.30 | $ 16.15 |
Income from Investment Operations | | | | | |
Net investment income (loss) B | (.03) E | (.03) F | (.03) G | (.03) | (.06) |
Net realized and unrealized gain (loss) | (.16) | 3.91 | 1.95 | (2.36) | (1.74) |
Total from investment operations | (.19) | 3.88 | 1.92 | (2.39) | (1.80) |
Distributions from net realized gain | (.32) | (.03) J | - | - | (1.05) |
Redemption fees added to paid in capital B,I | - | - | - | - | - |
Net asset value, end of period | $ 16.17 | $ 16.68 | $ 12.83 | $ 10.91 | $ 13.30 |
Total Return A | (.88)% | 30.24% | 17.60% | (17.97)% | (11.93)% |
Ratios to Average Net Assets C,H | | | | |
Expenses before reductions | 1.06% | .94% | 1.03% | 1.05% | 1.04% |
Expenses net of fee waivers, if any | 1.06% | .94% | 1.03% | 1.05% | 1.04% |
Expenses net of all reductions | 1.05% | .93% | 1.02% | 1.04% | 1.03% |
Net investment income (loss) | (.19)% E | (.17)% F | (.24)% G | (.36)% | (.38)% |
Supplemental Data | | | | | |
Net assets, end of period (000 omitted) | $ 36,694 | $ 41,440 | $ 25,650 | $ 19,204 | $ 22,444 |
Portfolio turnover rate D | 150% | 106% | 105% | 150% | 113% |
A Total returns would have been lower if certain expenses had not been reduced during the applicable periods shown.
B Calculated based on average shares outstanding during the period.
C Fees and expenses of any underlying Fidelity Central Funds are not included in the Fund's expense ratio. The Fund indirectly bears its proportionate share of the expenses of any underlying Fidelity Central Funds.
D Amount does not include the portfolio activity of any underlying Fidelity Central Funds.
E Investment income per share reflects a large, non-recurring dividend which amounted to $.01 per share. Excluding this non-recurring dividend, the ratio of net investment income (loss) to average net assets would have been (.28)%.
F Investment income per share reflects a large, non-recurring dividend which amounted to $.02 per share. Excluding this non-recurring dividend, the ratio of net investment income (loss) to average net assets would have been (.30)%.
G Investment income per share reflects a large, non-recurring dividend which amounted to $.01 per share. Excluding this non-recurring dividend, the ratio of net investment income (loss) to average net assets would have been (.34)%.
H Expense ratios reflect operating expenses of the class. Expenses before reductions do not reflect amounts reimbursed by the investment adviser or reductions from brokerage service arrangements or reductions from other expense offset arrangements and do not represent the amount paid by the class during periods when reimbursements or reductions occur. Expenses net of fee waivers reflect expenses after reimbursement by the investment adviser but prior to reductions from brokerage service arrangements or other expense offset arrangements. Expenses net of all reductions represent the net expenses paid by the class.
I Amount represents less than $.01 per share.
J The amount shown reflects certain reclassifications related to book to tax differences.
See accompanying notes which are an integral part of the financial statements.
Annual Report
Notes to Financial Statements
For the period ended July 31, 2012
1. Organization.
Fidelity Small Cap Growth Fund (the Fund) is a fund of Fidelity Securities Fund (the Trust) and is authorized to issue an unlimited number of shares. The Trust is registered under the Investment Company Act of 1940, as amended (the 1940 Act), as an open-end management investment company organized as a Massachusetts business trust. The Fund offers Class A, Class T, Class C, Small Cap Growth, Class F and Institutional Class shares, each of which, along with Class B shares, has equal rights as to assets and voting privileges. Effective after the close of business on September 1, 2010, Class B shares were closed to new accounts and additional purchases, except for exchanges and reinvestments. Each class has exclusive voting rights with respect to matters that affect that class. Class F shares of the Fund are only available for purchase by mutual funds for which Fidelity Management & Research Company (FMR) or an affiliate serves as investment manager. Class B shares will automatically convert to Class A shares after a holding period of seven years from the initial date of purchase. Investment income, realized and unrealized capital gains and losses, the common expenses of the Fund, and certain fund-level expense reductions, if any, are allocated on a pro-rata basis to each class based on the relative net assets of each class to the total net assets of the Fund. Each class differs with respect to transfer agent and distribution and service plan fees incurred. Certain expense reductions may also differ by class.
2. Investments in Fidelity Central Funds.
The Fund invests in Fidelity Central Funds, which are open-end investment companies available only to other investment companies and accounts managed by FMR and its affiliates. The Fund's Schedule of Investments lists each of the Fidelity Central Funds held as of period end, if any, as an investment of the Fund, but does not include the underlying holdings of each Fidelity Central Fund. As an Investing Fund, the Fund indirectly bears its proportionate share of the expenses of the underlying Fidelity Central Funds.
The Money Market Central Funds seek preservation of capital and current income and are managed by Fidelity Investments Money Management, Inc. (FIMM), an affiliate of FMR.
A complete unaudited list of holdings for each Fidelity Central Fund is available upon request or at the Securities and Exchange Commission (the SEC) web site at www.sec.gov. In addition, the financial statements of the Fidelity Central Funds, which are not covered by the Fund's Report of Independent Registered Public Accounting Firm, are available on the SEC web site or upon request.
Annual Report
Notes to Financial Statements - continued
3. Significant Accounting Policies.
The financial statements have been prepared in conformity with accounting principles generally accepted in the United States of America (GAAP), which require management to make certain estimates and assumptions at the date of the financial statements. Actual results could differ from those estimates. Subsequent events, if any, through the date that the financial statements were issued have been evaluated in the preparation of the financial statements. The following summarizes the significant accounting policies of the Fund:
Security Valuation. Investments are valued as of 4:00 p.m. Eastern time on the last calendar day of the period. In accordance with valuation policies and procedures approved by the Board of Trustees (the Board), the Fund attempts to obtain prices from one or more third party pricing vendor or broker to value its investments. When current market prices, quotations or rates are not readily available or reliable, securities will be fair valued in good faith by the FMR Fair Value Committee (the Committee), in accordance with procedures adopted by the Fund's Board. Factors used in determining fair value vary by security type and may include market or security specific events. The frequency with which these procedures are used cannot be predicted and they may be utilized to a significant extent. The Committee oversees the Fund's valuation policies and procedures and is responsible for approving and reporting to the Board all fair value determinations.
The Fund categorizes the inputs to valuation techniques used to value its investments into a disclosure hierarchy consisting of three levels as shown below:
Level 1 - quoted prices in active markets for identical investments
Level 2 - other significant observable inputs (including quoted prices for similar investments, interest rates, prepayment speeds, etc.)
Level 3 - unobservable inputs (including the Fund's own assumptions based on the best information available)
Valuation techniques used to value the Fund's investments by major category are as follows:
Equity securities, including restricted securities, for which market quotations are readily available, are valued at the last reported sale price or official closing price as reported by a third party pricing vendor on the primary market or exchange on which they are traded and are categorized as Level 1 in the hierarchy. In the event there were no sales during the day or closing prices are not available, securities are valued at the last quoted bid price or may be valued using the last available price and are generally categorized as Level 2 in the hierarchy. For foreign equity securities, when significant market or security specific events arise, comparisons to the valuation of American Depositary Receipts
Annual Report
3. Significant Accounting Policies - continued
Security Valuation - continued
(ADRs), futures contracts, Exchange-Traded Funds (ETFs) and certain indexes as well as quoted prices for similar securities are used and are categorized as Level 2 in the hierarchy. Utilizing these techniques may result in transfers between Level 1 and Level 2.
Investments in open-end mutual funds, including the Fidelity Central Funds, are valued at their closing net asset value each business day and are categorized as Level 1 in the hierarchy.
Changes in valuation techniques may result in transfers in or out of an assigned level within the disclosure hierarchy. The aggregate value of investments by input level, as of July 31, 2012, is included at the end of the Fund's Schedule of Investments.
Foreign Currency Translation. The Fund may use foreign currency contracts to facilitate transactions in foreign-denominated securities. Gains and losses from these transactions may arise from changes in the value of the foreign currency or if the counterparties do not perform under the contracts' terms.
Foreign-denominated assets, including investment securities, and liabilities are translated into U.S. dollars at the exchange rate at period end. Purchases and sales of investment securities, income and dividends received and expenses denominated in foreign currencies are translated into U.S. dollars at the exchange rate in effect on the transaction date.
The effects of exchange rate fluctuations on investments are included with the net realized and unrealized gain (loss) on investment securities. Other foreign currency transactions resulting in realized and unrealized gain (loss) are disclosed separately.
Investment Transactions and Income. For financial reporting purposes, the Fund's investment holdings and NAV include trades executed through the end of the last business day of the period. The NAV per share for processing shareholder transactions is calculated as of the close of business of the New York Stock Exchange (NYSE), normally 4:00 p.m. Eastern time and includes trades executed through the end of the prior business day. Gains and losses on securities sold are determined on the basis of identified cost and may include proceeds received from litigation. Dividend income is recorded on the ex-dividend date, except for certain dividends from foreign securities where the ex-dividend date may have passed, which are recorded as soon as the Fund is informed of the ex-dividend date. Non-cash dividends included in dividend income, if any, are recorded at the fair market value of the securities received. Distributions received on securities that represent a return of capital or capital gain are recorded as a reduction of cost of investments and/or as a realized gain. The Fund estimates the components of distributions received that may be considered return of capital distributions or capital
Annual Report
Notes to Financial Statements - continued
3. Significant Accounting Policies - continued
Investment Transactions and Income - continued
gain distributions. Large, non-recurring dividends recognized by the Fund are presented separately on the Statement of Operations as "Special Dividends" and the impact of these dividends is presented in the Financial Highlights. Interest income and distributions from the Fidelity Central Funds are accrued as earned. Interest income includes coupon interest and amortization of premium and accretion of discount on debt securities. Investment income is recorded net of foreign taxes withheld where recovery of such taxes is uncertain.
Expenses. Expenses directly attributable to a fund are charged to that fund. Expenses attributable to more than one fund are allocated among the respective funds on the basis of relative net assets or other appropriate methods. Expense estimates are accrued in the period to which they relate and adjustments are made when actual amounts are known.
Income Tax Information and Distributions to Shareholders. Each year, the Fund intends to qualify as a regulated investment company under Subchapter M of the Internal Revenue Code, including distributing substantially all of its taxable income and realized gains. As a result, no provision for income taxes is required. As of July 31, 2012, the Fund did not have any unrecognized tax benefits in the financial statements; nor is the Fund aware of any tax positions for which it is reasonably possible that the total amounts of unrecognized tax benefits will significantly change in the next twelve months. The Fund files a U.S. federal tax return, in addition to state and local tax returns as required. A fund's federal income tax returns are subject to examination by the Internal Revenue Service (IRS) for a period of three fiscal years after they are filed. State and local tax returns may be subject to examination for an additional fiscal year depending on the jurisdiction. Foreign taxes are provided for based on the Fund's understanding of the tax rules and rates that exist in the foreign markets in which it invests.
Distributions are declared and recorded on the ex-dividend date. Income dividends and capital gain distributions are declared separately for each class. Income and capital gain distributions are determined in accordance with income tax regulations, which may differ from GAAP. These differences resulted in distribution reclassifications for the period ended July 31, 2011. In addition, the Fund claimed a portion of the payment made to redeeming shareholders as a distribution for income tax purposes.
Capital accounts within the financial statements are adjusted for permanent book-tax differences. These adjustments have no impact on net assets or the results of operations. Temporary book-tax differences will reverse in a subsequent period.
Annual Report
3. Significant Accounting Policies - continued
Income Tax Information and Distributions to Shareholders - continued
Book-tax differences are primarily due to foreign currency transactions, net operating losses, future transactions, and losses deferred due to wash sales and excise tax regulations.
The federal tax cost of investment securities and unrealized appreciation (depreciation) as of period end were as follows:
Gross unrealized appreciation | $ 262,984,526 |
Gross unrealized depreciation | (85,038,817) |
Net unrealized appreciation (depreciation) on securities and other investments | $ 177,945,709 |
| |
Tax Cost | $ 1,734,004,109 |
The tax-based components of distributable earnings as of period end were as follows:
Undistributed long-term capital gain | $ 66,152,857 |
Net unrealized appreciation (depreciation) | $ 177,934,714 |
The tax character of distributions paid was as follows:
| July 31, 2012 | July 31, 2011 |
Long-term Capital Gains | $ 34,799,429 | $ 3,013,255 |
Short-Term Trading (Redemption) Fees. Shares held by investors in the Fund less than 90 days are subject to a redemption fee equal to 1.50% of the net asset value of shares redeemed. All redemption fees, which reduce the proceeds of the shareholder redemption, are retained by the Fund and accounted for as an addition to paid in capital.
New Accounting Pronouncement. In December 2011, the Financial Accounting Standards Board issued Accounting Standard Update No. 2011-11, Disclosures about Offsetting Assets and Liabilities. The update creates new disclosure requirements requiring entities to disclose both gross and net information for derivatives and other financial instruments that are either offset in the Statement of Assets and Liabilities or subject to an enforceable master netting arrangement or similar agreement. The disclosure requirements are effective for interim and annual reporting periods beginning on or after January 1, 2013. Management is currently evaluating the impact of the update's adoption on the Fund's financial statement disclosures.
Annual Report
Notes to Financial Statements - continued
4. Derivative Instruments.
Risk Exposures and the Use of Derivative Instruments. The Fund's investment objectives allow the Fund to enter into various types of derivative contracts, including futures contracts. Derivatives are investments whose value is derived from underlying assets, indices or reference rates and may be transacted on an exchange or over-the-counter (OTC). Derivatives may involve a future commitment to buy or sell a specified instrument based on specified terms, or to exchange future cash flows at periodic intervals based on a notional principal amount. The Fund used derivatives to increase returns and to manage exposure to certain risks as defined below. The success of any strategy involving derivatives depends on analysis of numerous economic factors, and if the strategies for investment do not work as intended, the Fund may not achieve its objectives.
The Fund's use of derivatives increased or decreased its exposure to the following risk:
Equity Risk | Equity risk relates to the fluctuations in the value of financial instruments as a result of changes in market prices (other than those arising from interest rate risk or foreign exchange risk), whether caused by factors specific to an individual investment, its issuer, or all factors affecting all instruments traded in a market or market segment. |
The Fund is also exposed to additional risks from investing in derivatives, such as liquidity risk and counterparty credit risk. Liquidity risk is the risk that the Fund will be unable to close out the derivative in the open market in a timely manner. Counterparty credit risk is the risk that the counterparty will not be able to fulfill its obligation to the Fund. Counterparty credit risk related to exchange-traded futures contracts is minimal because of the protection provided by the exchange on which they trade. Investing in derivatives may involve greater risks than investing in the underlying assets directly and, to varying degrees, involves risk of loss in excess of the initial investment, if any, collateral received and amounts recognized in the Statement of Assets and Liabilities. In addition, for futures contracts, there is the risk that the change in value of the derivative contract may not correspond to the change in value of the underlying instrument.
Futures Contracts. A futures contract is an agreement between two parties to buy or sell a specified underlying instrument for a fixed price at a specified future date. The Fund used futures contracts to manage its exposure to the stock market.
Upon entering into a futures contract, a fund is required to deposit either cash or securities (initial margin) with a clearing broker in an amount equal to a certain percentage of the face value of the contract. Futures contracts are marked-to-market daily and subsequent payments are made or received by a fund depending on the daily fluctuations in the value of the futures contracts and are recorded as unrealized appreciation or (depreciation). This receivable and/or payable is included in daily variation margin on
Annual Report
4. Derivative Instruments - continued
Futures Contracts - continued
futures contracts in the Statement of Assets and Liabilities. Realized gain or (loss) is recorded upon the expiration or closing of a futures contract.
Any open futures contracts at period end are shown in the Schedule of Investments under the caption "Futures Contracts." The underlying face amount at value reflects each contract's exposure to the underlying instrument at period end.
During the period the Fund recognized net realized gain (loss) of $5,787,075 related to its investment in futures contracts. This amount is included in the Statement of Operations.
5. Purchases and Sales of Investments.
Purchases and sales of securities, other than short-term securities, aggregated $2,541,649,453 and $2,542,251,432, respectively.
6. Fees and Other Transactions with Affiliates.
Management Fee. FMR and its affiliates provide the Fund with investment management related services for which the Fund pays a monthly management fee. The management fee is the sum of an individual fund fee rate that is based on an annual rate of .45% of the Fund's average net assets and an annualized group fee rate that averaged .26% during the period. The group fee rate is based upon the average net assets of all the mutual funds advised by FMR. The group fee rate decreases as assets under management increase and increases as assets under management decrease. In addition, the management fee is subject to a performance adjustment (up to a maximum of ± .20% of the Fund's average net assets over a 36 month performance period). The upward or downward adjustment to the management fee is based on the relative investment performance of Small Cap Growth as compared to an appropriate benchmark index. For the period, the total annual management fee rate, including the performance adjustment, was .76% of the Fund's average net assets.
Distribution and Service Plan Fees. In accordance with Rule 12b-1 of the 1940 Act, the Fund has adopted separate Distribution and Service Plans for each class of shares. Certain classes pay Fidelity Distributors Corporation (FDC), an affiliate of FMR, separate Distribution and Service Fees, each of which is based on an annual percentage of each class' average net assets. In addition, FDC may pay financial intermediaries for selling shares of the Fund and providing shareholder support services. For the period,
Annual Report
Notes to Financial Statements - continued
6. Fees and Other Transactions with Affiliates - continued
Distribution and Service Plan Fees - continued
the Distribution and Service Fee rates, total fees and amounts retained by FDC were as follows:
| Distribution
Fee | Service
Fee | Total Fees | Retained
by FDC |
Class A | -% | .25% | $ 149,665 | $ 2,982 |
Class T | .25% | .25% | 135,654 | 40 |
Class B | .75% | .25% | 44,856 | 33,711 |
Class C | .75% | .25% | 233,186 | 40,343 |
| | | $ 563,361 | $ 77,076 |
Sales Load. FDC may receive a front-end sales charge of up to 5.75% for selling Class A shares and 3.50% for selling Class T shares, some of which is paid to financial intermediaries for selling shares of the Fund. Depending on the holding period, FDC may receive contingent deferred sales charges levied on Class A, Class T, Class B, and Class C redemptions. The deferred sales charges range from 5.00% to 1.00% for Class B shares, 1.00% for Class C shares, 1.00% for certain purchases of Class A shares and .25% for certain purchases of Class T shares.
For the period, sales charge amounts retained by FDC were as follows:
| Retained
by FDC |
Class A | $ 18,734 |
Class T | 6,727 |
Class B* | 6,869 |
Class C* | 3,375 |
| $ 35,705 |
* When Class B and Class C shares are initially sold, FDC pays commissions from its own resources to financial intermediaries through which the sales are made.
Transfer Agent Fees. Fidelity Investments Institutional Operations Company, Inc. (FIIOC), an affiliate of FMR, is the transfer, dividend disbursing and shareholder servicing agent for each class of the Fund. FIIOC receives account fees and asset-based fees that vary according to the account size and type of account of the shareholders of the respective classes of the Fund, except for Class F. FIIOC receives no fees for providing transfer agency services to Class F. FIIOC pays for typesetting, printing and mailing of
Annual Report
6. Fees and Other Transactions with Affiliates - continued
Transfer Agent Fees - continued
shareholder reports, except proxy statements. For the period, transfer agent fees for each class were as follows:
| Amount | % of
Average
Net Assets |
Class A | $ 180,619 | .30 |
Class T | 83,964 | .31 |
Class B | 13,505 | .30 |
Class C | 70,300 | .30 |
Small Cap Growth | 2,720,942 | .23 |
Institutional Class | 96,167 | .26 |
| $ 3,165,497 | |
Accounting and Security Lending Fees. Fidelity Service Company, Inc. (FSC), an affiliate of FMR, maintains the Fund's accounting records. The accounting fee is based on the level of average net assets for each month. Under a separate contract, FSC administers the security lending program. The security lending fee is based on the number and duration of lending transactions.
Brokerage Commissions. The Fund placed a portion of its portfolio transactions with brokerage firms which are affiliates of the investment adviser. The commissions paid to these affiliated firms were $106,659 for the period.
7. Committed Line of Credit.
The Fund participates with other funds managed by FMR or an affiliate in a $4.25 billion credit facility (the "line of credit") to be utilized for temporary or emergency purposes to fund shareholder redemptions or for other short-term liquidity purposes. The Fund has agreed to pay commitment fees on its pro-rata portion of the line of credit, which amounted to $4,901 and is reflected in Miscellaneous expenses on the Statement of Operations. During the period, there were no borrowings on this line of credit.
8. Security Lending.
The Fund lends portfolio securities through a lending agent from time to time in order to earn additional income. For equity securities, a lending agent is used and may loan securities to certain qualified borrowers, including Fidelity Capital Markets (FCM), a broker-dealer affiliated with the Fund. On the settlement date of the loan, the Fund receives collateral (in the form of U.S. Treasury obligations, letters of credit and/or cash)
Annual Report
Notes to Financial Statements - continued
8. Security Lending - continued
against the loaned securities and maintains collateral in an amount not less than 100% of the market value of the loaned securities during the period of the loan. The market value of the loaned securities is determined at the close of business of the Fund and any additional required collateral is delivered to the Fund on the next business day. If the borrower defaults on its obligation to return the securities loaned because of insolvency or other reasons, a fund could experience delays and costs in recovering the securities loaned or in gaining access to the collateral. Any cash collateral received is invested in the Fidelity Securities Lending Cash Central Fund. The value of loaned securities and cash collateral at period end are disclosed on the Fund's Statement of Assets and Liabilities. The value of securities loaned to FCM at period end was $3,791,412. Security lending income represents the income earned on investing cash collateral, less rebates paid to borrowers and any lending agent fees associated with the loan, plus any premium payments received for lending certain types of securities. Security lending income is presented in the Statement of Operations as a component of income from Fidelity Central Funds, and includes $75,770 from securities loaned to FCM.
9. Expense Reductions.
Many of the brokers with whom FMR places trades on behalf of the Fund provided services to the Fund in addition to trade execution. These services included payments of certain expenses on behalf of the Fund totaling $174,463 for the period. In addition, through arrangements with the Fund's custodian, credits realized as a result of uninvested cash balances were used to reduce the Fund's expenses. During the period, these credits reduced the Fund's custody expenses by $222.
10. Distributions to Shareholders.
Distributions to shareholders of each class were as follows:
Years ended July 31, | 2012 | 2011 |
From net realized gain | | |
Class A | $ 1,262,924 | $ 40,130 |
Class T | 573,407 | - |
Class B | 101,910 | - |
Class C | 481,854 | - |
Small Cap Growth | 25,434,274 | 2,420,020 |
Class F | 6,152,820 | 492,928 |
Institutional Class | 792,240 | 60,177 |
Total | $ 34,799,429 | $ 3,013,255 |
Annual Report
11. Share Transactions.
Transactions for each class of shares were as follows:
| Shares | Dollars |
Years ended July 31, | 2012 | 2011 | 2012 | 2011 |
Class A | | | | |
Shares sold | 986,718 | 1,459,436 | $ 14,926,996 | $ 22,640,692 |
Reinvestment of distributions | 85,896 | 2,323 | 1,194,285 | 36,172 |
Shares redeemed | (1,407,222) | (1,364,690) | (21,375,353) | (20,977,078) |
Net increase (decrease) | (334,608) | 97,069 | $ (5,254,072) | $ 1,699,786 |
Class T | | | | |
Shares sold | 358,193 | 420,613 | $ 5,456,756 | $ 6,491,294 |
Reinvestment of distributions | 38,774 | - | 533,890 | - |
Shares redeemed | (523,310) | (434,512) | (7,812,853) | (6,714,256) |
Net increase (decrease) | (126,343) | (13,899) | $ (1,822,207) | $ (222,962) |
Class B | | | | |
Shares sold | 11,810 | 25,204 | $ 172,624 | $ 366,276 |
Reinvestment of distributions | 7,173 | - | 96,091 | - |
Shares redeemed | (81,516) | (109,118) | (1,196,288) | (1,597,390) |
Net increase (decrease) | (62,533) | (83,914) | $ (927,573) | $ (1,231,114) |
Class C | | | | |
Shares sold | 405,451 | 469,568 | $ 5,976,693 | $ 7,154,653 |
Reinvestment of distributions | 33,110 | - | 443,092 | - |
Shares redeemed | (384,855) | (368,398) | (5,527,477) | (5,494,248) |
Net increase (decrease) | 53,706 | 101,170 | $ 892,308 | $ 1,660,405 |
Small Cap Growth | | | | |
Shares sold | 14,552,522 | 19,971,507 | $ 226,496,807 | $ 315,167,556 |
Reinvestment of distributions | 1,774,167 | 153,921 | 25,022,882 | 2,384,001 |
Shares redeemed | (27,135,724) | (31,144,660) | (414,348,619) | (483,710,319) |
Net increase (decrease) | (10,809,035) | (11,019,232) | $ (162,828,930) | $ (166,158,762) |
Class F | | | | |
Shares sold | 16,430,240 | 11,382,202 | $ 255,874,632 | $ 176,012,143 |
Reinvestment of distributions | 432,802 | 31,816 | 6,152,820 | 492,928 |
Shares redeemed | (1,757,546) | (2,356,621) | (26,811,905) | (37,493,486) |
Net increase (decrease) | 15,105,496 | 9,057,397 | $ 235,215,547 | $ 139,011,585 |
Institutional Class | | | | |
Shares sold | 819,623 | 1,038,111 | $ 12,520,738 | $ 16,415,657 |
Reinvestment of distributions | 44,186 | 2,532 | 624,723 | 39,301 |
Shares redeemed | (1,078,752) | (555,221) | (16,617,897) | (8,700,391) |
Net increase (decrease) | (214,943) | 485,422 | $ (3,472,436) | $ 7,754,567 |
Annual Report
Notes to Financial Statements - continued
12. Other.
The Fund's organizational documents provide former and current trustees and officers with a limited indemnification against liabilities arising in connection with the performance of their duties to the Fund. In the normal course of business, the Fund may also enter into contracts that provide general indemnifications. The Fund's maximum exposure under these arrangements is unknown as this would be dependent on future claims that may be made against the Fund. The risk of material loss from such claims is considered remote.
At the end of the period, the Fidelity Advisor Freedom Funds, the Fidelity Freedom Funds and the Fidelity Freedom K Funds were the owners of record, in the aggregate, of approximately 60% of the total outstanding shares of the Fund.
Annual Report
To the Trustees of Fidelity Securities Fund and the Shareholders of Fidelity Small Cap Growth Fund:
In our opinion, the accompanying statement of assets and liabilities, including the schedule of investments, and the related statements of operations and of changes in net assets and the financial highlights present fairly, in all material respects, the financial position of Fidelity Small Cap Growth Fund (a fund of Fidelity Securities Fund) at July 31, 2012, the results of its operations for the year then ended, the changes in its net assets for each of the two years in the period then ended and the financial highlights for each of the periods indicated, in conformity with accounting principles generally accepted in the United States of America. These financial statements and financial highlights (hereafter referred to as "financial statements") are the responsibility of the Fidelity Small Cap Growth Fund's management. Our responsibility is to express an opinion on these financial statements based on our audits. We conducted our audits of these financial statements in accordance with the standards of the Public Company Accounting Oversight Board (United States). Those standards require that we plan and perform the audit to obtain reasonable assurance about whether the financial statements are free of material misstatement. An audit includes examining, on a test basis, evidence supporting the amounts and disclosures in the financial statements, assessing the accounting principles used and significant estimates made by management, and evaluating the overall financial statement presentation. We believe that our audits, which included confirmation of securities at July 31, 2012 by correspondence with the custodian brokers and transfer agent, provide a reasonable basis for our opinion.
PricewaterhouseCoopers LLP
Boston, Massachusetts
September 12, 2012
Annual Report
The Trustees, Members of the Advisory Board, and executive officers of the trust and fund, as applicable, are listed below. The Board of Trustees governs the fund and is responsible for protecting the interests of shareholders. The Trustees are experienced executives who meet periodically throughout the year to oversee the fund's activities, review contractual arrangements with companies that provide services to the fund, oversee management of the risks associated with such activities and contractual arrangements, and review the fund's performance. Except for James C. Curvey, each of the Trustees oversees 228 funds advised by FMR or an affiliate. Mr. Curvey oversees 435 funds advised by FMR or an affiliate.
The Trustees hold office without limit in time except that (a) any Trustee may resign; (b) any Trustee may be removed by written instrument, signed by at least two-thirds of the number of Trustees prior to such removal; (c) any Trustee who requests to be retired or who has become incapacitated by illness or injury may be retired by written instrument signed by a majority of the other Trustees; and (d) any Trustee may be removed at any special meeting of shareholders by a two-thirds vote of the outstanding voting securities of the trust. Each Trustee who is not an interested person (as defined in the 1940 Act) (Independent Trustee), shall retire not later than the last day of the calendar year in which his or her 75th birthday occurs. The Independent Trustees may waive this mandatory retirement age policy with respect to individual Trustees. The executive officers and Advisory Board Members hold office without limit in time, except that any officer and Advisory Board Member may resign or may be removed by a vote of a majority of the Trustees at any regular meeting or any special meeting of the Trustees. Except as indicated, each individual has held the office shown or other offices in the same company for the past five years.
Experience, Skills, Attributes, and Qualifications of the Fund's Trustees. The Governance and Nominating Committee has adopted a statement of policy that describes the experience, qualifications, attributes, and skills that are necessary and desirable for potential Independent Trustee candidates (Statement of Policy). The Board believes that each Trustee satisfied at the time he or she was initially elected or appointed a Trustee, and continues to satisfy, the standards contemplated by the Statement of Policy. The Governance and Nominating Committee also engages professional search firms to help identify potential Independent Trustee candidates who have the experience, qualifications, attributes, and skills consistent with the Statement of Policy. From time to time, additional criteria based on the composition and skills of the current Independent Trustees, as well as experience or skills that may be appropriate in light of future changes to board composition, business conditions, and regulatory or other developments, have also been considered by the professional search firms and the Governance and Nominating Committee. In addition, the Board takes into account the Trustees' commitment and participation in Board and committee meetings, as well as their leadership of standing and ad hoc committees throughout their tenure.
In determining that a particular Trustee was and continues to be qualified to serve as a Trustee, the Board has considered a variety of criteria, none of which, in isolation, was controlling. The Board believes that, collectively, the Trustees have balanced and diverse experience, qualifications, attributes, and skills, which allow the Board to operate effectively in governing the fund and protecting the interests of shareholders. Information about the specific experience, skills, attributes, and qualifications of each Trustee, which in each case led to the Board's conclusion that the Trustee should serve (or continue to serve) as a trustee of the fund, is provided below.
Annual Report
Board Structure and Oversight Function. James C. Curvey is an interested person (as defined in the 1940 Act) and currently serves as Chairman. The Trustees have determined that an interested Chairman is appropriate and benefits shareholders because an interested Chairman has a personal and professional stake in the quality and continuity of services provided to the fund. Independent Trustees exercise their informed business judgment to appoint an individual of their choosing to serve as Chairman, regardless of whether the Trustee happens to be independent or a member of management. The Independent Trustees have determined that they can act independently and effectively without having an Independent Trustee serve as Chairman and that a key structural component for assuring that they are in a position to do so is for the Independent Trustees to constitute a substantial majority for the Board. The Independent Trustees also regularly meet in executive session. Ned C. Lautenbach serves as Chairman of the Independent Trustees and as such (i) acts as a liaison between the Independent Trustees and management with respect to matters important to the Independent Trustees and (ii) with management prepares agendas for Board meetings.
Fidelity funds are overseen by different Boards of Trustees. The fund's Board oversees Fidelity's equity and high income funds and another Board oversees Fidelity's investment-grade bond, money market, and asset allocation funds. The asset allocation funds may invest in Fidelity funds overseen by the fund's Board. The use of separate Boards, each with its own committee structure, allows the Trustees of each group of Fidelity funds to focus on the unique issues of the funds they oversee, including common research, investment, and operational issues. On occasion, the separate Boards establish joint committees to address issues of overlapping consequences for the Fidelity funds overseen by each Board.
The Trustees operate using a system of committees to facilitate the timely and efficient consideration of all matters of importance to the Trustees, the fund, and fund shareholders and to facilitate compliance with legal and regulatory requirements and oversight of the fund's activities and associated risks. The Board, acting through its committees, has charged FMR and its affiliates with (i) identifying events or circumstances the occurrence of which could have demonstrably adverse effects on the fund's business and/or reputation; (ii) implementing processes and controls to lessen the possibility that such events or circumstances occur or to mitigate the effects of such events or circumstances if they do occur; and (iii) creating and maintaining a system designed to evaluate continuously business and market conditions in order to facilitate the identification and implementation processes described in (i) and (ii) above. Because the day-to-day operations and activities of the fund are carried out by or through FMR, its affiliates and other service providers, the fund's exposure to risks is mitigated but not eliminated by the processes overseen by the Trustees. While each of the Board's committees has responsibility for overseeing different aspects of the fund's activities, oversight is exercised primarily through the Operations, Audit, and Compliance Committees. In addition, the Independent Trustees have worked with FMR to enhance the Board's oversight of investment and financial risks, legal and regulatory risks, technology risks, and operational risks, including the development of additional risk reporting to the Board. For example, a working group comprised of Independent Trustees and FMR has worked and continues to work to review the Fidelity funds' valuation-related activities, reporting and risk management. Appropriate personnel, including but not limited to the fund's Chief Compliance Officer (CCO), FMR's internal auditor, the independent accountants, the fund's Treasurer and portfolio management personnel, make periodic reports to the Board's committees, as appropriate, including an annual review of FMR's risk management program for the Fidelity funds. The responsibilities of each standing committee, including their oversight responsibilities, are described further under "Standing Committees of the Fund's Trustees."
Annual Report
Trustees and Officers - continued
The fund's Statement of Additional Information (SAI) includes more information about the Trustees. To request a free copy, call Fidelity at 1-877-208-0098.
Interested Trustees*:
Correspondence intended for each Trustee who is an interested person may be sent to Fidelity Investments, 82 Devonshire Street, Boston, Massachusetts 02109.
Name, Age; Principal Occupations and Other Relevant Experience+ |
James C. Curvey (77) |
| Year of Election or Appointment: 2007 Mr. Curvey is Trustee and Chairman of the Board of Trustees of certain Trusts. Mr. Curvey also serves as Trustee (2007-present) of other investment companies advised by FMR. Mr. Curvey is a Director of Fidelity Investments Money Management, Inc. (2009-present), Director of Fidelity Research & Analysis Co. (2009-present) and Director of FMR and FMR Co., Inc. (2007-present). Mr. Curvey is also Vice Chairman (2007-present) and Director of FMR LLC. In addition, Mr. Curvey serves as an Overseer for the Boston Symphony Orchestra and a member of the Trustees of Villanova University. Previously, Mr. Curvey was the Vice Chairman (2006-2007) and Director (2000-2007) of FMR Corp. |
Ronald P. O'Hanley (55) |
| Year of Election or Appointment: 2011 Mr. O'Hanley is Director of FMR Co., Inc. (2010-present), Director of Fidelity Investments Money Management, Inc. (2010-present), Director of Fidelity Research & Analysis Company (2010-present), President of Fidelity Asset Management and Corporate Services and a member of Fidelity's Executive Committee (2010-present). Previously, Mr. O'Hanley served as President and Chief Executive Officer of BNY Mellon Asset Management (2007-2010). Mr. O'Hanley also served as Vice Chairman of Bank New York Mellon Corp. and a member of that firm's Executive Committee. Prior to the 2007 merger of The Bank of New York and Mellon Financial Corporation, he was Vice Chairman of Mellon Financial Corporation and President and Chief Executive Officer of Mellon Asset Management. He joined Mellon in February 1997. Mr. O'Hanley currently serves as Chairman of the Boston Public Library Foundation Board of Directors and sits on the Board of Directors of Beth Israel Deaconess Medical Center, the Board of Trustees of the Marine Biological Laboratory and the Advisory Board of the Maxwell School of Citizenship and Public Administration at Syracuse University. Mr. O'Hanley also chairs the Council on Asset Management for the Financial Services Roundtable and is a member of the Board of Directors of Institutional Investor's U.S. Institute. |
* Trustees have been determined to be "Interested Trustees" by virtue of, among other things, their affiliation with the trust or various entities under common control with FMR.
+ The information above includes each Trustee's principal occupation during the last five years and other information relating to the experience, attributes, and skills relevant to each Trustee's qualifications to serve as a Trustee, which led to the conclusion that each Trustee should serve as a Trustee for the fund.
Annual Report
Trustees and Officers - continued
Independent Trustees:
Correspondence intended for each Independent Trustee (that is, the Trustees other than the Interested Trustees) may be sent to Fidelity Investments, P.O. Box 55235, Boston, Massachusetts 02205-5235.
Name, Age; Principal Occupations and Other Relevant Experience+ |
Dennis J. Dirks (64) |
| Year of Election or Appointment: 2005 Prior to his retirement in May 2003, Mr. Dirks was Chief Operating Officer and a member of the Board of The Depository Trust & Clearing Corporation (DTCC). He also served as President, Chief Operating Officer, and Board member of The Depository Trust Company (DTC) and President and Board member of the National Securities Clearing Corporation (NSCC). In addition, Mr. Dirks served as Chief Executive Officer and Board member of the Government Securities Clearing Corporation, Chief Executive Officer and Board member of the Mortgage-Backed Securities Clearing Corporation, as a Trustee and a member of the Finance Committee of Manhattan College (2005-2008), and as a Trustee and a member of the Finance Committee of AHRC of Nassau County (2006-2008). Mr. Dirks is a member of the Independent Directors Council (IDC) Governing Council (2010-present) and Board of Directors for The Brookville Center for Children's Services, Inc. (2009-present). |
Alan J. Lacy (58) |
| Year of Election or Appointment: 2008 Mr. Lacy serves as Senior Adviser (2007-present) of Oak Hill Capital Partners, L.P. (private equity). Mr. Lacy also served as Chief Executive Officer (2000-2005) and Vice Chairman (2005-2006) of Sears Holdings Corporation and Sears, Roebuck and Co. (retail). In addition, Mr. Lacy serves as a member of the Board of Directors of Dave & Buster's Entertainment, Inc. (restaurant and entertainment complexes, 2010-present), Earth Fare, Inc. (retail grocery, 2012-present), The Hillman Companies, Inc. (hardware wholesalers, 2010-present), and Bristol-Myers Squibb Company (global pharmaceuticals, 2007-present). Mr. Lacy is a member of the Board of Trustees of The National Parks Conservation Association (2006-present). Previously, Mr. Lacy served as Chairman of the Board of Trustees of the National Parks Conservation Association (2008-2011) and as a member of the Board of Directors for the Western Union Company (global money transfer, 2006-2011). |
Ned C. Lautenbach (68) |
| Year of Election or Appointment: 2000 Mr. Lautenbach is Chairman of the Independent Trustees of the Equity and High Income Funds (2006-present). Mr. Lautenbach currently serves as the Lead Director of the Eaton Corporation Board of Directors (diversified industrial, 1997-present). Mr. Lautenbach is Chairman of the Board of Directors of the Philharmonic Center for the Arts in Naples, Florida (2012-present) and a member of the Council on Foreign Relations (1994-present). Previously, Mr. Lautenbach was a Partner/Advisory Partner at Clayton, Dubilier & Rice, LLC (private equity investment, 1998-2010), as well as a Director of Sony Corporation (2006-2007). |
Joseph Mauriello (67) |
| Year of Election or Appointment: 2008 Prior to his retirement in January 2006, Mr. Mauriello served in numerous senior management positions including Deputy Chairman and Chief Operating Officer (2004-2005), and Vice Chairman of Financial Services (2002-2004) of KPMG LLP US (professional services, 1965-2005). Mr. Mauriello currently serves as a member of the Board of Directors of XL Group plc. (global insurance and re-insurance, 2006-present). Previously, Mr. Mauriello served as a Director of the Hamilton Funds of the Bank of New York (2006-2007) and of Arcadia Resources Inc. (health care services and products, 2007-2012). |
Robert W. Selander (61) |
| Year of Election or Appointment: 2011 Previously, Mr. Selander served as a Member of the Advisory Board of Fidelity's Equity and High Income Funds (2011), Executive Vice Chairman (2010), Chief Executive Officer (2009-2010), and President and Chief Executive Officer (1997-2009) of Mastercard, Inc. |
Cornelia M. Small (68) |
| Year of Election or Appointment: 2005 Ms. Small is a member of the Board of Directors of the Teagle Foundation (2009-present). Ms. Small is also a member of the Investment Committee, and Chair (2008-present) and a member of the Board of Trustees of Smith College. In addition, Ms. Small serves on the Investment Committee of the Berkshire Taconic Community Foundation (2008-present). Previously, Ms. Small served as Chairperson of the Investment Committee (2002-2008) of Smith College. In addition, Ms. Small served as Chief Investment Officer, Director of Global Equity Investments, and a member of the Board of Directors of Scudder, Stevens & Clark and Scudder Kemper Investments. |
William S. Stavropoulos (73) |
| Year of Election or Appointment: 2002 Mr. Stavropoulos is Vice Chairman of the Independent Trustees of the Equity and High Income Funds (2006-present). Mr. Stavropoulos serves as President and Founder of the Michigan Baseball Foundation, the Great Lakes Loons (2007-present). Mr. Stavropoulos is Chairman Emeritus of the Board of Directors of The Dow Chemical Company, where he previously served in numerous senior management positions, including President, CEO (1995-2000; 2002-2004), Chairman of the Executive Committee (2000-2006), and as a member of the Board of Directors (1990-2006). Currently, Mr. Stavropoulos is Chairman of Univar (global distributor of commodity and specialty chemicals, 2010-present), a Director of Teradata Corporation (data warehousing and technology solutions, 2008-present), Chemical Financial Corporation, Maersk Inc. (industrial conglomerate), Tyco International, Inc. (multinational manufacturing and services, 2007-present), and a member of the Advisory Board for Metalmark Capital (private equity investment, 2005-present). Mr. Stavropoulos is a special advisor to Clayton, Dubilier & Rice, LLC (private equity investment). In addition, Mr. Stavropoulos is a member of the University of Notre Dame Advisory Council for the College of Science. |
David M. Thomas (63) |
| Year of Election or Appointment: 2008 Previously, Mr. Thomas served as Executive Chairman (2005-2006) and Chairman and Chief Executive Officer (2000-2005) of IMS Health, Inc. (pharmaceutical and healthcare information solutions). In addition, Mr. Thomas serves as a member of the Board of Directors of Fortune Brands, Inc. (consumer products), and Interpublic Group of Companies, Inc. (marketing communication, 2004-present). |
Michael E. Wiley (61) |
| Year of Election or Appointment: 2008 Mr. Wiley also serves as a Director of Asia Pacific Exploration Consolidated (international oil and gas exploration and production, 2008-present). Mr. Wiley serves as a Director of Tesoro Corporation (independent oil refiner and marketer, 2005-present), and a Director of Bill Barrett Corporation (exploration and production, 2005-present). In addition, Mr. Wiley also serves as a Director of Post Oak Bank (privately-held bank, 2004-present). Previously, Mr. Wiley served as a member of the Board of Trustees of the University of Tulsa (2000-2006; 2007-2010), as a Senior Energy Advisor of Katzenbach Partners, LLC (consulting, 2006-2007), as an Advisory Director of Riverstone Holdings (private investment), Chairman, President, and CEO of Baker Hughes, Inc. (oilfield services, 2000-2004), and as Director of Spinnaker Exploration Company (exploration and production, 2001-2005). |
Annual Report
+ The information above includes each Trustee's principal occupation during the last five years and other information relating to the experience, attributes, and skills relevant to each Trustee's qualifications to serve as a Trustee, which led to the conclusion that each Trustee should serve as a Trustee for the fund.
Advisory Board Members and Executive Officers:
Correspondence intended for David A. Rosow and Garnett A. Smith may be sent to Fidelity Investments, P.O. Box 55235, Boston, MA 02205-5235. Correspondence intended for each executive officer, Edward C. Johnson 3d, and Peter S. Lynch may be sent to Fidelity Investments, 82 Devonshire Street, Boston, Massachusetts 02109.
Name, Age; Principal Occupation |
Edward C. Johnson 3d (82) |
| Year of Election or Appointment: 2011 Member of the Advisory Board of Fidelity's Equity and High Income Funds. Mr. Johnson serves as Chief Executive Officer, Chairman, and a Director of FMR LLC, and also serves as Chairman and Director of FIL Limited. Previously, Mr. Johnson served as a Trustee and Chairman of the Board of certain Fidelity Trusts, Chairman and a Director of FMR, Chairman and a Director of FMR Co., Inc., and President of FMR LLC (2006-2007). |
Peter S. Lynch (68) |
| Year of Election or Appointment: 2003 Member of the Advisory Board of Fidelity's Equity and High Income Funds. Mr. Lynch is Vice Chairman and a Director of FMR and FMR Co., Inc. In addition, Mr. Lynch serves as a Trustee of Boston College and as the Chairman of the Inner-City Scholarship Fund. Previously, Mr. Lynch served on the Special Olympics International Board of Directors (1997-2006). |
David A. Rosow (69) |
| Year of Election or Appointment: 2012 Member of the Advisory Board of Fidelity's Equity and High Income Funds. Chairman and Chief Executive Officer of International Golf Group, Inc. (golf course development, 1990-present). Previously, Mr. Rosow served as Chairman and Chief Executive Officer of Rosow & Company, Inc. (private investment company, 1989-2011), a Lead Director of Hudson United Bancorp (2001-2006) and as a Director of TD Banknorth (1996-2006). In addition, Mr. Rosow is a member (2008-present) and President (2009-present) of the Town Council of Palm Beach, Florida. |
Garnett A. Smith (64) |
| Year of Election or Appointment: 2012 Member of the Advisory Board of Fidelity's Equity and High Income Funds. Prior to Mr. Smith's retirement, he served as Chairman and Chief Executive Officer of Inbrand Corp. (manufacturer of personal absorbent products, 1990-1997). He also served as President (1986-1990) of Inbrand Corp. Prior to his employment with Inbrand Corp., he was employed by a retail fabric chain and North Carolina National Bank. In addition, Mr. Smith is a board member of the Jackson Hole Land Trust (2009-present). |
Kenneth B. Robins (42) |
| Year of Election or Appointment: 2008 President and Treasurer of Fidelity's Equity and High Income Funds. Mr. Robins also serves as President and Treasurer (2010-present) and Assistant Treasurer (2009-present) of other Fidelity funds and is an employee of Fidelity Investments (2004-present). Previously, Mr. Robins served as Deputy Treasurer of the Fidelity funds (2005-2008) and Treasurer and Chief Financial Officer of The North Carolina Capital Management Trust: Cash and Term Portfolios (2006-2008). |
Brian B. Hogan (47) |
| Year of Election or Appointment: 2009 Vice President of Equity and High Income Funds. Mr. Hogan also serves as President of FMR's Equity Division (2009-present). Previously, Mr. Hogan served as Senior Vice President, Equity Research of FMR (2006-2009) and as a portfolio manager. |
Thomas C. Hense (48) |
| Year of Election or Appointment: 2008 or 2010 Vice President of Fidelity's High Income (2008), Small Cap (2008), and Value (2010) Funds. Previously, Mr. Hense served as a portfolio manager for Fidelity's Institutional Money Management Group (Pyramis) (2003-2008). |
Scott C. Goebel (44) |
| Year of Election or Appointment: 2008 Secretary and Chief Legal Officer (CLO) of the Fidelity funds. Mr. Goebel also serves as Secretary of Fidelity Investments Money Management, Inc. (FIMM) (2010-present) and Fidelity Research and Analysis Company (FRAC) (2010-present); Secretary and CLO of The North Carolina Capital Management Trust: Cash and Term Portfolios (2008-present); General Counsel, Secretary, and Senior Vice President of FMR (2008-present) and FMR Co., Inc. (2008-present); employed by FMR LLC or an affiliate (2001-present); Chief Legal Officer of Fidelity Management & Research (Hong Kong) Limited (2008-present) and Assistant Secretary of Fidelity Management & Research (Japan) Inc. (2008-present), and Fidelity Management & Research (U.K.) Inc. (2008-present). Previously, Mr. Goebel served as Assistant Secretary of FIMM (2008-2010), FRAC (2008-2010), and the Funds (2007-2008) and as Vice President and Secretary of Fidelity Distributors Corporation (FDC) (2005-2007). |
William C. Coffey (43) |
| Year of Election or Appointment: 2009 Assistant Secretary of Fidelity's Equity and High Income Funds. Mr. Coffey also serves as Senior Vice President and Deputy General Counsel of FMR LLC (2010-present), and is an employee of Fidelity Investments. Previously, Mr. Coffey served as Vice President and Associate General Counsel of FMR LLC (2005-2009). |
Elizabeth Paige Baumann (44) |
| Year of Election or Appointment: 2012 Anti-Money Laundering (AML) Officer of the Fidelity funds. Ms. Baumann also serves as AML Officer of The North Carolina Capital Management Trust: Cash and Term Portfolios (2012-present), Chief AML Officer of FMR LLC (2012-present), and is an employee of Fidelity Investments. Previously, Ms. Baumann served as Vice President and Deputy Anti-Money Laundering Officer (2007-2012). |
Christine Reynolds (53) |
| Year of Election or Appointment: 2008 Chief Financial Officer of the Fidelity funds. Ms. Reynolds became President of Fidelity Pricing and Cash Management Services (FPCMS) in August 2008. Ms. Reynolds served as Chief Operating Officer of FPCMS (2007-2008). Previously, Ms. Reynolds served as President, Treasurer, and Anti-Money Laundering officer of the Fidelity funds (2004-2007). |
Joseph A. Hanlon (44) |
| Year of Election or Appointment: 2012 Chief Compliance Officer of Fidelity's Equity and High Income Funds. Mr. Hanlon serves as Compliance Officer of FMR, FMR Co., Inc., Fidelity Investments Money Management, Inc. (FIMM), Fidelity Research and Analysis Company (FRAC), Fidelity Management & Research (Japan) Inc., Fidelity Management & Research (U.K.) Inc., Fidelity Management & Research (Hong Kong), and Strategic Advisers, Inc. (2009-present), as Senior Vice President of the Fidelity Asset Management Division (2009-present), and is an employee of Fidelity Investments. |
Joseph F. Zambello (55) |
| Year of Election or Appointment: 2011 Deputy Treasurer of the Fidelity funds. Mr. Zambello is an employee of Fidelity Investments. Previously, Mr. Zambello served as Vice Presidentof FMR's Program Management Group (2009-2011) and Vice President of the Transfer Agent Oversight Group (2005-2009). |
Adrien E. Deberghes (44) |
| Year of Election or Appointment: 2008 Deputy Treasurer of Fidelity's Equity and High Income Funds. Mr. Deberghes also serves as Vice President (2011-present) and Assistant Treasurer (2010-present) of other Fidelity funds, and is an employee of Fidelity Investments (2008-present). Previously, Mr. Deberghes served as Senior Vice President of Mutual Fund Administration at State Street Corporation (2007-2008), Senior Director of Mutual Fund Administration at Investors Bank & Trust (2005-2007), and Director of Finance for Dunkin' Brands (2000-2005). |
Stephanie J. Dorsey (43) |
| Year of Election or Appointment: 2010 Assistant Treasurer of Fidelity's Equity and High Income Funds. Ms. Dorsey also serves as Deputy Treasurer of other Fidelity funds (2008-present) and is an employee of Fidelity Investments (2008-present). Previously, Ms. Dorsey served as Treasurer (2004-2008) of the JPMorgan Mutual Funds and Vice President (2004-2008) of JPMorgan Chase Bank. |
John R. Hebble (54) |
| Year of Election or Appointment: 2009 Assistant Treasurer of Fidelity's Equity and High Income Funds. Mr. Hebble also serves as President (2011-present), Treasurer, and Chief Financial Officer of The North Carolina Capital Management Trust: Cash and Term Portfolios (2008-present), President and Treasurer of other Fidelity funds (2008-present) and is an employee of Fidelity Investments. |
Gary W. Ryan (53) |
| Year of Election or Appointment: 2005 Assistant Treasurer of the Fidelity funds. Mr. Ryan is an employee of Fidelity Investments. Previously, Mr. Ryan served as Vice President of Fund Reporting in Fidelity Pricing and Cash Management Services (FPCMS) (1999-2005). |
Jonathan Davis (44) |
| Year of Election or Appointment: 2010 Assistant Treasurer of the Fidelity funds. Mr. Davis is also Assistant Treasurer of Fidelity Rutland Square Trust II and Fidelity Commonwealth Trust II. Mr. Davis is an employee of Fidelity Investments. Previously, Mr. Davis served as Vice President and Associate General Counsel of FMR LLC (2003-2010). |
Annual Report
The Board of Trustees of Fidelity Small Cap Growth Fund voted to pay to shareholders of record at the opening of business, the following distributions per share derived from capital gains realized from sales of portfolio securities, and dividends derived from net investment income:
| Pay Date | Record Date | Capital Gains |
Institutional Class | 09/10/12 | 09/07/12 | $0.582 |
The fund hereby designates as a capital gain dividend with respect to the taxable year ended July 31,2012, $80,163,961, or, if subsequently determined to be different, the net capital gain of such year.
The fund will notify shareholders in January 2013 of amounts for use in preparing 2012 income tax returns.
Annual Report
Board Approval of Investment Advisory Contracts and Management Fees
Fidelity Small Cap Growth Fund
Each year, the Board of Trustees, including the Independent Trustees (together, the Board), votes on the renewal of the management contract and sub-advisory agreements (together, the Advisory Contracts) for the fund. The Board, assisted by the advice of fund counsel and Independent Trustees' counsel, requests and considers a broad range of information relevant to the renewal of the Advisory Contracts throughout the year.
The Board meets regularly and, at each of its meetings, considers factors that are relevant to its annual consideration of the renewal of the fund's Advisory Contracts, including the services and support provided to the fund and its shareholders. The Board has established various standing committees, each composed of and chaired by Independent Trustees with varying backgrounds, to which the Board has assigned specific subject matter responsibilities in order to enhance effective decision-making by the Board. The Board, acting directly and through its Committees, requests and receives information concerning the annual consideration of the renewal of the fund's Advisory Contracts. The Board also meets as needed to consider matters specifically related to the Board's annual consideration of the renewal of Advisory Contracts. Members of the Board may also meet with trustees of other Fidelity funds through ad hoc joint committees to discuss certain matters relevant to the Fidelity funds.
At its July 2012 meeting, the Board of Trustees, including the Independent Trustees, unanimously determined to renew the fund's Advisory Contracts. In reaching its determination, the Board considered all factors it believed relevant, including (i) the nature, extent, and quality of the services to be provided to the fund and its shareholders (including the investment performance of the fund); (ii) the competitiveness of the fund's management fee and total expense ratio relative to peer funds; (iii) the total costs of the services to be provided by and the profits to be realized by Fidelity from its relationship with the fund; (iv) the extent to which economies of scale exist and would be realized as the fund grows; and (v) whether fee levels reflect these economies of scale, if any, for the benefit of fund shareholders.
In considering whether to renew the Advisory Contracts for the fund, the Board reached a determination, with the assistance of fund counsel and Independent Trustees' counsel and through the exercise of its business judgment, that the renewal of the Advisory Contracts is in the best interests of the fund and its shareholders and that the compensation payable under the Advisory Contracts is fair and reasonable. The Board's decision to renew the Advisory Contracts was not based on any single factor, but rather was based on a comprehensive consideration of all the information provided to the Board at its meetings throughout the year. The Board, in reaching its determination to renew the Advisory Contracts, is aware that shareholders in the fund have a broad range of investment choices available to them, including a wide choice among mutual funds offered by Fidelity's competitors, and that the fund's shareholders, who have the opportunity to review and weigh the disclosure provided by the fund in its prospectus and other public disclosures, have chosen to invest in this fund, managed by Fidelity.
Annual Report
Board Approval of Investment Advisory Contracts and
Management Fees - continued
Nature, Extent, and Quality of Services Provided. The Board considered the staffing within the investment adviser, FMR, and the sub-advisers (together, the Investment Advisers), including the backgrounds of the fund's investment personnel, and also considered the fund's investment objective, strategies, and related investment philosophy. The Independent Trustees also had discussions with senior management of Fidelity's investment operations and investment groups. The Board considered the structure of the portfolio manager compensation program and whether this structure provides appropriate incentives to act in the best interests of the fund.
Resources Dedicated to Investment Management and Support Services. The Board and the Fund Oversight and Research Committees reviewed the general qualifications and capabilities of the Investment Advisers' investment staff, including its size, education, experience, and resources, as well as the Investment Advisers' approach to recruiting, training, managing, and compensating investment personnel. The Board also noted that FMR has continued to increase the resources devoted to non-U.S. offices, including expansion of Fidelity's global investment organization. The Board noted that Fidelity's analysts have extensive resources, tools and capabilities that allow them to conduct sophisticated quantitative and fundamental analysis, as well as credit analysis of issuers, counterparties and guarantors. The Board also believes that Fidelity's investment professionals have sufficient access to global information and data so as to provide competitive investment results over time, and that those professionals also have access to sophisticated tools that permit them to assess portfolio construction and risk and performance attribution characteristics continuously, as well as to transmit new information and research conclusions rapidly around the world. Additionally, in its deliberations, the Board considered the Investment Advisers' trading and risk management capabilities and resources, which are an integral part of the investment management process.
Shareholder and Administrative Services. The Board considered (i) the nature, extent, quality, and cost of advisory, administrative, and shareholder services performed by the Investment Advisers and their affiliates under the Advisory Contracts and under separate agreements covering transfer agency, pricing and bookkeeping, and securities lending services for the fund; (ii) the nature and extent of the supervision of third party service providers, principally custodians and subcustodians; and (iii) the resources devoted to, and the record of compliance with, the fund's compliance policies and procedures. The Board also reviewed the allocation of fund brokerage, including allocations to brokers affiliated with the Investment Advisers, the use of brokerage commissions to pay fund expenses, and the use of "soft" commission dollars to pay for research services.
Annual Report
The Board noted that the growth of fund assets over time across the complex allows Fidelity to reinvest in the development of services designed to enhance the value or convenience of the Fidelity funds as investment vehicles. These services include 24-hour access to account information and market information through telephone representatives and over the Internet, investor education materials and asset allocation tools, and the expanded availability of Fidelity Investor Centers.
Investment in a Large Fund Family. The Board considered the benefits to shareholders of investing in a Fidelity fund, including the benefits of investing in a fund that is part of a large family of funds offering a variety of investment disciplines and providing a large variety of mutual fund investor services. The Board noted that Fidelity had taken, or had made recommendations that resulted in the Fidelity funds taking, a number of actions over the previous year that benefited particular funds, including (i) continuing to dedicate additional resources to investment research and support of the senior management team that oversees asset management; (ii) persisting in efforts to enhance Fidelity's research capabilities, in particular, international research; (iii) launching new funds and making other enhancements to meet client needs for global and income-oriented solutions; (iv) continuing to launch dedicated lower cost underlying funds to meet investment management's portfolio construction needs related to expanding underlying fund options, specifically for the Freedom Fund product lines; (v) adopting a "Stock Selector" sector neutral investment approach and employing a team of portfolio managers who are sector specialists to manage certain funds; (vi) rationalizing product lines and gaining increased efficiencies through the mergers of several funds into other funds; (vii) strengthening the Spartan Index Fund product line by adding new funds and/or new low-cost institutional share classes, restructuring fund expenses to accommodate new classes, and reducing investment minimums for certain classes of shares; (viii) modifying the eligibility criteria for Institutional Class shares to increase their appeal to government entities and charitable investors; and (ix) reducing certain transfer agent fee rates.
Investment Performance. The Board considered whether the fund has operated in accordance with its investment objective, as well as its record of compliance with its investment restrictions. It also reviewed the fund's absolute investment performance for each class, as well as the fund's relative investment performance for each class measured over multiple periods against (i) a broad-based securities market index, and (ii) a peer group of mutual funds deemed appropriate by Fidelity and reviewed by the Board. The following charts considered by the Board show, over the one-, three-, and five-year periods ended December 31, 2011, the cumulative total returns of Institutional Class (Class I) and Class B of the fund, the cumulative total returns of a broad-based securities market index ("benchmark"), and a range of cumulative total returns of a peer group of mutual funds identified by Morningstar, Inc. as having an investment style similar to that of the fund based on underlying portfolio holdings. The returns of Institutional Class (Class I) and Class B show the performance of the highest and lowest performing classes, respectively (based on five-year performance). The box within each chart shows the 25th percentile return (top of box) and the 75th percentile return (bottom of box) of the peer group. Returns shown above the box are in the first quartile and returns shown below the box are in the fourth quartile. The percentage beaten numbers noted below each chart correspond to the percentile box and represent the percentage of funds in the peer group whose performance was equal to or lower than that of the class indicated.
Annual Report
Board Approval of Investment Advisory Contracts and
Management Fees - continued
Fidelity Small Cap Growth Fund

The Board reviewed the fund's relative investment performance against its peer group and noted that the performance of Institutional Class (Class I) of the fund was in the second quartile for all the periods shown. The Board also noted that the investment performance of Institutional Class (Class I) of the fund compared favorably to its benchmark for all the periods shown. The Board considered that the variations in performance among the fund's classes reflect the variations in class expenses, which result in lower performance for higher expense classes. The Board noted that there was a portfolio management change for the fund in November 2011. The Board also reviewed the fund's performance since inception as well as performance in the current year.
The Board also considered that the fund's management fee is subject to upward or downward adjustment depending upon whether, and to what extent, the fund's investment performance for the performance period exceeds, or is exceeded by, the record (over the same period) of a Board-approved performance adjustment index. The Board noted that the performance adjustment provides FMR with a strong economic incentive to seek to achieve superior performance for the fund's shareholders and helps to more closely align the interests of FMR and the fund's shareholders.
Annual Report
Based on its review, the Board concluded that the nature, extent, and quality of services provided to the fund under the Advisory Contracts should benefit the fund's shareholders.
Competitiveness of Management Fee and Total Expense Ratio. The Board considered the fund's management fee and total expense ratio compared to "mapped groups" of competitive funds and classes. Fidelity creates "mapped groups" by combining similar Lipper investment objective categories that have comparable management fee characteristics. Combining Lipper investment objective categories aids the Board's management fee and total expense ratio comparisons by broadening the competitive group used for comparison and by reducing the number of universes to which various Fidelity funds are compared.
Management Fee. The Board considered two proprietary management fee comparisons for the 12-month periods shown in the chart below. The group of Lipper funds used by the Board for management fee comparisons is referred to below as the "Total Mapped Group." The Total Mapped Group comparison focuses on a fund's standing relative to the total universe of comparable funds available to investors in terms of gross management fees before expense reimbursements or caps, and without giving effect to the fund's performance adjustment. "TMG %" represents the percentage of funds in the Total Mapped Group that had management fees that were lower than the fund's. For example, a TMG % of 13% means that 87% of the funds in the Total Mapped Group had higher management fees than the fund. The "Asset-Size Peer Group" (ASPG) comparison focuses on a fund's standing relative to non-Fidelity funds similar in size to the fund within the Total Mapped Group. The ASPG represents at least 15% of the funds in the Total Mapped Group with comparable asset size and management fee characteristics, subject to a minimum of 50 funds (or all funds in the Total Mapped Group if fewer than 50). Additional information, such as the ASPG quartile in which the fund's management fee ranked and the impact of the fund's performance adjustment, is also included in the chart and considered by the Board.
Annual Report
Board Approval of Investment Advisory Contracts and
Management Fees - continued
Fidelity Small Cap Growth Fund
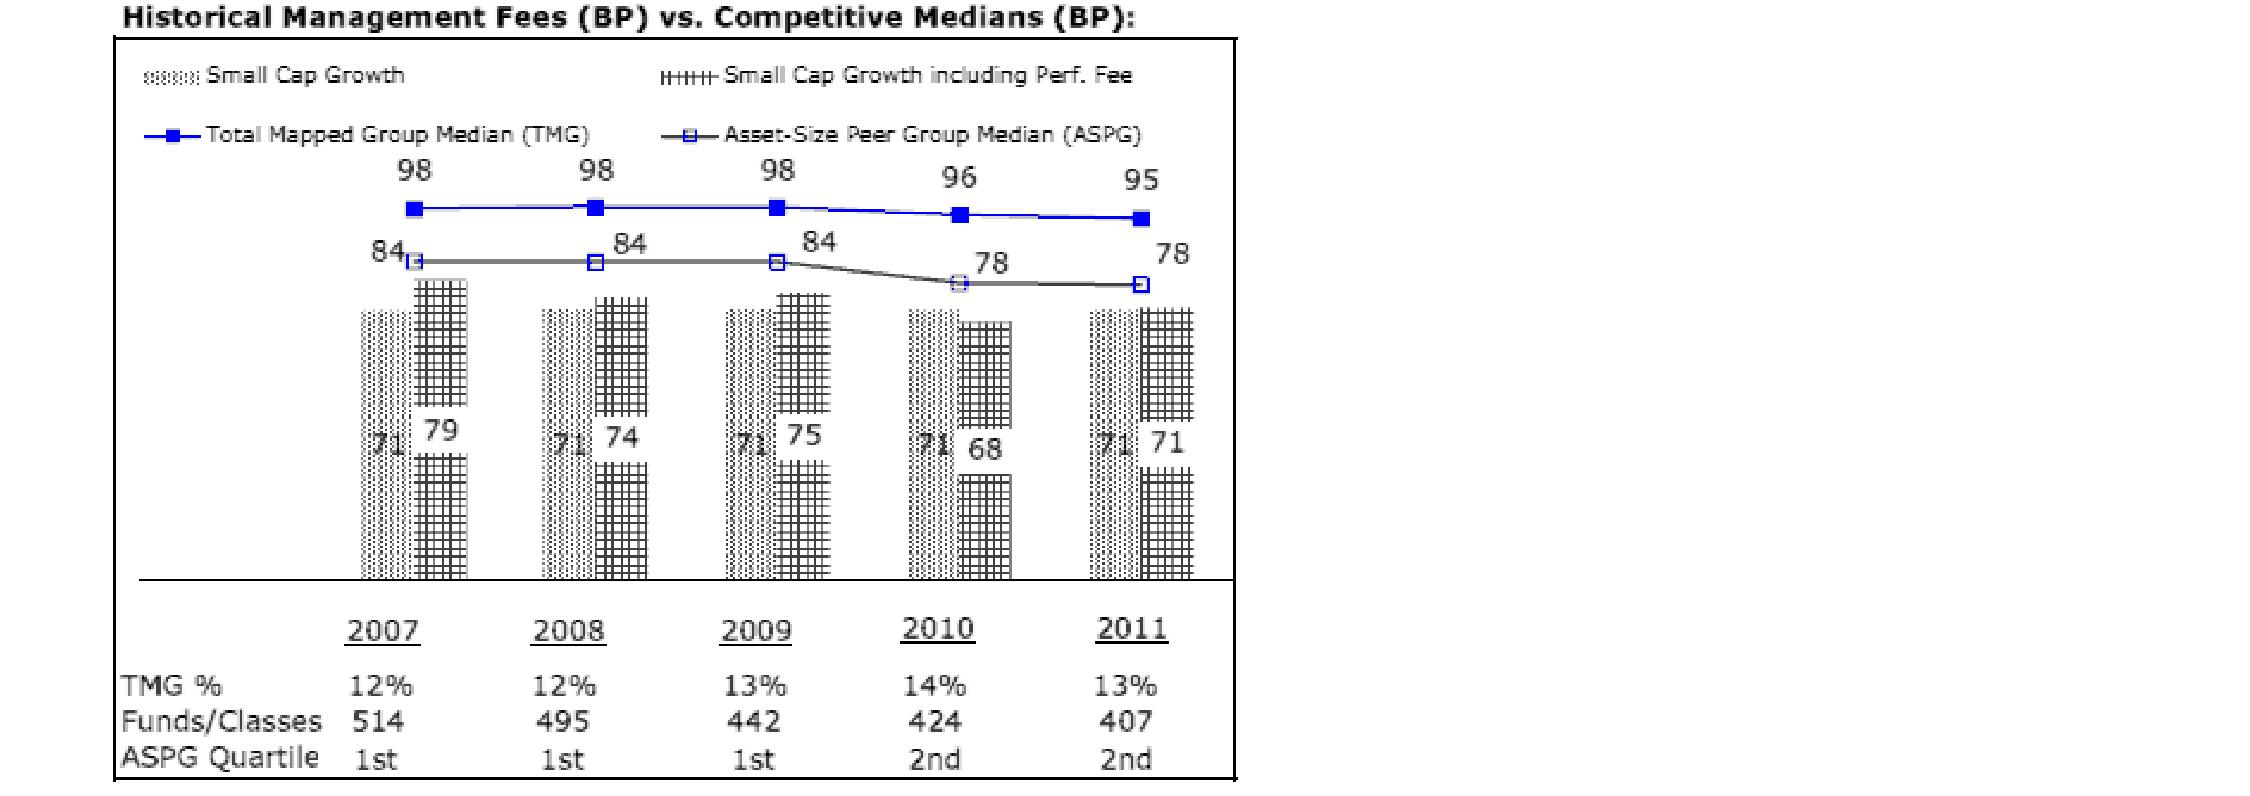
The Board noted that the fund's management fee ranked below the median of its Total Mapped Group and below the median of its ASPG for 2011. The Board also noted the effect of the fund's performance adjustment on the fund's management fee ranking. The Board noted that the performance adjustment for each year represents calculations for performance periods that differ from the periods shown in the performance charts above.
Based on its review, the Board concluded that the fund's management fee is fair and reasonable in light of the services that the fund receives and the other factors considered.
Total Expense Ratio. In its review of each class's total expense ratio, the Board considered the fund's management fee as well as other fund or class expenses, as applicable, such as transfer agent fees, pricing and bookkeeping fees, fund-paid 12b-1 fees, and custodial, legal, and audit fees. The Board also noted the effects of any waivers and reimbursements on fees and expenses, as well as the impact of the fund's performance adjustment. As part of its review, the Board also considered the current and historical total expense ratios of each class of the fund compared to competitive fund median expenses. Each class of the fund is compared to those funds and classes in the Total Mapped Group (used by the Board for management fee comparisons) that have a similar sales load structure.
The Board noted that the total expense ratio of each of Class A, Class B, Class C, Institutional Class, the retail class, and Class F ranked below its competitive median for 2011 and the total expense ratio of Class T ranked above its competitive median for 2011. The Board considered that various factors, including 12b-1 fees, positive or negative performance adjustments, and relatively higher other expenses in the case of small fund size, can affect total expense ratios. The Board noted that the total expense ratio of Class T was above the competitive median primarily because of higher 12b-1 fees on Class T. Class T has a higher 12b-1 fee, but a lower front-end sales charge, than traditionally priced front-end sales charge classes. The Board considered that Class T is primarily sold load-waived in the retirement plan market where its 0.50% 12b-1 fee is comparable to competing no-load, higher 12b-1 fee classes designed specifically for retirement plans. The Board noted that the fund offers multiple classes, each of which has a different sales load and 12b-1 fee structure, and that the multiple structures are intended to offer a range of pricing options for the intermediary market. The Board also noted that the total expense ratios of the classes vary primarily by the level of their 12b-1 fees, although differences in transfer agent fees may also cause expenses to vary from class to class.
Annual Report
Fees Charged to Other Fidelity Clients. The Board also considered Fidelity fee structures and other information with respect to clients of FMR and its affiliates, such as other mutual funds advised or subadvised by FMR or its affiliates, pension plan clients, and other institutional clients. The Board noted the findings of the 2010 ad hoc joint committee (created with the board of other Fidelity funds), which reviewed and compared Fidelity's institutional investment advisory business with its business of providing services to the Fidelity funds, including the differences in services provided, fees charged, and costs incurred, as well as competition in their respective marketplaces.
Based on its review of total expense ratios and fees charged to other Fidelity clients, the Board concluded that the total expense ratio of each class of the fund was reasonable, although Class T was above the median of the universe presented for comparison, in light of the services that the fund and its shareholders receive and the other factors considered.
Costs of the Services and Profitability. The Board considered the revenues earned and the expenses incurred by Fidelity in conducting the business of developing, marketing, distributing, managing, administering and servicing the fund and its shareholders. The Board also considered the level of Fidelity's profits in respect of all the Fidelity funds.
On an annual basis, FMR presents to the Board Fidelity's profitability for the fund. Fidelity calculates the profitability for each fund, as well as aggregate profitability for groups of Fidelity funds and all Fidelity funds, using a series of detailed revenue and cost allocation methodologies which originate with the books and records of Fidelity on which Fidelity's audited financial statements are based. The Audit Committee of the Board reviews any significant changes from the prior year's methodologies.
PricewaterhouseCoopers LLP (PwC), independent registered public accounting firm and auditor to Fidelity and certain Fidelity funds, has been engaged annually by the Board as part of the Board's assessment of Fidelity's profitability analysis. PwC's engagement includes the review and assessment of Fidelity's methodologies used in determining the revenues and expenses attributable to Fidelity's mutual fund business, and completion of agreed-upon procedures surrounding the mathematical accuracy of fund profitability and its conformity to allocation methodologies. After considering PwC's reports issued under the engagement and information provided by Fidelity, the Board concluded that while other allocation methods may also be reasonable, Fidelity's profitability methodologies are reasonable in all material respects.
Annual Report
Board Approval of Investment Advisory Contracts and
Management Fees - continued
The Board also reviewed Fidelity's non-fund businesses and fall-out benefits related to the mutual fund business as well as cases where Fidelity's affiliates may benefit from or be related to the fund's business.
The Board considered the costs of the services provided by and the profits realized by Fidelity in connection with the operation of the fund and was satisfied that the profitability was not excessive in the circumstances.
Economies of Scale. The Board considered whether there have been economies of scale in respect of the management of the Fidelity funds, whether the Fidelity funds (including the fund) have appropriately benefited from any such economies of scale, and whether there is potential for realization of any further economies of scale. The Board considered the extent to which the fund will benefit from economies of scale through increased services to the fund, through waivers or reimbursements, or through fee or expense reductions. The Board also noted that in 2009, it and the board of other Fidelity funds created an ad hoc committee (the Economies of Scale Committee) to analyze whether FMR attains economies of scale in respect of the management and servicing of the Fidelity funds, whether the Fidelity funds have appropriately benefited from such economies of scale, and whether there is potential for realization of any further economies of scale.
The Board recognized that the fund's management contract incorporates a "group fee" structure, which provides for lower group fee rates as total fund assets under FMR's management increase, and for higher group fee rates as total fund assets under FMR's management decrease. FMR calculates the group fee rates based on a tiered asset "breakpoint" schedule that varies based on asset class. The Board considered that the group fee is designed to deliver the benefits of economies of scale to fund shareholders when total Fidelity fund assets increase, even if assets of any particular fund are unchanged or have declined, because some portion of Fidelity's costs are attributable to services provided to all Fidelity funds, and all funds benefit if those costs can be allocated among more assets. The Board concluded that, given the group fee structure, fund shareholders will benefit from lower management fees as assets under FMR's management increase at the fund complex level, regardless of whether Fidelity achieves any such economies of scale.
Annual Report
The Board concluded, taking into account the analysis of the Economies of Scale Committee, that economies of scale, if any, are being appropriately shared between fund shareholders and Fidelity.
Additional Information Requested by the Board. In order to develop fully the factual basis for consideration of the Fidelity funds' Advisory Contracts, the Board requested and received additional information on certain topics, including (i) fund performance trends, actions to be taken by FMR to improve certain funds' overall performance, and Fidelity's long-term strategies for certain funds; (ii) the potential to further rationalize the Fidelity fund lineup with the possibility of achieving savings for the funds and Fidelity; (iii) Fidelity's compensation structure for portfolio managers and other key investment personnel; (iv) the amount of the investment that each portfolio manager has made in the Fidelity fund(s) that he or she manages; (v) the realization of fall-out benefits in certain Fidelity business units; (vi) Fidelity's group fee structures, the potential impact of regulatory changes on such structures, and the rationale for the individual fee rates of certain funds; (vii) fund profitability methodology, including Fidelity's cost allocation methodology, and the impact of certain factors on fund profitability results; (viii) trends regarding industry use of performance fee structures and the possibility of implementing performance fee structures for additional funds; and (ix) the impact of net redemptions from the Fidelity funds.
Based on its evaluation of all of the conclusions noted above, and after considering all factors it believed relevant, the Board ultimately concluded that the advisory fee structures are fair and reasonable, and that the fund's Advisory Contracts should be renewed.
Annual Report
Investment Adviser
Fidelity Management & Research Company
Boston, MA
Investment Sub-Advisers
FMR Co., Inc.
Fidelity Management & Research
(U.K.) Inc.
Fidelity Management & Research
(Hong Kong) Limited
Fidelity Management & Research
(Japan) Inc.
General Distributor
Fidelity Distributors Corporation
Smithfield, RI
Transfer and Service Agents
Fidelity Investments Institutional
Operations Company, Inc.
Boston, MA
Fidelity Service Company, Inc.
Boston, MA
Custodian
Citibank, N.A.
New York, NY
(Fidelity Investment logo)(registered trademark)
ASCPI-UANN-0912
1.803721.107
(Fidelity Investment logo)(registered trademark)
Fidelity Advisor®
Small Cap Growth
Fund - Class A, Class T,
Class B and Class C
Annual Report
July 31, 2012
(Fidelity Cover Art)
Class A, Class T, Class B,
and Class C are classes
of Fidelity® Small Cap
Growth Fund
Contents
Performance | (Click Here) | How the fund has done over time. |
Management's Discussion of Fund Performance | (Click Here) | The Portfolio Manager's review of fund performance and strategy. |
Shareholder Expense Example | (Click Here) | An example of shareholder expenses. |
Investment Changes | (Click Here) | A summary of major shifts in the fund's investments over the past six months. |
Investments | (Click Here) | A complete list of the fund's investments with their market values. |
Financial Statements | (Click Here) | Statements of assets and liabilities, operations, and changes in net assets, as well as financial highlights. |
Notes | (Click Here) | Notes to the financial statements. |
Report of Independent Registered Public Accounting Firm | (Click Here) | |
Trustees and Officers | (Click Here) | |
Distributions | (Click Here) | |
Board Approval of Investment Advisory Contracts and Management Fees | (Click Here) | |
To view a fund's proxy voting guidelines and proxy voting record for the 12-month period ended June 30, visit http://www.fidelity.com/proxyvotingresults or visit the Securities and Exchange Commission's (SEC) web site at http://www.sec.gov. You may also call 1-877-208-0098 to request a free copy of the proxy voting guidelines.
Standard & Poor's, S&P and S&P 500 are registered service marks of The McGraw-Hill Companies, Inc. and have been licensed for use by Fidelity Distributors Corporation.
Other third party marks appearing herein are the property of their respective owners.
All other marks appearing herein are registered or unregistered trademarks or service marks of FMR LLC or an affiliated company. © 2012 FMR LLC. All rights reserved.
Annual Report
This report and the financial statements contained herein are submitted for the general information of the shareholders of the fund. This report is not authorized for distribution to prospective investors in the fund unless preceded or accompanied by an effective prospectus.
A fund files its complete schedule of portfolio holdings with the SEC for the first and third quarters of each fiscal year on Form N-Q. Forms N-Q are available on the SEC's web site at http://www.sec.gov. A fund's Forms N-Q may be reviewed and copied at the SEC's Public Reference Room in Washington, DC. Information regarding the operation of the SEC's Public Reference Room may be obtained by calling 1-800-SEC-0330. For a complete list of a fund's portfolio holdings, view the most recent holdings listing, semiannual report, or annual report on Fidelity's web site at http://www.fidelity.com, http://www.advisor.fidelity.com, or http://www.401k.com, as applicable.
NOT FDIC INSURED • MAY LOSE VALUE • NO BANK GUARANTEE
Neither the fund nor Fidelity Distributors Corporation is a bank.
Annual Report
Average annual total return reflects the change in the value of an investment, assuming reinvestment of the class' distributions from dividend income and capital gains (the profits earned upon the sale of securities that have grown in value, if any) and assuming a constant rate of performance each year. The $10,000 table and the fund's returns do not reflect the deduction of taxes that a shareholder would pay on fund distributions or the redemption of fund shares. During periods of reimbursement by Fidelity, a fund's total return will be greater than it would be had the reimbursement not occurred. How a fund did yesterday is no guarantee of how it will do tomorrow.
Average Annual Total Returns
Periods ended July 31, 2012 | Past 1
year | Past 5
years | Life of
fundA |
Class A (incl. 5.75% sales charge) | -6.83% | 0.35% | 6.81% |
Class T (incl. 3.50% sales charge) | -4.86% | 0.56% | 6.87% |
Class B (incl. contingent deferred sales charge) B | -6.74% | 0.40% | 6.89% |
Class C (incl. contingent deferred sales charge) C | -2.92% | 0.77% | 6.82% |
A From November 3, 2004.
B Class B shares' contingent deferred sales charges included in the past one year, past five years, and life of fund total return figures are 5%, 2%, and 0%, respectively.
C Class C shares' contingent deferred sales charges included in the past one year, past five years, and life of fund total return figures are 1%, 0%, and 0%, respectively.
Annual Report
$10,000 Over Life of Fund
Let's say hypothetically that $10,000 was invested in Fidelity Advisor® Small Cap Growth Fund - Class A on November 3, 2004, when the fund started, and the current 5.75% sales charge was paid. The chart shows how the value of your investment would have changed, and also shows how the Russell 2000® Growth Index performed over the same period.
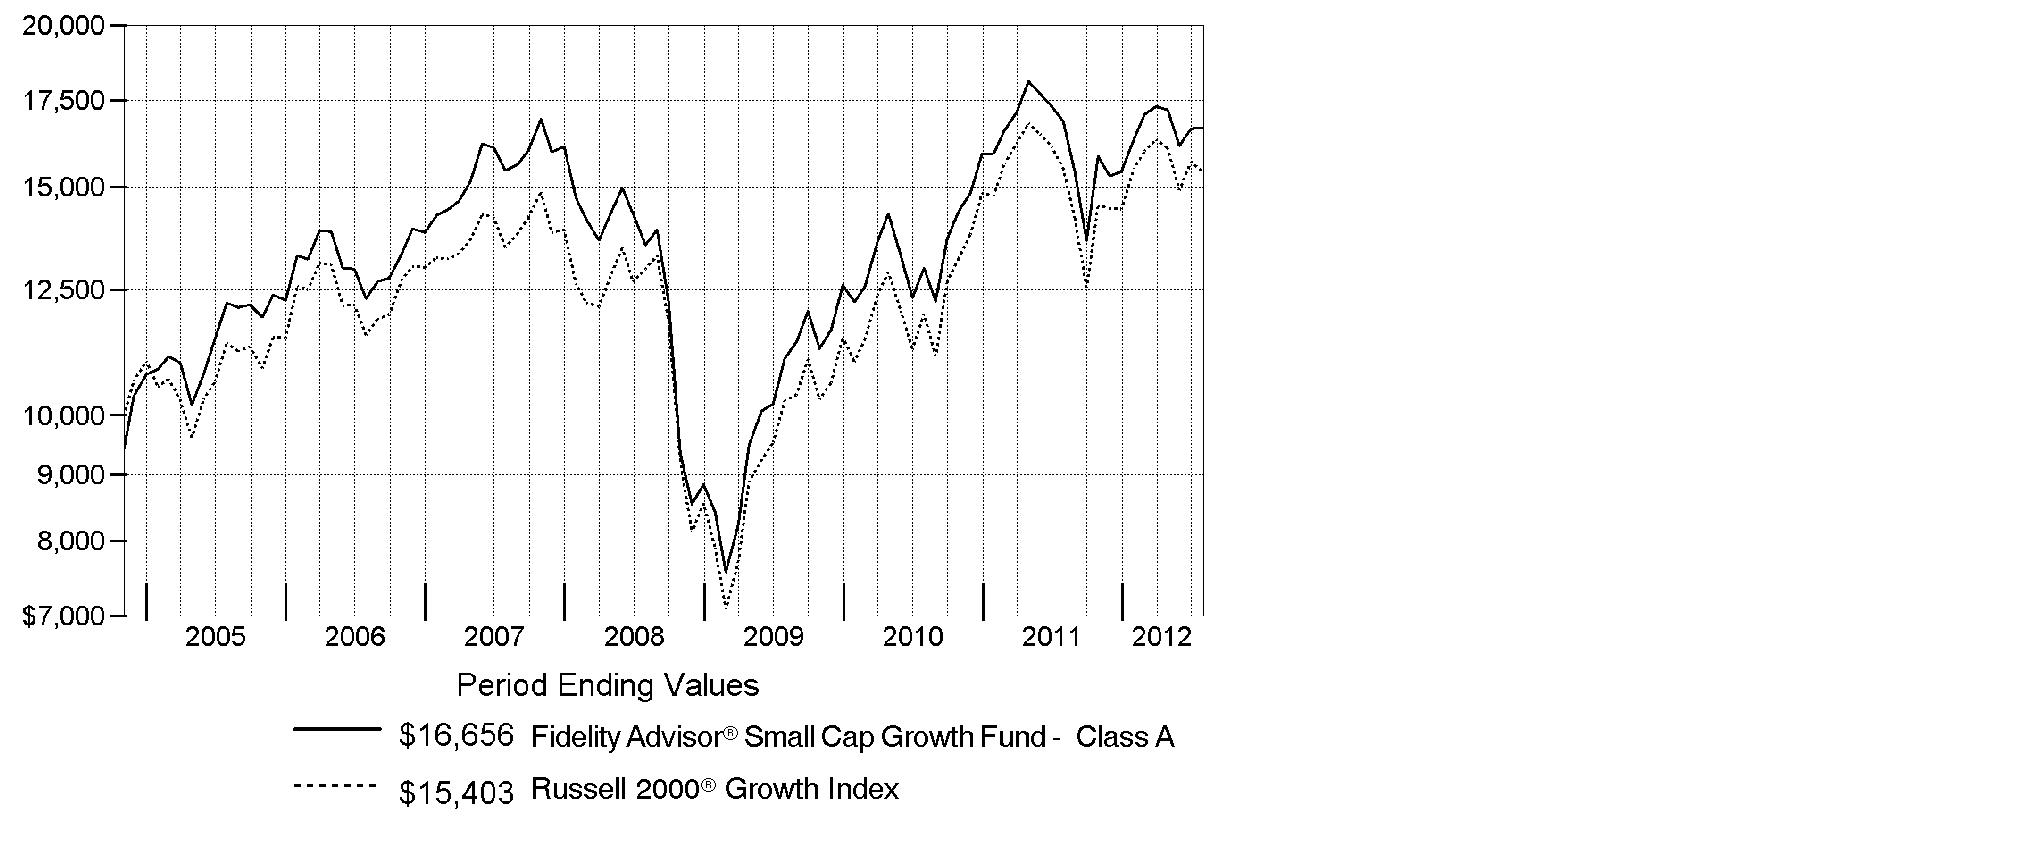
Annual Report
Market Recap: Major U.S. equity benchmarks posted solid gains for the year ending July 31, 2012, amid an uncertain investment environment. The broad-based S&P 500® Index returned 9.13%, while the blue-chip-laden Dow Jones Industrial AverageSM and technology-heavy Nasdaq Composite® Index gained 10.12% and 7.83%, respectively. Volatility spiked during the period's first half, as equities plummeted late last summer on Europe's debt woes, political wrangling over the U.S. debt ceiling and the sovereign credit-rating downgrade that followed. By October, a seemingly improved U.S. economy rejuvenated stocks, paving the way for major equity benchmarks to post their best first-quarter performance since 1998. However, more eurozone trouble, signs that the U.S. economy had turned sluggish and a slowdown in China caused stocks to slip in May, before a new wave of optimism took hold in June and July. Within the S&P 500®, more-defensive sectors such as telecommunication services (+30%) and consumer staples (+20%) fared best, while materials and energy significantly underperformed, returning -5%. Small- and mid-cap stocks trailed their less-volatile large-cap counterparts, with the Russell 2000® Index adding 0.19% and the Russell Midcap® Index rising 2.28%. Given turmoil and local currency weakness in Europe, foreign developed-markets stocks lost ground, with the MSCI® EAFE® Index returning -11.32%.
Comments from Patrick Venanzi, who became Portfolio Manager of Fidelity Advisor® Small Cap Growth Fund on November 17, 2011: For the year, the fund's Class A, Class T, Class B and Class C shares returned -1.14%, -1.41%, -1.96% and -1.96%, respectively (excluding sales charges), lagging the Russell 2000® Growth Index, which returned -0.51%. Poor positioning in health care was the main reason for the underperformance, with picks and an underweighting in the pharmaceuticals/biotechnology/life science industry particularly challenging. My choices within the software/services, health care equipment/services and automobiles/components industries also were letdowns. Our foreign holdings hurt overall, due in part to a stronger U.S. dollar. Individually, the biggest blow came from Polycom, a video and voice conferencing company, while Sohu.com, China's largest Internet company, and untimely ownership of medical device company Integra LifeSciences Holdings also hurt. Polycom, Sohu.com and Integra were not held at period end. Conversely, picks within industrials, tech hardware/equipment and materials were additive. At the stock level, specialty retailer Sally Beauty Holdings and Canadian discount store operator Dollarama were winners, as was a position in biopharmaceutical firm Amylin Pharmaceuticals. All of the names mentioned, except Integra, were not in the benchmark.
The views expressed above reflect those of the portfolio manager(s) only through the end of the period as stated on the cover of this report and do not necessarily represent the views of Fidelity or any other person in the Fidelity organization. Any such views are subject to change at any time based upon market or other conditions and Fidelity disclaims any responsibility to update such views. These views may not be relied on as investment advice and, because investment decisions for a Fidelity fund are based on numerous factors, may not be relied on as an indication of trading intent on behalf of any Fidelity fund.
Annual Report
Shareholder Expense Example
As a shareholder of the Fund, you incur two types of costs: (1) transaction costs, including sales charges (loads) on purchase payments or redemption proceeds, redemption fees and (2) ongoing costs, including management fees, distribution and/or service (12b-1) fees and other Fund expenses. This Example is intended to help you understand your ongoing costs (in dollars) of investing in the Fund and to compare these costs with the ongoing costs of investing in other mutual funds.
The Example is based on an investment of $1,000 invested at the beginning of the period and held for the entire period (February 1, 2012 to July 31, 2012).
Actual Expenses
The first line of the accompanying table for each class of the Fund provides information about actual account values and actual expenses. You may use the information in this line, together with the amount you invested, to estimate the expenses that you paid over the period. Simply divide your account value by $1,000.00 (for example, an $8,600 account value divided by $1,000.00 = 8.6), then multiply the result by the number in the first line for a class of the Fund under the heading entitled "Expenses Paid During Period" to estimate the expenses you paid on your account during this period. A small balance maintenance fee of $12.00 that is charged once a year may apply for certain accounts with a value of less than $2,000. This fee is not included in the table below. If it was, the estimate of expenses you paid during the period would be higher, and your ending account value lower, by this amount. In addition, the Fund, as a shareholder in the underlying Fidelity Central Funds, will indirectly bear its pro-rata share of the fees and expenses incurred by the underlying Fidelity Central Funds. These fees and expenses are not included in the Fund's annualized expense ratio used to calculate the expense estimate in the table below.
Hypothetical Example for Comparison Purposes
The second line of the accompanying table for each class of the Fund provides information about hypothetical account values and hypothetical expenses based on a Class' actual expense ratio and an assumed rate of return of 5% per year before expenses, which is not the Class' actual return. The hypothetical account values and expenses may not be used to estimate the actual ending account balance or expenses you paid for the period. You may use this information to compare the ongoing costs of investing in the Fund and other funds. To do so, compare this 5% hypothetical example with the 5% hypothetical examples that appear in the shareholder reports of the other funds. A small balance maintenance fee of $12.00 that is charged once a year may apply for certain accounts with a value of less than $2,000. This fee is not included in the table below. If it was, the estimate of expenses you paid during the period would be higher, and your ending account value lower, by this amount. In addition, the Fund, as a shareholder in the underlying Fidelity Central Funds, will indirectly bear its pro-rata share of the fees and expenses incurred by the underlying Fidelity Central Funds. These fees and expenses are not included in the Fund's annualized expense ratio used to calculate the expense estimate in the table below.
Please note that the expenses shown in the table are meant to highlight your ongoing costs only and do not reflect any transaction costs. Therefore, the second line of the table is useful in comparing ongoing costs only, and will not help you determine the relative total costs of owning different funds. In addition, if these transactional costs were included, your costs would have been higher.
Annual Report
| Annualized
Expense Ratio | Beginning
Account Value
February 1, 2012 | Ending
Account Value
July 31, 2012 | Expenses Paid
During Period*
February 1, 2012
to July 31, 2012 |
Class A | 1.31% | | | |
Actual | | $ 1,000.00 | $ 1,021.20 | $ 6.58 |
Hypothetical A | | $ 1,000.00 | $ 1,018.35 | $ 6.57 |
Class T | 1.57% | | | |
Actual | | $ 1,000.00 | $ 1,019.50 | $ 7.88 |
Hypothetical A | | $ 1,000.00 | $ 1,017.06 | $ 7.87 |
Class B | 2.06% | | | |
Actual | | $ 1,000.00 | $ 1,016.70 | $ 10.33 |
Hypothetical A | | $ 1,000.00 | $ 1,014.62 | $ 10.32 |
Class C | 2.07% | | | |
Actual | | $ 1,000.00 | $ 1,016.80 | $ 10.38 |
Hypothetical A | | $ 1,000.00 | $ 1,014.57 | $ 10.37 |
Small Cap Growth | .98% | | | |
Actual | | $ 1,000.00 | $ 1,022.20 | $ 4.93 |
Hypothetical A | | $ 1,000.00 | $ 1,019.99 | $ 4.92 |
Class F | .77% | | | |
Actual | | $ 1,000.00 | $ 1,023.30 | $ 3.87 |
Hypothetical A | | $ 1,000.00 | $ 1,021.03 | $ 3.87 |
Institutional Class | 1.00% | | | |
Actual | | $ 1,000.00 | $ 1,022.80 | $ 5.03 |
Hypothetical A | | $ 1,000.00 | $ 1,019.89 | $ 5.02 |
A 5% return per year before expenses
* Expenses are equal to each Class' annualized expense ratio, multiplied by the average account value over the period, multiplied by 182/366 (to reflect the one-half year period).
Annual Report
Investment Changes (Unaudited)
Top Ten Stocks as of July 31, 2012 |
| % of fund's
net assets | % of fund's net assets
6 months ago |
Vitamin Shoppe, Inc. | 1.5 | 0.9 |
Life Time Fitness, Inc. | 1.4 | 0.7 |
Hibbett Sports, Inc. | 1.4 | 0.8 |
Align Technology, Inc. | 1.4 | 0.0 |
Susser Holdings Corp. | 1.3 | 0.0 |
Ascena Retail Group, Inc. | 1.3 | 1.1 |
Liquidity Services, Inc. | 1.3 | 0.0 |
HMS Holdings Corp. | 1.3 | 0.9 |
Aspen Technology, Inc. | 1.3 | 0.7 |
Sally Beauty Holdings, Inc. | 1.2 | 1.2 |
| 13.4 | |
Top Five Market Sectors as of July 31, 2012 |
| % of fund's
net assets | % of fund's net assets
6 months ago |
Health Care | 21.2 | 14.2 |
Information Technology | 20.6 | 24.4 |
Consumer Discretionary | 17.5 | 16.5 |
Industrials | 14.6 | 17.8 |
Financials | 9.6 | 6.8 |
Asset Allocation (% of fund's net assets) |
As of July 31, 2012* | As of January 31, 2012** |
 | Stocks 96.9% | | | Stocks and Equity
Futures 98.4% | |
 | Short-Term
Investments and
Net Other Assets (Liabilities) 3.1% | | | Short-Term
Investments and
Net Other Assets (Liabilities) 1.6% | |
* Foreign investments | 9.1% | | ** Foreign investments | 12.4% | |

Annual Report
Investments July 31, 2012
Showing Percentage of Net Assets
Common Stocks - 96.9% |
| Shares | | Value |
CONSUMER DISCRETIONARY - 17.5% |
Auto Components - 0.6% |
Tenneco, Inc. (a) | 394,600 | | $ 11,557,834 |
Hotels, Restaurants & Leisure - 4.9% |
AFC Enterprises, Inc. (a) | 600,000 | | 13,254,000 |
Chuys Holdings, Inc. | 17,700 | | 308,157 |
Cracker Barrel Old Country Store, Inc. | 278,800 | | 17,469,608 |
Interval Leisure Group, Inc. | 1,120,000 | | 20,540,800 |
Life Time Fitness, Inc. (a) | 577,600 | | 26,228,816 |
Texas Roadhouse, Inc. Class A | 701,900 | | 12,149,889 |
| | 89,951,270 |
Household Durables - 1.9% |
Jarden Corp. | 290,000 | | 13,108,000 |
Lennar Corp. Class A | 303,800 | | 8,873,998 |
Toll Brothers, Inc. (a) | 461,300 | | 13,456,121 |
| | 35,438,119 |
Multiline Retail - 1.0% |
Dollarama, Inc. | 214,900 | | 13,393,080 |
The Bon-Ton Stores, Inc. | 700,000 | | 4,620,000 |
| | 18,013,080 |
Specialty Retail - 6.6% |
Ascena Retail Group, Inc. (a) | 1,334,800 | | 24,480,232 |
Conn's, Inc. (a) | 170,916 | | 3,050,851 |
DSW, Inc. Class A | 326,300 | | 19,290,856 |
Hibbett Sports, Inc. (a) | 430,000 | | 26,131,100 |
Sally Beauty Holdings, Inc. (a) | 801,000 | | 21,162,420 |
Vitamin Shoppe, Inc. (a) | 492,300 | | 27,037,116 |
| | 121,152,575 |
Textiles, Apparel & Luxury Goods - 2.5% |
Hanesbrands, Inc. (a) | 450,000 | | 13,509,000 |
PVH Corp. | 139,459 | | 11,077,228 |
Steven Madden Ltd. (a) | 331,400 | | 13,398,502 |
Ted Baker PLC | 591,073 | | 8,196,784 |
| | 46,181,514 |
TOTAL CONSUMER DISCRETIONARY | | 322,294,392 |
CONSUMER STAPLES - 5.8% |
Food & Staples Retailing - 1.3% |
Susser Holdings Corp. (a) | 678,155 | | 24,488,177 |
Common Stocks - continued |
| Shares | | Value |
CONSUMER STAPLES - continued |
Food Products - 3.0% |
Calavo Growers, Inc. (d) | 495,299 | | $ 13,363,167 |
Hain Celestial Group, Inc. (a) | 295,000 | | 16,428,550 |
J&J Snack Foods Corp. | 250,000 | | 14,447,500 |
Post Holdings, Inc. (a) | 400,000 | | 11,840,000 |
| | 56,079,217 |
Household Products - 0.9% |
WD-40 Co. | 322,566 | | 15,499,296 |
Personal Products - 0.6% |
Elizabeth Arden, Inc. (a) | 275,000 | | 10,727,750 |
TOTAL CONSUMER STAPLES | | 106,794,440 |
ENERGY - 4.5% |
Energy Equipment & Services - 2.2% |
Essential Energy Services Ltd. | 5,166,700 | | 10,973,796 |
Tesco Corp. (a) | 750,000 | | 8,692,500 |
Western Energy Services Corp. (a) | 1,530,000 | | 10,740,589 |
Xtreme Drilling & Coil Services Corp. (a)(e) | 4,100,000 | | 6,786,658 |
Zedi, Inc. (a)(e) | 5,020,900 | | 3,905,172 |
| | 41,098,715 |
Oil, Gas & Consumable Fuels - 2.3% |
Cabot Oil & Gas Corp. | 250,000 | | 10,547,500 |
Delek US Holdings, Inc. | 81,100 | | 1,600,914 |
Stone Energy Corp. (a) | 516,300 | | 13,558,038 |
Targa Resources Corp. | 379,300 | | 16,708,165 |
| | 42,414,617 |
TOTAL ENERGY | | 83,513,332 |
FINANCIALS - 9.6% |
Commercial Banks - 3.1% |
Banco Pine SA | 1,658,287 | | 10,868,043 |
BBCN Bancorp, Inc. (a) | 1,640,000 | | 18,597,600 |
Columbia Banking Systems, Inc. | 579,043 | | 10,451,726 |
Texas Capital Bancshares, Inc. (a) | 400,000 | | 17,236,000 |
| | 57,153,369 |
Insurance - 2.4% |
Allied World Assurance Co. Holdings Ltd. | 194,800 | | 14,693,764 |
Common Stocks - continued |
| Shares | | Value |
FINANCIALS - continued |
Insurance - continued |
Amerisafe, Inc. (a) | 464,900 | | $ 11,606,229 |
ProAssurance Corp. | 210,000 | | 18,809,700 |
| | 45,109,693 |
Real Estate Investment Trusts - 3.3% |
Highwoods Properties, Inc. (SBI) | 419,000 | | 14,191,530 |
LTC Properties, Inc. | 430,000 | | 15,351,000 |
Rayonier, Inc. | 285,000 | | 13,591,650 |
Sovran Self Storage, Inc. | 300,000 | | 17,130,000 |
| | 60,264,180 |
Real Estate Management & Development - 0.8% |
Altisource Portfolio Solutions SA (a) | 185,000 | | 14,348,600 |
TOTAL FINANCIALS | | 176,875,842 |
HEALTH CARE - 21.2% |
Biotechnology - 6.8% |
Alkermes PLC (a) | 175,500 | | 3,262,545 |
Amarin Corp. PLC ADR (a)(d) | 900,000 | | 10,539,000 |
Amylin Pharmaceuticals, Inc. (a) | 556,700 | | 17,140,793 |
ARIAD Pharmaceuticals, Inc. (a) | 400,000 | | 7,652,000 |
ArQule, Inc. (a) | 900,000 | | 5,445,000 |
BioMarin Pharmaceutical, Inc. (a) | 190,000 | | 7,465,100 |
Infinity Pharmaceuticals, Inc. (a) | 205,536 | | 3,588,659 |
Isis Pharmaceuticals, Inc. (a) | 437,257 | | 5,299,555 |
Medivation, Inc. (a) | 140,000 | | 13,958,000 |
OncoGenex Pharmaceuticals, Inc. (a)(d) | 570,000 | | 7,957,200 |
Pharmacyclics, Inc. (a)(d) | 150,000 | | 7,981,500 |
Seattle Genetics, Inc. (a) | 330,000 | | 8,632,800 |
Targacept, Inc. (a) | 500,000 | | 2,160,000 |
Theravance, Inc. (a)(d) | 379,000 | | 11,040,270 |
Threshold Pharmaceuticals, Inc. (a) | 880,000 | | 6,107,200 |
XOMA Corp. (a)(d) | 2,200,000 | | 7,986,000 |
| | 126,215,622 |
Health Care Equipment & Supplies - 5.8% |
Abiomed, Inc. (a)(d) | 600,000 | | 13,530,000 |
Align Technology, Inc. (a) | 764,398 | | 25,958,956 |
Cyberonics, Inc. (a) | 322,000 | | 13,942,600 |
ICU Medical, Inc. (a) | 380,000 | | 20,265,400 |
Sirona Dental Systems, Inc. (a) | 195,000 | | 8,429,850 |
Common Stocks - continued |
| Shares | | Value |
HEALTH CARE - continued |
Health Care Equipment & Supplies - continued |
The Cooper Companies, Inc. | 151,900 | | $ 11,431,994 |
The Spectranetics Corp. (a) | 1,130,000 | | 13,334,000 |
| | 106,892,800 |
Health Care Providers & Services - 5.5% |
Air Methods Corp. (a) | 151,000 | | 16,463,530 |
Catamaran Corp. (a) | 100,807 | | 8,562,338 |
Centene Corp. (a) | 330,000 | | 12,553,200 |
Corvel Corp. (a) | 202,592 | | 9,347,595 |
Health Net, Inc. (a) | 302,482 | | 6,660,654 |
HMS Holdings Corp. (a) | 683,500 | | 23,519,235 |
MEDNAX, Inc. (a) | 172,900 | | 11,433,877 |
MWI Veterinary Supply, Inc. (a) | 148,400 | | 13,517,756 |
| | 102,058,185 |
Health Care Technology - 0.9% |
athenahealth, Inc. (a)(d) | 120,000 | | 10,980,000 |
Epocrates, Inc. (a) | 672,706 | | 5,072,203 |
| | 16,052,203 |
Life Sciences Tools & Services - 0.8% |
Furiex Pharmaceuticals, Inc. (a) | 200,000 | | 3,844,000 |
Luminex Corp. (a) | 620,000 | | 10,620,600 |
| | 14,464,600 |
Pharmaceuticals - 1.4% |
Cadence Pharmaceuticals, Inc. (a) | 767,693 | | 3,255,018 |
Impax Laboratories, Inc. (a) | 640,200 | | 14,225,244 |
ViroPharma, Inc. (a) | 410,000 | | 8,901,100 |
| | 26,381,362 |
TOTAL HEALTH CARE | | 392,064,772 |
INDUSTRIALS - 14.6% |
Aerospace & Defense - 1.7% |
Teledyne Technologies, Inc. (a) | 235,700 | | 14,684,110 |
TransDigm Group, Inc. (a) | 138,183 | | 17,046,255 |
| | 31,730,365 |
Building Products - 0.9% |
Armstrong World Industries, Inc. | 260,000 | | 10,049,000 |
US Home Systems, Inc. (e) | 725,000 | | 6,604,750 |
| | 16,653,750 |
Common Stocks - continued |
| Shares | | Value |
INDUSTRIALS - continued |
Electrical Equipment - 2.1% |
Generac Holdings, Inc. | 450,000 | | $ 10,269,000 |
Hubbell, Inc. Class B | 161,800 | | 13,312,904 |
II-VI, Inc. (a) | 815,000 | | 14,213,600 |
| | 37,795,504 |
Industrial Conglomerates - 0.8% |
Carlisle Companies, Inc. | 290,000 | | 14,642,100 |
Machinery - 2.9% |
Actuant Corp. Class A | 383,100 | | 10,903,026 |
Blount International, Inc. (a) | 774,000 | | 11,006,280 |
TriMas Corp. (a) | 335,298 | | 7,289,379 |
Valmont Industries, Inc. | 75,000 | | 9,291,000 |
Wabtec Corp. | 197,300 | | 15,622,214 |
| | 54,111,899 |
Marine - 0.6% |
Kirby Corp. (a) | 200,000 | | 10,554,000 |
Professional Services - 3.0% |
Advisory Board Co. (a) | 421,005 | | 18,941,015 |
MISTRAS Group, Inc. (a) | 315,721 | | 7,097,408 |
Nielsen Holdings B.V. (a) | 650,000 | | 18,525,000 |
Nihon M&A Center, Inc. | 385,512 | | 11,389,587 |
| | 55,953,010 |
Road & Rail - 0.6% |
Genesee & Wyoming, Inc. Class A (a) | 180,000 | | 11,170,800 |
Trading Companies & Distributors - 2.0% |
DXP Enterprises, Inc. (a) | 214,719 | | 9,490,580 |
Watsco, Inc. | 289,000 | | 19,634,660 |
WESCO International, Inc. (a) | 145,000 | | 8,077,950 |
| | 37,203,190 |
TOTAL INDUSTRIALS | | 269,814,618 |
INFORMATION TECHNOLOGY - 20.6% |
Communications Equipment - 0.9% |
Parrot SA (a) | 368,100 | | 11,209,528 |
Telular Corp. | 500,000 | | 4,715,000 |
| | 15,924,528 |
Computers & Peripherals - 0.7% |
Super Micro Computer, Inc. (a) | 979,923 | | 12,160,844 |
Common Stocks - continued |
| Shares | | Value |
INFORMATION TECHNOLOGY - continued |
Electronic Equipment & Components - 2.1% |
Insight Enterprises, Inc. (a) | 377,400 | | $ 6,325,224 |
InvenSense, Inc. | 137,076 | | 1,768,280 |
Neonode, Inc. (a)(d) | 1,380,000 | | 6,969,000 |
OSI Systems, Inc. (a) | 164,000 | | 10,584,560 |
Parametric Sound Corp. (a) | 249,068 | | 2,428,413 |
Zygo Corp. (a) | 619,600 | | 11,078,448 |
| | 39,153,925 |
Internet Software & Services - 7.4% |
Active Network, Inc. (a) | 870,000 | | 12,345,300 |
Bankrate, Inc. (a)(d) | 600,000 | | 9,570,000 |
Blucora, Inc. (a) | 1,111,100 | | 16,944,275 |
Cornerstone OnDemand, Inc. (a) | 674,037 | | 16,028,600 |
Demand Media, Inc. (a)(d) | 1,743,000 | | 19,382,160 |
Liquidity Services, Inc. (a) | 523,400 | | 23,929,848 |
LivePerson, Inc. (a) | 963,426 | | 18,016,066 |
QuinStreet, Inc. (a)(d) | 1,350,000 | | 12,244,500 |
VeriSign, Inc. (a) | 200,000 | | 8,884,000 |
| | 137,344,749 |
IT Services - 2.2% |
Euronet Worldwide, Inc. (a) | 500,000 | | 9,140,000 |
Maximus, Inc. | 320,000 | | 16,160,000 |
ServiceSource International, Inc. (a) | 336,399 | | 3,794,581 |
Total System Services, Inc. | 500,000 | | 11,825,000 |
| | 40,919,581 |
Semiconductors & Semiconductor Equipment - 1.3% |
Cymer, Inc. (a) | 278,201 | | 15,915,879 |
Entegris, Inc. (a) | 1,056,500 | | 8,504,825 |
| | 24,420,704 |
Software - 6.0% |
Aspen Technology, Inc. (a) | 992,200 | | 23,197,636 |
BroadSoft, Inc. (a)(d) | 456,600 | | 11,209,530 |
CommVault Systems, Inc. (a) | 360,000 | | 17,467,200 |
Deltek, Inc. (a) | 1,030,000 | | 13,410,600 |
Ebix, Inc. (d) | 575,610 | | 12,484,981 |
MICROS Systems, Inc. (a) | 260,312 | | 12,427,295 |
Parametric Technology Corp. (a) | 980,000 | | 21,109,200 |
| | 111,306,442 |
TOTAL INFORMATION TECHNOLOGY | | 381,230,773 |
Common Stocks - continued |
| Shares | | Value |
MATERIALS - 2.4% |
Chemicals - 0.6% |
Albemarle Corp. | 200,300 | | $ 11,661,466 |
Containers & Packaging - 0.8% |
Myers Industries, Inc. | 850,000 | | 13,974,000 |
Metals & Mining - 1.0% |
Commercial Metals Co. | 809,800 | | 10,438,322 |
Compass Minerals International, Inc. | 120,000 | | 8,680,800 |
| | 19,119,122 |
TOTAL MATERIALS | | 44,754,588 |
UTILITIES - 0.7% |
Electric Utilities - 0.7% |
Cleco Corp. | 280,000 | | 12,252,800 |
TOTAL COMMON STOCKS (Cost $1,609,099,061) |
1,789,595,557
|
Money Market Funds - 6.6% |
| | | |
Fidelity Cash Central Fund, 0.17% (b) | 50,560,836 | | 50,560,836 |
Fidelity Securities Lending Cash Central Fund, 0.18% (b)(c) | 71,793,425 | | 71,793,425 |
TOTAL MONEY MARKET FUNDS (Cost $122,354,261) |
122,354,261
|
TOTAL INVESTMENT PORTFOLIO - 103.5% (Cost $1,731,453,322) | | 1,911,949,818 |
NET OTHER ASSETS (LIABILITIES) - (3.5)% | | (64,777,614) |
NET ASSETS - 100% | $ 1,847,172,204 |
Legend |
(a) Non-income producing |
(b) Affiliated fund that is available only to investment companies and other accounts managed by Fidelity Investments. The rate quoted is the annualized seven-day yield of the fund at period end. A complete unaudited listing of the fund's holdings as of its most recent quarter end is available upon request. In addition, each Fidelity Central Fund's financial statements, which are not covered by the Fund's Report of Independent Registered Public Accounting Firm, are available on the SEC's website or upon request. |
(c) Investment made with cash collateral received from securities on loan. |
(d) Security or a portion of the security is on loan at period end. |
(e) Affiliated company |
Affiliated Central Funds |
Information regarding fiscal year to date income earned by the Fund from investments in Fidelity Central Funds is as follows: |
Fund | Income earned |
Fidelity Cash Central Fund | $ 79,275 |
Fidelity Securities Lending Cash Central Fund | 3,071,956 |
Total | $ 3,151,231 |
Other Affiliated Issuers |
An affiliated company is a company in which the Fund has ownership of at least 5% of the voting securities. Fiscal year to date transactions with companies which are or were affiliates are as follows: |
Affiliate | Value, beginning of period | Purchases | Sales Proceeds | Dividend Income | Value,
end of
period |
Calavo Growers, Inc. | $ 16,826,331 | $ 13,436,045 | $ 19,540,642 | $ 307,289 | $ - |
Perficient, Inc. | 17,202,205 | 4,361,057 | 22,322,908 | - | - |
US Home Systems, Inc. | - | 8,770,904 | - | 43,500 | 6,604,750 |
Xtreme Drilling & Coil Services Corp. (formerly Xtreme Coil Drilling Corp.) | - | 12,099,252 | - | - | 6,786,658 |
Zedi, Inc. | - | 3,695,906 | - | - | 3,905,172 |
Total | $ 34,028,536 | $ 42,363,164 | $ 41,863,550 | $ 350,789 | $ 17,296,580 |
Other Information |
The following is a summary of the inputs used, as of July 31, 2012, involving the Fund's assets and liabilities carried at fair value. The inputs or methodology used for valuing securities may not be an indication of the risk associated with investing in those securities. For more information on valuation inputs, and their aggregation into the levels used in the table below, please refer to the Security Valuation section in the accompanying Notes to Financial Statements. |
Valuation Inputs at Reporting Date: |
Description | Total | Level 1 | Level 2 | Level 3 |
Investments in Securities: | | | | |
Equities: | | | | |
Consumer Discretionary | $ 322,294,392 | $ 322,294,392 | $ - | $ - |
Consumer Staples | 106,794,440 | 106,794,440 | - | - |
Energy | 83,513,332 | 83,513,332 | - | - |
Financials | 176,875,842 | 176,875,842 | - | - |
Health Care | 392,064,772 | 392,064,772 | - | - |
Industrials | 269,814,618 | 258,425,031 | 11,389,587 | - |
Information Technology | 381,230,773 | 381,230,773 | - | - |
Materials | 44,754,588 | 44,754,588 | - | - |
Utilities | 12,252,800 | 12,252,800 | - | - |
Money Market Funds | 122,354,261 | 122,354,261 | - | - |
Total Investments in Securities: | $ 1,911,949,818 | $ 1,900,560,231 | $ 11,389,587 | $ - |
See accompanying notes which are an integral part of the financial statements.
Annual Report
Statement of Assets and Liabilities
| July 31, 2012 |
| | |
Assets | | |
Investment in securities, at value (including securities loaned of $69,355,870) - See accompanying schedule: Unaffiliated issuers (cost $1,584,533,000) | $ 1,772,298,977 | |
Fidelity Central Funds (cost $122,354,261) | 122,354,261 | |
Other affiliated issuers (cost $24,566,061) | 17,296,580 | |
Total Investments (cost $1,731,453,322) | | $ 1,911,949,818 |
Cash | | 465,902 |
Receivable for investments sold | | 36,822,778 |
Receivable for fund shares sold | | 1,053,361 |
Dividends receivable | | 442,749 |
Distributions receivable from Fidelity Central Funds | | 49,171 |
Other receivables | | 85,041 |
Total assets | | 1,950,868,820 |
| | |
Liabilities | | |
Payable for investments purchased | $ 29,150,268 | |
Payable for fund shares redeemed | 1,206,971 | |
Accrued management fee | 1,131,791 | |
Distribution and service plan fees payable | 47,878 | |
Other affiliated payables | 299,993 | |
Other payables and accrued expenses | 66,290 | |
Collateral on securities loaned, at value | 71,793,425 | |
Total liabilities | | 103,696,616 |
| | |
Net Assets | | $ 1,847,172,204 |
Net Assets consist of: | | |
Paid in capital | | $ 1,604,527,390 |
Accumulated net investment loss | | (1,442,758) |
Accumulated undistributed net realized gain (loss) on investments and foreign currency transactions | | 63,602,071 |
Net unrealized appreciation (depreciation) on investments and assets and liabilities in foreign currencies | | 180,485,501 |
Net Assets | | $ 1,847,172,204 |
See accompanying notes which are an integral part of the financial statements.
Annual Report
Financial Statements - continued
Statement of Assets and Liabilities - continued
| July 31, 2012 |
| | |
Calculation of Maximum Offering Price Class A:
Net Asset Value and redemption price per share ($59,684,141 ÷ 3,761,625 shares) | | $ 15.87 |
| | |
Maximum offering price per share (100/94.25 of $15.87) | | $ 16.84 |
Class T:
Net Asset Value and redemption price per share ($27,657,540 ÷ 1,764,218 shares) | | $ 15.68 |
| | |
Maximum offering price per share (100/96.50 of $15.68) | | $ 16.25 |
Class B:
Net Asset Value and offering price per share ($4,123,211 ÷ 271,428 shares)A | | $ 15.19 |
| | |
Class C:
Net Asset Value and offering price per share ($24,682,877 ÷ 1,627,852 shares)A | | $ 15.16 |
| | |
Small Cap Growth:
Net Asset Value, offering price and redemption price per share ($1,166,101,377 ÷ 72,239,706 shares) | | $ 16.14 |
| | |
Class F:
Net Asset Value, offering price and redemption price per share ($528,229,315 ÷ 32,483,605 shares) | | $ 16.26 |
| | |
Institutional Class:
Net Asset Value, offering price and redemption price per share ($36,693,743 ÷ 2,269,537 shares) | | $ 16.17 |
A Redemption price per share is equal to net asset value less any applicable contingent deferred sales charge.
See accompanying notes which are an integral part of the financial statements.
Annual Report
Statement of Operations
| Year ended July 31, 2012 |
| | |
Investment Income | | |
Dividends (including $350,789 earned from other affiliated issuers) | | $ 10,164,089 |
Special dividends | | 1,530,000 |
Interest | | 2,005 |
Income from Fidelity Central Funds (including $3,071,956 from security lending) | | 3,151,231 |
Total income | | 14,847,325 |
| | |
Expenses | | |
Management fee
Basic fee | $ 12,271,775 | |
Performance adjustment | 827,912 | |
Transfer agent fees | 3,165,497 | |
Distribution and service plan fees | 563,361 | |
Accounting and security lending fees | 550,873 | |
Custodian fees and expenses | 30,254 | |
Independent trustees' compensation | 11,394 | |
Registration fees | 99,536 | |
Audit | 58,667 | |
Legal | 5,590 | |
Miscellaneous | 18,436 | |
Total expenses before reductions | 17,603,295 | |
Expense reductions | (174,685) | 17,428,610 |
Net investment income (loss) | | (2,581,285) |
Realized and Unrealized Gain (Loss) Net realized gain (loss) on: | | |
Investment securities: | | |
Unaffiliated issuers | 77,468,956 | |
Other affiliated issuers | 1,136,369 | |
Foreign currency transactions | (232,876) | |
Futures contracts | 5,787,075 | |
Total net realized gain (loss) | | 84,159,524 |
Change in net unrealized appreciation (depreciation) on: Investment securities | (104,787,928) | |
Assets and liabilities in foreign currencies | (14,661) | |
Total change in net unrealized appreciation (depreciation) | | (104,802,589) |
Net gain (loss) | | (20,643,065) |
Net increase (decrease) in net assets resulting from operations | | $ (23,224,350) |
See accompanying notes which are an integral part of the financial statements.
Annual Report
Financial Statements - continued
Statement of Changes in Net Assets
| Year ended
July 31,
2012 | Year ended
July 31,
2011 |
Increase (Decrease) in Net Assets | | |
Operations | | |
Net investment income (loss) | $ (2,581,285) | $ (3,102,614) |
Net realized gain (loss) | 84,159,524 | 221,065,530 |
Change in net unrealized appreciation (depreciation) | (104,802,589) | 210,253,368 |
Net increase (decrease) in net assets resulting
from operations | (23,224,350) | 428,216,284 |
Distributions to shareholders from net realized gain | (34,799,429) | (3,013,255) |
Share transactions - net increase (decrease) | 61,802,637 | (17,486,495) |
Redemption fees | 255,125 | 229,000 |
Total increase (decrease) in net assets | 4,033,983 | 407,945,534 |
| | |
Net Assets | | |
Beginning of period | 1,843,138,221 | 1,435,192,687 |
End of period (including accumulated net investment loss of $1,442,758 and accumulated net investment loss of $848,304, respectively) | $ 1,847,172,204 | $ 1,843,138,221 |
See accompanying notes which are an integral part of the financial statements.
Annual Report
Financial Highlights - Class A
Years ended July 31, | 2012 | 2011 | 2010 | 2009 | 2008 |
Selected Per-Share Data | | | | | |
Net asset value, beginning of period | $ 16.42 | $ 12.66 | $ 10.79 | $ 13.20 | $ 16.06 |
Income from Investment Operations | | | | | |
Net investment income (loss) C | (.07) F | (.07) G | (.07) H | (.06) | (.11) |
Net realized and unrealized gain (loss) | (.16) | 3.84 | 1.94 | (2.35) | (1.73) |
Total from investment operations | (.23) | 3.77 | 1.87 | (2.41) | (1.84) |
Distributions from net realized gain | (.32) | (.01) K | - | - | (1.02) |
Redemption fees added to paid in capital C,J | - | - | - | - | - |
Net asset value, end of period | $ 15.87 | $ 16.42 | $ 12.66 | $ 10.79 | $ 13.20 |
Total Return A,B | (1.14)% | 29.78% | 17.33% | (18.26)% | (12.26)% |
Ratios to Average Net Assets D,I | | | | | |
Expenses before reductions | 1.35% | 1.25% | 1.35% | 1.33% | 1.40% |
Expenses net of fee waivers, if any | 1.35% | 1.25% | 1.35% | 1.33% | 1.40% |
Expenses net of all reductions | 1.34% | 1.23% | 1.34% | 1.33% | 1.39% |
Net investment income (loss) | (.49)% F | (.47)% G | (.56)% H | (.64)% | (.74)% |
Supplemental Data | | | | | |
Net assets, end of period (000 omitted) | $ 59,684 | $ 67,272 | $ 50,620 | $ 40,211 | $ 42,187 |
Portfolio turnover rate E | 150% | 106% | 105% | 150% | 113% |
A Total returns would have been lower if certain expenses had not been reduced during the applicable periods shown.
B Total returns do not include the effect of the sales charges.
C Calculated based on average shares outstanding during the period.
D Fees and expenses of any underlying Fidelity Central Funds are not included in the Fund's expense ratio. The Fund indirectly bears its proportionate share of the expenses of any underlying Fidelity Central Funds.
E Amount does not include the portfolio activity of any underlying Fidelity Central Funds.
F Investment income per share reflects a large, non-recurring dividend which amounted to $.01 per share. Excluding this non-recurring dividend, the ratio of net investment income (loss) to average net assets would have been (.57)%.
G Investment income per share reflects a large, non-recurring dividend which amounted to $.02 per share. Excluding this non-recurring dividend, the ratio of net investment income (loss) to average net assets would have been (.61)%.
H Investment income per share reflects a large, non-recurring dividend which amounted to $.01 per share. Excluding this non-recurring dividend, the ratio of net investment income (loss) to average net assets would have been (.67)%.
I Expense ratios reflect operating expenses of the class. Expenses before reductions do not reflect amounts reimbursed by the investment adviser or reductions from brokerage service arrangements or reductions from other expense offset arrangements and do not represent the amount paid by the class during periods when reimbursements or reductions occur. Expenses net of fee waivers reflect expenses after reimbursement by the investment adviser but prior to reductions from brokerage service arrangements or other expense offset arrangements. Expenses net of all reductions represent the net expenses paid by the class.
J Amount represents less than $.01 per share.
K The amount shown reflects certain reclassifications related to book to tax differences.
See accompanying notes which are an integral part of the financial statements.
Annual Report
Financial Highlights - Class T
Years ended July 31, | 2012 | 2011 | 2010 | 2009 | 2008 |
Selected Per-Share Data | | | | | |
Net asset value, beginning of period | $ 16.27 | $ 12.57 | $ 10.74 | $ 13.17 | $ 16.01 |
Income from Investment Operations | | | | | |
Net investment income (loss) C | (.11) F | (.11) G | (.10) H | (.09) | (.15) |
Net realized and unrealized gain (loss) | (.16) | 3.81 | 1.93 | (2.34) | (1.73) |
Total from investment operations | (.27) | 3.70 | 1.83 | (2.43) | (1.88) |
Distributions from net realized gain | (.32) | - | - | - | (.96) |
Redemption fees added to paid in capital C,J | - | - | - | - | - |
Net asset value, end of period | $ 15.68 | $ 16.27 | $ 12.57 | $ 10.74 | $ 13.17 |
Total Return A,B | (1.41)% | 29.44% | 17.04% | (18.45)% | (12.50)% |
Ratios to Average Net AssetsD,I | | | | | |
Expenses before reductions | 1.61% | 1.50% | 1.61% | 1.60% | 1.65% |
Expenses net of fee waivers, if any | 1.61% | 1.50% | 1.61% | 1.60% | 1.65% |
Expenses net of all reductions | 1.60% | 1.49% | 1.60% | 1.59% | 1.65% |
Net investment income (loss) | (.74)% F | (.73)% G | (.82)% H | (.91)% | (.99)% |
Supplemental Data | | | | | |
Net assets, end of period (000 omitted) | $ 27,658 | $ 30,764 | $ 23,930 | $ 21,533 | $ 21,754 |
Portfolio turnover rate E | 150% | 106% | 105% | 150% | 113% |
A Total returns would have been lower if certain expenses had not been reduced during the applicable periods shown.
B Total returns do not include the effect of the sales charges.
C Calculated based on average shares outstanding during the period.
D Fees and expenses of any underlying Fidelity Central Funds are not included in the Fund's expense ratio. The Fund indirectly bears its proportionate share of the expenses of any underlying Fidelity Central Funds.
E Amount does not include the portfolio activity of any underlying Fidelity Central Funds.
F Investment income per share reflects a large, non-recurring dividend which amounted to $.01 per share. Excluding this non-recurring dividend, the ratio of net investment income (loss) to average net assets would have been (.83)%.
G Investment income per share reflects a large, non-recurring dividend which amounted to $.02 per share. Excluding this non-recurring dividend, the ratio of net investment income (loss) to average net assets would have been (.86)%.
H Investment income per share reflects a large, non-recurring dividend which amounted to $.01 per share. Excluding this non-recurring dividend, the ratio of net investment income (loss) to average net assets would have been (.93)%.
I Expense ratios reflect operating expenses of the class. Expenses before reductions do not reflect amounts reimbursed by the investment adviser or reductions from brokerage service arrangements or reductions from other expense offset arrangements and do not represent the amount paid by the class during periods when reimbursements or reductions occur. Expenses net of fee waivers reflect expenses after reimbursement by the investment adviser but prior to reductions from brokerage service arrangements or other expense offset arrangements. Expenses net of all reductions represent the net expenses paid by the class.
J Amount represents less than $.01 per share.
See accompanying notes which are an integral part of the financial statements.
Annual Report
Financial Highlights - Class B
Years ended July 31, | 2012 | 2011 | 2010 | 2009 | 2008 |
Selected Per-Share Data | | | | | |
Net asset value, beginning of period | $ 15.86 | $ 12.30 | $ 10.57 | $ 13.03 | $ 15.85 |
Income from Investment Operations | | | | | |
Net investment income (loss) C | (.18) F | (.18) G | (.16) H | (.13) | (.22) |
Net realized and unrealized gain (loss) | (.17) | 3.74 | 1.89 | (2.33) | (1.71) |
Total from investment operations | (.35) | 3.56 | 1.73 | (2.46) | (1.93) |
Distributions from net realized gain | (.32) | - | - | - | (.89) |
Redemption fees added to paid in capital C,J | - | - | - | - | - |
Net asset value, end of period | $ 15.19 | $ 15.86 | $ 12.30 | $ 10.57 | $ 13.03 |
Total Return A,B | (1.96)% | 28.94% | 16.37% | (18.88)% | (12.92)% |
Ratios to Average Net Assets D,I | | | | | |
Expenses before reductions | 2.10% | 2.00% | 2.11% | 2.08% | 2.15% |
Expenses net of fee waivers, if any | 2.10% | 2.00% | 2.11% | 2.08% | 2.15% |
Expenses net of all reductions | 2.09% | 1.98% | 2.09% | 2.08% | 2.15% |
Net investment income (loss) | (1.23)% F | (1.22)% G | (1.32)% H | (1.39)% | (1.49)% |
Supplemental Data | | | | | |
Net assets, end of period (000 omitted) | $ 4,123 | $ 5,295 | $ 5,142 | $ 4,171 | $ 5,517 |
Portfolio turnover rate E | 150% | 106% | 105% | 150% | 113% |
A Total returns would have been lower if certain expenses had not been reduced during the applicable periods shown.
B Total returns do not include the effect of the contingent deferred sales charge.
C Calculated based on average shares outstanding during the period.
D Fees and expenses of any underlying Fidelity Central Funds are not included in the Fund's expense ratio. The Fund indirectly bears its proportionate share of the expenses of any underlying Fidelity Central Funds.
E Amount does not include the portfolio activity of any underlying Fidelity Central Funds.
F Investment income per share reflects a large, non-recurring dividend which amounted to $.01 per share. Excluding this non-recurring dividend, the ratio of net investment income (loss) to average net assets would have been (1.32)%.
G Investment income per share reflects a large, non-recurring dividend which amounted to $.02 per share. Excluding this non-recurring dividend, the ratio of net investment income (loss) to average net assets would have been (1.36)%.
H Investment income per share reflects a large, non-recurring dividend which amounted to $.01 per share. Excluding this non-recurring dividend, the ratio of net investment income (loss) to average net assets would have been (1.42)%.
I Expense ratios reflect operating expenses of the class. Expenses before reductions do not reflect amounts reimbursed by the investment adviser or reductions from brokerage service arrangements or reductions from other expense offset arrangements and do not represent the amount paid by the class during periods when reimbursements or reductions occur. Expenses net of fee waivers reflect expenses after reimbursement by the investment adviser but prior to reductions from brokerage service arrangements or other expense offset arrangements. Expenses net of all reductions represent the net expenses paid by the class.
J Amount represents less than $.01 per share.
See accompanying notes which are an integral part of the financial statements.
Annual Report
Financial Highlights - Class C
Years ended July 31, | 2012 | 2011 | 2010 | 2009 | 2008 |
Selected Per-Share Data | | | | | |
Net asset value, beginning of period | $ 15.83 | $ 12.28 | $ 10.55 | $ 13.00 | $ 15.84 |
Income from Investment Operations | | | | | |
Net investment income (loss) C | (.18) F | (.18) G | (.16) H | (.13) | (.22) |
Net realized and unrealized gain (loss) | (.17) | 3.73 | 1.89 | (2.32) | (1.71) |
Total from investment operations | (.35) | 3.55 | 1.73 | (2.45) | (1.93) |
Distributions from net realized gain | (.32) | - | - | - | (.91) |
Redemption fees added to paid in capital C,J | - | - | - | - | - |
Net asset value, end of period | $ 15.16 | $ 15.83 | $ 12.28 | $ 10.55 | $ 13.00 |
Total Return A,B | (1.96)% | 28.91% | 16.40% | (18.85)% | (12.94)% |
Ratios to Average Net Assets D,I | | | | | |
Expenses before reductions | 2.10% | 2.00% | 2.11% | 2.08% | 2.15% |
Expenses net of fee waivers, if any | 2.10% | 2.00% | 2.11% | 2.08% | 2.15% |
Expenses net of all reductions | 2.09% | 1.98% | 2.09% | 2.07% | 2.14% |
Net investment income (loss) | (1.24)% F | (1.22)% G | (1.32)% H | (1.39)% | (1.49)% |
Supplemental Data | | | | | |
Net assets, end of period (000 omitted) | $ 24,683 | $ 24,914 | $ 18,091 | $ 14,267 | $ 15,946 |
Portfolio turnover rate E | 150% | 106% | 105% | 150% | 113% |
A Total returns would have been lower if certain expenses had not been reduced during the applicable periods shown.
B Total returns do not include the effect of the contingent deferred sales charge.
C Calculated based on average shares outstanding during the period.
D Fees and expenses of any underlying Fidelity Central Funds are not included in the Fund's expense ratio. The Fund indirectly bears its proportionate share of the expenses of any underlying Fidelity Central Funds.
E Amount does not include the portfolio activity of any underlying Fidelity Central Funds.
F Investment income per share reflects a large, non-recurring dividend which amounted to $.01 per share. Excluding this non-recurring dividend, the ratio of net investment income (loss) to average net assets would have been (1.32)%.
G Investment income per share reflects a large, non-recurring dividend which amounted to $.02 per share. Excluding this non-recurring dividend, the ratio of net investment income (loss) to average net assets would have been (1.36)%.
H Investment income per share reflects a large, non-recurring dividend which amounted to $.01 per share. Excluding this non-recurring dividend, the ratio of net investment income (loss) to average net assets would have been (1.42)%.
I Expense ratios reflect operating expenses of the class. Expenses before reductions do not reflect amounts reimbursed by the investment adviser or reductions from brokerage service arrangements or reductions from other expense offset arrangements and do not represent the amount paid by the class during periods when reimbursements or reductions occur. Expenses net of fee waivers reflect expenses after reimbursement by the investment adviser but prior to reductions from brokerage service arrangements or other expense offset arrangements. Expenses net of all reductions represent the net expenses paid by the class.
J Amount represents less than $.01 per share.
See accompanying notes which are an integral part of the financial statements.
Annual Report
Financial Highlights - Small Cap Growth
Years ended July 31, | 2012 | 2011 | 2010 | 2009 | 2008 |
Selected Per-Share Data | | | | | |
Net asset value, beginning of period | $ 16.65 | $ 12.81 | $ 10.89 | $ 13.29 | $ 16.15 |
Income from Investment Operations | | | | | |
Net investment income (loss) B | (.03) E | (.03) F | (.04) G | (.04) | (.07) |
Net realized and unrealized gain (loss) | (.16) | 3.90 | 1.96 | (2.36) | (1.74) |
Total from investment operations | (.19) | 3.87 | 1.92 | (2.40) | (1.81) |
Distributions from net realized gain | (.32) | (.03) J | - | - | (1.05) |
Redemption fees added to paid in capital B,I | - | - | - | - | - |
Net asset value, end of period | $ 16.14 | $ 16.65 | $ 12.81 | $ 10.89 | $ 13.29 |
Total Return A | (.88)% | 30.20% | 17.63% | (18.06)% | (11.98)% |
Ratios to Average Net Assets C,H | | | | |
Expenses before reductions | 1.03% | .95% | 1.08% | 1.08% | 1.11% |
Expenses net of fee waivers, if any | 1.03% | .95% | 1.08% | 1.08% | 1.11% |
Expenses net of all reductions | 1.02% | .93% | 1.07% | 1.08% | 1.10% |
Net investment income (loss) | (.16)% E | (.17)% F | (.29)% G | (.39)% | (.45)% |
Supplemental Data | | | | | |
Net assets, end of period (000 omitted) | $ 1,166,101 | $ 1,382,688 | $ 1,204,818 | $ 1,085,184 | $ 1,217,520 |
Portfolio turnover rate D | 150% | 106% | 105% | 150% | 113% |
A Total returns would have been lower if certain expenses had not been reduced during the applicable periods shown.
B Calculated based on average shares outstanding during the period.
C Fees and expenses of any underlying Fidelity Central Funds are not included in the Fund's expense ratio. The Fund indirectly bears its proportionate share of the expenses of any underlying Fidelity Central Funds.
D Amount does not include the portfolio activity of any underlying Fidelity Central Funds.
E Investment income per share reflects a large, non-recurring dividend which amounted to $.01 per share. Excluding this non-recurring dividend, the ratio of net investment income (loss) to average net assets would have been (.25)%.
F Investment income per share reflects a large, non-recurring dividend which amounted to $.02 per share. Excluding this non-recurring dividend, the ratio of net investment income (loss) to average net assets would have been (.31)%.
G Investment income per share reflects a large, non-recurring dividend which amounted to $.01 per share. Excluding this non-recurring dividend, the ratio of net investment income (loss) to average net assets would have been (.39)%.
H Expense ratios reflect operating expenses of the class. Expenses before reductions do not reflect amounts reimbursed by the investment adviser or reductions from brokerage service arrangements or reductions from other expense offset arrangements and do not represent the amount paid by the class during periods when reimbursements or reductions occur. Expenses net of fee waivers reflect expenses after reimbursement by the investment adviser but prior to reductions from brokerage service arrangements or other expense offset arrangements. Expenses net of all reductions represent the net expenses paid by the class.
I Amount represents less than $.01 per share.
J The amount shown reflects certain reclassifications related to book to tax differences.
See accompanying notes which are an integral part of the financial statements.
Annual Report
Financial Highlights - Class F
Years ended July 31, | 2012 | 2011 | 2010 | 2009 K |
Selected Per-Share Data | | | | |
Net asset value, beginning of period | $ 16.73 | $ 12.85 | $ 10.90 | $ 10.03 |
Income from Investment Operations | | | | |
Net investment income (loss) D | .01 H | .01 I | -J,M | (.01) |
Net realized and unrealized gain (loss) | (.16) | 3.91 | 1.95 | .88 |
Total from investment operations | (.15) | 3.92 | 1.95 | .87 |
Distributions from net realized gain | (.32) | (.04) N | - | - |
Redemption fees added to paid in capital D,M | - | - | - | - |
Net asset value, end of period | $ 16.26 | $ 16.73 | $ 12.85 | $ 10.90 |
Total Return B,C | (.64)% | 30.56% | 17.89% | 8.67% |
Ratios to Average Net Assets E,L | | | | |
Expenses before reductions | .80% | .70% | .78% | .74% A |
Expenses net of fee waivers, if any | .80% | .70% | .78% | .74% A |
Expenses net of all reductions | .79% | .68% | .77% | .73% A |
Net investment income (loss) | .07% H | .08% I | -% G,J | (.54)% A |
Supplemental Data | | | | |
Net assets, end of period (000 omitted) | $ 528,229 | $ 290,765 | $ 106,941 | $ 159 |
Portfolio turnover rate F | 150% | 106% | 105% | 150% |
A Annualized
B Total returns for periods of less than one year are not annualized.
C Total returns would have been lower if certain expenses had not been reduced during the applicable periods shown.
D Calculated based on average shares outstanding during the period.
E Fees and expenses of any underlying Fidelity Central Funds are not included in the Fund's expense ratio. The Fund indirectly bears its proportionate share of the expenses of any underlying Fidelity Central Funds.
F Amount does not include the portfolio activity of any underlying Fidelity Central Funds.
G Amount represents less than .01%.
H Investment income per share reflects a large, non-recurring dividend which amounted to $.01 per share. Excluding this non-recurring dividend, the ratio of net investment income (loss) to average net assets would have been (.02)%.
I Investment income per share reflects a large, non-recurring dividend which amounted to $.02 per share. Excluding this non-recurring dividend, the ratio of net investment income (loss) to average net assets would have been (.06)%.
J Investment income per share reflects a large, non-recurring dividend which amounted to $.01 per share. Excluding this non-recurring dividend, the ratio of net investment income (loss) to average net assets would have been (.10)%.
K For the period June 26, 2009 (commencement of sale of shares) to July 31, 2009.
L Expense ratios reflect operating expenses of the class. Expenses before reductions do not reflect amounts reimbursed by the investment adviser or reductions from brokerage service arrangements or reductions from other expense offset arrangements and do no represent the amount paid by the class during periods when reimbursements or reductions occur. Expense ratios before reductions for start-up periods may not be representative of longer-term operating periods. Expenses net of fee waivers reflect expenses after reimbursement by the investment adviser but prior to reductions from brokerage service arrangements or other expense offset arrangements. Expenses net of all reductions represent the net expenses paid by the class.
M Amount represents less than $.01 per share.
N The amount shown reflects certain reclassifications related to book to tax differences.
See accompanying notes which are an integral part of the financial statements.
Annual Report
Financial Highlights - Institutional Class
Years ended July 31, | 2012 | 2011 | 2010 | 2009 | 2008 |
Selected Per-Share Data | | | | | |
Net asset value, beginning of period | $ 16.68 | $ 12.83 | $ 10.91 | $ 13.30 | $ 16.15 |
Income from Investment Operations | | | | | |
Net investment income (loss) B | (.03) E | (.03) F | (.03) G | (.03) | (.06) |
Net realized and unrealized gain (loss) | (.16) | 3.91 | 1.95 | (2.36) | (1.74) |
Total from investment operations | (.19) | 3.88 | 1.92 | (2.39) | (1.80) |
Distributions from net realized gain | (.32) | (.03) J | - | - | (1.05) |
Redemption fees added to paid in capital B,I | - | - | - | - | - |
Net asset value, end of period | $ 16.17 | $ 16.68 | $ 12.83 | $ 10.91 | $ 13.30 |
Total Return A | (.88)% | 30.24% | 17.60% | (17.97)% | (11.93)% |
Ratios to Average Net Assets C,H | | | | |
Expenses before reductions | 1.06% | .94% | 1.03% | 1.05% | 1.04% |
Expenses net of fee waivers, if any | 1.06% | .94% | 1.03% | 1.05% | 1.04% |
Expenses net of all reductions | 1.05% | .93% | 1.02% | 1.04% | 1.03% |
Net investment income (loss) | (.19)% E | (.17)% F | (.24)% G | (.36)% | (.38)% |
Supplemental Data | | | | | |
Net assets, end of period (000 omitted) | $ 36,694 | $ 41,440 | $ 25,650 | $ 19,204 | $ 22,444 |
Portfolio turnover rate D | 150% | 106% | 105% | 150% | 113% |
A Total returns would have been lower if certain expenses had not been reduced during the applicable periods shown.
B Calculated based on average shares outstanding during the period.
C Fees and expenses of any underlying Fidelity Central Funds are not included in the Fund's expense ratio. The Fund indirectly bears its proportionate share of the expenses of any underlying Fidelity Central Funds.
D Amount does not include the portfolio activity of any underlying Fidelity Central Funds.
E Investment income per share reflects a large, non-recurring dividend which amounted to $.01 per share. Excluding this non-recurring dividend, the ratio of net investment income (loss) to average net assets would have been (.28)%.
F Investment income per share reflects a large, non-recurring dividend which amounted to $.02 per share. Excluding this non-recurring dividend, the ratio of net investment income (loss) to average net assets would have been (.30)%.
G Investment income per share reflects a large, non-recurring dividend which amounted to $.01 per share. Excluding this non-recurring dividend, the ratio of net investment income (loss) to average net assets would have been (.34)%.
H Expense ratios reflect operating expenses of the class. Expenses before reductions do not reflect amounts reimbursed by the investment adviser or reductions from brokerage service arrangements or reductions from other expense offset arrangements and do not represent the amount paid by the class during periods when reimbursements or reductions occur. Expenses net of fee waivers reflect expenses after reimbursement by the investment adviser but prior to reductions from brokerage service arrangements or other expense offset arrangements. Expenses net of all reductions represent the net expenses paid by the class.
I Amount represents less than $.01 per share.
J The amount shown reflects certain reclassifications related to book to tax differences.
See accompanying notes which are an integral part of the financial statements.
Annual Report
Notes to Financial Statements
For the period ended July 31, 2012
1. Organization.
Fidelity Small Cap Growth Fund (the Fund) is a fund of Fidelity Securities Fund (the Trust) and is authorized to issue an unlimited number of shares. The Trust is registered under the Investment Company Act of 1940, as amended (the 1940 Act), as an open-end management investment company organized as a Massachusetts business trust. The Fund offers Class A, Class T, Class C, Small Cap Growth, Class F and Institutional Class shares, each of which, along with Class B shares, has equal rights as to assets and voting privileges. Effective after the close of business on September 1, 2010, Class B shares were closed to new accounts and additional purchases, except for exchanges and reinvestments. Each class has exclusive voting rights with respect to matters that affect that class. Class F shares of the Fund are only available for purchase by mutual funds for which Fidelity Management & Research Company (FMR) or an affiliate serves as investment manager. Class B shares will automatically convert to Class A shares after a holding period of seven years from the initial date of purchase. Investment income, realized and unrealized capital gains and losses, the common expenses of the Fund, and certain fund-level expense reductions, if any, are allocated on a pro-rata basis to each class based on the relative net assets of each class to the total net assets of the Fund. Each class differs with respect to transfer agent and distribution and service plan fees incurred. Certain expense reductions may also differ by class.
2. Investments in Fidelity Central Funds.
The Fund invests in Fidelity Central Funds, which are open-end investment companies available only to other investment companies and accounts managed by FMR and its affiliates. The Fund's Schedule of Investments lists each of the Fidelity Central Funds held as of period end, if any, as an investment of the Fund, but does not include the underlying holdings of each Fidelity Central Fund. As an Investing Fund, the Fund indirectly bears its proportionate share of the expenses of the underlying Fidelity Central Funds.
The Money Market Central Funds seek preservation of capital and current income and are managed by Fidelity Investments Money Management, Inc. (FIMM), an affiliate of FMR.
A complete unaudited list of holdings for each Fidelity Central Fund is available upon request or at the Securities and Exchange Commission (the SEC) web site at www.sec.gov. In addition, the financial statements of the Fidelity Central Funds, which are not covered by the Fund's Report of Independent Registered Public Accounting Firm, are available on the SEC web site or upon request.
Annual Report
Notes to Financial Statements - continued
3. Significant Accounting Policies.
The financial statements have been prepared in conformity with accounting principles generally accepted in the United States of America (GAAP), which require management to make certain estimates and assumptions at the date of the financial statements. Actual results could differ from those estimates. Subsequent events, if any, through the date that the financial statements were issued have been evaluated in the preparation of the financial statements. The following summarizes the significant accounting policies of the Fund:
Security Valuation. Investments are valued as of 4:00 p.m. Eastern time on the last calendar day of the period. In accordance with valuation policies and procedures approved by the Board of Trustees (the Board), the Fund attempts to obtain prices from one or more third party pricing vendor or broker to value its investments. When current market prices, quotations or rates are not readily available or reliable, securities will be fair valued in good faith by the FMR Fair Value Committee (the Committee), in accordance with procedures adopted by the Fund's Board. Factors used in determining fair value vary by security type and may include market or security specific events. The frequency with which these procedures are used cannot be predicted and they may be utilized to a significant extent. The Committee oversees the Fund's valuation policies and procedures and is responsible for approving and reporting to the Board all fair value determinations.
The Fund categorizes the inputs to valuation techniques used to value its investments into a disclosure hierarchy consisting of three levels as shown below:
Level 1 - quoted prices in active markets for identical investments
Level 2 - other significant observable inputs (including quoted prices for similar investments, interest rates, prepayment speeds, etc.)
Level 3 - unobservable inputs (including the Fund's own assumptions based on the best information available)
Valuation techniques used to value the Fund's investments by major category are as follows:
Equity securities, including restricted securities, for which market quotations are readily available, are valued at the last reported sale price or official closing price as reported by a third party pricing vendor on the primary market or exchange on which they are traded and are categorized as Level 1 in the hierarchy. In the event there were no sales during the day or closing prices are not available, securities are valued at the last quoted bid price or may be valued using the last available price and are generally categorized as Level 2 in the hierarchy. For foreign equity securities, when significant market or security specific events arise, comparisons to the valuation of American Depositary Receipts
Annual Report
3. Significant Accounting Policies - continued
Security Valuation - continued
(ADRs), futures contracts, Exchange-Traded Funds (ETFs) and certain indexes as well as quoted prices for similar securities are used and are categorized as Level 2 in the hierarchy. Utilizing these techniques may result in transfers between Level 1 and Level 2.
Investments in open-end mutual funds, including the Fidelity Central Funds, are valued at their closing net asset value each business day and are categorized as Level 1 in the hierarchy.
Changes in valuation techniques may result in transfers in or out of an assigned level within the disclosure hierarchy. The aggregate value of investments by input level, as of July 31, 2012, is included at the end of the Fund's Schedule of Investments.
Foreign Currency Translation. The Fund may use foreign currency contracts to facilitate transactions in foreign-denominated securities. Gains and losses from these transactions may arise from changes in the value of the foreign currency or if the counterparties do not perform under the contracts' terms.
Foreign-denominated assets, including investment securities, and liabilities are translated into U.S. dollars at the exchange rate at period end. Purchases and sales of investment securities, income and dividends received and expenses denominated in foreign currencies are translated into U.S. dollars at the exchange rate in effect on the transaction date.
The effects of exchange rate fluctuations on investments are included with the net realized and unrealized gain (loss) on investment securities. Other foreign currency transactions resulting in realized and unrealized gain (loss) are disclosed separately.
Investment Transactions and Income. For financial reporting purposes, the Fund's investment holdings and NAV include trades executed through the end of the last business day of the period. The NAV per share for processing shareholder transactions is calculated as of the close of business of the New York Stock Exchange (NYSE), normally 4:00 p.m. Eastern time and includes trades executed through the end of the prior business day. Gains and losses on securities sold are determined on the basis of identified cost and may include proceeds received from litigation. Dividend income is recorded on the ex-dividend date, except for certain dividends from foreign securities where the ex-dividend date may have passed, which are recorded as soon as the Fund is informed of the ex-dividend date. Non-cash dividends included in dividend income, if any, are recorded at the fair market value of the securities received. Distributions received on securities that represent a return of capital or capital gain are recorded as a reduction of cost of investments and/or as a realized gain. The Fund estimates the components of distributions received that may be considered return of capital distributions or capital
Annual Report
Notes to Financial Statements - continued
3. Significant Accounting Policies - continued
Investment Transactions and Income - continued
gain distributions. Large, non-recurring dividends recognized by the Fund are presented separately on the Statement of Operations as "Special Dividends" and the impact of these dividends is presented in the Financial Highlights. Interest income and distributions from the Fidelity Central Funds are accrued as earned. Interest income includes coupon interest and amortization of premium and accretion of discount on debt securities. Investment income is recorded net of foreign taxes withheld where recovery of such taxes is uncertain.
Expenses. Expenses directly attributable to a fund are charged to that fund. Expenses attributable to more than one fund are allocated among the respective funds on the basis of relative net assets or other appropriate methods. Expense estimates are accrued in the period to which they relate and adjustments are made when actual amounts are known.
Income Tax Information and Distributions to Shareholders. Each year, the Fund intends to qualify as a regulated investment company under Subchapter M of the Internal Revenue Code, including distributing substantially all of its taxable income and realized gains. As a result, no provision for income taxes is required. As of July 31, 2012, the Fund did not have any unrecognized tax benefits in the financial statements; nor is the Fund aware of any tax positions for which it is reasonably possible that the total amounts of unrecognized tax benefits will significantly change in the next twelve months. The Fund files a U.S. federal tax return, in addition to state and local tax returns as required. A fund's federal income tax returns are subject to examination by the Internal Revenue Service (IRS) for a period of three fiscal years after they are filed. State and local tax returns may be subject to examination for an additional fiscal year depending on the jurisdiction. Foreign taxes are provided for based on the Fund's understanding of the tax rules and rates that exist in the foreign markets in which it invests.
Distributions are declared and recorded on the ex-dividend date. Income dividends and capital gain distributions are declared separately for each class. Income and capital gain distributions are determined in accordance with income tax regulations, which may differ from GAAP. These differences resulted in distribution reclassifications for the period ended July 31, 2011. In addition, the Fund claimed a portion of the payment made to redeeming shareholders as a distribution for income tax purposes.
Capital accounts within the financial statements are adjusted for permanent book-tax differences. These adjustments have no impact on net assets or the results of operations. Temporary book-tax differences will reverse in a subsequent period.
Annual Report
3. Significant Accounting Policies - continued
Income Tax Information and Distributions to Shareholders - continued
Book-tax differences are primarily due to foreign currency transactions, net operating losses, future transactions, and losses deferred due to wash sales and excise tax regulations.
The federal tax cost of investment securities and unrealized appreciation (depreciation) as of period end were as follows:
Gross unrealized appreciation | $ 262,984,526 |
Gross unrealized depreciation | (85,038,817) |
Net unrealized appreciation (depreciation) on securities and other investments | $ 177,945,709 |
| |
Tax Cost | $ 1,734,004,109 |
The tax-based components of distributable earnings as of period end were as follows:
Undistributed long-term capital gain | $ 66,152,857 |
Net unrealized appreciation (depreciation) | $ 177,934,714 |
The tax character of distributions paid was as follows:
| July 31, 2012 | July 31, 2011 |
Long-term Capital Gains | $ 34,799,429 | $ 3,013,255 |
Short-Term Trading (Redemption) Fees. Shares held by investors in the Fund less than 90 days are subject to a redemption fee equal to 1.50% of the net asset value of shares redeemed. All redemption fees, which reduce the proceeds of the shareholder redemption, are retained by the Fund and accounted for as an addition to paid in capital.
New Accounting Pronouncement. In December 2011, the Financial Accounting Standards Board issued Accounting Standard Update No. 2011-11, Disclosures about Offsetting Assets and Liabilities. The update creates new disclosure requirements requiring entities to disclose both gross and net information for derivatives and other financial instruments that are either offset in the Statement of Assets and Liabilities or subject to an enforceable master netting arrangement or similar agreement. The disclosure requirements are effective for interim and annual reporting periods beginning on or after January 1, 2013. Management is currently evaluating the impact of the update's adoption on the Fund's financial statement disclosures.
Annual Report
Notes to Financial Statements - continued
4. Derivative Instruments.
Risk Exposures and the Use of Derivative Instruments. The Fund's investment objectives allow the Fund to enter into various types of derivative contracts, including futures contracts. Derivatives are investments whose value is derived from underlying assets, indices or reference rates and may be transacted on an exchange or over-the-counter (OTC). Derivatives may involve a future commitment to buy or sell a specified instrument based on specified terms, or to exchange future cash flows at periodic intervals based on a notional principal amount. The Fund used derivatives to increase returns and to manage exposure to certain risks as defined below. The success of any strategy involving derivatives depends on analysis of numerous economic factors, and if the strategies for investment do not work as intended, the Fund may not achieve its objectives.
The Fund's use of derivatives increased or decreased its exposure to the following risk:
Equity Risk | Equity risk relates to the fluctuations in the value of financial instruments as a result of changes in market prices (other than those arising from interest rate risk or foreign exchange risk), whether caused by factors specific to an individual investment, its issuer, or all factors affecting all instruments traded in a market or market segment. |
The Fund is also exposed to additional risks from investing in derivatives, such as liquidity risk and counterparty credit risk. Liquidity risk is the risk that the Fund will be unable to close out the derivative in the open market in a timely manner. Counterparty credit risk is the risk that the counterparty will not be able to fulfill its obligation to the Fund. Counterparty credit risk related to exchange-traded futures contracts is minimal because of the protection provided by the exchange on which they trade. Investing in derivatives may involve greater risks than investing in the underlying assets directly and, to varying degrees, involves risk of loss in excess of the initial investment, if any, collateral received and amounts recognized in the Statement of Assets and Liabilities. In addition, for futures contracts, there is the risk that the change in value of the derivative contract may not correspond to the change in value of the underlying instrument.
Futures Contracts. A futures contract is an agreement between two parties to buy or sell a specified underlying instrument for a fixed price at a specified future date. The Fund used futures contracts to manage its exposure to the stock market.
Upon entering into a futures contract, a fund is required to deposit either cash or securities (initial margin) with a clearing broker in an amount equal to a certain percentage of the face value of the contract. Futures contracts are marked-to-market daily and subsequent payments are made or received by a fund depending on the daily fluctuations in the value of the futures contracts and are recorded as unrealized appreciation or (depreciation). This receivable and/or payable is included in daily variation margin on
Annual Report
4. Derivative Instruments - continued
Futures Contracts - continued
futures contracts in the Statement of Assets and Liabilities. Realized gain or (loss) is recorded upon the expiration or closing of a futures contract.
Any open futures contracts at period end are shown in the Schedule of Investments under the caption "Futures Contracts." The underlying face amount at value reflects each contract's exposure to the underlying instrument at period end.
During the period the Fund recognized net realized gain (loss) of $5,787,075 related to its investment in futures contracts. This amount is included in the Statement of Operations.
5. Purchases and Sales of Investments.
Purchases and sales of securities, other than short-term securities, aggregated $2,541,649,453 and $2,542,251,432, respectively.
6. Fees and Other Transactions with Affiliates.
Management Fee. FMR and its affiliates provide the Fund with investment management related services for which the Fund pays a monthly management fee. The management fee is the sum of an individual fund fee rate that is based on an annual rate of .45% of the Fund's average net assets and an annualized group fee rate that averaged .26% during the period. The group fee rate is based upon the average net assets of all the mutual funds advised by FMR. The group fee rate decreases as assets under management increase and increases as assets under management decrease. In addition, the management fee is subject to a performance adjustment (up to a maximum of ± .20% of the Fund's average net assets over a 36 month performance period). The upward or downward adjustment to the management fee is based on the relative investment performance of Small Cap Growth as compared to an appropriate benchmark index. For the period, the total annual management fee rate, including the performance adjustment, was .76% of the Fund's average net assets.
Distribution and Service Plan Fees. In accordance with Rule 12b-1 of the 1940 Act, the Fund has adopted separate Distribution and Service Plans for each class of shares. Certain classes pay Fidelity Distributors Corporation (FDC), an affiliate of FMR, separate Distribution and Service Fees, each of which is based on an annual percentage of each class' average net assets. In addition, FDC may pay financial intermediaries for selling shares of the Fund and providing shareholder support services. For the period,
Annual Report
Notes to Financial Statements - continued
6. Fees and Other Transactions with Affiliates - continued
Distribution and Service Plan Fees - continued
the Distribution and Service Fee rates, total fees and amounts retained by FDC were as follows:
| Distribution
Fee | Service
Fee | Total Fees | Retained
by FDC |
Class A | -% | .25% | $ 149,665 | $ 2,982 |
Class T | .25% | .25% | 135,654 | 40 |
Class B | .75% | .25% | 44,856 | 33,711 |
Class C | .75% | .25% | 233,186 | 40,343 |
| | | $ 563,361 | $ 77,076 |
Sales Load. FDC may receive a front-end sales charge of up to 5.75% for selling Class A shares and 3.50% for selling Class T shares, some of which is paid to financial intermediaries for selling shares of the Fund. Depending on the holding period, FDC may receive contingent deferred sales charges levied on Class A, Class T, Class B, and Class C redemptions. The deferred sales charges range from 5.00% to 1.00% for Class B shares, 1.00% for Class C shares, 1.00% for certain purchases of Class A shares and .25% for certain purchases of Class T shares.
For the period, sales charge amounts retained by FDC were as follows:
| Retained
by FDC |
Class A | $ 18,734 |
Class T | 6,727 |
Class B* | 6,869 |
Class C* | 3,375 |
| $ 35,705 |
* When Class B and Class C shares are initially sold, FDC pays commissions from its own resources to financial intermediaries through which the sales are made.
Transfer Agent Fees. Fidelity Investments Institutional Operations Company, Inc. (FIIOC), an affiliate of FMR, is the transfer, dividend disbursing and shareholder servicing agent for each class of the Fund. FIIOC receives account fees and asset-based fees that vary according to the account size and type of account of the shareholders of the respective classes of the Fund, except for Class F. FIIOC receives no fees for providing transfer agency services to Class F. FIIOC pays for typesetting, printing and mailing of
Annual Report
6. Fees and Other Transactions with Affiliates - continued
Transfer Agent Fees - continued
shareholder reports, except proxy statements. For the period, transfer agent fees for each class were as follows:
| Amount | % of
Average
Net Assets |
Class A | $ 180,619 | .30 |
Class T | 83,964 | .31 |
Class B | 13,505 | .30 |
Class C | 70,300 | .30 |
Small Cap Growth | 2,720,942 | .23 |
Institutional Class | 96,167 | .26 |
| $ 3,165,497 | |
Accounting and Security Lending Fees. Fidelity Service Company, Inc. (FSC), an affiliate of FMR, maintains the Fund's accounting records. The accounting fee is based on the level of average net assets for each month. Under a separate contract, FSC administers the security lending program. The security lending fee is based on the number and duration of lending transactions.
Brokerage Commissions. The Fund placed a portion of its portfolio transactions with brokerage firms which are affiliates of the investment adviser. The commissions paid to these affiliated firms were $106,659 for the period.
7. Committed Line of Credit.
The Fund participates with other funds managed by FMR or an affiliate in a $4.25 billion credit facility (the "line of credit") to be utilized for temporary or emergency purposes to fund shareholder redemptions or for other short-term liquidity purposes. The Fund has agreed to pay commitment fees on its pro-rata portion of the line of credit, which amounted to $4,901 and is reflected in Miscellaneous expenses on the Statement of Operations. During the period, there were no borrowings on this line of credit.
8. Security Lending.
The Fund lends portfolio securities through a lending agent from time to time in order to earn additional income. For equity securities, a lending agent is used and may loan securities to certain qualified borrowers, including Fidelity Capital Markets (FCM), a broker-dealer affiliated with the Fund. On the settlement date of the loan, the Fund receives collateral (in the form of U.S. Treasury obligations, letters of credit and/or cash)
Annual Report
Notes to Financial Statements - continued
8. Security Lending - continued
against the loaned securities and maintains collateral in an amount not less than 100% of the market value of the loaned securities during the period of the loan. The market value of the loaned securities is determined at the close of business of the Fund and any additional required collateral is delivered to the Fund on the next business day. If the borrower defaults on its obligation to return the securities loaned because of insolvency or other reasons, a fund could experience delays and costs in recovering the securities loaned or in gaining access to the collateral. Any cash collateral received is invested in the Fidelity Securities Lending Cash Central Fund. The value of loaned securities and cash collateral at period end are disclosed on the Fund's Statement of Assets and Liabilities. The value of securities loaned to FCM at period end was $3,791,412. Security lending income represents the income earned on investing cash collateral, less rebates paid to borrowers and any lending agent fees associated with the loan, plus any premium payments received for lending certain types of securities. Security lending income is presented in the Statement of Operations as a component of income from Fidelity Central Funds, and includes $75,770 from securities loaned to FCM.
9. Expense Reductions.
Many of the brokers with whom FMR places trades on behalf of the Fund provided services to the Fund in addition to trade execution. These services included payments of certain expenses on behalf of the Fund totaling $174,463 for the period. In addition, through arrangements with the Fund's custodian, credits realized as a result of uninvested cash balances were used to reduce the Fund's expenses. During the period, these credits reduced the Fund's custody expenses by $222.
10. Distributions to Shareholders.
Distributions to shareholders of each class were as follows:
Years ended July 31, | 2012 | 2011 |
From net realized gain | | |
Class A | $ 1,262,924 | $ 40,130 |
Class T | 573,407 | - |
Class B | 101,910 | - |
Class C | 481,854 | - |
Small Cap Growth | 25,434,274 | 2,420,020 |
Class F | 6,152,820 | 492,928 |
Institutional Class | 792,240 | 60,177 |
Total | $ 34,799,429 | $ 3,013,255 |
Annual Report
11. Share Transactions.
Transactions for each class of shares were as follows:
| Shares | Dollars |
Years ended July 31, | 2012 | 2011 | 2012 | 2011 |
Class A | | | | |
Shares sold | 986,718 | 1,459,436 | $ 14,926,996 | $ 22,640,692 |
Reinvestment of distributions | 85,896 | 2,323 | 1,194,285 | 36,172 |
Shares redeemed | (1,407,222) | (1,364,690) | (21,375,353) | (20,977,078) |
Net increase (decrease) | (334,608) | 97,069 | $ (5,254,072) | $ 1,699,786 |
Class T | | | | |
Shares sold | 358,193 | 420,613 | $ 5,456,756 | $ 6,491,294 |
Reinvestment of distributions | 38,774 | - | 533,890 | - |
Shares redeemed | (523,310) | (434,512) | (7,812,853) | (6,714,256) |
Net increase (decrease) | (126,343) | (13,899) | $ (1,822,207) | $ (222,962) |
Class B | | | | |
Shares sold | 11,810 | 25,204 | $ 172,624 | $ 366,276 |
Reinvestment of distributions | 7,173 | - | 96,091 | - |
Shares redeemed | (81,516) | (109,118) | (1,196,288) | (1,597,390) |
Net increase (decrease) | (62,533) | (83,914) | $ (927,573) | $ (1,231,114) |
Class C | | | | |
Shares sold | 405,451 | 469,568 | $ 5,976,693 | $ 7,154,653 |
Reinvestment of distributions | 33,110 | - | 443,092 | - |
Shares redeemed | (384,855) | (368,398) | (5,527,477) | (5,494,248) |
Net increase (decrease) | 53,706 | 101,170 | $ 892,308 | $ 1,660,405 |
Small Cap Growth | | | | |
Shares sold | 14,552,522 | 19,971,507 | $ 226,496,807 | $ 315,167,556 |
Reinvestment of distributions | 1,774,167 | 153,921 | 25,022,882 | 2,384,001 |
Shares redeemed | (27,135,724) | (31,144,660) | (414,348,619) | (483,710,319) |
Net increase (decrease) | (10,809,035) | (11,019,232) | $ (162,828,930) | $ (166,158,762) |
Class F | | | | |
Shares sold | 16,430,240 | 11,382,202 | $ 255,874,632 | $ 176,012,143 |
Reinvestment of distributions | 432,802 | 31,816 | 6,152,820 | 492,928 |
Shares redeemed | (1,757,546) | (2,356,621) | (26,811,905) | (37,493,486) |
Net increase (decrease) | 15,105,496 | 9,057,397 | $ 235,215,547 | $ 139,011,585 |
Institutional Class | | | | |
Shares sold | 819,623 | 1,038,111 | $ 12,520,738 | $ 16,415,657 |
Reinvestment of distributions | 44,186 | 2,532 | 624,723 | 39,301 |
Shares redeemed | (1,078,752) | (555,221) | (16,617,897) | (8,700,391) |
Net increase (decrease) | (214,943) | 485,422 | $ (3,472,436) | $ 7,754,567 |
Annual Report
Notes to Financial Statements - continued
12. Other.
The Fund's organizational documents provide former and current trustees and officers with a limited indemnification against liabilities arising in connection with the performance of their duties to the Fund. In the normal course of business, the Fund may also enter into contracts that provide general indemnifications. The Fund's maximum exposure under these arrangements is unknown as this would be dependent on future claims that may be made against the Fund. The risk of material loss from such claims is considered remote.
At the end of the period, the Fidelity Advisor Freedom Funds, the Fidelity Freedom Funds and the Fidelity Freedom K Funds were the owners of record, in the aggregate, of approximately 60% of the total outstanding shares of the Fund.
Annual Report
To the Trustees of Fidelity Securities Fund and the Shareholders of Fidelity Small Cap Growth Fund:
In our opinion, the accompanying statement of assets and liabilities, including the schedule of investments, and the related statements of operations and of changes in net assets and the financial highlights present fairly, in all material respects, the financial position of Fidelity Small Cap Growth Fund (a fund of Fidelity Securities Fund) at July 31, 2012, the results of its operations for the year then ended, the changes in its net assets for each of the two years in the period then ended and the financial highlights for each of the periods indicated, in conformity with accounting principles generally accepted in the United States of America. These financial statements and financial highlights (hereafter referred to as "financial statements") are the responsibility of the Fidelity Small Cap Growth Fund's management. Our responsibility is to express an opinion on these financial statements based on our audits. We conducted our audits of these financial statements in accordance with the standards of the Public Company Accounting Oversight Board (United States). Those standards require that we plan and perform the audit to obtain reasonable assurance about whether the financial statements are free of material misstatement. An audit includes examining, on a test basis, evidence supporting the amounts and disclosures in the financial statements, assessing the accounting principles used and significant estimates made by management, and evaluating the overall financial statement presentation. We believe that our audits, which included confirmation of securities at July 31, 2012 by correspondence with the custodian brokers and transfer agent, provide a reasonable basis for our opinion.
PricewaterhouseCoopers LLP
Boston, Massachusetts
September 12, 2012
Annual Report
The Trustees, Members of the Advisory Board, and executive officers of the trust and fund, as applicable, are listed below. The Board of Trustees governs the fund and is responsible for protecting the interests of shareholders. The Trustees are experienced executives who meet periodically throughout the year to oversee the fund's activities, review contractual arrangements with companies that provide services to the fund, oversee management of the risks associated with such activities and contractual arrangements, and review the fund's performance. Except for James C. Curvey, each of the Trustees oversees 228 funds advised by FMR or an affiliate. Mr. Curvey oversees 435 funds advised by FMR or an affiliate.
The Trustees hold office without limit in time except that (a) any Trustee may resign; (b) any Trustee may be removed by written instrument, signed by at least two-thirds of the number of Trustees prior to such removal; (c) any Trustee who requests to be retired or who has become incapacitated by illness or injury may be retired by written instrument signed by a majority of the other Trustees; and (d) any Trustee may be removed at any special meeting of shareholders by a two-thirds vote of the outstanding voting securities of the trust. Each Trustee who is not an interested person (as defined in the 1940 Act) (Independent Trustee), shall retire not later than the last day of the calendar year in which his or her 75th birthday occurs. The Independent Trustees may waive this mandatory retirement age policy with respect to individual Trustees. The executive officers and Advisory Board Members hold office without limit in time, except that any officer and Advisory Board Member may resign or may be removed by a vote of a majority of the Trustees at any regular meeting or any special meeting of the Trustees. Except as indicated, each individual has held the office shown or other offices in the same company for the past five years.
Experience, Skills, Attributes, and Qualifications of the Fund's Trustees. The Governance and Nominating Committee has adopted a statement of policy that describes the experience, qualifications, attributes, and skills that are necessary and desirable for potential Independent Trustee candidates (Statement of Policy). The Board believes that each Trustee satisfied at the time he or she was initially elected or appointed a Trustee, and continues to satisfy, the standards contemplated by the Statement of Policy. The Governance and Nominating Committee also engages professional search firms to help identify potential Independent Trustee candidates who have the experience, qualifications, attributes, and skills consistent with the Statement of Policy. From time to time, additional criteria based on the composition and skills of the current Independent Trustees, as well as experience or skills that may be appropriate in light of future changes to board composition, business conditions, and regulatory or other developments, have also been considered by the professional search firms and the Governance and Nominating Committee. In addition, the Board takes into account the Trustees' commitment and participation in Board and committee meetings, as well as their leadership of standing and ad hoc committees throughout their tenure.
In determining that a particular Trustee was and continues to be qualified to serve as a Trustee, the Board has considered a variety of criteria, none of which, in isolation, was controlling. The Board believes that, collectively, the Trustees have balanced and diverse experience, qualifications, attributes, and skills, which allow the Board to operate effectively in governing the fund and protecting the interests of shareholders. Information about the specific experience, skills, attributes, and qualifications of each Trustee, which in each case led to the Board's conclusion that the Trustee should serve (or continue to serve) as a trustee of the fund, is provided below.
Annual Report
Board Structure and Oversight Function. James C. Curvey is an interested person (as defined in the 1940 Act) and currently serves as Chairman. The Trustees have determined that an interested Chairman is appropriate and benefits shareholders because an interested Chairman has a personal and professional stake in the quality and continuity of services provided to the fund. Independent Trustees exercise their informed business judgment to appoint an individual of their choosing to serve as Chairman, regardless of whether the Trustee happens to be independent or a member of management. The Independent Trustees have determined that they can act independently and effectively without having an Independent Trustee serve as Chairman and that a key structural component for assuring that they are in a position to do so is for the Independent Trustees to constitute a substantial majority for the Board. The Independent Trustees also regularly meet in executive session. Ned C. Lautenbach serves as Chairman of the Independent Trustees and as such (i) acts as a liaison between the Independent Trustees and management with respect to matters important to the Independent Trustees and (ii) with management prepares agendas for Board meetings.
Fidelity funds are overseen by different Boards of Trustees. The fund's Board oversees Fidelity's equity and high income funds and another Board oversees Fidelity's investment-grade bond, money market, and asset allocation funds. The asset allocation funds may invest in Fidelity funds overseen by the fund's Board. The use of separate Boards, each with its own committee structure, allows the Trustees of each group of Fidelity funds to focus on the unique issues of the funds they oversee, including common research, investment, and operational issues. On occasion, the separate Boards establish joint committees to address issues of overlapping consequences for the Fidelity funds overseen by each Board.
The Trustees operate using a system of committees to facilitate the timely and efficient consideration of all matters of importance to the Trustees, the fund, and fund shareholders and to facilitate compliance with legal and regulatory requirements and oversight of the fund's activities and associated risks. The Board, acting through its committees, has charged FMR and its affiliates with (i) identifying events or circumstances the occurrence of which could have demonstrably adverse effects on the fund's business and/or reputation; (ii) implementing processes and controls to lessen the possibility that such events or circumstances occur or to mitigate the effects of such events or circumstances if they do occur; and (iii) creating and maintaining a system designed to evaluate continuously business and market conditions in order to facilitate the identification and implementation processes described in (i) and (ii) above. Because the day-to-day operations and activities of the fund are carried out by or through FMR, its affiliates and other service providers, the fund's exposure to risks is mitigated but not eliminated by the processes overseen by the Trustees. While each of the Board's committees has responsibility for overseeing different aspects of the fund's activities, oversight is exercised primarily through the Operations, Audit, and Compliance Committees. In addition, the Independent Trustees have worked with FMR to enhance the Board's oversight of investment and financial risks, legal and regulatory risks, technology risks, and operational risks, including the development of additional risk reporting to the Board. For example, a working group comprised of Independent Trustees and FMR has worked and continues to work to review the Fidelity funds' valuation-related activities, reporting and risk management. Appropriate personnel, including but not limited to the fund's Chief Compliance Officer (CCO), FMR's internal auditor, the independent accountants, the fund's Treasurer and portfolio management personnel, make periodic reports to the Board's committees, as appropriate, including an annual review of FMR's risk management program for the Fidelity funds. The responsibilities of each standing committee, including their oversight responsibilities, are described further under "Standing Committees of the Fund's Trustees."
Annual Report
Trustees and Officers - continued
The fund's Statement of Additional Information (SAI) includes more information about the Trustees. To request a free copy, call Fidelity at 1-877-208-0098.
Interested Trustees*:
Correspondence intended for each Trustee who is an interested person may be sent to Fidelity Investments, 82 Devonshire Street, Boston, Massachusetts 02109.
Name, Age; Principal Occupations and Other Relevant Experience+ |
James C. Curvey (77) |
| Year of Election or Appointment: 2007 Mr. Curvey is Trustee and Chairman of the Board of Trustees of certain Trusts. Mr. Curvey also serves as Trustee (2007-present) of other investment companies advised by FMR. Mr. Curvey is a Director of Fidelity Investments Money Management, Inc. (2009-present), Director of Fidelity Research & Analysis Co. (2009-present) and Director of FMR and FMR Co., Inc. (2007-present). Mr. Curvey is also Vice Chairman (2007-present) and Director of FMR LLC. In addition, Mr. Curvey serves as an Overseer for the Boston Symphony Orchestra and a member of the Trustees of Villanova University. Previously, Mr. Curvey was the Vice Chairman (2006-2007) and Director (2000-2007) of FMR Corp. |
Ronald P. O'Hanley (55) |
| Year of Election or Appointment: 2011 Mr. O'Hanley is Director of FMR Co., Inc. (2010-present), Director of Fidelity Investments Money Management, Inc. (2010-present), Director of Fidelity Research & Analysis Company (2010-present), President of Fidelity Asset Management and Corporate Services and a member of Fidelity's Executive Committee (2010-present). Previously, Mr. O'Hanley served as President and Chief Executive Officer of BNY Mellon Asset Management (2007-2010). Mr. O'Hanley also served as Vice Chairman of Bank New York Mellon Corp. and a member of that firm's Executive Committee. Prior to the 2007 merger of The Bank of New York and Mellon Financial Corporation, he was Vice Chairman of Mellon Financial Corporation and President and Chief Executive Officer of Mellon Asset Management. He joined Mellon in February 1997. Mr. O'Hanley currently serves as Chairman of the Boston Public Library Foundation Board of Directors and sits on the Board of Directors of Beth Israel Deaconess Medical Center, the Board of Trustees of the Marine Biological Laboratory and the Advisory Board of the Maxwell School of Citizenship and Public Administration at Syracuse University. Mr. O'Hanley also chairs the Council on Asset Management for the Financial Services Roundtable and is a member of the Board of Directors of Institutional Investor's U.S. Institute. |
* Trustees have been determined to be "Interested Trustees" by virtue of, among other things, their affiliation with the trust or various entities under common control with FMR.
+ The information above includes each Trustee's principal occupation during the last five years and other information relating to the experience, attributes, and skills relevant to each Trustee's qualifications to serve as a Trustee, which led to the conclusion that each Trustee should serve as a Trustee for the fund.
Annual Report
Trustees and Officers - continued
Independent Trustees:
Correspondence intended for each Independent Trustee (that is, the Trustees other than the Interested Trustees) may be sent to Fidelity Investments, P.O. Box 55235, Boston, Massachusetts 02205-5235.
Name, Age; Principal Occupations and Other Relevant Experience+ |
Dennis J. Dirks (64) |
| Year of Election or Appointment: 2005 Prior to his retirement in May 2003, Mr. Dirks was Chief Operating Officer and a member of the Board of The Depository Trust & Clearing Corporation (DTCC). He also served as President, Chief Operating Officer, and Board member of The Depository Trust Company (DTC) and President and Board member of the National Securities Clearing Corporation (NSCC). In addition, Mr. Dirks served as Chief Executive Officer and Board member of the Government Securities Clearing Corporation, Chief Executive Officer and Board member of the Mortgage-Backed Securities Clearing Corporation, as a Trustee and a member of the Finance Committee of Manhattan College (2005-2008), and as a Trustee and a member of the Finance Committee of AHRC of Nassau County (2006-2008). Mr. Dirks is a member of the Independent Directors Council (IDC) Governing Council (2010-present) and Board of Directors for The Brookville Center for Children's Services, Inc. (2009-present). |
Alan J. Lacy (58) |
| Year of Election or Appointment: 2008 Mr. Lacy serves as Senior Adviser (2007-present) of Oak Hill Capital Partners, L.P. (private equity). Mr. Lacy also served as Chief Executive Officer (2000-2005) and Vice Chairman (2005-2006) of Sears Holdings Corporation and Sears, Roebuck and Co. (retail). In addition, Mr. Lacy serves as a member of the Board of Directors of Dave & Buster's Entertainment, Inc. (restaurant and entertainment complexes, 2010-present), Earth Fare, Inc. (retail grocery, 2012-present), The Hillman Companies, Inc. (hardware wholesalers, 2010-present), and Bristol-Myers Squibb Company (global pharmaceuticals, 2007-present). Mr. Lacy is a member of the Board of Trustees of The National Parks Conservation Association (2006-present). Previously, Mr. Lacy served as Chairman of the Board of Trustees of the National Parks Conservation Association (2008-2011) and as a member of the Board of Directors for the Western Union Company (global money transfer, 2006-2011). |
Ned C. Lautenbach (68) |
| Year of Election or Appointment: 2000 Mr. Lautenbach is Chairman of the Independent Trustees of the Equity and High Income Funds (2006-present). Mr. Lautenbach currently serves as the Lead Director of the Eaton Corporation Board of Directors (diversified industrial, 1997-present). Mr. Lautenbach is Chairman of the Board of Directors of the Philharmonic Center for the Arts in Naples, Florida (2012-present) and a member of the Council on Foreign Relations (1994-present). Previously, Mr. Lautenbach was a Partner/Advisory Partner at Clayton, Dubilier & Rice, LLC (private equity investment, 1998-2010), as well as a Director of Sony Corporation (2006-2007). |
Joseph Mauriello (67) |
| Year of Election or Appointment: 2008 Prior to his retirement in January 2006, Mr. Mauriello served in numerous senior management positions including Deputy Chairman and Chief Operating Officer (2004-2005), and Vice Chairman of Financial Services (2002-2004) of KPMG LLP US (professional services, 1965-2005). Mr. Mauriello currently serves as a member of the Board of Directors of XL Group plc. (global insurance and re-insurance, 2006-present). Previously, Mr. Mauriello served as a Director of the Hamilton Funds of the Bank of New York (2006-2007) and of Arcadia Resources Inc. (health care services and products, 2007-2012). |
Robert W. Selander (61) |
| Year of Election or Appointment: 2011 Previously, Mr. Selander served as a Member of the Advisory Board of Fidelity's Equity and High Income Funds (2011), Executive Vice Chairman (2010), Chief Executive Officer (2009-2010), and President and Chief Executive Officer (1997-2009) of Mastercard, Inc. |
Cornelia M. Small (68) |
| Year of Election or Appointment: 2005 Ms. Small is a member of the Board of Directors of the Teagle Foundation (2009-present). Ms. Small is also a member of the Investment Committee, and Chair (2008-present) and a member of the Board of Trustees of Smith College. In addition, Ms. Small serves on the Investment Committee of the Berkshire Taconic Community Foundation (2008-present). Previously, Ms. Small served as Chairperson of the Investment Committee (2002-2008) of Smith College. In addition, Ms. Small served as Chief Investment Officer, Director of Global Equity Investments, and a member of the Board of Directors of Scudder, Stevens & Clark and Scudder Kemper Investments. |
William S. Stavropoulos (73) |
| Year of Election or Appointment: 2002 Mr. Stavropoulos is Vice Chairman of the Independent Trustees of the Equity and High Income Funds (2006-present). Mr. Stavropoulos serves as President and Founder of the Michigan Baseball Foundation, the Great Lakes Loons (2007-present). Mr. Stavropoulos is Chairman Emeritus of the Board of Directors of The Dow Chemical Company, where he previously served in numerous senior management positions, including President, CEO (1995-2000; 2002-2004), Chairman of the Executive Committee (2000-2006), and as a member of the Board of Directors (1990-2006). Currently, Mr. Stavropoulos is Chairman of Univar (global distributor of commodity and specialty chemicals, 2010-present), a Director of Teradata Corporation (data warehousing and technology solutions, 2008-present), Chemical Financial Corporation, Maersk Inc. (industrial conglomerate), Tyco International, Inc. (multinational manufacturing and services, 2007-present), and a member of the Advisory Board for Metalmark Capital (private equity investment, 2005-present). Mr. Stavropoulos is a special advisor to Clayton, Dubilier & Rice, LLC (private equity investment). In addition, Mr. Stavropoulos is a member of the University of Notre Dame Advisory Council for the College of Science. |
David M. Thomas (63) |
| Year of Election or Appointment: 2008 Previously, Mr. Thomas served as Executive Chairman (2005-2006) and Chairman and Chief Executive Officer (2000-2005) of IMS Health, Inc. (pharmaceutical and healthcare information solutions). In addition, Mr. Thomas serves as a member of the Board of Directors of Fortune Brands, Inc. (consumer products), and Interpublic Group of Companies, Inc. (marketing communication, 2004-present). |
Michael E. Wiley (61) |
| Year of Election or Appointment: 2008 Mr. Wiley also serves as a Director of Asia Pacific Exploration Consolidated (international oil and gas exploration and production, 2008-present). Mr. Wiley serves as a Director of Tesoro Corporation (independent oil refiner and marketer, 2005-present), and a Director of Bill Barrett Corporation (exploration and production, 2005-present). In addition, Mr. Wiley also serves as a Director of Post Oak Bank (privately-held bank, 2004-present). Previously, Mr. Wiley served as a member of the Board of Trustees of the University of Tulsa (2000-2006; 2007-2010), as a Senior Energy Advisor of Katzenbach Partners, LLC (consulting, 2006-2007), as an Advisory Director of Riverstone Holdings (private investment), Chairman, President, and CEO of Baker Hughes, Inc. (oilfield services, 2000-2004), and as Director of Spinnaker Exploration Company (exploration and production, 2001-2005). |
Annual Report
+ The information above includes each Trustee's principal occupation during the last five years and other information relating to the experience, attributes, and skills relevant to each Trustee's qualifications to serve as a Trustee, which led to the conclusion that each Trustee should serve as a Trustee for the fund.
Advisory Board Members and Executive Officers:
Correspondence intended for David A. Rosow and Garnett A. Smith may be sent to Fidelity Investments, P.O. Box 55235, Boston, MA 02205-5235. Correspondence intended for each executive officer, Edward C. Johnson 3d, and Peter S. Lynch may be sent to Fidelity Investments, 82 Devonshire Street, Boston, Massachusetts 02109.
Name, Age; Principal Occupation |
Edward C. Johnson 3d (82) |
| Year of Election or Appointment: 2011 Member of the Advisory Board of Fidelity's Equity and High Income Funds. Mr. Johnson serves as Chief Executive Officer, Chairman, and a Director of FMR LLC, and also serves as Chairman and Director of FIL Limited. Previously, Mr. Johnson served as a Trustee and Chairman of the Board of certain Fidelity Trusts, Chairman and a Director of FMR, Chairman and a Director of FMR Co., Inc., and President of FMR LLC (2006-2007). |
Peter S. Lynch (68) |
| Year of Election or Appointment: 2003 Member of the Advisory Board of Fidelity's Equity and High Income Funds. Mr. Lynch is Vice Chairman and a Director of FMR and FMR Co., Inc. In addition, Mr. Lynch serves as a Trustee of Boston College and as the Chairman of the Inner-City Scholarship Fund. Previously, Mr. Lynch served on the Special Olympics International Board of Directors (1997-2006). |
David A. Rosow (69) |
| Year of Election or Appointment: 2012 Member of the Advisory Board of Fidelity's Equity and High Income Funds. Chairman and Chief Executive Officer of International Golf Group, Inc. (golf course development, 1990-present). Previously, Mr. Rosow served as Chairman and Chief Executive Officer of Rosow & Company, Inc. (private investment company, 1989-2011), a Lead Director of Hudson United Bancorp (2001-2006) and as a Director of TD Banknorth (1996-2006). In addition, Mr. Rosow is a member (2008-present) and President (2009-present) of the Town Council of Palm Beach, Florida. |
Garnett A. Smith (64) |
| Year of Election or Appointment: 2012 Member of the Advisory Board of Fidelity's Equity and High Income Funds. Prior to Mr. Smith's retirement, he served as Chairman and Chief Executive Officer of Inbrand Corp. (manufacturer of personal absorbent products, 1990-1997). He also served as President (1986-1990) of Inbrand Corp. Prior to his employment with Inbrand Corp., he was employed by a retail fabric chain and North Carolina National Bank. In addition, Mr. Smith is a board member of the Jackson Hole Land Trust (2009-present). |
Kenneth B. Robins (42) |
| Year of Election or Appointment: 2008 President and Treasurer of Fidelity's Equity and High Income Funds. Mr. Robins also serves as President and Treasurer (2010-present) and Assistant Treasurer (2009-present) of other Fidelity funds and is an employee of Fidelity Investments (2004-present). Previously, Mr. Robins served as Deputy Treasurer of the Fidelity funds (2005-2008) and Treasurer and Chief Financial Officer of The North Carolina Capital Management Trust: Cash and Term Portfolios (2006-2008). |
Brian B. Hogan (47) |
| Year of Election or Appointment: 2009 Vice President of Equity and High Income Funds. Mr. Hogan also serves as President of FMR's Equity Division (2009-present). Previously, Mr. Hogan served as Senior Vice President, Equity Research of FMR (2006-2009) and as a portfolio manager. |
Thomas C. Hense (48) |
| Year of Election or Appointment: 2008 or 2010 Vice President of Fidelity's High Income (2008), Small Cap (2008), and Value (2010) Funds. Previously, Mr. Hense served as a portfolio manager for Fidelity's Institutional Money Management Group (Pyramis) (2003-2008). |
Scott C. Goebel (44) |
| Year of Election or Appointment: 2008 Secretary and Chief Legal Officer (CLO) of the Fidelity funds. Mr. Goebel also serves as Secretary of Fidelity Investments Money Management, Inc. (FIMM) (2010-present) and Fidelity Research and Analysis Company (FRAC) (2010-present); Secretary and CLO of The North Carolina Capital Management Trust: Cash and Term Portfolios (2008-present); General Counsel, Secretary, and Senior Vice President of FMR (2008-present) and FMR Co., Inc. (2008-present); employed by FMR LLC or an affiliate (2001-present); Chief Legal Officer of Fidelity Management & Research (Hong Kong) Limited (2008-present) and Assistant Secretary of Fidelity Management & Research (Japan) Inc. (2008-present), and Fidelity Management & Research (U.K.) Inc. (2008-present). Previously, Mr. Goebel served as Assistant Secretary of FIMM (2008-2010), FRAC (2008-2010), and the Funds (2007-2008) and as Vice President and Secretary of Fidelity Distributors Corporation (FDC) (2005-2007). |
William C. Coffey (43) |
| Year of Election or Appointment: 2009 Assistant Secretary of Fidelity's Equity and High Income Funds. Mr. Coffey also serves as Senior Vice President and Deputy General Counsel of FMR LLC (2010-present), and is an employee of Fidelity Investments. Previously, Mr. Coffey served as Vice President and Associate General Counsel of FMR LLC (2005-2009). |
Elizabeth Paige Baumann (44) |
| Year of Election or Appointment: 2012 Anti-Money Laundering (AML) Officer of the Fidelity funds. Ms. Baumann also serves as AML Officer of The North Carolina Capital Management Trust: Cash and Term Portfolios (2012-present), Chief AML Officer of FMR LLC (2012-present), and is an employee of Fidelity Investments. Previously, Ms. Baumann served as Vice President and Deputy Anti-Money Laundering Officer (2007-2012). |
Christine Reynolds (53) |
| Year of Election or Appointment: 2008 Chief Financial Officer of the Fidelity funds. Ms. Reynolds became President of Fidelity Pricing and Cash Management Services (FPCMS) in August 2008. Ms. Reynolds served as Chief Operating Officer of FPCMS (2007-2008). Previously, Ms. Reynolds served as President, Treasurer, and Anti-Money Laundering officer of the Fidelity funds (2004-2007). |
Joseph A. Hanlon (44) |
| Year of Election or Appointment: 2012 Chief Compliance Officer of Fidelity's Equity and High Income Funds. Mr. Hanlon serves as Compliance Officer of FMR, FMR Co., Inc., Fidelity Investments Money Management, Inc. (FIMM), Fidelity Research and Analysis Company (FRAC), Fidelity Management & Research (Japan) Inc., Fidelity Management & Research (U.K.) Inc., Fidelity Management & Research (Hong Kong), and Strategic Advisers, Inc. (2009-present), as Senior Vice President of the Fidelity Asset Management Division (2009-present), and is an employee of Fidelity Investments. |
Joseph F. Zambello (55) |
| Year of Election or Appointment: 2011 Deputy Treasurer of the Fidelity funds. Mr. Zambello is an employee of Fidelity Investments. Previously, Mr. Zambello served as Vice Presidentof FMR's Program Management Group (2009-2011) and Vice President of the Transfer Agent Oversight Group (2005-2009). |
Adrien E. Deberghes (44) |
| Year of Election or Appointment: 2008 Deputy Treasurer of Fidelity's Equity and High Income Funds. Mr. Deberghes also serves as Vice President (2011-present) and Assistant Treasurer (2010-present) of other Fidelity funds, and is an employee of Fidelity Investments (2008-present). Previously, Mr. Deberghes served as Senior Vice President of Mutual Fund Administration at State Street Corporation (2007-2008), Senior Director of Mutual Fund Administration at Investors Bank & Trust (2005-2007), and Director of Finance for Dunkin' Brands (2000-2005). |
Stephanie J. Dorsey (43) |
| Year of Election or Appointment: 2010 Assistant Treasurer of Fidelity's Equity and High Income Funds. Ms. Dorsey also serves as Deputy Treasurer of other Fidelity funds (2008-present) and is an employee of Fidelity Investments (2008-present). Previously, Ms. Dorsey served as Treasurer (2004-2008) of the JPMorgan Mutual Funds and Vice President (2004-2008) of JPMorgan Chase Bank. |
John R. Hebble (54) |
| Year of Election or Appointment: 2009 Assistant Treasurer of Fidelity's Equity and High Income Funds. Mr. Hebble also serves as President (2011-present), Treasurer, and Chief Financial Officer of The North Carolina Capital Management Trust: Cash and Term Portfolios (2008-present), President and Treasurer of other Fidelity funds (2008-present) and is an employee of Fidelity Investments. |
Gary W. Ryan (53) |
| Year of Election or Appointment: 2005 Assistant Treasurer of the Fidelity funds. Mr. Ryan is an employee of Fidelity Investments. Previously, Mr. Ryan served as Vice President of Fund Reporting in Fidelity Pricing and Cash Management Services (FPCMS) (1999-2005). |
Jonathan Davis (44) |
| Year of Election or Appointment: 2010 Assistant Treasurer of the Fidelity funds. Mr. Davis is also Assistant Treasurer of Fidelity Rutland Square Trust II and Fidelity Commonwealth Trust II. Mr. Davis is an employee of Fidelity Investments. Previously, Mr. Davis served as Vice President and Associate General Counsel of FMR LLC (2003-2010). |
Annual Report
The Board of Trustees of Fidelity Small Cap Growth Fund voted to pay to shareholders of record at the opening of business, the following distributions per share derived from capital gains realized from sales of portfolio securities, and dividends derived from net investment income:
| Pay Date | Record Date | Capital Gains |
Class A | 09/10/12 | 09/07/12 | $0.582 |
Class T | 09/10/12 | 09/07/12 | $0.582 |
Class B | 09/10/12 | 09/07/12 | $0.582 |
Class C | 09/10/12 | 09/07/12 | $0.582 |
The fund hereby designates as a capital gain dividend with respect to the taxable year ended July 31,2012, $80,163,961, or, if subsequently determined to be different, the net capital gain of such year.
The fund will notify shareholders in January 2013 of amounts for use in preparing 2012 income tax returns.
Annual Report
Board Approval of Investment Advisory Contracts and Management Fees
Fidelity Small Cap Growth Fund
Each year, the Board of Trustees, including the Independent Trustees (together, the Board), votes on the renewal of the management contract and sub-advisory agreements (together, the Advisory Contracts) for the fund. The Board, assisted by the advice of fund counsel and Independent Trustees' counsel, requests and considers a broad range of information relevant to the renewal of the Advisory Contracts throughout the year.
The Board meets regularly and, at each of its meetings, considers factors that are relevant to its annual consideration of the renewal of the fund's Advisory Contracts, including the services and support provided to the fund and its shareholders. The Board has established various standing committees, each composed of and chaired by Independent Trustees with varying backgrounds, to which the Board has assigned specific subject matter responsibilities in order to enhance effective decision-making by the Board. The Board, acting directly and through its Committees, requests and receives information concerning the annual consideration of the renewal of the fund's Advisory Contracts. The Board also meets as needed to consider matters specifically related to the Board's annual consideration of the renewal of Advisory Contracts. Members of the Board may also meet with trustees of other Fidelity funds through ad hoc joint committees to discuss certain matters relevant to the Fidelity funds.
At its July 2012 meeting, the Board of Trustees, including the Independent Trustees, unanimously determined to renew the fund's Advisory Contracts. In reaching its determination, the Board considered all factors it believed relevant, including (i) the nature, extent, and quality of the services to be provided to the fund and its shareholders (including the investment performance of the fund); (ii) the competitiveness of the fund's management fee and total expense ratio relative to peer funds; (iii) the total costs of the services to be provided by and the profits to be realized by Fidelity from its relationship with the fund; (iv) the extent to which economies of scale exist and would be realized as the fund grows; and (v) whether fee levels reflect these economies of scale, if any, for the benefit of fund shareholders.
In considering whether to renew the Advisory Contracts for the fund, the Board reached a determination, with the assistance of fund counsel and Independent Trustees' counsel and through the exercise of its business judgment, that the renewal of the Advisory Contracts is in the best interests of the fund and its shareholders and that the compensation payable under the Advisory Contracts is fair and reasonable. The Board's decision to renew the Advisory Contracts was not based on any single factor, but rather was based on a comprehensive consideration of all the information provided to the Board at its meetings throughout the year. The Board, in reaching its determination to renew the Advisory Contracts, is aware that shareholders in the fund have a broad range of investment choices available to them, including a wide choice among mutual funds offered by Fidelity's competitors, and that the fund's shareholders, who have the opportunity to review and weigh the disclosure provided by the fund in its prospectus and other public disclosures, have chosen to invest in this fund, managed by Fidelity.
Annual Report
Board Approval of Investment Advisory Contracts and
Management Fees - continued
Nature, Extent, and Quality of Services Provided. The Board considered the staffing within the investment adviser, FMR, and the sub-advisers (together, the Investment Advisers), including the backgrounds of the fund's investment personnel, and also considered the fund's investment objective, strategies, and related investment philosophy. The Independent Trustees also had discussions with senior management of Fidelity's investment operations and investment groups. The Board considered the structure of the portfolio manager compensation program and whether this structure provides appropriate incentives to act in the best interests of the fund.
Resources Dedicated to Investment Management and Support Services. The Board and the Fund Oversight and Research Committees reviewed the general qualifications and capabilities of the Investment Advisers' investment staff, including its size, education, experience, and resources, as well as the Investment Advisers' approach to recruiting, training, managing, and compensating investment personnel. The Board also noted that FMR has continued to increase the resources devoted to non-U.S. offices, including expansion of Fidelity's global investment organization. The Board noted that Fidelity's analysts have extensive resources, tools and capabilities that allow them to conduct sophisticated quantitative and fundamental analysis, as well as credit analysis of issuers, counterparties and guarantors. The Board also believes that Fidelity's investment professionals have sufficient access to global information and data so as to provide competitive investment results over time, and that those professionals also have access to sophisticated tools that permit them to assess portfolio construction and risk and performance attribution characteristics continuously, as well as to transmit new information and research conclusions rapidly around the world. Additionally, in its deliberations, the Board considered the Investment Advisers' trading and risk management capabilities and resources, which are an integral part of the investment management process.
Shareholder and Administrative Services. The Board considered (i) the nature, extent, quality, and cost of advisory, administrative, and shareholder services performed by the Investment Advisers and their affiliates under the Advisory Contracts and under separate agreements covering transfer agency, pricing and bookkeeping, and securities lending services for the fund; (ii) the nature and extent of the supervision of third party service providers, principally custodians and subcustodians; and (iii) the resources devoted to, and the record of compliance with, the fund's compliance policies and procedures. The Board also reviewed the allocation of fund brokerage, including allocations to brokers affiliated with the Investment Advisers, the use of brokerage commissions to pay fund expenses, and the use of "soft" commission dollars to pay for research services.
Annual Report
The Board noted that the growth of fund assets over time across the complex allows Fidelity to reinvest in the development of services designed to enhance the value or convenience of the Fidelity funds as investment vehicles. These services include 24-hour access to account information and market information through telephone representatives and over the Internet, investor education materials and asset allocation tools, and the expanded availability of Fidelity Investor Centers.
Investment in a Large Fund Family. The Board considered the benefits to shareholders of investing in a Fidelity fund, including the benefits of investing in a fund that is part of a large family of funds offering a variety of investment disciplines and providing a large variety of mutual fund investor services. The Board noted that Fidelity had taken, or had made recommendations that resulted in the Fidelity funds taking, a number of actions over the previous year that benefited particular funds, including (i) continuing to dedicate additional resources to investment research and support of the senior management team that oversees asset management; (ii) persisting in efforts to enhance Fidelity's research capabilities, in particular, international research; (iii) launching new funds and making other enhancements to meet client needs for global and income-oriented solutions; (iv) continuing to launch dedicated lower cost underlying funds to meet investment management's portfolio construction needs related to expanding underlying fund options, specifically for the Freedom Fund product lines; (v) adopting a "Stock Selector" sector neutral investment approach and employing a team of portfolio managers who are sector specialists to manage certain funds; (vi) rationalizing product lines and gaining increased efficiencies through the mergers of several funds into other funds; (vii) strengthening the Spartan Index Fund product line by adding new funds and/or new low-cost institutional share classes, restructuring fund expenses to accommodate new classes, and reducing investment minimums for certain classes of shares; (viii) modifying the eligibility criteria for Institutional Class shares to increase their appeal to government entities and charitable investors; and (ix) reducing certain transfer agent fee rates.
Investment Performance. The Board considered whether the fund has operated in accordance with its investment objective, as well as its record of compliance with its investment restrictions. It also reviewed the fund's absolute investment performance for each class, as well as the fund's relative investment performance for each class measured over multiple periods against (i) a broad-based securities market index, and (ii) a peer group of mutual funds deemed appropriate by Fidelity and reviewed by the Board. The following charts considered by the Board show, over the one-, three-, and five-year periods ended December 31, 2011, the cumulative total returns of Institutional Class (Class I) and Class B of the fund, the cumulative total returns of a broad-based securities market index ("benchmark"), and a range of cumulative total returns of a peer group of mutual funds identified by Morningstar, Inc. as having an investment style similar to that of the fund based on underlying portfolio holdings. The returns of Institutional Class (Class I) and Class B show the performance of the highest and lowest performing classes, respectively (based on five-year performance). The box within each chart shows the 25th percentile return (top of box) and the 75th percentile return (bottom of box) of the peer group. Returns shown above the box are in the first quartile and returns shown below the box are in the fourth quartile. The percentage beaten numbers noted below each chart correspond to the percentile box and represent the percentage of funds in the peer group whose performance was equal to or lower than that of the class indicated.
Annual Report
Board Approval of Investment Advisory Contracts and
Management Fees - continued
Fidelity Small Cap Growth Fund

The Board reviewed the fund's relative investment performance against its peer group and noted that the performance of Institutional Class (Class I) of the fund was in the second quartile for all the periods shown. The Board also noted that the investment performance of Institutional Class (Class I) of the fund compared favorably to its benchmark for all the periods shown. The Board considered that the variations in performance among the fund's classes reflect the variations in class expenses, which result in lower performance for higher expense classes. The Board noted that there was a portfolio management change for the fund in November 2011. The Board also reviewed the fund's performance since inception as well as performance in the current year.
The Board also considered that the fund's management fee is subject to upward or downward adjustment depending upon whether, and to what extent, the fund's investment performance for the performance period exceeds, or is exceeded by, the record (over the same period) of a Board-approved performance adjustment index. The Board noted that the performance adjustment provides FMR with a strong economic incentive to seek to achieve superior performance for the fund's shareholders and helps to more closely align the interests of FMR and the fund's shareholders.
Annual Report
Based on its review, the Board concluded that the nature, extent, and quality of services provided to the fund under the Advisory Contracts should benefit the fund's shareholders.
Competitiveness of Management Fee and Total Expense Ratio. The Board considered the fund's management fee and total expense ratio compared to "mapped groups" of competitive funds and classes. Fidelity creates "mapped groups" by combining similar Lipper investment objective categories that have comparable management fee characteristics. Combining Lipper investment objective categories aids the Board's management fee and total expense ratio comparisons by broadening the competitive group used for comparison and by reducing the number of universes to which various Fidelity funds are compared.
Management Fee. The Board considered two proprietary management fee comparisons for the 12-month periods shown in the chart below. The group of Lipper funds used by the Board for management fee comparisons is referred to below as the "Total Mapped Group." The Total Mapped Group comparison focuses on a fund's standing relative to the total universe of comparable funds available to investors in terms of gross management fees before expense reimbursements or caps, and without giving effect to the fund's performance adjustment. "TMG %" represents the percentage of funds in the Total Mapped Group that had management fees that were lower than the fund's. For example, a TMG % of 13% means that 87% of the funds in the Total Mapped Group had higher management fees than the fund. The "Asset-Size Peer Group" (ASPG) comparison focuses on a fund's standing relative to non-Fidelity funds similar in size to the fund within the Total Mapped Group. The ASPG represents at least 15% of the funds in the Total Mapped Group with comparable asset size and management fee characteristics, subject to a minimum of 50 funds (or all funds in the Total Mapped Group if fewer than 50). Additional information, such as the ASPG quartile in which the fund's management fee ranked and the impact of the fund's performance adjustment, is also included in the chart and considered by the Board.
Annual Report
Board Approval of Investment Advisory Contracts and
Management Fees - continued
Fidelity Small Cap Growth Fund

The Board noted that the fund's management fee ranked below the median of its Total Mapped Group and below the median of its ASPG for 2011. The Board also noted the effect of the fund's performance adjustment on the fund's management fee ranking. The Board noted that the performance adjustment for each year represents calculations for performance periods that differ from the periods shown in the performance charts above.
Based on its review, the Board concluded that the fund's management fee is fair and reasonable in light of the services that the fund receives and the other factors considered.
Total Expense Ratio. In its review of each class's total expense ratio, the Board considered the fund's management fee as well as other fund or class expenses, as applicable, such as transfer agent fees, pricing and bookkeeping fees, fund-paid 12b-1 fees, and custodial, legal, and audit fees. The Board also noted the effects of any waivers and reimbursements on fees and expenses, as well as the impact of the fund's performance adjustment. As part of its review, the Board also considered the current and historical total expense ratios of each class of the fund compared to competitive fund median expenses. Each class of the fund is compared to those funds and classes in the Total Mapped Group (used by the Board for management fee comparisons) that have a similar sales load structure.
The Board noted that the total expense ratio of each of Class A, Class B, Class C, Institutional Class, the retail class, and Class F ranked below its competitive median for 2011 and the total expense ratio of Class T ranked above its competitive median for 2011. The Board considered that various factors, including 12b-1 fees, positive or negative performance adjustments, and relatively higher other expenses in the case of small fund size, can affect total expense ratios. The Board noted that the total expense ratio of Class T was above the competitive median primarily because of higher 12b-1 fees on Class T. Class T has a higher 12b-1 fee, but a lower front-end sales charge, than traditionally priced front-end sales charge classes. The Board considered that Class T is primarily sold load-waived in the retirement plan market where its 0.50% 12b-1 fee is comparable to competing no-load, higher 12b-1 fee classes designed specifically for retirement plans. The Board noted that the fund offers multiple classes, each of which has a different sales load and 12b-1 fee structure, and that the multiple structures are intended to offer a range of pricing options for the intermediary market. The Board also noted that the total expense ratios of the classes vary primarily by the level of their 12b-1 fees, although differences in transfer agent fees may also cause expenses to vary from class to class.
Annual Report
Fees Charged to Other Fidelity Clients. The Board also considered Fidelity fee structures and other information with respect to clients of FMR and its affiliates, such as other mutual funds advised or subadvised by FMR or its affiliates, pension plan clients, and other institutional clients. The Board noted the findings of the 2010 ad hoc joint committee (created with the board of other Fidelity funds), which reviewed and compared Fidelity's institutional investment advisory business with its business of providing services to the Fidelity funds, including the differences in services provided, fees charged, and costs incurred, as well as competition in their respective marketplaces.
Based on its review of total expense ratios and fees charged to other Fidelity clients, the Board concluded that the total expense ratio of each class of the fund was reasonable, although Class T was above the median of the universe presented for comparison, in light of the services that the fund and its shareholders receive and the other factors considered.
Costs of the Services and Profitability. The Board considered the revenues earned and the expenses incurred by Fidelity in conducting the business of developing, marketing, distributing, managing, administering and servicing the fund and its shareholders. The Board also considered the level of Fidelity's profits in respect of all the Fidelity funds.
On an annual basis, FMR presents to the Board Fidelity's profitability for the fund. Fidelity calculates the profitability for each fund, as well as aggregate profitability for groups of Fidelity funds and all Fidelity funds, using a series of detailed revenue and cost allocation methodologies which originate with the books and records of Fidelity on which Fidelity's audited financial statements are based. The Audit Committee of the Board reviews any significant changes from the prior year's methodologies.
PricewaterhouseCoopers LLP (PwC), independent registered public accounting firm and auditor to Fidelity and certain Fidelity funds, has been engaged annually by the Board as part of the Board's assessment of Fidelity's profitability analysis. PwC's engagement includes the review and assessment of Fidelity's methodologies used in determining the revenues and expenses attributable to Fidelity's mutual fund business, and completion of agreed-upon procedures surrounding the mathematical accuracy of fund profitability and its conformity to allocation methodologies. After considering PwC's reports issued under the engagement and information provided by Fidelity, the Board concluded that while other allocation methods may also be reasonable, Fidelity's profitability methodologies are reasonable in all material respects.
Annual Report
Board Approval of Investment Advisory Contracts and
Management Fees - continued
The Board also reviewed Fidelity's non-fund businesses and fall-out benefits related to the mutual fund business as well as cases where Fidelity's affiliates may benefit from or be related to the fund's business.
The Board considered the costs of the services provided by and the profits realized by Fidelity in connection with the operation of the fund and was satisfied that the profitability was not excessive in the circumstances.
Economies of Scale. The Board considered whether there have been economies of scale in respect of the management of the Fidelity funds, whether the Fidelity funds (including the fund) have appropriately benefited from any such economies of scale, and whether there is potential for realization of any further economies of scale. The Board considered the extent to which the fund will benefit from economies of scale through increased services to the fund, through waivers or reimbursements, or through fee or expense reductions. The Board also noted that in 2009, it and the board of other Fidelity funds created an ad hoc committee (the Economies of Scale Committee) to analyze whether FMR attains economies of scale in respect of the management and servicing of the Fidelity funds, whether the Fidelity funds have appropriately benefited from such economies of scale, and whether there is potential for realization of any further economies of scale.
The Board recognized that the fund's management contract incorporates a "group fee" structure, which provides for lower group fee rates as total fund assets under FMR's management increase, and for higher group fee rates as total fund assets under FMR's management decrease. FMR calculates the group fee rates based on a tiered asset "breakpoint" schedule that varies based on asset class. The Board considered that the group fee is designed to deliver the benefits of economies of scale to fund shareholders when total Fidelity fund assets increase, even if assets of any particular fund are unchanged or have declined, because some portion of Fidelity's costs are attributable to services provided to all Fidelity funds, and all funds benefit if those costs can be allocated among more assets. The Board concluded that, given the group fee structure, fund shareholders will benefit from lower management fees as assets under FMR's management increase at the fund complex level, regardless of whether Fidelity achieves any such economies of scale.
Annual Report
The Board concluded, taking into account the analysis of the Economies of Scale Committee, that economies of scale, if any, are being appropriately shared between fund shareholders and Fidelity.
Additional Information Requested by the Board. In order to develop fully the factual basis for consideration of the Fidelity funds' Advisory Contracts, the Board requested and received additional information on certain topics, including (i) fund performance trends, actions to be taken by FMR to improve certain funds' overall performance, and Fidelity's long-term strategies for certain funds; (ii) the potential to further rationalize the Fidelity fund lineup with the possibility of achieving savings for the funds and Fidelity; (iii) Fidelity's compensation structure for portfolio managers and other key investment personnel; (iv) the amount of the investment that each portfolio manager has made in the Fidelity fund(s) that he or she manages; (v) the realization of fall-out benefits in certain Fidelity business units; (vi) Fidelity's group fee structures, the potential impact of regulatory changes on such structures, and the rationale for the individual fee rates of certain funds; (vii) fund profitability methodology, including Fidelity's cost allocation methodology, and the impact of certain factors on fund profitability results; (viii) trends regarding industry use of performance fee structures and the possibility of implementing performance fee structures for additional funds; and (ix) the impact of net redemptions from the Fidelity funds.
Based on its evaluation of all of the conclusions noted above, and after considering all factors it believed relevant, the Board ultimately concluded that the advisory fee structures are fair and reasonable, and that the fund's Advisory Contracts should be renewed.
Annual Report
Investment Adviser
Fidelity Management & Research Company
Boston, MA
Investment Sub-Advisers
FMR Co., Inc.
Fidelity Management & Research
(U.K.) Inc.
Fidelity Management & Research
(Hong Kong) Limited
Fidelity Management & Research
(Japan) Inc.
General Distributor
Fidelity Distributors Corporation
Smithfield, RI
Transfer and Service Agents
Fidelity Investments Institutional
Operations Company, Inc.
Boston, MA
Fidelity Service Company, Inc.
Boston, MA
Custodian
Citibank, N.A.
New York, NY
(Fidelity Investment logo)(registered trademark)
ASCP-UANN-0912
1.803713.107
Fidelity®
Series Small Cap Opportunities
Fund
Fidelity Series Small Cap Opportunities Fund
Class F
Annual Report
July 31, 2012
(Fidelity Cover Art)
Contents
Performance | (Click Here) | How the fund has done over time. |
Management's Discussion of Fund Performance | (Click Here) | The Portfolio Managers' review of fund performance and strategy. |
Shareholder Expense Example | (Click Here) | An example of shareholder expenses. |
Investment Changes | (Click Here) | A summary of major shifts in the fund's investments over the past six months. |
Investments | (Click Here) | A complete list of the fund's investments with their market values. |
Financial Statements | (Click Here) | Statements of assets and liabilities, operations, and changes in net assets, as well as financial highlights. |
Notes | (Click Here) | Notes to the financial statements. |
Report of Independent Registered Public Accounting Firm | (Click Here) | |
Trustees and Officers | (Click Here) | |
Distributions | (Click Here) | |
Board Approval of Investment Advisory Contracts and Management Fees | (Click Here) | |
To view a fund's proxy voting guidelines and proxy voting record for the 12-month period ended June 30, visit http://www.fidelity.com/proxyvotingresults or visit the Securities and Exchange Commission's (SEC) web site at http://www.sec.gov. You may also call 1-800-544-8544 for Fidelity® Series Small Cap Opportunities Fund or 1-800-835-5092 for Class F of the fund to request a free copy of the proxy voting guidelines.
Standard & Poor's, S&P and S&P 500 are registered service marks of The McGraw-Hill Companies, Inc. and have been licensed for use by Fidelity Distributors Corporation.
Other third party marks appearing herein are the property of their respective owners.
All other marks appearing herein are registered or unregistered trademarks or service marks of FMR LLC or an affiliated company. © 2012 FMR LLC. All rights reserved.
Annual Report
This report and the financial statements contained herein are submitted for the general information of the shareholders of the fund. This report is not authorized for distribution to prospective investors in the fund unless preceded or accompanied by an effective prospectus.
A fund files its complete schedule of portfolio holdings with the SEC for the first and third quarters of each fiscal year on Form N-Q. Forms N-Q are available on the SEC's web site at http://www.sec.gov. A fund's Forms N-Q may be reviewed and copied at the SEC's Public Reference Room in Washington, DC. Information regarding the operation of the SEC's Public Reference Room may be obtained by calling 1-800-SEC-0330. For a complete list of a fund's portfolio holdings, view the most recent holdings listing, semiannual report, or annual report on Fidelity's web site at http://www.fidelity.com, http://www.advisor.fidelity.com, or http://www.401k.com, as applicable.
NOT FDIC INSURED • MAY LOSE VALUE • NO BANK GUARANTEE
Neither the fund nor Fidelity Distributors Corporation is a bank.
Annual Report
Average annual total return reflects the change in the value of an investment, assuming reinvestment of the class' distributions from dividend income and capital gains (the profits earned upon the sale of securities that have grown in value, if any) and assuming a constant rate of performance each year. The $10,000 table and the fund's returns do not reflect the deduction of taxes that a shareholder would pay on fund distributions or the redemption of fund shares. During periods of reimbursement by Fidelity, a fund's total return will be greater than it would be had the reimbursement not occurred. How a fund did yesterday is no guarantee of how it will do tomorrow.
Average Annual Total Returns
Periods ended July 31, 2012 | Past 1
year | Past 5
years | Life of
fund A |
Fidelity ® Series Small Cap Opportunities Fund | -1.41% | 3.05% | 2.16% |
Class F B | -1.23% | 3.20% | 2.29% |
A From March 22, 2007.
B The initial offering of Class F shares took place on June 26, 2009. Returns prior to June 26, 2009 are those of Fidelity Series Small Cap Opportunities Fund, the original class of the fund.
$10,000 Over Life of Fund
Let's say hypothetically that $10,000 was invested in Fidelity Series Small Cap Opportunities Fund, a class of the fund, on March 22, 2007, when the fund started. The chart shows how the value of your investment would have changed, and also shows how the Russell 2000® Index performed over the same period.
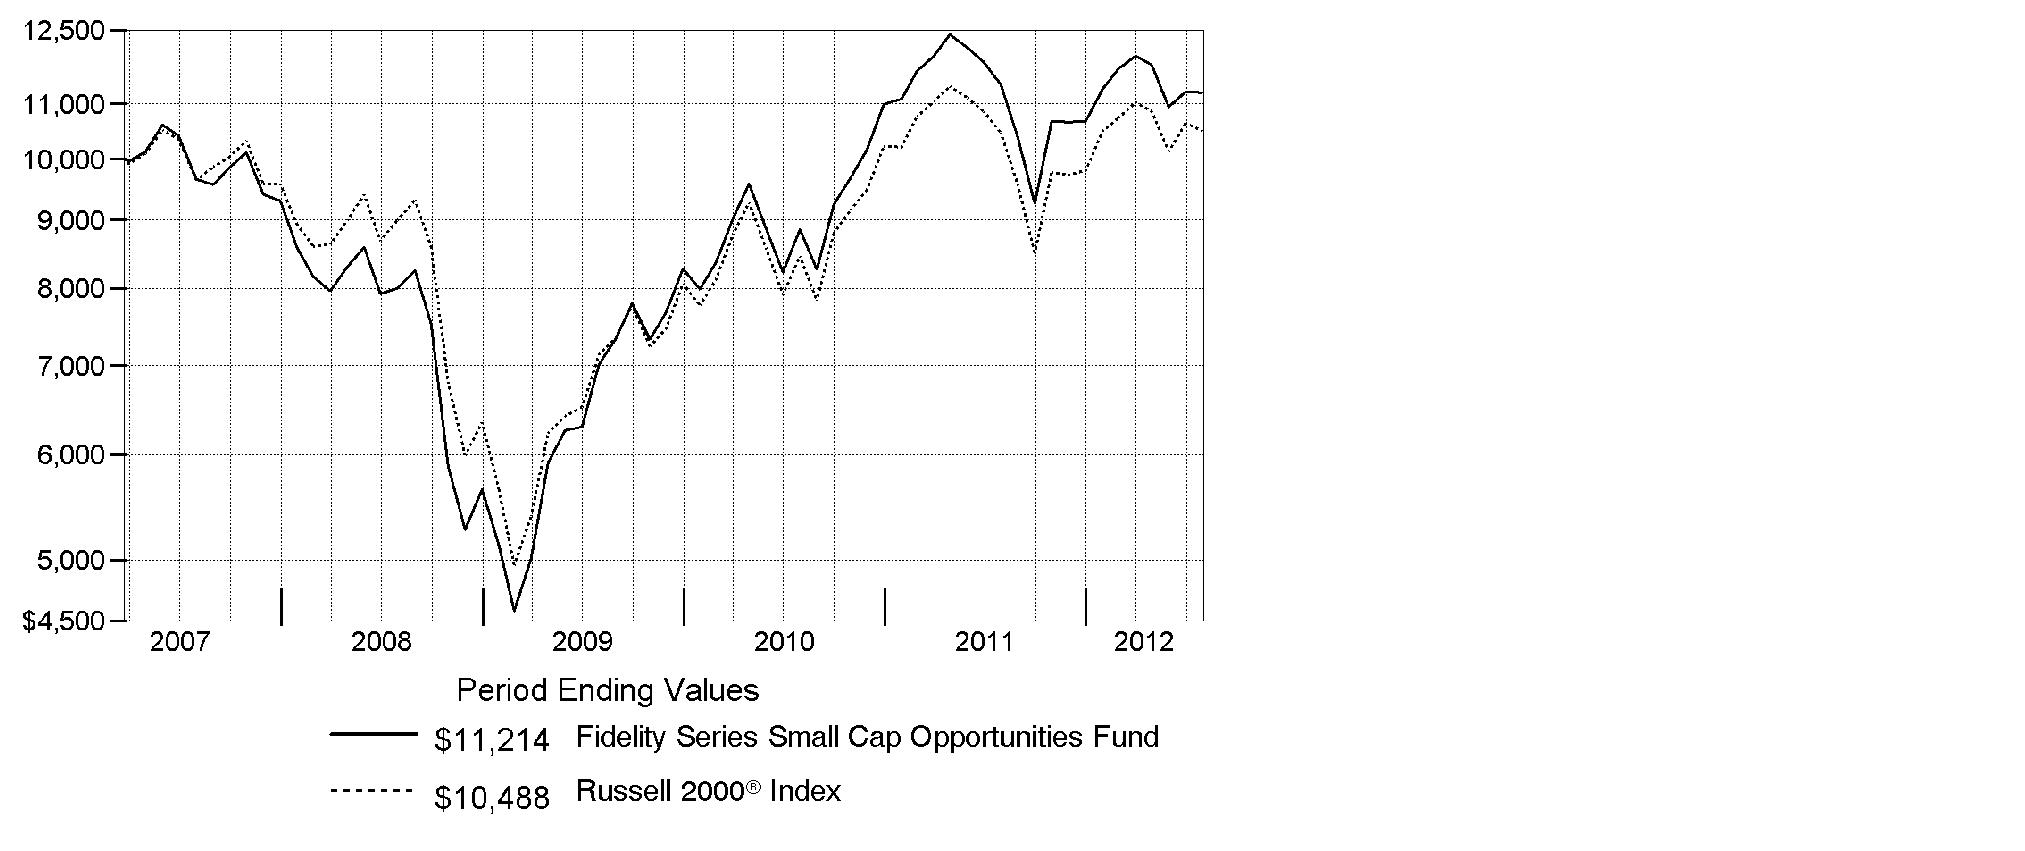
Annual Report
Market Recap: Major U.S. equity benchmarks posted solid gains for the year ending July 31, 2012, amid an uncertain investment environment. The broad-based S&P 500® Index returned 9.13%, while the blue-chip-laden Dow Jones Industrial AverageSM and technology-heavy Nasdaq Composite® Index gained 10.12% and 7.83%, respectively. Volatility spiked during the period's first half, as equities plummeted late last summer on Europe's debt woes, political wrangling over the U.S. debt ceiling and the sovereign credit-rating downgrade that followed. By October, a seemingly improved U.S. economy rejuvenated stocks, paving the way for major equity benchmarks to post their best first-quarter performance since 1998. However, more eurozone trouble, signs that the U.S. economy had turned sluggish and a slowdown in China caused stocks to slip in May, before a new wave of optimism took hold in June and July. Within the S&P 500®, more-defensive sectors such as telecommunication services (+30%) and consumer staples (+20%) fared best, while materials and energy significantly underperformed, returning -5%. Small- and mid-cap stocks trailed their less-volatile large-cap counterparts, with the Russell 2000® Index adding 0.19% and the Russell Midcap® Index rising 2.28%. Given turmoil and local currency weakness in Europe, foreign developed-markets stocks lost ground, with the MSCI® EAFE® Index returning -11.32%.
Comments from Shadman Riaz and Rayna Lesser, Co-Portfolio Managers of Fidelity® Series Small Cap Opportunities Fund, as part of Fidelity's Stock Selector Small Cap Team: For the year, the fund's Series Small Cap Opportunities and Class F shares returned -1.41% and -1.23%, respectively, lagging the Russell 2000®. Unproductive picks in consumer discretionary, consumer staples, financials and telecommunication services overshadowed strong stock choices in technology, energy and health care. Three underperforming non-index names hurt the most: Green Mountain Coffee Roasters, wholesale wireless network operator Clearwire and premium bedding manufacturer Tempur-Pedic International. Despite strong picks in tech, wireless chipmaker RF Micro Devices and online travel deals publisher Travelzoo weighed on results. We sold Tempur-Pedic and Travelzoo by period end. Conversely, an individual standout for the fund was Web.com Group, which offers full-service website solutions for small businesses. Ixia was another winner in the tech sleeve, and among retailers, non-index stakes in Canadian discount store operator Dollarama and hotel/time-share firm Wyndham Worldwide notably contributed. Advisory Board, a provider of software tools to hospitals, and Synageva BioPharma, a clinical-stage drug developer, also buoyed results.
The views expressed above reflect those of the portfolio manager(s) only through the end of the period as stated on the cover of this report and do not necessarily represent the views of Fidelity or any other person in the Fidelity organization. Any such views are subject to change at any time based upon market or other conditions and Fidelity disclaims any responsibility to update such views. These views may not be relied on as investment advice and, because investment decisions for a Fidelity fund are based on numerous factors, may not be relied on as an indication of trading intent on behalf of any Fidelity fund.
Annual Report
Shareholder Expense Example
As a shareholder of the Fund, you incur two types of costs: (1) transaction costs, and (2) ongoing costs, including management fees and other Fund expenses. This Example is intended to help you understand your ongoing costs (in dollars) of investing in the Fund and to compare these costs with the ongoing costs of investing in other mutual funds.
The Example is based on an investment of $1,000 invested at the beginning of the period and held for the entire period (February 1, 2012 to July 31, 2012).
Actual Expenses
The first line of the accompanying table for each class of the Fund provides information about actual account values and actual expenses. You may use the information in this line, together with the amount you invested, to estimate the expenses that you paid over the period. Simply divide your account value by $1,000.00 (for example, an $8,600 account value divided by $1,000.00 = 8.6), then multiply the result by the number in the first line for a class of the Fund under the heading entitled "Expenses Paid During Period" to estimate the expenses you paid on your account during this period. In addition, the Fund, as a shareholder in the underlying Fidelity Central Funds, will indirectly bear its pro-rata share of the fees and expenses incurred by the underlying Fidelity Central Funds. These fees and expenses are not included in the Fund's annualized expense ratio used to calculate the expense estimate in the table below.
Hypothetical Example for Comparison Purposes
The second line of the accompanying table for each class of the Fund provides information about hypothetical account values and hypothetical expenses based on a Class' actual expense ratio and an assumed rate of return of 5% per year before expenses, which is not the Class' actual return. The hypothetical account values and expenses may not be used to estimate the actual ending account balance or expenses you paid for the period. You may use this information to compare the ongoing costs of investing in the Fund and other funds. To do so, compare this 5% hypothetical example with the 5% hypothetical examples that appear in the shareholder reports of the other funds. In addition, the Fund, as a shareholder in the underlying Fidelity Central Funds, will indirectly bear its pro-rata share of the fees and expenses incurred by the underlying Fidelity Central Funds. These fees and expenses are not included in the Fund's annualized expense ratio used to calculate the expense estimate in the table below.
Please note that the expenses shown in the table are meant to highlight your ongoing costs only and do not reflect any transaction costs. Therefore, the second line of the table is useful in comparing ongoing costs only, and will not help you determine the relative total costs of owning different funds.
Annual Report
| Annualized
Expense Ratio | Beginning
Account Value
February 1, 2012 | Ending
Account Value
July 31, 2012 | Expenses Paid
During Period*
February 1, 2012
to July 31, 2012 |
Series Small Cap Opportunities | 1.10% | | | |
Actual | | $ 1,000.00 | $ 994.50 | $ 5.45 |
HypotheticalA | | $ 1,000.00 | $ 1,019.39 | $ 5.52 |
Class F | .90% | | | |
Actual | | $ 1,000.00 | $ 995.50 | $ 4.47 |
HypotheticalA | | $ 1,000.00 | $ 1,020.39 | $ 4.52 |
A 5% return per year before expenses
* Expenses are equal to each Class' annualized expense ratio, multiplied by the average account value over the period, multiplied by 182/366 (to reflect the one-half year period).
Annual Report
Investment Changes (Unaudited)
Top Ten Stocks as of July 31, 2012 |
| % of fund's
net assets | % of fund's net assets
6 months ago |
Colonial Properties Trust (SBI) | 1.1 | 0.9 |
Teledyne Technologies, Inc. | 1.0 | 0.9 |
UMB Financial Corp. | 1.0 | 0.0 |
Home Properties, Inc. | 1.0 | 0.9 |
National Retail Properties, Inc. | 1.0 | 1.1 |
Glimcher Realty Trust | 0.9 | 1.4 |
Ramco-Gershenson Properties Trust (SBI) | 0.9 | 0.9 |
National Penn Bancshares, Inc. | 0.9 | 1.0 |
American Assets Trust, Inc. | 0.9 | 1.1 |
Highwoods Properties, Inc. (SBI) | 0.9 | 1.1 |
| 9.6 | |
Top Five Market Sectors as of July 31, 2012 |
| % of fund's
net assets | % of fund's net assets
6 months ago |
Financials | 20.3 | 20.4 |
Information Technology | 16.6 | 17.7 |
Industrials | 13.7 | 14.7 |
Consumer Discretionary | 13.5 | 13.1 |
Health Care | 12.8 | 9.6 |
Asset Allocation (% of fund's net assets) |
As of July 31, 2012 * | As of January 31, 2012 ** |
 | Stocks and
Equity Futures 95.4% | | | Stocks and
Equity Futures 94.4% | |
 | Convertible
Securities 0.1% | | | Convertible
Securities 0.2% | |
 | Short-Term
Investments and
Net Other Assets
(Liabilities) 4.5% | | | Short-Term
Investments and
Net Other Assets
(Liabilities) 5.4% | |
* Foreign investments | 7.2% | | ** Foreign investments | 7.5% | |

Annual Report
Investments July 31, 2012
Showing Percentage of Net Assets
Common Stocks - 94.6% |
| Shares | | Value |
CONSUMER DISCRETIONARY - 13.5% |
Auto Components - 1.2% |
Gentex Corp. | 563,650 | | $ 9,024,037 |
Tenneco, Inc. (a) | 586,686 | | 17,184,033 |
| | 26,208,070 |
Hotels, Restaurants & Leisure - 2.3% |
BJ's Restaurants, Inc. (a) | 275,700 | | 10,912,206 |
Chuys Holdings, Inc. | 42,500 | | 739,925 |
Cracker Barrel Old Country Store, Inc. | 208,812 | | 13,084,160 |
Life Time Fitness, Inc. (a) | 384,699 | | 17,469,182 |
Wyndham Worldwide Corp. | 200,300 | | 10,425,615 |
| | 52,631,088 |
Household Durables - 1.2% |
Ethan Allen Interiors, Inc. | 611,990 | | 12,625,354 |
Skullcandy, Inc. (a)(d) | 929,035 | | 13,387,394 |
| | 26,012,748 |
Media - 1.5% |
Cinemark Holdings, Inc. | 606,033 | | 14,169,052 |
John Wiley & Sons, Inc. Class A | 300,534 | | 14,320,445 |
MDC Partners, Inc. Class A (sub. vtg.) | 603,200 | | 5,676,113 |
| | 34,165,610 |
Multiline Retail - 0.7% |
Dollarama, Inc. | 254,066 | | 15,833,998 |
Specialty Retail - 4.2% |
Ascena Retail Group, Inc. (a) | 952,660 | | 17,471,784 |
DSW, Inc. Class A | 280,558 | | 16,586,589 |
Express, Inc. (a) | 864,983 | | 13,926,226 |
GameStop Corp. Class A | 472,300 | | 7,566,246 |
Jos. A. Bank Clothiers, Inc. (a) | 322,275 | | 13,619,342 |
Shoe Carnival, Inc. | 499,973 | | 11,099,401 |
Signet Jewelers Ltd. | 337,400 | | 14,818,608 |
| | 95,088,196 |
Textiles, Apparel & Luxury Goods - 2.4% |
Hanesbrands, Inc. (a) | 371,065 | | 11,139,371 |
Iconix Brand Group, Inc. (a) | 677,610 | | 12,014,025 |
PVH Corp. | 180,500 | | 14,337,115 |
Common Stocks - continued |
| Shares | | Value |
CONSUMER DISCRETIONARY - continued |
Textiles, Apparel & Luxury Goods - continued |
Steven Madden Ltd. (a) | 416,861 | | $ 16,853,690 |
Vera Bradley, Inc. (a) | 198 | | 4,512 |
| | 54,348,713 |
TOTAL CONSUMER DISCRETIONARY | | 304,288,423 |
CONSUMER STAPLES - 3.5% |
Food & Staples Retailing - 2.1% |
Casey's General Stores, Inc. | 248,640 | | 14,776,675 |
Fresh Market, Inc. (a)(d) | 175,386 | | 10,328,482 |
Susser Holdings Corp. (a) | 273,880 | | 9,889,807 |
United Natural Foods, Inc. (a) | 243,855 | | 13,241,327 |
| | 48,236,291 |
Food Products - 0.5% |
Calavo Growers, Inc. | 279,527 | | 7,541,638 |
Green Mountain Coffee Roasters, Inc. (a) | 147,200 | | 2,687,872 |
| | 10,229,510 |
Household Products - 0.5% |
Spectrum Brands Holdings, Inc. | 299,592 | | 11,033,973 |
Personal Products - 0.4% |
Elizabeth Arden, Inc. (a) | 260,784 | | 10,173,184 |
TOTAL CONSUMER STAPLES | | 79,672,958 |
ENERGY - 5.9% |
Energy Equipment & Services - 1.0% |
Atwood Oceanics, Inc. (a) | 266,900 | | 11,885,057 |
Total Energy Services, Inc. | 692,550 | | 9,806,262 |
| | 21,691,319 |
Oil, Gas & Consumable Fuels - 4.9% |
Atlas Pipeline Partners, LP | 441,938 | | 14,694,439 |
Berry Petroleum Co. Class A | 403,746 | | 15,350,423 |
Cheniere Energy, Inc. (a) | 287,133 | | 3,913,623 |
Cloud Peak Energy, Inc. (a) | 746,500 | | 12,354,575 |
Energen Corp. | 76,438 | | 3,914,390 |
PDC Energy, Inc. (a) | 585,978 | | 15,352,624 |
Stone Energy Corp. (a) | 600,600 | | 15,771,756 |
Common Stocks - continued |
| Shares | | Value |
ENERGY - continued |
Oil, Gas & Consumable Fuels - continued |
Targa Resources Corp. | 377,100 | | $ 16,611,255 |
Western Refining, Inc. (d) | 580,860 | | 13,667,636 |
| | 111,630,721 |
TOTAL ENERGY | | 133,322,040 |
FINANCIALS - 20.3% |
Capital Markets - 2.5% |
Affiliated Managers Group, Inc. (a) | 90,800 | | 10,132,372 |
Duff & Phelps Corp. Class A | 1,062,577 | | 15,662,385 |
Knight Capital Group, Inc. Class A (a) | 1,299,885 | | 13,427,812 |
Waddell & Reed Financial, Inc. Class A | 598,541 | | 17,411,558 |
| | 56,634,127 |
Commercial Banks - 6.6% |
Associated Banc-Corp. | 1,297,328 | | 16,203,627 |
BancFirst Corp. | 110,857 | | 4,503,011 |
Bank of the Ozarks, Inc. | 538,305 | | 17,328,038 |
BBCN Bancorp, Inc. (a) | 1,208,110 | | 13,699,967 |
Bridge Capital Holdings (a) | 469,767 | | 7,295,482 |
Cathay General Bancorp | 497,224 | | 8,050,057 |
City National Corp. | 339,878 | | 16,749,188 |
Columbia Banking Systems, Inc. | 455,233 | | 8,216,956 |
National Penn Bancshares, Inc. | 2,355,644 | | 20,823,893 |
PacWest Bancorp | 648,003 | | 14,845,749 |
UMB Financial Corp. | 452,500 | | 21,747,150 |
| | 149,463,118 |
Insurance - 3.0% |
Allied World Assurance Co. Holdings Ltd. | 230,600 | | 17,394,158 |
Alterra Capital Holdings Ltd. | 676,896 | | 15,751,370 |
Amerisafe, Inc. (a) | 664,700 | | 16,594,235 |
ProAssurance Corp. | 191,304 | | 17,135,099 |
| | 66,874,862 |
Real Estate Investment Trusts - 7.5% |
American Assets Trust, Inc. | 763,100 | | 19,840,600 |
Colonial Properties Trust (SBI) | 1,053,289 | | 23,856,991 |
DCT Industrial Trust, Inc. | 3,048,400 | | 19,082,984 |
Glimcher Realty Trust | 2,152,305 | | 21,566,096 |
Highwoods Properties, Inc. (SBI) | 583,400 | | 19,759,758 |
Home Properties, Inc. | 330,249 | | 21,667,637 |
Common Stocks - continued |
| Shares | | Value |
FINANCIALS - continued |
Real Estate Investment Trusts - continued |
National Retail Properties, Inc. | 733,700 | | $ 21,644,150 |
Ramco-Gershenson Properties Trust (SBI) | 1,691,550 | | 21,550,347 |
| | 168,968,563 |
Thrifts & Mortgage Finance - 0.7% |
Washington Federal, Inc. | 1,041,005 | | 16,583,210 |
TOTAL FINANCIALS | | 458,523,880 |
HEALTH CARE - 12.7% |
Biotechnology - 5.5% |
Achillion Pharmaceuticals, Inc. (a) | 758,596 | | 5,021,906 |
Alnylam Pharmaceuticals, Inc. (a) | 62,025 | | 1,159,247 |
ARIAD Pharmaceuticals, Inc. (a) | 456,120 | | 8,725,576 |
BioMarin Pharmaceutical, Inc. (a) | 177,094 | | 6,958,023 |
Dynavax Technologies Corp. (a) | 2,043,459 | | 7,887,752 |
Infinity Pharmaceuticals, Inc. (a)(d) | 574,648 | | 10,033,354 |
Isis Pharmaceuticals, Inc. (a)(d) | 717,972 | | 8,701,821 |
Medivation, Inc. (a) | 81,757 | | 8,151,173 |
Merrimack Pharmaceuticals, Inc. (d) | 65,600 | | 522,832 |
Merrimack Pharmaceuticals, Inc. (g) | 380,800 | | 2,731,478 |
Neurocrine Biosciences, Inc. (a) | 96,411 | | 732,724 |
Novavax, Inc. (a)(d) | 3,240,313 | | 7,225,898 |
OncoGenex Pharmaceuticals, Inc. (a) | 371,471 | | 5,185,735 |
Pharmacyclics, Inc. (a)(d) | 109,648 | | 5,834,370 |
Rigel Pharmaceuticals, Inc. (a) | 512,300 | | 5,604,562 |
Synageva BioPharma Corp. (a) | 205,613 | | 10,292,987 |
Targacept, Inc. (a) | 1,044,883 | | 4,513,895 |
Theravance, Inc. (a)(d) | 420,631 | | 12,252,981 |
Threshold Pharmaceuticals, Inc. (a) | 779,628 | | 5,410,618 |
XOMA Corp. (a)(d) | 2,024,541 | | 7,349,084 |
| | 124,296,016 |
Health Care Equipment & Supplies - 2.6% |
Align Technology, Inc. (a) | 522,278 | | 17,736,561 |
Analogic Corp. | 68,343 | | 4,375,319 |
Cerus Corp. (a)(d) | 2,585,078 | | 7,806,936 |
Conceptus, Inc. (a) | 306,217 | | 5,689,512 |
ICU Medical, Inc. (a) | 242,308 | | 12,922,286 |
Natus Medical, Inc. (a) | 421,710 | | 5,212,336 |
Sirona Dental Systems, Inc. (a) | 129,646 | | 5,604,597 |
| | 59,347,547 |
Common Stocks - continued |
| Shares | | Value |
HEALTH CARE - continued |
Health Care Providers & Services - 2.3% |
Air Methods Corp. (a) | 77,209 | | $ 8,418,097 |
BioScrip, Inc. (a) | 760,945 | | 4,839,610 |
Centene Corp. (a) | 277,847 | | 10,569,300 |
Corvel Corp. (a) | 153,361 | | 7,076,077 |
Humana, Inc. | 107,872 | | 6,644,915 |
MEDNAX, Inc. (a) | 91,562 | | 6,054,995 |
Team Health Holdings, Inc. (a) | 126,803 | | 3,385,640 |
Wellcare Health Plans, Inc. (a) | 81,775 | | 5,300,656 |
| | 52,289,290 |
Health Care Technology - 0.3% |
Epocrates, Inc. (a)(d) | 933,410 | | 7,037,911 |
Life Sciences Tools & Services - 0.4% |
Luminex Corp. (a) | 444,245 | | 7,609,917 |
Pharmaceuticals - 1.6% |
Biodelivery Sciences International, Inc. (a)(d)(e) | 1,714,794 | | 8,128,124 |
Jazz Pharmaceuticals PLC (a) | 193,100 | | 9,282,317 |
Optimer Pharmaceuticals, Inc. (a)(d) | 222,613 | | 3,040,894 |
ViroPharma, Inc. (a) | 390,478 | | 8,477,277 |
XenoPort, Inc. (a) | 782,500 | | 6,166,100 |
| | 35,094,712 |
TOTAL HEALTH CARE | | 285,675,393 |
INDUSTRIALS - 13.7% |
Aerospace & Defense - 1.3% |
Alliant Techsystems, Inc. | 166,149 | | 7,696,022 |
Teledyne Technologies, Inc. (a) | 355,649 | | 22,156,933 |
| | 29,852,955 |
Air Freight & Logistics - 0.3% |
UTI Worldwide, Inc. | 584,500 | | 7,744,625 |
Building Products - 0.9% |
AAON, Inc. (d) | 548,150 | | 10,014,701 |
Armstrong World Industries, Inc. | 291,874 | | 11,280,930 |
| | 21,295,631 |
Commercial Services & Supplies - 1.4% |
Swisher Hygiene, Inc. (a) | 961,491 | | 1,739,337 |
Sykes Enterprises, Inc. (a) | 337,501 | | 4,991,640 |
Common Stocks - continued |
| Shares | | Value |
INDUSTRIALS - continued |
Commercial Services & Supplies - continued |
Tetra Tech, Inc. (a) | 521,613 | | $ 13,410,670 |
United Stationers, Inc. | 456,800 | | 11,515,928 |
| | 31,657,575 |
Construction & Engineering - 0.9% |
Foster Wheeler AG (a) | 519,228 | | 9,366,873 |
MasTec, Inc. (a) | 607,210 | | 9,691,072 |
| | 19,057,945 |
Electrical Equipment - 1.4% |
General Cable Corp. (a) | 605,310 | | 15,816,750 |
GrafTech International Ltd. (a) | 676,703 | | 7,071,546 |
II-VI, Inc. (a) | 465,348 | | 8,115,669 |
| | 31,003,965 |
Industrial Conglomerates - 0.6% |
Carlisle Companies, Inc. | 252,500 | | 12,748,725 |
Machinery - 2.4% |
Actuant Corp. Class A | 561,531 | | 15,981,172 |
Altra Holdings, Inc. | 488,343 | | 8,067,426 |
CLARCOR, Inc. | 218,797 | | 10,578,835 |
TriMas Corp. (a) | 476,697 | | 10,363,393 |
Wabtec Corp. | 120,254 | | 9,521,712 |
| | 54,512,538 |
Marine - 0.3% |
DryShips, Inc. (a)(d) | 2,727,003 | | 6,026,677 |
Professional Services - 2.7% |
Advisory Board Co. (a) | 220,964 | | 9,941,170 |
Equifax, Inc. | 269,900 | | 12,642,116 |
Manpower, Inc. | 360,700 | | 12,833,706 |
Stantec, Inc. | 512,500 | | 14,723,164 |
Towers Watson & Co. | 180,200 | | 10,565,126 |
| | 60,705,282 |
Trading Companies & Distributors - 1.5% |
Interline Brands, Inc. (a) | 659,893 | | 16,748,084 |
Watsco, Inc. | 261,177 | | 17,744,365 |
| | 34,492,449 |
TOTAL INDUSTRIALS | | 309,098,367 |
Common Stocks - continued |
| Shares | | Value |
INFORMATION TECHNOLOGY - 16.6% |
Communications Equipment - 4.2% |
Acme Packet, Inc. (a) | 435,217 | | $ 6,898,189 |
Brocade Communications Systems, Inc. (a) | 3,032,517 | | 15,071,609 |
Finisar Corp. (a) | 791,414 | | 9,837,276 |
Ixia (a) | 1,038,443 | | 16,095,867 |
NETGEAR, Inc. (a) | 407,731 | | 14,119,725 |
Plantronics, Inc. | 324,104 | | 10,637,093 |
Polycom, Inc. (a) | 1,002,026 | | 8,757,707 |
Riverbed Technology, Inc. (a) | 753,048 | | 13,283,767 |
| | 94,701,233 |
Computers & Peripherals - 2.8% |
NCR Corp. (a) | 584,600 | | 13,632,872 |
Quantum Corp. (a) | 8,164,236 | | 12,083,069 |
SanDisk Corp. (a) | 228,960 | | 9,417,125 |
Super Micro Computer, Inc. (a) | 1,154,512 | | 14,327,494 |
Synaptics, Inc. (a) | 509,700 | | 13,445,886 |
| | 62,906,446 |
Electronic Equipment & Components - 1.2% |
Arrow Electronics, Inc. (a) | 202,000 | | 6,817,500 |
Fabrinet (a) | 937,939 | | 12,455,830 |
Vishay Intertechnology, Inc. (a) | 754,200 | | 7,443,954 |
| | 26,717,284 |
Internet Software & Services - 2.0% |
Bankrate, Inc. (a) | 450,893 | | 7,191,743 |
Blucora, Inc. (a) | 871,036 | | 13,283,299 |
EarthLink, Inc. | 288,820 | | 1,978,417 |
QuinStreet, Inc. (a) | 849,786 | | 7,707,559 |
Rackspace Hosting, Inc. (a) | 131,099 | | 5,752,624 |
Web.com Group, Inc. (a) | 538,218 | | 8,342,379 |
| | 44,256,021 |
IT Services - 1.6% |
Euronet Worldwide, Inc. (a) | 707,817 | | 12,938,895 |
ExlService Holdings, Inc. (a) | 387,277 | | 9,546,378 |
HiSoft Technology International Ltd. ADR (a) | 386,924 | | 4,364,503 |
Sapient Corp. | 1,026,870 | | 10,227,625 |
| | 37,077,401 |
Semiconductors & Semiconductor Equipment - 2.3% |
Cirrus Logic, Inc. (a) | 269,916 | | 9,924,811 |
Entegris, Inc. (a) | 984,844 | | 7,927,994 |
Marvell Technology Group Ltd. | 743,404 | | 8,370,729 |
Common Stocks - continued |
| Shares | | Value |
INFORMATION TECHNOLOGY - continued |
Semiconductors & Semiconductor Equipment - continued |
ON Semiconductor Corp. (a) | 927,832 | | $ 6,439,154 |
RF Micro Devices, Inc. (a) | 2,884,650 | | 11,192,442 |
Spansion, Inc. Class A | 805,381 | | 8,255,155 |
| | 52,110,285 |
Software - 2.5% |
BroadSoft, Inc. (a)(d) | 479,111 | | 11,762,175 |
Mentor Graphics Corp. (a) | 461,632 | | 7,053,737 |
Nuance Communications, Inc. (a) | 634,467 | | 12,911,403 |
Parametric Technology Corp. (a) | 825,997 | | 17,791,975 |
Synchronoss Technologies, Inc. (a) | 315,844 | | 6,038,937 |
| | 55,558,227 |
TOTAL INFORMATION TECHNOLOGY | | 373,326,897 |
MATERIALS - 4.3% |
Chemicals - 1.3% |
Cabot Corp. | 389,397 | | 15,186,483 |
Kraton Performance Polymers, Inc. (a) | 584,739 | | 13,694,587 |
| | 28,881,070 |
Containers & Packaging - 1.0% |
Aptargroup, Inc. | 209,250 | | 10,464,593 |
Rock-Tenn Co. Class A | 211,700 | | 12,325,174 |
| | 22,789,767 |
Metals & Mining - 2.0% |
Carpenter Technology Corp. | 284,341 | | 13,608,560 |
Coeur d'Alene Mines Corp. (a) | 517,700 | | 8,443,687 |
Compass Minerals International, Inc. | 218,000 | | 15,770,120 |
HudBay Minerals, Inc. | 861,300 | | 7,274,479 |
| | 45,096,846 |
TOTAL MATERIALS | | 96,767,683 |
TELECOMMUNICATION SERVICES - 0.7% |
Wireless Telecommunication Services - 0.7% |
Clearwire Corp. Class A (a)(d) | 10,019,436 | | 11,422,157 |
MetroPCS Communications, Inc. (a) | 300,300 | | 2,630,628 |
NII Holdings, Inc. (a) | 157,396 | | 1,062,423 |
| | 15,115,208 |
Common Stocks - continued |
| Shares | | Value |
UTILITIES - 3.4% |
Electric Utilities - 1.9% |
Cleco Corp. | 331,100 | | $ 14,488,936 |
Empire District Electric Co. (d) | 413,023 | | 8,879,995 |
IDACORP, Inc. | 251,193 | | 10,600,345 |
PNM Resources, Inc. | 426,951 | | 8,880,581 |
| | 42,849,857 |
Gas Utilities - 1.1% |
Atmos Energy Corp. | 296,337 | | 10,623,681 |
Northwest Natural Gas Co. | 266,781 | | 12,989,567 |
| | 23,613,248 |
Multi-Utilities - 0.4% |
NorthWestern Energy Corp. | 250,100 | | 9,236,193 |
TOTAL UTILITIES | | 75,699,298 |
TOTAL COMMON STOCKS (Cost $1,944,023,242) |
2,131,490,147
|
Convertible Preferred Stocks - 0.1% |
| | | |
HEALTH CARE - 0.1% |
Pharmaceuticals - 0.1% |
Agios Pharmaceuticals, Inc. Series C (g) (Cost $1,738,254) | 353,944 | |
1,738,254
|
U.S. Treasury Obligations - 0.1% |
| Principal Amount | | |
U.S. Treasury Bills, yield at date of purchase 0.08% to 0.09% 8/23/12 to 10/11/12 (f)
(Cost $2,579,799) | | $ 2,580,000 | |
2,579,836
|
Money Market Funds - 7.6% |
| Shares | | Value |
Fidelity Cash Central Fund, 0.17% (b) | 119,811,908 | | $ 119,811,908 |
Fidelity Securities Lending Cash Central Fund, 0.18% (b)(c) | 51,950,463 | | 51,950,463 |
TOTAL MONEY MARKET FUNDS (Cost $171,762,371) |
171,762,371
|
TOTAL INVESTMENT PORTFOLIO - 102.4% (Cost $2,120,103,666) | | 2,307,570,608 |
NET OTHER ASSETS (LIABILITIES) - (2.4)% | | (54,148,786) |
NET ASSETS - 100% | $ 2,253,421,822 |
Futures Contracts |
| Expiration
Date | | Underlying
Face Amount
at Value | | Unrealized
Appreciation/
(Depreciation) |
Purchased |
Equity Index Contracts |
235 NYFE Russell 2000 Mini Index Contracts | Sept. 2012 | | $ 18,438,100 | | $ 907,365 |
|
The face value of futures purchased as a percentage of net assets is 0.8% |
Legend |
(a) Non-income producing |
(b) Affiliated fund that is available only to investment companies and other accounts managed by Fidelity Investments. The rate quoted is the annualized seven-day yield of the fund at period end. A complete unaudited listing of the fund's holdings as of its most recent quarter end is available upon request. In addition, each Fidelity Central Fund's financial statements, which are not covered by the Fund's Report of Independent Registered Public Accounting Firm, are available on the SEC's website or upon request. |
(c) Investment made with cash collateral received from securities on loan. |
(d) Security or a portion of the security is on loan at period end. |
(e) Affiliated company |
(f) Security or a portion of the security was pledged to cover margin requirements for futures contracts. At the period end, the value of securities pledged amounted to $1,679,864. |
(g) Restricted securities - Investment in securities not registered under the Securities Act of 1933 (excluding 144A issues). At the end of the period, the value of restricted securities (excluding 144A issues) amounted to $4,469,732 or 0.2% of net assets. |
Additional information on each restricted holding is as follows: |
Security | Acquisition
Date | Acquisition
Cost |
Agios Pharmaceuticals, Inc. Series C | 11/16/11 | $ 1,738,254 |
Merrimack Pharmaceuticals, Inc. | 3/31/11 | $ 2,665,600 |
Affiliated Central Funds |
Information regarding fiscal year to date income earned by the Fund from investments in Fidelity Central Funds is as follows: |
Fund | Income earned |
Fidelity Cash Central Fund | $ 148,940 |
Fidelity Securities Lending Cash Central Fund | 1,602,656 |
Total | $ 1,751,596 |
Other Affiliated Issuers |
An affiliated company is a company in which the Fund has ownership of at least 5% of the voting securities. Fiscal year to date transactions with companies which are or were affiliates are as follows: |
Affiliate | Value,
beginning of
period | Purchases | Sales
Proceeds | Dividend
Income | Value,
end of
period |
Biodelivery Sciences International, Inc. | $ - | $ 6,801,970 | $ 1,029,296 | $ - | $ 8,128,124 |
Western Liberty Bancorp | 3,020,000 | - | 2,360,204 | - | - |
Total | $ 3,020,000 | $ 6,801,970 | $ 3,389,500 | $ - | $ 8,128,124 |
Other Information |
The following is a summary of the inputs used, as of July 31, 2012, involving the Fund's assets and liabilities carried at fair value. The inputs or methodology used for valuing securities may not be an indication of the risk associated with investing in those securities. For more information on valuation inputs, and their aggregation into the levels used in the table below, please refer to the Security Valuation section in the accompanying Notes to Financial Statements. |
Valuation Inputs at Reporting Date: |
Description | Total | Level 1 | Level 2 | Level 3 |
Investments in Securities: | | | | |
Equities: | | | | |
Consumer Discretionary | $ 304,288,423 | $ 304,288,423 | $ - | $ - |
Consumer Staples | 79,672,958 | 79,672,958 | - | - |
Energy | 133,322,040 | 133,322,040 | - | - |
Financials | 458,523,880 | 458,523,880 | - | - |
Health Care | 287,413,647 | 282,943,915 | 2,731,478 | 1,738,254 |
Industrials | 309,098,367 | 307,359,030 | 1,739,337 | - |
Information Technology | 373,326,897 | 373,326,897 | - | - |
Materials | 96,767,683 | 96,767,683 | - | - |
Telecommunication Services | 15,115,208 | 15,115,208 | - | - |
Utilities | 75,699,298 | 75,699,298 | - | - |
U.S. Government and Government Agency Obligations | 2,579,836 | - | 2,579,836 | - |
Money Market Funds | 171,762,371 | 171,762,371 | - | - |
Total Investments in Securities: | $ 2,307,570,608 | $ 2,298,781,703 | $ 7,050,651 | $ 1,738,254 |
Derivative Instruments: | | | | |
Assets | | | | |
Futures Contracts | $ 907,365 | $ 907,365 | $ - | $ - |
Value of Derivative Instruments |
The following table is a summary of the Fund's value of derivative instruments by risk exposure as of July 31, 2012. For additional information on derivative instruments, please refer to the Derivative Instruments section in the accompanying Notes to Financial Statements. |
Risk Exposure /
Derivative Type | Value |
| Asset | Liability |
Equity Risk | | |
Futures Contracts (a) | $ 907,365 | $ - |
Total Value of Derivatives | $ 907,365 | $ - |
(a) Reflects cumulative appreciation/(depreciation) on futures contracts as disclosed on the Schedule of Investments. Only the period end variation margin is separately disclosed on the Statement of Assets and Liabilities. |
See accompanying notes which are an integral part of the financial statements.
Annual Report
Statement of Assets and Liabilities
| July 31, 2012 |
| | |
Assets | | |
Investment in securities, at value (including securities loaned of $49,209,237) - See accompanying schedule: Unaffiliated issuers (cost $1,942,527,542) | $ 2,127,680,113 | |
Fidelity Central Funds (cost $171,762,371) | 171,762,371 | |
Other affiliated issuers (cost $5,813,753) | 8,128,124 | |
Total Investments (cost $2,120,103,666) | | $ 2,307,570,608 |
Receivable for investments sold | | 6,107,529 |
Receivable for fund shares sold | | 831,543 |
Dividends receivable | | 1,136,801 |
Distributions receivable from Fidelity Central Funds | | 146,995 |
Other receivables | | 79,120 |
Total assets | | 2,315,872,596 |
| | |
Liabilities | | |
Payable to custodian bank | $ 486,162 | |
Payable for investments purchased | 6,073,471 | |
Payable for fund shares redeemed | 1,816,824 | |
Accrued management fee | 1,617,494 | |
Payable for daily variation margin on futures contracts | 96,350 | |
Other affiliated payables | 277,951 | |
Other payables and accrued expenses | 132,059 | |
Collateral on securities loaned, at value | 51,950,463 | |
Total liabilities | | 62,450,774 |
| | |
Net Assets | | $ 2,253,421,822 |
Net Assets consist of: | | |
Paid in capital | | $ 1,982,088,174 |
Undistributed net investment income | | 1,385,864 |
Accumulated undistributed net realized gain (loss) on investments and foreign currency transactions | | 81,580,110 |
Net unrealized appreciation (depreciation) on investments and assets and liabilities in foreign currencies | | 188,367,674 |
Net Assets | | $ 2,253,421,822 |
See accompanying notes which are an integral part of the financial statements.
Annual Report
Financial Statements - continued
Statement of Assets and Liabilities - continued
| July 31, 2012 |
| | |
Series Small Cap Opportunities: Net Asset Value, offering price and redemption price per share ($1,329,446,949 ÷ 121,592,438 shares) | | $ 10.93 |
| | |
Class F: Net Asset Value, offering price and redemption price per share ($923,974,873 ÷ 84,053,340 shares) | | $ 10.99 |
See accompanying notes which are an integral part of the financial statements.
Annual Report
Statement of Operations
| Year ended July 31, 2012 |
| | |
Investment Income | | |
Dividends | | $ 20,792,824 |
Interest | | 1,480 |
Income from Fidelity Central Funds (including $1,602,656 from security lending) | | 1,751,596 |
Total income | | 22,545,900 |
| | |
Expenses | | |
Management fee
Basic fee | $ 13,884,229 | |
Performance adjustment | 3,181,662 | |
Transfer agent fees | 2,637,548 | |
Accounting and security lending fees | 604,064 | |
Custodian fees and expenses | 102,938 | |
Independent trustees' compensation | 12,733 | |
Audit | 61,435 | |
Legal | 5,915 | |
Miscellaneous | 19,407 | |
Total expenses before reductions | 20,509,931 | |
Expense reductions | (119,606) | 20,390,325 |
Net investment income (loss) | | 2,155,575 |
Realized and Unrealized Gain (Loss) Net realized gain (loss) on: | | |
Investment securities: | | |
Unaffiliated issuers | 94,940,503 | |
Other affiliated issuers | (7,259,202) | |
Foreign currency transactions | 20,728 | |
Futures contracts | (662,789) | |
Total net realized gain (loss) | | 87,039,240 |
Change in net unrealized appreciation (depreciation) on: Investment securities | (120,421,683) | |
Assets and liabilities in foreign currencies | (11,709) | |
Futures contracts | 899,339 | |
Total change in net unrealized appreciation (depreciation) | | (119,534,053) |
Net gain (loss) | | (32,494,813) |
Net increase (decrease) in net assets resulting from operations | | $ (30,339,238) |
See accompanying notes which are an integral part of the financial statements.
Annual Report
Financial Statements - continued
Statement of Changes in Net Assets
| Year ended
July 31,
2012 | Year ended
July 31,
2011 |
Increase (Decrease) in Net Assets | | |
Operations | | |
Net investment income (loss) | $ 2,155,575 | $ 32,296 |
Net realized gain (loss) | 87,039,240 | 321,537,979 |
Change in net unrealized appreciation (depreciation) | (119,534,053) | 104,100,585 |
Net increase (decrease) in net assets resulting
from operations | (30,339,238) | 425,670,860 |
Distributions to shareholders from net investment income | (1,018,413) | - |
Distributions to shareholders from net realized gain | (19,349,019) | (6,204,046) |
Total distributions | (20,367,432) | (6,204,046) |
Share transactions - net increase (decrease) | 409,737,421 | (63,505,361) |
Total increase (decrease) in net assets | 359,030,751 | 355,961,453 |
| | |
Net Assets | | |
Beginning of period | 1,894,391,071 | 1,538,429,618 |
End of period (including undistributed net investment income of $1,385,864 and $0, respectively) | $ 2,253,421,822 | $ 1,894,391,071 |
See accompanying notes which are an integral part of the financial statements.
Annual Report
Financial Highlights - Series Small Cap Opportunities
Years ended July 31, | 2012 | 2011 | 2010 | 2009 | 2008 |
Selected Per-Share Data | | | | |
Net asset value, beginning of period | $ 11.22 | $ 8.76 | $ 6.94 | $ 7.97 | $ 9.65 |
Income from Investment Operations | | | | | |
Net investment income (loss) B | - H | (-) E, H | (.01) | .03 | .02 |
Net realized and unrealized gain (loss) | (.17) | 2.50 | 1.83 | (1.02) | (1.66) |
Total from investment operations | (.17) | 2.50 | 1.82 | (.99) | (1.64) |
Distributions from net investment income | - H | - J | - | (.04) | (.02) |
Distributions from net realized gain | (.11) | (.04) J | - | - | (.02) |
Total distributions | (.12) I | (.04) | - | (.04) | (.04) |
Redemption fees added to paid in capital G | - | - | - | - | - B, H |
Net asset value, end of period | $ 10.93 | $ 11.22 | $ 8.76 | $ 6.94 | $ 7.97 |
Total Return A | (1.41)% | 28.50% | 26.22% | (12.34)% | (17.10)% |
Ratios to Average Net Assets C, F | | | | |
Expenses before reductions | 1.12% | 1.10% | 1.02% | .93% | .93% |
Expenses net of fee waivers, if any | 1.12% | 1.10% | 1.02% | .93% | .93% |
Expenses net of all reductions | 1.11% | 1.09% | 1.01% | .93% | .92% |
Net investment income (loss) | .04% | (.04)% E | (.07)% | .49% | .20% |
Supplemental Data | | | | |
Net assets, end of period (000 omitted) | $ 1,329,447 | $ 1,415,570 | $ 1,363,646 | $ 1,284,079 | $ 1,348,258 |
Portfolio turnover rate D | 66% | 73% | 104% | 167% | 179% |
A Total returns would have been lower if certain expenses had not been reduced during the applicable periods shown.
B Calculated based on average shares outstanding during the period.
C Fees and expenses of any underlying Fidelity Central Funds are not included in the Fund's expense ratio. The Fund indirectly bears its proportionate share of the expenses of any underlying Fidelity Central Funds.
D Amount does not include the portfolio activity of any underlying Fidelity Central Funds.
E Investment income per share reflects a large, non-recurring dividend which amounted to $.02 per share. Excluding this non-recurring dividend, the ratio of net investment income (loss) to average net assets would have been (.27)%.
F Expense ratios reflect operating expenses of the class. Expenses before reductions do not reflect amounts reimbursed by the investment adviser or reductions from brokerage service arrangements or reductions from other expense offset arrangements and do not represent the amount paid by the class during periods when reimbursements or reductions occur. Expenses net of fee waivers reflect expenses after reimbursement by the investment adviser but prior to reductions from brokerage service arrangements or other expense offset arrangements. Expenses net of all reductions represent the net expenses paid by the class.
G The redemption fee was eliminated during the year ended July 31, 2009.
H Amount represents less than $.01 per share.
I Total distributions of $.12 per share is comprised of distributions from net investment income of $.003 and distributions from net realized gain of $.113 per share.
J The amount shown reflects certain reclassifications related to book to tax differences.
See accompanying notes which are an integral part of the financial statements.
Annual Report
Financial Highlights - Class F
Years ended July 31, | 2012 | 2011 | 2010 | 2009 H |
Selected Per-Share Data | | | |
Net asset value, beginning of period | $ 11.27 | $ 8.79 | $ 6.94 | $ 6.24 |
Income from Investment Operations | | | | |
Net investment income (loss) D | .03 | .02 G | .01 | - J |
Net realized and unrealized gain (loss) | (.18) | 2.50 | 1.84 | .70 |
Total from investment operations | (.15) | 2.52 | 1.85 | .70 |
Distributions from net investment income | (.01) | - L | - | - |
Distributions from net realized gain | (.11) | (.04) L | - | - |
Total distributions | (.13) K | (.04) | - | - |
Net asset value, end of period | $ 10.99 | $ 11.27 | $ 8.79 | $ 6.94 |
Total Return B, C | (1.23)% | 28.74% | 26.66% | 11.22% |
Ratios to Average Net Assets E, I | | | |
Expenses before reductions | .91% | .89% | .78% | .68% A |
Expenses net of fee waivers, if any | .91% | .89% | .78% | .68% A |
Expenses net of all reductions | .91% | .88% | .77% | .68% A |
Net investment income (loss) | .24% | .17% G | .17% | .11% A |
Supplemental Data | | | |
Net assets, end of period (000 omitted) | $ 923,975 | $ 478,821 | $ 174,783 | $ 197 |
Portfolio turnover rate F | 66% | 73% | 104% | 167% |
A Annualized
B Total returns for periods of less than one year are not annualized.
C Total returns would have been lower if certain expenses had not been reduced during the applicable periods shown.
D Calculated based on average shares outstanding during the period.
E Fees and expenses of any underlying Fidelity Central Funds are not included in the Fund's expense ratio. The Fund indirectly bears its proportionate share of the expenses of any underlying Fidelity Central Funds.
F Amount does not include the portfolio activity of any underlying Fidelity Central Funds.
G Investment income per share reflects a large, non-recurring dividend which amounted to $.02 per share. Excluding this non-recurring dividend, the ratio of net investment income (loss) to average net assets would have been (.06)%.
H For the period June 26, 2009 (commencement of sale of shares) to July 31, 2009.
I Expense ratios reflect operating expenses of the class. Expenses before reductions do not reflect amounts reimbursed by the investment adviser or reductions from brokerage service arrangements or reductions from other expense offset arrangements and do not represent the amount paid by the class during periods when reimbursements or reductions occur. Expense ratios before reductions for start-up periods may not be representative of longer-term operating periods. Expenses net of fee waivers reflect expenses after reimbursement by the investment adviser but prior to reductions from brokerage service arrangements or other expense offset arrangements. Expenses net of all reductions represent the net expenses paid by the class.
J Amount represents less than $.01 per share.
K Total distributions of $.13 per share is comprised of distributions from net investment income of $.012 and distributions from net realized gain of $.113 per share.
L The amount shown reflects certain reclassifications related to book to tax differences.
See accompanying notes which are an integral part of the financial statements.
Annual Report
Notes to Financial Statements
For the period ended July 31, 2012
1. Organization.
Fidelity Series Small Cap Opportunities Fund (the Fund) is a fund of Fidelity Securities Fund (the Trust) and is authorized to issue an unlimited number of shares. Shares of the Fund are only available for purchase by mutual funds for which Fidelity Management & Research Company (FMR) or an affiliate serves as an investment manager and, for shares of Series Small Cap Opportunities, FMR investment professionals. The Trust is registered under the Investment Company Act of 1940, as amended (the 1940 Act), as an open-end management investment company organized as a Massachusetts business trust. The Fund offers Series Small Cap Opportunities and Class F shares, each of which has equal rights as to assets and voting privileges. Each class has exclusive voting rights with respect to matters that affect that class. Investment income, realized and unrealized capital gains and losses, the common expenses of the Fund, and certain fund-level expense reductions, if any, are allocated on a pro-rata basis to each class based on the relative net assets of each class to the total net assets of the Fund. Each class differs with respect to transfer agent fees incurred. Certain expense reductions may also differ by class.
2. Investments in Fidelity Central Funds.
The Fund invests in Fidelity Central Funds, which are open-end investment companies available only to other investment companies and accounts managed by FMR and its affiliates. The Fund's Schedule of Investments lists each of the Fidelity Central Funds held as of period end, if any, as an investment of the Fund, but does not include the underlying holdings of each Fidelity Central Fund. As an Investing Fund, the Fund indirectly bears its proportionate share of the expenses of the underlying Fidelity Central Funds.
The Money Market Central Funds seek preservation of capital and current income and are managed by Fidelity Investments Money Management, Inc. (FIMM), an affiliate of FMR.
A complete unaudited list of holdings for each Fidelity Central Fund is available upon request or at the Securities and Exchange Commission (the SEC) web site at www.sec.gov. In addition, the financial statements of the Fidelity Central Funds, which are not covered by the Fund's Report of Independent Registered Public Accounting Firm, are available on the SEC web site or upon request.
3. Significant Accounting Policies.
The financial statements have been prepared in conformity with accounting principles generally accepted in the United States of America (GAAP), which require management to make certain estimates and assumptions at the date of the financial statements. Actual results could differ from those estimates. Subsequent events, if any, through the
Annual Report
3. Significant Accounting Policies - continued
date that the financial statements were issued have been evaluated in the preparation of the financial statements. The following summarizes the significant accounting policies of the Fund:
Security Valuation. Investments are valued as of 4:00 p.m. Eastern time on the last calendar day of the period. In accordance with valuation policies and procedures approved by the Board of Trustees (the Board), the Fund attempts to obtain prices from one or more third party pricing vendor or broker to value its investments. When current market prices, quotations or rates are not readily available or reliable, securities will be fair valued in good faith by the FMR Fair Value Committee (the Committee), in accordance with procedures adopted by the Fund's Board. Factors used in determining fair value vary by security type and may include market or security specific events, changes in interest rates and credit quality. The frequency with which these procedures are used cannot be predicted and they may be utilized to a significant extent. The Committee oversees the Fund's valuation policies and procedures and is responsible for approving and reporting to the Board all fair value determinations.
The Fund categorizes the inputs to valuation techniques used to value its investments into a disclosure hierarchy consisting of three levels as shown below:
Level 1 - quoted prices in active markets for identical investments
Level 2 - other significant observable inputs (including quoted prices for similar investments, interest rates, prepayment speeds, etc.)
Level 3 - unobservable inputs (including the Fund's own assumptions based on the best information available)
Valuation techniques used to value the Fund's investments by major category are as follows:
Equity securities, including restricted securities, for which market quotations are readily available, are valued at the last reported sale price or official closing price as reported by a third party pricing vendor on the primary market or exchange on which they are traded and are categorized as Level 1 in the hierarchy. In the event there were no sales during the day or closing prices are not available, securities are valued at the last quoted bid price or may be valued using the last available price and are generally categorized as Level 2 in the hierarchy. For foreign equity securities, when significant market or security specific events arise, comparisons to the valuation of American Depositary Receipts (ADRs), futures contracts, Exchange-Traded Funds (ETFs) and certain indexes as well as quoted prices for similar securities are used and are categorized as Level 2 in the hierarchy. Utilizing these techniques may result in transfers between Level 1 and Level 2. For restricted equity securities and private placements where observable inputs are
Annual Report
Notes to Financial Statements - continued
3. Significant Accounting Policies - continued
Security Valuation - continued
limited, assumptions about market activity and risk are used and these securities are categorized as Level 3 in the hierarchy.
Debt securities, including restricted securities, are valued based on evaluated prices received from third party pricing vendors or from brokers who make markets in such securities. For U.S. government and government agency obligations, pricing vendors utilize matrix pricing which considers yield or price of bonds of comparable quality, coupon, maturity and type as well as broker-supplied prices and are generally categorized as Level 2 in the hierarchy. When independent prices are unavailable or unreliable, debt securities may be valued utilizing pricing methodologies which consider similar factors that would be used by third party pricing vendors. These are generally categorized as Level 2 in the hierarchy but may be Level 3 depending on the circumstances.
Futures contracts are valued at the settlement price established each day by the board of trade or exchange on which they are traded and are categorized as Level 1 in the hierarchy. Investments in open-end mutual funds, including the Fidelity Central Funds, are valued at their closing net asset value each business day and are categorized as Level 1 in the hierarchy.
Changes in valuation techniques may result in transfers in or out of an assigned level within the disclosure hierarchy. The aggregate value of investments by input level, as of July 31, 2012, is included at the end of the Fund's Schedule of Investments.
Foreign Currency Translation. The Fund may use foreign currency contracts to facilitate transactions in foreign-denominated securities. Gains and losses from these transactions may arise from changes in the value of the foreign currency or if the counterparties do not perform under the contracts' terms.
Foreign-denominated assets, including investment securities, and liabilities are translated into U.S. dollars at the exchange rates at period end. Purchases and sales of investment securities, income and dividends received and expenses denominated in foreign currencies are translated into U.S. dollars at the exchange rate in effect on the transaction date.
The effects of exchange rate fluctuations on investments are included with the net realized and unrealized gain (loss) on investment securities. Other foreign currency transactions resulting in realized and unrealized gain (loss) are disclosed separately.
Investment Transactions and Income. For financial reporting purposes, the Fund's investment holdings and NAV include trades executed through the end of the last business day of the period. The NAV per share for processing shareholder transactions is calculated as of the close of business of the New York Stock Exchange (NYSE), normally
Annual Report
3. Significant Accounting Policies - continued
Investment Transactions and Income - continued
4:00 p.m. Eastern time and includes trades executed through the end of the prior business day. Gains and losses on securities sold are determined on the basis of identified cost and may include proceeds received from litigation. Dividend income is recorded on the ex-dividend date, except for certain dividends from foreign securities where the ex-dividend date may have passed, which are recorded as soon as the Fund is informed of the ex-dividend date. Non-cash dividends included in dividend income, if any, are recorded at the fair market value of the securities received. Distributions received on securities that represent a return of capital or capital gain are recorded as a reduction of cost of investments and/or as a realized gain. The Fund estimates the components of distributions received that may be considered return of capital distributions or capital gain distributions. Interest income and distributions from the Fidelity Central Funds are accrued as earned. Interest income includes coupon interest and amortization of premium and accretion of discount on debt securities. Investment income is recorded net of foreign taxes withheld where recovery of such taxes is uncertain.
Expenses. Expenses directly attributable to a fund are charged to that fund. Expenses attributable to more than one fund are allocated among the respective funds on the basis of relative net assets or other appropriate methods. Expense estimates are accrued in the period to which they relate and adjustments are made when actual amounts are known.
Income Tax Information and Distributions to Shareholders. Each year, the Fund intends to qualify as a regulated investment company under Subchapter M of the Internal Revenue Code, including distributing substantially all of its taxable income and realized gains. As a result, no provision for income taxes is required. As of July 31, 2012, the Fund did not have any unrecognized tax benefits in the financial statements; nor is the Fund aware of any tax positions for which it is reasonably possible that the total amounts of unrecognized tax benefits will significantly change in the next twelve months. The Fund files a U.S. federal tax return, in addition to state and local tax returns as required. A fund's federal income tax returns are subject to examination by the Internal Revenue Service (IRS) for a period of three fiscal years after they are filed. State and local tax returns may be subject to examination for an additional fiscal year depending on the jurisdiction. Foreign taxes are provided for based on the Fund's understanding of the tax rules and rates that exist in the foreign markets in which it invests.
Distributions are declared and recorded on the ex-dividend date. Income dividends and capital gain distributions are declared separately for each class. Income and capital gain distributions are determined in accordance with income tax regulations, which may differ from GAAP. These differences resulted in distribution reclassifications for the period ended July 31, 2011.
Annual Report
Notes to Financial Statements - continued
3. Significant Accounting Policies - continued
Income Tax Information and Distributions to Shareholders - continued
Capital accounts within the financial statements are adjusted for permanent book-tax differences. These adjustments have no impact on net assets or the results of operations. Temporary book-tax differences will reverse in a subsequent period.
Book-tax differences are primarily due to futures transactions, foreign currency transactions, market discount, partnerships and losses deferred due to wash sales.
The federal tax cost of investment securities and unrealized appreciation (depreciation) as of period end were as follows:
Gross unrealized appreciation | $ 342,199,289 |
Gross unrealized depreciation | (163,083,624) |
Net unrealized appreciation (depreciation) on securities and other investments | $ 179,115,665 |
| |
Tax Cost | $ 2,128,454,943 |
The tax-based components of distributable earnings as of period end were as follows:
Undistributed ordinary income | $ 1,385,864 |
Undistributed long-term capital gain | $ 90,838,755 |
Net unrealized appreciation (depreciation) | $ 179,109,032 |
The tax character of distributions paid was as follows:
| July 31, 2012 | July 31, 2011 |
Ordinary Income | $ 1,018,413 | $ - |
Long-term Capital Gains | 19,349,019 | 6,204,046 |
Total | $ 20,367,432 | $ 6,204,046 |
New Accounting Pronouncement. In December 2011, the Financial Accounting Standards Board issued Accounting Standard Update No. 2011-11, Disclosures about Offsetting Assets and Liabilities. The update creates new disclosure requirements requiring entities to disclose both gross and net information for derivatives and other financial instruments that are either offset in the Statement of Assets and Liabilities or subject to an enforceable master netting arrangement or similar agreement. The disclosure requirements are effective for interim and annual reporting periods beginning on or after January 1, 2013. Management is currently evaluating the impact of the update's adoption on the Fund's financial statement disclosures.
Annual Report
4. Operating Policies.
Restricted Securities. The Fund may invest in securities that are subject to legal or contractual restrictions on resale. These securities generally may be resold in transactions exempt from registration or to the public if the securities are registered. Disposal of these securities may involve time-consuming negotiations and expense, and prompt sale at an acceptable price may be difficult. Information regarding restricted securities is included at the end of the Fund's Schedule of Investments.
5. Derivative Instruments.
Risk Exposures and the Use of Derivative Instruments. The Fund's investment objectives allow the Fund to enter into various types of derivative contracts, including futures contracts. Derivatives are investments whose value is derived from underlying assets, indices or reference rates and may be transacted on an exchange or over-the-counter (OTC). Derivatives may involve a future commitment to buy or sell a specified instrument based on specified terms, or to exchange future cash flows at periodic intervals based on a notional principal amount. The Fund used derivatives to increase returns and to manage exposure to certain risks as defined below. The success of any strategy involving derivatives depends on analysis of numerous economic factors, and if the strategies for investment do not work as intended, the Fund may not achieve its objectives.
The Fund's use of derivatives increased or decreased its exposure to the following risk:
Equity Risk | Equity risk relates to the fluctuations in the value of financial instruments as a result of changes in market prices (other than those arising from interest rate risk or foreign exchange risk), whether caused by factors specific to an individual investment, its issuer, or all factors affecting all instruments traded in a market or market segment. |
The Fund is also exposed to additional risks from investing in derivatives, such as liquidity risk and counterparty credit risk. Liquidity risk is the risk that the Fund will be unable to close out the derivative in the open market in a timely manner. Counterparty credit risk is the risk that the counterparty will not be able to fulfill its obligation to the Fund. Counterparty credit risk related to exchange-traded futures contracts is minimal because of the protection provided by the exchange on which they trade. Investing in derivatives may involve greater risks than investing in the underlying assets directly and, to varying degrees, involves risk of loss in excess of the initial investment, if any, collateral received and amounts recognized in the Statement of Assets and Liabilities. In addition, for futures contracts, there is the risk that the change in value of the derivative contract may not correspond to the change in value of the underlying instrument.
Annual Report
Notes to Financial Statements - continued
5. Derivative Instruments - continued
Futures Contracts. A futures contract is an agreement between two parties to buy or sell a specified underlying instrument for a fixed price at a specified future date. The Fund used futures contracts to manage its exposure to the stock market.
Upon entering into a futures contract, a fund is required to deposit either cash or securities (initial margin) with a clearing broker in an amount equal to a certain percentage of the face value of the contract. Futures contracts are marked-to-market daily and subsequent payments (variation margin) are made or received by a fund depending on the daily fluctuations in the value of the futures contracts and are recorded as unrealized appreciation or (depreciation). This receivable and/or payable is included in daily variation margin on futures contracts in the Statement of Assets and Liabilities. Realized gain or (loss) is recorded upon the expiration or closing of a futures contract.
Any open futures contracts at period end are shown in the Schedule of Investments under the caption "Futures Contracts." The underlying face amount at value reflects each contract's exposure to the underlying instrument at period end and is representative of activity for the period. Securities deposited to meet initial margin requirements are identified in the Schedule of Investments.
During the period the Fund recognized net realized gain (loss) of $(662,789) and a change in net unrealized appreciation (depreciation) of $899,339 related to its investment in futures contracts. These amounts are included in the Statement of Operations.
6. Purchases and Sales of Investments.
Purchases and sales of securities, other than short-term securities, aggregated $1,574,530,145 and $1,237,609,080, respectively.
7. Fees and Other Transactions with Affiliates.
Management Fee. FMR and its affiliates provide the Fund with investment management related services for which the Fund pays a monthly management fee. The management fee is the sum of an individual fund fee rate that is based on an annual rate of .45% of the Fund's average net assets and an annualized group fee rate that averaged .26% during the period. The group fee rate is based upon the average net assets of all the mutual funds advised by FMR. The group fee rate decreases as assets under management increase and increases as assets under management decrease. In addition, the management fee is subject to a performance adjustment (up to a maximum of ± .20% of the Fund's average net assets over a 36 month performance period). The upward or downward adjustment to the management fee is based on the relative investment performance of Series Small Cap Opportunities as compared to an appropriate benchmark
Annual Report
7. Fees and Other Transactions with Affiliates - continued
Management Fee - continued
index. For the period, the total annual management fee rate, including the performance adjustment, was .87% of the Fund's average net assets.
Transfer Agent Fees. Fidelity Investments Institutional Operations Company, Inc. (FIIOC), an affiliate of FMR, is the transfer, dividend disbursing and shareholder servicing agent for each class of the Fund. FIIOC receives account fees and asset-based fees that vary according to the account size and type of account of the shareholders of Series Small Cap Opportunities. FIIOC receives no fees for providing transfer agency services to Class F. FIIOC pays for typesetting, printing and mailing of shareholder reports, except proxy statements. For the period, transfer agent fees for each class were as follows:
| Amount | % of
Average
Net Assets |
Series Small Cap Opportunities | $ 2,637,548 | .20 |
Accounting and Security Lending Fees. Fidelity Service Company, Inc. (FSC), an affiliate of FMR, maintains the Fund's accounting records. The accounting fee is based on the level of average net assets for each month. Under a separate contract, FSC administers the security lending program. The security lending fee is based on the number and duration of lending transactions.
Brokerage Commissions. The Fund placed a portion of its portfolio transactions with brokerage firms which are affiliates of the investment adviser. The commissions paid to these affiliated firms were $79,313 for the period.
8. Committed Line of Credit.
The Fund participates with other funds managed by FMR or an affiliate in a $4.25 billion credit facility (the "line of credit") to be utilized for temporary or emergency purposes to fund shareholder redemptions or for other short-term liquidity purposes. The Fund has agreed to pay commitment fees on its pro-rata portion of the line of credit, which amounted to $5,445 and is reflected in Miscellaneous expenses on the Statement of Operations. During the period, there were no borrowings on this line of credit.
9. Security Lending.
The Fund lends portfolio securities through a lending agent from time to time in order to earn additional income. For equity securities, a lending agent is used and may loan securities to certain qualified borrowers, including Fidelity Capital Markets (FCM), a broker-dealer affiliated with the Fund. On the settlement date of the loan, the Fund
Annual Report
Notes to Financial Statements - continued
9. Security Lending - continued
receives collateral (in the form of U.S. Treasury obligations, letters of credit and/or cash) against the loaned securities and maintains collateral in an amount not less than 100% of the market value of the loaned securities during the period of the loan. The market value of the loaned securities is determined at the close of business of the Fund and any additional required collateral is delivered to the Fund on the next business day. If the borrower defaults on its obligation to return the securities loaned because of insolvency or other reasons, a fund could experience delays and costs in recovering the securities loaned or in gaining access to the collateral. Any cash collateral received is invested in the Fidelity Securities Lending Cash Central Fund. The value of loaned securities and cash collateral at period end are disclosed on the Fund's Statement of Assets and Liabilities. The value of securities loaned to FCM at period end was $3,061,730. Security lending income represents the income earned on investing cash collateral, less rebates paid to borrowers and any lending agent fees associated with the loan, plus any premium payments received for lending certain types of securities. Security lending income is presented in the Statement of Operations as a component of income from Fidelity Central Funds, and includes $25,716 from securities loaned to FCM.
10. Expense Reductions.
Many of the brokers with whom FMR places trades on behalf of the Fund provided services to the Fund in addition to trade execution. These services included payments of certain expenses on behalf of the Fund totaling $119,606 for the period.
11. Distributions to Shareholders.
Distributions to shareholders of each class were as follows:
Years ended July 31, | 2012 | 2011 |
From net investment income | | |
Series Small Cap Opportunities | $ 360,217 | $ - |
Class F | 658,196 | - |
Total | $ 1,018,413 | $ - |
From net realized gain | | |
Series Small Cap Opportunities | $ 14,087,548 | $ 4,912,757 |
Class F | 5,261,471 | 1,291,289 |
Total | $ 19,349,019 | $ 6,204,046 |
Annual Report
12. Share Transactions.
Transactions for each class of shares were as follows:
| Shares | Dollars |
Years ended July 31, | 2012 | 2011 | 2012 | 2011 |
Series Small Cap Opportunities | | | | |
Shares sold | 27,072,389 | 16,351,707 | $ 295,278,935 | $ 173,441,686 |
Reinvestment of distributions | 1,501,907 | 455,386 | 14,447,765 | 4,912,757 |
Shares redeemed | (33,133,824) | (46,302,549) | (348,573,500) | (481,366,419) |
Net increase (decrease) | (4,559,528) | (29,495,456) | $ (38,846,800) | $ (303,011,976) |
Class F | | | | |
Shares sold | 45,760,157 | 27,247,978 | $ 492,916,658 | $ 289,602,420 |
Reinvestment of distributions | 607,120 | 119,471 | 5,919,667 | 1,291,289 |
Shares redeemed | (4,808,984) | (4,765,328) | (50,252,104) | (51,387,094) |
Net increase (decrease) | 41,558,293 | 22,602,121 | $ 448,584,221 | $ 239,506,615 |
13. Other.
The Fund's organizational documents provide former and current trustees and officers with a limited indemnification against liabilities arising in connection with the performance of their duties to the Fund. In the normal course of business, the Fund may also enter into contracts that provide general indemnifications. The Fund's maximum exposure under these arrangements is unknown as this would be dependent on future claims that may be made against the Fund. The risk of material loss from such claims is considered remote.
At the end of the period, mutual funds managed by FMR or an FMR affiliate were the owners of record of all of the outstanding shares of the Fund.
Annual Report
To the Trustees of Fidelity Securities Fund and Shareholders of Fidelity Series Small Cap Opportunities Fund:
We have audited the accompanying statement of assets and liabilities of Fidelity Series Small Cap Opportunities Fund (the Fund), a fund of Fidelity Securities Fund, including the schedule of investments, as of July 31, 2012, and the related statement of operations for the year then ended, the statement of changes in net assets for each of the two years in the period then ended, and the financial highlights for each of the five years in the period then ended. These financial statements and financial highlights are the responsibility of the Fund's management. Our responsibility is to express an opinion on these financial statements and financial highlights based on our audits.
We conducted our audits in accordance with the standards of the Public Company Accounting Oversight Board (United States). Those standards require that we plan and perform the audit to obtain reasonable assurance about whether the financial statements and financial highlights are free of material misstatement. The Fund is not required to have, nor were we engaged to perform, an audit of its internal control over financial reporting. Our audits included consideration of internal control over financial reporting as a basis for designing audit procedures that are appropriate in the circumstances, but not for the purpose of expressing an opinion on the effectiveness of the Fund's internal control over financial reporting. Accordingly, we express no such opinion. An audit also includes examining, on a test basis, evidence supporting the amounts and disclosures in the financial statements, assessing the accounting principles used and significant estimates made by management, as well as evaluating the overall financial statement presentation. Our procedures included confirmation of securities owned as of July 31, 2012, by correspondence with the custodians and brokers; where replies were not received from brokers, we performed other auditing procedures. We believe that our audits provide a reasonable basis for our opinion.
In our opinion, the financial statements and financial highlights referred to above present fairly, in all material respects, the financial position of Fidelity Series Small Cap Opportunities Fund as of July 31, 2012, the results of its operations for the year then ended, the changes in its net assets for each of the two years in the period then ended, and the financial highlights for each of the five years in the period then ended, in conformity with accounting principles generally accepted in the United States of America.
DELOITTE & TOUCHE LLP
Boston, Massachusetts
September 12, 2012
Annual Report
The Trustees, Members of the Advisory Board, and executive officers of the trust and fund, as applicable, are listed below. The Board of Trustees governs the fund and is responsible for protecting the interests of shareholders. The Trustees are experienced executives who meet periodically throughout the year to oversee the fund's activities, review contractual arrangements with companies that provide services to the fund, oversee management of the risks associated with such activities and contractual arrangements, and review the fund's performance. Except for James C. Curvey, each of the Trustees oversees 228 funds advised by FMR or an affiliate. Mr. Curvey oversees 435 funds advised by FMR or an affiliate.
The Trustees hold office without limit in time except that (a) any Trustee may resign; (b) any Trustee may be removed by written instrument, signed by at least two-thirds of the number of Trustees prior to such removal; (c) any Trustee who requests to be retired or who has become incapacitated by illness or injury may be retired by written instrument signed by a majority of the other Trustees; and (d) any Trustee may be removed at any special meeting of shareholders by a two-thirds vote of the outstanding voting securities of the trust. Each Trustee who is not an interested person (as defined in the 1940 Act) (Independent Trustee), shall retire not later than the last day of the calendar year in which his or her 75th birthday occurs. The Independent Trustees may waive this mandatory retirement age policy with respect to individual Trustees. The executive officers and Advisory Board Members hold office without limit in time, except that any officer and Advisory Board Member may resign or may be removed by a vote of a majority of the Trustees at any regular meeting or any special meeting of the Trustees. Except as indicated, each individual has held the office shown or other offices in the same company for the past five years.
Experience, Skills, Attributes, and Qualifications of the Fund's Trustees. The Governance and Nominating Committee has adopted a statement of policy that describes the experience, qualifications, attributes, and skills that are necessary and desirable for potential Independent Trustee candidates (Statement of Policy). The Board believes that each Trustee satisfied at the time he or she was initially elected or appointed a Trustee, and continues to satisfy, the standards contemplated by the Statement of Policy. The Governance and Nominating Committee also engages professional search firms to help identify potential Independent Trustee candidates who have the experience, qualifications, attributes, and skills consistent with the Statement of Policy. From time to time, additional criteria based on the composition and skills of the current Independent Trustees, as well as experience or skills that may be appropriate in light of future changes to board composition, business conditions, and regulatory or other developments, have also been considered by the professional search firms and the Governance and Nominating Committee. In addition, the Board takes into account the Trustees' commitment and participation in Board and committee meetings, as well as their leadership of standing and ad hoc committees throughout their tenure.
In determining that a particular Trustee was and continues to be qualified to serve as a Trustee, the Board has considered a variety of criteria, none of which, in isolation, was controlling. The Board believes that, collectively, the Trustees have balanced and diverse experience, qualifications, attributes, and skills, which allow the Board to operate effectively in governing the fund and protecting the interests of shareholders. Information about the specific experience, skills, attributes, and qualifications of each Trustee, which in each case led to the Board's conclusion that the Trustee should serve (or continue to serve) as a trustee of the fund, is provided below.
Annual Report
Trustees and Officers - continued
Board Structure and Oversight Function. James C. Curvey is an interested person (as defined in the 1940 Act) and currently serves as Chairman. The Trustees have determined that an interested Chairman is appropriate and benefits shareholders because an interested Chairman has a personal and professional stake in the quality and continuity of services provided to the fund. Independent Trustees exercise their informed business judgment to appoint an individual of their choosing to serve as Chairman, regardless of whether the Trustee happens to be independent or a member of management. The Independent Trustees have determined that they can act independently and effectively without having an Independent Trustee serve as Chairman and that a key structural component for assuring that they are in a position to do so is for the Independent Trustees to constitute a substantial majority for the Board. The Independent Trustees also regularly meet in executive session. Ned C. Lautenbach serves as Chairman of the Independent Trustees and as such (i) acts as a liaison between the Independent Trustees and management with respect to matters important to the Independent Trustees and (ii) with management prepares agendas for Board meetings.
Fidelity funds are overseen by different Boards of Trustees. The fund's Board oversees Fidelity's equity and high income funds and another Board oversees Fidelity's investment-grade bond, money market, and asset allocation funds. The asset allocation funds may invest in Fidelity funds overseen by the fund's Board. The use of separate Boards, each with its own committee structure, allows the Trustees of each group of Fidelity funds to focus on the unique issues of the funds they oversee, including common research, investment, and operational issues. On occasion, the separate Boards establish joint committees to address issues of overlapping consequences for the Fidelity funds overseen by each Board.
The Trustees operate using a system of committees to facilitate the timely and efficient consideration of all matters of importance to the Trustees, the fund, and fund shareholders and to facilitate compliance with legal and regulatory requirements and oversight of the fund's activities and associated risks. The Board, acting through its committees, has charged FMR and its affiliates with (i) identifying events or circumstances the occurrence of which could have demonstrably adverse effects on the fund's business and/or reputation; (ii) implementing processes and controls to lessen the possibility that such events or circumstances occur or to mitigate the effects of such events or circumstances if they do occur; and (iii) creating and maintaining a system designed to evaluate continuously business and market conditions in order to facilitate the identification and implementation processes described in (i) and (ii) above. Because the day-to-day operations and activities of the fund are carried out by or through FMR, its affiliates and other service providers, the fund's exposure to risks is mitigated but not eliminated by the processes overseen by the Trustees. While each of the Board's committees has responsibility for overseeing different aspects of the fund's activities, oversight is exercised primarily through the Operations, Audit, and Compliance Committees. In addition, the Independent Trustees have worked with FMR to enhance the Board's oversight of investment and financial risks, legal and regulatory risks, technology risks, and operational risks, including the development of additional risk reporting to the Board. For example, a working group comprised of Independent Trustees and FMR has worked and continues to work to review the Fidelity funds' valuation-related activities, reporting and risk management. Appropriate personnel, including but not limited to the fund's Chief Compliance Officer (CCO), FMR's internal auditor, the independent accountants, the fund's Treasurer and portfolio management personnel, make periodic reports to the Board's committees, as appropriate, including an annual review of FMR's risk management program for the Fidelity funds. The responsibilities of each standing committee, including their oversight responsibilities, are described further under "Standing Committees of the Fund's Trustees."
Annual Report
The fund's Statements of Additional Information (SAIs) include more information about the Trustees. To request a free copy, call Fidelity at 1-800-544-8544 for Fidelity Series Small Cap Opportunities Fund or 1-800-835-5092 for Class F.
Interested Trustees*:
Correspondence intended for each Trustee who is an interested person may be sent to Fidelity Investments, 82 Devonshire Street, Boston, Massachusetts 02109.
Name, Age; Principal Occupations and Other Relevant Experience+ |
James C. Curvey (77) |
| Year of Election or Appointment: 2007 Mr. Curvey is Trustee and Chairman of the Board of Trustees of certain Trusts. Mr. Curvey also serves as Trustee (2007-present) of other investment companies advised by FMR. Mr. Curvey is a Director of Fidelity Investments Money Management, Inc. (2009-present), Director of Fidelity Research & Analysis Co. (2009-present) and Director of FMR and FMR Co., Inc. (2007-present). Mr. Curvey is also Vice Chairman (2007-present) and Director of FMR LLC. In addition, Mr. Curvey serves as an Overseer for the Boston Symphony Orchestra and a member of the Trustees of Villanova University. Previously, Mr. Curvey was the Vice Chairman (2006-2007) and Director (2000-2007) of FMR Corp. |
Ronald P. O'Hanley (55) |
| Year of Election or Appointment: 2011 Mr. O'Hanley is Director of FMR Co., Inc. (2010-present), Director of Fidelity Investments Money Management, Inc. (2010-present), Director of Fidelity Research & Analysis Company (2010-present), President of Fidelity Asset Management and Corporate Services and a member of Fidelity's Executive Committee (2010-present). Previously, Mr. O'Hanley served as President and Chief Executive Officer of BNY Mellon Asset Management (2007-2010). Mr. O'Hanley also served as Vice Chairman of Bank New York Mellon Corp. and a member of that firm's Executive Committee. Prior to the 2007 merger of The Bank of New York and Mellon Financial Corporation, he was Vice Chairman of Mellon Financial Corporation and President and Chief Executive Officer of Mellon Asset Management. He joined Mellon in February 1997. Mr. O'Hanley currently serves as Chairman of the Boston Public Library Foundation Board of Directors and sits on the Board of Directors of Beth Israel Deaconess Medical Center, the Board of Trustees of the Marine Biological Laboratory and the Advisory Board of the Maxwell School of Citizenship and Public Administration at Syracuse University. Mr. O'Hanley also chairs the Council on Asset Management for the Financial Services Roundtable and is a member of the Board of Directors of Institutional Investor's U.S. Institute. |
* Trustees have been determined to be "Interested Trustees" by virtue of, among other things, their affiliation with the trust or various entities under common control with FMR.
+ The information above includes each Trustee's principal occupation during the last five years and other information relating to the experience, attributes, and skills relevant to each Trustee's qualifications to serve as a Trustee, which led to the conclusion that each Trustee should serve as a Trustee for the fund.
Annual Report
Independent Trustees:
Correspondence intended for each Independent Trustee (that is, the Trustees other than the Interested Trustees) may be sent to Fidelity Investments, P.O. Box 55235, Boston, Massachusetts 02205-5235.
Name, Age; Principal Occupations and Other Relevant Experience+ |
Dennis J. Dirks (64) |
| Year of Election or Appointment: 2005 Prior to his retirement in May 2003, Mr. Dirks was Chief Operating Officer and a member of the Board of The Depository Trust & Clearing Corporation (DTCC). He also served as President, Chief Operating Officer, and Board member of The Depository Trust Company (DTC) and President and Board member of the National Securities Clearing Corporation (NSCC). In addition, Mr. Dirks served as Chief Executive Officer and Board member of the Government Securities Clearing Corporation, Chief Executive Officer and Board member of the Mortgage-Backed Securities Clearing Corporation, as a Trustee and a member of the Finance Committee of Manhattan College (2005-2008), and as a Trustee and a member of the Finance Committee of AHRC of Nassau County (2006-2008). Mr. Dirks is a member of the Independent Directors Council (IDC) Governing Council (2010-present) and Board of Directors for The Brookville Center for Children's Services, Inc. (2009-present). |
Alan J. Lacy (58) |
| Year of Election or Appointment: 2008 Mr. Lacy serves as Senior Adviser (2007-present) of Oak Hill Capital Partners, L.P. (private equity). Mr. Lacy also served as Chief Executive Officer (2000-2005) and Vice Chairman (2005-2006) of Sears Holdings Corporation and Sears, Roebuck and Co. (retail). In addition, Mr. Lacy serves as a member of the Board of Directors of Dave & Buster's Entertainment, Inc. (restaurant and entertainment complexes, 2010-present), Earth Fare, Inc. (retail grocery, 2012-present), The Hillman Companies, Inc. (hardware wholesalers, 2010-present), and Bristol-Myers Squibb Company (global pharmaceuticals, 2007-present). Mr. Lacy is a member of the Board of Trustees of The National Parks Conservation Association (2006-present). Previously, Mr. Lacy served as Chairman of the Board of Trustees of the National Parks Conservation Association (2008-2011) and as a member of the Board of Directors for the Western Union Company (global money transfer, 2006-2011). |
Ned C. Lautenbach (68) |
| Year of Election or Appointment: 2000 Mr. Lautenbach is Chairman of the Independent Trustees of the Equity and High Income Funds (2006-present). Mr. Lautenbach currently serves as the Lead Director of the Eaton Corporation Board of Directors (diversified industrial, 1997-present). Mr. Lautenbach is Chairman of the Board of Directors of the Philharmonic Center for the Arts in Naples, Florida (2012-present) and a member of the Council on Foreign Relations (1994-present). Previously, Mr. Lautenbach was a Partner/Advisory Partner at Clayton, Dubilier & Rice, LLC (private equity investment, 1998-2010), as well as a Director of Sony Corporation (2006-2007). |
Joseph Mauriello (67) |
| Year of Election or Appointment: 2008 Prior to his retirement in January 2006, Mr. Mauriello served in numerous senior management positions including Deputy Chairman and Chief Operating Officer (2004-2005), and Vice Chairman of Financial Services (2002-2004) of KPMG LLP US (professional services, 1965-2005). Mr. Mauriello currently serves as a member of the Board of Directors of XL Group plc. (global insurance and re-insurance, 2006-present). Previously, Mr. Mauriello served as a Director of the Hamilton Funds of the Bank of New York (2006-2007) and of Arcadia Resources Inc. (health care services and products, 2007-2012). |
Robert W. Selander (61) |
| Year of Election or Appointment: 2011 Previously, Mr. Selander served as a Member of the Advisory Board of Fidelity's Equity and High Income Funds (2011), Executive Vice Chairman (2010), Chief Executive Officer (2009-2010), and President and Chief Executive Officer (1997-2009) of Mastercard, Inc. |
Cornelia M. Small (68) |
| Year of Election or Appointment: 2005 Ms. Small is a member of the Board of Directors of the Teagle Foundation (2009-present). Ms. Small is also a member of the Investment Committee, and Chair (2008-present) and a member of the Board of Trustees of Smith College. In addition, Ms. Small serves on the Investment Committee of the Berkshire Taconic Community Foundation (2008-present). Previously, Ms. Small served as Chairperson of the Investment Committee (2002-2008) of Smith College. In addition, Ms. Small served as Chief Investment Officer, Director of Global Equity Investments, and a member of the Board of Directors of Scudder, Stevens & Clark and Scudder Kemper Investments. |
William S. Stavropoulos (73) |
| Year of Election or Appointment: 2002 Mr. Stavropoulos is Vice Chairman of the Independent Trustees of the Equity and High Income Funds (2006-present). Mr. Stavropoulos serves as President and Founder of the Michigan Baseball Foundation, the Great Lakes Loons (2007-present). Mr. Stavropoulos is Chairman Emeritus of the Board of Directors of The Dow Chemical Company, where he previously served in numerous senior management positions, including President, CEO (1995-2000; 2002-2004), Chairman of the Executive Committee (2000-2006), and as a member of the Board of Directors (1990-2006). Currently, Mr. Stavropoulos is Chairman of Univar (global distributor of commodity and specialty chemicals, 2010-present), a Director of Teradata Corporation (data warehousing and technology solutions, 2008-present), Chemical Financial Corporation, Maersk Inc. (industrial conglomerate), Tyco International, Inc. (multinational manufacturing and services, 2007-present), and a member of the Advisory Board for Metalmark Capital (private equity investment, 2005-present). Mr. Stavropoulos is a special advisor to Clayton, Dubilier & Rice, LLC (private equity investment). In addition, Mr. Stavropoulos is a member of the University of Notre Dame Advisory Council for the College of Science. |
David M. Thomas (63) |
| Year of Election or Appointment: 2008 Previously, Mr. Thomas served as Executive Chairman (2005-2006) and Chairman and Chief Executive Officer (2000-2005) of IMS Health, Inc. (pharmaceutical and healthcare information solutions). In addition, Mr. Thomas serves as a member of the Board of Directors of Fortune Brands, Inc. (consumer products), and Interpublic Group of Companies, Inc. (marketing communication, 2004-present). |
Michael E. Wiley (61) |
| Year of Election or Appointment: 2008 Mr. Wiley also serves as a Director of Asia Pacific Exploration Consolidated (international oil and gas exploration and production, 2008-present). Mr. Wiley serves as a Director of Tesoro Corporation (independent oil refiner and marketer, 2005-present), and a Director of Bill Barrett Corporation (exploration and production, 2005-present). In addition, Mr. Wiley also serves as a Director of Post Oak Bank (privately-held bank, 2004-present). Previously, Mr. Wiley served as a member of the Board of Trustees of the University of Tulsa (2000-2006; 2007-2010), as a Senior Energy Advisor of Katzenbach Partners, LLC (consulting, 2006-2007), as an Advisory Director of Riverstone Holdings (private investment), Chairman, President, and CEO of Baker Hughes, Inc. (oilfield services, 2000-2004), and as Director of Spinnaker Exploration Company (exploration and production, 2001-2005). |
Annual Report
Trustees and Officers - continued
+ The information above includes each Trustee's principal occupation during the last five years and other information relating to the experience, attributes, and skills relevant to each Trustee's qualifications to serve as a Trustee, which led to the conclusion that each Trustee should serve as a Trustee for the fund.
Advisory Board Members and Executive Officers:
Correspondence intended for David A. Rosow and Garnett A. Smith may be sent to Fidelity Investments, P.O. Box 55235, Boston, Massachusetts 02205-5235. Correspondence intended for each executive officer, Edward C. Johnson 3d, and Peter S. Lynch may be sent to Fidelity Investments, 82 Devonshire Street, Boston, Massachusetts 02109.
Name, Age; Principal Occupation |
Edward C. Johnson 3d (82) |
| Year of Election or Appointment: 2011 Member of the Advisory Board of Fidelity's Equity and High Income Funds. Mr. Johnson serves as Chief Executive Officer, Chairman, and a Director of FMR LLC, and also serves as Chairman and Director of FIL Limited. Previously, Mr. Johnson served as a Trustee and Chairman of the Board of certain Fidelity Trusts, Chairman and a Director of FMR, Chairman and a Director of FMR Co., Inc., and President of FMR LLC (2006-2007). |
Peter S. Lynch (68) |
| Year of Election or Appointment: 2003 Member of the Advisory Board of Fidelity's Equity and High Income Funds. Mr. Lynch is Vice Chairman and a Director of FMR and FMR Co., Inc. In addition, Mr. Lynch serves as a Trustee of Boston College and as the Chairman of the Inner-City Scholarship Fund. Previously, Mr. Lynch served on the Special Olympics International Board of Directors (1997-2006). |
David A. Rosow (69) |
| Year of Election or Appointment: 2012 Member of the Advisory Board of Fidelity's Equity and High Income Funds. Chairman and Chief Executive Officer of International Golf Group, Inc. (golf course development, 1990-present). Previously, Mr. Rosow served as Chairman and Chief Executive Officer of Rosow & Company, Inc. (private investment company, 1989-2011), a Lead Director of Hudson United Bancorp (2001-2006) and as a Director of TD Banknorth (1996-2006). In addition, Mr. Rosow is a member (2008-present) and President (2009-present) of the Town Council of Palm Beach, Florida. |
Garnett A. Smith (64) |
| Year of Election or Appointment: 2012 Member of the Advisory Board of Fidelity's Equity and High Income Funds. Prior to Mr. Smith's retirement, he served as Chairman and Chief Executive Officer of Inbrand Corp. (manufacturer of personal absorbent products, 1990-1997). He also served as President (1986-1990) of Inbrand Corp. Prior to his employment with Inbrand Corp., he was employed by a retail fabric chain and North Carolina National Bank. In addition, Mr. Smith is a board member of the Jackson Hole Land Trust (2009-present). |
Kenneth B. Robins (42) |
| Year of Election or Appointment: 2008 President and Treasurer of Fidelity's Equity and High Income Funds. Mr. Robins also serves as President and Treasurer (2010-present) and Assistant Treasurer (2009-present) of other Fidelity funds and is an employee of Fidelity Investments (2004-present). Previously, Mr. Robins served as Deputy Treasurer of the Fidelity funds (2005-2008) and Treasurer and Chief Financial Officer of The North Carolina Capital Management Trust: Cash and Term Portfolios (2006-2008). |
Brian B. Hogan (47) |
| Year of Election or Appointment: 2009 Vice President of Equity and High Income Funds. Mr. Hogan also serves as President of FMR's Equity Division (2009-present). Previously, Mr. Hogan served as Senior Vice President, Equity Research of FMR (2006-2009) and as a portfolio manager. |
Thomas C. Hense (48) |
| Year of Election or Appointment: 2008 or 2010 Vice President of Fidelity's High Income (2008), Small Cap (2008), and Value (2010) Funds. Previously, Mr. Hense served as a portfolio manager for Fidelity's Institutional Money Management Group (Pyramis) (2003-2008). |
Scott C. Goebel (44) |
| Year of Election or Appointment: 2008 Secretary and Chief Legal Officer (CLO) of the Fidelity funds. Mr. Goebel also serves as Secretary of Fidelity Investments Money Management, Inc. (FIMM) (2010-present) and Fidelity Research and Analysis Company (FRAC) (2010-present); Secretary and CLO of The North Carolina Capital Management Trust: Cash and Term Portfolios (2008-present); General Counsel, Secretary, and Senior Vice President of FMR (2008-present) and FMR Co., Inc. (2008-present); employed by FMR LLC or an affiliate (2001-present); Chief Legal Officer of Fidelity Management & Research (Hong Kong) Limited (2008-present) and Assistant Secretary of Fidelity Management & Research (Japan) Inc. (2008-present), and Fidelity Management & Research (U.K.) Inc. (2008-present). Previously, Mr. Goebel served as Assistant Secretary of FIMM (2008-2010), FRAC (2008-2010), and the Funds (2007-2008) and as Vice President and Secretary of Fidelity Distributors Corporation (FDC) (2005-2007). |
William C. Coffey (43) |
| Year of Election or Appointment: 2009 Assistant Secretary of Fidelity's Equity and High Income Funds. Mr. Coffey also serves as Senior Vice President and Deputy General Counsel of FMR LLC (2010-present), and is an employee of Fidelity Investments. Previously, Mr. Coffey served as Vice President and Associate General Counsel of FMR LLC (2005-2009). |
Elizabeth Paige Baumann (44) |
| Year of Election or Appointment: 2012 Anti-Money Laundering (AML) Officer of the Fidelity funds. Ms. Baumann also serves as AML Officer of The North Carolina Capital Management Trust: Cash and Term Portfolios (2012-present), Chief AML Officer of FMR LLC (2012-present), and is an employee of Fidelity Investments. Previously, Ms. Baumann served as Vice President and Deputy Anti-Money Laundering Officer (2007-2012). |
Christine Reynolds (53) |
| Year of Election or Appointment: 2008 Chief Financial Officer of the Fidelity funds. Ms. Reynolds became President of Fidelity Pricing and Cash Management Services (FPCMS) in August 2008. Ms. Reynolds served as Chief Operating Officer of FPCMS (2007-2008). Previously, Ms. Reynolds served as President, Treasurer, and Anti-Money Laundering officer of the Fidelity funds (2004-2007). |
Joseph A. Hanlon (44) |
| Year of Election or Appointment: 2012 Chief Compliance Officer of Fidelity's Equity and High Income Funds. Mr. Hanlon serves as Compliance Officer of FMR, FMR Co., Inc., Fidelity Investments Money Management, Inc. (FIMM), Fidelity Research and Analysis Company (FRAC), Fidelity Management & Research (Japan) Inc., Fidelity Management & Research (U.K.) Inc., Fidelity Management & Research (Hong Kong), and Strategic Advisers, Inc. (2009-present), as Senior Vice President of the Fidelity Asset Management Division (2009-present), and is an employee of Fidelity Investments. |
Joseph F. Zambello (55) |
| Year of Election or Appointment: 2011 Deputy Treasurer of the Fidelity funds. Mr. Zambello is an employee of Fidelity Investments. Previously, Mr. Zambello served as Vice President of FMR's Program Management Group (2009-2011) and Vice President of the Transfer Agent Oversight Group (2005-2009). |
Adrien E. Deberghes (44) |
| Year of Election or Appointment: 2008 Deputy Treasurer of Fidelity's Equity and High Income Funds. Mr. Deberghes also serves as Vice President (2011-present) and Assistant Treasurer (2010-present) of other Fidelity funds, and is an employee of Fidelity Investments (2008-present). Previously, Mr. Deberghes served as Senior Vice President of Mutual Fund Administration at State Street Corporation (2007-2008), Senior Director of Mutual Fund Administration at Investors Bank & Trust (2005-2007), and Director of Finance for Dunkin' Brands (2000-2005). |
Stephanie J. Dorsey (43) |
| Year of Election or Appointment: 2010 Assistant Treasurer of Fidelity's Equity and High Income Funds. Ms. Dorsey also serves as Deputy Treasurer of other Fidelity funds (2008-present) and is an employee of Fidelity Investments (2008-present). Previously, Ms. Dorsey served as Treasurer (2004-2008) of the JPMorgan Mutual Funds and Vice President (2004-2008) of JPMorgan Chase Bank. |
John R. Hebble (54) |
| Year of Election or Appointment: 2009 Assistant Treasurer of Fidelity's Equity and High Income Funds. Mr. Hebble also serves as President (2011-present), Treasurer, and Chief Financial Officer of The North Carolina Capital Management Trust: Cash and Term Portfolios (2008-present), President and Treasurer of other Fidelity funds (2008-present) and is an employee of Fidelity Investments. |
Gary W. Ryan (53) |
| Year of Election or Appointment: 2005 Assistant Treasurer of the Fidelity funds. Mr. Ryan is an employee of Fidelity Investments. Previously, Mr. Ryan served as Vice President of Fund Reporting in Fidelity Pricing and Cash Management Services (FPCMS) (1999-2005). |
Jonathan Davis (44) |
| Year of Election or Appointment: 2010 Assistant Treasurer of the Fidelity funds. Mr. Davis is also Assistant Treasurer of Fidelity Rutland Square Trust II and Fidelity Commonwealth Trust II. Mr. Davis is an employee of Fidelity Investments. Previously, Mr. Davis served as Vice President and Associate General Counsel of FMR LLC (2003-2010). |
Annual Report
The Board of Trustees of Fidelity Series Small Cap Opportunities Fund voted to pay to shareholders of record at the opening of business on record date, the following distributions per share derived from capital gains realized from sales of portfolio securities, and dividends derived from net investment income:
| Pay Date | Record Date | Dividends | Capital Gains |
Fidelity Series Small Cap Opportunities Fund | 09/10/12 | 09/07/12 | 0.003 | 0.440 |
Class F | 09/10/12 | 09/07/12 | 0.016 | 0.440 |
The fund hereby designates as a capital gain dividend with respect to the taxable year ended July 31, 2012, $93,030,224, or, if subsequently determined to be different, the net capital gain of such year.
Series Small Cap Opportunities and Class F designate 100% of the dividend distributed during the fiscal year as qualifying for the dividends-received deduction for corporate shareholders.
Series Small Cap Opportunities and Class F designate 100% of the dividend distributed during the fiscal year as amounts which may be taken into account as a dividend for purposes of the maximum rate under section 1(h)(11) of the Internal Revenue Code.
The fund will notify shareholders in January 2013 of amounts for use in preparing 2012 income tax returns.
Annual Report
Board Approval of Investment Advisory Contracts and Management Fees
Fidelity Series Small Cap Opportunities Fund
Each year, the Board of Trustees, including the Independent Trustees (together, the Board), votes on the renewal of the management contract and sub-advisory agreements (together, the Advisory Contracts) for the fund. The Board, assisted by the advice of fund counsel and Independent Trustees' counsel, requests and considers a broad range of information relevant to the renewal of the Advisory Contracts throughout the year.
The Board meets regularly and, at each of its meetings, considers factors that are relevant to its annual consideration of the renewal of the fund's Advisory Contracts, including the services and support provided to the fund and its shareholders. The Board has established various standing committees, each composed of and chaired by Independent Trustees with varying backgrounds, to which the Board has assigned specific subject matter responsibilities in order to enhance effective decision-making by the Board. The Board, acting directly and through its Committees, requests and receives information concerning the annual consideration of the renewal of the fund's Advisory Contracts. The Board also meets as needed to consider matters specifically related to the Board's annual consideration of the renewal of Advisory Contracts. Members of the Board may also meet with trustees of other Fidelity funds through ad hoc joint committees to discuss certain matters relevant to the Fidelity funds.
At its July 2012 meeting, the Board of Trustees, including the Independent Trustees, unanimously determined to renew the fund's Advisory Contracts. In reaching its determination, the Board considered all factors it believed relevant, including (i) the nature, extent, and quality of the services to be provided to the fund and its shareholders (including the investment performance of the fund); (ii) the competitiveness of the fund's management fee and total expense ratio relative to peer funds; (iii) the total costs of the services to be provided by and the profits to be realized by Fidelity from its relationship with the fund; (iv) the extent to which economies of scale exist and would be realized as the fund grows; and (v) whether fee levels reflect these economies of scale, if any, for the benefit of fund shareholders.
In considering whether to renew the Advisory Contracts for the fund, the Board reached a determination, with the assistance of fund counsel and Independent Trustees' counsel and through the exercise of its business judgment, that the renewal of the Advisory Contracts is in the best interests of the fund and its shareholders and that the compensation payable under the Advisory Contracts is fair and reasonable. The Board's decision to renew the Advisory Contracts was not based on any single factor, but rather was based on a comprehensive consideration of all the information provided to the Board at its meetings throughout the year. The Board, in reaching its determination to renew the Advisory Contracts, is aware that shareholders in the fund have a broad range of investment choices available to them, including a wide choice among mutual funds offered by Fidelity's competitors, and that the fund's shareholders, who have the opportunity to review and weigh the disclosure provided by the fund in its prospectus and other public disclosures, have chosen to invest in this fund, managed by Fidelity.
Annual Report
Nature, Extent, and Quality of Services Provided. The Board considered the staffing within the investment adviser, FMR, and the sub-advisers (together, the Investment Advisers), including the backgrounds of the fund's investment personnel, and also considered the fund's investment objective, strategies, and related investment philosophy. The Independent Trustees also had discussions with senior management of Fidelity's investment operations and investment groups. The Board considered the structure of the portfolio manager compensation program and whether this structure provides appropriate incentives to act in the best interests of the fund.
Resources Dedicated to Investment Management and Support Services. The Board and the Fund Oversight and Research Committees reviewed the general qualifications and capabilities of the Investment Advisers' investment staff, including its size, education, experience, and resources, as well as the Investment Advisers' approach to recruiting, training, managing, and compensating investment personnel. The Board also noted that FMR has continued to increase the resources devoted to non-U.S. offices, including expansion of Fidelity's global investment organization. The Board noted that Fidelity's analysts have extensive resources, tools and capabilities that allow them to conduct sophisticated quantitative and fundamental analysis, as well as credit analysis of issuers, counterparties and guarantors. The Board also believes that Fidelity's investment professionals have sufficient access to global information and data so as to provide competitive investment results over time, and that those professionals also have access to sophisticated tools that permit them to assess portfolio construction and risk and performance attribution characteristics continuously, as well as to transmit new information and research conclusions rapidly around the world. Additionally, in its deliberations, the Board considered the Investment Advisers' trading and risk management capabilities and resources, which are an integral part of the investment management process.
Shareholder and Administrative Services. The Board considered (i) the nature, extent, quality, and cost of advisory, administrative, and shareholder services performed by the Investment Advisers and their affiliates under the Advisory Contracts and under separate agreements covering transfer agency, pricing and bookkeeping, and securities lending services for the fund; (ii) the nature and extent of the supervision of third party service providers, principally custodians and subcustodians; and (iii) the resources devoted to, and the record of compliance with, the fund's compliance policies and procedures. The Board also reviewed the allocation of fund brokerage, including allocations to brokers affiliated with the Investment Advisers, the use of brokerage commissions to pay fund expenses, and the use of "soft" commission dollars to pay for research services.
Annual Report
Board Approval of Investment Advisory Contracts and
Management Fees - continued
The Board noted that the growth of fund assets over time across the complex allows Fidelity to reinvest in the development of services designed to enhance the value or convenience of the Fidelity funds as investment vehicles. These services include 24-hour access to account information and market information through telephone representatives and over the Internet, investor education materials and asset allocation tools, and the expanded availability of Fidelity Investor Centers.
Investment in a Large Fund Family. The Board considered the benefits to shareholders of investing in a Fidelity fund, including the benefits of investing in a fund that is part of a large family of funds offering a variety of investment disciplines and providing a large variety of mutual fund investor services. The Board noted that Fidelity had taken, or had made recommendations that resulted in the Fidelity funds taking, a number of actions over the previous year that benefited particular funds, including (i) continuing to dedicate additional resources to investment research and support of the senior management team that oversees asset management; (ii) persisting in efforts to enhance Fidelity's research capabilities, in particular, international research; (iii) launching new funds and making other enhancements to meet client needs for global and income-oriented solutions; (iv) continuing to launch dedicated lower cost underlying funds to meet investment management's portfolio construction needs related to expanding underlying fund options, specifically for the Freedom Fund product lines; (v) adopting a "Stock Selector" sector neutral investment approach and employing a team of portfolio managers who are sector specialists to manage certain funds; (vi) rationalizing product lines and gaining increased efficiencies through the mergers of several funds into other funds; (vii) strengthening the Spartan Index Fund product line by adding new funds and/or new low-cost institutional share classes, restructuring fund expenses to accommodate new classes, and reducing investment minimums for certain classes of shares; (viii) modifying the eligibility criteria for Institutional Class shares to increase their appeal to government entities and charitable investors; and (ix) reducing certain transfer agent fee rates.
Investment Performance. The Board considered whether the fund has operated in accordance with its investment objective, as well as its record of compliance with its investment restrictions. It also reviewed the fund's absolute investment performance for each class, as well as the fund's relative investment performance for each class measured over multiple periods against (i) a broad-based securities market index, and (ii) a peer group of mutual funds deemed appropriate by Fidelity and reviewed by the Board. Because the fund had been in existence less than five calendar years, the following charts considered by the Board show, over the one- and three-year periods ended December 31, 2011, as available, the cumulative total returns of Class F and the retail class of the fund, the cumulative total returns of a broad-based securities market index ("benchmark"), and a range of cumulative total returns of a peer group of mutual funds identified by Morningstar, Inc. as having an investment style similar to that of the fund based on underlying portfolio holdings. The box within each chart shows the 25th percentile return (top of box) and the 75th percentile return (bottom of box) of the peer group. Returns shown above the box are in the first quartile and returns shown below the box are in the fourth quartile. The percentage beaten numbers noted below each chart correspond to the percentile box and represent the percentage of funds in the peer group whose performance was equal to or lower than that of the class indicated.
Annual Report
Fidelity Series Small Cap Opportunities Fund
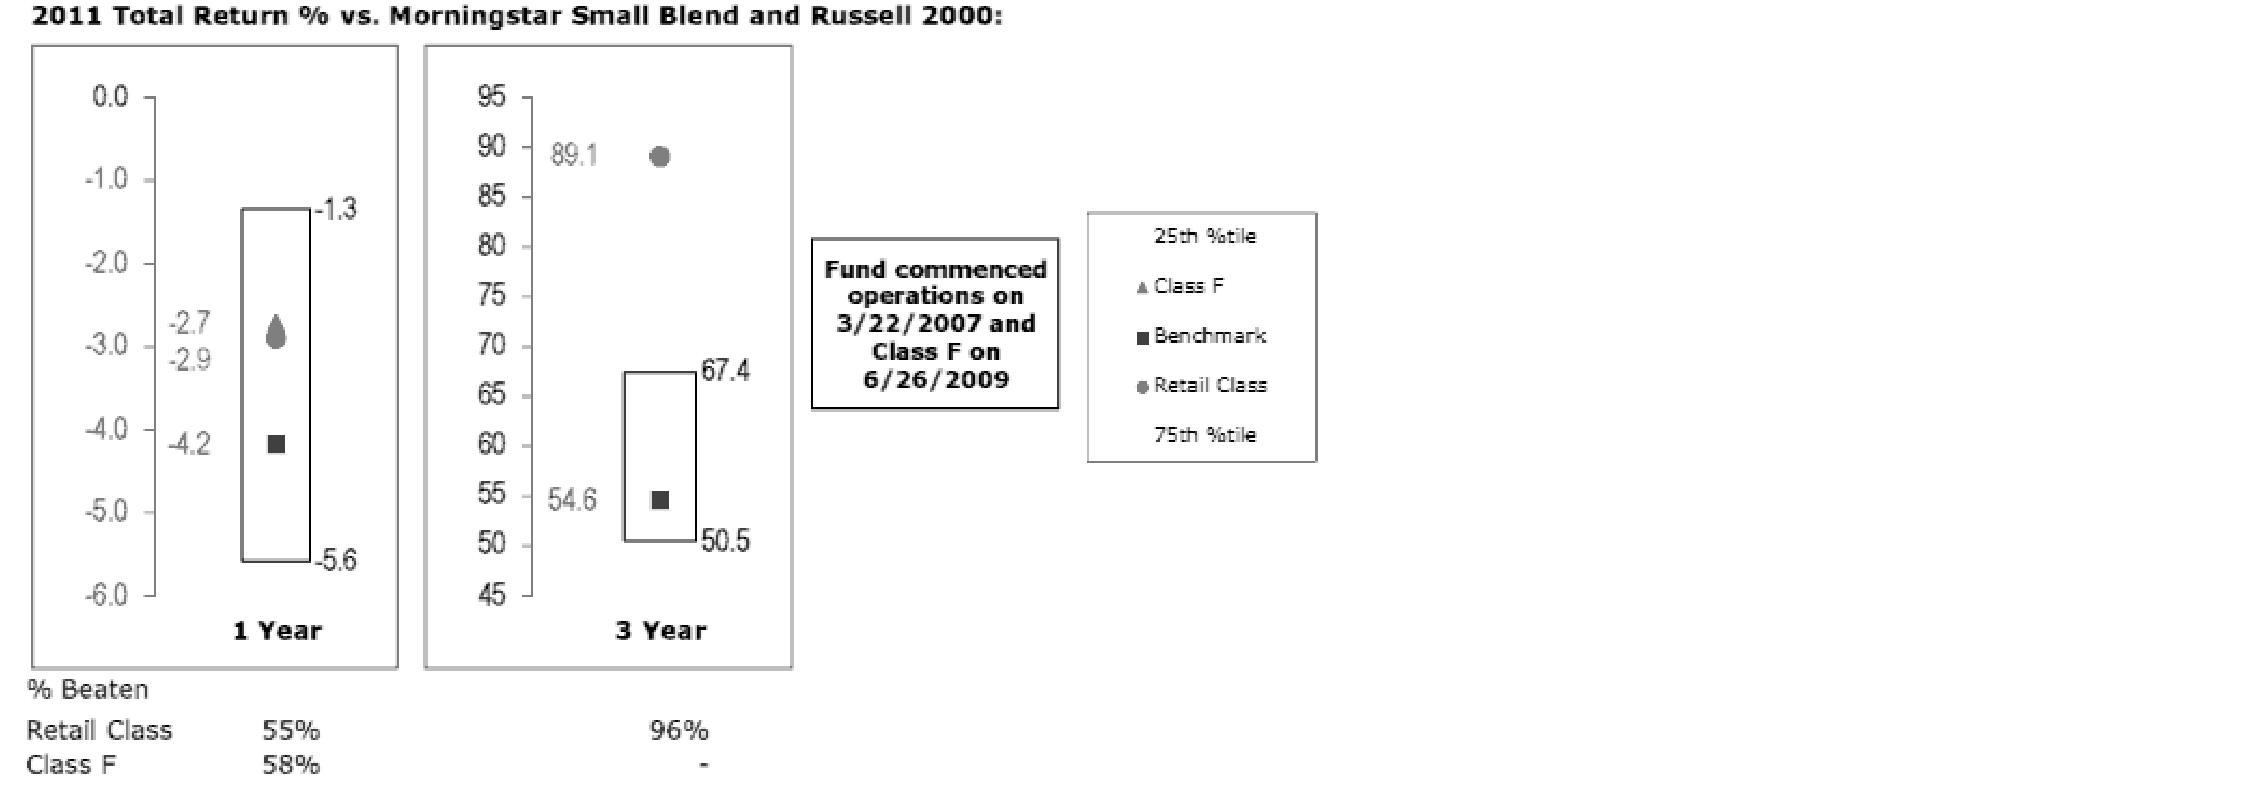
The Board reviewed the fund's relative investment performance against its peer group and noted that the performance of the retail class of the fund (the class with the longer performance record) was in the second quartile for the one-year period and the first quartile for the three-year period. The Board also noted that the investment performance of the retail class of the fund compared favorably to its benchmark for all the periods shown. The Board considered that the variations in performance between the fund's classes reflect the variations in class expenses, which result in lower performance for the higher expense class. The Board noted that there were portfolio management changes for the fund in April 2012, February 2012 and December 2011. The Board also reviewed the fund's performance since inception as well as performance in the current year.
The Board also considered that the fund's management fee is subject to upward or downward adjustment depending upon whether, and to what extent, the fund's investment performance for the performance period exceeds, or is exceeded by, the record (over the same period) of a Board-approved performance adjustment index. The Board noted that the performance adjustment provides FMR with a strong economic incentive to seek to achieve superior performance for the fund's shareholders and helps to more closely align the interests of FMR and the fund's shareholders.
Annual Report
Board Approval of Investment Advisory Contracts and
Management Fees - continued
Based on its review, the Board concluded that the nature, extent, and quality of services provided to the fund under the Advisory Contracts should benefit the fund's shareholders.
Competitiveness of Management Fee and Total Expense Ratio. The Board considered the fund's management fee and total expense ratio compared to "mapped groups" of competitive funds and classes. Fidelity creates "mapped groups" by combining similar Lipper investment objective categories that have comparable management fee characteristics. Combining Lipper investment objective categories aids the Board's management fee and total expense ratio comparisons by broadening the competitive group used for comparison and by reducing the number of universes to which various Fidelity funds are compared.
Management Fee. The Board considered two proprietary management fee comparisons for the 12-month (or shorter) periods shown in the chart below. The group of Lipper funds used by the Board for management fee comparisons is referred to below as the "Total Mapped Group." The Total Mapped Group comparison focuses on a fund's standing relative to the total universe of comparable funds available to investors in terms of gross management fees before expense reimbursements or caps, and without giving effect to the fund's performance adjustment. "TMG %" represents the percentage of funds in the Total Mapped Group that had management fees that were lower than the fund's. For example, a TMG % of 13% means that 87% of the funds in the Total Mapped Group had higher management fees than the fund. The "Asset-Size Peer Group" (ASPG) comparison focuses on a fund's standing relative to non-Fidelity funds similar in size to the fund within the Total Mapped Group. The ASPG represents at least 15% of the funds in the Total Mapped Group with comparable asset size and management fee characteristics, subject to a minimum of 50 funds (or all funds in the Total Mapped Group if fewer than 50). Additional information, such as the ASPG quartile in which the fund's management fee ranked and the impact of the fund's performance adjustment, is also included in the chart and considered by the Board.
Annual Report
Fidelity Series Small Cap Opportunities Fund
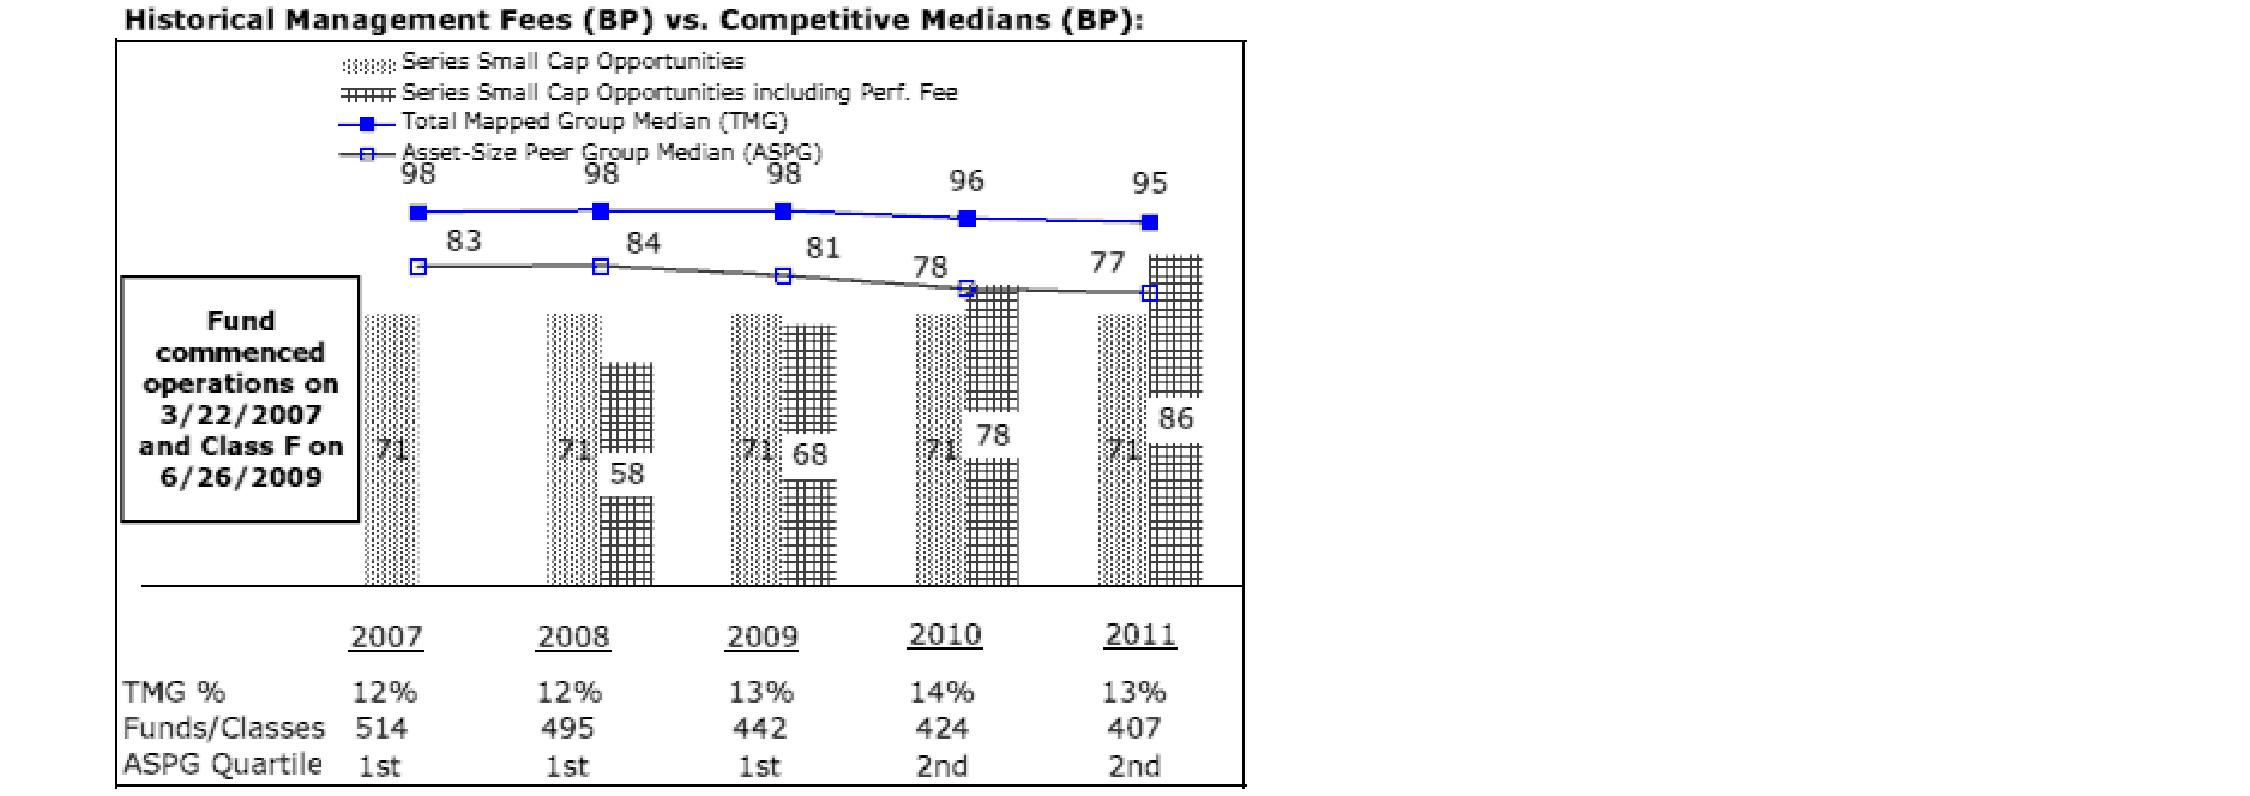
The Board noted that the fund's management fee ranked below the median of its Total Mapped Group and below the median of its ASPG for 2011. The Board also noted the effect of the fund's positive performance adjustment on the fund's management fee ranking. The Board noted that the performance adjustment for each year represents calculations for performance periods that differ from the periods shown in the performance charts above.
Based on its review, the Board concluded that the fund's management fee is fair and reasonable in light of the services that the fund receives and the other factors considered.
Total Expense Ratio. In its review of each class's total expense ratio, the Board considered the fund's management fee as well as other fund or class expenses, as applicable, such as transfer agent fees, pricing and bookkeeping fees, and custodial, legal, and audit fees. The Board also noted the effects of any waivers and reimbursements on fees and expenses, as well as the impact of the fund's performance adjustment. As part of its review, the Board also considered the current total expense ratios of each class of the fund compared to competitive fund median expenses. Each class of the fund is compared to those funds and classes in the Total Mapped Group (used by the Board for management fee comparisons) that have a similar sales load structure.
The Board noted that the total expense ratio of each class ranked below its competitive median for 2011.
Annual Report
Board Approval of Investment Advisory Contracts and
Management Fees - continued
Fees Charged to Other Fidelity Clients. The Board also considered Fidelity fee structures and other information with respect to clients of FMR and its affiliates, such as other mutual funds advised or subadvised by FMR or its affiliates, pension plan clients, and other institutional clients. The Board noted the findings of the 2010 ad hoc joint committee (created with the board of other Fidelity funds), which reviewed and compared Fidelity's institutional investment advisory business with its business of providing services to the Fidelity funds, including the differences in services provided, fees charged, and costs incurred, as well as competition in their respective marketplaces.
Based on its review of total expense ratios and fees charged to other Fidelity clients, the Board concluded that the total expense ratio of each class of the fund was reasonable in light of the services that the fund and its shareholders receive and the other factors considered.
Costs of the Services and Profitability. The Board considered the revenues earned and the expenses incurred by Fidelity in conducting the business of developing, marketing, distributing, managing, administering and servicing the fund and its shareholders. The Board also considered the level of Fidelity's profits in respect of all the Fidelity funds.
On an annual basis, FMR presents to the Board Fidelity's profitability for the fund. Fidelity calculates the profitability for each fund, as well as aggregate profitability for groups of Fidelity funds and all Fidelity funds, using a series of detailed revenue and cost allocation methodologies which originate with the books and records of Fidelity on which Fidelity's audited financial statements are based. The Audit Committee of the Board reviews any significant changes from the prior year's methodologies.
PricewaterhouseCoopers LLP (PwC), independent registered public accounting firm and auditor to Fidelity and certain Fidelity funds, has been engaged annually by the Board as part of the Board's assessment of Fidelity's profitability analysis. PwC's engagement includes the review and assessment of Fidelity's methodologies used in determining the revenues and expenses attributable to Fidelity's mutual fund business, and completion of agreed-upon procedures surrounding the mathematical accuracy of fund profitability and its conformity to allocation methodologies. After considering PwC's reports issued under the engagement and information provided by Fidelity, the Board concluded that while other allocation methods may also be reasonable, Fidelity's profitability methodologies are reasonable in all material respects.
The Board also reviewed Fidelity's non-fund businesses and fall-out benefits related to the mutual fund business as well as cases where Fidelity's affiliates may benefit from or be related to the fund's business.
Annual Report
The Board considered the costs of the services provided by and the profits realized by Fidelity in connection with the operation of the fund and was satisfied that the profitability was not excessive in the circumstances.
Economies of Scale. The Board considered whether there have been economies of scale in respect of the management of the Fidelity funds, whether the Fidelity funds (including the fund) have appropriately benefited from any such economies of scale, and whether there is potential for realization of any further economies of scale. The Board considered the extent to which the fund will benefit from economies of scale through increased services to the fund, through waivers or reimbursements, or through fee or expense reductions. The Board also noted that in 2009, it and the board of other Fidelity funds created an ad hoc committee (the Economies of Scale Committee) to analyze whether FMR attains economies of scale in respect of the management and servicing of the Fidelity funds, whether the Fidelity funds have appropriately benefited from such economies of scale, and whether there is potential for realization of any further economies of scale.
The Board recognized that the fund's management contract incorporates a "group fee" structure, which provides for lower group fee rates as total fund assets under FMR's management increase, and for higher group fee rates as total fund assets under FMR's management decrease. FMR calculates the group fee rates based on a tiered asset "breakpoint" schedule that varies based on asset class. The Board considered that the group fee is designed to deliver the benefits of economies of scale to fund shareholders when total Fidelity fund assets increase, even if assets of any particular fund are unchanged or have declined, because some portion of Fidelity's costs are attributable to services provided to all Fidelity funds, and all funds benefit if those costs can be allocated among more assets. The Board also considered that although the fund is offered only to other funds advised by FMR or an affiliate, it continues to incur investment management expenses. The Board further noted that the fund may continue to realize benefits from the group fee structure, even though assets may not be expected to grow significantly at the fund level. The Board concluded that, given the group fee structure, fund shareholders will benefit from lower management fees as assets under FMR's management increase at the fund complex level, regardless of whether Fidelity achieves any such economies of scale.
The Board concluded, taking into account the analysis of the Economies of Scale Committee, that economies of scale, if any, are being appropriately shared between fund shareholders and Fidelity.
Additional Information Requested by the Board. In order to develop fully the factual basis for consideration of the Fidelity funds' Advisory Contracts, the Board requested and received additional information on certain topics, including (i) fund performance trends, actions to be taken by FMR to improve certain funds' overall performance, and Fidelity's long-term strategies for certain funds; (ii) the potential to further rationalize the Fidelity fund lineup with the possibility of achieving savings for the funds and Fidelity; (iii) Fidelity's compensation structure for portfolio managers and other key investment personnel; (iv) the amount of the investment that each portfolio manager has made in the Fidelity fund(s) that he or she manages; (v) the realization of fall-out benefits in certain Fidelity business units; (vi) Fidelity's group fee structures, the potential impact of regulatory changes on such structures, and the rationale for the individual fee rates of certain funds; (vii) fund profitability methodology, including Fidelity's cost allocation methodology, and the impact of certain factors on fund profitability results; (viii) trends regarding industry use of performance fee structures and the possibility of implementing performance fee structures for additional funds; and (ix) the impact of net redemptions from the Fidelity funds.
Annual Report
Board Approval of Investment Advisory Contracts and
Management Fees - continued
Based on its evaluation of all of the conclusions noted above, and after considering all factors it believed relevant, the Board ultimately concluded that the advisory fee structures are fair and reasonable, and that the fund's Advisory Contracts should be renewed.
Annual Report
Investment Adviser
Fidelity Management & Research Company
Boston, MA
Investment Sub-Advisers
FMR Co., Inc.
Fidelity Management & Research (U.K.) Inc.
Fidelity Management & Research
(Hong Kong) Limited
Fidelity Management & Research
(Japan) Inc.
FIL Investments (Japan) Limited
FIL Investment Advisors
FIL Investment Advisors (UK) Limited
General Distributor
Fidelity Distributors Corporation
Smithfield, RI
Transfer and Service Agents
Fidelity Investments Institutional Operations Company, Inc.
Boston, MA
Fidelity Service Company, Inc.
Boston, MA
Custodian
Citibank, N.A.
New York, NY
(Fidelity Investment logo)(registered trademark)
Corporate Headquarters
82 Devonshire St., Boston, MA 02109
www.fidelity.com
SMO-ANN-0912
1.839807.105
Fidelity®
Series Real Estate Equity
Fund
Fidelity Series Real Estate Equity Fund
Class F
Annual Report
July 31, 2012
(Fidelity Cover Art)
Contents
Performance | (Click Here) | How the fund has done over time. |
Management's Discussion of Fund Performance | (Click Here) | The Portfolio Manager's review of fund performance and strategy. |
Shareholder Expense Example | (Click Here) | An example of shareholder expenses. |
Investment Changes | (Click Here) | A summary of major shifts in the fund's investments over the past six months. |
Investments | (Click Here) | A complete list of the fund's investments with their market values. |
Financial Statements | (Click Here) | Statements of assets and liabilities, operations, and changes in net assets, as well as financial highlights. |
Notes | (Click Here) | Notes to the financial statements. |
Report of Independent Registered Public Accounting Firm | (Click Here) | |
Trustees and Officers | (Click Here) | |
Distributions | (Click Here) | |
Board Approval of Investment Advisory Contracts and Management Fees | (Click Here) | |
To view a fund's proxy voting guidelines and proxy voting record for the 12-month period ended June 30, visit http://www.fidelity.com/proxyvotingresults or visit the Securities and Exchange Commission's (SEC) web site at http://www.sec.gov. You may also call 1-800-544-8544 for Fidelity® Series Real Estate Equity Fund or 1-800-835-5092 for Class F of the fund to request a free copy of the proxy voting guidelines.
Standard & Poor's, S&P and S&P 500 are registered service marks of The McGraw-Hill Companies, Inc. and have been licensed for use by Fidelity Distributors Corporation.
Other third party marks appearing herein are the property of their respective owners.
All other marks appearing herein are registered or unregistered trademarks or service marks of FMR LLC or an affiliated company. © 2012 FMR LLC. All rights reserved.
Annual Report
This report and the financial statements contained herein are submitted for the general information of the shareholders of the fund. This report is not authorized for distribution to prospective investors in the fund unless preceded or accompanied by an effective prospectus.
A fund files its complete schedule of portfolio holdings with the SEC for the first and third quarters of each fiscal year on Form N-Q. Forms N-Q are available on the SEC's web site at http://www.sec.gov. A fund's Forms N-Q may be reviewed and copied at the SEC's Public Reference Room in Washington, DC. Information regarding the operation of the SEC's Public Reference Room may be obtained by calling 1-800-SEC-0330. For a complete list of a fund's portfolio holdings, view the most recent holdings listing, semiannual report, or annual report on Fidelity's web site at http://www.fidelity.com, http://www.advisor.fidelity.com, or http://www.401k.com, as applicable.
NOT FDIC INSURED • MAY LOSE VALUE • NO BANK GUARANTEE
Neither the fund nor Fidelity Distributors Corporation is a bank.
Annual Report
Average annual total return reflects the change in the value of an investment, assuming reinvestment of the class' distributions from dividend income and capital gains (the profits earned upon the sale of securities that have grown in value, if any) and assuming a constant rate of performance each year. The $10,000 table and the fund's returns do not reflect the deduction of taxes that a shareholder would pay on fund distributions or the redemption of fund shares. During periods of reimbursement by Fidelity, a fund's total return will be greater than it would be had the reimbursement not occurred. How a fund did yesterday is no guarantee of how it will do tomorrow.
Average annual total returns take each class' cumulative total return and show you what would have happened if Fidelity® Series Real Estate Equity Fund shares and Class F shares had performed at a constant rate each year. These numbers will be reported once the fund is a year old.
$10,000 Over Life of Fund
Let's say hypothetically that $10,000 was invested in Fidelity Series Real Estate Equity Fund, a class of the fund, on October 20, 2011, when the fund started. The chart shows how the value of your investment would have changed, and also shows how the S&P 500® Index performed over the same period.
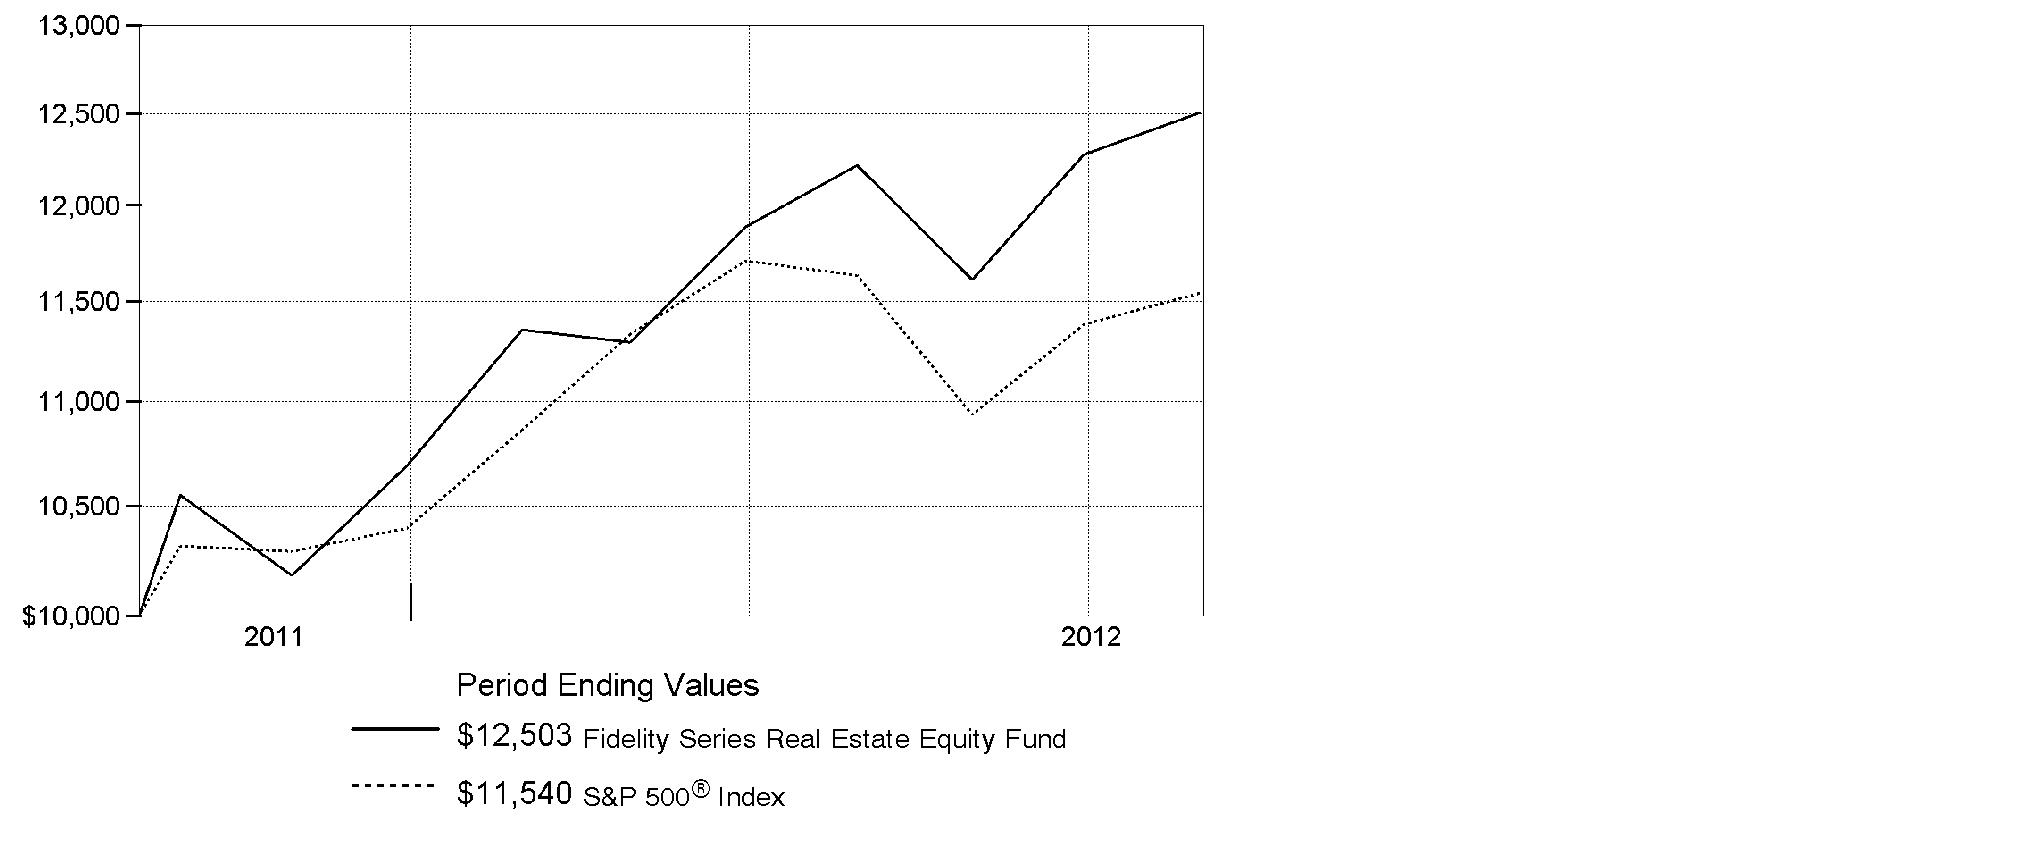
Annual Report
Market Recap: Major U.S. equity benchmarks posted solid gains for the nine months ending July 31, 2012, despite bouts of volatility along the way. The broad-based S&P 500® Index returned 11.90%, while the blue-chip-laden Dow Jones Industrial AverageSM and technology-heavy Nasdaq Composite® Index gained 11.07% and 10.43%, respectively. Despite an early-period slump in November 2011, stocks continued on a generally upward trajectory through early April, buoyed by a seemingly improving U.S. economy, which paved the way for major equity benchmarks to post their best first-quarter performance since 1998. However, more eurozone trouble, signs that the U.S. economy had turned sluggish and a marked slowdown in China caused stocks to slip in May, before a new wave of optimism took hold in June and July. Within the S&P 500®, more-defensive sectors such as telecommunication services (+30%) and consumer staples (+18%) fared best, while materials and energy lagged, each returning roughly 3%. Small- and mid-cap stocks trailed their less-volatile large-cap counterparts, with the Russell 2000® Index adding 7.35% and the Russell Midcap® Index increasing 7.55%. Given turmoil in Europe and local currency weakness, foreign developed-markets stocks were under pressure, with the MSCI® EAFE® Index returning -1.72%.
Comments from Samuel Wald, Portfolio Manager of Fidelity® Series Real Estate Equity Fund: Between the fund's inception date of October 20, 2011, and July 31, 2012, the fund's Series Real Estate Equity and Class F shares returned 25.03% and 25.16%, respectively, compared with 28.29% for the Dow Jones U.S. Select Real Estate Securities IndexSM, and handily beat the 15.40% rise of the S&P 500® Index. Relative to the Dow Jones real estate index, individual contributors included mall owners CBL & Associates Properties and DDR, both of which benefited from investors' increased comfort with more-leveraged companies at times during the period. Another notable contributor was Vornado Realty Trust, a diversified REIT in which the fund was underweighted. Health care REIT Ventas did well, as did most of its industry peers during the period. On the negative side, two out-of-benchmark senior housing companies, Emeritus and Brookdale Senior Living, significantly underperformed the benchmark and hampered results. In both cases, I felt these out-of-benchmark stocks were attractively valued compared to many health care property companies. Also detracting was the lack of a position in three index components that did well - retail REIT General Growth Properties, self-storage REIT Extra Space Storage and mall owner Taubman Centers - as did the fund's average cash position in a rising market.
The views expressed above reflect those of the portfolio manager(s) only through the end of the period as stated on the cover of this report and do not necessarily represent the views of Fidelity or any other person in the Fidelity organization. Any such views are subject to change at any time based upon market or other conditions and Fidelity disclaims any responsibility to update such views. These views may not be relied on as investment advice and, because investment decisions for a Fidelity fund are based on numerous factors, may not be relied on as an indication of trading intent on behalf of any Fidelity fund.
Annual Report
Shareholder Expense Example
As a shareholder of the Fund, you incur two types of costs: (1) transaction costs, and (2) ongoing costs, including management fees and other Fund expenses. This Example is intended to help you understand your ongoing costs (in dollars) of investing in the Fund and to compare these costs with the ongoing costs of investing in other mutual funds.
The Example is based on an investment of $1,000 invested at the beginning of the period and held for the entire period (February 1, 2012 to July 31, 2012).
Actual Expenses
The first line of the accompanying table for each class of the Fund provides information about actual account values and actual expenses. You may use the information in this line, together with the amount you invested, to estimate the expenses that you paid over the period. Simply divide your account value by $1,000.00 (for example, an $8,600 account value divided by $1,000.00 = 8.6), then multiply the result by the number in the first line for a class of the Fund under the heading entitled "Expenses Paid During Period" to estimate the expenses you paid on your account during this period. In addition, the Fund, as a shareholder in the underlying Fidelity Central Funds, will indirectly bear its pro-rata share of the fees and expenses incurred by the underlying Fidelity Central Funds. These fees and expenses are not included in the Fund's annualized expense ratio used to calculate the expense estimate in the table below.
Hypothetical Example for Comparison Purposes
The second line of the accompanying table for each class of the Fund provides information about hypothetical account values and hypothetical expenses based on a Class' actual expense ratio and an assumed rate of return of 5% per year before expenses, which is not the Class' actual return. The hypothetical account values and expenses may not be used to estimate the actual ending account balance or expenses you paid for the period. You may use this information to compare the ongoing costs of investing in the Fund and other funds. To do so, compare this 5% hypothetical example with the 5% hypothetical examples that appear in the shareholder reports of the other funds. In addition, the Fund, as a shareholder in the underlying Fidelity Central Funds, will indirectly bear its pro-rata share of the fees and expenses incurred by the underlying Fidelity Central Funds. These fees and expenses are not included in the Fund's annualized expense ratio used to calculate the expense estimate in the table below.
Please note that the expenses shown in the table are meant to highlight your ongoing costs only and do not reflect any transaction costs. Therefore, the second line of the table is useful in comparing ongoing costs only, and will not help you determine the relative total costs of owning different funds.
Annual Report
Shareholder Expense Example - continued
| Annualized
Expense Ratio | Beginning
Account Value
February 1, 2012 | Ending
Account Value
July 31, 2012 | Expenses Paid
During Period*
February 1, 2012 to July 31, 2012 |
Series Real Estate Equity | .81% | | | |
Actual | | $ 1,000.00 | $ 1,101.20 | $ 4.23 |
HypotheticalA | | $ 1,000.00 | $ 1,020.84 | $ 4.07 |
Class F | .61% | | | |
Actual | | $ 1,000.00 | $ 1,101.10 | $ 3.19 |
HypotheticalA | | $ 1,000.00 | $ 1,021.83 | $ 3.07 |
A 5% return per year before expenses
* Expenses are equal to each Class' annualized expense ratio, multiplied by the average account value over the period, multiplied by 182/366 (to reflect the one-half year period).
Annual Report
Investment Changes (Unaudited)
Top Ten Stocks as of July 31, 2012 |
| % of fund's
net assets | % of fund's net assets
6 months ago |
Simon Property Group, Inc. | 13.2 | 11.3 |
Ventas, Inc. | 7.7 | 7.2 |
Public Storage | 6.7 | 7.5 |
Prologis, Inc. | 5.3 | 5.9 |
Boston Properties, Inc. | 5.1 | 4.5 |
SL Green Realty Corp. | 4.3 | 4.0 |
Essex Property Trust, Inc. | 4.2 | 3.8 |
Camden Property Trust (SBI) | 3.8 | 3.8 |
Digital Realty Trust, Inc. | 3.8 | 4.6 |
HCP, Inc. | 3.0 | 2.0 |
| 57.1 | |
Top Five REIT Sectors as of July 31, 2012 |
| % of fund's
net assets | % of fund's net assets
6 months ago |
REITs - Apartments | 17.6 | 17.2 |
REITs - Malls | 16.6 | 15.8 |
REITs - Office Buildings | 15.2 | 14.6 |
REITs - Industrial Buildings | 13.4 | 14.5 |
REITs - Health Care Facilities | 11.7 | 10.6 |
Asset Allocation (% of fund's net assets) |
As of July 31, 2012 * | As of January 31, 2012 ** |
 | Stocks 96.8% | | | Stocks 96.2% | |
 | Short-Term Investments and Net Other Assets (Liabilities) 3.2% | | | Short-Term Investments and Net Other Assets (Liabilities) 3.8% | |
* Foreign investments | 0.0% | | ** Foreign investments | 0.7% | |

Annual Report
Investments July 31, 2012
Showing Percentage of Net Assets
Common Stocks - 96.8% |
| Shares | | Value |
HEALTH CARE PROVIDERS & SERVICES - 1.8% |
Health Care Facilities - 1.8% |
Brookdale Senior Living, Inc. (a) | 260,446 | | $ 4,286,941 |
Emeritus Corp. (a) | 453,064 | | 7,679,435 |
Sunrise Senior Living, Inc. (a) | 374,000 | | 2,498,320 |
TOTAL HEALTH CARE FACILITIES | | 14,464,696 |
REAL ESTATE INVESTMENT TRUSTS - 94.0% |
REITs - Apartments - 17.6% |
Apartment Investment & Management Co. Class A | 296,100 | | 8,122,023 |
AvalonBay Communities, Inc. | 89,300 | | 13,135,137 |
Camden Property Trust (SBI) | 428,972 | | 30,589,993 |
Education Realty Trust, Inc. | 1,562,800 | | 18,316,016 |
Equity Residential (SBI) | 339,951 | | 21,522,298 |
Essex Property Trust, Inc. | 213,667 | | 33,622,639 |
Home Properties, Inc. | 53,407 | | 3,504,033 |
Post Properties, Inc. | 229,300 | | 11,843,345 |
TOTAL REITS - APARTMENTS | | 140,655,484 |
REITs - Health Care Facilities - 11.7% |
HCP, Inc. | 502,275 | | 23,712,403 |
Health Care REIT, Inc. | 97,720 | | 6,081,116 |
LTC Properties, Inc. | 63,100 | | 2,252,670 |
Ventas, Inc. | 910,700 | | 61,244,575 |
TOTAL REITS - HEALTH CARE FACILITIES | | 93,290,764 |
REITs - Hotels - 4.8% |
Chesapeake Lodging Trust | 577,066 | | 9,792,810 |
Host Hotels & Resorts, Inc. | 740,100 | | 10,864,668 |
LaSalle Hotel Properties (SBI) | 393,398 | | 10,330,631 |
Sunstone Hotel Investors, Inc. (a) | 740,766 | | 7,415,068 |
TOTAL REITS - HOTELS | | 38,403,177 |
REITs - Industrial Buildings - 13.4% |
DCT Industrial Trust, Inc. | 993,900 | | 6,221,814 |
First Potomac Realty Trust | 173,100 | | 2,006,229 |
Prologis, Inc. | 1,312,200 | | 42,423,426 |
Common Stocks - continued |
| Shares | | Value |
REAL ESTATE INVESTMENT TRUSTS - CONTINUED |
REITs - Industrial Buildings - continued |
Public Storage | 357,850 | | $ 53,301,758 |
Stag Industrial, Inc. | 231,400 | | 3,346,044 |
TOTAL REITS - INDUSTRIAL BUILDINGS | | 107,299,271 |
REITs - Malls - 16.6% |
CBL & Associates Properties, Inc. | 1,135,800 | | 22,409,334 |
Simon Property Group, Inc. | 654,800 | | 105,088,850 |
The Macerich Co. | 82,531 | | 4,820,636 |
TOTAL REITS - MALLS | | 132,318,820 |
REITs - Management/Investment - 3.9% |
Digital Realty Trust, Inc. (d) | 387,643 | | 30,263,289 |
Lexington Corporate Properties Trust | 111,500 | | 996,810 |
TOTAL REITS - MANAGEMENT/INVESTMENT | | 31,260,099 |
REITs - Mobile Home Parks - 0.6% |
Sun Communities, Inc. | 107,900 | | 5,027,061 |
REITs - Mortgage - 0.3% |
Newcastle Investment Corp. | 271,600 | | 2,023,420 |
REITs - Office Buildings - 15.2% |
Boston Properties, Inc. | 365,800 | | 40,567,220 |
Douglas Emmett, Inc. | 925,300 | | 21,753,803 |
Highwoods Properties, Inc. (SBI) | 553,317 | | 18,740,847 |
SL Green Realty Corp. | 433,300 | | 34,122,375 |
Sovran Self Storage, Inc. | 114,900 | | 6,560,790 |
TOTAL REITS - OFFICE BUILDINGS | | 121,745,035 |
REITs - Shopping Centers - 9.9% |
Acadia Realty Trust (SBI) | 610,800 | | 14,622,552 |
Cedar Shopping Centers, Inc. | 698,900 | | 3,599,335 |
DDR Corp. | 601,888 | | 9,052,396 |
Equity One, Inc. | 1,076,069 | | 23,339,937 |
Excel Trust, Inc. | 96,592 | | 1,182,286 |
Glimcher Realty Trust | 852,400 | | 8,541,048 |
Common Stocks - continued |
| Shares | | Value |
REAL ESTATE INVESTMENT TRUSTS - CONTINUED |
REITs - Shopping Centers - continued |
Kite Realty Group Trust | 632,000 | | $ 3,178,960 |
Vornado Realty Trust | 185,300 | | 15,472,550 |
TOTAL REITS - SHOPPING CENTERS | | 78,989,064 |
TOTAL REAL ESTATE INVESTMENT TRUSTS | | 751,012,195 |
REAL ESTATE MANAGEMENT & DEVELOPMENT - 1.0% |
Real Estate Operating Companies - 0.8% |
Forest City Enterprises, Inc. Class A (a) | 472,400 | | 6,665,564 |
Real Estate Services - 0.2% |
CBRE Group, Inc. (a) | 77,400 | | 1,205,892 |
TOTAL REAL ESTATE MANAGEMENT & DEVELOPMENT | | 7,871,456 |
TOTAL COMMON STOCKS (Cost $664,549,264) |
773,348,347
|
Money Market Funds - 5.9% |
| | | |
Fidelity Cash Central Fund, 0.17% (b) | 26,473,742 | | 26,473,742 |
Fidelity Securities Lending Cash Central Fund, 0.18% (b)(c) | 20,921,950 | | 20,921,950 |
TOTAL MONEY MARKET FUNDS (Cost $47,395,692) |
47,395,692
|
TOTAL INVESTMENT PORTFOLIO - 102.7% (Cost $711,944,956) | 820,744,039 |
NET OTHER ASSETS (LIABILITIES) - (2.7)% | (21,829,770) |
NET ASSETS - 100% | $ 798,914,269 |
Legend |
(a) Non-income producing |
(b) Affiliated fund that is available only to investment companies and other accounts managed by Fidelity Investments. The rate quoted is the annualized seven-day yield of the fund at period end. A complete unaudited listing of the fund's holdings as of its most recent quarter end is available upon request. In addition, each Fidelity Central Fund's financial statements, which are not covered by the Fund's Report of Independent Registered Public Accounting Firm, are available on the SEC's website or upon request. |
(c) Investment made with cash collateral received from securities on loan. |
(d) Security or a portion of the security is on loan at period end. |
Affiliated Central Funds |
Information regarding fiscal year to date income earned by the Fund from investments in Fidelity Central Funds is as follows: |
Fund | Income earned |
Fidelity Cash Central Fund | $ 24,837 |
Fidelity Securities Lending Cash Central Fund | 44,380 |
Total | $ 69,217 |
Other Information |
All investments are categorized as Level 1 under the Fair Value Hierarchy. The inputs or methodology used for valuing securities may not be an indication of the risk associated with investing in those securities. For more information on valuation inputs, please refer to the Security Valuation section in the accompanying Notes to Financial Statements. |
See accompanying notes which are an integral part of the financial statements.
Annual Report
Statement of Assets and Liabilities
| July 31, 2012 |
| | |
Assets | | |
Investment in securities, at value (including securities loaned of $20,290,393) - See accompanying schedule: Unaffiliated issuers (cost $664,549,264) | $ 773,348,347 | |
Fidelity Central Funds (cost $47,395,692) | 47,395,692 | |
Total Investments (cost $711,944,956) | | $ 820,744,039 |
Receivable for investments sold | | 2,198,609 |
Receivable for fund shares sold | | 309,949 |
Dividends receivable | | 155,860 |
Distributions receivable from Fidelity Central Funds | | 7,065 |
Other receivables | | 6,922 |
Total assets | | 823,422,444 |
| | |
Liabilities | | |
Payable for investments purchased | $ 2,521,331 | |
Payable for fund shares redeemed | 558,382 | |
Accrued management fee | 367,403 | |
Other affiliated payables | 98,649 | |
Other payables and accrued expenses | 40,460 | |
Collateral on securities loaned, at value | 20,921,950 | |
Total liabilities | | 24,508,175 |
| | |
Net Assets | | $ 798,914,269 |
Net Assets consist of: | | |
Paid in capital | | $ 680,077,181 |
Undistributed net investment income | | 1,911,471 |
Accumulated undistributed net realized gain (loss) on investments and foreign currency transactions | | 8,126,534 |
Net unrealized appreciation (depreciation) on investments | | 108,799,083 |
Net Assets | | $ 798,914,269 |
Series Real Estate Equity:
Net Asset Value, offering price and redemption price per share ($475,391,516 ÷ 38,378,355 shares) | | $ 12.39 |
| | |
Class F:
Net Asset Value, offering price and redemption price per share ($323,522,753 ÷ 26,105,467 shares) | | $ 12.39 |
See accompanying notes which are an integral part of the financial statements.
Annual Report
Financial Statements - continued
Statement of Operations
For the period October 20, 2011
(commencement of operations)
to July 31, 2012 |
| | |
Investment Income | | |
Dividends | | $ 9,301,005 |
Income from Fidelity Central Funds | | 69,217 |
Total income | | 9,370,222 |
| | |
Expenses | | |
Management fee | $ 2,510,772 | |
Transfer agent fees | 577,795 | |
Accounting and security lending fees | 168,263 | |
Custodian fees and expenses | 18,506 | |
Independent trustees' compensation | 2,671 | |
Audit | 44,248 | |
Legal | 455 | |
Miscellaneous | 1,006 | |
Total expenses before reductions | 3,323,716 | |
Expense reductions | (16,859) | 3,306,857 |
Net investment income (loss) | | 6,063,365 |
Realized and Unrealized Gain (Loss) Net realized gain (loss) on: | | |
Investment securities: | | |
Unaffiliated issuers | 8,925,185 | |
Foreign currency transactions | (2,673) | |
Total net realized gain (loss) | | 8,922,512 |
Change in net unrealized appreciation (depreciation) on investment securities | | 108,799,083 |
Net gain (loss) | | 117,721,595 |
Net increase (decrease) in net assets resulting from operations | | $ 123,784,960 |
See accompanying notes which are an integral part of the financial statements.
Annual Report
Statement of Changes in Net Assets
| For the period
October 20, 2011
(commencement of operations) to
July 31, 2012 |
Increase (Decrease) in Net Assets | |
Operations | |
Net investment income (loss) | $ 6,063,365 |
Net realized gain (loss) | 8,922,512 |
Change in net unrealized appreciation (depreciation) | 108,799,083 |
Net increase (decrease) in net assets resulting
from operations | 123,784,960 |
Distributions to shareholders from net investment income | (4,149,221) |
Distributions to shareholders from net realized gain | (798,651) |
Total distributions | (4,947,872) |
Share transactions - net increase (decrease) | 680,077,181 |
Total increase (decrease) in net assets | 798,914,269 |
| |
Net Assets | |
Beginning of period | - |
End of period (including undistributed net investment income of $1,911,471) | $ 798,914,269 |
See accompanying notes which are an integral part of the financial statements.
Annual Report
Financial Highlights - Series Real Estate Equity
| Year ended
July 31, 2012 G |
Selected Per-Share Data | |
Net asset value, beginning of period | $ 10.00 |
Income from Investment Operations | |
Net investment income (loss) D | .11 |
Net realized and unrealized gain (loss) | 2.38 |
Total from investment operations | 2.49 |
Distributions from net investment income | (.08) |
Distributions from net realized gain | (.02) |
Total distributions | (.10) |
Net asset value, end of period | $ 12.39 |
Total Return B, C | 25.03% |
Ratios to Average Net Assets E, H | |
Expenses before reductions | .81% A |
Expenses net of fee waivers, if any | .81% A |
Expenses net of all reductions | .81% A |
Net investment income (loss) | 1.27% A |
Supplemental Data | |
Net assets, end of period (000 omitted) | $ 475,392 |
Portfolio turnover rate F | 40% A |
A Annualized
B Total returns for periods of less than one year are not annualized.
C Total returns would have been lower if certain expenses had not been reduced during the applicable periods shown.
D Calculated based on average shares outstanding during the period.
E Fees and expenses of any underlying Fidelity Central Funds are not included in the Fund's expense ratio. The Fund indirectly bears its proportionate share of the expenses of any underlying Fidelity Central Funds.
F Amount does not include the portfolio activity of any underlying Fidelity Central Funds.
G For the period October 20, 2011 (commencement of operations) to July 31, 2012.
H Expense ratios reflect operating expenses of the class. Expenses before reductions do not reflect amounts reimbursed by the investment adviser or reductions from brokerage service arrangements or reductions from other expense offset arrangements and do not represent the amount paid by the class during periods when reimbursements or reductions occur. Expense ratios before reductions for start-up periods may not be representative of longer-term operating periods. Expenses net of fee waivers reflect expenses after reimbursement by the investment adviser but prior to reductions from brokerage service arrangements or other expense offset arrangements. Expenses net of all reductions represent the net expenses paid by the class.
See accompanying notes which are an integral part of the financial statements.
Annual Report
Financial Highlights - Class F
| Year ended
July 31, 2012 G |
Selected Per-Share Data | |
Net asset value, beginning of period | $ 10.00 |
Income from Investment Operations | |
Net investment income (loss) D | .13 |
Net realized and unrealized gain (loss) | 2.37 |
Total from investment operations | 2.50 |
Distributions from net investment income | (.09) |
Distributions from net realized gain | (.02) |
Total distributions | (.11) |
Net asset value, end of period | $ 12.39 |
Total Return B, C | 25.16% |
Ratios to Average Net Assets E, H | |
Expenses before reductions | .61% A |
Expenses net of fee waivers, if any | .61% A |
Expenses net of all reductions | .61% A |
Net investment income (loss) | 1.47% A |
Supplemental Data | |
Net assets, end of period (000 omitted) | $ 323,523 |
Portfolio turnover rate F | 40% A |
A Annualized
B Total returns for periods of less than one year are not annualized.
C Total returns would have been lower if certain expenses had not been reduced during the applicable periods shown.
D Calculated based on average shares outstanding during the period.
E Fees and expenses of any underlying Fidelity Central Funds are not included in the Fund's expense ratio. The Fund indirectly bears its proportionate share of the expenses of any underlying Fidelity Central Funds.
F Amount does not include the portfolio activity of any underlying Fidelity Central Funds.
G For the period October 20, 2011 (commencement of operations) to July 31, 2012.
H Expense ratios reflect operating expenses of the class. Expenses before reductions do not reflect amounts reimbursed by the investment adviser or reductions from brokerage service arrangements or reductions from other expense offset arrangements and do not represent the amount paid by the class during periods when reimbursements or reductions occur. Expense ratios before reductions for start-up periods may not be representative of longer-term operating periods. Expenses net of fee waivers reflect expenses after reimbursement by the investment adviser but prior to reductions from brokerage service arrangements or other expense offset arrangements. Expenses net of all reductions represent the net expenses paid by the class.
See accompanying notes which are an integral part of the financial statements.
Annual Report
Notes to Financial Statements
For the period ended July 31, 2012
1. Organization.
Fidelity® Series Real Estate Equity Fund (the Fund) is a non-diversified fund of Fidelity Securities Fund (the Trust) and is authorized to issue an unlimited number of shares. Shares of the Fund are only available for purchase by mutual funds for which Fidelity Management & Research Company (FMR) or an affiliate serves as an investment manager. The Trust is registered under the Investment Company Act of 1940, as amended (the 1940 Act), as an open-end management investment company organized as a Massachusetts business trust. The Fund offers Series Real Estate Equity and Class F shares, each of which has equal rights as to assets and voting privileges. Each class has exclusive voting rights with respect to matters that affect that class. Investment income, realized and unrealized capital gains and losses, the common expenses of the Fund, and certain fund-level expense reductions, if any, are allocated on a pro-rata basis to each class based on the relative net assets of each class to the total net assets of the Fund. Each class differs with respect to transfer agent fees incurred. Certain expense reductions may also differ by class.
2. Investments in Fidelity Central Funds.
The Fund invests in Fidelity Central Funds, which are open-end investment companies available only to other investment companies and accounts managed by Fidelity Management & Research Company (FMR) and its affiliates. The Fund's Schedule of Investments lists each of the Fidelity Central Funds held as of period end, if any, as an investment of the Fund, but does not include the underlying holdings of each Fidelity Central Fund. As an Investing Fund, the Fund indirectly bears its proportionate share of the expenses of the underlying Fidelity Central Funds.
The Money Market Central Funds seek preservation of capital and current income and are managed by Fidelity Investments Money Management, Inc. (FIMM), an affiliate of FMR.
A complete unaudited list of holdings for each Fidelity Central Fund is available upon request or at the Securities and Exchange Commission (the SEC) web site at www.sec.gov. In addition, the financial statements of the Fidelity Central Funds, which are not covered by the Fund's Report of Independent Registered Public Accounting Firm, are available on the SEC web site or upon request.
3. Significant Accounting Policies.
The financial statements have been prepared in conformity with accounting principles generally accepted in the United States of America (GAAP), which require management to make certain estimates and assumptions at the date of the financial statements. Actual results could differ from those estimates. Subsequent events, if any, through the date that the financial statements were issued have been evaluated in the preparation of the financial statements. The following summarizes the significant accounting policies of the Fund:
Annual Report
3. Significant Accounting Policies - continued
Security Valuation. Investments are valued as of 4:00 p.m. Eastern time on the last calendar day of the period. In accordance with valuation policies and procedures approved by the Board of Trustees (the Board), the Fund attempts to obtain prices from one or more third party pricing vendor or broker to value its investments. When current market prices, quotations or rates are not readily available or reliable, securities will be fair valued in good faith by the FMR Fair Value Committee (the Committee), in accordance with procedures adopted by the Fund's Board. Factors used in determining fair value vary by security type and may include market or security specific events. The frequency with which these procedures are used cannot be predicted and they may be utilized to a significant extent. The Committee oversees the Fund's valuation policies and procedures and is responsible for approving and reporting to the Board all fair value determinations.
The Fund categorizes the inputs to valuation techniques used to value its investments into a disclosure hierarchy consisting of three levels as shown below:
Level 1 - quoted prices in active markets for identical investments
Level 2 - other significant observable inputs (including quoted prices for similar investments, interest rates, prepayment speeds, etc.)
Level 3 - unobservable inputs (including the Fund's own assumptions based on the best information available)
Valuation techniques used to value the Fund's investments by major category are as follows:
Equity securities, including restricted securities, for which market quotations are readily available, are valued at the last reported sale price or official closing price as reported by a third party pricing vendor on the primary market or exchange on which they are traded and are categorized as Level 1 in the hierarchy. In the event there were no sales during the day or closing prices are not available, securities are valued at the last quoted bid price or may be valued using the last available price and are generally categorized as Level 2 in the hierarchy. For foreign equity securities, when significant market or security specific events arise, comparisons to the valuation of American Depositary Receipts (ADRs), futures contracts, Exchange-Traded Funds (ETFs) and certain indexes as well as quoted prices for similar securities are used and are categorized as Level 2 in the hierarchy. Utilizing these techniques may result in transfers between Level 1 and Level 2.
Annual Report
Notes to Financial Statements - continued
3. Significant Accounting Policies - continued
Security Valuation - continued
Investments in open-end mutual funds, including the Fidelity Central Funds, are valued at their closing net asset value each business day and are categorized as Level 1 in the hierarchy.
Changes in valuation techniques may result in transfers in or out of an assigned level within the disclosure hierarchy.
Foreign Currency Translation. The Fund may use foreign currency contracts to facilitate transactions in foreign-denominated securities. Gains and losses from these transactions may arise from changes in the value of the foreign currency or if the counterparties do not perform under the contracts' terms.
Foreign-denominated assets, including investment securities, and liabilities are translated into U.S. dollars at the exchange rates at period end. Purchases and sales of investment securities, income and dividends received and expenses denominated in foreign currencies are translated into U.S. dollars at the exchange rate in effect on the transaction date.
The effects of exchange rate fluctuations on investments are included with the net realized and unrealized gain (loss) on investment securities. Other foreign currency transactions resulting in realized and unrealized gain (loss) are disclosed separately.
Investment Transactions and Income. For financial reporting purposes, the Fund's investment holdings and NAV include trades executed through the end of the last business day of the period. The NAV per share for processing shareholder transactions is calculated as of the close of business of the New York Stock Exchange (NYSE), normally 4:00 p.m. Eastern time and includes trades executed through the end of the prior business day. Gains and losses on securities sold are determined on the basis of identified cost. Dividend income is recorded on the ex-dividend date, except for certain dividends from foreign securities where the ex-dividend date may have passed, which are recorded as soon as the Fund is informed of the ex-dividend date. Non-cash dividends included in dividend income, if any, are recorded at the fair market value of the securities received. Distributions received on securities that represent a return of capital or capital gain are recorded as a reduction of cost of investments and/or as a realized gain. The Fund estimates the components of distributions received that may be considered return of capital distributions or capital gain distributions. Interest income and distributions from the Fidelity Central Funds are accrued as earned. Interest income includes coupon interest and amortization of premium and accretion of discount on debt securities. Investment income is recorded net of foreign taxes withheld where recovery of such taxes is uncertain.
Annual Report
3. Significant Accounting Policies - continued
Expenses. Expenses directly attributable to a fund are charged to that fund. Expenses attributable to more than one fund are allocated among the respective funds on the basis of relative net assets or other appropriate methods. Expense estimates are accrued in the period to which they relate and adjustments are made when actual amounts are known.
Income Tax Information and Distributions to Shareholders. Each year, the Fund intends to qualify as a regulated investment company under Subchapter M of the Internal Revenue Code, including distributing substantially all of its taxable income and realized gains. As a result, no provision for income taxes is required. As of July 31, 2012, the Fund did not have any unrecognized tax benefits in the financial statements; nor is the Fund aware of any tax positions for which it is reasonably possible that the total amounts of unrecognized tax benefits will significantly change in the next twelve months. The Fund files a U.S. federal tax return, in addition to state and local tax returns as required. A fund's federal income tax returns are subject to examination by the Internal Revenue Service (IRS) for a period of three fiscal years after they are filed. State and local tax returns may be subject to examination for an additional fiscal year depending on the jurisdiction. Foreign taxes are provided for based on the Fund's understanding of the tax rules and rates that exist in the foreign markets in which it invests.
Distributions are declared and recorded on the ex-dividend date. Income dividends and capital gain distributions are declared separately for each class. Income and capital gain distributions are determined in accordance with income tax regulations, which may differ from GAAP.
Capital accounts within the financial statements are adjusted for permanent book-tax differences. These adjustments have no impact on net assets or the results of operations. Temporary book-tax differences will reverse in a subsequent period.
Book-tax differences are primarily due to foreign currency transactions and losses deferred due to wash sales.
The federal tax cost of investment securities and unrealized appreciation (depreciation) as of period end were as follows:
Gross unrealized appreciation | $ 111,454,749 |
Gross unrealized depreciation | (2,988,199) |
Net unrealized appreciation (depreciation) on securities and other investments | $ 108,466,550 |
| |
Tax Cost | $ 712,277,489 |
Annual Report
Notes to Financial Statements - continued
3. Significant Accounting Policies - continued
Income Tax Information and Distributions to Shareholders - continued
The tax-based components of distributable earnings as of period end were as follows:
Undistributed ordinary income | $ 8,796,448 |
Undistributed long-term capital gain | $ 1,574,090 |
Net unrealized appreciation (depreciation) | $ 108,466,550 |
The tax character of distributions paid was as follows:
| July 31, 2012 |
Ordinary Income | $ 4,947,872 |
New Accounting Pronouncement. In December 2011, the Financial Accounting Standards Board issued Accounting Standard Update No. 2011-11, Disclosures about Offsetting Assets and Liabilities. The update creates new disclosure requirements requiring entities to disclose both gross and net information for derivatives and other financial instruments that are either offset in the Statement of Assets and Liabilities or subject to an enforceable master netting arrangement or similar agreement. The disclosure requirements are effective for interim and annual reporting periods beginning on or after January 1, 2013. Management is currently evaluating the impact of the update's adoption on the Fund's financial statement disclosures.
4. Purchases and Sales of Investments.
Purchases and sales of securities, other than short-term securities, aggregated $838,134,048 and $178,298,874, respectively.
5. Fees and Other Transactions with Affiliates.
Management Fee. FMR and its affiliates provide the Fund with investment management related services for which the Fund pays a monthly management fee. The management fee is the sum of an individual fund fee rate that is based on an annual rate of .30% of the Fund's average net assets and an annualized group fee rate that averaged .26% during the period. The group fee rate is based upon the average net assets of all the mutual funds advised by FMR. The group fee rate decreases as assets under management increase and increases as assets under management decrease. For the period, the total annualized management fee rate was .56% of the Fund's average net assets.
Annual Report
5. Fees and Other Transactions with Affiliates - continued
Transfer Agent Fees. Fidelity Investments Institutional Operations Company, Inc. (FIIOC), an affiliate of FMR, is the transfer, dividend disbursing and shareholder servicing agent for each class of the Fund. FIIOC receives account fees and asset-based fees that vary according to the account size and type of account of the shareholders of Series Real Estate Equity. FIIOC receives no fees for providing transfer agency services to Class F. FIIOC pays for typesetting, printing and mailing of shareholder reports, except proxy statements. For the period, transfer agent fees for each class were as follows:
| Amount | % of
Average
Net Assets* |
Series Real Estate Equity | $ 577,795 | .20 |
* Annualized
Accounting and Security Lending Fees. Fidelity Service Company, Inc. (FSC), an affiliate of FMR, maintains the Fund's accounting records. The accounting fee is based on the level of average net assets for each month. Under a separate contract, FSC administers the security lending program. The security lending fee is based on the number and duration of lending transactions.
Brokerage Commissions. The Fund placed a portion of its portfolio transactions with brokerage firms which are affiliates of the investment adviser. The commissions paid to these affiliated firms were $7,337 for the period.
Exchanges In-Kind. During the period, certain investment companies managed by FMR or its affiliates (Investing Funds) completed exchanges in-kind with the Fund. The Investing Funds delivered securities valued at $402,288,933 in exchange for 40,228,893 shares of the Fund. The amount of in-kind exchanges is included in share transactions in the accompanying Statement of Changes in Net Assets as well as Note 10: Share Transactions. The Fund recognized no gain or loss for federal income tax purposes.
6. Committed Line of Credit.
The Fund participates with other funds managed by FMR or an affiliate in a $4.25 billion credit facility (the "line of credit") to be utilized for temporary or emergency purposes to fund shareholder redemptions or for other short-term liquidity purposes. The Fund has agreed to pay commitment fees on its pro-rata portion of the line of credit, which amounted to $545 and is reflected in Miscellaneous expenses on the Statement of Operations. During the period, there were no borrowings on this line of credit.
Annual Report
Notes to Financial Statements - continued
7. Security Lending.
The Fund lends portfolio securities through a lending agent from time to time in order to earn additional income. For equity securities, a lending agent is used and may loan securities to certain qualified borrowers, including Fidelity Capital Markets (FCM), a broker-dealer affiliated with the Fund. On the settlement date of the loan, the Fund receives collateral (in the form of U.S. Treasury obligations, letters of credit and/or cash) against the loaned securities and maintains collateral in an amount not less than 100% of the market value of the loaned securities during the period of the loan. The market value of the loaned securities is determined at the close of business of the Fund and any additional required collateral is delivered to the Fund on the next business day. If the borrower defaults on its obligation to return the securities loaned because of insolvency or other reasons, a fund could experience delays and costs in recovering the securities loaned or in gaining access to the collateral. Any cash collateral received is invested in the Fidelity Securities Lending Cash Central Fund. The value of loaned securities and cash collateral at period end are disclosed on the Fund's Statement of Assets and Liabilities. Security lending income represents the income earned on investing cash collateral, less rebates paid to borrowers and any lending agent fees associated with the loan, plus any premium payments received for lending certain types of securities. Security lending income is presented in the Statement of Operations as a component of income from Fidelity Central Funds. Total security lending income during the period amounted to $44,380. During the period, there were no securities loaned to FCM.
8. Expense Reductions.
Many of the brokers with whom FMR places trades on behalf of the Fund provided services to the Fund in addition to trade execution. These services included payments of certain expenses on behalf of the Fund totaling $16,859 for the period.
9. Distributions to Shareholders.
Distributions to shareholders of each class were as follows:
| Year ended
July 31,
2012 A |
From net investment income | |
Series Real Estate Equity | $ 2,536,950 |
Class F | 1,612,271 |
Total | $ 4,149,221 |
From net realized gain | |
Series Real Estate Equity | $ 550,380 |
Class F | 248,271 |
Total | $ 798,651 |
A For the period October 20, 2011 (commencement of operations) to July 31, 2012.
Annual Report
10. Share Transactions.
Transactions for each class of shares were as follows:
| Shares | Dollars |
| Year ended
July 31,
2012 A | Year ended
July 31,
2012 A |
Series Real Estate Equity | | |
Shares sold | 45,860,755 B | $ 478,790,709 B |
Reinvestment of distributions | 289,752 | 3,087,330 |
Shares redeemed | (7,772,152) | (82,058,496) |
Net increase (decrease) | 38,378,355 | $ 399,819,543 |
Class F | | |
Shares sold | 28,641,002 B | $ 306,842,724 B |
Reinvestment of distributions | 172,860 | 1,860,542 |
Shares redeemed | (2,708,395) | (28,445,628) |
Net increase (decrease) | 26,105,467 | $ 280,257,638 |
A For the period October 20, 2011 (commencement of operations) to July 31, 2012.
B Amount includes in-kind exchanges (see Note 5: Exchanges In-Kind).
11. Other.
The Fund's organizational documents provide former and current trustees and officers with a limited indemnification against liabilities arising in connection with the performance of their duties to the Fund. In the normal course of business, the Fund may also enter into contracts that provide general indemnifications. The Fund's maximum exposure under these arrangements is unknown as this would be dependent on future claims that may be made against the Fund. The risk of material loss from such claims is considered remote.
At the end of the period, mutual funds managed by FMR or an FMR affiliate were the owners of record of all of the outstanding shares of the Fund.
Annual Report
To the Trustees of Fidelity Securities Fund and Shareholders of Fidelity Series Real Estate Equity Fund:
We have audited the accompanying statement of assets and liabilities of Fidelity Series Real Estate Equity Fund (the Fund), a fund of Fidelity Securities Fund, including the schedule of investments, as of July 31, 2012, and the related statement of operations, the statement of changes in net assets and the financial highlights for the period from October 20, 2011 (commencement of operations) to July 31, 2012. These financial statements and financial highlights are the responsibility of the Fund's management. Our responsibility is to express an opinion on these financial statements and financial highlights based on our audit.
We conducted our audit in accordance with the standards of the Public Company Accounting Oversight Board (United States). Those standards require that we plan and perform the audit to obtain reasonable assurance about whether the financial statements and financial highlights are free of material misstatement. The Fund is not required to have, nor were we engaged to perform, an audit of its internal control over financial reporting. Our audit included consideration of internal control over financial reporting as a basis for designing audit procedures that are appropriate in the circumstances, but not for the purpose of expressing an opinion on the effectiveness of the Fund's internal control over financial reporting. Accordingly, we express no such opinion. An audit also includes examining, on a test basis, evidence supporting the amounts and disclosures in the financial statements, assessing the accounting principles used and significant estimates made by management, as well as evaluating the overall financial statement presentation. Our procedures included confirmation of securities owned as of July 31, 2012, by correspondence with the custodians and brokers; where replies were not received from brokers, we performed other auditing procedures. We believe that our audit provides a reasonable basis for our opinion.
In our opinion, the financial statements and financial highlights referred to above present fairly, in all material respects, the financial position of Fidelity Series Real Estate Equity Fund as of July 31, 2012, and the results of its operations, the changes in its net assets and the financial highlights for the period from October 20, 2011 (commencement of operations) to July 31, 2012, in conformity with accounting principles generally accepted in the United States of America.
DELOITTE & TOUCHE LLP
Boston, Massachusetts
September 13, 2012
Annual Report
The Trustees, Members of the Advisory Board, and executive officers of the trust and fund, as applicable, are listed below. The Board of Trustees governs the fund and is responsible for protecting the interests of shareholders. The Trustees are experienced executives who meet periodically throughout the year to oversee the fund's activities, review contractual arrangements with companies that provide services to the fund, oversee management of the risks associated with such activities and contractual arrangements, and review the fund's performance. Except for James C. Curvey, each of the Trustees oversees 228 funds advised by FMR or an affiliate. Mr. Curvey oversees 435 funds advised by FMR or an affiliate.
The Trustees hold office without limit in time except that (a) any Trustee may resign; (b) any Trustee may be removed by written instrument, signed by at least two-thirds of the number of Trustees prior to such removal; (c) any Trustee who requests to be retired or who has become incapacitated by illness or injury may be retired by written instrument signed by a majority of the other Trustees; and (d) any Trustee may be removed at any special meeting of shareholders by a two-thirds vote of the outstanding voting securities of the trust. Each Trustee who is not an interested person (as defined in the 1940 Act) (Independent Trustee), shall retire not later than the last day of the calendar year in which his or her 75th birthday occurs. The Independent Trustees may waive this mandatory retirement age policy with respect to individual Trustees. The executive officers and Advisory Board Members hold office without limit in time, except that any officer and Advisory Board Member may resign or may be removed by a vote of a majority of the Trustees at any regular meeting or any special meeting of the Trustees. Except as indicated, each individual has held the office shown or other offices in the same company for the past five years.
Experience, Skills, Attributes, and Qualifications of the Fund's Trustees. The Governance and Nominating Committee has adopted a statement of policy that describes the experience, qualifications, attributes, and skills that are necessary and desirable for potential Independent Trustee candidates (Statement of Policy). The Board believes that each Trustee satisfied at the time he or she was initially elected or appointed a Trustee, and continues to satisfy, the standards contemplated by the Statement of Policy. The Governance and Nominating Committee also engages professional search firms to help identify potential Independent Trustee candidates who have the experience, qualifications, attributes, and skills consistent with the Statement of Policy. From time to time, additional criteria based on the composition and skills of the current Independent Trustees, as well as experience or skills that may be appropriate in light of future changes to board composition, business conditions, and regulatory or other developments, have also been considered by the professional search firms and the Governance and Nominating Committee. In addition, the Board takes into account the Trustees' commitment and participation in Board and committee meetings, as well as their leadership of standing and ad hoc committees throughout their tenure.
In determining that a particular Trustee was and continues to be qualified to serve as a Trustee, the Board has considered a variety of criteria, none of which, in isolation, was controlling. The Board believes that, collectively, the Trustees have balanced and diverse experience, qualifications, attributes, and skills, which allow the Board to operate effectively in governing the fund and protecting the interests of shareholders. Information about the specific experience, skills, attributes, and qualifications of each Trustee, which in each case led to the Board's conclusion that the Trustee should serve (or continue to serve) as a trustee of the fund, is provided below.
Annual Report
Board Structure and Oversight Function. James C. Curvey is an interested person (as defined in the 1940 Act) and currently serves as Chairman. The Trustees have determined that an interested Chairman is appropriate and benefits shareholders because an interested Chairman has a personal and professional stake in the quality and continuity of services provided to the fund. Independent Trustees exercise their informed business judgment to appoint an individual of their choosing to serve as Chairman, regardless of whether the Trustee happens to be independent or a member of management. The Independent Trustees have determined that they can act independently and effectively without having an Independent Trustee serve as Chairman and that a key structural component for assuring that they are in a position to do so is for the Independent Trustees to constitute a substantial majority for the Board. The Independent Trustees also regularly meet in executive session. Ned C. Lautenbach serves as Chairman of the Independent Trustees and as such (i) acts as a liaison between the Independent Trustees and management with respect to matters important to the Independent Trustees and (ii) with management prepares agendas for Board meetings.
Fidelity funds are overseen by different Boards of Trustees. The fund's Board oversees Fidelity's equity and high income funds and another Board oversees Fidelity's investment-grade bond, money market, and asset allocation funds. The asset allocation funds may invest in Fidelity funds overseen by the fund's Board. The use of separate Boards, each with its own committee structure, allows the Trustees of each group of Fidelity funds to focus on the unique issues of the funds they oversee, including common research, investment, and operational issues. On occasion, the separate Boards establish joint committees to address issues of overlapping consequences for the Fidelity funds overseen by each Board.
The Trustees operate using a system of committees to facilitate the timely and efficient consideration of all matters of importance to the Trustees, the fund, and fund shareholders and to facilitate compliance with legal and regulatory requirements and oversight of the fund's activities and associated risks. The Board, acting through its committees, has charged FMR and its affiliates with (i) identifying events or circumstances the occurrence of which could have demonstrably adverse effects on the fund's business and/or reputation; (ii) implementing processes and controls to lessen the possibility that such events or circumstances occur or to mitigate the effects of such events or circumstances if they do occur; and (iii) creating and maintaining a system designed to evaluate continuously business and market conditions in order to facilitate the identification and implementation processes described in (i) and (ii) above. Because the day-to-day operations and activities of the fund are carried out by or through FMR, its affiliates and other service providers, the fund's exposure to risks is mitigated but not eliminated by the processes overseen by the Trustees. While each of the Board's committees has responsibility for overseeing different aspects of the fund's activities, oversight is exercised primarily through the Operations, Audit, and Compliance Committees. In addition, the Independent Trustees have worked with FMR to enhance the Board's oversight of investment and financial risks, legal and regulatory risks, technology risks, and operational risks, including the development of additional risk reporting to the Board. For example, a working group comprised of Independent Trustees and FMR has worked and continues to work to review the Fidelity funds' valuation-related activities, reporting and risk management. Appropriate personnel, including but not limited to the fund's Chief Compliance Officer (CCO), FMR's internal auditor, the independent accountants, the fund's Treasurer and portfolio management personnel, make periodic reports to the Board's committees, as appropriate, including an annual review of FMR's risk management program for the Fidelity funds. The responsibilities of each standing committee, including their oversight responsibilities, are described further under "Standing Committees of the Fund's Trustees."
Annual Report
Trustees and Officers - continued
The fund's Statements of Additional Information (SAIs) include more information about the Trustees. To request a free copy, call Fidelity at 1-800-544-8544 for Fidelity Series Real Estate Equity Fund or 1-800-835-5092 for Class F.
Interested Trustees*:
Correspondence intended for each Trustee who is an interested person may be sent to Fidelity Investments, 82 Devonshire Street, Boston, Massachusetts 02109.
Name, Age; Principal Occupations and Other Relevant Experience+ |
James C. Curvey (77) |
| Year of Election or Appointment: 2007 Mr. Curvey is Trustee and Chairman of the Board of Trustees of certain Trusts. Mr. Curvey also serves as Trustee (2007-present) of other investment companies advised by FMR. Mr. Curvey is a Director of Fidelity Investments Money Management, Inc. (2009-present), Director of Fidelity Research & Analysis Co. (2009-present) and Director of FMR and FMR Co., Inc. (2007-present). Mr. Curvey is also Vice Chairman (2007-present) and Director of FMR LLC. In addition, Mr. Curvey serves as an Overseer for the Boston Symphony Orchestra and a member of the Trustees of Villanova University. Previously, Mr. Curvey was the Vice Chairman (2006-2007) and Director (2000-2007) of FMR Corp. |
Ronald P. O'Hanley (55) |
| Year of Election or Appointment: 2011 Mr. O'Hanley is Director of FMR Co., Inc. (2010-present), Director of Fidelity Investments Money Management, Inc. (2010-present), Director of Fidelity Research & Analysis Company (2010-present), President of Fidelity Asset Management and Corporate Services and a member of Fidelity's Executive Committee (2010-present). Previously, Mr. O'Hanley served as President and Chief Executive Officer of BNY Mellon Asset Management (2007-2010). Mr. O'Hanley also served as Vice Chairman of Bank New York Mellon Corp. and a member of that firm's Executive Committee. Prior to the 2007 merger of The Bank of New York and Mellon Financial Corporation, he was Vice Chairman of Mellon Financial Corporation and President and Chief Executive Officer of Mellon Asset Management. He joined Mellon in February 1997. Mr. O'Hanley currently serves as Chairman of the Boston Public Library Foundation Board of Directors and sits on the Board of Directors of Beth Israel Deaconess Medical Center, the Board of Trustees of the Marine Biological Laboratory and the Advisory Board of the Maxwell School of Citizenship and Public Administration at Syracuse University. Mr. O'Hanley also chairs the Council on Asset Management for the Financial Services Roundtable and is a member of the Board of Directors of Institutional Investor's U.S. Institute. |
* Trustees have been determined to be "Interested Trustees" by virtue of, among other things, their affiliation with the trust or various entities under common control with FMR.
+ The information above includes each Trustee's principal occupation during the last five years and other information relating to the experience, attributes, and skills relevant to each Trustee's qualifications to serve as a Trustee, which led to the conclusion that each Trustee should serve as a Trustee for the fund.
Annual Report
Trustees and Officers - continued
Independent Trustees:
Correspondence intended for each Independent Trustee (that is, the Trustees other than the Interested Trustees) may be sent to Fidelity Investments, P.O. Box 55235, Boston, Massachusetts 02205-5235.
Name, Age; Principal Occupations and Other Relevant Experience+ |
Dennis J. Dirks (64) |
| Year of Election or Appointment: 2005 Prior to his retirement in May 2003, Mr. Dirks was Chief Operating Officer and a member of the Board of The Depository Trust & Clearing Corporation (DTCC). He also served as President, Chief Operating Officer, and Board member of The Depository Trust Company (DTC) and President and Board member of the National Securities Clearing Corporation (NSCC). In addition, Mr. Dirks served as Chief Executive Officer and Board member of the Government Securities Clearing Corporation, Chief Executive Officer and Board member of the Mortgage-Backed Securities Clearing Corporation, as a Trustee and a member of the Finance Committee of Manhattan College (2005-2008), and as a Trustee and a member of the Finance Committee of AHRC of Nassau County (2006-2008). Mr. Dirks is a member of the Independent Directors Council (IDC) Governing Council (2010-present) and Board of Directors for The Brookville Center for Children's Services, Inc. (2009-present). |
Alan J. Lacy (58) |
| Year of Election or Appointment: 2008 Mr. Lacy serves as Senior Adviser (2007-present) of Oak Hill Capital Partners, L.P. (private equity). Mr. Lacy also served as Chief Executive Officer (2000-2005) and Vice Chairman (2005-2006) of Sears Holdings Corporation and Sears, Roebuck and Co. (retail). In addition, Mr. Lacy serves as a member of the Board of Directors of Dave & Buster's Entertainment, Inc. (restaurant and entertainment complexes, 2010-present), Earth Fare, Inc. (retail grocery, 2012-present), The Hillman Companies, Inc. (hardware wholesalers, 2010-present), and Bristol-Myers Squibb Company (global pharmaceuticals, 2007-present). Mr. Lacy is a member of the Board of Trustees of The National Parks Conservation Association (2006-present). Previously, Mr. Lacy served as Chairman of the Board of Trustees of the National Parks Conservation Association (2008-2011) and as a member of the Board of Directors for the Western Union Company (global money transfer, 2006-2011). |
Ned C. Lautenbach (68) |
| Year of Election or Appointment: 2000 Mr. Lautenbach is Chairman of the Independent Trustees of the Equity and High Income Funds (2006-present). Mr. Lautenbach currently serves as the Lead Director of the Eaton Corporation Board of Directors (diversified industrial, 1997-present). Mr. Lautenbach is Chairman of the Board of Directors of the Philharmonic Center for the Arts in Naples, Florida (2012-present) and a member of the Council on Foreign Relations (1994-present). Previously, Mr. Lautenbach was a Partner/Advisory Partner at Clayton, Dubilier & Rice, LLC (private equity investment, 1998-2010), as well as a Director of Sony Corporation (2006-2007). |
Joseph Mauriello (67) |
| Year of Election or Appointment: 2008 Prior to his retirement in January 2006, Mr. Mauriello served in numerous senior management positions including Deputy Chairman and Chief Operating Officer (2004-2005), and Vice Chairman of Financial Services (2002-2004) of KPMG LLP US (professional services, 1965-2005). Mr. Mauriello currently serves as a member of the Board of Directors of XL Group plc. (global insurance and re-insurance, 2006-present). Previously, Mr. Mauriello served as a Director of the Hamilton Funds of the Bank of New York (2006-2007) and of Arcadia Resources Inc. (health care services and products, 2007-2012). |
Robert W. Selander (61) |
| Year of Election or Appointment: 2011 Previously, Mr. Selander served as a Member of the Advisory Board of Fidelity's Equity and High Income Funds (2011), Executive Vice Chairman (2010), Chief Executive Officer (2009-2010), and President and Chief Executive Officer (1997-2009) of Mastercard, Inc. |
Cornelia M. Small (68) |
| Year of Election or Appointment: 2005 Ms. Small is a member of the Board of Directors of the Teagle Foundation (2009-present). Ms. Small is also a member of the Investment Committee, and Chair (2008-present) and a member of the Board of Trustees of Smith College. In addition, Ms. Small serves on the Investment Committee of the Berkshire Taconic Community Foundation (2008-present). Previously, Ms. Small served as Chairperson of the Investment Committee (2002-2008) of Smith College. In addition, Ms. Small served as Chief Investment Officer, Director of Global Equity Investments, and a member of the Board of Directors of Scudder, Stevens & Clark and Scudder Kemper Investments. |
William S. Stavropoulos (73) |
| Year of Election or Appointment: 2002 Mr. Stavropoulos is Vice Chairman of the Independent Trustees of the Equity and High Income Funds (2006-present). Mr. Stavropoulos serves as President and Founder of the Michigan Baseball Foundation, the Great Lakes Loons (2007-present). Mr. Stavropoulos is Chairman Emeritus of the Board of Directors of The Dow Chemical Company, where he previously served in numerous senior management positions, including President, CEO (1995-2000; 2002-2004), Chairman of the Executive Committee (2000-2006), and as a member of the Board of Directors (1990-2006). Currently, Mr. Stavropoulos is Chairman of Univar (global distributor of commodity and specialty chemicals, 2010-present), a Director of Teradata Corporation (data warehousing and technology solutions, 2008-present), Chemical Financial Corporation, Maersk Inc. (industrial conglomerate), Tyco International, Inc. (multinational manufacturing and services, 2007-present), and a member of the Advisory Board for Metalmark Capital (private equity investment, 2005-present). Mr. Stavropoulos is a special advisor to Clayton, Dubilier & Rice, LLC (private equity investment). In addition, Mr. Stavropoulos is a member of the University of Notre Dame Advisory Council for the College of Science. |
David M. Thomas (63) |
| Year of Election or Appointment: 2008 Previously, Mr. Thomas served as Executive Chairman (2005-2006) and Chairman and Chief Executive Officer (2000-2005) of IMS Health, Inc. (pharmaceutical and healthcare information solutions). In addition, Mr. Thomas serves as a member of the Board of Directors of Fortune Brands, Inc. (consumer products), and Interpublic Group of Companies, Inc. (marketing communication, 2004-present). |
Michael E. Wiley (61) |
| Year of Election or Appointment: 2008 Mr. Wiley also serves as a Director of Asia Pacific Exploration Consolidated (international oil and gas exploration and production, 2008-present). Mr. Wiley serves as a Director of Tesoro Corporation (independent oil refiner and marketer, 2005-present), and a Director of Bill Barrett Corporation (exploration and production, 2005-present). In addition, Mr. Wiley also serves as a Director of Post Oak Bank (privately-held bank, 2004-present). Previously, Mr. Wiley served as a member of the Board of Trustees of the University of Tulsa (2000-2006; 2007-2010), as a Senior Energy Advisor of Katzenbach Partners, LLC (consulting, 2006-2007), as an Advisory Director of Riverstone Holdings (private investment), Chairman, President, and CEO of Baker Hughes, Inc. (oilfield services, 2000-2004), and as Director of Spinnaker Exploration Company (exploration and production, 2001-2005). |
Annual Report
+ The information above includes each Trustee's principal occupation during the last five years and other information relating to the experience, attributes, and skills relevant to each Trustee's qualifications to serve as a Trustee, which led to the conclusion that each Trustee should serve as a Trustee for the fund.
Advisory Board Members and Executive Officers:
Correspondence intended for David A. Rosow and Garnett A. Smith may be sent to Fidelity Investments, P.O. Box 55235, Boston, Massachusetts 02205-5235. Correspondence intended for each executive officer, Edward C. Johnson 3d, and Peter S. Lynch may be sent to Fidelity Investments, 82 Devonshire Street, Boston, Massachusetts 02109.
Name, Age; Principal Occupation |
Edward C. Johnson 3d (82) |
| Year of Election or Appointment: 2011 Member of the Advisory Board of Fidelity's Equity and High Income Funds. Mr. Johnson serves as Chief Executive Officer, Chairman, and a Director of FMR LLC, and also serves as Chairman and Director of FIL Limited. Previously, Mr. Johnson served as a Trustee and Chairman of the Board of certain Fidelity Trusts, Chairman and a Director of FMR, Chairman and a Director of FMR Co., Inc., and President of FMR LLC (2006-2007). |
Peter S. Lynch (68) |
| Year of Election or Appointment: 2003 Member of the Advisory Board of Fidelity's Equity and High Income Funds. Mr. Lynch is Vice Chairman and a Director of FMR and FMR Co., Inc. In addition, Mr. Lynch serves as a Trustee of Boston College and as the Chairman of the Inner-City Scholarship Fund. Previously, Mr. Lynch served on the Special Olympics International Board of Directors (1997-2006). |
David A. Rosow (69) |
| Year of Election or Appointment: 2012 Member of the Advisory Board of Fidelity's Equity and High Income Funds. Chairman and Chief Executive Officer of International Golf Group, Inc. (golf course development, 1990-present). Previously, Mr. Rosow served as Chairman and Chief Executive Officer of Rosow & Company, Inc. (private investment company, 1989-2011), a Lead Director of Hudson United Bancorp (2001-2006) and as a Director of TD Banknorth (1996-2006). In addition, Mr. Rosow is a member (2008-present) and President (2009-present) of the Town Council of Palm Beach, Florida. |
Garnett A. Smith (64) |
| Year of Election or Appointment: 2012 Member of the Advisory Board of Fidelity's Equity and High Income Funds. Prior to Mr. Smith's retirement, he served as Chairman and Chief Executive Officer of Inbrand Corp. (manufacturer of personal absorbent products, 1990-1997). He also served as President (1986-1990) of Inbrand Corp. Prior to his employment with Inbrand Corp., he was employed by a retail fabric chain and North Carolina National Bank. In addition, Mr. Smith is a board member of the Jackson Hole Land Trust (2009-present). |
Kenneth B. Robins (42) |
| Year of Election or Appointment: 2008 President and Treasurer of Fidelity's Equity and High Income Funds. Mr. Robins also serves as President and Treasurer (2010-present) and Assistant Treasurer (2009-present) of other Fidelity funds and is an employee of Fidelity Investments (2004-present). Previously, Mr. Robins served as Deputy Treasurer of the Fidelity funds (2005-2008) and Treasurer and Chief Financial Officer of The North Carolina Capital Management Trust: Cash and Term Portfolios (2006-2008). |
Christopher S. Bartel (40) |
| Year of Election or Appointment: 2009 Vice President of Fidelity's Sector and Real Estate Equity Funds. Mr. Bartel also serves as a Director, President, and Chief Executive Officer of Fidelity Management & Research (Japan) Inc. (2012-present), a Director of Fidelity Management & Research (Hong Kong) (2012-present), and Senior Vice President of Global Equity Research (2010-present). Previously, Mr. Bartel served as Senior Vice President of Equity Research (2009-2010), Managing Director of Research (2006-2009), and an analyst and portfolio manager (2000-2006). |
Brian B. Hogan (47) |
| Year of Election or Appointment: 2009 Vice President of Equity and High Income Funds. Mr. Hogan also serves as President of FMR's Equity Division (2009-present). Previously, Mr. Hogan served as Senior Vice President, Equity Research of FMR (2006-2009) and as a portfolio manager. |
Scott C. Goebel (44) |
| Year of Election or Appointment: 2008 Secretary and Chief Legal Officer (CLO) of the Fidelity funds. Mr. Goebel also serves as Secretary of Fidelity Investments Money Management, Inc. (FIMM) (2010-present) and Fidelity Research and Analysis Company (FRAC) (2010-present); Secretary and CLO of The North Carolina Capital Management Trust: Cash and Term Portfolios (2008-present); General Counsel, Secretary, and Senior Vice President of FMR (2008-present) and FMR Co., Inc. (2008-present); employed by FMR LLC or an affiliate (2001-present); Chief Legal Officer of Fidelity Management & Research (Hong Kong) Limited (2008-present) and Assistant Secretary of Fidelity Management & Research (Japan) Inc. (2008-present), and Fidelity Management & Research (U.K.) Inc. (2008-present). Previously, Mr. Goebel served as Assistant Secretary of FIMM (2008-2010), FRAC (2008-2010), and the Funds (2007-2008) and as Vice President and Secretary of Fidelity Distributors Corporation (FDC) (2005-2007). |
William C. Coffey (43) |
| Year of Election or Appointment: 2009 Assistant Secretary of Fidelity's Equity and High Income Funds. Mr. Coffey also serves as Senior Vice President and Deputy General Counsel of FMR LLC (2010-present), and is an employee of Fidelity Investments. Previously, Mr. Coffey served as Vice President and Associate General Counsel of FMR LLC (2005-2009). |
Elizabeth Paige Baumann (44) |
| Year of Election or Appointment: 2012 Anti-Money Laundering (AML) Officer of the Fidelity funds. Ms. Baumann also serves as AML Officer of The North Carolina Capital Management Trust: Cash and Term Portfolios (2012-present), Chief AML Officer of FMR LLC (2012-present), and is an employee of Fidelity Investments. Previously, Ms. Baumann served as Vice President and Deputy Anti-Money Laundering Officer (2007-2012). |
Christine Reynolds (53) |
| Year of Election or Appointment: 2008 Chief Financial Officer of the Fidelity funds. Ms. Reynolds became President of Fidelity Pricing and Cash Management Services (FPCMS) in August 2008. Ms. Reynolds served as Chief Operating Officer of FPCMS (2007-2008). Previously, Ms. Reynolds served as President, Treasurer, and Anti-Money Laundering officer of the Fidelity funds (2004-2007). |
Joseph A. Hanlon (44) |
| Year of Election or Appointment: 2012 Chief Compliance Officer of Fidelity's Equity and High Income Funds. Mr. Hanlon serves as Compliance Officer of FMR, FMR Co., Inc., Fidelity Investments Money Management, Inc. (FIMM), Fidelity Research and Analysis Company (FRAC), Fidelity Management & Research (Japan) Inc., Fidelity Management & Research (U.K.) Inc., Fidelity Management & Research (Hong Kong), and Strategic Advisers, Inc. (2009-present), as Senior Vice President of the Fidelity Asset Management Division (2009-present), and is an employee of Fidelity Investments. |
Joseph F. Zambello (55) |
| Year of Election or Appointment: 2011 Deputy Treasurer of the Fidelity funds. Mr. Zambello is an employee of Fidelity Investments. Previously, Mr. Zambello served as Vice President of FMR's Program Management Group (2009-2011) and Vice President of the Transfer Agent Oversight Group (2005-2009). |
Adrien E. Deberghes (44) |
| Year of Election or Appointment: 2008 Deputy Treasurer of Fidelity's Equity and High Income Funds. Mr. Deberghes also serves as Vice President (2011-present) and Assistant Treasurer (2010-present) of other Fidelity funds, and is an employee of Fidelity Investments (2008-present). Previously, Mr. Deberghes served as Senior Vice President of Mutual Fund Administration at State Street Corporation (2007-2008), Senior Director of Mutual Fund Administration at Investors Bank & Trust (2005-2007), and Director of Finance for Dunkin' Brands (2000-2005). |
Stephanie J. Dorsey (43) |
| Year of Election or Appointment: 2010 Assistant Treasurer of Fidelity's Equity and High Income Funds. Ms. Dorsey also serves as Deputy Treasurer of other Fidelity funds (2008-present) and is an employee of Fidelity Investments (2008-present). Previously, Ms. Dorsey served as Treasurer (2004-2008) of the JPMorgan Mutual Funds and Vice President (2004-2008) of JPMorgan Chase Bank. |
John R. Hebble (54) |
| Year of Election or Appointment: 2009 Assistant Treasurer of Fidelity's Equity and High Income Funds. Mr. Hebble also serves as President (2011-present), Treasurer, and Chief Financial Officer of The North Carolina Capital Management Trust: Cash and Term Portfolios (2008-present), President and Treasurer of other Fidelity funds (2008-present) and is an employee of Fidelity Investments. |
Gary W. Ryan (53) |
| Year of Election or Appointment: 2005 Assistant Treasurer of the Fidelity funds. Mr. Ryan is an employee of Fidelity Investments. Previously, Mr. Ryan served as Vice President of Fund Reporting in Fidelity Pricing and Cash Management Services (FPCMS) (1999-2005). |
Jonathan Davis (44) |
| Year of Election or Appointment: 2010 Assistant Treasurer of the Fidelity funds. Mr. Davis is also Assistant Treasurer of Fidelity Rutland Square Trust II and Fidelity Commonwealth Trust II. Mr. Davis is an employee of Fidelity Investments. Previously, Mr. Davis served as Vice President and Associate General Counsel of FMR LLC (2003-2010). |
Annual Report
The Board of Trustees of Fidelity Series Real Estate Equity Fund voted to pay shareholders of record at the opening of business on record date, the following distributions per share derived from capital gains realized from sales of portfolio securities, and dividends derived from net investment income:
| Pay Date | Record Date | Dividends | Capital Gains |
Real Estate Equity | 09/10/12 | 09/07/12 | $0.037 | $0.132 |
Class F | 09/10/12 | 09/07/12 | $0.044 | $0.132 |
The fund hereby designates as a capital gain dividend with respect to the taxable year ended July 31, 2012, $1,574,090, or, if subsequently determined to be different, the net capital gain of such year.
A total of 0.03% of the dividends distributed during the fiscal year was derived from interest on U.S. Government securities which is generally exempt from state income tax.
The fund will notify shareholders in January 2013 of amounts for use in preparing 2012 income tax returns.
Annual Report
Board Approval of Investment Advisory Contracts and Management Fees
Fidelity Series Real Estate Equity Fund
Each year, the Board of Trustees, including the Independent Trustees (together, the Board), votes on the renewal of the management contract and sub-advisory agreements (together, the Advisory Contracts) for the fund. The Board, assisted by the advice of fund counsel and Independent Trustees' counsel, requests and considers a broad range of information relevant to the renewal of the Advisory Contracts throughout the year.
The Board meets regularly and, at each of its meetings, considers factors that are relevant to its annual consideration of the renewal of the fund's Advisory Contracts, including the services and support provided to the fund and its shareholders. The Board has established various standing committees, each composed of and chaired by Independent Trustees with varying backgrounds, to which the Board has assigned specific subject matter responsibilities in order to enhance effective decision-making by the Board. The Board, acting directly and through its Committees, requests and receives information concerning the annual consideration of the renewal of the fund's Advisory Contracts. The Board also meets as needed to consider matters specifically related to the Board's annual consideration of the renewal of Advisory Contracts. Members of the Board may also meet with trustees of other Fidelity funds through ad hoc joint committees to discuss certain matters relevant to the Fidelity funds.
At its July 2012 meeting, the Board of Trustees, including the Independent Trustees, unanimously determined to renew the fund's Advisory Contracts. In reaching its determination, the Board considered all factors it believed relevant, including (i) the nature, extent, and quality of the services to be provided to the fund and its shareholders (including the investment performance of the fund); (ii) the competitiveness of the fund's management fee and total expense ratio relative to peer funds; (iii) the total costs of the services to be provided by and the profits to be realized by Fidelity from its relationship with the fund; (iv) the extent to which economies of scale exist and would be realized as the fund grows; and (v) whether fee levels reflect these economies of scale, if any, for the benefit of fund shareholders.
In considering whether to renew the Advisory Contracts for the fund, the Board reached a determination, with the assistance of fund counsel and Independent Trustees' counsel and through the exercise of its business judgment, that the renewal of the Advisory Contracts is in the best interests of the fund and its shareholders and that the compensation payable under the Advisory Contracts is fair and reasonable. The Board's decision to renew the Advisory Contracts was not based on any single factor, but rather was based on a comprehensive consideration of all the information provided to the Board at its meetings throughout the year. The Board, in reaching its determination to renew the Advisory Contracts, is aware that shareholders in the fund have a broad range of investment choices available to them, including a wide choice among mutual funds offered by Fidelity's competitors, and that the fund's shareholders, who have the opportunity to review and weigh the disclosure provided by the fund in its prospectus and other public disclosures, have chosen to invest in this fund, managed by Fidelity.
Annual Report
Board Approval of Investment Advisory Contracts and
Management Fees - continued
Nature, Extent, and Quality of Services Provided. The Board considered the staffing within the investment adviser, FMR, and the sub-advisers (together, the Investment Advisers), including the backgrounds of the fund's investment personnel, and also considered the fund's investment objective, strategies, and related investment philosophy. The Independent Trustees also had discussions with senior management of Fidelity's investment operations and investment groups. The Board considered the structure of the portfolio manager compensation program and whether this structure provides appropriate incentives to act in the best interests of the fund.
Resources Dedicated to Investment Management and Support Services. The Board and the Fund Oversight and Research Committees reviewed the general qualifications and capabilities of the Investment Advisers' investment staff, including its size, education, experience, and resources, as well as the Investment Advisers' approach to recruiting, training, managing, and compensating investment personnel. The Board also noted that FMR has continued to increase the resources devoted to non-U.S. offices, including expansion of Fidelity's global investment organization. The Board noted that Fidelity's analysts have extensive resources, tools and capabilities that allow them to conduct sophisticated quantitative and fundamental analysis, as well as credit analysis of issuers, counterparties and guarantors. The Board also believes that Fidelity's investment professionals have sufficient access to global information and data so as to provide competitive investment results over time, and that those professionals also have access to sophisticated tools that permit them to assess portfolio construction and risk and performance attribution characteristics continuously, as well as to transmit new information and research conclusions rapidly around the world. Additionally, in its deliberations, the Board considered the Investment Advisers' trading and risk management capabilities and resources, which are an integral part of the investment management process.
Shareholder and Administrative Services. The Board considered (i) the nature, extent, quality, and cost of advisory, administrative, and shareholder services performed by the Investment Advisers and their affiliates under the Advisory Contracts and under separate agreements covering transfer agency, pricing and bookkeeping, and securities lending services for the fund; (ii) the nature and extent of the supervision of third party service providers, principally custodians and subcustodians; and (iii) the resources devoted to, and the record of compliance with, the fund's compliance policies and procedures. The Board also reviewed the allocation of fund brokerage, including allocations to brokers affiliated with the Investment Advisers, the use of brokerage commissions to pay fund expenses, and the use of "soft" commission dollars to pay for research services.
Annual Report
The Board noted that the growth of fund assets over time across the complex allows Fidelity to reinvest in the development of services designed to enhance the value or convenience of the Fidelity funds as investment vehicles. These services include 24-hour access to account information and market information through telephone representatives and over the Internet, investor education materials and asset allocation tools, and the expanded availability of Fidelity Investor Centers.
Investment in a Large Fund Family. The Board considered the benefits to shareholders of investing in a Fidelity fund, including the benefits of investing in a fund that is part of a large family of funds offering a variety of investment disciplines and providing a large variety of mutual fund investor services. The Board noted that Fidelity had taken, or had made recommendations that resulted in the Fidelity funds taking, a number of actions over the previous year that benefited particular funds, including (i) continuing to dedicate additional resources to investment research and support of the senior management team that oversees asset management; (ii) persisting in efforts to enhance Fidelity's research capabilities, in particular, international research; (iii) launching new funds and making other enhancements to meet client needs for global and income-oriented solutions; (iv) continuing to launch dedicated lower cost underlying funds to meet investment management's portfolio construction needs related to expanding underlying fund options, specifically for the Freedom Fund product lines; (v) adopting a "Stock Selector" sector neutral investment approach and employing a team of portfolio managers who are sector specialists to manage certain funds; (vi) rationalizing product lines and gaining increased efficiencies through the mergers of several funds into other funds; (vii) strengthening the Spartan Index Fund product line by adding new funds and/or new low-cost institutional share classes, restructuring fund expenses to accommodate new classes, and reducing investment minimums for certain classes of shares; (viii) modifying the eligibility criteria for Institutional Class shares to increase their appeal to government entities and charitable investors; and (ix) reducing certain transfer agent fee rates.
Investment Performance. The Board considered whether the fund has operated in accordance with its investment objective, as well as its record of compliance with its investment restrictions. As the fund recently commenced operations the Board did not believe that it was appropriate to assign significant weight to its limited investment performance.
Based on its review, the Board concluded that the nature, extent, and quality of services provided to the fund under the Advisory Contracts should benefit the fund's shareholders.
Competitiveness of Management Fee and Total Expense Ratio. The Board considered the fund's management fee and total expense ratio compared to "mapped groups" of competitive funds and classes. Fidelity creates "mapped groups" by combining similar Lipper investment objective categories that have comparable management fee characteristics. Combining Lipper investment objective categories aids the Board's management fee and total expense ratio comparisons by broadening the competitive group used for comparison and by reducing the number of universes to which various Fidelity funds are compared.
Annual Report
Board Approval of Investment Advisory Contracts and
Management Fees - continued
Management Fee. The Board considered two proprietary management fee comparisons for the period of the fund's operations shown in the chart below. The group of Lipper funds used by the Board for management fee comparisons is referred to below as the "Total Mapped Group." The Total Mapped Group comparison focuses on a fund's standing relative to the total universe of comparable funds available to investors in terms of gross management fees before expense reimbursements or caps. "TMG %" represents the percentage of funds in the Total Mapped Group that had management fees that were lower than the fund's. For example, a TMG % of 6% means that 94% of the funds in the Total Mapped Group had higher management fees than the fund. The "Asset-Size Peer Group" (ASPG) comparison focuses on a fund's standing relative to non-Fidelity funds similar in size to the fund within the Total Mapped Group. The ASPG represents at least 15% of the funds in the Total Mapped Group with comparable asset size and management fee characteristics, subject to a minimum of 50 funds (or all funds in the Total Mapped Group if fewer than 50). Additional information, such as the ASPG quartile in which the fund's management fee ranked, is also included in the chart and considered by the Board.
Fidelity Series Real Estate Equity Fund
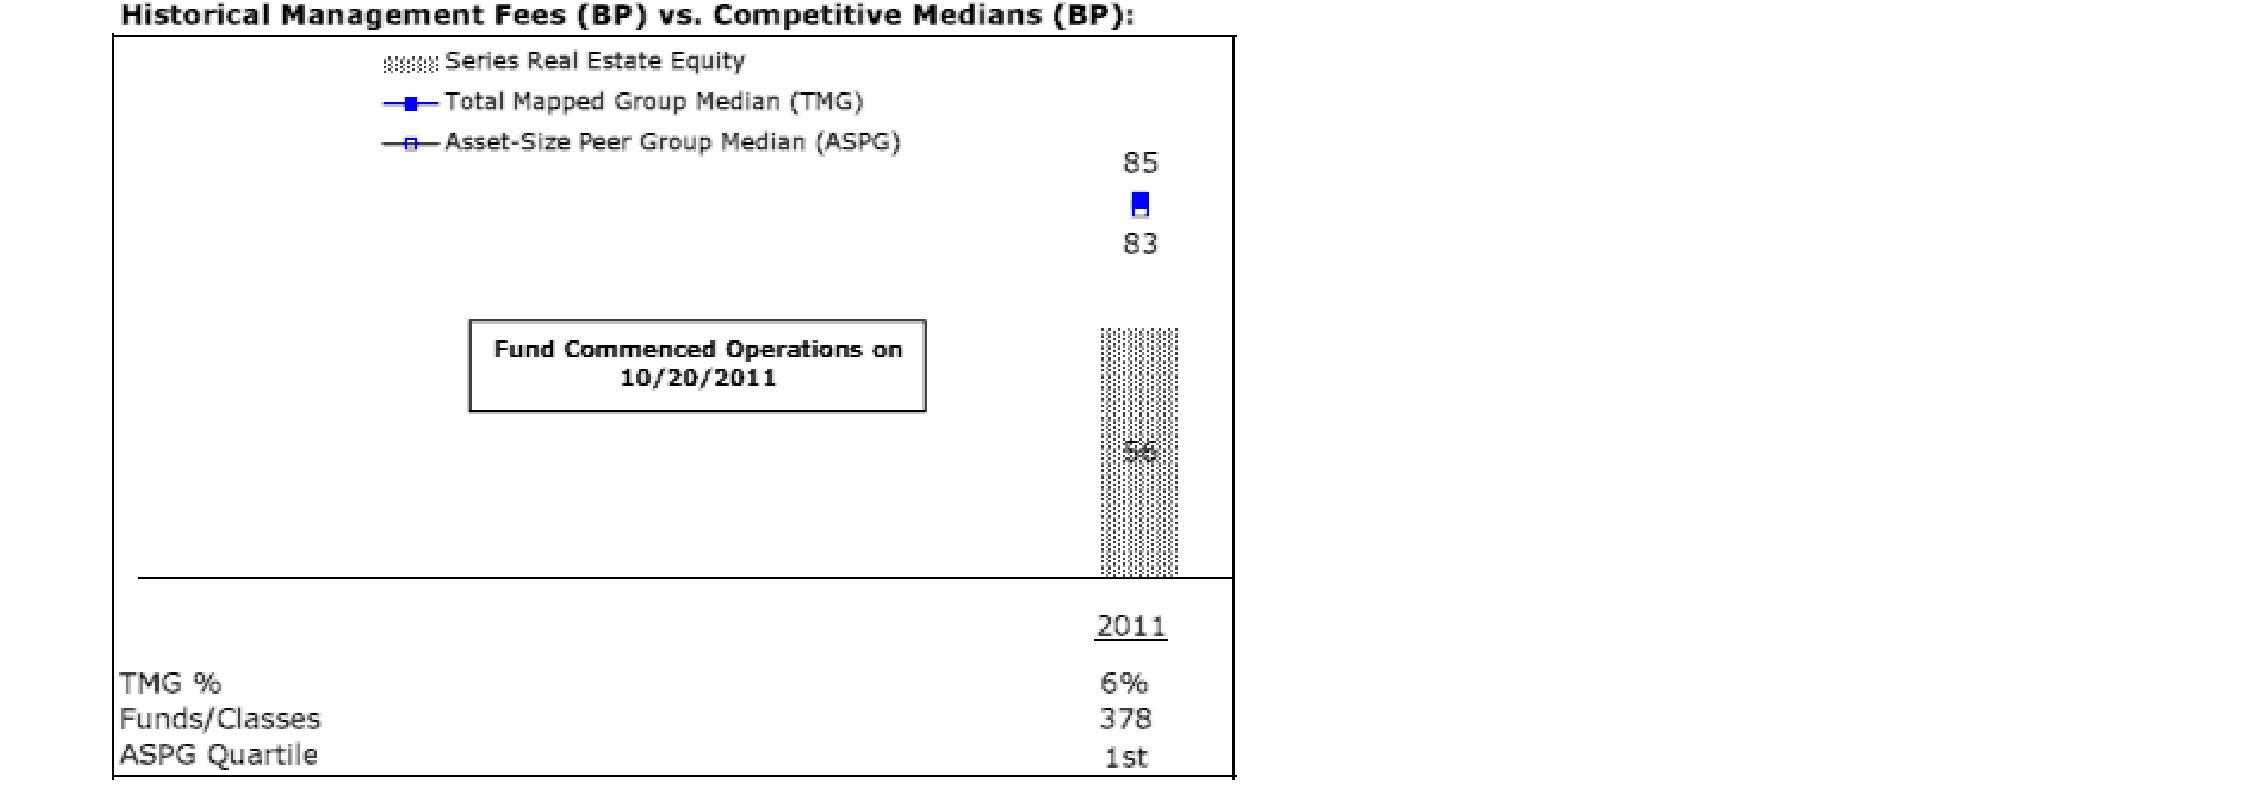
The Board noted that the fund's management fee ranked below the median of its Total Mapped Group and below the median of its ASPG for the period.
Annual Report
Based on its review, the Board concluded that the fund's management fee is fair and reasonable in light of the services that the fund receives and the other factors considered.
Total Expense Ratio. In its review of each class's total expense ratio, the Board considered the fund's management fee as well as other fund or class expenses, as applicable, such as transfer agent fees, pricing and bookkeeping fees, and custodial, legal, and audit fees. The Board also noted the effects of any waivers and reimbursements on fees and expenses. As part of its review, the Board also considered the current total expense ratios of each class of the fund compared to competitive fund median expenses. Each class of the fund is compared to those funds and classes in the Total Mapped Group (used by the Board for management fee comparisons) that have a similar sales load structure.
The Board noted that the total expense ratio of each class ranked below its competitive median for the period.
Fees Charged to Other Fidelity Clients. The Board also considered Fidelity fee structures and other information with respect to clients of FMR and its affiliates, such as other mutual funds advised or subadvised by FMR or its affiliates, pension plan clients, and other institutional clients. The Board noted the findings of the 2010 ad hoc joint committee (created with the board of other Fidelity funds), which reviewed and compared Fidelity's institutional investment advisory business with its business of providing services to the Fidelity funds, including the differences in services provided, fees charged, and costs incurred, as well as competition in their respective marketplaces.
Based on its review of total expense ratios and fees charged to other Fidelity clients, the Board concluded that the total expense ratio of each class of the fund was reasonable in light of the services that the fund and its shareholders receive and the other factors considered.
Costs of the Services and Profitability. The Board considered the revenues earned and the expenses incurred by Fidelity in conducting the business of developing, marketing, distributing, managing, administering and servicing the fund and its shareholders. The Board also considered the level of Fidelity's profits in respect of all the Fidelity funds.
On an annual basis, FMR presents to the Board Fidelity's profitability for the fund. Fidelity calculates the profitability for each fund, as well as aggregate profitability for groups of Fidelity funds and all Fidelity funds, using a series of detailed revenue and cost allocation methodologies which originate with the books and records of Fidelity on which Fidelity's audited financial statements are based. The Audit Committee of the Board reviews any significant changes from the prior year's methodologies.
PricewaterhouseCoopers LLP (PwC), independent registered public accounting firm and auditor to Fidelity and certain Fidelity funds, has been engaged annually by the Board as part of the Board's assessment of Fidelity's profitability analysis. PwC's engagement includes the review and assessment of Fidelity's methodologies used in determining the revenues and expenses attributable to Fidelity's mutual fund business, and completion of agreed-upon procedures surrounding the mathematical accuracy of fund profitability and its conformity to allocation methodologies. After considering PwC's reports issued under the engagement and information provided by Fidelity, the Board concluded that while other allocation methods may also be reasonable, Fidelity's profitability methodologies are reasonable in all material respects.
Annual Report
Board Approval of Investment Advisory Contracts and
Management Fees - continued
The Board also reviewed Fidelity's non-fund businesses and fall-out benefits related to the mutual fund business as well as cases where Fidelity's affiliates may benefit from or be related to the fund's business.
The Board considered the costs of the services provided by and the profits realized by Fidelity in connection with the operation of the fund and was satisfied that the profitability was not excessive in the circumstances.
Economies of Scale. The Board considered whether there have been economies of scale in respect of the management of the Fidelity funds, whether the Fidelity funds (including the fund) have appropriately benefited from any such economies of scale, and whether there is potential for realization of any further economies of scale. The Board considered the extent to which the fund will benefit from economies of scale through increased services to the fund, through waivers or reimbursements, or through fee or expense reductions. The Board also noted that in 2009, it and the board of other Fidelity funds created an ad hoc committee (the Economies of Scale Committee) to analyze whether FMR attains economies of scale in respect of the management and servicing of the Fidelity funds, whether the Fidelity funds have appropriately benefited from such economies of scale, and whether there is potential for realization of any further economies of scale.
The Board recognized that the fund's management contract incorporates a "group fee" structure, which provides for lower group fee rates as total fund assets under FMR's management increase, and for higher group fee rates as total fund assets under FMR's management decrease. FMR calculates the group fee rates based on a tiered asset "breakpoint" schedule that varies based on asset class. The Board considered that the group fee is designed to deliver the benefits of economies of scale to fund shareholders when total Fidelity fund assets increase, even if assets of any particular fund are unchanged or have declined, because some portion of Fidelity's costs are attributable to services provided to all Fidelity funds, and all funds benefit if those costs can be allocated among more assets. The Board also considered that although the fund is offered only to other funds advised by FMR or an affiliate, it continues to incur investment management expenses. The Board further noted that the fund may continue to realize benefits from the group fee structure, even though assets may not be expected to grow significantly at the fund level. The Board concluded that, given the group fee structure, fund shareholders will benefit from lower management fees as assets under FMR's management increase at the fund complex level, regardless of whether Fidelity achieves any such economies of scale.
Annual Report
The Board concluded, taking into account the analysis of the Economies of Scale Committee, that economies of scale, if any, are being appropriately shared between fund shareholders and Fidelity.
Additional Information Requested by the Board. In order to develop fully the factual basis for consideration of the Fidelity funds' Advisory Contracts, the Board requested and received additional information on certain topics, including (i) fund performance trends, actions to be taken by FMR to improve certain funds' overall performance, and Fidelity's long-term strategies for certain funds; (ii) the potential to further rationalize the Fidelity fund lineup with the possibility of achieving savings for the funds and Fidelity; (iii) Fidelity's compensation structure for portfolio managers and other key investment personnel; (iv) the amount of the investment that each portfolio manager has made in the Fidelity fund(s) that he or she manages; (v) the realization of fall-out benefits in certain Fidelity business units; (vi) Fidelity's group fee structures, the potential impact of regulatory changes on such structures, and the rationale for the individual fee rates of certain funds; (vii) fund profitability methodology, including Fidelity's cost allocation methodology, and the impact of certain factors on fund profitability results; (viii) trends regarding industry use of performance fee structures and the possibility of implementing performance fee structures for additional funds; and (ix) the impact of net redemptions from the Fidelity funds.
Based on its evaluation of all of the conclusions noted above, and after considering all factors it believed relevant, the Board ultimately concluded that the advisory fee structures are fair and reasonable, and that the fund's Advisory Contracts should be renewed.
Annual Report
Investment Adviser
Fidelity Management & Research Company
Boston, MA
Investment Sub-Advisers
FMR Co., Inc.
Fidelity Management & Research (U.K.) Inc.
Fidelity Management & Research
(Hong Kong) Limited
Fidelity Management & Research
(Japan) Inc.
General Distributor
Fidelity Distributors Corporation
Smithfield, RI
Transfer and Service Agents
Fidelity Investments Institutional Operations Company, Inc.
Boston, MA
Fidelity Service Company, Inc.
Boston, MA
Custodian
State Street Bank and Trust Company
Quincy, MA
(Fidelity Investment logo)(registered trademark)
Corporate Headquarters
82 Devonshire St., Boston, MA 02109
www.fidelity.com
SLE-ANN-0912
1.930453.100
Fidelity®
Dividend Growth
Fund -
Class K
Annual Report
July 31, 2012
(Fidelity Cover Art)
Contents
Performance | (Click Here) | How the fund has done over time. |
Management's Discussion of Fund Performance | (Click Here) | The Portfolio Manager's review of fund performance and strategy. |
Shareholder Expense Example | (Click Here) | An example of shareholder expenses. |
Investment Changes | (Click Here) | A summary of major shifts in the fund's investments over the past six months. |
Investments | (Click Here) | A complete list of the fund's investments with their market values. |
Financial Statements | (Click Here) | Statements of assets and liabilities, operations, and changes in net assets, as well as financial highlights. |
Notes | (Click Here) | Notes to the financial statements. |
Report of Independent Registered Public Accounting Firm | (Click Here) | |
Trustees and Officers | (Click Here) | |
Distributions | (Click Here) | |
Board Approval of Investment Advisory Contracts and Management Fees | (Click Here) | |
To view a fund's proxy voting guidelines and proxy voting record for the 12-month period ended June 30, visit http://www.fidelity.com/proxyvotingresults or visit the Securities and Exchange Commission's (SEC) web site at http://www.sec.gov. You may also call 1-800-835-5092 to request a free copy of the proxy voting guidelines.
Standard & Poor's, S&P and S&P 500 are registered service marks of The McGraw-Hill Companies, Inc. and have been licensed for use by Fidelity Distributors Corporation.
Other third party marks appearing herein are the property of their respective owners.
All other marks appearing herein are registered or unregistered trademarks or service marks of FMR LLC or an affiliated company. © 2012 FMR LLC. All rights reserved.
Annual Report
This report and the financial statements contained herein are submitted for the general information of the shareholders of the fund. This report is not authorized for distribution to prospective investors in the fund unless preceded or accompanied by an effective prospectus.
A fund files its complete schedule of portfolio holdings with the SEC for the first and third quarters of each fiscal year on Form N-Q. Forms N-Q are available on the SEC's web site at http://www.sec.gov. A fund's Forms N-Q may be reviewed and copied at the SEC's Public Reference Room in Washington, DC. Information regarding the operation of the SEC's Public Reference Room may be obtained by calling 1-800-SEC-0330. For a complete list of a fund's portfolio holdings, view the most recent holdings listing, semiannual report, or annual report on Fidelity's web site at http://www.fidelity.com, http://www.advisor.fidelity.com, or http://www.401k.com, as applicable.
NOT FDIC INSURED • MAY LOSE VALUE • NO BANK GUARANTEE
Neither the fund nor Fidelity Distributors Corporation is a bank.
Annual Report
Average annual total return reflects the change in the value of an investment, assuming reinvestment of the class' distributions from dividend income and capital gains (the profits earned upon the sale of securities that have grown in value, if any) and assuming a constant rate of performance each year. The $10,000 table and the fund's returns do not reflect the deduction of taxes that a shareholder would pay on fund distributions or the redemption of fund shares. During periods of reimbursement by Fidelity, a fund's total return will be greater than it would be had the reimbursement not occurred. How a fund did yesterday is no guarantee of how it will do tomorrow.
Average Annual Total Returns
Periods ended July 31, 2012 | Past 1
year | Past 5
years | Past 10
years |
Class K A | -0.52% | 0.82% | 5.41% |
A The initial offering of Class K shares took place on May 9, 2008. Returns prior to May 9, 2008 are those of Fidelity® Dividend Growth Fund, the original class of the fund.
$10,000 Over 10 Years
Let's say hypothetically that $10,000 was invested in Fidelity® Dividend Growth Fund - Class K on July 31, 2002. The chart shows how the value of your investment would have changed, and also shows how the S&P 500® Index performed over the same period. The initial offering of Class K took place on May 9, 2008. See above for additional information regarding the performance of Class K.
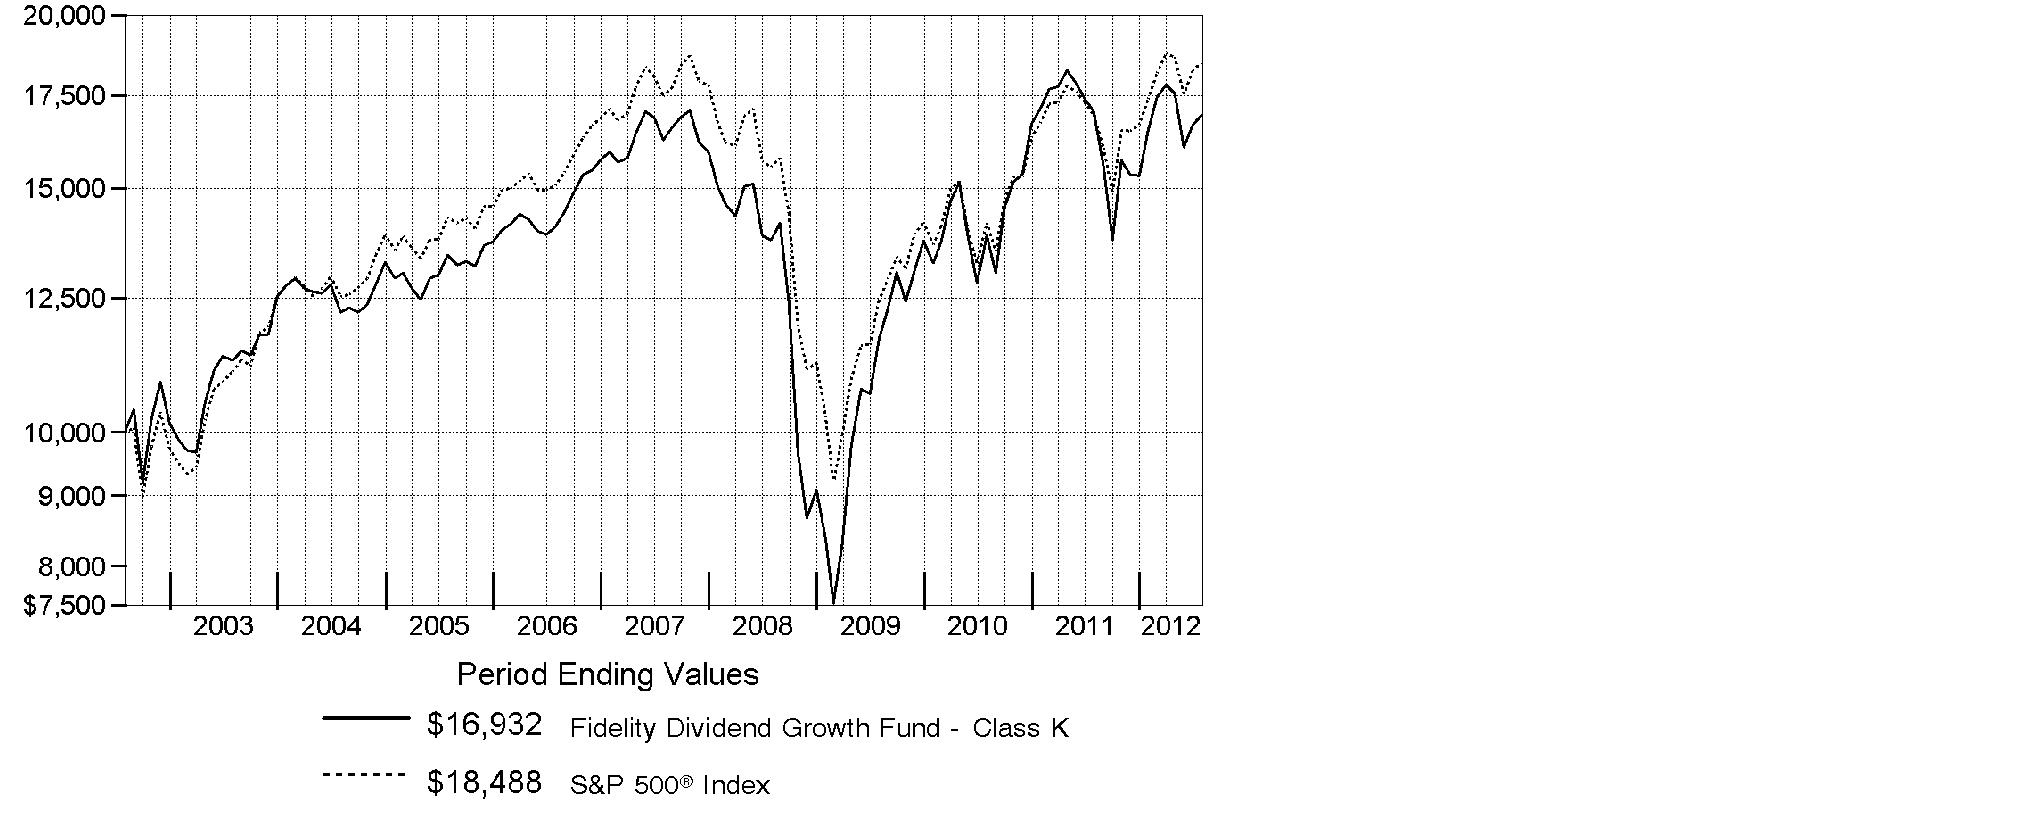
Annual Report
Market Recap: Major U.S. equity benchmarks posted solid gains for the year ending July 31, 2012, amid an uncertain investment environment. The broad-based S&P 500® Index returned 9.13%, while the blue-chip-laden Dow Jones Industrial AverageSM and technology-heavy Nasdaq Composite® Index gained 10.12% and 7.83%, respectively. Volatility spiked during the period's first half, as equities plummeted late last summer on Europe's debt woes, political wrangling over the U.S. debt ceiling and the sovereign credit-rating downgrade that followed. By October, a seemingly improved U.S. economy rejuvenated stocks, paving the way for major equity benchmarks to post their best first-quarter performance since 1998. However, more eurozone trouble, signs that the U.S. economy had turned sluggish and a slowdown in China caused stocks to slip in May, before a new wave of optimism took hold in June and July. Within the S&P 500®, more-defensive sectors such as telecommunication services (+30%) and consumer staples (+20%) fared best, while materials and energy significantly underperformed, returning -5%. Small- and mid-cap stocks trailed their less-volatile large-cap counterparts, with the Russell 2000® Index adding 0.19% and the Russell Midcap® Index rising 2.28%. Given turmoil and local currency weakness in Europe, foreign developed-markets stocks lost ground, with the MSCI® EAFE® Index returning -11.32%.
Comments from Lawrence Rakers, Portfolio Manager of Fidelity® Dividend Growth Fund: For the year, the fund's Class K shares returned -0.52%, considerably trailing the S&P 500. Versus the index, out-of-benchmark exposure to a number of small-cap stocks and underweighting larger-cap benchmark components worked against the fund. Among sectors, stock picking in energy, industrials, materials and consumer discretionary hurt the most. Additionally, the fund's foreign holdings weighed on performance, hampered in part by a stronger U.S. dollar. Three non-index holdings were significant detractors. Our position in Canada-based copper miner Ivanhoe Mines lost more than half of its value, as investor concern about decelerating global economic growth triggered a decline in the price of copper, which hurt the stock. Green Mountain Coffee Roasters and commercial satellite imagery provider GeoEye also hampered performance. Having negligible exposure to telecommunication services carrier AT&T, which I sold during the period, and not owning pharmaceuticals provider Pfizer further detracted. Conversely, not having a stake in weak-performing index component Bank of America was beneficial. Three out-of-index positions also bolstered performance: ASML Holding, a Dutch manufacturer of semiconductor capital equipment, Australia-based energy provider InterOil and ARIAD Pharmaceuticals.
The views expressed above reflect those of the portfolio manager(s) only through the end of the period as stated on the cover of this report and do not necessarily represent the views of Fidelity or any other person in the Fidelity organization. Any such views are subject to change at any time based upon market or other conditions and Fidelity disclaims any responsibility to update such views. These views may not be relied on as investment advice and, because investment decisions for a Fidelity fund are based on numerous factors, may not be relied on as an indication of trading intent on behalf of any Fidelity fund.
Annual Report
Shareholder Expense Example
As a shareholder of the Fund, you incur two types of costs: (1) transaction costs, and (2) ongoing costs, including management fees and other Fund expenses. This Example is intended to help you understand your ongoing costs (in dollars) of investing in the Fund and to compare these costs with the ongoing costs of investing in other mutual funds.
The Example is based on an investment of $1,000 invested at the beginning of the period and held for the entire period (February 1, 2012 to July 31, 2012).
Actual Expenses
The first line of the accompanying table for each class of the Fund provides information about actual account values and actual expenses. You may use the information in this line, together with the amount you invested, to estimate the expenses that you paid over the period. Simply divide your account value by $1,000.00 (for example, an $8,600 account value divided by $1,000.00 = 8.6), then multiply the result by the number in the first line for a class of the Fund under the heading entitled "Expenses Paid During Period" to estimate the expenses you paid on your account during this period. A small balance maintenance fee of $12.00 that is charged once a year may apply for certain accounts with a value of less than $2,000. This fee is not included in the table below. If it was, the estimate of expenses you paid during the period would be higher, and your ending account value lower, by this amount. In addition, the Fund, as a shareholder in the underlying Fidelity Central Funds, will indirectly bear its pro-rata share of the fees and expenses incurred by the underlying Fidelity Central Funds. These fees and expenses are not included in the Fund's annualized expense ratio used to calculate the expense estimate in the table below.
Hypothetical Example for Comparison Purposes
The second line of the accompanying table for each class of the Fund provides information about hypothetical account values and hypothetical expenses based on a Class' actual expense ratio and an assumed rate of return of 5% per year before expenses, which is not the Class' actual return. The hypothetical account values and expenses may not be used to estimate the actual ending account balance or expenses you paid for the period. You may use this information to compare the ongoing costs of investing in the Fund and other funds. To do so, compare this 5% hypothetical example with the 5% hypothetical examples that appear in the shareholder reports of the other funds. A small balance maintenance fee of $12.00 that is charged once a year may apply for certain accounts with a value of less than $2,000. This fee is not included in the table below. If it was, the estimate of expenses you paid during the period would be higher, and your ending account value lower, by this amount. In addition, the Fund, as a shareholder in the underlying Fidelity Central Funds, will indirectly bear its pro-rata share of the fees and expenses incurred by the underlying Fidelity Central Funds. These fees and expenses are not included in the Fund's annualized expense ratio used to calculate the expense estimate in the table below.
Please note that the expenses shown in the table are meant to highlight your ongoing costs only and do not reflect any transaction costs. Therefore, the second line of the table is useful in comparing ongoing costs only, and will not help you determine the relative total costs of owning different funds.
Annual Report
| Annualized
Expense Ratio | Beginning
Account Value
February 1, 2012 | Ending
Account Value
July 31, 2012 | Expenses Paid
During Period*
February 1, 2012
to July 31, 2012 |
Dividend Growth | .85% | | | |
Actual | | $ 1,000.00 | $ 1,024.70 | $ 4.28 |
HypotheticalA | | $ 1,000.00 | $ 1,020.64 | $ 4.27 |
Class K | .72% | | | |
Actual | | $ 1,000.00 | $ 1,025.40 | $ 3.63 |
HypotheticalA | | $ 1,000.00 | $ 1,021.28 | $ 3.62 |
A 5% return per year before expenses
* Expenses are equal to each Class' annualized expense ratio, multiplied by the average account value over the period, multiplied by 182/366 (to reflect the one-half year period).
Annual Report
Investment Changes (Unaudited)
Top Ten Stocks as of July 31, 2012 |
| % of fund's
net assets | % of fund's net assets
6 months ago |
Apple, Inc. | 5.2 | 3.9 |
Wells Fargo & Co. | 1.8 | 1.6 |
Berkshire Hathaway, Inc. Class B | 1.6 | 0.1 |
The Coca-Cola Co. | 1.5 | 1.2 |
Johnson & Johnson | 1.3 | 0.0 |
Merck & Co., Inc. | 1.2 | 0.4 |
Philip Morris International, Inc. | 1.1 | 0.9 |
Procter & Gamble Co. | 1.1 | 1.4 |
National Oilwell Varco, Inc. | 1.0 | 0.8 |
Visa, Inc. Class A | 1.0 | 0.0 |
| 16.8 | |
Top Five Market Sectors as of July 31, 2012 |
| % of fund's
net assets | % of fund's net assets
6 months ago |
Information Technology | 20.9 | 18.5 |
Financials | 13.0 | 13.7 |
Health Care | 11.9 | 10.8 |
Consumer Discretionary | 11.7 | 11.9 |
Industrials | 11.6 | 13.7 |
Asset Allocation (% of fund's net assets) |
As of July 31, 2012 * | As of January 31, 2012 ** |
 | Stocks 97.3% | | | Stocks and Investment Companies 98.8% | |
 | Convertible
Securities 1.1% | | | Convertible
Securities 0.8% | |
 | Short-Term
Investments and
Net Other Assets (Liabilities) 1.6% | | | Short-Term
Investments and
Net Other Assets (Liabilities) 0.4% | |
* Foreign investments | 17.8% | | ** Foreign investments | 22.6% | |

Annual Report
Investments July 31, 2012
Showing Percentage of Net Assets
Common Stocks - 97.2% |
| Shares | | Value (000s) |
CONSUMER DISCRETIONARY - 11.6% |
Auto Components - 0.4% |
Delphi Automotive PLC | 270,300 | | $ 7,674 |
Gentex Corp. | 217,815 | | 3,487 |
Tenneco, Inc. (a) | 447,112 | | 13,096 |
TRW Automotive Holdings Corp. (a) | 206,683 | | 8,123 |
| | 32,380 |
Automobiles - 0.1% |
Harley-Davidson, Inc. | 133,899 | | 5,788 |
Winnebago Industries, Inc. (a)(d) | 507,068 | | 5,137 |
| | 10,925 |
Diversified Consumer Services - 0.3% |
American Public Education, Inc. (a)(d) | 145,562 | | 3,655 |
Anhanguera Educacional Participacoes SA | 840,000 | | 11,949 |
DeVry, Inc. | 334,728 | | 6,571 |
| | 22,175 |
Hotels, Restaurants & Leisure - 2.0% |
Bravo Brio Restaurant Group, Inc. (a) | 320,815 | | 5,797 |
Brinker International, Inc. | 905,163 | | 29,336 |
Club Mediterranee SA (a) | 541,223 | | 8,863 |
Darden Restaurants, Inc. | 40,590 | | 2,077 |
Denny's Corp. (a) | 4,185,041 | | 18,247 |
Dunkin' Brands Group, Inc. | 165,487 | | 5,011 |
Icahn Enterprises LP rights (a) | 1,067,316 | | 0 |
Ignite Restaurant Group, Inc. (a) | 29,100 | | 398 |
Jubilant Foodworks Ltd. (a) | 7,261 | | 147 |
Las Vegas Sands Corp. | 602,700 | | 21,950 |
Ruth's Hospitality Group, Inc. (a) | 922,300 | | 6,198 |
Sands China Ltd. | 108,800 | | 322 |
Spur Corp. Ltd. | 1,895,350 | | 3,928 |
Starbucks Corp. | 286,877 | | 12,990 |
Texas Roadhouse, Inc. Class A | 621,764 | | 10,763 |
Yum! Brands, Inc. | 269,930 | | 17,502 |
| | 143,529 |
Household Durables - 0.3% |
PulteGroup, Inc. (a) | 783,307 | | 8,851 |
Standard Pacific Corp. (a)(d) | 43,435 | | 246 |
Techtronic Industries Co. Ltd. | 5,510,500 | | 7,461 |
Woongjin Coway Co. Ltd. | 126,810 | | 3,970 |
| | 20,528 |
Common Stocks - continued |
| Shares | | Value (000s) |
CONSUMER DISCRETIONARY - continued |
Internet & Catalog Retail - 0.8% |
Amazon.com, Inc. (a) | 166,045 | | $ 38,738 |
Expedia, Inc. | 87,200 | | 4,970 |
Liberty Media Corp. Interactive Series A (a) | 539,879 | | 10,112 |
| | 53,820 |
Leisure Equipment & Products - 0.3% |
Brunswick Corp. | 165,565 | | 3,641 |
Hasbro, Inc. | 399,077 | | 14,295 |
Summer Infant, Inc. (a) | 476,174 | | 1,509 |
| | 19,445 |
Media - 2.4% |
Antena 3 de Television SA (d) | 1,139,439 | | 4,262 |
Comcast Corp. Class A | 1,604,370 | | 52,222 |
DISH Network Corp. Class A | 403,630 | | 12,416 |
MDC Partners, Inc. Class A (sub. vtg.) | 867,039 | | 8,159 |
Mood Media Corp. (a)(d) | 422,600 | | 1,171 |
Mood Media Corp. (a)(h) | 2,002,900 | | 5,552 |
The Walt Disney Co. | 857,198 | | 42,123 |
Time Warner Cable, Inc. | 11,000 | | 934 |
Time Warner, Inc. | 1,037,666 | | 40,593 |
Valassis Communications, Inc. (a) | 36,300 | | 819 |
Virgin Media, Inc. | 40,000 | | 1,095 |
| | 169,346 |
Multiline Retail - 0.1% |
PPR SA | 60,754 | | 9,120 |
The Bon-Ton Stores, Inc. | 187,900 | | 1,240 |
| | 10,360 |
Specialty Retail - 3.8% |
Advance Auto Parts, Inc. | 489,367 | | 34,329 |
American Eagle Outfitters, Inc. | 131,863 | | 2,745 |
Ascena Retail Group, Inc. (a) | 385,653 | | 7,073 |
AutoZone, Inc. (a) | 51,240 | | 19,227 |
Bed Bath & Beyond, Inc. (a) | 192,653 | | 11,742 |
Best Buy Co., Inc. | 518,642 | | 9,382 |
Big 5 Sporting Goods Corp. | 416,900 | | 3,143 |
Body Central Corp. (a)(e) | 1,023,708 | | 10,585 |
Express, Inc. (a) | 1,111,241 | | 17,891 |
Fast Retailing Co. Ltd. | 29,300 | | 6,017 |
Foot Locker, Inc. | 218,768 | | 7,224 |
Foschini Ltd. | 495,308 | | 8,529 |
Common Stocks - continued |
| Shares | | Value (000s) |
CONSUMER DISCRETIONARY - continued |
Specialty Retail - continued |
GameStop Corp. Class A | 296,878 | | $ 4,756 |
GNC Holdings, Inc. | 7,300 | | 281 |
Home Depot, Inc. | 979,736 | | 51,123 |
Inditex SA | 7,437 | | 767 |
Limited Brands, Inc. | 397,652 | | 18,908 |
Lowe's Companies, Inc. | 1,215,848 | | 30,846 |
MarineMax, Inc. (a) | 189,740 | | 1,412 |
SuperGroup PLC (a)(d) | 1,436,787 | | 9,422 |
TJX Companies, Inc. | 399,454 | | 17,688 |
| | 273,090 |
Textiles, Apparel & Luxury Goods - 1.1% |
Deckers Outdoor Corp. (a)(d) | 77,644 | | 3,239 |
G-III Apparel Group Ltd. (a) | 469,443 | | 11,534 |
Iconix Brand Group, Inc. (a) | 301,301 | | 5,342 |
lululemon athletica, Inc. (a) | 79,838 | | 4,509 |
NIKE, Inc. Class B | 202,506 | | 18,904 |
PVH Corp. | 230,256 | | 18,289 |
Vera Bradley, Inc. (a)(d) | 353,879 | | 8,065 |
VF Corp. | 35,568 | | 5,310 |
| | 75,192 |
TOTAL CONSUMER DISCRETIONARY | | 830,790 |
CONSUMER STAPLES - 9.7% |
Beverages - 2.4% |
Anheuser-Busch InBev SA NV | 14,900 | | 1,179 |
Britvic PLC | 36,300 | | 171 |
Cott Corp. (a) | 1,155,800 | | 9,796 |
Dr Pepper Snapple Group, Inc. | 591,760 | | 26,972 |
Grupo Modelo SAB de CV Series C | 1,599,100 | | 14,420 |
SABMiller PLC | 184,500 | | 7,975 |
The Coca-Cola Co. | 1,350,413 | | 109,113 |
| | 169,626 |
Food & Staples Retailing - 2.1% |
Costco Wholesale Corp. | 110,017 | | 10,581 |
CVS Caremark Corp. | 1,349,238 | | 61,053 |
Eurocash SA | 669,195 | | 7,852 |
Rami Levi Chain Stores Hashikma Marketing 2006 Ltd. | 14,950 | | 381 |
Wal-Mart Stores, Inc. | 911,277 | | 67,826 |
| | 147,693 |
Common Stocks - continued |
| Shares | | Value (000s) |
CONSUMER STAPLES - continued |
Food Products - 1.1% |
Flowers Foods, Inc. | 541,849 | | $ 11,579 |
Green Mountain Coffee Roasters, Inc. (a) | 367,137 | | 6,704 |
Hilton Food Group PLC | 148,789 | | 629 |
Kraft Foods, Inc. Class A | 1,390,644 | | 55,222 |
Marine Harvest ASA (a) | 1,633,478 | | 1,092 |
The J.M. Smucker Co. | 87,046 | | 6,685 |
| | 81,911 |
Household Products - 1.6% |
Colgate-Palmolive Co. | 103,300 | | 11,090 |
Procter & Gamble Co. | 1,168,394 | | 75,408 |
Reckitt Benckiser Group PLC | 325,100 | | 17,875 |
Unicharm Corp. | 235,500 | | 12,974 |
| | 117,347 |
Personal Products - 0.2% |
Estee Lauder Companies, Inc. Class A | 99,550 | | 5,214 |
Hengan International Group Co. Ltd. | 692,000 | | 6,568 |
| | 11,782 |
Tobacco - 2.3% |
Altria Group, Inc. | 813,020 | | 29,244 |
British American Tobacco PLC (United Kingdom) | 271,700 | | 14,431 |
Imperial Tobacco Group PLC | 307,049 | | 11,934 |
KT&G Corp. | 7,436 | | 548 |
Lorillard, Inc. | 211,211 | | 27,170 |
Philip Morris International, Inc. | 890,466 | | 81,424 |
| | 164,751 |
TOTAL CONSUMER STAPLES | | 693,110 |
ENERGY - 11.3% |
Energy Equipment & Services - 4.0% |
BW Offshore Ltd. | 9,997,526 | | 9,205 |
Cal Dive International, Inc. (a)(d) | 1,703,683 | | 2,760 |
Cameron International Corp. (a) | 494,811 | | 24,874 |
Cathedral Energy Services Ltd. | 1,248,200 | | 7,095 |
Essential Energy Services Ltd. | 3,982,500 | | 8,459 |
Forum Energy Technologies, Inc. | 40,553 | | 845 |
Fugro NV (Certificaten Van Aandelen) unit | 61,800 | | 4,049 |
Halliburton Co. | 687,764 | | 22,786 |
McDermott International, Inc. (a) | 1,076,784 | | 12,598 |
Common Stocks - continued |
| Shares | | Value (000s) |
ENERGY - continued |
Energy Equipment & Services - continued |
National Oilwell Varco, Inc. | 974,975 | | $ 70,491 |
Noble Corp. | 685,608 | | 25,367 |
SBM Offshore NV (a) | 812,000 | | 9,915 |
Schlumberger Ltd. | 766,091 | | 54,592 |
TETRA Technologies, Inc. (a) | 767,284 | | 5,317 |
Tuscany International Drilling, Inc. (a) | 5,159,671 | | 1,672 |
Unit Corp. (a) | 114,078 | | 4,536 |
Vantage Drilling Co. (a) | 5,769,678 | | 9,058 |
Weatherford International Ltd. (a) | 623,514 | | 7,513 |
Xtreme Drilling & Coil Services Corp. (a) | 2,095,460 | | 3,469 |
| | 284,601 |
Oil, Gas & Consumable Fuels - 7.3% |
Alon USA Energy, Inc. | 784,510 | | 8,567 |
Alpha Natural Resources, Inc. (a) | 199,700 | | 1,400 |
Americas Petrogas, Inc. (a) | 2,225,900 | | 4,128 |
Americas Petrogas, Inc. (f) | 2,665,500 | | 4,944 |
Amyris, Inc. (a)(d) | 941,492 | | 3,644 |
Anadarko Petroleum Corp. | 349,409 | | 24,263 |
Apache Corp. | 233,346 | | 20,096 |
Bonavista Energy Corp. | 14,800 | | 269 |
Bonavista Energy Corp. (f) | 152,100 | | 2,765 |
BPZ Energy, Inc. (a)(d) | 2,421,078 | | 5,520 |
Cabot Oil & Gas Corp. | 191,000 | | 8,058 |
Chesapeake Energy Corp. | 493,646 | | 9,290 |
Chevron Corp. | 306,929 | | 33,633 |
Crew Energy, Inc. (a) | 646,100 | | 4,458 |
Crown Point Energy, Inc. (a) | 942,800 | | 376 |
Crown Point Ventures Ltd. (a)(f) | 4,157,416 | | 1,658 |
Denbury Resources, Inc. (a) | 396,621 | | 5,997 |
Double Eagle Petroleum Co. (a)(e) | 912,603 | | 3,787 |
Energen Corp. | 7,300 | | 374 |
EOG Resources, Inc. | 81,095 | | 7,948 |
EQT Corp. | 204,550 | | 11,537 |
Gran Tierra Energy, Inc. (Canada) (a) | 1,321,700 | | 6,049 |
Halcon Resources Corp. (h) | 910,000 | | 6,006 |
Hess Corp. | 54,500 | | 2,570 |
HollyFrontier Corp. | 445,634 | | 16,662 |
InterOil Corp. (a)(d) | 509,153 | | 43,604 |
Madalena Ventures, Inc. (a) | 1,468,000 | | 468 |
Marathon Petroleum Corp. | 477,488 | | 22,585 |
Common Stocks - continued |
| Shares | | Value (000s) |
ENERGY - continued |
Oil, Gas & Consumable Fuels - continued |
Markwest Energy Partners LP | 134,300 | | $ 7,060 |
Niko Resources Ltd. | 163,400 | | 2,804 |
Northern Oil & Gas, Inc. (a)(d) | 1,851,439 | | 29,179 |
Northern Tier Energy LP Class A | 591,800 | | 9,131 |
Occidental Petroleum Corp. | 463,437 | | 40,333 |
Painted Pony Petroleum Ltd. (a)(f) | 178,000 | | 1,660 |
Painted Pony Petroleum Ltd. Class A (a) | 435,700 | | 4,062 |
Paladin Energy Ltd. (Australia) (a)(d) | 5,703,939 | | 7,013 |
Pan Orient Energy Corp. (a) | 739,800 | | 2,855 |
Peabody Energy Corp. | 531,600 | | 11,100 |
PetroBakken Energy Ltd. Class A | 94,400 | | 1,172 |
Petrominerales Ltd. | 312,000 | | 2,887 |
Phillips 66 | 376,335 | | 14,150 |
Pioneer Natural Resources Co. | 70,733 | | 6,269 |
Resolute Energy Corp. (a)(d) | 1,326,032 | | 11,497 |
Rosetta Resources, Inc. (a) | 18,204 | | 759 |
Royal Dutch Shell PLC Class A sponsored ADR | 313,936 | | 21,410 |
SM Energy Co. | 74,049 | | 3,487 |
Southwestern Energy Co. (a) | 205,282 | | 6,826 |
Suncor Energy, Inc. | 87,400 | | 2,672 |
TAG Oil Ltd. (a) | 1,603,400 | | 11,208 |
TAG Oil Ltd. (f) | 146,900 | | 1,027 |
Targa Resources Corp. | 131,500 | | 5,793 |
Tesoro Corp. | 535,763 | | 14,814 |
Voyager Oil & Gas, Inc. (a)(d) | 2,798,269 | | 3,162 |
Voyager Oil & Gas, Inc. warrants 2/4/16 (a) | 1,198,388 | | 96 |
Williams Companies, Inc. | 1,115,202 | | 35,452 |
| | 518,534 |
TOTAL ENERGY | | 803,135 |
FINANCIALS - 12.7% |
Capital Markets - 1.5% |
Ameriprise Financial, Inc. | 77,600 | | 4,013 |
Ares Capital Corp. | 843,880 | | 14,034 |
BlackRock, Inc. Class A | 72,832 | | 12,400 |
GP Investments Ltd. (depositary receipt) (a) | 3,230,579 | | 6,448 |
ICAP PLC | 1,339,900 | | 6,689 |
ICG Group, Inc. (a) | 512,336 | | 4,580 |
Invesco Ltd. | 538,787 | | 11,923 |
KKR & Co. LP | 414,055 | | 5,793 |
Common Stocks - continued |
| Shares | | Value (000s) |
FINANCIALS - continued |
Capital Markets - continued |
Knight Capital Group, Inc. Class A (a) | 1,126,297 | | $ 11,635 |
Monex Group, Inc. | 22,026 | | 3,574 |
Morgan Stanley | 780,861 | | 10,667 |
State Street Corp. | 363,973 | | 14,697 |
The Blackstone Group LP | 72,600 | | 1,006 |
| | 107,459 |
Commercial Banks - 3.6% |
Banco Pine SA | 997,744 | | 6,539 |
Bank of Ireland (a) | 29,363,209 | | 3,585 |
Barclays PLC | 1,016,640 | | 2,648 |
CIT Group, Inc. (a) | 513,598 | | 18,757 |
Comerica, Inc. | 227,800 | | 6,882 |
Commercial Bank of Qatar GDR (Reg. S) | 948,915 | | 3,633 |
Guaranty Trust Bank PLC GDR (Reg. S) | 731,523 | | 4,243 |
KeyCorp | 934,900 | | 7,461 |
Regions Financial Corp. | 3,240,692 | | 22,555 |
U.S. Bancorp | 1,445,465 | | 48,423 |
Wells Fargo & Co. | 3,895,291 | | 131,700 |
| | 256,426 |
Consumer Finance - 0.6% |
Capital One Financial Corp. | 634,830 | | 35,862 |
International Personal Finance PLC | 1,642,400 | | 7,210 |
| | 43,072 |
Diversified Financial Services - 2.0% |
Citigroup, Inc. | 1,482,770 | | 40,228 |
CME Group, Inc. | 263,635 | | 13,738 |
JPMorgan Chase & Co. | 1,552,854 | | 55,903 |
PICO Holdings, Inc. (a)(e) | 1,405,013 | | 33,875 |
| | 143,744 |
Insurance - 3.0% |
AEGON NV | 1,383,727 | | 6,281 |
AFLAC, Inc. | 343,551 | | 15,041 |
Allied World Assurance Co. Holdings Ltd. | 118,600 | | 8,946 |
Assured Guaranty Ltd. | 2,212,304 | | 26,503 |
Berkshire Hathaway, Inc. Class B (a) | 1,305,276 | | 110,740 |
Lincoln National Corp. | 186,842 | | 3,746 |
MetLife, Inc. | 918,717 | | 28,269 |
Prudential Financial, Inc. | 273,016 | | 13,181 |
| | 212,707 |
Common Stocks - continued |
| Shares | | Value (000s) |
FINANCIALS - continued |
Real Estate Investment Trusts - 1.6% |
American Tower Corp. | 229,713 | | $ 16,611 |
Beni Stabili SpA SIIQ | 13,576,500 | | 6,212 |
CBL & Associates Properties, Inc. | 1,171,549 | | 23,115 |
Douglas Emmett, Inc. | 463,359 | | 10,894 |
Education Realty Trust, Inc. | 933,600 | | 10,942 |
Franklin Street Properties Corp. | 497,800 | | 5,162 |
Lexington Corporate Properties Trust | 678,700 | | 6,068 |
Prologis, Inc. | 484,130 | | 15,652 |
SL Green Realty Corp. | 195,070 | | 15,362 |
Sovran Self Storage, Inc. | 54,487 | | 3,111 |
Vornado Realty Trust | 43,900 | | 3,666 |
| | 116,795 |
Real Estate Management & Development - 0.4% |
CBRE Group, Inc. (a) | 1,344,677 | | 20,950 |
Forest City Enterprises, Inc. Class A (a) | 292,106 | | 4,122 |
LSL Property Services PLC | 176,816 | | 610 |
| | 25,682 |
TOTAL FINANCIALS | | 905,885 |
HEALTH CARE - 11.9% |
Biotechnology - 3.7% |
Alnylam Pharmaceuticals, Inc. (a) | 716,200 | | 13,386 |
Amgen, Inc. | 459,009 | | 37,914 |
ARIAD Pharmaceuticals, Inc. (a) | 1,619,584 | | 30,983 |
AVEO Pharmaceuticals, Inc. (a)(d) | 1,032,309 | | 13,523 |
Biogen Idec, Inc. (a) | 143,300 | | 20,897 |
Biovitrum AB (a) | 1,889,028 | | 6,611 |
Dynavax Technologies Corp. (a) | 3,717,870 | | 14,351 |
Gentium SpA sponsored ADR (a) | 324,845 | | 3,265 |
Gilead Sciences, Inc. (a) | 444,854 | | 24,169 |
Grifols SA ADR | 253,400 | | 5,656 |
Horizon Pharma, Inc. (d) | 316,293 | | 1,806 |
Horizon Pharma, Inc. (h) | 1,015,612 | | 5,799 |
Horizon Pharma, Inc. warrants 2/28/17 (a)(h) | 253,903 | | 400 |
Infinity Pharmaceuticals, Inc. (a) | 181,620 | | 3,171 |
InterMune, Inc. (a)(d) | 614,172 | | 5,423 |
Isis Pharmaceuticals, Inc. (a) | 331,000 | | 4,012 |
Merrimack Pharmaceuticals, Inc. (d) | 249,200 | | 1,986 |
Common Stocks - continued |
| Shares | | Value (000s) |
HEALTH CARE - continued |
Biotechnology - continued |
NPS Pharmaceuticals, Inc. (a) | 506,635 | | $ 3,906 |
Synageva BioPharma Corp. (a) | 142,286 | | 7,123 |
Synta Pharmaceuticals Corp. (a) | 7,300 | | 54 |
Theravance, Inc. (a) | 917,861 | | 26,737 |
Thrombogenics NV (a) | 398,797 | | 12,871 |
Vertex Pharmaceuticals, Inc. (a) | 59,100 | | 2,867 |
ZIOPHARM Oncology, Inc. (a)(d) | 2,189,550 | | 12,327 |
| | 259,237 |
Health Care Equipment & Supplies - 0.8% |
Analogic Corp. | 7,400 | | 474 |
Baxter International, Inc. | 211,147 | | 12,354 |
Boston Scientific Corp. (a) | 1,531,100 | | 7,916 |
C.R. Bard, Inc. | 29,348 | | 2,854 |
Covidien PLC | 232,484 | | 12,991 |
Genmark Diagnostics, Inc. (a) | 807,700 | | 4,564 |
Nakanishi, Inc. | 42,300 | | 4,370 |
Opto Circuits India Ltd. | 1,137,349 | | 3,149 |
Sirona Dental Systems, Inc. (a) | 210,922 | | 9,118 |
| | 57,790 |
Health Care Providers & Services - 3.4% |
Accretive Health, Inc. (a) | 872,328 | | 11,846 |
Brookdale Senior Living, Inc. (a) | 1,932,000 | | 31,801 |
Centene Corp. (a) | 308,474 | | 11,734 |
Chemed Corp. | 132,551 | | 8,320 |
CIGNA Corp. | 541,181 | | 21,799 |
Corvel Corp. (a) | 29,036 | | 1,340 |
DaVita, Inc. (a) | 140,079 | | 13,787 |
Emeritus Corp. (a) | 603,933 | | 10,237 |
Express Scripts Holding Co. (a) | 626,389 | | 36,293 |
Humana, Inc. | 97,116 | | 5,982 |
McKesson Corp. | 331,454 | | 30,073 |
MEDNAX, Inc. (a) | 58,121 | | 3,844 |
Sunrise Senior Living, Inc. (a) | 89,228 | | 596 |
UnitedHealth Group, Inc. | 733,430 | | 37,471 |
WellPoint, Inc. | 344,559 | | 18,362 |
| | 243,485 |
Common Stocks - continued |
| Shares | | Value (000s) |
HEALTH CARE - continued |
Life Sciences Tools & Services - 0.4% |
Agilent Technologies, Inc. | 559,968 | | $ 21,441 |
Charles River Laboratories International, Inc. (a) | 214,269 | | 7,292 |
| | 28,733 |
Pharmaceuticals - 3.6% |
AVANIR Pharmaceuticals Class A (a)(d) | 1,508,431 | | 4,314 |
Biodelivery Sciences International, Inc. (a) | 32,913 | | 156 |
Cadence Pharmaceuticals, Inc. (a)(d) | 3,867,920 | | 16,400 |
Cardiome Pharma Corp. (a) | 2,305,800 | | 738 |
Elan Corp. PLC sponsored ADR (a) | 527,000 | | 6,087 |
Eli Lilly & Co. | 243,300 | | 10,712 |
Impax Laboratories, Inc. (a) | 292,896 | | 6,508 |
Jazz Pharmaceuticals PLC (a) | 158,400 | | 7,614 |
Johnson & Johnson | 1,299,974 | | 89,984 |
Merck & Co., Inc. | 1,984,053 | | 87,636 |
Novo Nordisk A/S Series B | 137,937 | | 21,268 |
Watson Pharmaceuticals, Inc. (a) | 77,792 | | 6,055 |
| | 257,472 |
TOTAL HEALTH CARE | | 846,717 |
INDUSTRIALS - 11.4% |
Aerospace & Defense - 2.6% |
DigitalGlobe, Inc. (a) | 635,974 | | 12,382 |
GeoEye, Inc. (a)(e) | 1,254,884 | | 31,912 |
Honeywell International, Inc. | 445,030 | | 25,834 |
Meggitt PLC | 2,825,241 | | 16,987 |
Precision Castparts Corp. | 105,105 | | 16,350 |
Raytheon Co. | 325,226 | | 18,044 |
Textron, Inc. | 789,832 | | 20,575 |
Ultra Electronics Holdings PLC | 186,989 | | 4,307 |
United Technologies Corp. | 562,726 | | 41,889 |
| | 188,280 |
Air Freight & Logistics - 0.8% |
FedEx Corp. | 10,910 | | 985 |
Pacer International, Inc. (a) | 697,415 | | 2,929 |
United Parcel Service, Inc. Class B | 714,773 | | 54,044 |
| | 57,958 |
Building Products - 0.5% |
Armstrong World Industries, Inc. | 89,140 | | 3,445 |
Common Stocks - continued |
| Shares | | Value (000s) |
INDUSTRIALS - continued |
Building Products - continued |
Lennox International, Inc. | 113,786 | | $ 4,969 |
Owens Corning (a) | 801,907 | | 21,539 |
Quanex Building Products Corp. | 482,339 | | 8,152 |
| | 38,105 |
Commercial Services & Supplies - 0.9% |
Corrections Corp. of America | 467,000 | | 14,514 |
Multiplus SA | 533,600 | | 12,876 |
Republic Services, Inc. | 568,005 | | 16,432 |
Steelcase, Inc. Class A | 1,239,263 | | 10,620 |
Swisher Hygiene, Inc. (a) | 2,081,064 | | 3,765 |
Swisher Hygiene, Inc. (Canada) (a) | 1,367,162 | | 2,748 |
The Geo Group, Inc. (a) | 110,000 | | 2,543 |
US Ecology, Inc. | 61,700 | | 1,203 |
| | 64,701 |
Construction & Engineering - 0.8% |
AECOM Technology Corp. (a) | 589,479 | | 9,555 |
Fluor Corp. | 361,680 | | 17,932 |
Foster Wheeler AG (a) | 1,116,695 | | 20,145 |
MasTec, Inc. (a) | 689,614 | | 11,006 |
Quanta Services, Inc. (a) | 18,600 | | 428 |
| | 59,066 |
Electrical Equipment - 1.6% |
Alstom SA | 362,367 | | 12,056 |
AMETEK, Inc. | 315,198 | | 9,771 |
Emerson Electric Co. | 503,905 | | 24,072 |
GrafTech International Ltd. (a) | 1,283,396 | | 13,411 |
Hubbell, Inc. Class B | 92,642 | | 7,623 |
Prysmian SpA | 813,700 | | 13,085 |
Regal-Beloit Corp. | 404,468 | | 26,036 |
Roper Industries, Inc. | 75,739 | | 7,532 |
| | 113,586 |
Industrial Conglomerates - 0.1% |
Reunert Ltd. | 495,947 | | 4,797 |
Machinery - 2.3% |
Actuant Corp. Class A | 498,002 | | 14,173 |
Colfax Corp. (a) | 215,542 | | 6,238 |
Cummins, Inc. | 156,384 | | 14,997 |
Dover Corp. | 158,995 | | 8,660 |
Common Stocks - continued |
| Shares | | Value (000s) |
INDUSTRIALS - continued |
Machinery - continued |
EVA Precision Industrial Holdings Ltd. | 3,672,000 | | $ 279 |
Fiat Industrial SpA | 2,911,405 | | 28,658 |
GEA Group AG | 22,102 | | 597 |
Illinois Tool Works, Inc. | 302,448 | | 16,435 |
Ingersoll-Rand PLC | 592,811 | | 25,141 |
Manitowoc Co., Inc. (d) | 957,037 | | 11,484 |
Navistar International Corp. (a) | 109,932 | | 2,704 |
Stanley Black & Decker, Inc. | 296,481 | | 19,832 |
Timken Co. | 194,581 | | 7,044 |
Valmont Industries, Inc. | 59,985 | | 7,431 |
| | 163,673 |
Marine - 0.1% |
Kirby Corp. (a) | 73,723 | | 3,890 |
Ultrapetrol (Bahamas) Ltd. (a) | 797,900 | | 726 |
| | 4,616 |
Professional Services - 0.5% |
Michael Page International PLC | 111,479 | | 642 |
Qualicorp SA (a) | 655,000 | | 5,833 |
Randstad Holding NV | 446,500 | | 13,553 |
Robert Half International, Inc. | 379,515 | | 10,251 |
SR Teleperformance SA | 238,130 | | 5,875 |
| | 36,154 |
Road & Rail - 0.9% |
J.B. Hunt Transport Services, Inc. | 125,181 | | 6,887 |
Norfolk Southern Corp. | 197,400 | | 14,617 |
Union Pacific Corp. | 309,865 | | 37,993 |
Universal Truckload Services, Inc. | 284,651 | | 4,238 |
| | 63,735 |
Trading Companies & Distributors - 0.3% |
Houston Wire & Cable Co. | 446,305 | | 5,110 |
Rush Enterprises, Inc. Class A (a) | 268,323 | | 4,333 |
Watsco, Inc. | 170,380 | | 11,576 |
| | 21,019 |
TOTAL INDUSTRIALS | | 815,690 |
INFORMATION TECHNOLOGY - 20.8% |
Communications Equipment - 1.7% |
Brocade Communications Systems, Inc. (a) | 1,565,104 | | 7,779 |
Common Stocks - continued |
| Shares | | Value (000s) |
INFORMATION TECHNOLOGY - continued |
Communications Equipment - continued |
Cisco Systems, Inc. | 2,951,875 | | $ 47,082 |
Harris Corp. | 36,800 | | 1,533 |
Motorola Solutions, Inc. | 284,997 | | 13,777 |
Polycom, Inc. (a) | 994,368 | | 8,691 |
QUALCOMM, Inc. | 242,222 | | 14,456 |
Riverbed Technology, Inc. (a) | 947,834 | | 16,720 |
ViaSat, Inc. (a) | 298,212 | | 11,422 |
| | 121,460 |
Computers & Peripherals - 5.4% |
Apple, Inc. | 615,203 | | 375,752 |
Gemalto NV (d) | 168,763 | | 12,934 |
| | 388,686 |
Electronic Equipment & Components - 1.3% |
Arrow Electronics, Inc. (a) | 382,925 | | 12,924 |
Avnet, Inc. (a) | 639,678 | | 20,150 |
Corning, Inc. | 1,918,921 | | 21,895 |
Flextronics International Ltd. (a) | 669,751 | | 4,293 |
Jabil Circuit, Inc. | 353,852 | | 7,679 |
Molex, Inc. (d) | 464,025 | | 11,656 |
TE Connectivity Ltd. | 426,556 | | 14,081 |
| | 92,678 |
Internet Software & Services - 0.8% |
Baidu.com, Inc. sponsored ADR (a) | 69,023 | | 8,319 |
Cornerstone OnDemand, Inc. (a) | 80,743 | | 1,920 |
Facebook, Inc. Class B (a)(h) | 488,526 | | 9,545 |
Google, Inc. Class A (a) | 26,073 | | 16,503 |
QuinStreet, Inc. (a) | 661,811 | | 6,003 |
Velti PLC (a)(d) | 859,700 | | 4,685 |
Yahoo!, Inc. (a) | 482,000 | | 7,635 |
| | 54,610 |
IT Services - 4.1% |
Accenture PLC Class A | 205,353 | | 12,383 |
Acxiom Corp. (a) | 181,824 | | 3,049 |
Amdocs Ltd. | 249,754 | | 7,430 |
Cognizant Technology Solutions Corp. Class A (a) | 581,020 | | 32,985 |
EPAM Systems, Inc. | 174,900 | | 2,805 |
ExlService Holdings, Inc. (a) | 290,527 | | 7,161 |
Fidelity National Information Services, Inc. | 495,835 | | 15,589 |
Fiserv, Inc. (a) | 186,613 | | 13,087 |
Common Stocks - continued |
| Shares | | Value (000s) |
INFORMATION TECHNOLOGY - continued |
IT Services - continued |
Heartland Payment Systems, Inc. | 232,300 | | $ 7,364 |
IBM Corp. | 276,792 | | 54,246 |
Jack Henry & Associates, Inc. | 37,215 | | 1,292 |
MasterCard, Inc. Class A | 38,923 | | 16,993 |
Maximus, Inc. | 30,155 | | 1,523 |
Redecard SA | 277,800 | | 4,480 |
ServiceSource International, Inc. (a) | 1,165,625 | | 13,148 |
Total System Services, Inc. | 32,900 | | 778 |
Unisys Corp. (a) | 1,114,203 | | 21,649 |
Virtusa Corp. (a) | 304,842 | | 4,618 |
Visa, Inc. Class A | 539,028 | | 69,572 |
| | 290,152 |
Office Electronics - 0.3% |
Xerox Corp. | 2,853,381 | | 19,774 |
Semiconductors & Semiconductor Equipment - 4.7% |
Altera Corp. | 14,500 | | 514 |
Analog Devices, Inc. | 429,940 | | 16,802 |
Applied Micro Circuits Corp. (a) | 364,735 | | 2,086 |
ASML Holding NV | 1,024,463 | | 58,907 |
Avago Technologies Ltd. | 573,809 | | 21,231 |
Cirrus Logic, Inc. (a) | 672,246 | | 24,718 |
Cymer, Inc. (a) | 561,231 | | 32,108 |
Entropic Communications, Inc. (a)(d) | 1,286,129 | | 7,717 |
Freescale Semiconductor Holdings I Ltd. (a) | 1,598,319 | | 17,054 |
LTX-Credence Corp. (a)(e) | 2,542,696 | | 14,900 |
Maxim Integrated Products, Inc. | 644,151 | | 17,540 |
Micron Technology, Inc. (a) | 1,526,488 | | 9,479 |
Monolithic Power Systems, Inc. (a) | 21,800 | | 422 |
NXP Semiconductors NV (a) | 1,066,264 | | 24,087 |
ON Semiconductor Corp. (a) | 1,655,446 | | 11,489 |
RF Micro Devices, Inc. (a) | 4,132,045 | | 16,032 |
Samsung Electronics Co. Ltd. | 21,459 | | 24,844 |
Skyworks Solutions, Inc. (a) | 1,055,475 | | 30,535 |
Spansion, Inc. Class A | 497,281 | | 5,097 |
| | 335,562 |
Software - 2.5% |
Adobe Systems, Inc. (a) | 151,967 | | 4,693 |
Autodesk, Inc. (a) | 189,700 | | 6,435 |
Check Point Software Technologies Ltd. (a) | 185,100 | | 8,990 |
Citrix Systems, Inc. (a) | 392,611 | | 28,535 |
Common Stocks - continued |
| Shares | | Value (000s) |
INFORMATION TECHNOLOGY - continued |
Software - continued |
Comverse Technology, Inc. (a) | 3,632,060 | | $ 19,722 |
Electronic Arts, Inc. (a) | 317,190 | | 3,495 |
Ellie Mae, Inc. (a) | 18,132 | | 372 |
JDA Software Group, Inc. (a) | 198,523 | | 5,872 |
Microsoft Corp. | 1,637,749 | | 48,264 |
Nuance Communications, Inc. (a) | 351,931 | | 7,162 |
Opnet Technologies, Inc. | 268,277 | | 7,093 |
Oracle Corp. | 969,607 | | 29,282 |
Royalblue Group PLC | 41,674 | | 916 |
VMware, Inc. Class A (a) | 98,200 | | 8,913 |
| | 179,744 |
TOTAL INFORMATION TECHNOLOGY | | 1,482,666 |
MATERIALS - 4.1% |
Chemicals - 2.1% |
Air Products & Chemicals, Inc. | 48,749 | | 3,921 |
Albemarle Corp. | 43,600 | | 2,538 |
Ashland, Inc. | 156,993 | | 11,051 |
CF Industries Holdings, Inc. | 20,722 | | 4,057 |
Clariant AG (Reg.) | 2,171,280 | | 22,974 |
Kraton Performance Polymers, Inc. (a) | 182,723 | | 4,279 |
LyondellBasell Industries NV Class A | 456,157 | | 20,313 |
Monsanto Co. | 10,200 | | 873 |
PetroLogistics LP | 1,096,560 | | 13,553 |
Spartech Corp. (a) | 1,386,259 | | 7,056 |
The Mosaic Co. | 152,410 | | 8,857 |
W.R. Grace & Co. (a) | 828,876 | | 46,450 |
| | 145,922 |
Construction Materials - 0.1% |
HeidelbergCement Finance AG | 107,913 | | 5,027 |
Containers & Packaging - 0.2% |
Nampak Ltd. | 2,604,800 | | 8,184 |
Rock-Tenn Co. Class A | 128,497 | | 7,481 |
Youyuan International Holdings Ltd. | 1,418,000 | | 276 |
| | 15,941 |
Metals & Mining - 1.7% |
Agnico-Eagle Mines Ltd. (Canada) | 188,800 | | 8,285 |
Anglo American PLC (United Kingdom) | 185,200 | | 5,517 |
Avion Gold Corp. (a) | 3,113,900 | | 1,553 |
Common Stocks - continued |
| Shares | | Value (000s) |
MATERIALS - continued |
Metals & Mining - continued |
Avion Gold Corp. (f) | 289,800 | | $ 144 |
Commercial Metals Co. | 1,210,444 | | 15,603 |
Copper Mountain Mining Corp. (a) | 477,400 | | 1,538 |
First Quantum Minerals Ltd. | 278,840 | | 5,063 |
Freeport-McMoRan Copper & Gold, Inc. | 308,095 | | 10,374 |
Goldcorp, Inc. | 409,300 | | 14,775 |
Iluka Resources Ltd. | 72,612 | | 726 |
Ivanhoe Mines Ltd. (d) | 2,519,636 | | 21,230 |
Newcrest Mining Ltd. | 291,654 | | 7,203 |
Randgold Resources Ltd. sponsored ADR | 290,223 | | 25,969 |
Reliance Steel & Aluminum Co. | 36,273 | | 1,867 |
SunCoke Energy, Inc. (a) | 159,898 | | 2,558 |
| | 122,405 |
TOTAL MATERIALS | | 289,295 |
TELECOMMUNICATION SERVICES - 1.0% |
Diversified Telecommunication Services - 0.6% |
CenturyLink, Inc. | 558,452 | | 23,198 |
China Unicom Ltd. | 4,236,000 | | 6,198 |
Frontier Communications Corp. (d) | 1,383,389 | | 5,423 |
PT Telkomunikasi Indonesia Tbk sponsored ADR | 234,541 | | 9,107 |
| | 43,926 |
Wireless Telecommunication Services - 0.4% |
Crown Castle International Corp. (a) | 18,400 | | 1,139 |
SBA Communications Corp. Class A (a) | 464,110 | | 27,410 |
| | 28,549 |
TOTAL TELECOMMUNICATION SERVICES | | 72,475 |
UTILITIES - 2.7% |
Electric Utilities - 1.2% |
Edison International | 521,915 | | 24,102 |
NextEra Energy, Inc. | 509,556 | | 36,128 |
Northeast Utilities | 713,080 | | 28,438 |
| | 88,668 |
Gas Utilities - 0.1% |
Atmos Energy Corp. | 104,257 | | 3,738 |
Independent Power Producers & Energy Traders - 0.4% |
The AES Corp. (a) | 2,503,593 | | 30,193 |
Common Stocks - continued |
| Shares | | Value (000s) |
UTILITIES - continued |
Multi-Utilities - 1.0% |
CMS Energy Corp. | 168,040 | | $ 4,144 |
National Grid PLC | 64,318 | | 667 |
PG&E Corp. | 737,837 | | 34,059 |
Sempra Energy | 410,821 | | 28,926 |
| | 67,796 |
TOTAL UTILITIES | | 190,395 |
TOTAL COMMON STOCKS (Cost $6,173,521) |
6,930,158
|
Preferred Stocks - 0.5% |
| | | |
Convertible Preferred Stocks - 0.4% |
FINANCIALS - 0.2% |
Diversified Financial Services - 0.2% |
Citigroup, Inc. 7.50% | 143,900 | | 12,352 |
HEALTH CARE - 0.0% |
Pharmaceuticals - 0.0% |
KaloBios Pharmaceuticals, Inc. Series E (a)(h) | 1,403,000 | | 4,770 |
INDUSTRIALS - 0.1% |
Aerospace & Defense - 0.1% |
United Technologies Corp. 7.50% | 148,700 | | 7,844 |
INFORMATION TECHNOLOGY - 0.1% |
IT Services - 0.1% |
Unisys Corp. Series A, 6.25% | 92,200 | | 5,475 |
TOTAL CONVERTIBLE PREFERRED STOCKS | | 30,441 |
Nonconvertible Preferred Stocks - 0.1% |
CONSUMER DISCRETIONARY - 0.1% |
Automobiles - 0.1% |
Volkswagen AG | 14,900 | | 2,548 |
TOTAL PREFERRED STOCKS (Cost $34,354) |
32,989
|
Convertible Bonds - 0.7% |
| Principal Amount (000s) | | Value (000s) |
ENERGY - 0.1% |
Energy Equipment & Services - 0.0% |
Cal Dive International, Inc. 5% 7/15/17 (f) | | $ 3,660 | | $ 3,539 |
Oil, Gas & Consumable Fuels - 0.1% |
Amyris, Inc. 3% 2/27/17 (h) | | 7,356 | | 5,810 |
TOTAL ENERGY | | 9,349 |
FINANCIALS - 0.1% |
Thrifts & Mortgage Finance - 0.1% |
MGIC Investment Corp. 9% 4/1/63 (f) | | 16,623 | | 6,566 |
INDUSTRIALS - 0.1% |
Building Products - 0.1% |
Aspen Aerogels, Inc. 8% 6/1/14 (h) | | 4,085 | | 4,085 |
MATERIALS - 0.4% |
Metals & Mining - 0.4% |
Ivanplats Ltd. 8% 11/10/14 pay-in-kind (g)(h) | | 27,595 | | 28,618 |
TELECOMMUNICATION SERVICES - 0.0% |
Diversified Telecommunication Services - 0.0% |
Clearwire Communications LLC/Clearwire Finance, Inc. 8.25% 12/1/40 (f) | | 3,730 | | 2,462 |
TOTAL CONVERTIBLE BONDS (Cost $54,733) |
51,080
|
Money Market Funds - 3.1% |
| Shares | | |
Fidelity Cash Central Fund, 0.17% (b) | 96,665,474 | | 96,665 |
Fidelity Securities Lending Cash Central Fund, 0.18% (b)(c) | 120,768,332 | | 120,768 |
TOTAL MONEY MARKET FUNDS (Cost $217,433) |
217,433
|
TOTAL INVESTMENT PORTFOLIO - 101.5% (Cost $6,480,041) | 7,231,660 |
NET OTHER ASSETS (LIABILITIES) - (1.5)% | (105,468) |
NET ASSETS - 100% | $ 7,126,192 |
Legend |
(a) Non-income producing |
(b) Affiliated fund that is available only to investment companies and other accounts managed by Fidelity Investments. The rate quoted is the annualized seven-day yield of the fund at period end. A complete unaudited listing of the fund's holdings as of its most recent quarter end is available upon request. In addition, each Fidelity Central Fund's financial statements, which are not covered by the Fund's Report of Independent Registered Public Accounting Firm, are available on the SEC's website or upon request. |
(c) Investment made with cash collateral received from securities on loan. |
(d) Security or a portion of the security is on loan at period end. |
(e) Affiliated company |
(f) Security exempt from registration under Rule 144A of the Securities Act of 1933. These securities may be resold in transactions exempt from registration, normally to qualified institutional buyers. At the end of the period, the value of these securities amounted to $24,765,000 or 0.3% of net assets. |
(g) Coupon rates for floating and adjustable rate securities reflect the rates in effect at period end. |
(h) Restricted securities - Investment in securities not registered under the Securities Act of 1933 (excluding 144A issues). At the end of the period, the value of restricted securities (excluding 144A issues) amounted to $70,585,000 or 1.0% of net assets. |
Additional information on each restricted holding is as follows: |
Security | Acquisition Date | Acquisition Cost (000s) |
Amyris, Inc. 3% 2/27/17 | 2/27/12 | $ 7,356 |
Aspen Aerogels, Inc. 8% 6/1/14 | 6/1/11 | $ 4,085 |
Facebook, Inc. Class B | 3/31/11 - 5/19/11 | $ 12,217 |
Halcon Resources Corp. | 3/1/12 | $ 8,190 |
Horizon Pharma, Inc. | 2/29/12 | $ 3,646 |
Horizon Pharma, Inc. warrants 2/28/17 | 2/29/12 | $ 32 |
Ivanplats Ltd. 8% 11/10/14 pay-in-kind | 11/10/11 - 3/28/12 | $ 27,868 |
KaloBios Pharmaceuticals, Inc. Series E | 5/2/12 | $ 4,770 |
Mood Media Corp. | 2/2/11 | $ 4,054 |
Affiliated Central Funds |
Information regarding fiscal year to date income earned by the Fund from investments in Fidelity Central Funds is as follows: |
Fund | Income earned
(Amounts in thousands) |
Fidelity Cash Central Fund | $ 65 |
Fidelity Securities Lending Cash Central Fund | 4,448 |
Total | $ 4,513 |
Other Affiliated Issuers |
An affiliated company is a company in which the Fund has ownership of at least 5% of the voting securities. Fiscal year to date transactions with companies which are or were affiliates are as follows: |
Affiliate
(Amounts in thousands) | Value, beginning of period | Purchases | Sales Proceeds | Dividend Income | Value,
end of
period |
Body Central Corp. | $ - | $ 18,973 | $ 553 | $ - | $ 10,585 |
Cadence Pharmaceuticals, Inc. | 28,450 | 4,838 | 2,396* | - | - |
Crown Point Ventures Ltd. | 1,096 | 417 | 119* | - | - |
Crown Point Ventures Ltd. (144A) | 2,491 | 2,462 | - | - | - |
Double Eagle Petroleum Co. | 10,542 | 643 | 799* | - | 3,787 |
GeoEye, Inc. | 53,351 | 5,884 | 7,035* | - | 31,912 |
LTX-Credence Corp. | 24,118 | 1,818 | 7,533* | - | 14,900 |
O'Charleys, Inc. | 9,150 | 871 | 15,521* | - | - |
PICO Holdings, Inc. | 32,970 | 8,869 | 4,356* | - | 33,875 |
Saia, Inc. | 13,037 | 446 | 15,580* | - | - |
Spartech Corp. | 9,331 | 930 | 2,094* | - | - |
Voyager Oil & Gas, Inc. | 11,252 | 138 | 1,870* | - | - |
Voyager Oil & Gas, Inc. warrants 2/4/16 | 1,539 | - | - | - | - |
Winnebago Industries, Inc. | 15,684 | - | 12,741* | - | - |
Total | $ 213,011 | $ 46,289 | $ 70,597 | $ - | $ 95,059 |
* Includes the value of securities delivered through in-kind transactions.
Other Information |
The following is a summary of the inputs used, as of July 31, 2012, involving the Fund's assets and liabilities carried at fair value. The inputs or methodology used for valuing securities may not be an indication of the risk associated with investing in those securities. For more information on valuation inputs, and their aggregation into the levels used in the table below, please refer to the Security Valuation section in the accompanying Notes to Financial Statements. |
Valuation Inputs at Reporting Date: |
Description
(Amounts in thousands) | Total | Level 1 | Level 2 | Level 3 |
Investments in Securities: | | | | |
Equities: | | | | |
Consumer Discretionary | $ 833,338 | $ 827,321 | $ 6,017 | $ - |
Consumer Staples | 693,110 | 664,526 | 28,584 | - |
Energy | 803,135 | 803,039 | 96 | - |
Financials | 918,237 | 902,149 | 16,088 | - |
Health Care | 851,487 | 820,679 | 26,038 | 4,770 |
Industrials | 823,534 | 819,769 | 3,765 | - |
Information Technology | 1,488,141 | 1,478,596 | 9,545 | - |
Materials | 289,295 | 289,295 | - | - |
Telecommunication Services | 72,475 | 66,277 | 6,198 | - |
Utilities | 190,395 | 189,728 | 667 | - |
Corporate Bonds | 51,080 | - | 18,377 | 32,703 |
Money Market Funds | 217,433 | 217,433 | - | - |
Total Investments in Securities: | $ 7,231,660 | $ 7,078,812 | $ 115,375 | $ 37,473 |
Distribution of investments by country or territory of incorporation, as a percentage of total net assets, is as follows. (Unaudited) |
United States of America | 82.2% |
Canada | 2.9% |
Netherlands | 2.1% |
United Kingdom | 1.7% |
Switzerland | 1.4% |
Bermuda | 1.0% |
Ireland | 1.0% |
Others (Individually Less Than 1%) | 7.7% |
| 100.0% |
See accompanying notes which are an integral part of the financial statements.
Annual Report
Statement of Assets and Liabilities
Amounts in thousands (except per-share amounts) | July 31, 2012 |
| | |
Assets | | |
Investment in securities, at value (including securities loaned of $116,146) - See accompanying schedule: Unaffiliated issuers (cost $6,135,024) | $ 6,919,168 | |
Fidelity Central Funds (cost $217,433) | 217,433 | |
Other affiliated issuers (cost $127,584) | 95,059 | |
Total Investments (cost $6,480,041) | | $ 7,231,660 |
Foreign currency held at value (cost $2,298) | | 2,307 |
Receivable for investments sold | | 151,821 |
Receivable for fund shares sold | | 2,205 |
Dividends receivable | | 3,562 |
Interest receivable | | 2,636 |
Distributions receivable from Fidelity Central Funds | | 487 |
Other receivables | | 444 |
Total assets | | 7,395,122 |
| | |
Liabilities | | |
Payable to custodian bank | $ 582 | |
Payable for investments purchased | 136,008 | |
Payable for fund shares redeemed | 7,147 | |
Accrued management fee | 2,710 | |
Other affiliated payables | 1,261 | |
Other payables and accrued expenses | 454 | |
Collateral on securities loaned, at value | 120,768 | |
Total liabilities | | 268,930 |
| | |
Net Assets | | $ 7,126,192 |
Net Assets consist of: | | |
Paid in capital | | $ 6,351,386 |
Undistributed net investment income | | 20,016 |
Accumulated undistributed net realized gain (loss) on investments and foreign currency transactions | | 3,207 |
Net unrealized appreciation (depreciation) on investments and assets and liabilities in foreign currencies | | 751,583 |
Net Assets | | $ 7,126,192 |
| | |
Dividend Growth:
Net Asset Value, offering price and redemption price per share ($5,905,455 ÷ 206,421 shares) | | $ 28.61 |
| | |
Class K:
Net Asset Value, offering price and redemption price per share ($1,220,737 ÷ 42,653 shares) | | $ 28.62 |
See accompanying notes which are an integral part of the financial statements.
Annual Report
Financial Statements - continued
Statement of Operations
Amounts in thousands | Year ended July 31, 2012 |
| | |
Investment Income | | |
Dividends | | $ 127,970 |
Interest | | 3,705 |
Income from Fidelity Central Funds | | 4,513 |
Total income | | 136,188 |
| | |
Expenses | | |
Management fee
Basic fee | $ 45,875 | |
Performance adjustment | 9,790 | |
Transfer agent fees | 15,919 | |
Accounting and security lending fees | 1,245 | |
Custodian fees and expenses | 269 | |
Independent trustees' compensation | 57 | |
Registration fees | 169 | |
Audit | 90 | |
Legal | 40 | |
Miscellaneous | 98 | |
Total expenses before reductions | 73,552 | |
Expense reductions | (362) | 73,190 |
Net investment income (loss) | | 62,998 |
Realized and Unrealized Gain (Loss) Net realized gain (loss) on: | | |
Investment securities: | | |
Unaffiliated issuers | 96,599 | |
Other affiliated issuers | (8,111) | |
Redemption in-kind with affiliated entities (including gain from Other affiliated issuers of $1,089) | 188,389 | |
Foreign currency transactions | (1,488) | |
Futures contracts | 6,943 | |
Total net realized gain (loss) | | 282,332 |
Change in net unrealized appreciation (depreciation) on: Investment securities | (523,285) | |
Assets and liabilities in foreign currencies | (110) | |
Total change in net unrealized appreciation (depreciation) | | (523,395) |
Net gain (loss) | | (241,063) |
Net increase (decrease) in net assets resulting from operations | | $ (178,065) |
See accompanying notes which are an integral part of the financial statements.
Annual Report
Statement of Changes in Net Assets
Amounts in thousands | Year ended
July 31,
2012 | Year ended
July 31,
2011 |
Increase (Decrease) in Net Assets | | |
Operations | | |
Net investment income (loss) | $ 62,998 | $ 43,819 |
Net realized gain (loss) | 282,332 | 802,201 |
Change in net unrealized appreciation (depreciation) | (523,395) | 997,707 |
Net increase (decrease) in net assets resulting
from operations | (178,065) | 1,843,727 |
Distributions to shareholders from net investment income | (42,120) | (51,737) |
Distributions to shareholders from net realized gain | (5,141) | (26,364) |
Total distributions | (47,261) | (78,101) |
Share transactions - net increase (decrease) | (2,591,197) | 91,677 |
Total increase (decrease) in net assets | (2,816,523) | 1,857,303 |
| | |
Net Assets | | |
Beginning of period | 9,942,715 | 8,085,412 |
End of period (including undistributed net investment income of $20,016 and undistributed net investment income of $22,949, respectively) | $ 7,126,192 | $ 9,942,715 |
See accompanying notes which are an integral part of the financial statements.
Annual Report
Financial Highlights - Dividend Growth
Years ended July 31, | 2012 | 2011 | 2010 | 2009 | 2008 |
Selected Per-Share Data | | | | | |
Net asset value, beginning of period | $ 28.96 | $ 23.84 | $ 20.25 | $ 25.40 | $ 32.73 |
Income from Investment Operations | | | | | |
Net investment income (loss) B | .20 | .12 | .13 E | .24 | .43 |
Net realized and unrealized gain (loss) | (.41) | 5.23 | 3.63 | (4.01) | (5.08) |
Total from investment operations | (.21) | 5.35 | 3.76 | (3.77) | (4.65) |
Distributions from net investment income | (.12) | (.15) | (.12) | (.37) | (.45) |
Distributions from net realized gain | (.02) | (.08) | (.05) | (1.01) | (2.23) |
Total distributions | (.14) | (.23) | (.17) | (1.38) H | (2.68) |
Net asset value, end of period | $ 28.61 | $ 28.96 | $ 23.84 | $ 20.25 | $ 25.40 |
Total Return A | (.67)% | 22.57% | 18.59% | (15.33)% | (15.45)% |
Ratios to Average Net Assets C,F | | | | | |
Expenses before reductions | .91% | .93% | .93% | .62% | .64% |
Expenses net of fee waivers, if any | .91% | .93% | .93% | .62% | .64% |
Expenses net of all reductions | .91% | .93% | .92% | .62% | .63% |
Net investment income (loss) | .75% | .44% | .56% E | 1.34% | 1.47% |
Supplemental Data | | | | | |
Net assets, end of period (in millions) | $ 5,905 | $ 9,309 | $ 7,730 | $ 6,603 | $ 9,502 |
Portfolio turnover rate D | 63% G | 67% | 85% | 177% | 52% |
A Total returns would have been lower if certain expenses had not been reduced during the applicable periods shown.
B Calculated based on average shares outstanding during the period.
C Fees and expenses of any underlying Fidelity Central Funds are not included in the Fund's expense ratio. The Fund indirectly bears its proportionate share of the expenses of any underlying Fidelity Central Funds.
D Amount does not include the portfolio activity of any underlying Fidelity Central Funds.
E Investment income per share reflects a large, non-recurring dividend which amounted to $.04 per share. Excluding this non-recurring dividend, the ratio of net investment income (loss) to average net assets would have been .40%.
F Expense ratios reflect operating expenses of the class. Expenses before reductions do not reflect amounts reimbursed by the investment adviser or reductions from brokerage service arrangements or reductions from other expense offset arrangements and do not represent the amount paid by the class during periods when reimbursements or reductions occur. Expenses net of fee waivers reflect expenses after reimbursement by the investment adviser but prior to reductions from brokerage service arrangements or other expense offset arrangements. Expenses net of all reductions represent the net expenses paid by the class.
G Portfolio turnover rate excludes securities received or delivered in-kind.
H Total distributions of $1.38 per share is comprised of distributions from net investment income of $.374 and distributions from net realized gain of $1.005 per share.
See accompanying notes which are an integral part of the financial statements.
Annual Report
Financial Highlights - Class K
Years ended July 31, | 2012 | 2011 | 2010 | 2009 | 2008 H |
Selected Per-Share Data | | | | | |
Net asset value, beginning of period | $ 28.98 | $ 23.86 | $ 20.26 | $ 25.41 | $ 27.72 |
Income from Investment Operations | | | | | |
Net investment income (loss) D | .25 | .17 | .18 G | .26 | .10 |
Net realized and unrealized gain (loss) | (.43) | 5.22 | 3.63 | (4.00) | (2.41) |
Total from investment operations | (.18) | 5.39 | 3.81 | (3.74) | (2.31) |
Distributions from net investment income | (.17) | (.20) | (.16) | (.41) | - |
Distributions from net realized gain | (.02) | (.08) | (.05) | (1.01) | - |
Total distributions | (.18) M | (.27) L | (.21) | (1.41) K | - |
Net asset value, end of period | $ 28.62 | $ 28.98 | $ 23.86 | $ 20.26 | $ 25.41 |
Total Return B,C | (.52)% | 22.79% | 18.86% | (15.16)% | (8.33)% |
Ratios to Average Net AssetsE,I | | | | | |
Expenses before reductions | .75% | .78% | .72% | .40% | .47% A |
Expenses net of fee waivers, if any | .75% | .78% | .72% | .40% | .47% A |
Expenses net of all reductions | .75% | .77% | .71% | .39% | .47% A |
Net investment income (loss) | .91% | .60% | .76% G | 1.57% | 1.66% A |
Supplemental Data | | | | | |
Net assets, end of period
(000 omitted) | $ 1,220,737 | $ 633,935 | $ 355,463 | $ 201,625 | $ 92 |
Portfolio turnover rate F | 63% J | 67% | 85% | 177% | 52% |
A Annualized
B Total returns for periods of less than one year are not annualized.
C Total returns would have been lower if certain expenses had not been reduced during the applicable periods shown.
D Calculated based on average shares outstanding during the period.
E Fees and expenses of any underlying Fidelity Central Funds are not included in the Fund's expense ratio. The Fund indirectly bears its proportionate share of the expenses of any underlying Fidelity Central Funds.
F Amount does not include the portfolio activity of any underlying Fidelity Central Funds.
G Investment income per share reflects a large, non-recurring dividend which amounted to $.04 per share. Excluding this non-recurring dividend, the ratio of net investment income (loss) to average net assets would have been .60%.
H For the period May 9, 2008 (commencement of sale of shares) to July 31, 2008.
I Expense ratios reflect operating expenses of the class. Expenses before reductions do not reflect amounts reimbursed by the investment adviser or reductions from brokerage service arrangements or reductions from other expense offset arrangements and do not represent the amount paid by the class during periods when reimbursements or reductions occur. Expense ratios before reductions for start-up periods may not be representative of longer-term operating periods. Expenses net of fee waivers reflect expenses after reimbursement by the investment adviser but prior to reductions from brokerage service arrangements or other expense offset arrangements. Expenses net of all reductions represent the net expenses paid by the class.
J Portfolio turnover rate excludes securities received or delivered in-kind.
K Total distributions of $1.41 per share is comprised of distributions from net investment income of $.407 and distributions from net realized gain of $1.005 per share.
L Total distributions of $.27 per share is comprised of distributions from net investment income of $.197 and distributions from net realized gain of $.077 per share.
M Total distributions of $.18 per share is comprised of distributions from net investment income of $.169 and distributions from net realized gain of $.015 per share.
See accompanying notes which are an integral part of the financial statements.
Annual Report
Notes to Financial Statements
For the period ended July 31, 2012
(Amounts in thousands except percentages)
1. Organization.
Fidelity® Dividend Growth Fund (the Fund) is a fund of Fidelity Securities Fund (the Trust) and is authorized to issue an unlimited number of shares. The Trust is registered under the Investment Company Act of 1940, as amended (the 1940 Act), as an open-end management investment company organized as a Massachusetts business trust. The Fund offers Dividend Growth and Class K shares, each of which has equal rights as to assets and voting privileges. Each class has exclusive voting rights with respect to matters that affect that class. Investment income, realized and unrealized capital gains and losses, the common expenses of the Fund, and certain fund-level expense reductions, if any, are allocated on a pro-rata basis to each class based on the relative net assets of each class to the total net assets of the Fund. Each class differs with respect to transfer agent fees incurred. Certain expense reductions may also differ by class.
2. Investments in Fidelity Central Funds.
The Fund invests in Fidelity Central Funds, which are open-end investment companies available only to other investment companies and accounts managed by Fidelity Management & Research Company (FMR) and its affiliates. The Fund's Schedule of Investments lists each of the Fidelity Central Funds held as of period end, if any, as an investment of the Fund, but does not include the underlying holdings of each Fidelity Central Fund. As an Investing Fund, the Fund indirectly bears its proportionate share of the expenses of the underlying Fidelity Central Funds.
The Money Market Central Funds seek preservation of capital and current income and are managed by Fidelity Investments Money Management, Inc. (FIMM), an affiliate of FMR.
A complete unaudited list of holdings for each Fidelity Central Fund is available upon request or at the Securities and Exchange Commission (the SEC) web site at www.sec.gov. In addition, the financial statements of the Fidelity Central Funds, which are not covered by the Fund's Report of Independent Registered Public Accounting Firm, are available on the SEC web site or upon request.
3. Significant Accounting Policies.
The financial statements have been prepared in conformity with accounting principles generally accepted in the United States of America (GAAP), which require management to make certain estimates and assumptions at the date of the financial statements. Actual results could differ from those estimates. Subsequent events, if any, through the date that the financial statements were issued have been evaluated in the preparation of the financial statements. The following summarizes the significant accounting policies of the Fund:
Annual Report
3. Significant Accounting Policies - continued
Security Valuation. Investments are valued as of 4:00 p.m. Eastern time on the last calendar day of the period. In accordance with valuation policies and procedures approved by the Board of Trustees (the Board), the Fund attempts to obtain prices from one or more third party pricing vendor or broker to value its investments. When current market prices, quotations or rates are not readily available or reliable, securities will be fair valued in good faith by the FMR Fair Value Committee (the Committee), in accordance with procedures adopted by the Fund's Board. Factors used in determining fair value vary by security type and may include market or security specific events, changes in interest rates and credit quality. The frequency with which these procedures are used cannot be predicted and they may be utilized to a significant extent. The Committee oversees the Fund's valuation policies and procedures and is responsible for approving and reporting to the Board all fair value determinations.
The Fund categorizes the inputs to valuation techniques used to value its investments into a disclosure hierarchy consisting of three levels as shown below:
Level 1 - quoted prices in active markets for identical investments
Level 2 - other significant observable inputs (including quoted prices for similar investments, interest rates, prepayment speeds, etc.)
Level 3 - unobservable inputs (including the Fund's own assumptions based on the best information available)
Valuation techniques used to value the Fund's investments by major category are as follows:
Equity securities, including restricted securities, for which market quotations are readily available, are valued at the last reported sale price or official closing price as reported by a third party pricing vendor on the primary market or exchange on which they are traded and are categorized as Level 1 in the hierarchy. In the event there were no sales during the day or closing prices are not available, securities are valued at the last quoted bid price or may be valued using the last available price and are generally categorized as Level 2 in the hierarchy. For foreign equity securities, when significant market or security specific events arise, comparisons to the valuation of American Depositary Receipts (ADRs), futures contracts, Exchange-Traded Funds (ETFs) and certain indexes as well as quoted prices for similar securities are used and are categorized as Level 2 in the hierarchy. Utilizing these techniques may result in transfers between Level 1 and Level 2. For restricted equity securities and private placements where observable inputs are limited, assumptions about market activity and risk are used and these securities are categorized as Level 3 in the hierarchy.
Annual Report
Notes to Financial Statements - continued
(Amounts in thousands except percentages)
3. Significant Accounting Policies - continued
Security Valuation - continued
Debt securities, including restricted securities, are valued based on evaluated prices received from third party pricing vendors or from brokers who make markets in such securities. For corporate bonds, pricing vendors utilize matrix pricing which considers yield or price of bonds of comparable quality, coupon, maturity and type as well as broker-supplied prices and are generally categorized as Level 2 in the hierarchy. When independent prices are unavailable or unreliable, debt securities may be valued utilizing pricing methodologies which consider similar factors that would be used by third party pricing vendors. These are generally categorized as Level 2 in the hierarchy but may be Level 3 depending on the circumstances.
Investments in open-end mutual funds, including the Fidelity Central Funds, are valued at their closing net asset value each business day and are categorized as Level 1 in the hierarchy.
Changes in valuation techniques may result in transfers in or out of an assigned level within the disclosure hierarchy. The aggregate value of investments by input level, as of July 31, 2012, is included at the end of the Fund's Schedule of Investments.
Foreign Currency Translation. The Fund may use foreign currency contracts to facilitate transactions in foreign-denominated securities. Gains and losses from these transactions may arise from changes in the value of the foreign currency or if the counterparties do not perform under the contracts' terms.
Foreign-denominated assets, including investment securities, and liabilities are translated into U.S. dollars at the exchange rates at period end. Purchases and sales of investment securities, income and dividends received and expenses denominated in foreign currencies are translated into U.S. dollars at the exchange rate in effect on the transaction date.
The effects of exchange rate fluctuations on investments are included with the net realized and unrealized gain (loss) on investment securities. Other foreign currency transactions resulting in realized and unrealized gain (loss) are disclosed separately.
Investment Transactions and Income. For financial reporting purposes, the Fund's investment holdings and NAV include trades executed through the end of the last business day of the period. The NAV per share for processing shareholder transactions is calculated as of the close of business of the New York Stock Exchange (NYSE), normally 4:00 p.m. Eastern time and includes trades executed through the end of the prior business day. Gains and losses on securities sold are determined on the basis of identified cost and may include proceeds received from litigation. Dividend income is recorded on the ex-dividend date, except for certain dividends from foreign securities where the
Annual Report
3. Significant Accounting Policies - continued
Investment Transactions and Income - continued
ex-dividend date may have passed, which are recorded as soon as the Fund is informed of the ex-dividend date. Non-cash dividends included in dividend income, if any, are recorded at the fair market value of the securities received. Distributions received on securities that represent a return of capital or capital gain are recorded as a reduction of cost of investments and/or as a realized gain. The Fund estimates the components of distributions received that may be considered return of capital distributions or capital gain distributions. Interest income and distributions from the Fidelity Central Funds are accrued as earned. Interest income includes coupon interest and amortization of premium and accretion of discount on debt securities. Investment income is recorded net of foreign taxes withheld where recovery of such taxes is uncertain.
Expenses. Expenses directly attributable to a fund are charged to that fund. Expenses attributable to more than one fund are allocated among the respective funds on the basis of relative net assets or other appropriate methods. Expense estimates are accrued in the period to which they relate and adjustments are made when actual amounts are known.
Deferred Trustee Compensation. Under a Deferred Compensation Plan (the Plan), independent Trustees may elect to defer receipt of a portion of their annual compensation. Deferred amounts are invested in a cross-section of Fidelity funds, are marked-to-market and remain in the Fund until distributed in accordance with the Plan. The investment of deferred amounts and the offsetting payable to the Trustees are included in the accompanying Statement of Assets and Liabilities.
Income Tax Information and Distributions to Shareholders. Each year, the Fund intends to qualify as a regulated investment company under Subchapter M of the Internal Revenue Code, including distributing substantially all of its taxable income and realized gains. As a result, no provision for income taxes is required. As of July 31, 2012, the Fund did not have any unrecognized tax benefits in the financial statements; nor is the Fund aware of any tax positions for which it is reasonably possible that the total amounts of unrecognized tax benefits will significantly change in the next twelve months. The Fund files a U.S. federal tax return, in addition to state and local tax returns as required. A fund's federal income tax returns are subject to examination by the Internal Revenue Service (IRS) for a period of three fiscal years after they are filed. State and local tax returns may be subject to examination for an additional fiscal year depending on the jurisdiction. Foreign taxes are provided for based on the Fund's understanding of the tax rules and rates that exist in the foreign markets in which it invests.
Annual Report
Notes to Financial Statements - continued
(Amounts in thousands except percentages)
3. Significant Accounting Policies - continued
Income Tax Information and Distributions to Shareholders - continued
Distributions are declared and recorded on the ex-dividend date. Income dividends and capital gain distributions are declared separately for each class. Income and capital gain distributions are determined in accordance with income tax regulations, which may differ from GAAP. In addition, the Fund claimed a portion of the payment made to redeeming shareholders as a distribution for income tax purposes.
Capital accounts within the financial statements are adjusted for permanent book-tax differences. These adjustments have no impact on net assets or the results of operations. Temporary book-tax differences will reverse in a subsequent period.
Book-tax differences are primarily due to futures transactions, foreign currency transactions, passive foreign investment companies (PFIC), market discount, redemptions in kind, equity-debt classifications, partnerships, deferred trustees compensation, capital loss carryforwards and losses deferred due to wash sales.
The federal tax cost of investment securities and unrealized appreciation (depreciation) as of period end were as follows:
Gross unrealized appreciation | $ 1,269,157 |
Gross unrealized depreciation | (546,000) |
Net unrealized appreciation (depreciation) on securities and other investments | $ 723,157 |
| |
Tax Cost | $ 6,508,503 |
The tax-based components of distributable earnings as of period end were as follows:
Undistributed ordinary income | $ 19,112 |
Undistributed long-term capital gain | $ 32,963 |
Net unrealized appreciation (depreciation) | $ 723,121 |
The tax character of distributions paid was as follows:
| July 31, 2012 | July 31, 2011 |
Ordinary Income | $ 47,261 | $ 78,101 |
New Accounting Pronouncement. In December 2011, the Financial Accounting Standards Board issued Accounting Standard Update No. 2011-11, Disclosures about Offsetting Assets and Liabilities. The update creates new disclosure requirements requiring entities to disclose both gross and net information for derivatives and other financial instruments that are either offset in the Statement of Assets and Liabilities or subject to an enforceable master netting arrangement or similar agreement. The disclosure requirements are effective for interim and annual reporting periods beginning on or after January 1, 2013. Management is currently evaluating the impact of the update's adoption on the Fund's financial statement disclosures.
Annual Report
4. Operating Policies.
Restricted Securities. The Fund may invest in securities that are subject to legal or contractual restrictions on resale. These securities generally may be resold in transactions exempt from registration or to the public if the securities are registered. Disposal of these securities may involve time-consuming negotiations and expense, and prompt sale at an acceptable price may be difficult. Information regarding restricted securities is included at the end of the Fund's Schedule of Investments.
5. Derivative Instruments.
Risk Exposures and the Use of Derivative Instruments. The Fund's investment objectives allow the Fund to enter into various types of derivative contracts, including futures contracts. Derivatives are investments whose value is derived from underlying assets, indices or reference rates and may be transacted on an exchange or over-the-counter (OTC). Derivatives may involve a future commitment to buy or sell a specified instrument based on specified terms, or to exchange future cash flows at periodic intervals based on a notional principal amount. The Fund used derivatives to increase returns and to manage exposure to certain risks as defined below. The success of any strategy involving derivatives depends on analysis of numerous economic factors, and if the strategies for investment do not work as intended, the Fund may not achieve its objectives.
The Fund's use of derivatives increased or decreased its exposure to the following risk:
Equity Risk | Equity risk relates to the fluctuations in the value of financial instruments as a result of changes in market prices (other than those arising from interest rate risk or foreign exchange risk), whether caused by factors specific to an individual investment, its issuer, or all factors affecting all instruments traded in a market or market segment. |
The Fund is also exposed to additional risks from investing in derivatives, such as liquidity risk and counterparty credit risk. Liquidity risk is the risk that the Fund will be unable to close out the derivative in the open market in a timely manner. Counterparty credit risk is the risk that the counterparty will not be able to fulfill its obligation to the Fund. Counterparty credit risk related to exchange-traded futures contracts is minimal because of the protection provided by the exchange on which they trade. Investing in derivatives may involve greater risks than investing in the underlying assets directly and, to varying degrees, involves risk of loss in excess of the initial investment, if any, collateral received and amounts recognized in the Statement of Assets and Liabilities. In addition, for futures contracts, there is the risk that the change in value of the derivative contract may not correspond to the change in value of the underlying instrument.
Annual Report
Notes to Financial Statements - continued
(Amounts in thousands except percentages)
5. Derivative Instruments - continued
Futures Contracts. A futures contract is an agreement between two parties to buy or sell a specified underlying instrument for a fixed price at a specified future date. The Fund used futures contracts to manage its exposure to the stock market.
Upon entering into a futures contract, a fund is required to deposit either cash or securities (initial margin) with a clearing broker in an amount equal to a certain percentage of the face value of the contract. Futures contracts are marked-to-market daily and subsequent payments (variation margin) are made or received by a fund depending on the daily fluctuations in the value of the futures contracts and are recorded as unrealized appreciation or (depreciation). This receivable and/or payable is included in daily variation margin on futures contracts in the Statement of Assets and Liabilities. Realized gain or (loss) is recorded upon the expiration or closing of a futures contract.
Any open futures contracts at period end are shown in the Schedule of Investments under the caption "Futures Contracts." The underlying face amount at value reflects each contract's exposure to the underlying instrument at period end.
During the period the Fund recognized net realized gain (loss) of $6,943 related to its investment in futures contracts. This amount is included in the Statement of Operations.
6. Purchases and Sales of Investments.
Purchases and sales of securities, other than short-term securities and in-kind transactions, aggregated $5,165,803 and $7,075,318, respectively.
7. Fees and Other Transactions with Affiliates.
Management Fee. FMR and its affiliates provide the Fund with investment management related services for which the Fund pays a monthly management fee. The management fee is the sum of an individual fund fee rate that is based on an annual rate of .30% of the Fund's average net assets and an annualized group fee rate that averaged .26% during the period. The group fee rate is based upon the average net assets of all the mutual funds advised by FMR. The group fee rate decreases as assets under management increase and increases as assets under management decrease. In addition, the management fee is subject to a performance adjustment (up to a maximum of ± .20% of the Fund's average net assets over a 36 month performance period). The upward or downward adjustment to the management fee is based on the relative investment performance of Dividend Growth as compared to an appropriate benchmark index. For the period, the total annual management fee rate, including the performance adjustment, was .68% of the Fund's average net assets.
Annual Report
7. Fees and Other Transactions with Affiliates - continued
Transfer Agent Fees. Fidelity Investments Institutional Operations Company, Inc. (FIIOC), an affiliate of FMR, is the transfer, dividend disbursing and shareholder servicing agent for each class of the Fund. FIIOC receives account fees and asset-based fees that vary according to the account size and type of account of the shareholders of Dividend Growth. FIIOC receives an asset-based fee of Class K's average net assets. FIIOC pays for typesetting, printing and mailing of shareholder reports, except proxy statements. For the period, transfer agent fees for each class were as follows:
| Amount | % of
Average
Net Assets |
Dividend Growth | $ 15,455 | .21 |
Class K | 464 | .05 |
| $ 15,919 | |
Accounting and Security Lending Fees. Fidelity Service Company, Inc. (FSC), an affiliate of FMR, maintains the Fund's accounting records. The accounting fee is based on the level of average net assets for each month. Under a separate contract, FSC administers the security lending program. The security lending fee is based on the number and duration of lending transactions.
Brokerage Commissions. The Fund placed a portion of its portfolio transactions with brokerage firms which are affiliates of the investment adviser. The commissions paid to these affiliated firms were $50 for the period.
Interfund Lending Program. Pursuant to an Exemptive Order issued by the SEC, the Fund, along with other registered investment companies having management contracts with FMR, may participate in an interfund lending program. This program provides an alternative credit facility allowing the funds to borrow from, or lend money to, other participating affiliated funds. At period end, there were no interfund loans outstanding. The Fund's activity in this program during the period for which loans were outstanding was as follows:
Borrower or Lender | Average Loan
Balance | Weighted Average Interest Rate |
Borrower | $ 11,847 | .33% |
Redemptions In-Kind. During the period, 26,569 shares of the Fund held by affiliated entities were redeemed for cash and securities, including accrued interest, with a value of $746,864. The net realized gain of $188,389 on securities delivered through in-kind redemptions is included in the accompanying Statement of Operations. The amount of in-kind redemptions is included in share transactions in the accompanying Statement of Changes in Net Assets a well as Note 12: Share Transactions. The Fund recognized no gain or loss for federal income tax purposes.
Annual Report
Notes to Financial Statements - continued
(Amounts in thousands except percentages)
8. Committed Line of Credit.
The Fund participates with other funds managed by FMR or an affiliate in a $4.25 billion credit facility (the "line of credit") to be utilized for temporary or emergency purposes to fund shareholder redemptions or for other short-term liquidity purposes. The Fund has agreed to pay commitment fees on its pro-rata portion of the line of credit, which amounted to $24 and is reflected in Miscellaneous expenses on the Statement of Operations. During the period, there were no borrowings on this line of credit.
9. Security Lending.
The Fund lends portfolio securities through a lending agent from time to time in order to earn additional income. For equity securities, a lending agent is used and may loan securities to certain qualified borrowers, including Fidelity Capital Markets (FCM), a broker-dealer affiliated with the Fund. On the settlement date of the loan, the Fund receives collateral (in the form of U.S. Treasury obligations, letters of credit and/or cash) against the loaned securities and maintains collateral in an amount not less than 100% of the market value of the loaned securities during the period of the loan. The market value of the loaned securities is determined at the close of business of the Fund and any additional required collateral is delivered to the Fund on the next business day. If the borrower defaults on its obligation to return the securities loaned because of insolvency or other reasons, a fund could experience delays and costs in recovering the securities loaned or in gaining access to the collateral. Any cash collateral received is invested in the Fidelity Securities Lending Cash Central Fund. The value of loaned securities and cash collateral at period end are disclosed on the Fund's Statement of Assets and Liabilities. The value of securities loaned to FCM at period end was $1,856. Security lending income represents the income earned on investing cash collateral, less rebates paid to borrowers and any lending agent fees associated with the loan, plus any premium payments received for lending certain types of securities. Security lending income is presented in the Statement of Operations as a component of income from Fidelity Central Funds. Total security lending income during the period amounted to $4,448, including $130 from securities loaned to FCM.
10. Expense Reductions.
Many of the brokers with whom FMR places trades on behalf of the Fund provided services to the Fund in addition to trade execution. These services included payments of certain expenses on behalf of the Fund totaling $362 for the period. In addition, through arrangements with the Fund's custodian, credits realized as a result of uninvested cash balances were used to reduce the Fund's expenses.
Annual Report
11. Distributions to Shareholders.
Distributions to shareholders of each class were as follows:
Years ended July 31, | 2012 | 2011 |
From net investment income | | |
Dividend Growth | $ 37,592 | $ 48,547 |
Class K | 4,528 | 3,190 |
Total | $ 42,120 | $ 51,737 |
From net realized gain | | |
Dividend Growth | $ 4,761 | $ 25,105 |
Class K | 380 | 1,259 |
Total | $ 5,141 | $ 26,364 |
12. Share Transactions.
Transactions for each class of shares were as follows:
| Shares | Dollars |
Years ended July 31, | 2012 | 2011 | 2012 | 2011 |
Dividend Growth | | | | |
Shares sold | 28,017 | 76,617 | $ 753,110 | $ 2,092,410 |
Reinvestment of distributions | 1,596 | 2,707 | 40,357 | 68,380 |
Shares redeemed | (144,643) A | (82,166) | (3,948,966) A | (2,266,445) |
Net increase (decrease) | (115,030) | (2,842) | $ (3,155,499) | $ (105,655) |
Class K | | | | |
Shares sold | 29,433 | 11,524 | $ 801,392 | $ 323,383 |
Reinvestment of distributions | 194 | 175 | 4,908 | 4,449 |
Shares redeemed | (8,851) | (4,720) | (241,998) | (130,500) |
Net increase (decrease) | 20,776 | 6,979 | $ 564,302 | $ 197,332 |
A Amount includes in-kind redemptions (see Note 7: Redemptions in-kind).
13. Other.
The Fund's organizational documents provide former and current trustees and officers with a limited indemnification against liabilities arising in connection with the performance of their duties to the Fund. In the normal course of business, the Fund may also enter into contracts that provide general indemnifications. The Fund's maximum exposure under these arrangements is unknown as this would be dependent on future claims that may be made against the Fund. The risk of material loss from such claims is considered remote.
Annual Report
To the Trustees of Fidelity Securities Fund and the Shareholders of Fidelity Dividend Growth Fund:
In our opinion, the accompanying statement of assets and liabilities, including the schedule of investments, and the related statements of operations and of changes in net assets and the financial highlights present fairly, in all material respects, the financial position of Fidelity Dividend Growth Fund (a fund of Fidelity Securities Fund) at July 31, 2012, the results of its operations for the year then ended, the changes in its net assets for each of the two years in the period then ended and the financial highlights for each of the periods indicated, in conformity with accounting principles generally accepted in the United States of America. These financial statements and financial highlights (hereafter referred to as "financial statements") are the responsibility of the Fidelity Dividend Growth Fund's management. Our responsibility is to express an opinion on these financial statements based on our audits. We conducted our audits of these financial statements in accordance with the standards of the Public Company Accounting Oversight Board (United States). Those standards require that we plan and perform the audit to obtain reasonable assurance about whether the financial statements are free of material misstatement. An audit includes examining, on a test basis, evidence supporting the amounts and disclosures in the financial statements, assessing the accounting principles used and significant estimates made by management, and evaluating the overall financial statement presentation. We believe that our audits, which included confirmation of securities at July 31, 2012 by correspondence with the custodian and brokers, provide a reasonable basis for our opinion.
PricewaterhouseCoopers LLP
Boston, Massachusetts
September 12, 2012
Annual Report
The Trustees, Members of the Advisory Board, and executive officers of the trust and fund, as applicable, are listed below. The Board of Trustees governs the fund and is responsible for protecting the interests of shareholders. The Trustees are experienced executives who meet periodically throughout the year to oversee the fund's activities, review contractual arrangements with companies that provide services to the fund, oversee management of the risks associated with such activities and contractual arrangements, and review the fund's performance. Except for James C. Curvey, each of the Trustees oversees 228 funds advised by FMR or an affiliate. Mr. Curvey oversees 435 funds advised by FMR or an affiliate.
The Trustees hold office without limit in time except that (a) any Trustee may resign; (b) any Trustee may be removed by written instrument, signed by at least two-thirds of the number of Trustees prior to such removal; (c) any Trustee who requests to be retired or who has become incapacitated by illness or injury may be retired by written instrument signed by a majority of the other Trustees; and (d) any Trustee may be removed at any special meeting of shareholders by a two-thirds vote of the outstanding voting securities of the trust. Each Trustee who is not an interested person (as defined in the 1940 Act) (Independent Trustee), shall retire not later than the last day of the calendar year in which his or her 75th birthday occurs. The Independent Trustees may waive this mandatory retirement age policy with respect to individual Trustees. The executive officers and Advisory Board Members hold office without limit in time, except that any officer and Advisory Board Member may resign or may be removed by a vote of a majority of the Trustees at any regular meeting or any special meeting of the Trustees. Except as indicated, each individual has held the office shown or other offices in the same company for the past five years.
Experience, Skills, Attributes, and Qualifications of the Fund's Trustees. The Governance and Nominating Committee has adopted a statement of policy that describes the experience, qualifications, attributes, and skills that are necessary and desirable for potential Independent Trustee candidates (Statement of Policy). The Board believes that each Trustee satisfied at the time he or she was initially elected or appointed a Trustee, and continues to satisfy, the standards contemplated by the Statement of Policy. The Governance and Nominating Committee also engages professional search firms to help identify potential Independent Trustee candidates who have the experience, qualifications, attributes, and skills consistent with the Statement of Policy. From time to time, additional criteria based on the composition and skills of the current Independent Trustees, as well as experience or skills that may be appropriate in light of future changes to board composition, business conditions, and regulatory or other developments, have also been considered by the professional search firms and the Governance and Nominating Committee. In addition, the Board takes into account the Trustees' commitment and participation in Board and committee meetings, as well as their leadership of standing and ad hoc committees throughout their tenure.
In determining that a particular Trustee was and continues to be qualified to serve as a Trustee, the Board has considered a variety of criteria, none of which, in isolation, was controlling. The Board believes that, collectively, the Trustees have balanced and diverse experience, qualifications, attributes, and skills, which allow the Board to operate effectively in governing the fund and protecting the interests of shareholders. Information about the specific experience, skills, attributes, and qualifications of each Trustee, which in each case led to the Board's conclusion that the Trustee should serve (or continue to serve) as a trustee of the fund, is provided below.
Annual Report
Board Structure and Oversight Function. James C. Curvey is an interested person (as defined in the 1940 Act) and currently serves as Chairman. The Trustees have determined that an interested Chairman is appropriate and benefits shareholders because an interested Chairman has a personal and professional stake in the quality and continuity of services provided to the fund. Independent Trustees exercise their informed business judgment to appoint an individual of their choosing to serve as Chairman, regardless of whether the Trustee happens to be independent or a member of management. The Independent Trustees have determined that they can act independently and effectively without having an Independent Trustee serve as Chairman and that a key structural component for assuring that they are in a position to do so is for the Independent Trustees to constitute a substantial majority for the Board. The Independent Trustees also regularly meet in executive session. Ned C. Lautenbach serves as Chairman of the Independent Trustees and as such (i) acts as a liaison between the Independent Trustees and management with respect to matters important to the Independent Trustees and (ii) with management prepares agendas for Board meetings.
Fidelity funds are overseen by different Boards of Trustees. The fund's Board oversees Fidelity's equity and high income funds and another Board oversees Fidelity's investment-grade bond, money market, and asset allocation funds. The asset allocation funds may invest in Fidelity funds overseen by the fund's Board. The use of separate Boards, each with its own committee structure, allows the Trustees of each group of Fidelity funds to focus on the unique issues of the funds they oversee, including common research, investment, and operational issues. On occasion, the separate Boards establish joint committees to address issues of overlapping consequences for the Fidelity funds overseen by each Board.
The Trustees operate using a system of committees to facilitate the timely and efficient consideration of all matters of importance to the Trustees, the fund, and fund shareholders and to facilitate compliance with legal and regulatory requirements and oversight of the fund's activities and associated risks. The Board, acting through its committees, has charged FMR and its affiliates with (i) identifying events or circumstances the occurrence of which could have demonstrably adverse effects on the fund's business and/or reputation; (ii) implementing processes and controls to lessen the possibility that such events or circumstances occur or to mitigate the effects of such events or circumstances if they do occur; and (iii) creating and maintaining a system designed to evaluate continuously business and market conditions in order to facilitate the identification and implementation processes described in (i) and (ii) above. Because the day-to-day operations and activities of the fund are carried out by or through FMR, its affiliates and other service providers, the fund's exposure to risks is mitigated but not eliminated by the processes overseen by the Trustees. While each of the Board's committees has responsibility for overseeing different aspects of the fund's activities, oversight is exercised primarily through the Operations, Audit, and Compliance Committees. In addition, the Independent Trustees have worked with FMR to enhance the Board's oversight of investment and financial risks, legal and regulatory risks, technology risks, and operational risks, including the development of additional risk reporting to the Board. For example, a working group comprised of Independent Trustees and FMR has worked and continues to work to review the Fidelity funds' valuation-related activities, reporting and risk management. Appropriate personnel, including but not limited to the fund's Chief Compliance Officer (CCO), FMR's internal auditor, the independent accountants, the fund's Treasurer and portfolio management personnel, make periodic reports to the Board's committees, as appropriate, including an annual review of FMR's risk management program for the Fidelity funds. The responsibilities of each standing committee, including their oversight responsibilities, are described further under "Standing Committees of the Fund's Trustees."
Annual Report
Trustees and Officers - continued
The fund's Statement of Additional Information (SAI) includes more information about the Trustees. To request a free copy, call Fidelity at 1-800-835-5092.
Interested Trustees*:
Correspondence intended for each Trustee who is an interested person may be sent to Fidelity Investments, 82 Devonshire Street, Boston, Massachusetts 02109.
Name, Age; Principal Occupations and Other Relevant Experience+ |
James C. Curvey (77) |
| Year of Election or Appointment: 2007 Mr. Curvey is Trustee and Chairman of the Board of Trustees of certain Trusts. Mr. Curvey also serves as Trustee (2007-present) of other investment companies advised by FMR. Mr. Curvey is a Director of Fidelity Investments Money Management, Inc. (2009-present), Director of Fidelity Research & Analysis Co. (2009-present) and Director of FMR and FMR Co., Inc. (2007-present). Mr. Curvey is also Vice Chairman (2007-present) and Director of FMR LLC. In addition, Mr. Curvey serves as an Overseer for the Boston Symphony Orchestra and a member of the Trustees of Villanova University. Previously, Mr. Curvey was the Vice Chairman (2006-2007) and Director (2000-2007) of FMR Corp. |
Ronald P. O'Hanley (55) |
| Year of Election or Appointment: 2011 Mr. O'Hanley is Director of FMR Co., Inc. (2010-present), Director of Fidelity Investments Money Management, Inc. (2010-present), Director of Fidelity Research & Analysis Company (2010-present), President of Fidelity Asset Management and Corporate Services and a member of Fidelity's Executive Committee (2010-present). Previously, Mr. O'Hanley served as President and Chief Executive Officer of BNY Mellon Asset Management (2007-2010). Mr. O'Hanley also served as Vice Chairman of Bank New York Mellon Corp. and a member of that firm's Executive Committee. Prior to the 2007 merger of The Bank of New York and Mellon Financial Corporation, he was Vice Chairman of Mellon Financial Corporation and President and Chief Executive Officer of Mellon Asset Management. He joined Mellon in February 1997. Mr. O'Hanley currently serves as Chairman of the Boston Public Library Foundation Board of Directors and sits on the Board of Directors of Beth Israel Deaconess Medical Center, the Board of Trustees of the Marine Biological Laboratory and the Advisory Board of the Maxwell School of Citizenship and Public Administration at Syracuse University. Mr. O'Hanley also chairs the Council on Asset Management for the Financial Services Roundtable and is a member of the Board of Directors of Institutional Investor's U.S. Institute. |
* Trustees have been determined to be "Interested Trustees" by virtue of, among other things, their affiliation with the trust or various entities under common control with FMR.
+ The information above includes each Trustee's principal occupation during the last five years and other information relating to the experience, attributes, and skills relevant to each Trustee's qualifications to serve as a Trustee, which led to the conclusion that each Trustee should serve as a Trustee for the fund.
Annual Report
Trustees and Officers - continued
Independent Trustees:
Correspondence intended for each Independent Trustee (that is, the Trustees other than the Interested Trustees) may be sent to Fidelity Investments, P.O. Box 55235, Boston, Massachusetts 02205-5235.
Name, Age; Principal Occupations and Other Relevant Experience+ |
Dennis J. Dirks (64) |
| Year of Election or Appointment: 2005 Prior to his retirement in May 2003, Mr. Dirks was Chief Operating Officer and a member of the Board of The Depository Trust & Clearing Corporation (DTCC). He also served as President, Chief Operating Officer, and Board member of The Depository Trust Company (DTC) and President and Board member of the National Securities Clearing Corporation (NSCC). In addition, Mr. Dirks served as Chief Executive Officer and Board member of the Government Securities Clearing Corporation, Chief Executive Officer and Board member of the Mortgage-Backed Securities Clearing Corporation, as a Trustee and a member of the Finance Committee of Manhattan College (2005-2008), and as a Trustee and a member of the Finance Committee of AHRC of Nassau County (2006-2008). Mr. Dirks is a member of the Independent Directors Council (IDC) Governing Council (2010-present) and Board of Directors for The Brookville Center for Children's Services, Inc. (2009-present). |
Alan J. Lacy (58) |
| Year of Election or Appointment: 2008 Mr. Lacy serves as Senior Adviser (2007-present) of Oak Hill Capital Partners, L.P. (private equity). Mr. Lacy also served as Chief Executive Officer (2000-2005) and Vice Chairman (2005-2006) of Sears Holdings Corporation and Sears, Roebuck and Co. (retail). In addition, Mr. Lacy serves as a member of the Board of Directors of Dave & Buster's Entertainment, Inc. (restaurant and entertainment complexes, 2010-present), Earth Fare, Inc. (retail grocery, 2012-present), The Hillman Companies, Inc. (hardware wholesalers, 2010-present), and Bristol-Myers Squibb Company (global pharmaceuticals, 2007-present). Mr. Lacy is a member of the Board of Trustees of The National Parks Conservation Association (2006-present). Previously, Mr. Lacy served as Chairman of the Board of Trustees of the National Parks Conservation Association (2008-2011) and as a member of the Board of Directors for the Western Union Company (global money transfer, 2006-2011). |
Ned C. Lautenbach (68) |
| Year of Election or Appointment: 2000 Mr. Lautenbach is Chairman of the Independent Trustees of the Equity and High Income Funds (2006-present). Mr. Lautenbach currently serves as the Lead Director of the Eaton Corporation Board of Directors (diversified industrial, 1997-present). Mr. Lautenbach is Chairman of the Board of Directors of the Philharmonic Center for the Arts in Naples, Florida (2012-present) and a member of the Council on Foreign Relations (1994-present). Previously, Mr. Lautenbach was a Partner/Advisory Partner at Clayton, Dubilier & Rice, LLC (private equity investment, 1998-2010), as well as a Director of Sony Corporation (2006-2007). |
Joseph Mauriello (67) |
| Year of Election or Appointment: 2008 Prior to his retirement in January 2006, Mr. Mauriello served in numerous senior management positions including Deputy Chairman and Chief Operating Officer (2004-2005), and Vice Chairman of Financial Services (2002-2004) of KPMG LLP US (professional services, 1965-2005). Mr. Mauriello currently serves as a member of the Board of Directors of XL Group plc. (global insurance and re-insurance, 2006-present). Previously, Mr. Mauriello served as a Director of the Hamilton Funds of the Bank of New York (2006-2007) and of Arcadia Resources Inc. (health care services and products, 2007-2012). |
Robert W. Selander (61) |
| Year of Election or Appointment: 2011 Previously, Mr. Selander served as a Member of the Advisory Board of Fidelity's Equity and High Income Funds (2011), Executive Vice Chairman (2010), Chief Executive Officer (2009-2010), and President and Chief Executive Officer (1997-2009) of Mastercard, Inc. |
Cornelia M. Small (68) |
| Year of Election or Appointment: 2005 Ms. Small is a member of the Board of Directors of the Teagle Foundation (2009-present). Ms. Small is also a member of the Investment Committee, and Chair (2008-present) and a member of the Board of Trustees of Smith College. In addition, Ms. Small serves on the Investment Committee of the Berkshire Taconic Community Foundation (2008-present). Previously, Ms. Small served as Chairperson of the Investment Committee (2002-2008) of Smith College. In addition, Ms. Small served as Chief Investment Officer, Director of Global Equity Investments, and a member of the Board of Directors of Scudder, Stevens & Clark and Scudder Kemper Investments. |
William S. Stavropoulos (73) |
| Year of Election or Appointment: 2002 Mr. Stavropoulos is Vice Chairman of the Independent Trustees of the Equity and High Income Funds (2006-present). Mr. Stavropoulos serves as President and Founder of the Michigan Baseball Foundation, the Great Lakes Loons (2007-present). Mr. Stavropoulos is Chairman Emeritus of the Board of Directors of The Dow Chemical Company, where he previously served in numerous senior management positions, including President, CEO (1995-2000; 2002-2004), Chairman of the Executive Committee (2000-2006), and as a member of the Board of Directors (1990-2006). Currently, Mr. Stavropoulos is Chairman of Univar (global distributor of commodity and specialty chemicals, 2010-present), a Director of Teradata Corporation (data warehousing and technology solutions, 2008-present), Chemical Financial Corporation, Maersk Inc. (industrial conglomerate), Tyco International, Inc. (multinational manufacturing and services, 2007-present), and a member of the Advisory Board for Metalmark Capital (private equity investment, 2005-present). Mr. Stavropoulos is a special advisor to Clayton, Dubilier & Rice, LLC (private equity investment). In addition, Mr. Stavropoulos is a member of the University of Notre Dame Advisory Council for the College of Science. |
David M. Thomas (63) |
| Year of Election or Appointment: 2008 Previously, Mr. Thomas served as Executive Chairman (2005-2006) and Chairman and Chief Executive Officer (2000-2005) of IMS Health, Inc. (pharmaceutical and healthcare information solutions). In addition, Mr. Thomas serves as a member of the Board of Directors of Fortune Brands, Inc. (consumer products), and Interpublic Group of Companies, Inc. (marketing communication, 2004-present). |
Michael E. Wiley (61) |
| Year of Election or Appointment: 2008 Mr. Wiley also serves as a Director of Asia Pacific Exploration Consolidated (international oil and gas exploration and production, 2008-present). Mr. Wiley serves as a Director of Tesoro Corporation (independent oil refiner and marketer, 2005-present), and a Director of Bill Barrett Corporation (exploration and production, 2005-present). In addition, Mr. Wiley also serves as a Director of Post Oak Bank (privately-held bank, 2004-present). Previously, Mr. Wiley served as a member of the Board of Trustees of the University of Tulsa (2000-2006; 2007-2010), as a Senior Energy Advisor of Katzenbach Partners, LLC (consulting, 2006-2007), as an Advisory Director of Riverstone Holdings (private investment), Chairman, President, and CEO of Baker Hughes, Inc. (oilfield services, 2000-2004), and as Director of Spinnaker Exploration Company (exploration and production, 2001-2005). |
Annual Report
+ The information above includes each Trustee's principal occupation during the last five years and other information relating to the experience, attributes, and skills relevant to each Trustee's qualifications to serve as a Trustee, which led to the conclusion that each Trustee should serve as a Trustee for the fund.
Advisory Board Members and Executive Officers:
Correspondence intended for David A. Rosow and Garnett A. Smith may be sent to Fidelity Investments, P.O. Box 55235, Boston, Massachusetts 02205-5235. Correspondence intended for each executive officer, Edward C. Johnson 3d, and Peter S. Lynch may be sent to Fidelity Investments, 82 Devonshire Street, Boston, Massachusetts 02109.
Name, Age; Principal Occupation |
Edward C. Johnson 3d (82) |
| Year of Election or Appointment: 2011 Member of the Advisory Board of Fidelity's Equity and High Income Funds. Mr. Johnson serves as Chief Executive Officer, Chairman, and a Director of FMR LLC, and also serves as Chairman and Director of FIL Limited. Previously, Mr. Johnson served as a Trustee and Chairman of the Board of certain Fidelity Trusts, Chairman and a Director of FMR, Chairman and a Director of FMR Co., Inc., and President of FMR LLC (2006-2007). |
Peter S. Lynch (68) |
| Year of Election or Appointment: 2003 Member of the Advisory Board of Fidelity's Equity and High Income Funds. Mr. Lynch is Vice Chairman and a Director of FMR and FMR Co., Inc. In addition, Mr. Lynch serves as a Trustee of Boston College and as the Chairman of the Inner-City Scholarship Fund. Previously, Mr. Lynch served on the Special Olympics International Board of Directors (1997-2006). |
David A. Rosow (69) |
| Year of Election or Appointment: 2012 Member of the Advisory Board of Fidelity's Equity and High Income Funds. Chairman and Chief Executive Officer of International Golf Group, Inc. (golf course development, 1990-present). Previously, Mr. Rosow served as Chairman and Chief Executive Officer of Rosow & Company, Inc. (private investment company, 1989-2011), a Lead Director of Hudson United Bancorp (2001-2006) and as a Director of TD Banknorth (1996-2006). In addition, Mr. Rosow is a member (2008-present) and President (2009-present) of the Town Council of Palm Beach, Florida. |
Garnett A. Smith (64) |
| Year of Election or Appointment: 2012 Member of the Advisory Board of Fidelity's Equity and High Income Funds. Prior to Mr. Smith's retirement, he served as Chairman and Chief Executive Officer of Inbrand Corp. (manufacturer of personal absorbent products, 1990-1997). He also served as President (1986-1990) of Inbrand Corp. Prior to his employment with Inbrand Corp., he was employed by a retail fabric chain and North Carolina National Bank. In addition, Mr. Smith is a board member of the Jackson Hole Land Trust (2009-present). |
Kenneth B. Robins (42) |
| Year of Election or Appointment: 2008 President and Treasurer of Fidelity's Equity and High Income Funds. Mr. Robins also serves as President and Treasurer (2010-present) and Assistant Treasurer (2009-present) of other Fidelity funds and is an employee of Fidelity Investments (2004-present). Previously, Mr. Robins served as Deputy Treasurer of the Fidelity funds (2005-2008) and Treasurer and Chief Financial Officer of The North Carolina Capital Management Trust: Cash and Term Portfolios (2006-2008). |
Bruce T. Herring (46) |
| Year of Election or Appointment: 2006 Vice President of certain Equity Funds. Mr. Herring also serves as President of Fidelity Research & Analysis Company (2010-present), Chief Investment Officer and Director of Fidelity Management & Research (U.K.) Inc. (2010-present) and Group Chief Investment Officer of FMR. Previously, Mr. Herring served as Vice President (2005-2006) and Senior Vice President (2006-2007) of Fidelity Management & Research Company, Vice President of FMR Co., Inc. (2001-2007) and as a portfolio manager for Fidelity U.S. Equity Funds. |
Brian B. Hogan (47) |
| Year of Election or Appointment: 2009 Vice President of Equity and High Income Funds. Mr. Hogan also serves as President of FMR's Equity Division (2009-present). Previously, Mr. Hogan served as Senior Vice President, Equity Research of FMR (2006-2009) and as a portfolio manager. |
Scott C. Goebel (44) |
| Year of Election or Appointment: 2008 Secretary and Chief Legal Officer (CLO) of the Fidelity funds. Mr. Goebel also serves as Secretary of Fidelity Investments Money Management, Inc. (FIMM) (2010-present) and Fidelity Research and Analysis Company (FRAC) (2010-present); Secretary and CLO of The North Carolina Capital Management Trust: Cash and Term Portfolios (2008-present); General Counsel, Secretary, and Senior Vice President of FMR (2008-present) and FMR Co., Inc. (2008-present); employed by FMR LLC or an affiliate (2001-present); Chief Legal Officer of Fidelity Management & Research (Hong Kong) Limited (2008-present) and Assistant Secretary of Fidelity Management & Research (Japan) Inc. (2008-present), and Fidelity Management & Research (U.K.) Inc. (2008-present). Previously, Mr. Goebel served as Assistant Secretary of FIMM (2008-2010), FRAC (2008-2010), and the Funds (2007-2008) and as Vice President and Secretary of Fidelity Distributors Corporation (FDC) (2005-2007). |
William C. Coffey (43) |
| Year of Election or Appointment: 2009 Assistant Secretary of Fidelity's Equity and High Income Funds. Mr. Coffey also serves as Senior Vice President and Deputy General Counsel of FMR LLC (2010-present), and is an employee of Fidelity Investments. Previously, Mr. Coffey served as Vice President and Associate General Counsel of FMR LLC (2005-2009). |
Elizabeth Paige Baumann (44) |
| Year of Election or Appointment: 2012 Anti-Money Laundering (AML) Officer of the Fidelity funds. Ms. Baumann also serves as AML Officer of The North Carolina Capital Management Trust: Cash and Term Portfolios (2012-present), Chief AML Officer of FMR LLC (2012-present), and is an employee of Fidelity Investments. Previously, Ms. Baumann served as Vice President and Deputy Anti-Money Laundering Officer (2007-2012). |
Christine Reynolds (53) |
| Year of Election or Appointment: 2008 Chief Financial Officer of the Fidelity funds. Ms. Reynolds became President of Fidelity Pricing and Cash Management Services (FPCMS) in August 2008. Ms. Reynolds served as Chief Operating Officer of FPCMS (2007-2008). Previously, Ms. Reynolds served as President, Treasurer, and Anti-Money Laundering officer of the Fidelity funds (2004-2007). |
Joseph A. Hanlon (44) |
| Year of Election or Appointment: 2012 Chief Compliance Officer of Fidelity's Equity and High Income Funds. Mr. Hanlon serves as Compliance Officer of FMR, FMR Co., Inc., Fidelity Investments Money Management, Inc. (FIMM), Fidelity Research and Analysis Company (FRAC), Fidelity Management & Research (Japan) Inc., Fidelity Management & Research (U.K.) Inc., Fidelity Management & Research (Hong Kong), and Strategic Advisers, Inc. (2009-present), as Senior Vice President of the Fidelity Asset Management Division (2009-present), and is an employee of Fidelity Investments. |
Joseph F. Zambello (55) |
| Year of Election or Appointment: 2011 Deputy Treasurer of the Fidelity funds. Mr. Zambello is an employee of Fidelity Investments. Previously, Mr. Zambello served as Vice President of FMR's Program Management Group (2009-2011) and Vice President of the Transfer Agent Oversight Group (2005-2009). |
Adrien E. Deberghes (44) |
| Year of Election or Appointment: 2008 Deputy Treasurer of Fidelity's Equity and High Income Funds. Mr. Deberghes also serves as Vice President (2011-present) and Assistant Treasurer (2010-present) of other Fidelity funds, and is an employee of Fidelity Investments (2008-present). Previously, Mr. Deberghes served as Senior Vice President of Mutual Fund Administration at State Street Corporation (2007-2008), Senior Director of Mutual Fund Administration at Investors Bank & Trust (2005-2007), and Director of Finance for Dunkin' Brands (2000-2005). |
Stephanie J. Dorsey (43) |
| Year of Election or Appointment: 2010 Assistant Treasurer of Fidelity's Equity and High Income Funds. Ms. Dorsey also serves as Deputy Treasurer of other Fidelity funds (2008-present) and is an employee of Fidelity Investments (2008-present). Previously, Ms. Dorsey served as Treasurer (2004-2008) of the JPMorgan Mutual Funds and Vice President (2004-2008) of JPMorgan Chase Bank. |
John R. Hebble (54) |
| Year of Election or Appointment: 2009 Assistant Treasurer of Fidelity's Equity and High Income Funds. Mr. Hebble also serves as President (2011-present), Treasurer, and Chief Financial Officer of The North Carolina Capital Management Trust: Cash and Term Portfolios (2008-present), President and Treasurer of other Fidelity funds (2008-present) and is an employee of Fidelity Investments. |
Gary W. Ryan (53) |
| Year of Election or Appointment: 2005 Assistant Treasurer of the Fidelity funds. Mr. Ryan is an employee of Fidelity Investments. Previously, Mr. Ryan served as Vice President of Fund Reporting in Fidelity Pricing and Cash Management Services (FPCMS) (1999-2005). |
Jonathan Davis (44) |
| Year of Election or Appointment: 2010 Assistant Treasurer of the Fidelity funds. Mr. Davis is also Assistant Treasurer of Fidelity Rutland Square Trust II and Fidelity Commonwealth Trust II. Mr. Davis is an employee of Fidelity Investments. Previously, Mr. Davis served as Vice President and Associate General Counsel of FMR LLC (2003-2010). |
Annual Report
The Board of Trustees of Fidelity Dividend Growth Fund voted to pay on record date, the following distributions per share derived from capital gains realized from sales of portfolio securities, and dividends derived from net investment income:
| Pay Date | Record Date | Dividends | Capital Gains |
Class K | 9/10/12 | 9/07/12 | $0.107 | $0.134 |
The fund hereby designates as a capital gain dividend with respect to the taxable year ended July 31, 2012 $33,089,253 or, if subsequently determined to be different, the net capital gain of such year.
Class K designates 100% of the dividends distributed during the fiscal year as qualifying for the dividends-received deduction for corporate shareholders.
Class K designates 100% of the dividends distributed during the fiscal year as amounts which may be taken into account as a dividend for the purposes of the maximum rate under section 1(h)(11) of the Internal Revenue Code.
The fund will notify shareholders in January 2013 of amounts for use in preparing 2012 income tax returns.
Annual Report
Board Approval of Investment Advisory Contracts and Management Fees
Fidelity Dividend Growth Fund
Each year, the Board of Trustees, including the Independent Trustees (together, the Board), votes on the renewal of the management contract and sub-advisory agreements (together, the Advisory Contracts) for the fund. The Board, assisted by the advice of fund counsel and Independent Trustees' counsel, requests and considers a broad range of information relevant to the renewal of the Advisory Contracts throughout the year.
The Board meets regularly and, at each of its meetings, considers factors that are relevant to its annual consideration of the renewal of the fund's Advisory Contracts, including the services and support provided to the fund and its shareholders. The Board has established various standing committees, each composed of and chaired by Independent Trustees with varying backgrounds, to which the Board has assigned specific subject matter responsibilities in order to enhance effective decision-making by the Board. The Board, acting directly and through its Committees, requests and receives information concerning the annual consideration of the renewal of the fund's Advisory Contracts. The Board also meets as needed to consider matters specifically related to the Board's annual consideration of the renewal of Advisory Contracts. Members of the Board may also meet with trustees of other Fidelity funds through ad hoc joint committees to discuss certain matters relevant to the Fidelity funds.
At its July 2012 meeting, the Board of Trustees, including the Independent Trustees, unanimously determined to renew the fund's Advisory Contracts. In reaching its determination, the Board considered all factors it believed relevant, including (i) the nature, extent, and quality of the services to be provided to the fund and its shareholders (including the investment performance of the fund); (ii) the competitiveness of the fund's management fee and total expense ratio relative to peer funds; (iii) the total costs of the services to be provided by and the profits to be realized by Fidelity from its relationship with the fund; (iv) the extent to which economies of scale exist and would be realized as the fund grows; and (v) whether fee levels reflect these economies of scale, if any, for the benefit of fund shareholders.
In considering whether to renew the Advisory Contracts for the fund, the Board reached a determination, with the assistance of fund counsel and Independent Trustees' counsel and through the exercise of its business judgment, that the renewal of the Advisory Contracts is in the best interests of the fund and its shareholders and that the compensation payable under the Advisory Contracts is fair and reasonable. The Board's decision to renew the Advisory Contracts was not based on any single factor, but rather was based on a comprehensive consideration of all the information provided to the Board at its meetings throughout the year. The Board, in reaching its determination to renew the Advisory Contracts, is aware that shareholders in the fund have a broad range of investment choices available to them, including a wide choice among mutual funds offered by Fidelity's competitors, and that the fund's shareholders, who have the opportunity to review and weigh the disclosure provided by the fund in its prospectus and other public disclosures, have chosen to invest in this fund, managed by Fidelity.
Annual Report
Board Approval of Investment Advisory Contracts and
Management Fees - continued
Nature, Extent, and Quality of Services Provided. The Board considered the staffing within the investment adviser, FMR, and the sub-advisers (together, the Investment Advisers), including the backgrounds of the fund's investment personnel, and also considered the fund's investment objective, strategies, and related investment philosophy. The Independent Trustees also had discussions with senior management of Fidelity's investment operations and investment groups. The Board considered the structure of the portfolio manager compensation program and whether this structure provides appropriate incentives to act in the best interests of the fund.
Resources Dedicated to Investment Management and Support Services. The Board and the Fund Oversight and Research Committees reviewed the general qualifications and capabilities of the Investment Advisers' investment staff, including its size, education, experience, and resources, as well as the Investment Advisers' approach to recruiting, training, managing, and compensating investment personnel. The Board also noted that FMR has continued to increase the resources devoted to non-U.S. offices, including expansion of Fidelity's global investment organization. The Board noted that Fidelity's analysts have extensive resources, tools and capabilities that allow them to conduct sophisticated quantitative and fundamental analysis, as well as credit analysis of issuers, counterparties and guarantors. The Board also believes that Fidelity's investment professionals have sufficient access to global information and data so as to provide competitive investment results over time, and that those professionals also have access to sophisticated tools that permit them to assess portfolio construction and risk and performance attribution characteristics continuously, as well as to transmit new information and research conclusions rapidly around the world. Additionally, in its deliberations, the Board considered the Investment Advisers' trading and risk management capabilities and resources, which are an integral part of the investment management process.
Shareholder and Administrative Services. The Board considered (i) the nature, extent, quality, and cost of advisory, administrative, and shareholder services performed by the Investment Advisers and their affiliates under the Advisory Contracts and under separate agreements covering transfer agency, pricing and bookkeeping, and securities lending services for the fund; (ii) the nature and extent of the supervision of third party service providers, principally custodians and subcustodians; and (iii) the resources devoted to, and the record of compliance with, the fund's compliance policies and procedures. The Board also reviewed the allocation of fund brokerage, including allocations to brokers affiliated with the Investment Advisers, the use of brokerage commissions to pay fund expenses, and the use of "soft" commission dollars to pay for research services.
Annual Report
The Board noted that the growth of fund assets over time across the complex allows Fidelity to reinvest in the development of services designed to enhance the value or convenience of the Fidelity funds as investment vehicles. These services include 24-hour access to account information and market information through telephone representatives and over the Internet, investor education materials and asset allocation tools, and the expanded availability of Fidelity Investor Centers.
Investment in a Large Fund Family. The Board considered the benefits to shareholders of investing in a Fidelity fund, including the benefits of investing in a fund that is part of a large family of funds offering a variety of investment disciplines and providing a large variety of mutual fund investor services. The Board noted that Fidelity had taken, or had made recommendations that resulted in the Fidelity funds taking, a number of actions over the previous year that benefited particular funds, including (i) continuing to dedicate additional resources to investment research and support of the senior management team that oversees asset management; (ii) persisting in efforts to enhance Fidelity's research capabilities, in particular, international research; (iii) launching new funds and making other enhancements to meet client needs for global and income-oriented solutions; (iv) continuing to launch dedicated lower cost underlying funds to meet investment management's portfolio construction needs related to expanding underlying fund options, specifically for the Freedom Fund product lines; (v) adopting a "Stock Selector" sector neutral investment approach and employing a team of portfolio managers who are sector specialists to manage certain funds; (vi) rationalizing product lines and gaining increased efficiencies through the mergers of several funds into other funds; (vii) strengthening the Spartan Index Fund product line by adding new funds and/or new low-cost institutional share classes, restructuring fund expenses to accommodate new classes, and reducing investment minimums for certain classes of shares; (viii) modifying the eligibility criteria for Institutional Class shares to increase their appeal to government entities and charitable investors; and (ix) reducing certain transfer agent fee rates.
Investment Performance. The Board considered whether the fund has operated in accordance with its investment objective, as well as its record of compliance with its investment restrictions. It also reviewed the fund's absolute investment performance for each class, as well as the fund's relative investment performance for each class measured over multiple periods against (i) a broad-based securities market index, and (ii) a peer group of mutual funds deemed appropriate by Fidelity and reviewed by the Board. The following charts considered by the Board show, over the one-, three-, and five-year periods ended December 31, 2011, as available, the cumulative total returns of Class K and the retail class of the fund, the cumulative total returns of a broad-based securities market index ("benchmark"), and a range of cumulative total returns of a peer group of mutual funds identified by Morningstar, Inc. as having an investment style similar to that of the fund based on underlying portfolio holdings. The box within each chart shows the 25th percentile return (top of box) and the 75th percentile return (bottom of box) of the peer group. Returns shown above the box are in the first quartile and returns shown below the box are in the fourth quartile. The percentage beaten numbers noted below each chart correspond to the percentile box and represent the percentage of funds in the peer group whose performance was equal to or lower than that of the class indicated.
Annual Report
Board Approval of Investment Advisory Contracts and
Management Fees - continued
Fidelity Dividend Growth Fund
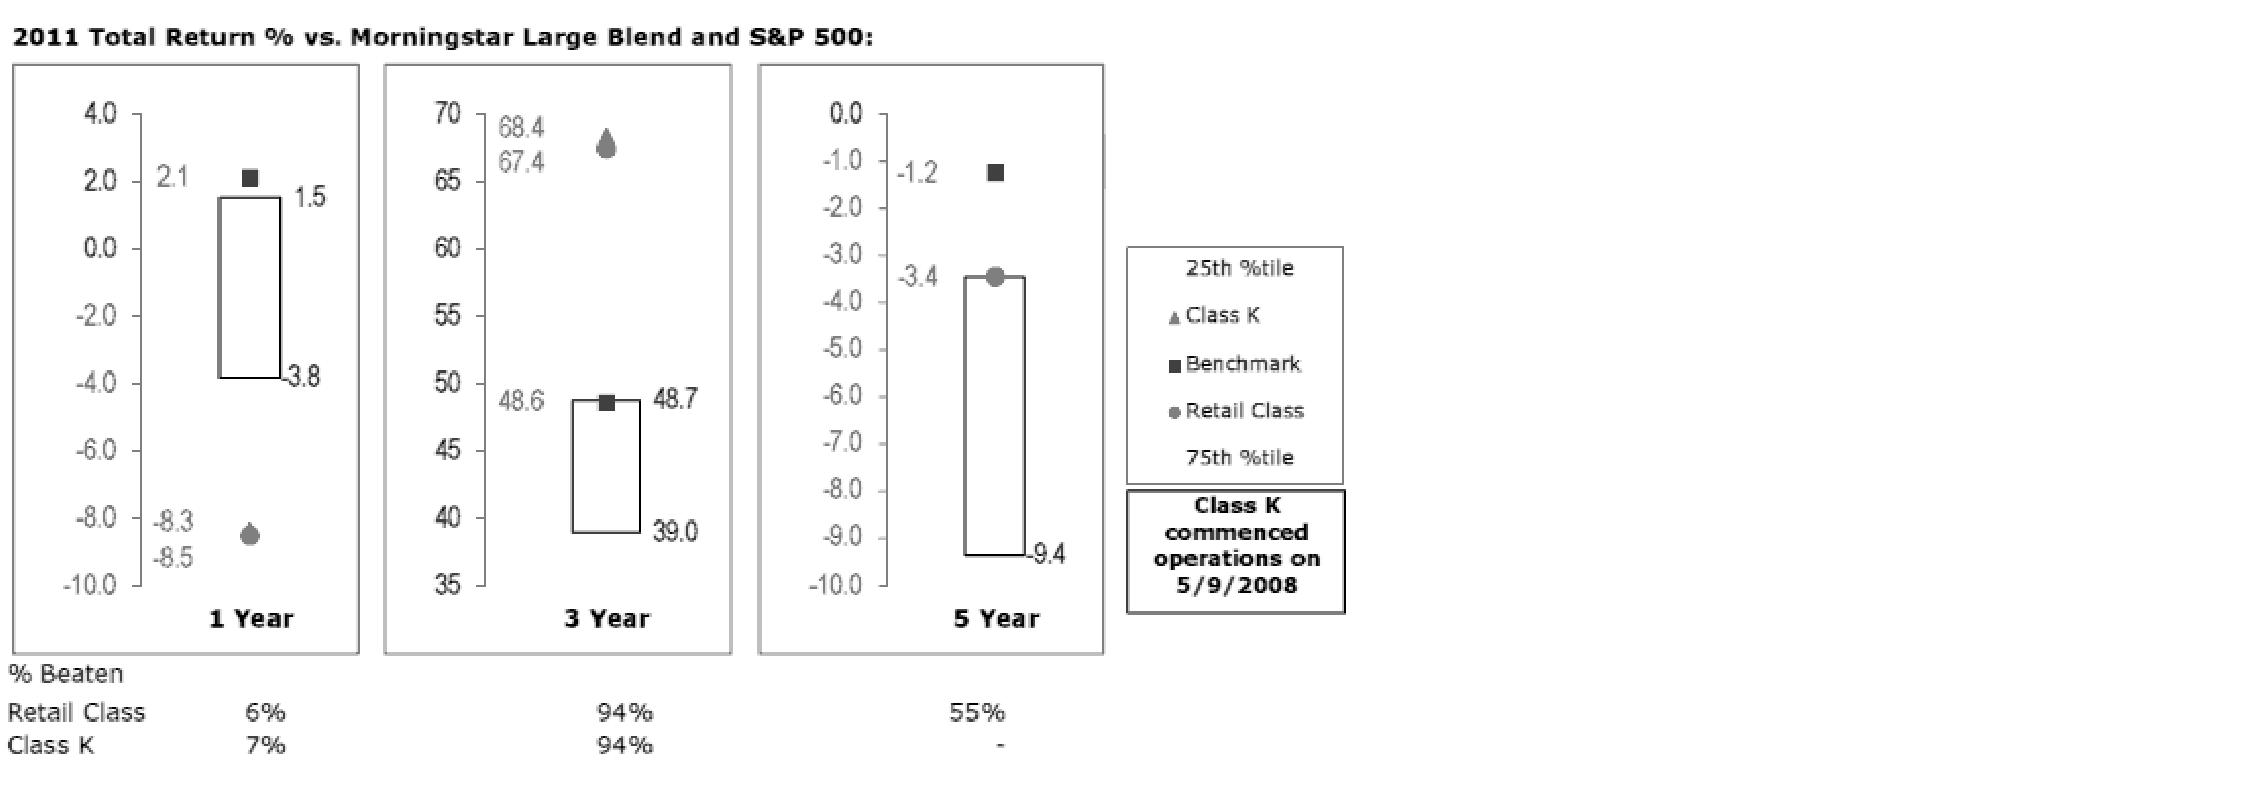
The Board reviewed the fund's relative investment performance against its peer group and noted that the performance of the retail class of the fund (the class with the longer performance record) was in the fourth quartile for the one-year period, the first quartile for the three-year period, and the second quartile for the five-year period. The Board also noted that the investment performance of the fund was lower than its benchmark for the one- and five-year periods, although the three-year cumulative total return of the retail class compared favorably to its benchmark. The Board considered that the variations in performance between the fund's classes reflect the variations in class expenses, which result in lower performance for the higher expense class. The Board also reviewed the fund's performance since inception as well as performance in the current year.
The Board also considered that the fund's management fee is subject to upward or downward adjustment depending upon whether, and to what extent, the fund's investment performance for the performance period exceeds, or is exceeded by, the record (over the same period) of a Board-approved performance adjustment index. The Board noted that the performance adjustment provides FMR with a strong economic incentive to seek to achieve superior performance for the fund's shareholders and helps to more closely align the interests of FMR and the fund's shareholders.
Annual Report
Based on its review, the Board concluded that the nature, extent, and quality of services provided to the fund under the Advisory Contracts should benefit the fund's shareholders.
Competitiveness of Management Fee and Total Expense Ratio. The Board considered the fund's management fee and total expense ratio compared to "mapped groups" of competitive funds and classes. Fidelity creates "mapped groups" by combining similar Lipper investment objective categories that have comparable management fee characteristics. Combining Lipper investment objective categories aids the Board's management fee and total expense ratio comparisons by broadening the competitive group used for comparison and by reducing the number of universes to which various Fidelity funds are compared.
Management Fee. The Board considered two proprietary management fee comparisons for the 12-month periods shown in the chart below. The group of Lipper funds used by the Board for management fee comparisons is referred to below as the "Total Mapped Group." The Total Mapped Group comparison focuses on a fund's standing relative to the total universe of comparable funds available to investors in terms of gross management fees before expense reimbursements or caps, and without giving effect to the fund's performance adjustment. "TMG %" represents the percentage of funds in the Total Mapped Group that had management fees that were lower than the fund's. For example, a TMG % of 10% means that 90% of the funds in the Total Mapped Group had higher management fees than the fund. The "Asset-Size Peer Group" (ASPG) comparison focuses on a fund's standing relative to non-Fidelity funds similar in size to the fund within the Total Mapped Group. The ASPG represents at least 15% of the funds in the Total Mapped Group with comparable asset size and management fee characteristics, subject to a minimum of 50 funds (or all funds in the Total Mapped Group if fewer than 50). Additional information, such as the ASPG quartile in which the fund's management fee ranked and the impact of the fund's performance adjustment, is also included in the chart and considered by the Board.
Annual Report
Board Approval of Investment Advisory Contracts and
Management Fees - continued
Fidelity Dividend Growth Fund

The Board noted that the fund's management fee ranked below the median of its Total Mapped Group and below the median of its ASPG for 2011. The Board also noted the effect of the fund's positive performance adjustment on the fund's management fee ranking. The Board noted that the performance adjustment for each year represents calculations for performance periods that differ from the periods shown in the performance charts above.
Based on its review, the Board concluded that the fund's management fee is fair and reasonable in light of the services that the fund receives and the other factors considered.
Total Expense Ratio. In its review of each class's total expense ratio, the Board considered the fund's management fee as well as other fund or class expenses, as applicable, such as transfer agent fees, pricing and bookkeeping fees, and custodial, legal, and audit fees. The Board also noted the effects of any waivers and reimbursements on fees and expenses, as well as the impact of the fund's performance adjustment. As part of its review, the Board also considered the current and historical total expense ratios of each class of the fund compared to competitive fund median expenses. Each class of the fund is compared to those funds and classes in the Total Mapped Group (used by the Board for management fee comparisons) that have a similar sales load structure.
The Board noted that the total expense ratio of each class ranked below its competitive median for 2011.
Fees Charged to Other Fidelity Clients. The Board also considered Fidelity fee structures and other information with respect to clients of FMR and its affiliates, such as other mutual funds advised or subadvised by FMR or its affiliates, pension plan clients, and other institutional clients. The Board noted the findings of the 2010 ad hoc joint committee (created with the board of other Fidelity funds), which reviewed and compared Fidelity's institutional investment advisory business with its business of providing services to the Fidelity funds, including the differences in services provided, fees charged, and costs incurred, as well as competition in their respective marketplaces.
Annual Report
Based on its review of total expense ratios and fees charged to other Fidelity clients, the Board concluded that the total expense ratio of each class of the fund was reasonable in light of the services that the fund and its shareholders receive and the other factors considered.
Costs of the Services and Profitability. The Board considered the revenues earned and the expenses incurred by Fidelity in conducting the business of developing, marketing, distributing, managing, administering and servicing the fund and its shareholders. The Board also considered the level of Fidelity's profits in respect of all the Fidelity funds.
On an annual basis, FMR presents to the Board Fidelity's profitability for the fund. Fidelity calculates the profitability for each fund, as well as aggregate profitability for groups of Fidelity funds and all Fidelity funds, using a series of detailed revenue and cost allocation methodologies which originate with the books and records of Fidelity on which Fidelity's audited financial statements are based. The Audit Committee of the Board reviews any significant changes from the prior year's methodologies.
PricewaterhouseCoopers LLP (PwC), independent registered public accounting firm and auditor to Fidelity and certain Fidelity funds, has been engaged annually by the Board as part of the Board's assessment of Fidelity's profitability analysis. PwC's engagement includes the review and assessment of Fidelity's methodologies used in determining the revenues and expenses attributable to Fidelity's mutual fund business, and completion of agreed-upon procedures surrounding the mathematical accuracy of fund profitability and its conformity to allocation methodologies. After considering PwC's reports issued under the engagement and information provided by Fidelity, the Board concluded that while other allocation methods may also be reasonable, Fidelity's profitability methodologies are reasonable in all material respects.
The Board also reviewed Fidelity's non-fund businesses and fall-out benefits related to the mutual fund business as well as cases where Fidelity's affiliates may benefit from or be related to the fund's business.
The Board considered the costs of the services provided by and the profits realized by Fidelity in connection with the operation of the fund and was satisfied that the profitability was not excessive in the circumstances.
Annual Report
Board Approval of Investment Advisory Contracts and
Management Fees - continued
Economies of Scale. The Board considered whether there have been economies of scale in respect of the management of the Fidelity funds, whether the Fidelity funds (including the fund) have appropriately benefited from any such economies of scale, and whether there is potential for realization of any further economies of scale. The Board considered the extent to which the fund will benefit from economies of scale through increased services to the fund, through waivers or reimbursements, or through fee or expense reductions. The Board also noted that in 2009, it and the board of other Fidelity funds created an ad hoc committee (the Economies of Scale Committee) to analyze whether FMR attains economies of scale in respect of the management and servicing of the Fidelity funds, whether the Fidelity funds have appropriately benefited from such economies of scale, and whether there is potential for realization of any further economies of scale.
The Board recognized that the fund's management contract incorporates a "group fee" structure, which provides for lower group fee rates as total fund assets under FMR's management increase, and for higher group fee rates as total fund assets under FMR's management decrease. FMR calculates the group fee rates based on a tiered asset "breakpoint" schedule that varies based on asset class. The Board considered that the group fee is designed to deliver the benefits of economies of scale to fund shareholders when total Fidelity fund assets increase, even if assets of any particular fund are unchanged or have declined, because some portion of Fidelity's costs are attributable to services provided to all Fidelity funds, and all funds benefit if those costs can be allocated among more assets. The Board concluded that, given the group fee structure, fund shareholders will benefit from lower management fees as assets under FMR's management increase at the fund complex level, regardless of whether Fidelity achieves any such economies of scale.
The Board concluded, taking into account the analysis of the Economies of Scale Committee, that economies of scale, if any, are being appropriately shared between fund shareholders and Fidelity.
Additional Information Requested by the Board. In order to develop fully the factual basis for consideration of the Fidelity funds' Advisory Contracts, the Board requested and received additional information on certain topics, including (i) fund performance trends, actions to be taken by FMR to improve certain funds' overall performance, and Fidelity's long-term strategies for certain funds; (ii) the potential to further rationalize the Fidelity fund lineup with the possibility of achieving savings for the funds and Fidelity; (iii) Fidelity's compensation structure for portfolio managers and other key investment personnel; (iv) the amount of the investment that each portfolio manager has made in the Fidelity fund(s) that he or she manages; (v) the realization of fall-out benefits in certain Fidelity business units; (vi) Fidelity's group fee structures, the potential impact of regulatory changes on such structures, and the rationale for the individual fee rates of certain funds; (vii) fund profitability methodology, including Fidelity's cost allocation methodology, and the impact of certain factors on fund profitability results; (viii) trends regarding industry use of performance fee structures and the possibility of implementing performance fee structures for additional funds; and (ix) the impact of net redemptions from the Fidelity funds.
Annual Report
Based on its evaluation of all of the conclusions noted above, and after considering all factors it believed relevant, the Board ultimately concluded that the advisory fee structures are fair and reasonable, and that the fund's Advisory Contracts should be renewed.
Annual Report
Investment Adviser
Fidelity Management & Research Company
Boston, MA
Investment Sub-Advisers
FMR Co., Inc.
Fidelity Management & Research
(U.K.) Inc.
Fidelity Management & Research
(Hong Kong) Limited
Fidelity Management & Research
(Japan) Inc.
General Distributor
Fidelity Distributors Corporation
Smithfield, RI
Transfer and Service Agents
Fidelity Investments Institutional
Operations Company, Inc.
Boston, MA
Fidelity Service Company, Inc.
Boston, MA
Custodian
Citibank, N.A.,
New York, NY
(Fidelity Investment logo)(registered trademark)
Corporate Headquarters
82 Devonshire St., Boston, MA 02109
www.fidelity.com
DGF-K-UANN-0912
1.863064.103
Fidelity®
Dividend Growth
Fund
Annual Report
July 31, 2012
(Fidelity Cover Art)
Contents
Performance | (Click Here) | How the fund has done over time. |
Management's Discussion of Fund Performance | (Click Here) | The Portfolio Manager's review of fund performance and strategy. |
Shareholder Expense Example | (Click Here) | An example of shareholder expenses. |
Investment Changes | (Click Here) | A summary of major shifts in the fund's investments over the past six months. |
Investments | (Click Here) | A complete list of the fund's investments with their market values. |
Financial Statements | (Click Here) | Statements of assets and liabilities, operations, and changes in net assets, as well as financial highlights. |
Notes | (Click Here) | Notes to the financial statements. |
Report of Independent Registered Public Accounting Firm | (Click Here) | |
Trustees and Officers | (Click Here) | |
Distributions | (Click Here) | |
Board Approval of Investment Advisory Contracts and Management Fees | (Click Here) | |
To view a fund's proxy voting guidelines and proxy voting record for the 12-month period ended June 30, visit http://www.fidelity.com/proxyvotingresults or visit the Securities and Exchange Commission's (SEC) web site at http://www.sec.gov. You may also call 1-800-544-8544 to request a free copy of the proxy voting guidelines.
Standard & Poor's, S&P and S&P 500 are registered service marks of The McGraw-Hill Companies, Inc. and have been licensed for use by Fidelity Distributors Corporation.
Other third party marks appearing herein are the property of their respective owners.
All other marks appearing herein are registered or unregistered trademarks or service marks of FMR LLC or an affiliated company. © 2012 FMR LLC. All rights reserved.
Annual Report
This report and the financial statements contained herein are submitted for the general information of the shareholders of the fund. This report is not authorized for distribution to prospective investors in the fund unless preceded or accompanied by an effective prospectus.
A fund files its complete schedule of portfolio holdings with the SEC for the first and third quarters of each fiscal year on Form N-Q. Forms N-Q are available on the SEC's web site at http://www.sec.gov. A fund's Forms N-Q may be reviewed and copied at the SEC's Public Reference Room in Washington, DC. Information regarding the operation of the SEC's Public Reference Room may be obtained by calling 1-800-SEC-0330. For a complete list of a fund's portfolio holdings, view the most recent holdings listing, semiannual report, or annual report on Fidelity's web site at http://www.fidelity.com, http://www.advisor.fidelity.com, or http://www.401k.com, as applicable.
NOT FDIC INSURED • MAY LOSE VALUE • NO BANK GUARANTEE
Neither the fund nor Fidelity Distributors Corporation is a bank.
Annual Report
Average annual total return reflects the change in the value of an investment, assuming reinvestment of the class' distributions from dividend income and capital gains (the profits earned upon the sale of securities that have grown in value, if any) and assuming a constant rate of performance each year. The $10,000 table and the fund's returns do not reflect the deduction of taxes that a shareholder would pay on fund distributions or the redemption of fund shares. During periods of reimbursement by Fidelity, a fund's total return will be greater than it would be had the reimbursement not occurred. How a fund did yesterday is no guarantee of how it will do tomorrow.
Average Annual Total Returns
Periods ended July 31, 2012 | Past 1
year | Past 5
years | Past 10
years |
Fidelity® Dividend Growth Fund | -0.67% | 0.66% | 5.32% |
$10,000 Over 10 Years
Let's say hypothetically that $10,000 was invested in Fidelity® Dividend Growth Fund, a class of the fund, on July 31, 2002. The chart shows how the value of your investment would have changed, and also shows how the S&P 500® Index performed over the same period.
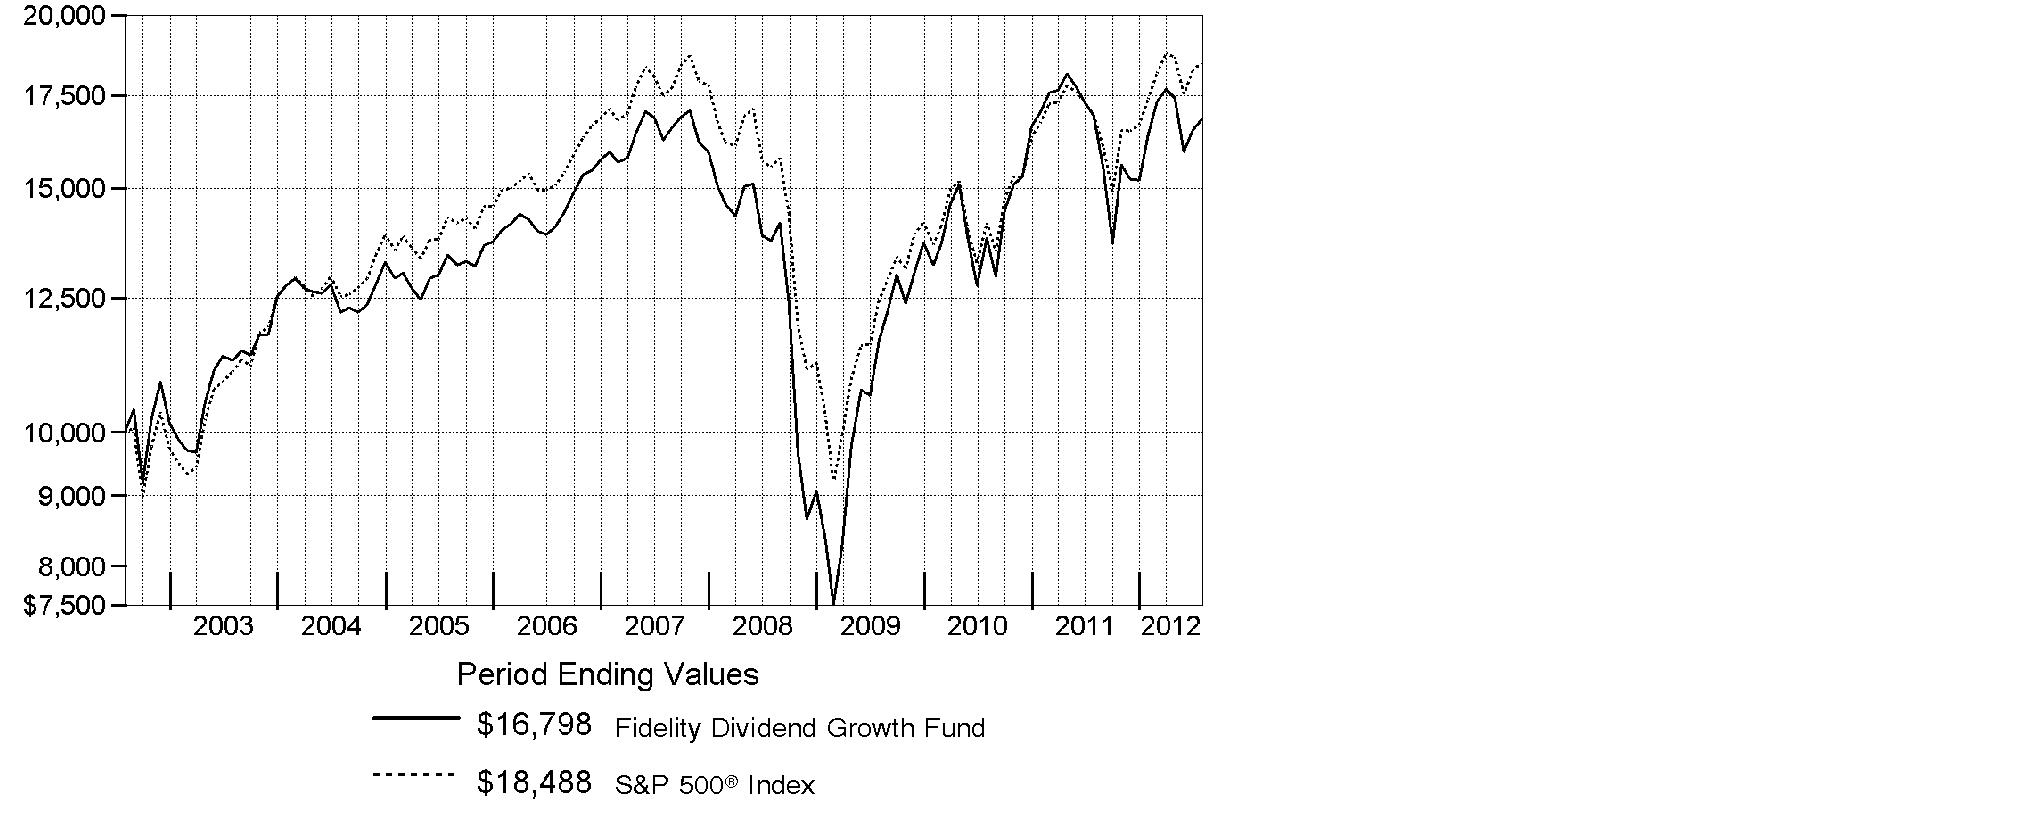
Annual Report
Market Recap: Major U.S. equity benchmarks posted solid gains for the year ending July 31, 2012, amid an uncertain investment environment. The broad-based S&P 500® Index returned 9.13%, while the blue-chip-laden Dow Jones Industrial AverageSM and technology-heavy Nasdaq Composite® Index gained 10.12% and 7.83%, respectively. Volatility spiked during the period's first half, as equities plummeted late last summer on Europe's debt woes, political wrangling over the U.S. debt ceiling and the sovereign credit-rating downgrade that followed. By October, a seemingly improved U.S. economy rejuvenated stocks, paving the way for major equity benchmarks to post their best first-quarter performance since 1998. However, more eurozone trouble, signs that the U.S. economy had turned sluggish and a slowdown in China caused stocks to slip in May, before a new wave of optimism took hold in June and July. Within the S&P 500®, more-defensive sectors such as telecommunication services (+30%) and consumer staples (+20%) fared best, while materials and energy significantly underperformed, returning -5%. Small-and mid-cap stocks trailed their less-volatile large-cap counterparts, with the Russell 2000® Index adding 0.19% and the Russell Midcap® Index rising 2.28%. Given turmoil and local currency weakness in Europe, foreign developed-markets stocks lost ground, with the MSCI® EAFE® Index returning -11.32%.
Comments from Lawrence Rakers, Portfolio Manager of Fidelity® Dividend Growth Fund: For the year, the fund's Retail Class shares returned -0.67%, considerably trailing the S&P 500. Versus the index, out-of-benchmark exposure to a number of small-cap stocks and underweighting larger-cap benchmark components worked against the fund. Among sectors, stock picking in energy, industrials, materials and consumer discretionary hurt the most. Additionally, the fund's foreign holdings weighed on performance, hampered in part by a stronger U.S. dollar. Three non-index holdings were significant detractors. Our position in Canada-based copper miner Ivanhoe Mines lost more than half of its value, as investor concern about decelerating global economic growth, triggered a decline in the price of copper, which hurt the stock. Green Mountain Coffee Roasters and commercial satellite imagery provider GeoEye also hampered performance. Having negligible exposure to telecommunication services carrier AT&T, which I sold during the period, and not owning pharmaceuticals provider Pfizer further detracted. Conversely, not having a stake in weak-performing index component Bank of America was beneficial. Three out-of-index positions also bolstered performance: ASML Holding, a Dutch manufacturer of semiconductor capital equipment, Australia-based energy provider InterOil and ARIAD Pharmaceuticals.
The views expressed above reflect those of the portfolio manager(s) only through the end of the period as stated on the cover of this report and do not necessarily represent the views of Fidelity or any other person in the Fidelity organization. Any such views are subject to change at any time based upon market or other conditions and Fidelity disclaims any responsibility to update such views. These views may not be relied on as investment advice and, because investment decisions for a Fidelity fund are based on numerous factors, may not be relied on as an indication of trading intent on behalf of any Fidelity fund.
Annual Report
Shareholder Expense Example
As a shareholder of the Fund, you incur two types of costs: (1) transaction costs, and (2) ongoing costs, including management fees and other Fund expenses. This Example is intended to help you understand your ongoing costs (in dollars) of investing in the Fund and to compare these costs with the ongoing costs of investing in other mutual funds.
The Example is based on an investment of $1,000 invested at the beginning of the period and held for the entire period (February 1, 2012 to July 31, 2012).
Actual Expenses
The first line of the accompanying table for each class of the Fund provides information about actual account values and actual expenses. You may use the information in this line, together with the amount you invested, to estimate the expenses that you paid over the period. Simply divide your account value by $1,000.00 (for example, an $8,600 account value divided by $1,000.00 = 8.6), then multiply the result by the number in the first line for a class of the Fund under the heading entitled "Expenses Paid During Period" to estimate the expenses you paid on your account during this period. A small balance maintenance fee of $12.00 that is charged once a year may apply for certain accounts with a value of less than $2,000. This fee is not included in the table below. If it was, the estimate of expenses you paid during the period would be higher, and your ending account value lower, by this amount. In addition, the Fund, as a shareholder in the underlying Fidelity Central Funds, will indirectly bear its pro-rata share of the fees and expenses incurred by the underlying Fidelity Central Funds. These fees and expenses are not included in the Fund's annualized expense ratio used to calculate the expense estimate in the table below.
Hypothetical Example for Comparison Purposes
The second line of the accompanying table for each class of the Fund provides information about hypothetical account values and hypothetical expenses based on a Class' actual expense ratio and an assumed rate of return of 5% per year before expenses, which is not the Class' actual return. The hypothetical account values and expenses may not be used to estimate the actual ending account balance or expenses you paid for the period. You may use this information to compare the ongoing costs of investing in the Fund and other funds. To do so, compare this 5% hypothetical example with the 5% hypothetical examples that appear in the shareholder reports of the other funds. A small balance maintenance fee of $12.00 that is charged once a year may apply for certain accounts with a value of less than $2,000. This fee is not included in the table below. If it was, the estimate of expenses you paid during the period would be higher, and your ending account value lower, by this amount. In addition, the Fund, as a shareholder in the underlying Fidelity Central Funds, will indirectly bear its pro-rata share of the fees and expenses incurred by the underlying Fidelity Central Funds. These fees and expenses are not included in the Fund's annualized expense ratio used to calculate the expense estimate in the table below.
Please note that the expenses shown in the table are meant to highlight your ongoing costs only and do not reflect any transaction costs. Therefore, the second line of the table is useful in comparing ongoing costs only, and will not help you determine the relative total costs of owning different funds.
Annual Report
Shareholder Expense Example - continued
| Annualized
Expense Ratio | Beginning
Account Value
February 1, 2012 | Ending
Account Value
July 31, 2012 | Expenses Paid
During Period*
February 1, 2012
to July 31, 2012 |
Dividend Growth | .85% | | | |
Actual | | $ 1,000.00 | $ 1,024.70 | $ 4.28 |
HypotheticalA | | $ 1,000.00 | $ 1,020.64 | $ 4.27 |
Class K | .72% | | | |
Actual | | $ 1,000.00 | $ 1,025.40 | $ 3.63 |
HypotheticalA | | $ 1,000.00 | $ 1,021.28 | $ 3.62 |
A 5% return per year before expenses
* Expenses are equal to each Class' annualized expense ratio, multiplied by the average account value over the period, multiplied by 182/366 (to reflect the one-half year period).
Annual Report
Investment Changes (Unaudited)
Top Ten Stocks as of July 31, 2012 |
| % of fund's
net assets | % of fund's net assets
6 months ago |
Apple, Inc. | 5.2 | 3.9 |
Wells Fargo & Co. | 1.8 | 1.6 |
Berkshire Hathaway, Inc. Class B | 1.6 | 0.1 |
The Coca-Cola Co. | 1.5 | 1.2 |
Johnson & Johnson | 1.3 | 0.0 |
Merck & Co., Inc. | 1.2 | 0.4 |
Philip Morris International, Inc. | 1.1 | 0.9 |
Procter & Gamble Co. | 1.1 | 1.4 |
National Oilwell Varco, Inc. | 1.0 | 0.8 |
Visa, Inc. Class A | 1.0 | 0.0 |
| 16.8 | |
Top Five Market Sectors as of July 31, 2012 |
| % of fund's
net assets | % of fund's net assets
6 months ago |
Information Technology | 20.9 | 18.5 |
Financials | 13.0 | 13.7 |
Health Care | 11.9 | 10.8 |
Consumer Discretionary | 11.7 | 11.9 |
Industrials | 11.6 | 13.7 |
Asset Allocation (% of fund's net assets) |
As of July 31, 2012 * | As of January 31, 2012 ** |
 | Stocks 97.3% | | | Stocks and Investment Companies 98.8% | |
 | Convertible
Securities 1.1% | | | Convertible
Securities 0.8% | |
 | Short-Term
Investments and
Net Other Assets (Liabilities) 1.6% | | | Short-Term
Investments and
Net Other Assets (Liabilities) 0.4% | |
* Foreign investments | 17.8% | | ** Foreign investments | 22.6% | |

Annual Report
Investments July 31, 2012
Showing Percentage of Net Assets
Common Stocks - 97.2% |
| Shares | | Value (000s) |
CONSUMER DISCRETIONARY - 11.6% |
Auto Components - 0.4% |
Delphi Automotive PLC | 270,300 | | $ 7,674 |
Gentex Corp. | 217,815 | | 3,487 |
Tenneco, Inc. (a) | 447,112 | | 13,096 |
TRW Automotive Holdings Corp. (a) | 206,683 | | 8,123 |
| | 32,380 |
Automobiles - 0.1% |
Harley-Davidson, Inc. | 133,899 | | 5,788 |
Winnebago Industries, Inc. (a)(d) | 507,068 | | 5,137 |
| | 10,925 |
Diversified Consumer Services - 0.3% |
American Public Education, Inc. (a)(d) | 145,562 | | 3,655 |
Anhanguera Educacional Participacoes SA | 840,000 | | 11,949 |
DeVry, Inc. | 334,728 | | 6,571 |
| | 22,175 |
Hotels, Restaurants & Leisure - 2.0% |
Bravo Brio Restaurant Group, Inc. (a) | 320,815 | | 5,797 |
Brinker International, Inc. | 905,163 | | 29,336 |
Club Mediterranee SA (a) | 541,223 | | 8,863 |
Darden Restaurants, Inc. | 40,590 | | 2,077 |
Denny's Corp. (a) | 4,185,041 | | 18,247 |
Dunkin' Brands Group, Inc. | 165,487 | | 5,011 |
Icahn Enterprises LP rights (a) | 1,067,316 | | 0 |
Ignite Restaurant Group, Inc. (a) | 29,100 | | 398 |
Jubilant Foodworks Ltd. (a) | 7,261 | | 147 |
Las Vegas Sands Corp. | 602,700 | | 21,950 |
Ruth's Hospitality Group, Inc. (a) | 922,300 | | 6,198 |
Sands China Ltd. | 108,800 | | 322 |
Spur Corp. Ltd. | 1,895,350 | | 3,928 |
Starbucks Corp. | 286,877 | | 12,990 |
Texas Roadhouse, Inc. Class A | 621,764 | | 10,763 |
Yum! Brands, Inc. | 269,930 | | 17,502 |
| | 143,529 |
Household Durables - 0.3% |
PulteGroup, Inc. (a) | 783,307 | | 8,851 |
Standard Pacific Corp. (a)(d) | 43,435 | | 246 |
Techtronic Industries Co. Ltd. | 5,510,500 | | 7,461 |
Woongjin Coway Co. Ltd. | 126,810 | | 3,970 |
| | 20,528 |
Common Stocks - continued |
| Shares | | Value (000s) |
CONSUMER DISCRETIONARY - continued |
Internet & Catalog Retail - 0.8% |
Amazon.com, Inc. (a) | 166,045 | | $ 38,738 |
Expedia, Inc. | 87,200 | | 4,970 |
Liberty Media Corp. Interactive Series A (a) | 539,879 | | 10,112 |
| | 53,820 |
Leisure Equipment & Products - 0.3% |
Brunswick Corp. | 165,565 | | 3,641 |
Hasbro, Inc. | 399,077 | | 14,295 |
Summer Infant, Inc. (a) | 476,174 | | 1,509 |
| | 19,445 |
Media - 2.4% |
Antena 3 de Television SA (d) | 1,139,439 | | 4,262 |
Comcast Corp. Class A | 1,604,370 | | 52,222 |
DISH Network Corp. Class A | 403,630 | | 12,416 |
MDC Partners, Inc. Class A (sub. vtg.) | 867,039 | | 8,159 |
Mood Media Corp. (a)(d) | 422,600 | | 1,171 |
Mood Media Corp. (a)(h) | 2,002,900 | | 5,552 |
The Walt Disney Co. | 857,198 | | 42,123 |
Time Warner Cable, Inc. | 11,000 | | 934 |
Time Warner, Inc. | 1,037,666 | | 40,593 |
Valassis Communications, Inc. (a) | 36,300 | | 819 |
Virgin Media, Inc. | 40,000 | | 1,095 |
| | 169,346 |
Multiline Retail - 0.1% |
PPR SA | 60,754 | | 9,120 |
The Bon-Ton Stores, Inc. | 187,900 | | 1,240 |
| | 10,360 |
Specialty Retail - 3.8% |
Advance Auto Parts, Inc. | 489,367 | | 34,329 |
American Eagle Outfitters, Inc. | 131,863 | | 2,745 |
Ascena Retail Group, Inc. (a) | 385,653 | | 7,073 |
AutoZone, Inc. (a) | 51,240 | | 19,227 |
Bed Bath & Beyond, Inc. (a) | 192,653 | | 11,742 |
Best Buy Co., Inc. | 518,642 | | 9,382 |
Big 5 Sporting Goods Corp. | 416,900 | | 3,143 |
Body Central Corp. (a)(e) | 1,023,708 | | 10,585 |
Express, Inc. (a) | 1,111,241 | | 17,891 |
Fast Retailing Co. Ltd. | 29,300 | | 6,017 |
Foot Locker, Inc. | 218,768 | | 7,224 |
Foschini Ltd. | 495,308 | | 8,529 |
Common Stocks - continued |
| Shares | | Value (000s) |
CONSUMER DISCRETIONARY - continued |
Specialty Retail - continued |
GameStop Corp. Class A | 296,878 | | $ 4,756 |
GNC Holdings, Inc. | 7,300 | | 281 |
Home Depot, Inc. | 979,736 | | 51,123 |
Inditex SA | 7,437 | | 767 |
Limited Brands, Inc. | 397,652 | | 18,908 |
Lowe's Companies, Inc. | 1,215,848 | | 30,846 |
MarineMax, Inc. (a) | 189,740 | | 1,412 |
SuperGroup PLC (a)(d) | 1,436,787 | | 9,422 |
TJX Companies, Inc. | 399,454 | | 17,688 |
| | 273,090 |
Textiles, Apparel & Luxury Goods - 1.1% |
Deckers Outdoor Corp. (a)(d) | 77,644 | | 3,239 |
G-III Apparel Group Ltd. (a) | 469,443 | | 11,534 |
Iconix Brand Group, Inc. (a) | 301,301 | | 5,342 |
lululemon athletica, Inc. (a) | 79,838 | | 4,509 |
NIKE, Inc. Class B | 202,506 | | 18,904 |
PVH Corp. | 230,256 | | 18,289 |
Vera Bradley, Inc. (a)(d) | 353,879 | | 8,065 |
VF Corp. | 35,568 | | 5,310 |
| | 75,192 |
TOTAL CONSUMER DISCRETIONARY | | 830,790 |
CONSUMER STAPLES - 9.7% |
Beverages - 2.4% |
Anheuser-Busch InBev SA NV | 14,900 | | 1,179 |
Britvic PLC | 36,300 | | 171 |
Cott Corp. (a) | 1,155,800 | | 9,796 |
Dr Pepper Snapple Group, Inc. | 591,760 | | 26,972 |
Grupo Modelo SAB de CV Series C | 1,599,100 | | 14,420 |
SABMiller PLC | 184,500 | | 7,975 |
The Coca-Cola Co. | 1,350,413 | | 109,113 |
| | 169,626 |
Food & Staples Retailing - 2.1% |
Costco Wholesale Corp. | 110,017 | | 10,581 |
CVS Caremark Corp. | 1,349,238 | | 61,053 |
Eurocash SA | 669,195 | | 7,852 |
Rami Levi Chain Stores Hashikma Marketing 2006 Ltd. | 14,950 | | 381 |
Wal-Mart Stores, Inc. | 911,277 | | 67,826 |
| | 147,693 |
Common Stocks - continued |
| Shares | | Value (000s) |
CONSUMER STAPLES - continued |
Food Products - 1.1% |
Flowers Foods, Inc. | 541,849 | | $ 11,579 |
Green Mountain Coffee Roasters, Inc. (a) | 367,137 | | 6,704 |
Hilton Food Group PLC | 148,789 | | 629 |
Kraft Foods, Inc. Class A | 1,390,644 | | 55,222 |
Marine Harvest ASA (a) | 1,633,478 | | 1,092 |
The J.M. Smucker Co. | 87,046 | | 6,685 |
| | 81,911 |
Household Products - 1.6% |
Colgate-Palmolive Co. | 103,300 | | 11,090 |
Procter & Gamble Co. | 1,168,394 | | 75,408 |
Reckitt Benckiser Group PLC | 325,100 | | 17,875 |
Unicharm Corp. | 235,500 | | 12,974 |
| | 117,347 |
Personal Products - 0.2% |
Estee Lauder Companies, Inc. Class A | 99,550 | | 5,214 |
Hengan International Group Co. Ltd. | 692,000 | | 6,568 |
| | 11,782 |
Tobacco - 2.3% |
Altria Group, Inc. | 813,020 | | 29,244 |
British American Tobacco PLC (United Kingdom) | 271,700 | | 14,431 |
Imperial Tobacco Group PLC | 307,049 | | 11,934 |
KT&G Corp. | 7,436 | | 548 |
Lorillard, Inc. | 211,211 | | 27,170 |
Philip Morris International, Inc. | 890,466 | | 81,424 |
| | 164,751 |
TOTAL CONSUMER STAPLES | | 693,110 |
ENERGY - 11.3% |
Energy Equipment & Services - 4.0% |
BW Offshore Ltd. | 9,997,526 | | 9,205 |
Cal Dive International, Inc. (a)(d) | 1,703,683 | | 2,760 |
Cameron International Corp. (a) | 494,811 | | 24,874 |
Cathedral Energy Services Ltd. | 1,248,200 | | 7,095 |
Essential Energy Services Ltd. | 3,982,500 | | 8,459 |
Forum Energy Technologies, Inc. | 40,553 | | 845 |
Fugro NV (Certificaten Van Aandelen) unit | 61,800 | | 4,049 |
Halliburton Co. | 687,764 | | 22,786 |
McDermott International, Inc. (a) | 1,076,784 | | 12,598 |
Common Stocks - continued |
| Shares | | Value (000s) |
ENERGY - continued |
Energy Equipment & Services - continued |
National Oilwell Varco, Inc. | 974,975 | | $ 70,491 |
Noble Corp. | 685,608 | | 25,367 |
SBM Offshore NV (a) | 812,000 | | 9,915 |
Schlumberger Ltd. | 766,091 | | 54,592 |
TETRA Technologies, Inc. (a) | 767,284 | | 5,317 |
Tuscany International Drilling, Inc. (a) | 5,159,671 | | 1,672 |
Unit Corp. (a) | 114,078 | | 4,536 |
Vantage Drilling Co. (a) | 5,769,678 | | 9,058 |
Weatherford International Ltd. (a) | 623,514 | | 7,513 |
Xtreme Drilling & Coil Services Corp. (a) | 2,095,460 | | 3,469 |
| | 284,601 |
Oil, Gas & Consumable Fuels - 7.3% |
Alon USA Energy, Inc. | 784,510 | | 8,567 |
Alpha Natural Resources, Inc. (a) | 199,700 | | 1,400 |
Americas Petrogas, Inc. (a) | 2,225,900 | | 4,128 |
Americas Petrogas, Inc. (f) | 2,665,500 | | 4,944 |
Amyris, Inc. (a)(d) | 941,492 | | 3,644 |
Anadarko Petroleum Corp. | 349,409 | | 24,263 |
Apache Corp. | 233,346 | | 20,096 |
Bonavista Energy Corp. | 14,800 | | 269 |
Bonavista Energy Corp. (f) | 152,100 | | 2,765 |
BPZ Energy, Inc. (a)(d) | 2,421,078 | | 5,520 |
Cabot Oil & Gas Corp. | 191,000 | | 8,058 |
Chesapeake Energy Corp. | 493,646 | | 9,290 |
Chevron Corp. | 306,929 | | 33,633 |
Crew Energy, Inc. (a) | 646,100 | | 4,458 |
Crown Point Energy, Inc. (a) | 942,800 | | 376 |
Crown Point Ventures Ltd. (a)(f) | 4,157,416 | | 1,658 |
Denbury Resources, Inc. (a) | 396,621 | | 5,997 |
Double Eagle Petroleum Co. (a)(e) | 912,603 | | 3,787 |
Energen Corp. | 7,300 | | 374 |
EOG Resources, Inc. | 81,095 | | 7,948 |
EQT Corp. | 204,550 | | 11,537 |
Gran Tierra Energy, Inc. (Canada) (a) | 1,321,700 | | 6,049 |
Halcon Resources Corp. (h) | 910,000 | | 6,006 |
Hess Corp. | 54,500 | | 2,570 |
HollyFrontier Corp. | 445,634 | | 16,662 |
InterOil Corp. (a)(d) | 509,153 | | 43,604 |
Madalena Ventures, Inc. (a) | 1,468,000 | | 468 |
Marathon Petroleum Corp. | 477,488 | | 22,585 |
Common Stocks - continued |
| Shares | | Value (000s) |
ENERGY - continued |
Oil, Gas & Consumable Fuels - continued |
Markwest Energy Partners LP | 134,300 | | $ 7,060 |
Niko Resources Ltd. | 163,400 | | 2,804 |
Northern Oil & Gas, Inc. (a)(d) | 1,851,439 | | 29,179 |
Northern Tier Energy LP Class A | 591,800 | | 9,131 |
Occidental Petroleum Corp. | 463,437 | | 40,333 |
Painted Pony Petroleum Ltd. (a)(f) | 178,000 | | 1,660 |
Painted Pony Petroleum Ltd. Class A (a) | 435,700 | | 4,062 |
Paladin Energy Ltd. (Australia) (a)(d) | 5,703,939 | | 7,013 |
Pan Orient Energy Corp. (a) | 739,800 | | 2,855 |
Peabody Energy Corp. | 531,600 | | 11,100 |
PetroBakken Energy Ltd. Class A | 94,400 | | 1,172 |
Petrominerales Ltd. | 312,000 | | 2,887 |
Phillips 66 | 376,335 | | 14,150 |
Pioneer Natural Resources Co. | 70,733 | | 6,269 |
Resolute Energy Corp. (a)(d) | 1,326,032 | | 11,497 |
Rosetta Resources, Inc. (a) | 18,204 | | 759 |
Royal Dutch Shell PLC Class A sponsored ADR | 313,936 | | 21,410 |
SM Energy Co. | 74,049 | | 3,487 |
Southwestern Energy Co. (a) | 205,282 | | 6,826 |
Suncor Energy, Inc. | 87,400 | | 2,672 |
TAG Oil Ltd. (a) | 1,603,400 | | 11,208 |
TAG Oil Ltd. (f) | 146,900 | | 1,027 |
Targa Resources Corp. | 131,500 | | 5,793 |
Tesoro Corp. | 535,763 | | 14,814 |
Voyager Oil & Gas, Inc. (a)(d) | 2,798,269 | | 3,162 |
Voyager Oil & Gas, Inc. warrants 2/4/16 (a) | 1,198,388 | | 96 |
Williams Companies, Inc. | 1,115,202 | | 35,452 |
| | 518,534 |
TOTAL ENERGY | | 803,135 |
FINANCIALS - 12.7% |
Capital Markets - 1.5% |
Ameriprise Financial, Inc. | 77,600 | | 4,013 |
Ares Capital Corp. | 843,880 | | 14,034 |
BlackRock, Inc. Class A | 72,832 | | 12,400 |
GP Investments Ltd. (depositary receipt) (a) | 3,230,579 | | 6,448 |
ICAP PLC | 1,339,900 | | 6,689 |
ICG Group, Inc. (a) | 512,336 | | 4,580 |
Invesco Ltd. | 538,787 | | 11,923 |
KKR & Co. LP | 414,055 | | 5,793 |
Common Stocks - continued |
| Shares | | Value (000s) |
FINANCIALS - continued |
Capital Markets - continued |
Knight Capital Group, Inc. Class A (a) | 1,126,297 | | $ 11,635 |
Monex Group, Inc. | 22,026 | | 3,574 |
Morgan Stanley | 780,861 | | 10,667 |
State Street Corp. | 363,973 | | 14,697 |
The Blackstone Group LP | 72,600 | | 1,006 |
| | 107,459 |
Commercial Banks - 3.6% |
Banco Pine SA | 997,744 | | 6,539 |
Bank of Ireland (a) | 29,363,209 | | 3,585 |
Barclays PLC | 1,016,640 | | 2,648 |
CIT Group, Inc. (a) | 513,598 | | 18,757 |
Comerica, Inc. | 227,800 | | 6,882 |
Commercial Bank of Qatar GDR (Reg. S) | 948,915 | | 3,633 |
Guaranty Trust Bank PLC GDR (Reg. S) | 731,523 | | 4,243 |
KeyCorp | 934,900 | | 7,461 |
Regions Financial Corp. | 3,240,692 | | 22,555 |
U.S. Bancorp | 1,445,465 | | 48,423 |
Wells Fargo & Co. | 3,895,291 | | 131,700 |
| | 256,426 |
Consumer Finance - 0.6% |
Capital One Financial Corp. | 634,830 | | 35,862 |
International Personal Finance PLC | 1,642,400 | | 7,210 |
| | 43,072 |
Diversified Financial Services - 2.0% |
Citigroup, Inc. | 1,482,770 | | 40,228 |
CME Group, Inc. | 263,635 | | 13,738 |
JPMorgan Chase & Co. | 1,552,854 | | 55,903 |
PICO Holdings, Inc. (a)(e) | 1,405,013 | | 33,875 |
| | 143,744 |
Insurance - 3.0% |
AEGON NV | 1,383,727 | | 6,281 |
AFLAC, Inc. | 343,551 | | 15,041 |
Allied World Assurance Co. Holdings Ltd. | 118,600 | | 8,946 |
Assured Guaranty Ltd. | 2,212,304 | | 26,503 |
Berkshire Hathaway, Inc. Class B (a) | 1,305,276 | | 110,740 |
Lincoln National Corp. | 186,842 | | 3,746 |
MetLife, Inc. | 918,717 | | 28,269 |
Prudential Financial, Inc. | 273,016 | | 13,181 |
| | 212,707 |
Common Stocks - continued |
| Shares | | Value (000s) |
FINANCIALS - continued |
Real Estate Investment Trusts - 1.6% |
American Tower Corp. | 229,713 | | $ 16,611 |
Beni Stabili SpA SIIQ | 13,576,500 | | 6,212 |
CBL & Associates Properties, Inc. | 1,171,549 | | 23,115 |
Douglas Emmett, Inc. | 463,359 | | 10,894 |
Education Realty Trust, Inc. | 933,600 | | 10,942 |
Franklin Street Properties Corp. | 497,800 | | 5,162 |
Lexington Corporate Properties Trust | 678,700 | | 6,068 |
Prologis, Inc. | 484,130 | | 15,652 |
SL Green Realty Corp. | 195,070 | | 15,362 |
Sovran Self Storage, Inc. | 54,487 | | 3,111 |
Vornado Realty Trust | 43,900 | | 3,666 |
| | 116,795 |
Real Estate Management & Development - 0.4% |
CBRE Group, Inc. (a) | 1,344,677 | | 20,950 |
Forest City Enterprises, Inc. Class A (a) | 292,106 | | 4,122 |
LSL Property Services PLC | 176,816 | | 610 |
| | 25,682 |
TOTAL FINANCIALS | | 905,885 |
HEALTH CARE - 11.9% |
Biotechnology - 3.7% |
Alnylam Pharmaceuticals, Inc. (a) | 716,200 | | 13,386 |
Amgen, Inc. | 459,009 | | 37,914 |
ARIAD Pharmaceuticals, Inc. (a) | 1,619,584 | | 30,983 |
AVEO Pharmaceuticals, Inc. (a)(d) | 1,032,309 | | 13,523 |
Biogen Idec, Inc. (a) | 143,300 | | 20,897 |
Biovitrum AB (a) | 1,889,028 | | 6,611 |
Dynavax Technologies Corp. (a) | 3,717,870 | | 14,351 |
Gentium SpA sponsored ADR (a) | 324,845 | | 3,265 |
Gilead Sciences, Inc. (a) | 444,854 | | 24,169 |
Grifols SA ADR | 253,400 | | 5,656 |
Horizon Pharma, Inc. (d) | 316,293 | | 1,806 |
Horizon Pharma, Inc. (h) | 1,015,612 | | 5,799 |
Horizon Pharma, Inc. warrants 2/28/17 (a)(h) | 253,903 | | 400 |
Infinity Pharmaceuticals, Inc. (a) | 181,620 | | 3,171 |
InterMune, Inc. (a)(d) | 614,172 | | 5,423 |
Isis Pharmaceuticals, Inc. (a) | 331,000 | | 4,012 |
Merrimack Pharmaceuticals, Inc. (d) | 249,200 | | 1,986 |
Common Stocks - continued |
| Shares | | Value (000s) |
HEALTH CARE - continued |
Biotechnology - continued |
NPS Pharmaceuticals, Inc. (a) | 506,635 | | $ 3,906 |
Synageva BioPharma Corp. (a) | 142,286 | | 7,123 |
Synta Pharmaceuticals Corp. (a) | 7,300 | | 54 |
Theravance, Inc. (a) | 917,861 | | 26,737 |
Thrombogenics NV (a) | 398,797 | | 12,871 |
Vertex Pharmaceuticals, Inc. (a) | 59,100 | | 2,867 |
ZIOPHARM Oncology, Inc. (a)(d) | 2,189,550 | | 12,327 |
| | 259,237 |
Health Care Equipment & Supplies - 0.8% |
Analogic Corp. | 7,400 | | 474 |
Baxter International, Inc. | 211,147 | | 12,354 |
Boston Scientific Corp. (a) | 1,531,100 | | 7,916 |
C.R. Bard, Inc. | 29,348 | | 2,854 |
Covidien PLC | 232,484 | | 12,991 |
Genmark Diagnostics, Inc. (a) | 807,700 | | 4,564 |
Nakanishi, Inc. | 42,300 | | 4,370 |
Opto Circuits India Ltd. | 1,137,349 | | 3,149 |
Sirona Dental Systems, Inc. (a) | 210,922 | | 9,118 |
| | 57,790 |
Health Care Providers & Services - 3.4% |
Accretive Health, Inc. (a) | 872,328 | | 11,846 |
Brookdale Senior Living, Inc. (a) | 1,932,000 | | 31,801 |
Centene Corp. (a) | 308,474 | | 11,734 |
Chemed Corp. | 132,551 | | 8,320 |
CIGNA Corp. | 541,181 | | 21,799 |
Corvel Corp. (a) | 29,036 | | 1,340 |
DaVita, Inc. (a) | 140,079 | | 13,787 |
Emeritus Corp. (a) | 603,933 | | 10,237 |
Express Scripts Holding Co. (a) | 626,389 | | 36,293 |
Humana, Inc. | 97,116 | | 5,982 |
McKesson Corp. | 331,454 | | 30,073 |
MEDNAX, Inc. (a) | 58,121 | | 3,844 |
Sunrise Senior Living, Inc. (a) | 89,228 | | 596 |
UnitedHealth Group, Inc. | 733,430 | | 37,471 |
WellPoint, Inc. | 344,559 | | 18,362 |
| | 243,485 |
Common Stocks - continued |
| Shares | | Value (000s) |
HEALTH CARE - continued |
Life Sciences Tools & Services - 0.4% |
Agilent Technologies, Inc. | 559,968 | | $ 21,441 |
Charles River Laboratories International, Inc. (a) | 214,269 | | 7,292 |
| | 28,733 |
Pharmaceuticals - 3.6% |
AVANIR Pharmaceuticals Class A (a)(d) | 1,508,431 | | 4,314 |
Biodelivery Sciences International, Inc. (a) | 32,913 | | 156 |
Cadence Pharmaceuticals, Inc. (a)(d) | 3,867,920 | | 16,400 |
Cardiome Pharma Corp. (a) | 2,305,800 | | 738 |
Elan Corp. PLC sponsored ADR (a) | 527,000 | | 6,087 |
Eli Lilly & Co. | 243,300 | | 10,712 |
Impax Laboratories, Inc. (a) | 292,896 | | 6,508 |
Jazz Pharmaceuticals PLC (a) | 158,400 | | 7,614 |
Johnson & Johnson | 1,299,974 | | 89,984 |
Merck & Co., Inc. | 1,984,053 | | 87,636 |
Novo Nordisk A/S Series B | 137,937 | | 21,268 |
Watson Pharmaceuticals, Inc. (a) | 77,792 | | 6,055 |
| | 257,472 |
TOTAL HEALTH CARE | | 846,717 |
INDUSTRIALS - 11.4% |
Aerospace & Defense - 2.6% |
DigitalGlobe, Inc. (a) | 635,974 | | 12,382 |
GeoEye, Inc. (a)(e) | 1,254,884 | | 31,912 |
Honeywell International, Inc. | 445,030 | | 25,834 |
Meggitt PLC | 2,825,241 | | 16,987 |
Precision Castparts Corp. | 105,105 | | 16,350 |
Raytheon Co. | 325,226 | | 18,044 |
Textron, Inc. | 789,832 | | 20,575 |
Ultra Electronics Holdings PLC | 186,989 | | 4,307 |
United Technologies Corp. | 562,726 | | 41,889 |
| | 188,280 |
Air Freight & Logistics - 0.8% |
FedEx Corp. | 10,910 | | 985 |
Pacer International, Inc. (a) | 697,415 | | 2,929 |
United Parcel Service, Inc. Class B | 714,773 | | 54,044 |
| | 57,958 |
Building Products - 0.5% |
Armstrong World Industries, Inc. | 89,140 | | 3,445 |
Common Stocks - continued |
| Shares | | Value (000s) |
INDUSTRIALS - continued |
Building Products - continued |
Lennox International, Inc. | 113,786 | | $ 4,969 |
Owens Corning (a) | 801,907 | | 21,539 |
Quanex Building Products Corp. | 482,339 | | 8,152 |
| | 38,105 |
Commercial Services & Supplies - 0.9% |
Corrections Corp. of America | 467,000 | | 14,514 |
Multiplus SA | 533,600 | | 12,876 |
Republic Services, Inc. | 568,005 | | 16,432 |
Steelcase, Inc. Class A | 1,239,263 | | 10,620 |
Swisher Hygiene, Inc. (a) | 2,081,064 | | 3,765 |
Swisher Hygiene, Inc. (Canada) (a) | 1,367,162 | | 2,748 |
The Geo Group, Inc. (a) | 110,000 | | 2,543 |
US Ecology, Inc. | 61,700 | | 1,203 |
| | 64,701 |
Construction & Engineering - 0.8% |
AECOM Technology Corp. (a) | 589,479 | | 9,555 |
Fluor Corp. | 361,680 | | 17,932 |
Foster Wheeler AG (a) | 1,116,695 | | 20,145 |
MasTec, Inc. (a) | 689,614 | | 11,006 |
Quanta Services, Inc. (a) | 18,600 | | 428 |
| | 59,066 |
Electrical Equipment - 1.6% |
Alstom SA | 362,367 | | 12,056 |
AMETEK, Inc. | 315,198 | | 9,771 |
Emerson Electric Co. | 503,905 | | 24,072 |
GrafTech International Ltd. (a) | 1,283,396 | | 13,411 |
Hubbell, Inc. Class B | 92,642 | | 7,623 |
Prysmian SpA | 813,700 | | 13,085 |
Regal-Beloit Corp. | 404,468 | | 26,036 |
Roper Industries, Inc. | 75,739 | | 7,532 |
| | 113,586 |
Industrial Conglomerates - 0.1% |
Reunert Ltd. | 495,947 | | 4,797 |
Machinery - 2.3% |
Actuant Corp. Class A | 498,002 | | 14,173 |
Colfax Corp. (a) | 215,542 | | 6,238 |
Cummins, Inc. | 156,384 | | 14,997 |
Dover Corp. | 158,995 | | 8,660 |
Common Stocks - continued |
| Shares | | Value (000s) |
INDUSTRIALS - continued |
Machinery - continued |
EVA Precision Industrial Holdings Ltd. | 3,672,000 | | $ 279 |
Fiat Industrial SpA | 2,911,405 | | 28,658 |
GEA Group AG | 22,102 | | 597 |
Illinois Tool Works, Inc. | 302,448 | | 16,435 |
Ingersoll-Rand PLC | 592,811 | | 25,141 |
Manitowoc Co., Inc. (d) | 957,037 | | 11,484 |
Navistar International Corp. (a) | 109,932 | | 2,704 |
Stanley Black & Decker, Inc. | 296,481 | | 19,832 |
Timken Co. | 194,581 | | 7,044 |
Valmont Industries, Inc. | 59,985 | | 7,431 |
| | 163,673 |
Marine - 0.1% |
Kirby Corp. (a) | 73,723 | | 3,890 |
Ultrapetrol (Bahamas) Ltd. (a) | 797,900 | | 726 |
| | 4,616 |
Professional Services - 0.5% |
Michael Page International PLC | 111,479 | | 642 |
Qualicorp SA (a) | 655,000 | | 5,833 |
Randstad Holding NV | 446,500 | | 13,553 |
Robert Half International, Inc. | 379,515 | | 10,251 |
SR Teleperformance SA | 238,130 | | 5,875 |
| | 36,154 |
Road & Rail - 0.9% |
J.B. Hunt Transport Services, Inc. | 125,181 | | 6,887 |
Norfolk Southern Corp. | 197,400 | | 14,617 |
Union Pacific Corp. | 309,865 | | 37,993 |
Universal Truckload Services, Inc. | 284,651 | | 4,238 |
| | 63,735 |
Trading Companies & Distributors - 0.3% |
Houston Wire & Cable Co. | 446,305 | | 5,110 |
Rush Enterprises, Inc. Class A (a) | 268,323 | | 4,333 |
Watsco, Inc. | 170,380 | | 11,576 |
| | 21,019 |
TOTAL INDUSTRIALS | | 815,690 |
INFORMATION TECHNOLOGY - 20.8% |
Communications Equipment - 1.7% |
Brocade Communications Systems, Inc. (a) | 1,565,104 | | 7,779 |
Common Stocks - continued |
| Shares | | Value (000s) |
INFORMATION TECHNOLOGY - continued |
Communications Equipment - continued |
Cisco Systems, Inc. | 2,951,875 | | $ 47,082 |
Harris Corp. | 36,800 | | 1,533 |
Motorola Solutions, Inc. | 284,997 | | 13,777 |
Polycom, Inc. (a) | 994,368 | | 8,691 |
QUALCOMM, Inc. | 242,222 | | 14,456 |
Riverbed Technology, Inc. (a) | 947,834 | | 16,720 |
ViaSat, Inc. (a) | 298,212 | | 11,422 |
| | 121,460 |
Computers & Peripherals - 5.4% |
Apple, Inc. | 615,203 | | 375,752 |
Gemalto NV (d) | 168,763 | | 12,934 |
| | 388,686 |
Electronic Equipment & Components - 1.3% |
Arrow Electronics, Inc. (a) | 382,925 | | 12,924 |
Avnet, Inc. (a) | 639,678 | | 20,150 |
Corning, Inc. | 1,918,921 | | 21,895 |
Flextronics International Ltd. (a) | 669,751 | | 4,293 |
Jabil Circuit, Inc. | 353,852 | | 7,679 |
Molex, Inc. (d) | 464,025 | | 11,656 |
TE Connectivity Ltd. | 426,556 | | 14,081 |
| | 92,678 |
Internet Software & Services - 0.8% |
Baidu.com, Inc. sponsored ADR (a) | 69,023 | | 8,319 |
Cornerstone OnDemand, Inc. (a) | 80,743 | | 1,920 |
Facebook, Inc. Class B (a)(h) | 488,526 | | 9,545 |
Google, Inc. Class A (a) | 26,073 | | 16,503 |
QuinStreet, Inc. (a) | 661,811 | | 6,003 |
Velti PLC (a)(d) | 859,700 | | 4,685 |
Yahoo!, Inc. (a) | 482,000 | | 7,635 |
| | 54,610 |
IT Services - 4.1% |
Accenture PLC Class A | 205,353 | | 12,383 |
Acxiom Corp. (a) | 181,824 | | 3,049 |
Amdocs Ltd. | 249,754 | | 7,430 |
Cognizant Technology Solutions Corp. Class A (a) | 581,020 | | 32,985 |
EPAM Systems, Inc. | 174,900 | | 2,805 |
ExlService Holdings, Inc. (a) | 290,527 | | 7,161 |
Fidelity National Information Services, Inc. | 495,835 | | 15,589 |
Fiserv, Inc. (a) | 186,613 | | 13,087 |
Common Stocks - continued |
| Shares | | Value (000s) |
INFORMATION TECHNOLOGY - continued |
IT Services - continued |
Heartland Payment Systems, Inc. | 232,300 | | $ 7,364 |
IBM Corp. | 276,792 | | 54,246 |
Jack Henry & Associates, Inc. | 37,215 | | 1,292 |
MasterCard, Inc. Class A | 38,923 | | 16,993 |
Maximus, Inc. | 30,155 | | 1,523 |
Redecard SA | 277,800 | | 4,480 |
ServiceSource International, Inc. (a) | 1,165,625 | | 13,148 |
Total System Services, Inc. | 32,900 | | 778 |
Unisys Corp. (a) | 1,114,203 | | 21,649 |
Virtusa Corp. (a) | 304,842 | | 4,618 |
Visa, Inc. Class A | 539,028 | | 69,572 |
| | 290,152 |
Office Electronics - 0.3% |
Xerox Corp. | 2,853,381 | | 19,774 |
Semiconductors & Semiconductor Equipment - 4.7% |
Altera Corp. | 14,500 | | 514 |
Analog Devices, Inc. | 429,940 | | 16,802 |
Applied Micro Circuits Corp. (a) | 364,735 | | 2,086 |
ASML Holding NV | 1,024,463 | | 58,907 |
Avago Technologies Ltd. | 573,809 | | 21,231 |
Cirrus Logic, Inc. (a) | 672,246 | | 24,718 |
Cymer, Inc. (a) | 561,231 | | 32,108 |
Entropic Communications, Inc. (a)(d) | 1,286,129 | | 7,717 |
Freescale Semiconductor Holdings I Ltd. (a) | 1,598,319 | | 17,054 |
LTX-Credence Corp. (a)(e) | 2,542,696 | | 14,900 |
Maxim Integrated Products, Inc. | 644,151 | | 17,540 |
Micron Technology, Inc. (a) | 1,526,488 | | 9,479 |
Monolithic Power Systems, Inc. (a) | 21,800 | | 422 |
NXP Semiconductors NV (a) | 1,066,264 | | 24,087 |
ON Semiconductor Corp. (a) | 1,655,446 | | 11,489 |
RF Micro Devices, Inc. (a) | 4,132,045 | | 16,032 |
Samsung Electronics Co. Ltd. | 21,459 | | 24,844 |
Skyworks Solutions, Inc. (a) | 1,055,475 | | 30,535 |
Spansion, Inc. Class A | 497,281 | | 5,097 |
| | 335,562 |
Software - 2.5% |
Adobe Systems, Inc. (a) | 151,967 | | 4,693 |
Autodesk, Inc. (a) | 189,700 | | 6,435 |
Check Point Software Technologies Ltd. (a) | 185,100 | | 8,990 |
Citrix Systems, Inc. (a) | 392,611 | | 28,535 |
Common Stocks - continued |
| Shares | | Value (000s) |
INFORMATION TECHNOLOGY - continued |
Software - continued |
Comverse Technology, Inc. (a) | 3,632,060 | | $ 19,722 |
Electronic Arts, Inc. (a) | 317,190 | | 3,495 |
Ellie Mae, Inc. (a) | 18,132 | | 372 |
JDA Software Group, Inc. (a) | 198,523 | | 5,872 |
Microsoft Corp. | 1,637,749 | | 48,264 |
Nuance Communications, Inc. (a) | 351,931 | | 7,162 |
Opnet Technologies, Inc. | 268,277 | | 7,093 |
Oracle Corp. | 969,607 | | 29,282 |
Royalblue Group PLC | 41,674 | | 916 |
VMware, Inc. Class A (a) | 98,200 | | 8,913 |
| | 179,744 |
TOTAL INFORMATION TECHNOLOGY | | 1,482,666 |
MATERIALS - 4.1% |
Chemicals - 2.1% |
Air Products & Chemicals, Inc. | 48,749 | | 3,921 |
Albemarle Corp. | 43,600 | | 2,538 |
Ashland, Inc. | 156,993 | | 11,051 |
CF Industries Holdings, Inc. | 20,722 | | 4,057 |
Clariant AG (Reg.) | 2,171,280 | | 22,974 |
Kraton Performance Polymers, Inc. (a) | 182,723 | | 4,279 |
LyondellBasell Industries NV Class A | 456,157 | | 20,313 |
Monsanto Co. | 10,200 | | 873 |
PetroLogistics LP | 1,096,560 | | 13,553 |
Spartech Corp. (a) | 1,386,259 | | 7,056 |
The Mosaic Co. | 152,410 | | 8,857 |
W.R. Grace & Co. (a) | 828,876 | | 46,450 |
| | 145,922 |
Construction Materials - 0.1% |
HeidelbergCement Finance AG | 107,913 | | 5,027 |
Containers & Packaging - 0.2% |
Nampak Ltd. | 2,604,800 | | 8,184 |
Rock-Tenn Co. Class A | 128,497 | | 7,481 |
Youyuan International Holdings Ltd. | 1,418,000 | | 276 |
| | 15,941 |
Metals & Mining - 1.7% |
Agnico-Eagle Mines Ltd. (Canada) | 188,800 | | 8,285 |
Anglo American PLC (United Kingdom) | 185,200 | | 5,517 |
Avion Gold Corp. (a) | 3,113,900 | | 1,553 |
Common Stocks - continued |
| Shares | | Value (000s) |
MATERIALS - continued |
Metals & Mining - continued |
Avion Gold Corp. (f) | 289,800 | | $ 144 |
Commercial Metals Co. | 1,210,444 | | 15,603 |
Copper Mountain Mining Corp. (a) | 477,400 | | 1,538 |
First Quantum Minerals Ltd. | 278,840 | | 5,063 |
Freeport-McMoRan Copper & Gold, Inc. | 308,095 | | 10,374 |
Goldcorp, Inc. | 409,300 | | 14,775 |
Iluka Resources Ltd. | 72,612 | | 726 |
Ivanhoe Mines Ltd. (d) | 2,519,636 | | 21,230 |
Newcrest Mining Ltd. | 291,654 | | 7,203 |
Randgold Resources Ltd. sponsored ADR | 290,223 | | 25,969 |
Reliance Steel & Aluminum Co. | 36,273 | | 1,867 |
SunCoke Energy, Inc. (a) | 159,898 | | 2,558 |
| | 122,405 |
TOTAL MATERIALS | | 289,295 |
TELECOMMUNICATION SERVICES - 1.0% |
Diversified Telecommunication Services - 0.6% |
CenturyLink, Inc. | 558,452 | | 23,198 |
China Unicom Ltd. | 4,236,000 | | 6,198 |
Frontier Communications Corp. (d) | 1,383,389 | | 5,423 |
PT Telkomunikasi Indonesia Tbk sponsored ADR | 234,541 | | 9,107 |
| | 43,926 |
Wireless Telecommunication Services - 0.4% |
Crown Castle International Corp. (a) | 18,400 | | 1,139 |
SBA Communications Corp. Class A (a) | 464,110 | | 27,410 |
| | 28,549 |
TOTAL TELECOMMUNICATION SERVICES | | 72,475 |
UTILITIES - 2.7% |
Electric Utilities - 1.2% |
Edison International | 521,915 | | 24,102 |
NextEra Energy, Inc. | 509,556 | | 36,128 |
Northeast Utilities | 713,080 | | 28,438 |
| | 88,668 |
Gas Utilities - 0.1% |
Atmos Energy Corp. | 104,257 | | 3,738 |
Independent Power Producers & Energy Traders - 0.4% |
The AES Corp. (a) | 2,503,593 | | 30,193 |
Common Stocks - continued |
| Shares | | Value (000s) |
UTILITIES - continued |
Multi-Utilities - 1.0% |
CMS Energy Corp. | 168,040 | | $ 4,144 |
National Grid PLC | 64,318 | | 667 |
PG&E Corp. | 737,837 | | 34,059 |
Sempra Energy | 410,821 | | 28,926 |
| | 67,796 |
TOTAL UTILITIES | | 190,395 |
TOTAL COMMON STOCKS (Cost $6,173,521) |
6,930,158
|
Preferred Stocks - 0.5% |
| | | |
Convertible Preferred Stocks - 0.4% |
FINANCIALS - 0.2% |
Diversified Financial Services - 0.2% |
Citigroup, Inc. 7.50% | 143,900 | | 12,352 |
HEALTH CARE - 0.0% |
Pharmaceuticals - 0.0% |
KaloBios Pharmaceuticals, Inc. Series E (a)(h) | 1,403,000 | | 4,770 |
INDUSTRIALS - 0.1% |
Aerospace & Defense - 0.1% |
United Technologies Corp. 7.50% | 148,700 | | 7,844 |
INFORMATION TECHNOLOGY - 0.1% |
IT Services - 0.1% |
Unisys Corp. Series A, 6.25% | 92,200 | | 5,475 |
TOTAL CONVERTIBLE PREFERRED STOCKS | | 30,441 |
Nonconvertible Preferred Stocks - 0.1% |
CONSUMER DISCRETIONARY - 0.1% |
Automobiles - 0.1% |
Volkswagen AG | 14,900 | | 2,548 |
TOTAL PREFERRED STOCKS (Cost $34,354) |
32,989
|
Convertible Bonds - 0.7% |
| Principal Amount (000s) | | Value (000s) |
ENERGY - 0.1% |
Energy Equipment & Services - 0.0% |
Cal Dive International, Inc. 5% 7/15/17 (f) | | $ 3,660 | | $ 3,539 |
Oil, Gas & Consumable Fuels - 0.1% |
Amyris, Inc. 3% 2/27/17 (h) | | 7,356 | | 5,810 |
TOTAL ENERGY | | 9,349 |
FINANCIALS - 0.1% |
Thrifts & Mortgage Finance - 0.1% |
MGIC Investment Corp. 9% 4/1/63 (f) | | 16,623 | | 6,566 |
INDUSTRIALS - 0.1% |
Building Products - 0.1% |
Aspen Aerogels, Inc. 8% 6/1/14 (h) | | 4,085 | | 4,085 |
MATERIALS - 0.4% |
Metals & Mining - 0.4% |
Ivanplats Ltd. 8% 11/10/14 pay-in-kind (g)(h) | | 27,595 | | 28,618 |
TELECOMMUNICATION SERVICES - 0.0% |
Diversified Telecommunication Services - 0.0% |
Clearwire Communications LLC/Clearwire Finance, Inc. 8.25% 12/1/40 (f) | | 3,730 | | 2,462 |
TOTAL CONVERTIBLE BONDS (Cost $54,733) |
51,080
|
Money Market Funds - 3.1% |
| Shares | | |
Fidelity Cash Central Fund, 0.17% (b) | 96,665,474 | | 96,665 |
Fidelity Securities Lending Cash Central Fund, 0.18% (b)(c) | 120,768,332 | | 120,768 |
TOTAL MONEY MARKET FUNDS (Cost $217,433) |
217,433
|
TOTAL INVESTMENT PORTFOLIO - 101.5% (Cost $6,480,041) | 7,231,660 |
NET OTHER ASSETS (LIABILITIES) - (1.5)% | (105,468) |
NET ASSETS - 100% | $ 7,126,192 |
Legend |
(a) Non-income producing |
(b) Affiliated fund that is available only to investment companies and other accounts managed by Fidelity Investments. The rate quoted is the annualized seven-day yield of the fund at period end. A complete unaudited listing of the fund's holdings as of its most recent quarter end is available upon request. In addition, each Fidelity Central Fund's financial statements, which are not covered by the Fund's Report of Independent Registered Public Accounting Firm, are available on the SEC's website or upon request. |
(c) Investment made with cash collateral received from securities on loan. |
(d) Security or a portion of the security is on loan at period end. |
(e) Affiliated company |
(f) Security exempt from registration under Rule 144A of the Securities Act of 1933. These securities may be resold in transactions exempt from registration, normally to qualified institutional buyers. At the end of the period, the value of these securities amounted to $24,765,000 or 0.3% of net assets. |
(g) Coupon rates for floating and adjustable rate securities reflect the rates in effect at period end. |
(h) Restricted securities - Investment in securities not registered under the Securities Act of 1933 (excluding 144A issues). At the end of the period, the value of restricted securities (excluding 144A issues) amounted to $70,585,000 or 1.0% of net assets. |
Additional information on each restricted holding is as follows: |
Security | Acquisition Date | Acquisition Cost (000s) |
Amyris, Inc. 3% 2/27/17 | 2/27/12 | $ 7,356 |
Aspen Aerogels, Inc. 8% 6/1/14 | 6/1/11 | $ 4,085 |
Facebook, Inc. Class B | 3/31/11 - 5/19/11 | $ 12,217 |
Halcon Resources Corp. | 3/1/12 | $ 8,190 |
Horizon Pharma, Inc. | 2/29/12 | $ 3,646 |
Horizon Pharma, Inc. warrants 2/28/17 | 2/29/12 | $ 32 |
Ivanplats Ltd. 8% 11/10/14 pay-in-kind | 11/10/11 - 3/28/12 | $ 27,868 |
KaloBios Pharmaceuticals, Inc. Series E | 5/2/12 | $ 4,770 |
Mood Media Corp. | 2/2/11 | $ 4,054 |
Affiliated Central Funds |
Information regarding fiscal year to date income earned by the Fund from investments in Fidelity Central Funds is as follows: |
Fund | Income earned
(Amounts in thousands) |
Fidelity Cash Central Fund | $ 65 |
Fidelity Securities Lending Cash Central Fund | 4,448 |
Total | $ 4,513 |
Other Affiliated Issuers |
An affiliated company is a company in which the Fund has ownership of at least 5% of the voting securities. Fiscal year to date transactions with companies which are or were affiliates are as follows: |
Affiliate
(Amounts in thousands) | Value, beginning of period | Purchases | Sales Proceeds | Dividend Income | Value,
end of
period |
Body Central Corp. | $ - | $ 18,973 | $ 553 | $ - | $ 10,585 |
Cadence Pharmaceuticals, Inc. | 28,450 | 4,838 | 2,396* | - | - |
Crown Point Ventures Ltd. | 1,096 | 417 | 119* | - | - |
Crown Point Ventures Ltd. (144A) | 2,491 | 2,462 | - | - | - |
Double Eagle Petroleum Co. | 10,542 | 643 | 799* | - | 3,787 |
GeoEye, Inc. | 53,351 | 5,884 | 7,035* | - | 31,912 |
LTX-Credence Corp. | 24,118 | 1,818 | 7,533* | - | 14,900 |
O'Charleys, Inc. | 9,150 | 871 | 15,521* | - | - |
PICO Holdings, Inc. | 32,970 | 8,869 | 4,356* | - | 33,875 |
Saia, Inc. | 13,037 | 446 | 15,580* | - | - |
Spartech Corp. | 9,331 | 930 | 2,094* | - | - |
Voyager Oil & Gas, Inc. | 11,252 | 138 | 1,870* | - | - |
Voyager Oil & Gas, Inc. warrants 2/4/16 | 1,539 | - | - | - | - |
Winnebago Industries, Inc. | 15,684 | - | 12,741* | - | - |
Total | $ 213,011 | $ 46,289 | $ 70,597 | $ - | $ 95,059 |
* Includes the value of securities delivered through in-kind transactions.
Other Information |
The following is a summary of the inputs used, as of July 31, 2012, involving the Fund's assets and liabilities carried at fair value. The inputs or methodology used for valuing securities may not be an indication of the risk associated with investing in those securities. For more information on valuation inputs, and their aggregation into the levels used in the table below, please refer to the Security Valuation section in the accompanying Notes to Financial Statements. |
Valuation Inputs at Reporting Date: |
Description
(Amounts in thousands) | Total | Level 1 | Level 2 | Level 3 |
Investments in Securities: | | | | |
Equities: | | | | |
Consumer Discretionary | $ 833,338 | $ 827,321 | $ 6,017 | $ - |
Consumer Staples | 693,110 | 664,526 | 28,584 | - |
Energy | 803,135 | 803,039 | 96 | - |
Financials | 918,237 | 902,149 | 16,088 | - |
Health Care | 851,487 | 820,679 | 26,038 | 4,770 |
Industrials | 823,534 | 819,769 | 3,765 | - |
Information Technology | 1,488,141 | 1,478,596 | 9,545 | - |
Materials | 289,295 | 289,295 | - | - |
Telecommunication Services | 72,475 | 66,277 | 6,198 | - |
Utilities | 190,395 | 189,728 | 667 | - |
Corporate Bonds | 51,080 | - | 18,377 | 32,703 |
Money Market Funds | 217,433 | 217,433 | - | - |
Total Investments in Securities: | $ 7,231,660 | $ 7,078,812 | $ 115,375 | $ 37,473 |
Distribution of investments by country or territory of incorporation, as a percentage of total net assets, is as follows. (Unaudited) |
United States of America | 82.2% |
Canada | 2.9% |
Netherlands | 2.1% |
United Kingdom | 1.7% |
Switzerland | 1.4% |
Bermuda | 1.0% |
Ireland | 1.0% |
Others (Individually Less Than 1%) | 7.7% |
| 100.0% |
See accompanying notes which are an integral part of the financial statements.
Annual Report
Statement of Assets and Liabilities
Amounts in thousands (except per-share amounts) | July 31, 2012 |
| | |
Assets | | |
Investment in securities, at value (including securities loaned of $116,146) - See accompanying schedule: Unaffiliated issuers (cost $6,135,024) | $ 6,919,168 | |
Fidelity Central Funds (cost $217,433) | 217,433 | |
Other affiliated issuers (cost $127,584) | 95,059 | |
Total Investments (cost $6,480,041) | | $ 7,231,660 |
Foreign currency held at value (cost $2,298) | | 2,307 |
Receivable for investments sold | | 151,821 |
Receivable for fund shares sold | | 2,205 |
Dividends receivable | | 3,562 |
Interest receivable | | 2,636 |
Distributions receivable from Fidelity Central Funds | | 487 |
Other receivables | | 444 |
Total assets | | 7,395,122 |
| | |
Liabilities | | |
Payable to custodian bank | $ 582 | |
Payable for investments purchased | 136,008 | |
Payable for fund shares redeemed | 7,147 | |
Accrued management fee | 2,710 | |
Other affiliated payables | 1,261 | |
Other payables and accrued expenses | 454 | |
Collateral on securities loaned, at value | 120,768 | |
Total liabilities | | 268,930 |
| | |
Net Assets | | $ 7,126,192 |
Net Assets consist of: | | |
Paid in capital | | $ 6,351,386 |
Undistributed net investment income | | 20,016 |
Accumulated undistributed net realized gain (loss) on investments and foreign currency transactions | | 3,207 |
Net unrealized appreciation (depreciation) on investments and assets and liabilities in foreign currencies | | 751,583 |
Net Assets | | $ 7,126,192 |
| | |
Dividend Growth:
Net Asset Value, offering price and redemption price per share ($5,905,455 ÷ 206,421 shares) | | $ 28.61 |
| | |
Class K:
Net Asset Value, offering price and redemption price per share ($1,220,737 ÷ 42,653 shares) | | $ 28.62 |
See accompanying notes which are an integral part of the financial statements.
Annual Report
Statement of Operations
Amounts in thousands | Year ended July 31, 2012 |
| | |
Investment Income | | |
Dividends | | $ 127,970 |
Interest | | 3,705 |
Income from Fidelity Central Funds | | 4,513 |
Total income | | 136,188 |
| | |
Expenses | | |
Management fee
Basic fee | $ 45,875 | |
Performance adjustment | 9,790 | |
Transfer agent fees | 15,919 | |
Accounting and security lending fees | 1,245 | |
Custodian fees and expenses | 269 | |
Independent trustees' compensation | 57 | |
Registration fees | 169 | |
Audit | 90 | |
Legal | 40 | |
Miscellaneous | 98 | |
Total expenses before reductions | 73,552 | |
Expense reductions | (362) | 73,190 |
Net investment income (loss) | | 62,998 |
Realized and Unrealized Gain (Loss) Net realized gain (loss) on: | | |
Investment securities: | | |
Unaffiliated issuers | 96,599 | |
Other affiliated issuers | (8,111) | |
Redemption in-kind with affiliated entities (including gain from Other affiliated issuers of $1,089) | 188,389 | |
Foreign currency transactions | (1,488) | |
Futures contracts | 6,943 | |
Total net realized gain (loss) | | 282,332 |
Change in net unrealized appreciation (depreciation) on: Investment securities | (523,285) | |
Assets and liabilities in foreign currencies | (110) | |
Total change in net unrealized appreciation (depreciation) | | (523,395) |
Net gain (loss) | | (241,063) |
Net increase (decrease) in net assets resulting from operations | | $ (178,065) |
See accompanying notes which are an integral part of the financial statements.
Annual Report
Financial Statements - continued
Statement of Changes in Net Assets
Amounts in thousands | Year ended
July 31,
2012 | Year ended
July 31,
2011 |
Increase (Decrease) in Net Assets | | |
Operations | | |
Net investment income (loss) | $ 62,998 | $ 43,819 |
Net realized gain (loss) | 282,332 | 802,201 |
Change in net unrealized appreciation (depreciation) | (523,395) | 997,707 |
Net increase (decrease) in net assets resulting
from operations | (178,065) | 1,843,727 |
Distributions to shareholders from net investment income | (42,120) | (51,737) |
Distributions to shareholders from net realized gain | (5,141) | (26,364) |
Total distributions | (47,261) | (78,101) |
Share transactions - net increase (decrease) | (2,591,197) | 91,677 |
Total increase (decrease) in net assets | (2,816,523) | 1,857,303 |
| | |
Net Assets | | |
Beginning of period | 9,942,715 | 8,085,412 |
End of period (including undistributed net investment income of $20,016 and undistributed net investment income of $22,949, respectively) | $ 7,126,192 | $ 9,942,715 |
See accompanying notes which are an integral part of the financial statements.
Annual Report
Financial Highlights - Dividend Growth
Years ended July 31, | 2012 | 2011 | 2010 | 2009 | 2008 |
Selected Per-Share Data | | | | | |
Net asset value, beginning of period | $ 28.96 | $ 23.84 | $ 20.25 | $ 25.40 | $ 32.73 |
Income from Investment Operations | | | | | |
Net investment income (loss) B | .20 | .12 | .13 E | .24 | .43 |
Net realized and unrealized gain (loss) | (.41) | 5.23 | 3.63 | (4.01) | (5.08) |
Total from investment operations | (.21) | 5.35 | 3.76 | (3.77) | (4.65) |
Distributions from net investment income | (.12) | (.15) | (.12) | (.37) | (.45) |
Distributions from net realized gain | (.02) | (.08) | (.05) | (1.01) | (2.23) |
Total distributions | (.14) | (.23) | (.17) | (1.38) H | (2.68) |
Net asset value, end of period | $ 28.61 | $ 28.96 | $ 23.84 | $ 20.25 | $ 25.40 |
Total Return A | (.67)% | 22.57% | 18.59% | (15.33)% | (15.45)% |
Ratios to Average Net Assets C,F | | | | | |
Expenses before reductions | .91% | .93% | .93% | .62% | .64% |
Expenses net of fee waivers, if any | .91% | .93% | .93% | .62% | .64% |
Expenses net of all reductions | .91% | .93% | .92% | .62% | .63% |
Net investment income (loss) | .75% | .44% | .56% E | 1.34% | 1.47% |
Supplemental Data | | | | | |
Net assets, end of period (in millions) | $ 5,905 | $ 9,309 | $ 7,730 | $ 6,603 | $ 9,502 |
Portfolio turnover rate D | 63% G | 67% | 85% | 177% | 52% |
A Total returns would have been lower if certain expenses had not been reduced during the applicable periods shown.
B Calculated based on average shares outstanding during the period.
C Fees and expenses of any underlying Fidelity Central Funds are not included in the Fund's expense ratio. The Fund indirectly bears its proportionate share of the expenses of any underlying Fidelity Central Funds.
D Amount does not include the portfolio activity of any underlying Fidelity Central Funds.
E Investment income per share reflects a large, non-recurring dividend which amounted to $.04 per share. Excluding this non-recurring dividend, the ratio of net investment income (loss) to average net assets would have been .40%.
F Expense ratios reflect operating expenses of the class. Expenses before reductions do not reflect amounts reimbursed by the investment adviser or reductions from brokerage service arrangements or reductions from other expense offset arrangements and do not represent the amount paid by the class during periods when reimbursements or reductions occur. Expenses net of fee waivers reflect expenses after reimbursement by the investment adviser but prior to reductions from brokerage service arrangements or other expense offset arrangements. Expenses net of all reductions represent the net expenses paid by the class.
G Portfolio turnover rate excludes securities received or delivered in-kind.
H Total distributions of $1.38 per share is comprised of distributions from net investment income of $.374 and distributions from net realized gain of $1.005 per share.
See accompanying notes which are an integral part of the financial statements.
Annual Report
Financial Highlights - Class K
Years ended July 31, | 2012 | 2011 | 2010 | 2009 | 2008 H |
Selected Per-Share Data | | | | | |
Net asset value, beginning of period | $ 28.98 | $ 23.86 | $ 20.26 | $ 25.41 | $ 27.72 |
Income from Investment Operations | | | | | |
Net investment income (loss) D | .25 | .17 | .18 G | .26 | .10 |
Net realized and unrealized gain (loss) | (.43) | 5.22 | 3.63 | (4.00) | (2.41) |
Total from investment operations | (.18) | 5.39 | 3.81 | (3.74) | (2.31) |
Distributions from net investment income | (.17) | (.20) | (.16) | (.41) | - |
Distributions from net realized gain | (.02) | (.08) | (.05) | (1.01) | - |
Total distributions | (.18) M | (.27) L | (.21) | (1.41) K | - |
Net asset value, end of period | $ 28.62 | $ 28.98 | $ 23.86 | $ 20.26 | $ 25.41 |
Total Return B,C | (.52)% | 22.79% | 18.86% | (15.16)% | (8.33)% |
Ratios to Average Net AssetsE,I | | | | | |
Expenses before reductions | .75% | .78% | .72% | .40% | .47% A |
Expenses net of fee waivers, if any | .75% | .78% | .72% | .40% | .47% A |
Expenses net of all reductions | .75% | .77% | .71% | .39% | .47% A |
Net investment income (loss) | .91% | .60% | .76% G | 1.57% | 1.66% A |
Supplemental Data | | | | | |
Net assets, end of period
(000 omitted) | $ 1,220,737 | $ 633,935 | $ 355,463 | $ 201,625 | $ 92 |
Portfolio turnover rate F | 63% J | 67% | 85% | 177% | 52% |
A Annualized
B Total returns for periods of less than one year are not annualized.
C Total returns would have been lower if certain expenses had not been reduced during the applicable periods shown.
D Calculated based on average shares outstanding during the period.
E Fees and expenses of any underlying Fidelity Central Funds are not included in the Fund's expense ratio. The Fund indirectly bears its proportionate share of the expenses of any underlying Fidelity Central Funds.
F Amount does not include the portfolio activity of any underlying Fidelity Central Funds.
G Investment income per share reflects a large, non-recurring dividend which amounted to $.04 per share. Excluding this non-recurring dividend, the ratio of net investment income (loss) to average net assets would have been .60%.
H For the period May 9, 2008 (commencement of sale of shares) to July 31, 2008.
I Expense ratios reflect operating expenses of the class. Expenses before reductions do not reflect amounts reimbursed by the investment adviser or reductions from brokerage service arrangements or reductions from other expense offset arrangements and do not represent the amount paid by the class during periods when reimbursements or reductions occur. Expense ratios before reductions for start-up periods may not be representative of longer-term operating periods. Expenses net of fee waivers reflect expenses after reimbursement by the investment adviser but prior to reductions from brokerage service arrangements or other expense offset arrangements. Expenses net of all reductions represent the net expenses paid by the class.
J Portfolio turnover rate excludes securities received or delivered in-kind.
K Total distributions of $1.41 per share is comprised of distributions from net investment income of $.407 and distributions from net realized gain of $1.005 per share.
L Total distributions of $.27 per share is comprised of distributions from net investment income of $.197 and distributions from net realized gain of $.077 per share.
M Total distributions of $.18 per share is comprised of distributions from net investment income of $.169 and distributions from net realized gain of $.015 per share.
See accompanying notes which are an integral part of the financial statements.
Annual Report
Notes to Financial Statements
For the period ended July 31, 2012
(Amounts in thousands except percentages)
1. Organization.
Fidelity® Dividend Growth Fund (the Fund) is a fund of Fidelity Securities Fund (the Trust) and is authorized to issue an unlimited number of shares. The Trust is registered under the Investment Company Act of 1940, as amended (the 1940 Act), as an open-end management investment company organized as a Massachusetts business trust. The Fund offers Dividend Growth and Class K shares, each of which has equal rights as to assets and voting privileges. Each class has exclusive voting rights with respect to matters that affect that class. Investment income, realized and unrealized capital gains and losses, the common expenses of the Fund, and certain fund-level expense reductions, if any, are allocated on a pro-rata basis to each class based on the relative net assets of each class to the total net assets of the Fund. Each class differs with respect to transfer agent fees incurred. Certain expense reductions may also differ by class.
2. Investments in Fidelity Central Funds.
The Fund invests in Fidelity Central Funds, which are open-end investment companies available only to other investment companies and accounts managed by Fidelity Management & Research Company (FMR) and its affiliates. The Fund's Schedule of Investments lists each of the Fidelity Central Funds held as of period end, if any, as an investment of the Fund, but does not include the underlying holdings of each Fidelity Central Fund. As an Investing Fund, the Fund indirectly bears its proportionate share of the expenses of the underlying Fidelity Central Funds.
The Money Market Central Funds seek preservation of capital and current income and are managed by Fidelity Investments Money Management, Inc. (FIMM), an affiliate of FMR.
A complete unaudited list of holdings for each Fidelity Central Fund is available upon request or at the Securities and Exchange Commission (the SEC) web site at www.sec.gov. In addition, the financial statements of the Fidelity Central Funds, which are not covered by the Fund's Report of Independent Registered Public Accounting Firm, are available on the SEC web site or upon request.
3. Significant Accounting Policies.
The financial statements have been prepared in conformity with accounting principles generally accepted in the United States of America (GAAP), which require management to make certain estimates and assumptions at the date of the financial statements. Actual results could differ from those estimates. Subsequent events, if any, through the date that the financial statements were issued have been evaluated in the preparation of the financial statements. The following summarizes the significant accounting policies of the Fund:
Annual Report
Notes to Financial Statements - continued
(Amounts in thousands except percentages)
3. Significant Accounting Policies - continued
Security Valuation. Investments are valued as of 4:00 p.m. Eastern time on the last calendar day of the period. In accordance with valuation policies and procedures approved by the Board of Trustees (the Board), the Fund attempts to obtain prices from one or more third party pricing vendor or broker to value its investments. When current market prices, quotations or rates are not readily available or reliable, securities will be fair valued in good faith by the FMR Fair Value Committee (the Committee), in accordance with procedures adopted by the Fund's Board. Factors used in determining fair value vary by security type and may include market or security specific events, changes in interest rates and credit quality. The frequency with which these procedures are used cannot be predicted and they may be utilized to a significant extent. The Committee oversees the Fund's valuation policies and procedures and is responsible for approving and reporting to the Board all fair value determinations.
The Fund categorizes the inputs to valuation techniques used to value its investments into a disclosure hierarchy consisting of three levels as shown below:
Level 1 - quoted prices in active markets for identical investments
Level 2 - other significant observable inputs (including quoted prices for similar investments, interest rates, prepayment speeds, etc.)
Level 3 - unobservable inputs (including the Fund's own assumptions based on the best information available)
Valuation techniques used to value the Fund's investments by major category are as follows:
Equity securities, including restricted securities, for which market quotations are readily available, are valued at the last reported sale price or official closing price as reported by a third party pricing vendor on the primary market or exchange on which they are traded and are categorized as Level 1 in the hierarchy. In the event there were no sales during the day or closing prices are not available, securities are valued at the last quoted bid price or may be valued using the last available price and are generally categorized as Level 2 in the hierarchy. For foreign equity securities, when significant market or security specific events arise, comparisons to the valuation of American Depositary Receipts (ADRs), futures contracts, Exchange-Traded Funds (ETFs) and certain indexes as well as quoted prices for similar securities are used and are categorized as Level 2 in the hierarchy. Utilizing these techniques may result in transfers between Level 1 and Level 2. For restricted equity securities and private placements where observable inputs are limited, assumptions about market activity and risk are used and these securities are categorized as Level 3 in the hierarchy.
Annual Report
3. Significant Accounting Policies - continued
Security Valuation - continued
Debt securities, including restricted securities, are valued based on evaluated prices received from third party pricing vendors or from brokers who make markets in such securities. For corporate bonds, pricing vendors utilize matrix pricing which considers yield or price of bonds of comparable quality, coupon, maturity and type as well as broker-supplied prices and are generally categorized as Level 2 in the hierarchy. When independent prices are unavailable or unreliable, debt securities may be valued utilizing pricing methodologies which consider similar factors that would be used by third party pricing vendors. These are generally categorized as Level 2 in the hierarchy but may be Level 3 depending on the circumstances.
Investments in open-end mutual funds, including the Fidelity Central Funds, are valued at their closing net asset value each business day and are categorized as Level 1 in the hierarchy.
Changes in valuation techniques may result in transfers in or out of an assigned level within the disclosure hierarchy. The aggregate value of investments by input level, as of July 31, 2012, is included at the end of the Fund's Schedule of Investments.
Foreign Currency Translation. The Fund may use foreign currency contracts to facilitate transactions in foreign-denominated securities. Gains and losses from these transactions may arise from changes in the value of the foreign currency or if the counterparties do not perform under the contracts' terms.
Foreign-denominated assets, including investment securities, and liabilities are translated into U.S. dollars at the exchange rates at period end. Purchases and sales of investment securities, income and dividends received and expenses denominated in foreign currencies are translated into U.S. dollars at the exchange rate in effect on the transaction date.
The effects of exchange rate fluctuations on investments are included with the net realized and unrealized gain (loss) on investment securities. Other foreign currency transactions resulting in realized and unrealized gain (loss) are disclosed separately.
Investment Transactions and Income. For financial reporting purposes, the Fund's investment holdings and NAV include trades executed through the end of the last business day of the period. The NAV per share for processing shareholder transactions is calculated as of the close of business of the New York Stock Exchange (NYSE), normally 4:00 p.m. Eastern time and includes trades executed through the end of the prior business day. Gains and losses on securities sold are determined on the basis of identified cost and may include proceeds received from litigation. Dividend income is recorded on the ex-dividend date, except for certain dividends from foreign securities where the
Annual Report
Notes to Financial Statements - continued
(Amounts in thousands except percentages)
3. Significant Accounting Policies - continued
Investment Transactions and Income - continued
ex-dividend date may have passed, which are recorded as soon as the Fund is informed of the ex-dividend date. Non-cash dividends included in dividend income, if any, are recorded at the fair market value of the securities received. Distributions received on securities that represent a return of capital or capital gain are recorded as a reduction of cost of investments and/or as a realized gain. The Fund estimates the components of distributions received that may be considered return of capital distributions or capital gain distributions. Interest income and distributions from the Fidelity Central Funds are accrued as earned. Interest income includes coupon interest and amortization of premium and accretion of discount on debt securities. Investment income is recorded net of foreign taxes withheld where recovery of such taxes is uncertain.
Expenses. Expenses directly attributable to a fund are charged to that fund. Expenses attributable to more than one fund are allocated among the respective funds on the basis of relative net assets or other appropriate methods. Expense estimates are accrued in the period to which they relate and adjustments are made when actual amounts are known.
Deferred Trustee Compensation. Under a Deferred Compensation Plan (the Plan), independent Trustees may elect to defer receipt of a portion of their annual compensation. Deferred amounts are invested in a cross-section of Fidelity funds, are marked-to-market and remain in the Fund until distributed in accordance with the Plan. The investment of deferred amounts and the offsetting payable to the Trustees are included in the accompanying Statement of Assets and Liabilities.
Income Tax Information and Distributions to Shareholders. Each year, the Fund intends to qualify as a regulated investment company under Subchapter M of the Internal Revenue Code, including distributing substantially all of its taxable income and realized gains. As a result, no provision for income taxes is required. As of July 31, 2012, the Fund did not have any unrecognized tax benefits in the financial statements; nor is the Fund aware of any tax positions for which it is reasonably possible that the total amounts of unrecognized tax benefits will significantly change in the next twelve months. The Fund files a U.S. federal tax return, in addition to state and local tax returns as required. A fund's federal income tax returns are subject to examination by the Internal Revenue Service (IRS) for a period of three fiscal years after they are filed. State and local tax returns may be subject to examination for an additional fiscal year depending on the jurisdiction. Foreign taxes are provided for based on the Fund's understanding of the tax rules and rates that exist in the foreign markets in which it invests.
Annual Report
3. Significant Accounting Policies - continued
Income Tax Information and Distributions to Shareholders - continued
Distributions are declared and recorded on the ex-dividend date. Income dividends and capital gain distributions are declared separately for each class. Income and capital gain distributions are determined in accordance with income tax regulations, which may differ from GAAP. In addition, the Fund claimed a portion of the payment made to redeeming shareholders as a distribution for income tax purposes.
Capital accounts within the financial statements are adjusted for permanent book-tax differences. These adjustments have no impact on net assets or the results of operations. Temporary book-tax differences will reverse in a subsequent period.
Book-tax differences are primarily due to futures transactions, foreign currency transactions, passive foreign investment companies (PFIC), market discount, redemptions in kind, equity-debt classifications, partnerships, deferred trustees compensation, capital loss carryforwards and losses deferred due to wash sales.
The federal tax cost of investment securities and unrealized appreciation (depreciation) as of period end were as follows:
Gross unrealized appreciation | $ 1,269,157 |
Gross unrealized depreciation | (546,000) |
Net unrealized appreciation (depreciation) on securities and other investments | $ 723,157 |
| |
Tax Cost | $ 6,508,503 |
The tax-based components of distributable earnings as of period end were as follows:
Undistributed ordinary income | $ 19,112 |
Undistributed long-term capital gain | $ 32,963 |
Net unrealized appreciation (depreciation) | $ 723,121 |
The tax character of distributions paid was as follows:
| July 31, 2012 | July 31, 2011 |
Ordinary Income | $ 47,261 | $ 78,101 |
New Accounting Pronouncement. In December 2011, the Financial Accounting Standards Board issued Accounting Standard Update No. 2011-11, Disclosures about Offsetting Assets and Liabilities. The update creates new disclosure requirements requiring entities to disclose both gross and net information for derivatives and other financial instruments that are either offset in the Statement of Assets and Liabilities or subject to an enforceable master netting arrangement or similar agreement. The disclosure requirements are effective for interim and annual reporting periods beginning on or after January 1, 2013. Management is currently evaluating the impact of the update's adoption on the Fund's financial statement disclosures.
Annual Report
Notes to Financial Statements - continued
(Amounts in thousands except percentages)
4. Operating Policies.
Restricted Securities. The Fund may invest in securities that are subject to legal or contractual restrictions on resale. These securities generally may be resold in transactions exempt from registration or to the public if the securities are registered. Disposal of these securities may involve time-consuming negotiations and expense, and prompt sale at an acceptable price may be difficult. Information regarding restricted securities is included at the end of the Fund's Schedule of Investments.
5. Derivative Instruments.
Risk Exposures and the Use of Derivative Instruments. The Fund's investment objectives allow the Fund to enter into various types of derivative contracts, including futures contracts. Derivatives are investments whose value is derived from underlying assets, indices or reference rates and may be transacted on an exchange or over-the-counter (OTC). Derivatives may involve a future commitment to buy or sell a specified instrument based on specified terms, or to exchange future cash flows at periodic intervals based on a notional principal amount. The Fund used derivatives to increase returns and to manage exposure to certain risks as defined below. The success of any strategy involving derivatives depends on analysis of numerous economic factors, and if the strategies for investment do not work as intended, the Fund may not achieve its objectives.
The Fund's use of derivatives increased or decreased its exposure to the following risk:
Equity Risk | Equity risk relates to the fluctuations in the value of financial instruments as a result of changes in market prices (other than those arising from interest rate risk or foreign exchange risk), whether caused by factors specific to an individual investment, its issuer, or all factors affecting all instruments traded in a market or market segment. |
The Fund is also exposed to additional risks from investing in derivatives, such as liquidity risk and counterparty credit risk. Liquidity risk is the risk that the Fund will be unable to close out the derivative in the open market in a timely manner. Counterparty credit risk is the risk that the counterparty will not be able to fulfill its obligation to the Fund. Counterparty credit risk related to exchange-traded futures contracts is minimal because of the protection provided by the exchange on which they trade. Investing in derivatives may involve greater risks than investing in the underlying assets directly and, to varying degrees, involves risk of loss in excess of the initial investment, if any, collateral received and amounts recognized in the Statement of Assets and Liabilities. In addition, for futures contracts, there is the risk that the change in value of the derivative contract may not correspond to the change in value of the underlying instrument.
Annual Report
5. Derivative Instruments - continued
Futures Contracts. A futures contract is an agreement between two parties to buy or sell a specified underlying instrument for a fixed price at a specified future date. The Fund used futures contracts to manage its exposure to the stock market.
Upon entering into a futures contract, a fund is required to deposit either cash or securities (initial margin) with a clearing broker in an amount equal to a certain percentage of the face value of the contract. Futures contracts are marked-to-market daily and subsequent payments (variation margin) are made or received by a fund depending on the daily fluctuations in the value of the futures contracts and are recorded as unrealized appreciation or (depreciation). This receivable and/or payable is included in daily variation margin on futures contracts in the Statement of Assets and Liabilities. Realized gain or (loss) is recorded upon the expiration or closing of a futures contract.
Any open futures contracts at period end are shown in the Schedule of Investments under the caption "Futures Contracts." The underlying face amount at value reflects each contract's exposure to the underlying instrument at period end.
During the period the Fund recognized net realized gain (loss) of $6,943 related to its investment in futures contracts. This amount is included in the Statement of Operations.
6. Purchases and Sales of Investments.
Purchases and sales of securities, other than short-term securities and in-kind transactions, aggregated $5,165,803 and $7,075,318, respectively.
7. Fees and Other Transactions with Affiliates.
Management Fee. FMR and its affiliates provide the Fund with investment management related services for which the Fund pays a monthly management fee. The management fee is the sum of an individual fund fee rate that is based on an annual rate of .30% of the Fund's average net assets and an annualized group fee rate that averaged .26% during the period. The group fee rate is based upon the average net assets of all the mutual funds advised by FMR. The group fee rate decreases as assets under management increase and increases as assets under management decrease. In addition, the management fee is subject to a performance adjustment (up to a maximum of ± .20% of the Fund's average net assets over a 36 month performance period). The upward or downward adjustment to the management fee is based on the relative investment performance of Dividend Growth as compared to an appropriate benchmark index. For the period, the total annual management fee rate, including the performance adjustment, was .68% of the Fund's average net assets.
Annual Report
Notes to Financial Statements - continued
(Amounts in thousands except percentages)
7. Fees and Other Transactions with Affiliates - continued
Transfer Agent Fees. Fidelity Investments Institutional Operations Company, Inc. (FIIOC), an affiliate of FMR, is the transfer, dividend disbursing and shareholder servicing agent for each class of the Fund. FIIOC receives account fees and asset-based fees that vary according to the account size and type of account of the shareholders of Dividend Growth. FIIOC receives an asset-based fee of Class K's average net assets. FIIOC pays for typesetting, printing and mailing of shareholder reports, except proxy statements. For the period, transfer agent fees for each class were as follows:
| Amount | % of
Average
Net Assets |
Dividend Growth | $ 15,455 | .21 |
Class K | 464 | .05 |
| $ 15,919 | |
Accounting and Security Lending Fees. Fidelity Service Company, Inc. (FSC), an affiliate of FMR, maintains the Fund's accounting records. The accounting fee is based on the level of average net assets for each month. Under a separate contract, FSC administers the security lending program. The security lending fee is based on the number and duration of lending transactions.
Brokerage Commissions. The Fund placed a portion of its portfolio transactions with brokerage firms which are affiliates of the investment adviser. The commissions paid to these affiliated firms were $50 for the period.
Interfund Lending Program. Pursuant to an Exemptive Order issued by the SEC, the Fund, along with other registered investment companies having management contracts with FMR, may participate in an interfund lending program. This program provides an alternative credit facility allowing the funds to borrow from, or lend money to, other participating affiliated funds. At period end, there were no interfund loans outstanding. The Fund's activity in this program during the period for which loans were outstanding was as follows:
Borrower or Lender | Average Loan
Balance | Weighted Average Interest Rate |
Borrower | $ 11,847 | .33% |
Redemptions In-Kind. During the period, 26,569 shares of the Fund held by affiliated entities were redeemed for cash and securities, including accrued interest, with a value of $746,864. The net realized gain of $188,389 on securities delivered through in-kind redemptions is included in the accompanying Statement of Operations. The amount of in-kind redemptions is included in share transactions in the accompanying Statement of Changes in Net Assets a well as Note 12: Share Transactions. The Fund recognized no gain or loss for federal income tax purposes.
Annual Report
8. Committed Line of Credit.
The Fund participates with other funds managed by FMR or an affiliate in a $4.25 billion credit facility (the "line of credit") to be utilized for temporary or emergency purposes to fund shareholder redemptions or for other short-term liquidity purposes. The Fund has agreed to pay commitment fees on its pro-rata portion of the line of credit, which amounted to $24 and is reflected in Miscellaneous expenses on the Statement of Operations. During the period, there were no borrowings on this line of credit.
9. Security Lending.
The Fund lends portfolio securities through a lending agent from time to time in order to earn additional income. For equity securities, a lending agent is used and may loan securities to certain qualified borrowers, including Fidelity Capital Markets (FCM), a broker-dealer affiliated with the Fund. On the settlement date of the loan, the Fund receives collateral (in the form of U.S. Treasury obligations, letters of credit and/or cash) against the loaned securities and maintains collateral in an amount not less than 100% of the market value of the loaned securities during the period of the loan. The market value of the loaned securities is determined at the close of business of the Fund and any additional required collateral is delivered to the Fund on the next business day. If the borrower defaults on its obligation to return the securities loaned because of insolvency or other reasons, a fund could experience delays and costs in recovering the securities loaned or in gaining access to the collateral. Any cash collateral received is invested in the Fidelity Securities Lending Cash Central Fund. The value of loaned securities and cash collateral at period end are disclosed on the Fund's Statement of Assets and Liabilities. The value of securities loaned to FCM at period end was $1,856. Security lending income represents the income earned on investing cash collateral, less rebates paid to borrowers and any lending agent fees associated with the loan, plus any premium payments received for lending certain types of securities. Security lending income is presented in the Statement of Operations as a component of income from Fidelity Central Funds. Total security lending income during the period amounted to $4,448, including $130 from securities loaned to FCM.
10. Expense Reductions.
Many of the brokers with whom FMR places trades on behalf of the Fund provided services to the Fund in addition to trade execution. These services included payments of certain expenses on behalf of the Fund totaling $362 for the period. In addition, through arrangements with the Fund's custodian, credits realized as a result of uninvested cash balances were used to reduce the Fund's expenses.
Annual Report
Notes to Financial Statements - continued
(Amounts in thousands except percentages)
11. Distributions to Shareholders.
Distributions to shareholders of each class were as follows:
Years ended July 31, | 2012 | 2011 |
From net investment income | | |
Dividend Growth | $ 37,592 | $ 48,547 |
Class K | 4,528 | 3,190 |
Total | $ 42,120 | $ 51,737 |
From net realized gain | | |
Dividend Growth | $ 4,761 | $ 25,105 |
Class K | 380 | 1,259 |
Total | $ 5,141 | $ 26,364 |
12. Share Transactions.
Transactions for each class of shares were as follows:
| Shares | Dollars |
Years ended July 31, | 2012 | 2011 | 2012 | 2011 |
Dividend Growth | | | | |
Shares sold | 28,017 | 76,617 | $ 753,110 | $ 2,092,410 |
Reinvestment of distributions | 1,596 | 2,707 | 40,357 | 68,380 |
Shares redeemed | (144,643) A | (82,166) | (3,948,966) A | (2,266,445) |
Net increase (decrease) | (115,030) | (2,842) | $ (3,155,499) | $ (105,655) |
Class K | | | | |
Shares sold | 29,433 | 11,524 | $ 801,392 | $ 323,383 |
Reinvestment of distributions | 194 | 175 | 4,908 | 4,449 |
Shares redeemed | (8,851) | (4,720) | (241,998) | (130,500) |
Net increase (decrease) | 20,776 | 6,979 | $ 564,302 | $ 197,332 |
A Amount includes in-kind redemptions (see Note 7: Redemptions in-kind).
13. Other.
The Fund's organizational documents provide former and current trustees and officers with a limited indemnification against liabilities arising in connection with the performance of their duties to the Fund. In the normal course of business, the Fund may also enter into contracts that provide general indemnifications. The Fund's maximum exposure under these arrangements is unknown as this would be dependent on future claims that may be made against the Fund. The risk of material loss from such claims is considered remote.
Annual Report
To the Trustees of Fidelity Securities Fund and the Shareholders of Fidelity Dividend Growth Fund:
In our opinion, the accompanying statement of assets and liabilities, including the schedule of investments, and the related statements of operations and of changes in net assets and the financial highlights present fairly, in all material respects, the financial position of Fidelity Dividend Growth Fund (a fund of Fidelity Securities Fund) at July 31, 2012, the results of its operations for the year then ended, the changes in its net assets for each of the two years in the period then ended and the financial highlights for each of the periods indicated, in conformity with accounting principles generally accepted in the United States of America. These financial statements and financial highlights (hereafter referred to as "financial statements") are the responsibility of the Fidelity Dividend Growth Fund's management. Our responsibility is to express an opinion on these financial statements based on our audits. We conducted our audits of these financial statements in accordance with the standards of the Public Company Accounting Oversight Board (United States). Those standards require that we plan and perform the audit to obtain reasonable assurance about whether the financial statements are free of material misstatement. An audit includes examining, on a test basis, evidence supporting the amounts and disclosures in the financial statements, assessing the accounting principles used and significant estimates made by management, and evaluating the overall financial statement presentation. We believe that our audits, which included confirmation of securities at July 31, 2012 by correspondence with the custodian and brokers, provide a reasonable basis for our opinion.
PricewaterhouseCoopers LLP
Boston, Massachusetts
September 12, 2012
Annual Report
The Trustees, Members of the Advisory Board, and executive officers of the trust and fund, as applicable, are listed below. The Board of Trustees governs the fund and is responsible for protecting the interests of shareholders. The Trustees are experienced executives who meet periodically throughout the year to oversee the fund's activities, review contractual arrangements with companies that provide services to the fund, oversee management of the risks associated with such activities and contractual arrangements, and review the fund's performance. Except for James C. Curvey, each of the Trustees oversees 228 funds advised by FMR or an affiliate. Mr. Curvey oversees 435 funds advised by FMR or an affiliate.
The Trustees hold office without limit in time except that (a) any Trustee may resign; (b) any Trustee may be removed by written instrument, signed by at least two-thirds of the number of Trustees prior to such removal; (c) any Trustee who requests to be retired or who has become incapacitated by illness or injury may be retired by written instrument signed by a majority of the other Trustees; and (d) any Trustee may be removed at any special meeting of shareholders by a two-thirds vote of the outstanding voting securities of the trust. Each Trustee who is not an interested person (as defined in the 1940 Act) (Independent Trustee), shall retire not later than the last day of the calendar year in which his or her 75th birthday occurs. The Independent Trustees may waive this mandatory retirement age policy with respect to individual Trustees. The executive officers and Advisory Board Members hold office without limit in time, except that any officer and Advisory Board Member may resign or may be removed by a vote of a majority of the Trustees at any regular meeting or any special meeting of the Trustees. Except as indicated, each individual has held the office shown or other offices in the same company for the past five years.
Experience, Skills, Attributes, and Qualifications of the Fund's Trustees. The Governance and Nominating Committee has adopted a statement of policy that describes the experience, qualifications, attributes, and skills that are necessary and desirable for potential Independent Trustee candidates (Statement of Policy). The Board believes that each Trustee satisfied at the time he or she was initially elected or appointed a Trustee, and continues to satisfy, the standards contemplated by the Statement of Policy. The Governance and Nominating Committee also engages professional search firms to help identify potential Independent Trustee candidates who have the experience, qualifications, attributes, and skills consistent with the Statement of Policy. From time to time, additional criteria based on the composition and skills of the current Independent Trustees, as well as experience or skills that may be appropriate in light of future changes to board composition, business conditions, and regulatory or other developments, have also been considered by the professional search firms and the Governance and Nominating Committee. In addition, the Board takes into account the Trustees' commitment and participation in Board and committee meetings, as well as their leadership of standing and ad hoc committees throughout their tenure.
In determining that a particular Trustee was and continues to be qualified to serve as a Trustee, the Board has considered a variety of criteria, none of which, in isolation, was controlling. The Board believes that, collectively, the Trustees have balanced and diverse experience, qualifications, attributes, and skills, which allow the Board to operate effectively in governing the fund and protecting the interests of shareholders. Information about the specific experience, skills, attributes, and qualifications of each Trustee, which in each case led to the Board's conclusion that the Trustee should serve (or continue to serve) as a trustee of the fund, is provided below.
Annual Report
Trustees and Officers - continued
Board Structure and Oversight Function. James C. Curvey is an interested person (as defined in the 1940 Act) and currently serves as Chairman. The Trustees have determined that an interested Chairman is appropriate and benefits shareholders because an interested Chairman has a personal and professional stake in the quality and continuity of services provided to the fund. Independent Trustees exercise their informed business judgment to appoint an individual of their choosing to serve as Chairman, regardless of whether the Trustee happens to be independent or a member of management. The Independent Trustees have determined that they can act independently and effectively without having an Independent Trustee serve as Chairman and that a key structural component for assuring that they are in a position to do so is for the Independent Trustees to constitute a substantial majority for the Board. The Independent Trustees also regularly meet in executive session. Ned C. Lautenbach serves as Chairman of the Independent Trustees and as such (i) acts as a liaison between the Independent Trustees and management with respect to matters important to the Independent Trustees and (ii) with management prepares agendas for Board meetings.
Fidelity funds are overseen by different Boards of Trustees. The fund's Board oversees Fidelity's equity and high income funds and another Board oversees Fidelity's investment-grade bond, money market, and asset allocation funds. The asset allocation funds may invest in Fidelity funds overseen by the fund's Board. The use of separate Boards, each with its own committee structure, allows the Trustees of each group of Fidelity funds to focus on the unique issues of the funds they oversee, including common research, investment, and operational issues. On occasion, the separate Boards establish joint committees to address issues of overlapping consequences for the Fidelity funds overseen by each Board.
The Trustees operate using a system of committees to facilitate the timely and efficient consideration of all matters of importance to the Trustees, the fund, and fund shareholders and to facilitate compliance with legal and regulatory requirements and oversight of the fund's activities and associated risks. The Board, acting through its committees, has charged FMR and its affiliates with (i) identifying events or circumstances the occurrence of which could have demonstrably adverse effects on the fund's business and/or reputation; (ii) implementing processes and controls to lessen the possibility that such events or circumstances occur or to mitigate the effects of such events or circumstances if they do occur; and (iii) creating and maintaining a system designed to evaluate continuously business and market conditions in order to facilitate the identification and implementation processes described in (i) and (ii) above. Because the day-to-day operations and activities of the fund are carried out by or through FMR, its affiliates and other service providers, the fund's exposure to risks is mitigated but not eliminated by the processes overseen by the Trustees. While each of the Board's committees has responsibility for overseeing different aspects of the fund's activities, oversight is exercised primarily through the Operations, Audit, and Compliance Committees. In addition, the Independent Trustees have worked with FMR to enhance the Board's oversight of investment and financial risks, legal and regulatory risks, technology risks, and operational risks, including the development of additional risk reporting to the Board. For example, a working group comprised of Independent Trustees and FMR has worked and continues to work to review the Fidelity funds' valuation-related activities, reporting and risk management. Appropriate personnel, including but not limited to the fund's Chief Compliance Officer (CCO), FMR's internal auditor, the independent accountants, the fund's Treasurer and portfolio management personnel, make periodic reports to the Board's committees, as appropriate, including an annual review of FMR's risk management program for the Fidelity funds. The responsibilities of each standing committee, including their oversight responsibilities, are described further under "Standing Committees of the Fund's Trustees."
Annual Report
The fund's Statement of Additional Information (SAI) includes more information about the Trustees. To request a free copy, call Fidelity at 1-800-544-8544.
Interested Trustees*:
Correspondence intended for each Trustee who is an interested person may be sent to Fidelity Investments, 82 Devonshire Street, Boston, Massachusetts 02109.
Name, Age; Principal Occupations and Other Relevant Experience+ |
James C. Curvey (77) |
| Year of Election or Appointment: 2007 Mr. Curvey is Trustee and Chairman of the Board of Trustees of certain Trusts. Mr. Curvey also serves as Trustee (2007-present) of other investment companies advised by FMR. Mr. Curvey is a Director of Fidelity Investments Money Management, Inc. (2009-present), Director of Fidelity Research & Analysis Co. (2009-present) and Director of FMR and FMR Co., Inc. (2007-present). Mr. Curvey is also Vice Chairman (2007-present) and Director of FMR LLC. In addition, Mr. Curvey serves as an Overseer for the Boston Symphony Orchestra and a member of the Trustees of Villanova University. Previously, Mr. Curvey was the Vice Chairman (2006-2007) and Director (2000-2007) of FMR Corp. |
Ronald P. O'Hanley (55) |
| Year of Election or Appointment: 2011 Mr. O'Hanley is Director of FMR Co., Inc. (2010-present), Director of Fidelity Investments Money Management, Inc. (2010-present), Director of Fidelity Research & Analysis Company (2010-present), President of Fidelity Asset Management and Corporate Services and a member of Fidelity's Executive Committee (2010-present). Previously, Mr. O'Hanley served as President and Chief Executive Officer of BNY Mellon Asset Management (2007-2010). Mr. O'Hanley also served as Vice Chairman of Bank New York Mellon Corp. and a member of that firm's Executive Committee. Prior to the 2007 merger of The Bank of New York and Mellon Financial Corporation, he was Vice Chairman of Mellon Financial Corporation and President and Chief Executive Officer of Mellon Asset Management. He joined Mellon in February 1997. Mr. O'Hanley currently serves as Chairman of the Boston Public Library Foundation Board of Directors and sits on the Board of Directors of Beth Israel Deaconess Medical Center, the Board of Trustees of the Marine Biological Laboratory and the Advisory Board of the Maxwell School of Citizenship and Public Administration at Syracuse University. Mr. O'Hanley also chairs the Council on Asset Management for the Financial Services Roundtable and is a member of the Board of Directors of Institutional Investor's U.S. Institute. |
* Trustees have been determined to be "Interested Trustees" by virtue of, among other things, their affiliation with the trust or various entities under common control with FMR.
+ The information above includes each Trustee's principal occupation during the last five years and other information relating to the experience, attributes, and skills relevant to each Trustee's qualifications to serve as a Trustee, which led to the conclusion that each Trustee should serve as a Trustee for the fund.
Annual Report
Independent Trustees:
Correspondence intended for each Independent Trustee (that is, the Trustees other than the Interested Trustees) may be sent to Fidelity Investments, P.O. Box 55235, Boston, Massachusetts 02205-5235.
Name, Age; Principal Occupations and Other Relevant Experience+ |
Dennis J. Dirks (64) |
| Year of Election or Appointment: 2005 Prior to his retirement in May 2003, Mr. Dirks was Chief Operating Officer and a member of the Board of The Depository Trust & Clearing Corporation (DTCC). He also served as President, Chief Operating Officer, and Board member of The Depository Trust Company (DTC) and President and Board member of the National Securities Clearing Corporation (NSCC). In addition, Mr. Dirks served as Chief Executive Officer and Board member of the Government Securities Clearing Corporation, Chief Executive Officer and Board member of the Mortgage-Backed Securities Clearing Corporation, as a Trustee and a member of the Finance Committee of Manhattan College (2005-2008), and as a Trustee and a member of the Finance Committee of AHRC of Nassau County (2006-2008). Mr. Dirks is a member of the Independent Directors Council (IDC) Governing Council (2010-present) and Board of Directors for The Brookville Center for Children's Services, Inc. (2009-present). |
Alan J. Lacy (58) |
| Year of Election or Appointment: 2008 Mr. Lacy serves as Senior Adviser (2007-present) of Oak Hill Capital Partners, L.P. (private equity). Mr. Lacy also served as Chief Executive Officer (2000-2005) and Vice Chairman (2005-2006) of Sears Holdings Corporation and Sears, Roebuck and Co. (retail). In addition, Mr. Lacy serves as a member of the Board of Directors of Dave & Buster's Entertainment, Inc. (restaurant and entertainment complexes, 2010-present), Earth Fare, Inc. (retail grocery, 2012-present), The Hillman Companies, Inc. (hardware wholesalers, 2010-present), and Bristol-Myers Squibb Company (global pharmaceuticals, 2007-present). Mr. Lacy is a member of the Board of Trustees of The National Parks Conservation Association (2006-present). Previously, Mr. Lacy served as Chairman of the Board of Trustees of the National Parks Conservation Association (2008-2011) and as a member of the Board of Directors for the Western Union Company (global money transfer, 2006-2011). |
Ned C. Lautenbach (68) |
| Year of Election or Appointment: 2000 Mr. Lautenbach is Chairman of the Independent Trustees of the Equity and High Income Funds (2006-present). Mr. Lautenbach currently serves as the Lead Director of the Eaton Corporation Board of Directors (diversified industrial, 1997-present). Mr. Lautenbach is Chairman of the Board of Directors of the Philharmonic Center for the Arts in Naples, Florida (2012-present) and a member of the Council on Foreign Relations (1994-present). Previously, Mr. Lautenbach was a Partner/Advisory Partner at Clayton, Dubilier & Rice, LLC (private equity investment, 1998-2010), as well as a Director of Sony Corporation (2006-2007). |
Joseph Mauriello (67) |
| Year of Election or Appointment: 2008 Prior to his retirement in January 2006, Mr. Mauriello served in numerous senior management positions including Deputy Chairman and Chief Operating Officer (2004-2005), and Vice Chairman of Financial Services (2002-2004) of KPMG LLP US (professional services, 1965-2005). Mr. Mauriello currently serves as a member of the Board of Directors of XL Group plc. (global insurance and re-insurance, 2006-present). Previously, Mr. Mauriello served as a Director of the Hamilton Funds of the Bank of New York (2006-2007) and of Arcadia Resources Inc. (health care services and products, 2007-2012). |
Robert W. Selander (61) |
| Year of Election or Appointment: 2011 Previously, Mr. Selander served as a Member of the Advisory Board of Fidelity's Equity and High Income Funds (2011), Executive Vice Chairman (2010), Chief Executive Officer (2009-2010), and President and Chief Executive Officer (1997-2009) of Mastercard, Inc. |
Cornelia M. Small (68) |
| Year of Election or Appointment: 2005 Ms. Small is a member of the Board of Directors of the Teagle Foundation (2009-present). Ms. Small is also a member of the Investment Committee, and Chair (2008-present) and a member of the Board of Trustees of Smith College. In addition, Ms. Small serves on the Investment Committee of the Berkshire Taconic Community Foundation (2008-present). Previously, Ms. Small served as Chairperson of the Investment Committee (2002-2008) of Smith College. In addition, Ms. Small served as Chief Investment Officer, Director of Global Equity Investments, and a member of the Board of Directors of Scudder, Stevens & Clark and Scudder Kemper Investments. |
William S. Stavropoulos (73) |
| Year of Election or Appointment: 2002 Mr. Stavropoulos is Vice Chairman of the Independent Trustees of the Equity and High Income Funds (2006-present). Mr. Stavropoulos serves as President and Founder of the Michigan Baseball Foundation, the Great Lakes Loons (2007-present). Mr. Stavropoulos is Chairman Emeritus of the Board of Directors of The Dow Chemical Company, where he previously served in numerous senior management positions, including President, CEO (1995-2000; 2002-2004), Chairman of the Executive Committee (2000-2006), and as a member of the Board of Directors (1990-2006). Currently, Mr. Stavropoulos is Chairman of Univar (global distributor of commodity and specialty chemicals, 2010-present), a Director of Teradata Corporation (data warehousing and technology solutions, 2008-present), Chemical Financial Corporation, Maersk Inc. (industrial conglomerate), Tyco International, Inc. (multinational manufacturing and services, 2007-present), and a member of the Advisory Board for Metalmark Capital (private equity investment, 2005-present). Mr. Stavropoulos is a special advisor to Clayton, Dubilier & Rice, LLC (private equity investment). In addition, Mr. Stavropoulos is a member of the University of Notre Dame Advisory Council for the College of Science. |
David M. Thomas (63) |
| Year of Election or Appointment: 2008 Previously, Mr. Thomas served as Executive Chairman (2005-2006) and Chairman and Chief Executive Officer (2000-2005) of IMS Health, Inc. (pharmaceutical and healthcare information solutions). In addition, Mr. Thomas serves as a member of the Board of Directors of Fortune Brands, Inc. (consumer products), and Interpublic Group of Companies, Inc. (marketing communication, 2004-present). |
Michael E. Wiley (61) |
| Year of Election or Appointment: 2008 Mr. Wiley also serves as a Director of Asia Pacific Exploration Consolidated (international oil and gas exploration and production, 2008-present). Mr. Wiley serves as a Director of Tesoro Corporation (independent oil refiner and marketer, 2005-present), and a Director of Bill Barrett Corporation (exploration and production, 2005-present). In addition, Mr. Wiley also serves as a Director of Post Oak Bank (privately-held bank, 2004-present). Previously, Mr. Wiley served as a member of the Board of Trustees of the University of Tulsa (2000-2006; 2007-2010), as a Senior Energy Advisor of Katzenbach Partners, LLC (consulting, 2006-2007), as an Advisory Director of Riverstone Holdings (private investment), Chairman, President, and CEO of Baker Hughes, Inc. (oilfield services, 2000-2004), and as Director of Spinnaker Exploration Company (exploration and production, 2001-2005). |
Annual Report
Trustees and Officers - continued
+ The information above includes each Trustee's principal occupation during the last five years and other information relating to the experience, attributes, and skills relevant to each Trustee's qualifications to serve as a Trustee, which led to the conclusion that each Trustee should serve as a Trustee for the fund.
Advisory Board Members and Executive Officers:
Correspondence intended for David A. Rosow and Garnett A. Smith may be sent to Fidelity Investments, P.O. Box 55235, Boston, Massachusetts 02205-5235. Correspondence intended for each executive officer, Edward C. Johnson 3d, and Peter S. Lynch may be sent to Fidelity Investments, 82 Devonshire Street, Boston, Massachusetts 02109.
Name, Age; Principal Occupation |
Edward C. Johnson 3d (82) |
| Year of Election or Appointment: 2011 Member of the Advisory Board of Fidelity's Equity and High Income Funds. Mr. Johnson serves as Chief Executive Officer, Chairman, and a Director of FMR LLC, and also serves as Chairman and Director of FIL Limited. Previously, Mr. Johnson served as a Trustee and Chairman of the Board of certain Fidelity Trusts, Chairman and a Director of FMR, Chairman and a Director of FMR Co., Inc., and President of FMR LLC (2006-2007). |
Peter S. Lynch (68) |
| Year of Election or Appointment: 2003 Member of the Advisory Board of Fidelity's Equity and High Income Funds. Mr. Lynch is Vice Chairman and a Director of FMR and FMR Co., Inc. In addition, Mr. Lynch serves as a Trustee of Boston College and as the Chairman of the Inner-City Scholarship Fund. Previously, Mr. Lynch served on the Special Olympics International Board of Directors (1997-2006). |
David A. Rosow (69) |
| Year of Election or Appointment: 2012 Member of the Advisory Board of Fidelity's Equity and High Income Funds. Chairman and Chief Executive Officer of International Golf Group, Inc. (golf course development, 1990-present). Previously, Mr. Rosow served as Chairman and Chief Executive Officer of Rosow & Company, Inc. (private investment company, 1989-2011), a Lead Director of Hudson United Bancorp (2001-2006) and as a Director of TD Banknorth (1996-2006). In addition, Mr. Rosow is a member (2008-present) and President (2009-present) of the Town Council of Palm Beach, Florida. |
Garnett A. Smith (64) |
| Year of Election or Appointment: 2012 Member of the Advisory Board of Fidelity's Equity and High Income Funds. Prior to Mr. Smith's retirement, he served as Chairman and Chief Executive Officer of Inbrand Corp. (manufacturer of personal absorbent products, 1990-1997). He also served as President (1986-1990) of Inbrand Corp. Prior to his employment with Inbrand Corp., he was employed by a retail fabric chain and North Carolina National Bank. In addition, Mr. Smith is a board member of the Jackson Hole Land Trust (2009-present). |
Kenneth B. Robins (42) |
| Year of Election or Appointment: 2008 President and Treasurer of Fidelity's Equity and High Income Funds. Mr. Robins also serves as President and Treasurer (2010-present) and Assistant Treasurer (2009-present) of other Fidelity funds and is an employee of Fidelity Investments (2004-present). Previously, Mr. Robins served as Deputy Treasurer of the Fidelity funds (2005-2008) and Treasurer and Chief Financial Officer of The North Carolina Capital Management Trust: Cash and Term Portfolios (2006-2008). |
Bruce T. Herring (46) |
| Year of Election or Appointment: 2006 Vice President of certain Equity Funds. Mr. Herring also serves as President of Fidelity Research & Analysis Company (2010-present), Chief Investment Officer and Director of Fidelity Management & Research (U.K.) Inc. (2010-present) and Group Chief Investment Officer of FMR. Previously, Mr. Herring served as Vice President (2005-2006) and Senior Vice President (2006-2007) of Fidelity Management & Research Company, Vice President of FMR Co., Inc. (2001-2007) and as a portfolio manager for Fidelity U.S. Equity Funds. |
Brian B. Hogan (47) |
| Year of Election or Appointment: 2009 Vice President of Equity and High Income Funds. Mr. Hogan also serves as President of FMR's Equity Division (2009-present). Previously, Mr. Hogan served as Senior Vice President, Equity Research of FMR (2006-2009) and as a portfolio manager. |
Scott C. Goebel (44) |
| Year of Election or Appointment: 2008 Secretary and Chief Legal Officer (CLO) of the Fidelity funds. Mr. Goebel also serves as Secretary of Fidelity Investments Money Management, Inc. (FIMM) (2010-present) and Fidelity Research and Analysis Company (FRAC) (2010-present); Secretary and CLO of The North Carolina Capital Management Trust: Cash and Term Portfolios (2008-present); General Counsel, Secretary, and Senior Vice President of FMR (2008-present) and FMR Co., Inc. (2008-present); employed by FMR LLC or an affiliate (2001-present); Chief Legal Officer of Fidelity Management & Research (Hong Kong) Limited (2008-present) and Assistant Secretary of Fidelity Management & Research (Japan) Inc. (2008-present), and Fidelity Management & Research (U.K.) Inc. (2008-present). Previously, Mr. Goebel served as Assistant Secretary of FIMM (2008-2010), FRAC (2008-2010), and the Funds (2007-2008) and as Vice President and Secretary of Fidelity Distributors Corporation (FDC) (2005-2007). |
William C. Coffey (43) |
| Year of Election or Appointment: 2009 Assistant Secretary of Fidelity's Equity and High Income Funds. Mr. Coffey also serves as Senior Vice President and Deputy General Counsel of FMR LLC (2010-present), and is an employee of Fidelity Investments. Previously, Mr. Coffey served as Vice President and Associate General Counsel of FMR LLC (2005-2009). |
Elizabeth Paige Baumann (44) |
| Year of Election or Appointment: 2012 Anti-Money Laundering (AML) Officer of the Fidelity funds. Ms. Baumann also serves as AML Officer of The North Carolina Capital Management Trust: Cash and Term Portfolios (2012-present), Chief AML Officer of FMR LLC (2012-present), and is an employee of Fidelity Investments. Previously, Ms. Baumann served as Vice President and Deputy Anti-Money Laundering Officer (2007-2012). |
Christine Reynolds (53) |
| Year of Election or Appointment: 2008 Chief Financial Officer of the Fidelity funds. Ms. Reynolds became President of Fidelity Pricing and Cash Management Services (FPCMS) in August 2008. Ms. Reynolds served as Chief Operating Officer of FPCMS (2007-2008). Previously, Ms. Reynolds served as President, Treasurer, and Anti-Money Laundering officer of the Fidelity funds (2004-2007). |
Joseph A. Hanlon (44) |
| Year of Election or Appointment: 2012 Chief Compliance Officer of Fidelity's Equity and High Income Funds. Mr. Hanlon serves as Compliance Officer of FMR, FMR Co., Inc., Fidelity Investments Money Management, Inc. (FIMM), Fidelity Research and Analysis Company (FRAC), Fidelity Management & Research (Japan) Inc., Fidelity Management & Research (U.K.) Inc., Fidelity Management & Research (Hong Kong), and Strategic Advisers, Inc. (2009-present), as Senior Vice President of the Fidelity Asset Management Division (2009-present), and is an employee of Fidelity Investments. |
Joseph F. Zambello (55) |
| Year of Election or Appointment: 2011 Deputy Treasurer of the Fidelity funds. Mr. Zambello is an employee of Fidelity Investments. Previously, Mr. Zambello served as Vice President of FMR's Program Management Group (2009-2011) and Vice President of the Transfer Agent Oversight Group (2005-2009). |
Adrien E. Deberghes (44) |
| Year of Election or Appointment: 2008 Deputy Treasurer of Fidelity's Equity and High Income Funds. Mr. Deberghes also serves as Vice President (2011-present) and Assistant Treasurer (2010-present) of other Fidelity funds, and is an employee of Fidelity Investments (2008-present). Previously, Mr. Deberghes served as Senior Vice President of Mutual Fund Administration at State Street Corporation (2007-2008), Senior Director of Mutual Fund Administration at Investors Bank & Trust (2005-2007), and Director of Finance for Dunkin' Brands (2000-2005). |
Stephanie J. Dorsey (43) |
| Year of Election or Appointment: 2010 Assistant Treasurer of Fidelity's Equity and High Income Funds. Ms. Dorsey also serves as Deputy Treasurer of other Fidelity funds (2008-present) and is an employee of Fidelity Investments (2008-present). Previously, Ms. Dorsey served as Treasurer (2004-2008) of the JPMorgan Mutual Funds and Vice President (2004-2008) of JPMorgan Chase Bank. |
John R. Hebble (54) |
| Year of Election or Appointment: 2009 Assistant Treasurer of Fidelity's Equity and High Income Funds. Mr. Hebble also serves as President (2011-present), Treasurer, and Chief Financial Officer of The North Carolina Capital Management Trust: Cash and Term Portfolios (2008-present), President and Treasurer of other Fidelity funds (2008-present) and is an employee of Fidelity Investments. |
Gary W. Ryan (53) |
| Year of Election or Appointment: 2005 Assistant Treasurer of the Fidelity funds. Mr. Ryan is an employee of Fidelity Investments. Previously, Mr. Ryan served as Vice President of Fund Reporting in Fidelity Pricing and Cash Management Services (FPCMS) (1999-2005). |
Jonathan Davis (44) |
| Year of Election or Appointment: 2010 Assistant Treasurer of the Fidelity funds. Mr. Davis is also Assistant Treasurer of Fidelity Rutland Square Trust II and Fidelity Commonwealth Trust II. Mr. Davis is an employee of Fidelity Investments. Previously, Mr. Davis served as Vice President and Associate General Counsel of FMR LLC (2003-2010). |
Annual Report
The Board of Trustees of Fidelity Dividend Growth Fund voted to pay on record date, the following distributions per share derived from capital gains realized from sales of portfolio securities, and dividends derived from net investment income:
| Pay Date | Record Date | Dividends | Capital Gains |
Dividend Growth | 9/10/12 | 9/07/12 | $0.074 | $0.134 |
The fund hereby designates as a capital gain dividend with respect to the taxable year ended July 31, 2012 $33,089,253 or, if subsequently determined to be different, the net capital gain of such year.
Dividend Growth designates 100% of the dividends distributed during the fiscal year as qualifying for the dividends-received deduction for corporate shareholders.
Dividend Growth designates 100% of the dividends distributed during the fiscal year as amounts which may be taken into account as a dividend for the purposes of the maximum rate under section 1(h)(11) of the Internal Revenue Code.
The fund will notify shareholders in January 2013 of amounts for use in preparing 2012 income tax returns.
Annual Report
Board Approval of Investment Advisory Contracts and Management Fees
Fidelity Dividend Growth Fund
Each year, the Board of Trustees, including the Independent Trustees (together, the Board), votes on the renewal of the management contract and sub-advisory agreements (together, the Advisory Contracts) for the fund. The Board, assisted by the advice of fund counsel and Independent Trustees' counsel, requests and considers a broad range of information relevant to the renewal of the Advisory Contracts throughout the year.
The Board meets regularly and, at each of its meetings, considers factors that are relevant to its annual consideration of the renewal of the fund's Advisory Contracts, including the services and support provided to the fund and its shareholders. The Board has established various standing committees, each composed of and chaired by Independent Trustees with varying backgrounds, to which the Board has assigned specific subject matter responsibilities in order to enhance effective decision-making by the Board. The Board, acting directly and through its Committees, requests and receives information concerning the annual consideration of the renewal of the fund's Advisory Contracts. The Board also meets as needed to consider matters specifically related to the Board's annual consideration of the renewal of Advisory Contracts. Members of the Board may also meet with trustees of other Fidelity funds through ad hoc joint committees to discuss certain matters relevant to the Fidelity funds.
At its July 2012 meeting, the Board of Trustees, including the Independent Trustees, unanimously determined to renew the fund's Advisory Contracts. In reaching its determination, the Board considered all factors it believed relevant, including (i) the nature, extent, and quality of the services to be provided to the fund and its shareholders (including the investment performance of the fund); (ii) the competitiveness of the fund's management fee and total expense ratio relative to peer funds; (iii) the total costs of the services to be provided by and the profits to be realized by Fidelity from its relationship with the fund; (iv) the extent to which economies of scale exist and would be realized as the fund grows; and (v) whether fee levels reflect these economies of scale, if any, for the benefit of fund shareholders.
In considering whether to renew the Advisory Contracts for the fund, the Board reached a determination, with the assistance of fund counsel and Independent Trustees' counsel and through the exercise of its business judgment, that the renewal of the Advisory Contracts is in the best interests of the fund and its shareholders and that the compensation payable under the Advisory Contracts is fair and reasonable. The Board's decision to renew the Advisory Contracts was not based on any single factor, but rather was based on a comprehensive consideration of all the information provided to the Board at its meetings throughout the year. The Board, in reaching its determination to renew the Advisory Contracts, is aware that shareholders in the fund have a broad range of investment choices available to them, including a wide choice among mutual funds offered by Fidelity's competitors, and that the fund's shareholders, who have the opportunity to review and weigh the disclosure provided by the fund in its prospectus and other public disclosures, have chosen to invest in this fund, managed by Fidelity.
Annual Report
Nature, Extent, and Quality of Services Provided. The Board considered the staffing within the investment adviser, FMR, and the sub-advisers (together, the Investment Advisers), including the backgrounds of the fund's investment personnel, and also considered the fund's investment objective, strategies, and related investment philosophy. The Independent Trustees also had discussions with senior management of Fidelity's investment operations and investment groups. The Board considered the structure of the portfolio manager compensation program and whether this structure provides appropriate incentives to act in the best interests of the fund.
Resources Dedicated to Investment Management and Support Services. The Board and the Fund Oversight and Research Committees reviewed the general qualifications and capabilities of the Investment Advisers' investment staff, including its size, education, experience, and resources, as well as the Investment Advisers' approach to recruiting, training, managing, and compensating investment personnel. The Board also noted that FMR has continued to increase the resources devoted to non-U.S. offices, including expansion of Fidelity's global investment organization. The Board noted that Fidelity's analysts have extensive resources, tools and capabilities that allow them to conduct sophisticated quantitative and fundamental analysis, as well as credit analysis of issuers, counterparties and guarantors. The Board also believes that Fidelity's investment professionals have sufficient access to global information and data so as to provide competitive investment results over time, and that those professionals also have access to sophisticated tools that permit them to assess portfolio construction and risk and performance attribution characteristics continuously, as well as to transmit new information and research conclusions rapidly around the world. Additionally, in its deliberations, the Board considered the Investment Advisers' trading and risk management capabilities and resources, which are an integral part of the investment management process.
Shareholder and Administrative Services. The Board considered (i) the nature, extent, quality, and cost of advisory, administrative, and shareholder services performed by the Investment Advisers and their affiliates under the Advisory Contracts and under separate agreements covering transfer agency, pricing and bookkeeping, and securities lending services for the fund; (ii) the nature and extent of the supervision of third party service providers, principally custodians and subcustodians; and (iii) the resources devoted to, and the record of compliance with, the fund's compliance policies and procedures. The Board also reviewed the allocation of fund brokerage, including allocations to brokers affiliated with the Investment Advisers, the use of brokerage commissions to pay fund expenses, and the use of "soft" commission dollars to pay for research services.
Annual Report
Board Approval of Investment Advisory Contracts and
Management Fees - continued
The Board noted that the growth of fund assets over time across the complex allows Fidelity to reinvest in the development of services designed to enhance the value or convenience of the Fidelity funds as investment vehicles. These services include 24-hour access to account information and market information through telephone representatives and over the Internet, investor education materials and asset allocation tools, and the expanded availability of Fidelity Investor Centers.
Investment in a Large Fund Family. The Board considered the benefits to shareholders of investing in a Fidelity fund, including the benefits of investing in a fund that is part of a large family of funds offering a variety of investment disciplines and providing a large variety of mutual fund investor services. The Board noted that Fidelity had taken, or had made recommendations that resulted in the Fidelity funds taking, a number of actions over the previous year that benefited particular funds, including (i) continuing to dedicate additional resources to investment research and support of the senior management team that oversees asset management; (ii) persisting in efforts to enhance Fidelity's research capabilities, in particular, international research; (iii) launching new funds and making other enhancements to meet client needs for global and income-oriented solutions; (iv) continuing to launch dedicated lower cost underlying funds to meet investment management's portfolio construction needs related to expanding underlying fund options, specifically for the Freedom Fund product lines; (v) adopting a "Stock Selector" sector neutral investment approach and employing a team of portfolio managers who are sector specialists to manage certain funds; (vi) rationalizing product lines and gaining increased efficiencies through the mergers of several funds into other funds; (vii) strengthening the Spartan Index Fund product line by adding new funds and/or new low-cost institutional share classes, restructuring fund expenses to accommodate new classes, and reducing investment minimums for certain classes of shares; (viii) modifying the eligibility criteria for Institutional Class shares to increase their appeal to government entities and charitable investors; and (ix) reducing certain transfer agent fee rates.
Investment Performance. The Board considered whether the fund has operated in accordance with its investment objective, as well as its record of compliance with its investment restrictions. It also reviewed the fund's absolute investment performance for each class, as well as the fund's relative investment performance for each class measured over multiple periods against (i) a broad-based securities market index, and (ii) a peer group of mutual funds deemed appropriate by Fidelity and reviewed by the Board. The following charts considered by the Board show, over the one-, three-, and five-year periods ended December 31, 2011, as available, the cumulative total returns of Class K and the retail class of the fund, the cumulative total returns of a broad-based securities market index ("benchmark"), and a range of cumulative total returns of a peer group of mutual funds identified by Morningstar, Inc. as having an investment style similar to that of the fund based on underlying portfolio holdings. The box within each chart shows the 25th percentile return (top of box) and the 75th percentile return (bottom of box) of the peer group. Returns shown above the box are in the first quartile and returns shown below the box are in the fourth quartile. The percentage beaten numbers noted below each chart correspond to the percentile box and represent the percentage of funds in the peer group whose performance was equal to or lower than that of the class indicated.
Annual Report
Fidelity Dividend Growth Fund

The Board reviewed the fund's relative investment performance against its peer group and noted that the performance of the retail class of the fund (the class with the longer performance record) was in the fourth quartile for the one-year period, the first quartile for the three-year period, and the second quartile for the five-year period. The Board also noted that the investment performance of the fund was lower than its benchmark for the one- and five-year periods, although the three-year cumulative total return of the retail class compared favorably to its benchmark. The Board considered that the variations in performance between the fund's classes reflect the variations in class expenses, which result in lower performance for the higher expense class. The Board also reviewed the fund's performance since inception as well as performance in the current year.
The Board also considered that the fund's management fee is subject to upward or downward adjustment depending upon whether, and to what extent, the fund's investment performance for the performance period exceeds, or is exceeded by, the record (over the same period) of a Board-approved performance adjustment index. The Board noted that the performance adjustment provides FMR with a strong economic incentive to seek to achieve superior performance for the fund's shareholders and helps to more closely align the interests of FMR and the fund's shareholders.
Annual Report
Board Approval of Investment Advisory Contracts and
Management Fees - continued
Based on its review, the Board concluded that the nature, extent, and quality of services provided to the fund under the Advisory Contracts should benefit the fund's shareholders.
Competitiveness of Management Fee and Total Expense Ratio. The Board considered the fund's management fee and total expense ratio compared to "mapped groups" of competitive funds and classes. Fidelity creates "mapped groups" by combining similar Lipper investment objective categories that have comparable management fee characteristics. Combining Lipper investment objective categories aids the Board's management fee and total expense ratio comparisons by broadening the competitive group used for comparison and by reducing the number of universes to which various Fidelity funds are compared.
Management Fee. The Board considered two proprietary management fee comparisons for the 12-month periods shown in the chart below. The group of Lipper funds used by the Board for management fee comparisons is referred to below as the "Total Mapped Group." The Total Mapped Group comparison focuses on a fund's standing relative to the total universe of comparable funds available to investors in terms of gross management fees before expense reimbursements or caps, and without giving effect to the fund's performance adjustment. "TMG %" represents the percentage of funds in the Total Mapped Group that had management fees that were lower than the fund's. For example, a TMG % of 10% means that 90% of the funds in the Total Mapped Group had higher management fees than the fund. The "Asset-Size Peer Group" (ASPG) comparison focuses on a fund's standing relative to non-Fidelity funds similar in size to the fund within the Total Mapped Group. The ASPG represents at least 15% of the funds in the Total Mapped Group with comparable asset size and management fee characteristics, subject to a minimum of 50 funds (or all funds in the Total Mapped Group if fewer than 50). Additional information, such as the ASPG quartile in which the fund's management fee ranked and the impact of the fund's performance adjustment, is also included in the chart and considered by the Board.
Annual Report
Fidelity Dividend Growth Fund
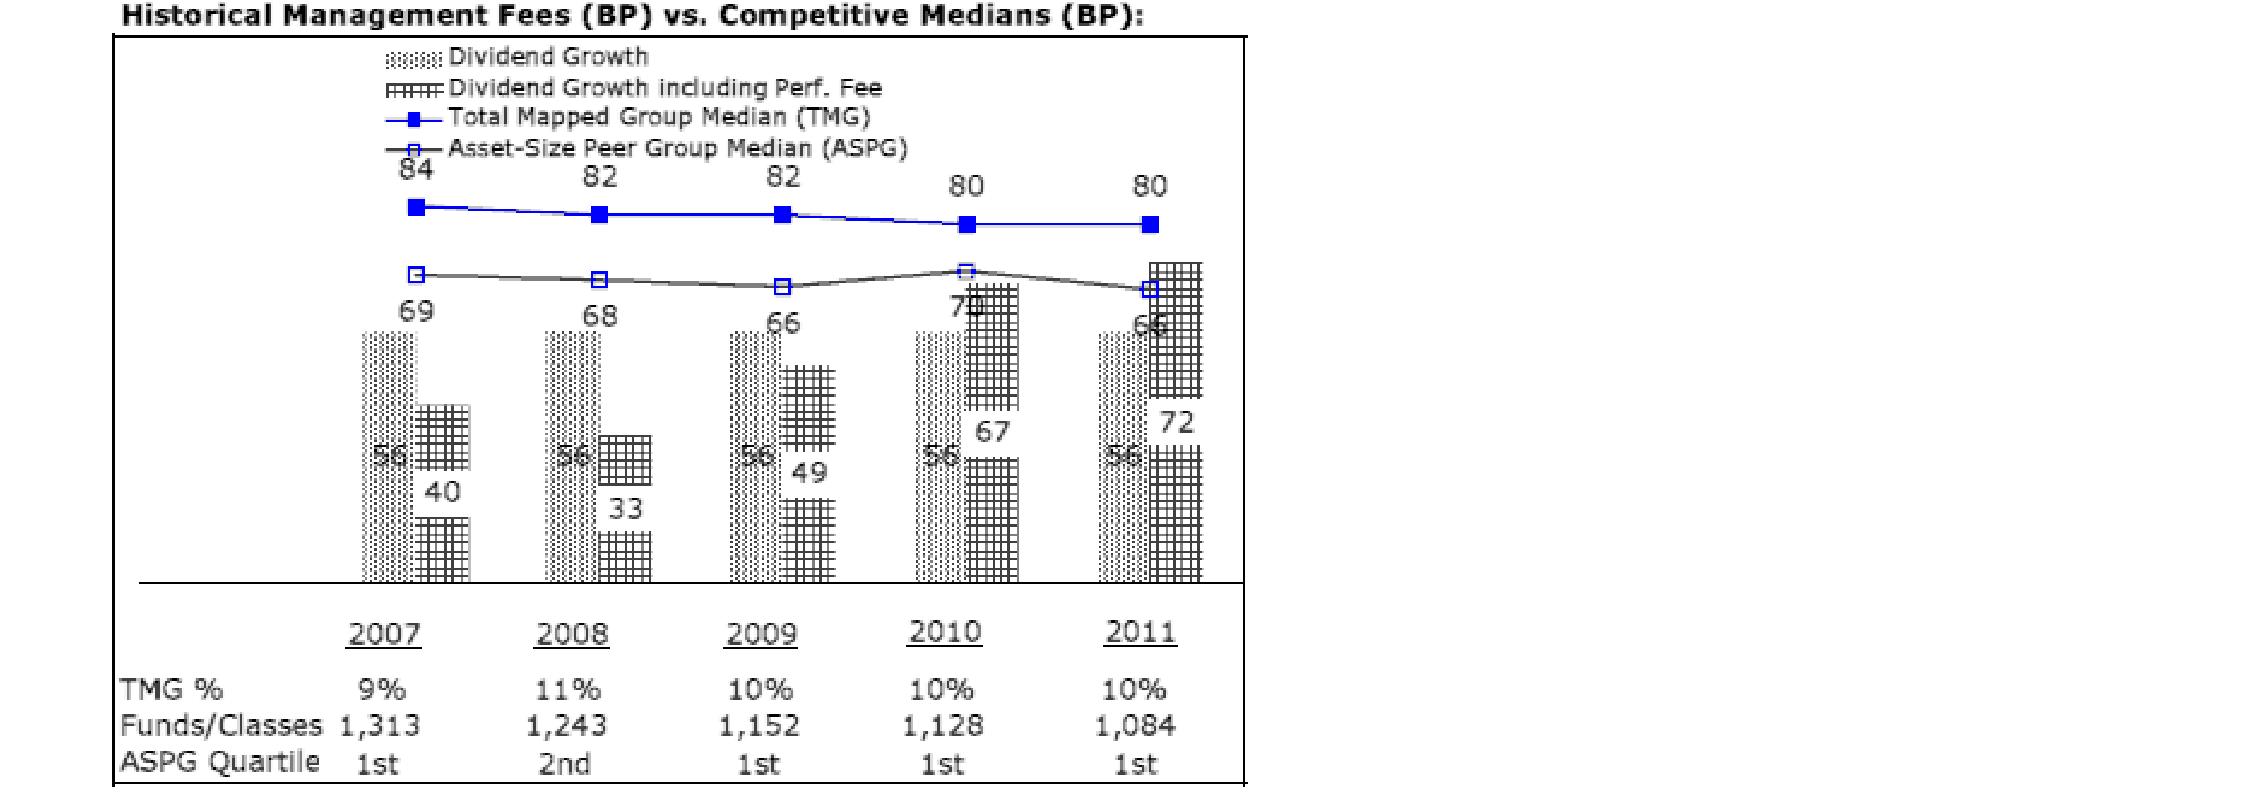
The Board noted that the fund's management fee ranked below the median of its Total Mapped Group and below the median of its ASPG for 2011. The Board also noted the effect of the fund's positive performance adjustment on the fund's management fee ranking. The Board noted that the performance adjustment for each year represents calculations for performance periods that differ from the periods shown in the performance charts above.
Based on its review, the Board concluded that the fund's management fee is fair and reasonable in light of the services that the fund receives and the other factors considered.
Total Expense Ratio. In its review of each class's total expense ratio, the Board considered the fund's management fee as well as other fund or class expenses, as applicable, such as transfer agent fees, pricing and bookkeeping fees, and custodial, legal, and audit fees. The Board also noted the effects of any waivers and reimbursements on fees and expenses, as well as the impact of the fund's performance adjustment. As part of its review, the Board also considered the current and historical total expense ratios of each class of the fund compared to competitive fund median expenses. Each class of the fund is compared to those funds and classes in the Total Mapped Group (used by the Board for management fee comparisons) that have a similar sales load structure.
The Board noted that the total expense ratio of each class ranked below its competitive median for 2011.
Fees Charged to Other Fidelity Clients. The Board also considered Fidelity fee structures and other information with respect to clients of FMR and its affiliates, such as other mutual funds advised or subadvised by FMR or its affiliates, pension plan clients, and other institutional clients. The Board noted the findings of the 2010 ad hoc joint committee (created with the board of other Fidelity funds), which reviewed and compared Fidelity's institutional investment advisory business with its business of providing services to the Fidelity funds, including the differences in services provided, fees charged, and costs incurred, as well as competition in their respective marketplaces.
Annual Report
Board Approval of Investment Advisory Contracts and
Management Fees - continued
Based on its review of total expense ratios and fees charged to other Fidelity clients, the Board concluded that the total expense ratio of each class of the fund was reasonable in light of the services that the fund and its shareholders receive and the other factors considered.
Costs of the Services and Profitability. The Board considered the revenues earned and the expenses incurred by Fidelity in conducting the business of developing, marketing, distributing, managing, administering and servicing the fund and its shareholders. The Board also considered the level of Fidelity's profits in respect of all the Fidelity funds.
On an annual basis, FMR presents to the Board Fidelity's profitability for the fund. Fidelity calculates the profitability for each fund, as well as aggregate profitability for groups of Fidelity funds and all Fidelity funds, using a series of detailed revenue and cost allocation methodologies which originate with the books and records of Fidelity on which Fidelity's audited financial statements are based. The Audit Committee of the Board reviews any significant changes from the prior year's methodologies.
PricewaterhouseCoopers LLP (PwC), independent registered public accounting firm and auditor to Fidelity and certain Fidelity funds, has been engaged annually by the Board as part of the Board's assessment of Fidelity's profitability analysis. PwC's engagement includes the review and assessment of Fidelity's methodologies used in determining the revenues and expenses attributable to Fidelity's mutual fund business, and completion of agreed-upon procedures surrounding the mathematical accuracy of fund profitability and its conformity to allocation methodologies. After considering PwC's reports issued under the engagement and information provided by Fidelity, the Board concluded that while other allocation methods may also be reasonable, Fidelity's profitability methodologies are reasonable in all material respects.
The Board also reviewed Fidelity's non-fund businesses and fall-out benefits related to the mutual fund business as well as cases where Fidelity's affiliates may benefit from or be related to the fund's business.
The Board considered the costs of the services provided by and the profits realized by Fidelity in connection with the operation of the fund and was satisfied that the profitability was not excessive in the circumstances.
Annual Report
Economies of Scale. The Board considered whether there have been economies of scale in respect of the management of the Fidelity funds, whether the Fidelity funds (including the fund) have appropriately benefited from any such economies of scale, and whether there is potential for realization of any further economies of scale. The Board considered the extent to which the fund will benefit from economies of scale through increased services to the fund, through waivers or reimbursements, or through fee or expense reductions. The Board also noted that in 2009, it and the board of other Fidelity funds created an ad hoc committee (the Economies of Scale Committee) to analyze whether FMR attains economies of scale in respect of the management and servicing of the Fidelity funds, whether the Fidelity funds have appropriately benefited from such economies of scale, and whether there is potential for realization of any further economies of scale.
The Board recognized that the fund's management contract incorporates a "group fee" structure, which provides for lower group fee rates as total fund assets under FMR's management increase, and for higher group fee rates as total fund assets under FMR's management decrease. FMR calculates the group fee rates based on a tiered asset "breakpoint" schedule that varies based on asset class. The Board considered that the group fee is designed to deliver the benefits of economies of scale to fund shareholders when total Fidelity fund assets increase, even if assets of any particular fund are unchanged or have declined, because some portion of Fidelity's costs are attributable to services provided to all Fidelity funds, and all funds benefit if those costs can be allocated among more assets. The Board concluded that, given the group fee structure, fund shareholders will benefit from lower management fees as assets under FMR's management increase at the fund complex level, regardless of whether Fidelity achieves any such economies of scale.
The Board concluded, taking into account the analysis of the Economies of Scale Committee, that economies of scale, if any, are being appropriately shared between fund shareholders and Fidelity.
Additional Information Requested by the Board. In order to develop fully the factual basis for consideration of the Fidelity funds' Advisory Contracts, the Board requested and received additional information on certain topics, including (i) fund performance trends, actions to be taken by FMR to improve certain funds' overall performance, and Fidelity's long-term strategies for certain funds; (ii) the potential to further rationalize the Fidelity fund lineup with the possibility of achieving savings for the funds and Fidelity; (iii) Fidelity's compensation structure for portfolio managers and other key investment personnel; (iv) the amount of the investment that each portfolio manager has made in the Fidelity fund(s) that he or she manages; (v) the realization of fall-out benefits in certain Fidelity business units; (vi) Fidelity's group fee structures, the potential impact of regulatory changes on such structures, and the rationale for the individual fee rates of certain funds; (vii) fund profitability methodology, including Fidelity's cost allocation methodology, and the impact of certain factors on fund profitability results; (viii) trends regarding industry use of performance fee structures and the possibility of implementing performance fee structures for additional funds; and (ix) the impact of net redemptions from the Fidelity funds.
Annual Report
Board Approval of Investment Advisory Contracts and
Management Fees - continued
Based on its evaluation of all of the conclusions noted above, and after considering all factors it believed relevant, the Board ultimately concluded that the advisory fee structures are fair and reasonable, and that the fund's Advisory Contracts should be renewed.
Annual Report
Investment Adviser
Fidelity Management & Research Company
Boston, MA
Investment Sub-Advisers
FMR Co., Inc.
Fidelity Management & Research
(U.K.) Inc.
Fidelity Management & Research
(Hong Kong) Limited
Fidelity Management & Research
(Japan) Inc.
General Distributor
Fidelity Distributors Corporation
Smithfield, RI
Transfer and Service Agents
Fidelity Investments Institutional
Operations Company, Inc.
Boston, MA
Fidelity Service Company, Inc.
Boston, MA
Custodian
Citibank, N.A.,
New York, NY
The Fidelity Telephone Connection
Mutual Fund 24-Hour Service
Exchanges/Redemptions
and Account Assistance 1-800-544-6666
Product Information 1-800-544-6666
Retirement Accounts 1-800-544-4774 (8 a.m. - 9 p.m.)
TDD Service 1-800-544-0118 for the deaf and hearing impaired
(9 a.m. - 9 p.m. Eastern time)
Fidelity Automated Service
Telephone (FAST®)
1-800-544-5555
Automated line for quickest service
(Fidelity Investment logo)(registered trademark)
Corporate Headquarters
82 Devonshire St., Boston, MA 02109
www.fidelity.com
DGF-UANN-0912
1.789245.109
Fidelity®
Leveraged Company Stock
Fund -
Class K
Annual Report
July 31, 2012
(Fidelity Cover Art)
Contents
Performance | (Click Here) | How the fund has done over time. |
Management's Discussion of Fund Performance | (Click Here) | The Portfolio Manager's review of fund performance and strategy. |
Shareholder Expense Example | (Click Here) | An example of shareholder expenses. |
Investment Changes | (Click Here) | A summary of major shifts in the fund's investments over the last six months. |
Investments | (Click Here) | A complete list of the fund's investments with their market values. |
Financial Statements | (Click Here) | Statements of assets and liabilities, operations, and changes in net assets, as well as financial highlights. |
Notes | (Click Here) | Notes to the financial statements. |
Report of Independent Registered Public Accounting Firm | (Click Here) | |
Trustees and Officers | (Click Here) | |
Distributions | (Click Here) | |
Board Approval of Investment Advisory Contracts and Management Fees | (Click Here) | |
To view a fund's proxy voting guidelines and proxy voting record for the 12-month period ended June 30, visit http://www.fidelity.com/proxyvotingresults or visit the Securities and Exchange Commission's (SEC) web site at http://www.sec.gov. You may also call 1-800-835-5092 to request a free copy of the proxy voting guidelines.
Standard & Poor's, S&P and S&P 500 are registered service marks of The McGraw-Hill Companies, Inc. and have been licensed for use by Fidelity Distributors Corporation.
Other third party marks appearing herein are the property of their respective owners.
All other marks appearing herein are registered or unregistered trademarks or service marks of FMR LLC or an affiliated company. © 2012 FMR LLC. All rights reserved.
Annual Report
This report and the financial statements contained herein are submitted for the general information of the shareholders of the fund. This report is not authorized for distribution to prospective investors in the fund unless preceded or accompanied by an effective prospectus.
A fund files its complete schedule of portfolio holdings with the SEC for the first and third quarters of each fiscal year on Form N-Q. Forms N-Q are available on the SEC's web site at http://www.sec.gov. A fund's Forms N-Q may be reviewed and copied at the SEC's Public Reference Room in Washington, DC. Information regarding the operation of the SEC's Public Reference Room may be obtained by calling 1-800-SEC-0330. For a complete list of a fund's portfolio holdings, view the most recent holdings listing, semiannual report, or annual report on Fidelity's web site at http://www.fidelity.com, http://www.advisor.fidelity.com, or http://www.401k.com, as applicable.
NOT FDIC INSURED • MAY LOSE VALUE • NO BANK GUARANTEE
Neither the fund nor Fidelity Distributors Corporation is a bank.
Annual Report
Average annual total return reflects the change in the value of an investment, assuming reinvestment of the class' distributions from dividend income and capital gains (the profits earned upon the sale of securities that have grown in value, if any) and assuming a constant rate of performance each year. The $10,000 table and the fund's returns do not reflect the deduction of taxes that a shareholder would pay on fund distributions or the redemption of fund shares. During periods of reimbursement by Fidelity, a fund's total return will be greater than it would be had the reimbursement not occurred. How a fund did yesterday is no guarantee of how it will do tomorrow.
Average Annual Total Returns
Periods ended July 31, 2012 | Past 1
year | Past 5
years | Past 10
years |
Class K A | -0.87% | -1.55% | 17.31% |
A The initial offering of Class K shares took place on May 9, 2008. Returns prior to May 9, 2008 are those of Fidelity® Leveraged Company Stock Fund, the original class of the fund.
$10,000 Over 10 Years
Let's say hypothetically that $10,000 was invested in Fidelity® Leveraged Company Stock Fund - Class K on July 31, 2002. The chart shows how the value of your investment would have changed, and also shows how the S&P 500® Index performed over the same period. The initial offering of Class K took place on May 9, 2008. See above for additional information regarding the performance of Class K.
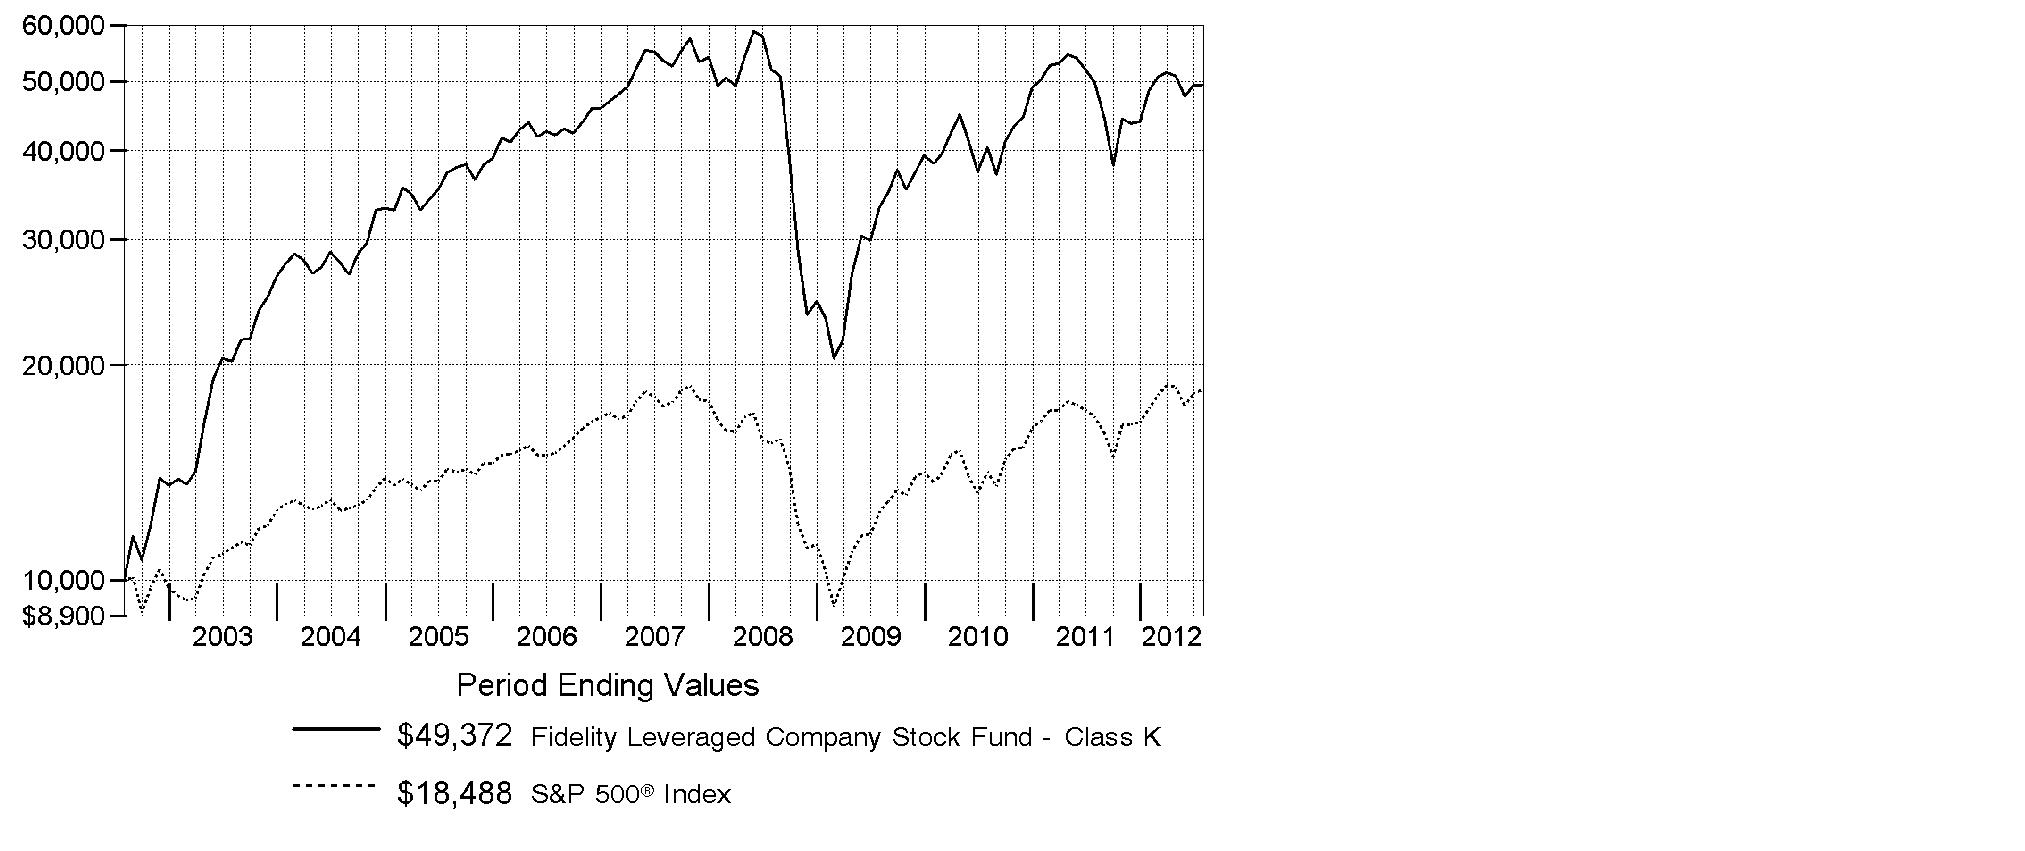
Annual Report
Market Recap: Major U.S. equity benchmarks posted solid gains for the year ending July 31, 2012, amid an uncertain investment environment. The broad-based S&P 500® Index returned 9.13%, while the blue-chip-laden Dow Jones Industrial AverageSM and technology-heavy Nasdaq Composite® Index gained 10.12% and 7.83%, respectively. Volatility spiked during the period's first half, as equities plummeted late last summer on Europe's debt woes, political wrangling over the U.S. debt ceiling and the sovereign credit-rating downgrade that followed. By October, a seemingly improved U.S. economy rejuvenated stocks, paving the way for major equity benchmarks to post their best first-quarter performance since 1998. However, more eurozone trouble, signs that the U.S. economy had turned sluggish and a slowdown in China caused stocks to slip in May, before a new wave of optimism took hold in June and July. Within the S&P 500®, more-defensive sectors such as telecommunication services (+30%) and consumer staples (+20%) fared best, while materials and energy significantly underperformed, returning -5%. Small- and mid-cap stocks trailed their less-volatile large-cap counterparts, with the Russell 2000® Index adding 0.19% and the Russell Midcap® Index rising 2.28%. Given turmoil and local currency weakness in Europe, foreign developed-markets stocks lost ground, with the MSCI® EAFE® Index returning -11.32%.
Comments from Thomas Soviero, Portfolio Manager of Fidelity® Leveraged Company Stock Fund: For the year, the fund's Class K shares returned -0.87%, underperforming the S&P 500® Index but beating the -7.76% return of the Credit Suisse Leveraged Equity Index. Relative to the S&P® index, the fund lost ground due to positioning in automobiles and components, an overweighting in materials - although the negative impact was more than offset by strong security selection here - positioning in health care and consumer staples, and stock selection in energy, capital goods and semiconductor/semiconductor equipment. Among individual stocks coal companies Peabody Energy and Alpha Natural Resources detracted, as did ON Semiconductor, video-game retailer GameStop and Ford Motor. On the plus side, the fund benefited from underweighting the weak financials sector. Contributors included chemicals company LyondellBasell Industries, pipeline provider El Paso and funeral home operator Service Corporation International. Some of the stocks I've mentioned in this report were not part of the S&P index and El Paso - which was acquired in May - was sold from the fund before period end.
The views expressed above reflect those of the portfolio manager(s) only through the end of the period as stated on the cover of this report and do not necessarily represent the views of Fidelity or any other person in the Fidelity organization. Any such views are subject to change at any time based upon market or other conditions and Fidelity disclaims any responsibility to update such views. These views may not be relied on as investment advice and, because investment decisions for a Fidelity fund are based on numerous factors, may not be relied on as an indication of trading intent on behalf of any Fidelity fund.
Annual Report
Shareholder Expense Example
As a shareholder of the Fund, you incur two types of costs: (1) transaction costs, including redemption fees and (2) ongoing costs, including management fees and other Fund expenses. This Example is intended to help you understand your ongoing costs (in dollars) of investing in the Fund and to compare these costs with the ongoing costs of investing in other mutual funds.
The Example is based on an investment of $1,000 invested at the beginning of the period and held for the entire period (February 1, 2012 to July 31, 2012).
Actual Expenses
The first line of the accompanying table for each class of the Fund provides information about actual account values and actual expenses. You may use the information in this line, together with the amount you invested, to estimate the expenses that you paid over the period. Simply divide your account value by $1,000.00 (for example, an $8,600 account value divided by $1,000.00 = 8.6), then multiply the result by the number in the first line for a class of the Fund under the heading entitled "Expenses Paid During Period" to estimate the expenses you paid on your account during this period. A small balance maintenance fee of $12.00 that is charged once a year may apply for certain accounts with a value of less than $2,000. This fee is not included in the table below. If it was, the estimate of expenses you paid during the period would be higher, and your ending account value lower, by this amount. In addition, the Fund, as a shareholder in the underlying Fidelity Central Funds, will indirectly bear its pro-rata share of the fees and expenses incurred by the underlying Fidelity Central Funds. These fees and expenses are not included in the Fund's annualized expense ratio used to calculate the expense estimate in the table below.
Hypothetical Example for Comparison Purposes
The second line of the accompanying table for each class of the Fund provides information about hypothetical account values and hypothetical expenses based on a Class' actual expense ratio and an assumed rate of return of 5% per year before expenses, which is not the Class' actual return. The hypothetical account values and expenses may not be used to estimate the actual ending account balance or expenses you paid for the period. You may use this information to compare the ongoing costs of investing in the Fund and other funds. To do so, compare this 5% hypothetical example with the 5% hypothetical examples that appear in the shareholder reports of the other funds. A small balance maintenance fee of $12.00 that is charged once a year may apply for certain accounts with a value of less than $2,000. This fee is not included in the table below. If it was, the estimate of expenses you paid during the period would be higher, and your ending account value lower, by this amount. In addition, the Fund, as a shareholder in the underlying Fidelity Central Funds, will indirectly bear its pro-rata share of the fees and expenses incurred by the underlying Fidelity Central Funds. These fees and expenses are not included in the Fund's annualized expense ratio used to calculate the expense estimate in the table below.
Please note that the expenses shown in the table are meant to highlight your ongoing costs only and do not reflect any transaction costs. Therefore, the second line of the table is useful in comparing ongoing costs only, and will not help you determine the relative total costs of owning different funds. In addition, if these transactional costs were included, your costs would have been higher.
Annual Report
| Annualized
Expense Ratio | Beginning
Account Value
February 1, 2012 | Ending
Account Value
July 31, 2012 | Expenses Paid
During Period*
February 1, 2012
to July 31, 2012 |
Leveraged Company Stock | .85% | | | |
Actual | | $ 1,000.00 | $ 1,015.80 | $ 4.26 |
HypotheticalA | | $ 1,000.00 | $ 1,020.64 | $ 4.27 |
Class K | .69% | | | |
Actual | | $ 1,000.00 | $ 1,016.50 | $ 3.46 |
HypotheticalA | | $ 1,000.00 | $ 1,021.43 | $ 3.47 |
A 5% return per year before expenses
* Expenses are equal to each Class' annualized expense ratio, multiplied by the average account value over the period, multiplied by 182/366 (to reflect the one-half year period).
Annual Report
Investment Changes (Unaudited)
Top Ten Stocks as of July 31, 2012 |
| % of fund's
net assets | % of fund's net assets
6 months ago |
LyondellBasell Industries NV Class A | 8.9 | 9.1 |
Service Corporation International | 4.9 | 4.6 |
Apple, Inc. | 4.4 | 3.7 |
The AES Corp. | 4.3 | 4.2 |
HollyFrontier Corp. | 3.1 | 2.1 |
Comcast Corp. Class A | 3.0 | 2.8 |
Merck & Co., Inc. | 1.9 | 1.0 |
Ford Motor Co. | 1.7 | 1.9 |
ON Semiconductor Corp. | 1.7 | 2.4 |
Cinemark Holdings, Inc. | 1.7 | 1.3 |
| 35.6 | |
Top Five Market Sectors as of July 31, 2012 |
| % of fund's
net assets | % of fund's net assets
6 months ago |
Consumer Discretionary | 21.5 | 22.4 |
Materials | 13.9 | 16.0 |
Energy | 11.3 | 9.5 |
Information Technology | 11.3 | 11.5 |
Industrials | 11.0 | 14.0 |
Asset Allocation (% of fund's net assets) |
As of July 31, 2012 * | As of January 31, 2012** |
 | Stocks 91.3% | | | Stocks 95.7% | |
 | Bonds 0.9% | | | Bonds 0.3% | |
 | Other Investments 0.4% | | | Other Investments 0.3% | |
 | Short-Term Investments and Net Other Assets (Liabilities) 7.4% | | | Short-Term Investments and Net Other Assets (Liabilities) 3.7% | |
* Foreign investments | 14.3% | | ** Foreign investments | 14.7% | |

Annual Report
Investments July 31, 2012
Showing Percentage of Net Assets
Common Stocks - 90.9% |
| Shares | | Value (000s) |
CONSUMER DISCRETIONARY - 20.7% |
Auto Components - 1.0% |
Delphi Automotive PLC | 163,300 | | $ 4,636 |
Exide Technologies (a)(f) | 3,930,293 | | 11,516 |
Tenneco, Inc. (a) | 97,700 | | 2,862 |
TRW Automotive Holdings Corp. (a) | 456,100 | | 17,925 |
| | 36,939 |
Automobiles - 3.4% |
Daimler AG (United States) | 209,400 | | 10,426 |
Ford Motor Co. | 6,790,633 | | 62,745 |
General Motors Co. (a) | 1,647,566 | | 32,474 |
General Motors Co.: | | | |
warrants 7/10/16 (a) | 445,805 | | 4,922 |
warrants 7/10/19 (a) | 445,805 | | 3,005 |
Motors Liquidation Co. GUC Trust (a) | 123,112 | | 1,741 |
Toyota Motor Corp. sponsored ADR | 89,500 | | 6,848 |
| | 122,161 |
Diversified Consumer Services - 5.2% |
Service Corporation International (f) | 13,723,282 | | 176,344 |
Stewart Enterprises, Inc. Class A (e) | 1,515,242 | | 10,349 |
| | 186,693 |
Hotels, Restaurants & Leisure - 0.5% |
Penn National Gaming, Inc. (a) | 416,040 | | 16,192 |
Station Holdco LLC warrants 6/15/18 (a)(i)(j) | 146,846 | | 7 |
| | 16,199 |
Household Durables - 2.0% |
Hovnanian Enterprises, Inc. Class A (a)(e) | 1,419,000 | | 3,292 |
Lennar Corp. Class A (e) | 983,400 | | 28,725 |
Newell Rubbermaid, Inc. | 2,341,747 | | 41,332 |
| | 73,349 |
Leisure Equipment & Products - 0.2% |
Callaway Golf Co. (e) | 1,630,035 | | 8,949 |
Media - 5.3% |
Belo Corp. Series A | 163,800 | | 1,122 |
Cablevision Systems Corp. - NY Group Class A | 541,324 | | 8,304 |
Cinemark Holdings, Inc. | 2,601,645 | | 60,826 |
Comcast Corp. Class A | 3,302,598 | | 107,500 |
Gray Television, Inc. (a)(f) | 3,766,164 | | 6,327 |
Nexstar Broadcasting Group, Inc. Class A (a) | 1,130,500 | | 7,371 |
| | 191,450 |
Common Stocks - continued |
| Shares | | Value (000s) |
CONSUMER DISCRETIONARY - continued |
Multiline Retail - 0.6% |
Target Corp. | 338,600 | | $ 20,536 |
Specialty Retail - 1.9% |
Asbury Automotive Group, Inc. (a) | 385,122 | | 10,075 |
GameStop Corp. Class A (e) | 3,156,107 | | 50,561 |
Sally Beauty Holdings, Inc. (a) | 300,000 | | 7,926 |
| | 68,562 |
Textiles, Apparel & Luxury Goods - 0.6% |
Coach, Inc. | 123,220 | | 6,078 |
PVH Corp. | 188,310 | | 14,957 |
| | 21,035 |
TOTAL CONSUMER DISCRETIONARY | | 745,873 |
CONSUMER STAPLES - 2.7% |
Food & Staples Retailing - 0.6% |
Whole Foods Market, Inc. | 222,009 | | 20,376 |
Food Products - 1.9% |
Darling International, Inc. (a) | 3,476,642 | | 57,434 |
Smithfield Foods, Inc. (a) | 559,606 | | 10,353 |
| | 67,787 |
Personal Products - 0.2% |
Revlon, Inc. (a) | 553,261 | | 8,050 |
TOTAL CONSUMER STAPLES | | 96,213 |
ENERGY - 11.3% |
Energy Equipment & Services - 3.1% |
Ensco PLC Class A | 110,000 | | 5,976 |
Halliburton Co. | 1,126,593 | | 37,324 |
Noble Corp. | 447,200 | | 16,546 |
Oil States International, Inc. (a) | 270,700 | | 19,680 |
Parker Drilling Co. (a) | 1,200,000 | | 5,556 |
Schlumberger Ltd. | 109,400 | | 7,796 |
Transocean Ltd. (United States) | 381,900 | | 17,884 |
| | 110,762 |
Oil, Gas & Consumable Fuels - 8.2% |
Alpha Natural Resources, Inc. (a) | 1,098,500 | | 7,700 |
Chesapeake Energy Corp. (e) | 1,090,491 | | 20,523 |
Continental Resources, Inc. (a)(e) | 534,087 | | 34,176 |
Common Stocks - continued |
| Shares | | Value (000s) |
ENERGY - continued |
Oil, Gas & Consumable Fuels - continued |
Forest Oil Corp. (a) | 1,205,652 | | $ 8,259 |
Hess Corp. | 109,600 | | 5,169 |
HollyFrontier Corp. | 2,997,133 | | 112,063 |
Nexen, Inc. | 188,000 | | 4,777 |
Peabody Energy Corp. | 822,825 | | 17,181 |
Range Resources Corp. | 247,200 | | 15,475 |
Valero Energy Corp. | 1,438,166 | | 39,550 |
Western Refining, Inc. (e) | 1,403,970 | | 33,035 |
| | 297,908 |
TOTAL ENERGY | | 408,670 |
FINANCIALS - 6.5% |
Capital Markets - 0.5% |
Morgan Stanley | 1,187,000 | | 16,214 |
Commercial Banks - 2.8% |
Huntington Bancshares, Inc. | 8,526,580 | | 52,993 |
Regions Financial Corp. | 3,284,894 | | 22,863 |
SunTrust Banks, Inc. | 1,019,600 | | 24,114 |
| | 99,970 |
Consumer Finance - 0.5% |
American Express Co. | 335,547 | | 19,364 |
Diversified Financial Services - 0.6% |
Citigroup, Inc. | 855,847 | | 23,219 |
Insurance - 1.4% |
AFLAC, Inc. | 641,700 | | 28,094 |
Assured Guaranty Ltd. | 1,249,684 | | 14,971 |
Lincoln National Corp. | 435,700 | | 8,736 |
| | 51,801 |
Real Estate Investment Trusts - 0.7% |
Host Hotels & Resorts, Inc. | 1,016,122 | | 14,917 |
Sabra Health Care REIT, Inc. | 547,507 | | 10,140 |
| | 25,057 |
TOTAL FINANCIALS | | 235,625 |
Common Stocks - continued |
| Shares | | Value (000s) |
HEALTH CARE - 7.5% |
Health Care Equipment & Supplies - 0.9% |
Alere, Inc. (a) | 419,708 | | $ 7,920 |
Boston Scientific Corp. (a) | 4,796,000 | | 24,795 |
| | 32,715 |
Health Care Providers & Services - 4.4% |
Community Health Systems, Inc. (a) | 784,376 | | 19,303 |
DaVita, Inc. (a) | 367,826 | | 36,201 |
HCA Holdings, Inc. | 1,216,779 | | 32,220 |
Kindred Healthcare, Inc. (a) | 108,330 | | 1,026 |
Sun Healthcare Group, Inc. (a) | 547,507 | | 4,577 |
Tenet Healthcare Corp. (a) | 10,697,206 | | 49,421 |
Universal Health Services, Inc. Class B | 385,505 | | 15,066 |
| | 157,814 |
Pharmaceuticals - 2.2% |
Johnson & Johnson | 153,000 | | 10,591 |
Merck & Co., Inc. | 1,577,900 | | 69,696 |
| | 80,287 |
TOTAL HEALTH CARE | | 270,816 |
INDUSTRIALS - 10.7% |
Aerospace & Defense - 1.0% |
Teledyne Technologies, Inc. (a) | 340,694 | | 21,225 |
Textron, Inc. | 602,700 | | 15,700 |
| | 36,925 |
Airlines - 2.1% |
Delta Air Lines, Inc. (a) | 4,757,234 | | 45,907 |
Southwest Airlines Co. | 571,283 | | 5,250 |
United Continental Holdings, Inc. (a) | 370,700 | | 7,003 |
US Airways Group, Inc. (a)(e) | 1,481,380 | | 16,977 |
| | 75,137 |
Building Products - 1.0% |
Armstrong World Industries, Inc. | 693,300 | | 26,796 |
Owens Corning (a) | 294,219 | | 7,903 |
Owens Corning warrants 10/31/13 (a) | 406,600 | | 305 |
| | 35,004 |
Common Stocks - continued |
| Shares | | Value (000s) |
INDUSTRIALS - continued |
Commercial Services & Supplies - 1.6% |
Deluxe Corp. | 1,786,873 | | $ 50,604 |
R.R. Donnelley & Sons Co. (e) | 450,900 | | 5,465 |
| | 56,069 |
Electrical Equipment - 1.4% |
Belden, Inc. | 777,664 | | 24,986 |
Emerson Electric Co. | 163,500 | | 7,810 |
General Cable Corp. (a) | 437,132 | | 11,422 |
Polypore International, Inc. (a)(e) | 217,800 | | 8,093 |
| | 52,311 |
Industrial Conglomerates - 1.3% |
Carlisle Companies, Inc. | 109,910 | | 5,549 |
General Electric Co. | 1,103,883 | | 22,906 |
Tyco International Ltd. | 328,233 | | 18,033 |
| | 46,488 |
Machinery - 1.5% |
Fiat Industrial SpA | 1,634,423 | | 16,088 |
Ingersoll-Rand PLC | 739,500 | | 31,362 |
Timken Co. | 228,734 | | 8,280 |
| | 55,730 |
Marine - 0.2% |
Navios Maritime Holdings, Inc. | 2,162,794 | | 7,591 |
Road & Rail - 0.5% |
Avis Budget Group, Inc. (a) | 719,914 | | 10,345 |
Hertz Global Holdings, Inc. (a) | 707,700 | | 7,969 |
| | 18,314 |
Trading Companies & Distributors - 0.1% |
Edgen Group, Inc. Class A | 482,300 | | 3,617 |
TOTAL INDUSTRIALS | | 387,186 |
INFORMATION TECHNOLOGY - 11.3% |
Communications Equipment - 1.1% |
Cisco Systems, Inc. | 2,383,049 | | 38,010 |
Computers & Peripherals - 4.4% |
Apple, Inc. | 260,413 | | 159,050 |
Electronic Equipment & Components - 1.0% |
Avnet, Inc. (a) | 594,313 | | 18,721 |
Common Stocks - continued |
| Shares | | Value (000s) |
INFORMATION TECHNOLOGY - continued |
Electronic Equipment & Components - continued |
Corning, Inc. | 726,800 | | $ 8,293 |
Viasystems Group, Inc. (a) | 540,460 | | 8,323 |
| | 35,337 |
Internet Software & Services - 0.2% |
VeriSign, Inc. (a) | 194,300 | | 8,631 |
Office Electronics - 0.3% |
Xerox Corp. | 1,756,342 | | 12,171 |
Semiconductors & Semiconductor Equipment - 3.6% |
Fairchild Semiconductor International, Inc. (a) | 1,122,274 | | 15,555 |
Freescale Semiconductor Holdings I Ltd. (a) | 584,500 | | 6,237 |
Intel Corp. | 454,981 | | 11,693 |
Intersil Corp. Class A | 1,460,387 | | 13,450 |
Micron Technology, Inc. (a) | 2,293,545 | | 14,243 |
NXP Semiconductors NV (a) | 275,200 | | 6,217 |
ON Semiconductor Corp. (a) | 8,823,313 | | 61,234 |
| | 128,629 |
Software - 0.7% |
Citrix Systems, Inc. (a) | 230,899 | | 16,782 |
Microsoft Corp. | 108,800 | | 3,206 |
Nuance Communications, Inc. (a) | 219,300 | | 4,463 |
| | 24,451 |
TOTAL INFORMATION TECHNOLOGY | | 406,279 |
MATERIALS - 13.9% |
Chemicals - 11.3% |
Dow Chemical Co. | 832,388 | | 23,956 |
H.B. Fuller Co. | 461,829 | | 13,495 |
LyondellBasell Industries NV Class A | 7,208,712 | | 321,002 |
OMNOVA Solutions, Inc. (a)(f) | 3,114,962 | | 22,677 |
Phosphate Holdings, Inc. (a) | 307,500 | | 1,122 |
W.R. Grace & Co. (a) | 480,404 | | 26,922 |
| | 409,174 |
Containers & Packaging - 1.7% |
Rock-Tenn Co. Class A | 733,723 | | 42,717 |
Sealed Air Corp. | 1,091,149 | | 17,677 |
| | 60,394 |
Metals & Mining - 0.6% |
AngloGold Ashanti Ltd. sponsored ADR | 526,100 | | 17,893 |
Common Stocks - continued |
| Shares | | Value (000s) |
MATERIALS - continued |
Metals & Mining - continued |
Ormet Corp. (a) | 330,000 | | $ 891 |
Ormet Corp. (a)(j) | 1,075,000 | | 2,903 |
| | 21,687 |
Paper & Forest Products - 0.3% |
Neenah Paper, Inc. | 418,300 | | 11,236 |
TOTAL MATERIALS | | 502,491 |
TELECOMMUNICATION SERVICES - 0.9% |
Diversified Telecommunication Services - 0.9% |
CenturyLink, Inc. | 771,680 | | 32,056 |
UTILITIES - 5.4% |
Independent Power Producers & Energy Traders - 5.4% |
Calpine Corp. (a) | 2,361,000 | | 40,349 |
The AES Corp. (a) | 12,738,524 | | 153,627 |
| | 193,976 |
TOTAL COMMON STOCKS (Cost $2,963,145) |
3,279,185
|
Nonconvertible Preferred Stocks - 0.4% |
| | | |
CONSUMER STAPLES - 0.1% |
Personal Products - 0.1% |
Revlon, Inc. Series A 12.75% | 639,576 | | 3,562 |
FINANCIALS - 0.3% |
Diversified Financial Services - 0.3% |
GMAC Capital Trust I Series 2, 8.125% | 439,013 | | 10,703 |
TOTAL NONCONVERTIBLE PREFERRED STOCKS (Cost $19,207) |
14,265
|
Nonconvertible Bonds - 0.9% |
| Principal Amount (000s) | | |
CONSUMER DISCRETIONARY - 0.8% |
Automobiles - 0.0% |
General Motors Corp.: | | | | |
6.75% 5/1/28 (d) | | $ 3,075 | | 0 |
Nonconvertible Bonds - continued |
| Principal Amount (000s) | | Value (000s) |
CONSUMER DISCRETIONARY - continued |
Automobiles - continued |
General Motors Corp.: - continued | | | | |
7.125% 7/15/13 (d) | | $ 8,320 | | $ 0 |
7.2% 1/15/11 (d) | | 22,980 | | 0 |
8.25% 7/15/23 (d) | | 25,035 | | 0 |
8.375% 7/15/33 (d) | | 50,210 | | 0 |
8.8% 3/1/21 (d) | | 10,765 | | 0 |
Household Durables - 0.0% |
K. Hovnanian Enterprises, Inc. 8.625% 1/15/17 | | 1,090 | | 861 |
Multiline Retail - 0.8% |
The Bon-Ton Department Stores, Inc. 10.625% 7/15/17 (g) | | 34,820 | | 27,856 |
TOTAL CONSUMER DISCRETIONARY | | 28,717 |
FINANCIALS - 0.1% |
Commercial Banks - 0.1% |
Regions Bank 6.45% 6/26/37 | | 5,430 | | 5,376 |
TOTAL NONCONVERTIBLE BONDS (Cost $32,981) |
34,093
|
Floating Rate Loans - 0.4% |
|
INDUSTRIALS - 0.3% |
Airlines - 0.3% |
US Airways Group, Inc. term loan 2.7462% 3/23/14 (h) | | 10,835 | | 10,402 |
UTILITIES - 0.1% |
Electric Utilities - 0.1% |
Texas Competitive Electric Holdings Co. LLC/Texas Competitive Electric Holdings Finance, Inc. Tranche B, term loan 4.7458% 10/10/17 (h) | | 5,458 | | 3,472 |
TOTAL FLOATING RATE LOANS (Cost $14,544) |
13,874
|
Money Market Funds - 8.7% |
| Shares | | Value (000s) |
Fidelity Cash Central Fund, 0.17% (b) | 269,397,752 | | $ 269,398 |
Fidelity Securities Lending Cash Central Fund, 0.18% (b)(c) | 43,365,490 | | 43,365 |
TOTAL MONEY MARKET FUNDS (Cost $312,763) |
312,763
|
TOTAL INVESTMENT PORTFOLIO - 101.3% (Cost $3,342,640) | 3,654,180 |
NET OTHER ASSETS (LIABILITIES) - (1.3)% | (45,114) |
NET ASSETS - 100% | $ 3,609,066 |
Legend |
(a) Non-income producing |
(b) Affiliated fund that is available only to investment companies and other accounts managed by Fidelity Investments. The rate quoted is the annualized seven-day yield of the fund at period end. A complete unaudited listing of the fund's holdings as of its most recent quarter end is available upon request. In addition, each Fidelity Central Fund's financial statements, which are not covered by the Fund's Report of Independent Registered Public Accounting Firm, are available on the SEC's website or upon request. |
(c) Investment made with cash collateral received from securities on loan. |
(d) Non-income producing - Security is in default. |
(e) Security or a portion of the security is on loan at period end. |
(f) Affiliated company |
(g) Security exempt from registration under Rule 144A of the Securities Act of 1933. These securities may be resold in transactions exempt from registration, normally to qualified institutional buyers. At the end of the period, the value of these securities amounted to $27,856,000 or 0.8% of net assets. |
(h) Coupon rates for floating and adjustable rate securities reflect the rates in effect at period end. |
(i) Investment is owned by an entity that is treated as a corporation for U.S. tax purposes which is owned by the Fund. |
(j) Restricted securities - Investment in securities not registered under the Securities Act of 1933 (excluding 144A issues). At the end of the period, the value of restricted securities (excluding 144A issues) amounted to $2,910,000 or 0.1% of net assets. |
Additional information on each restricted holding is as follows: |
Security | Acquisition Date | Acquisition Cost (000s) |
Ormet Corp. | 2/27/07 - 4/4/07 | $ 20,556 |
Station Holdco LLC warrants 6/15/18 | 10/28/08 - 12/1/08 | $ 5,990 |
Affiliated Central Funds |
Information regarding fiscal year to date income earned by the Fund from investments in Fidelity Central Funds is as follows: |
Fund | Income earned
(Amounts in thousands) |
Fidelity Cash Central Fund | $ 320 |
Fidelity Securities Lending Cash Central Fund | 1,584 |
Total | $ 1,904 |
Other Affiliated Issuers |
An affiliated company is a company in which the Fund has ownership of at least 5% of the voting securities. Fiscal year to date transactions with companies which are or were affiliates are as follows: |
Affiliate
(Amounts in thousands) | Value, beginning of period | Purchases | Sales Proceeds | Dividend Income | Value,
end of
period |
Cenveo, Inc. | $ 21,182 | $ - | $ 9,881 | $ - | $ - |
Exide Technologies | 26,087 | 897 | - | - | 11,516 |
Gray Television, Inc. | 9,152 | - | - | - | 6,327 |
OMNOVA Solutions, Inc. | 18,584 | 1,893 | - | - | 22,677 |
Service Corporation International | 160,784 | 4,160 | 22,896 | 3,090 | 176,344 |
Total | $ 235,789 | $ 6,950 | $ 32,777 | $ 3,090 | $ 216,864 |
Other Information |
The following is a summary of the inputs used, as of July 31, 2012, involving the Fund's assets and liabilities carried at fair value. The inputs or methodology used for valuing securities may not be an indication of the risk associated with investing in those securities. For more information on valuation inputs, and their aggregation into the levels used in the table below, please refer to the Security Valuation section in the accompanying Notes to Financial Statements. |
Valuation Inputs at Reporting Date: |
Description
(Amounts in thousands) | Total | Level 1 | Level 2 | Level 3 |
Investments in Securities: | | | | |
Equities: | | | | |
Consumer Discretionary | $ 745,873 | $ 745,866 | $ - | $ 7 |
Consumer Staples | 99,775 | 96,213 | - | 3,562 |
Energy | 408,670 | 408,670 | - | - |
Financials | 246,328 | 246,328 | - | - |
Health Care | 270,816 | 270,816 | - | - |
Industrials | 387,186 | 387,186 | - | - |
Information Technology | 406,279 | 406,279 | - | - |
Materials | 502,491 | 502,491 | - | - |
Telecommunication Services | 32,056 | 32,056 | - | - |
Utilities | 193,976 | 193,976 | - | - |
Corporate Bonds | 34,093 | - | 34,093 | - |
Floating Rate Loans | 13,874 | - | 13,874 | - |
Money Market Funds | 312,763 | 312,763 | - | - |
Total Investments in Securities: | $ 3,654,180 | $ 3,602,644 | $ 47,967 | $ 3,569 |
Distribution of investments by country or territory of incorporation, as a percentage of total net assets, is as follows. (Unaudited) |
United States of America | 85.7% |
Netherlands | 9.1% |
Switzerland | 1.5% |
Others (Individually Less Than 1%) | 3.7% |
| 100.0% |
See accompanying notes which are an integral part of the financial statements.
Annual Report
Statement of Assets and Liabilities
Amounts in thousands (except per-share amounts) | July 31, 2012 |
| | |
Assets | | |
Investment in securities, at value (including securities loaned of $42,040) - See accompanying schedule: Unaffiliated issuers (cost $2,850,762) | $ 3,124,553 | |
Fidelity Central Funds (cost $312,763) | 312,763 | |
Other affiliated issuers (cost $179,115) | 216,864 | |
Total Investments (cost $3,342,640) | | $ 3,654,180 |
Receivable for investments sold | | 3,306 |
Receivable for fund shares sold | | 1,879 |
Dividends receivable | | 426 |
Interest receivable | | 287 |
Distributions receivable from Fidelity Central Funds | | 127 |
Other receivables | | 68 |
Total assets | | 3,660,273 |
| | |
Liabilities | | |
Payable for fund shares redeemed | $ 5,325 | |
Accrued management fee | 1,836 | |
Other affiliated payables | 624 | |
Other payables and accrued expenses | 57 | |
Collateral on securities loaned, at value | 43,365 | |
Total liabilities | | 51,207 |
| | |
Net Assets | | $ 3,609,066 |
Net Assets consist of: | | |
Paid in capital | | $ 3,894,684 |
Distributions in excess of net investment income | | (18,505) |
Accumulated undistributed net realized gain (loss) on investments and foreign currency transactions | | (578,653) |
Net unrealized appreciation (depreciation) on investments | | 311,540 |
Net Assets | | $ 3,609,066 |
Leveraged Company Stock:
Net Asset Value, offering price and redemption price per share ($3,008,796 ÷ 106,617 shares) | | $ 28.22 |
| | |
Class K:
Net Asset Value, offering price and redemption price per share ($600,270 ÷ 21,243 shares) | | $ 28.26 |
See accompanying notes which are an integral part of the financial statements.
Annual Report
Financial Statements - continued
Statement of Operations
Amounts in thousands | Year ended July 31, 2012 |
| | |
Investment Income | | |
Dividends (including $3,090 earned from other affiliated issuers) | | $ 47,272 |
Interest | | 4,214 |
Income from Fidelity Central Funds | | 1,904 |
Total income | | 53,390 |
| | |
Expenses | | |
Management fee | $ 22,473 | |
Transfer agent fees | 6,943 | |
Accounting and security lending fees | 1,036 | |
Custodian fees and expenses | 45 | |
Independent trustees' compensation | 25 | |
Registration fees | 83 | |
Audit | 61 | |
Legal | 18 | |
Miscellaneous | 43 | |
Total expenses before reductions | 30,727 | |
Expense reductions | (256) | 30,471 |
Net investment income (loss) | | 22,919 |
Realized and Unrealized Gain (Loss) Net realized gain (loss) on: | | |
Investment securities: | | |
Unaffiliated issuers | 189,996 | |
Other affiliated issuers | (26,964) | |
Foreign currency transactions | (17) | |
Total net realized gain (loss) | | 163,015 |
Change in net unrealized appreciation (depreciation) on: Investment securities | (307,253) | |
Assets and liabilities in foreign currencies | (2) | |
Total change in net unrealized appreciation (depreciation) | | (307,255) |
Net gain (loss) | | (144,240) |
Net increase (decrease) in net assets resulting from operations | | $ (121,321) |
See accompanying notes which are an integral part of the financial statements.
Annual Report
Statement of Changes in Net Assets
Amounts in thousands | Year ended
July 31,
2012 | Year ended
July 31,
2011 |
Increase (Decrease) in Net Assets | | |
Operations | | |
Net investment income (loss) | $ 22,919 | $ 691 |
Net realized gain (loss) | 163,015 | 265,176 |
Change in net unrealized appreciation (depreciation) | (307,255) | 656,096 |
Net increase (decrease) in net assets resulting
from operations | (121,321) | 921,963 |
Distributions to shareholders from net investment income | (41,206) | (19,058) |
Share transactions - net increase (decrease) | (714,976) | (810,250) |
Redemption fees | 410 | 558 |
Total increase (decrease) in net assets | (877,093) | 93,213 |
| | |
Net Assets | | |
Beginning of period | 4,486,159 | 4,392,946 |
End of period (including distributions in excess of net investment income of $18,505 and distributions in excess of net investment income of $1,080, respectively) | $ 3,609,066 | $ 4,486,159 |
See accompanying notes which are an integral part of the financial statements.
Annual Report
Financial Highlights - Leveraged Company Stock
Years ended July 31, | 2012 | 2011 | 2010 | 2009 | 2008 |
Selected Per-Share Data | | | | | |
Net asset value, beginning of period | $ 28.85 | $ 23.50 | $ 19.55 | $ 31.09 | $ 33.78 |
Income from Investment Operations | | | | | |
Net investment income (loss) B | .16 | -G | .07 | .21 | .14 |
Net realized and unrealized gain (loss) | (.50) | 5.46 | 3.99 | (11.37) | (1.06) |
Total from investment operations | (.34) | 5.46 | 4.06 | (11.16) | (.92) |
Distributions from net investment income | (.29) | (.11) | (.11) | (.14) | (.39) |
Distributions from net realized gain | - | - | - | (.25) | (1.39) |
Total distributions | (.29) | (.11) | (.11) | (.39) | (1.78) |
Redemption fees added to paid in capital B | -G | - G | - G | .01 | .01 |
Net asset value, end of period | $ 28.22 | $ 28.85 | $ 23.50 | $ 19.55 | $ 31.09 |
Total Return A | (1.05)% | 23.27% | 20.84% | (35.99)% | (2.76)% |
Ratios to Average Net Assets C,F | | | | | |
Expenses before reductions | .86% | .85% | .88% | .92% | .83% |
Expenses net of fee waivers, if any | .86% | .85% | .88% | .92% | .83% |
Expenses net of all reductions | .85% | .84% | .88% | .92% | .83% |
Net investment income (loss) | .60% | -% E | .29% | 1.17% | .44% |
Supplemental Data | | | | | |
Net assets, end of period (in millions) | $ 3,009 | $ 3,931 | $ 3,983 | $ 3,714 | $ 8,032 |
Portfolio turnover rate D | 29% | 18% | 21% | 34% | 30% |
A Total returns would have been lower if certain expenses had not been reduced during the applicable periods shown.
B Calculated based on average shares outstanding during the period.
C Fees and expenses of any underlying Fidelity Central Funds are not included in the Fund's expense ratio. The Fund indirectly bears its proportionate share of the expenses of any underlying Fidelity Central Funds.
D Amount does not include the portfolio activity of any underlying Fidelity Central Funds.
E Amount represents less than .01%.
F Expense ratios reflect operating expenses of the class. Expenses before reductions do not reflect amounts reimbursed by the investment adviser or reductions from brokerage service arrangements or reductions from other expense offset arrangements and do not represent the amount paid by the class during periods when reimbursements or reductions occur. Expenses net of fee waivers reflect expenses after reimbursement by the investment adviser but prior to reductions from brokerage service arrangements or other expense offset arrangements. Expenses net of all reductions represent the net expenses paid by the class.
G Amount represents less than $.01 per share.
See accompanying notes which are an integral part of the financial statements.
Annual Report
Financial Highlights - Class K
Years ended July 31, | 2012 | 2011 | 2010 | 2009 | 2008 G |
Selected Per-Share Data | | | | | |
Net asset value, beginning of period | $ 28.86 | $ 23.52 | $ 19.56 | $ 31.11 | $ 34.10 |
Income from Investment Operations | | | | | |
Net investment income (loss) D | .20 | .04 | .11 | .21 | .05 |
Net realized and unrealized gain (loss) | (.49) | 5.45 | 4.00 | (11.35) | (3.04) |
Total from investment operations | (.29) | 5.49 | 4.11 | (11.14) | (2.99) |
Distributions from net investment income | (.31) | (.15) | (.15) | (.17) | - |
Distributions from net realized gain | - | - | - | (.25) | - |
Total distributions | (.31) | (.15) | (.15) | (.42) | - |
Redemption fees added to paid in capital D | - I | - I | - I | .01 | - I |
Net asset value, end of period | $ 28.26 | $ 28.86 | $ 23.52 | $ 19.56 | $ 31.11 |
Total Return B,C | (.87)% | 23.45% | 21.09% | (35.86)% | (8.77)% |
Ratios to Average Net Assets E,H | | | | | |
Expenses before reductions | .69% | .69% | .70% | .71% | .70% A |
Expenses net of fee waivers, if any | .69% | .69% | .70% | .71% | .70% A |
Expenses net of all reductions | .69% | .69% | .69% | .71% | .70% A |
Net investment income (loss) | .76% | .16% | .47% | 1.39% | .58% A |
Supplemental Data | | | | | |
Net assets, end of period
(000 omitted) | $ 600,270 | $ 554,907 | $ 409,934 | $ 267,351 | $ 91 |
Portfolio turnover rate F | 29% | 18% | 21% | 34% | 30% |
A Annualized
B Total returns for periods of less than one year are not annualized.
C Total returns would have been lower if certain expenses had not been reduced during the applicable periods shown.
D Calculated based on average shares outstanding during the period.
E Fees and expenses of any underlying Fidelity Central Funds are not included in the Fund's expense ratio. The Fund indirectly bears its proportionate share of the expenses of any underlying Fidelity Central Funds.
F Amount does not include the portfolio activity of any underlying Fidelity Central Funds.
G For the period May 9, 2008 (commencement of sale of shares) to July 31, 2008.
H Expense ratios reflect operating expenses of the class. Expenses before reductions do not reflect amounts reimbursed by the investment adviser or reductions from brokerage service arrangements or reductions from other expense offset arrangements and do not represent the amount paid by the class during periods when reimbursements or reductions occur. Expense ratios before reductions for start-up periods may not be representative of longer-term operating periods. Expenses net of fee waivers reflect expenses after reimbursement by the investment adviser but prior to reductions from brokerage service arrangements or other expense offset arrangements. Expenses net of all reductions represent the net expenses paid by the class.
I Amount represents less than $.01 per share.
See accompanying notes which are an integral part of the financial statements.
Annual Report
Notes to Financial Statements
For the period ended July 31, 2012
(Amounts in thousands except percentages)
1. Organization.
Fidelity Leveraged Company Stock Fund (the Fund) is a fund of Fidelity Securities Fund (the Trust) and is authorized to issue an unlimited number of shares. The Trust is registered under the Investment Company Act of 1940, as amended (the 1940 Act), as an open-end management investment company organized as a Massachusetts business trust. The Fund offers Leveraged Company Stock and Class K, each of which has equal rights as to assets and voting privileges. Each class has exclusive voting rights with respect to matters that affect that class. Investment income, realized and unrealized capital gains and losses, the common expenses of the Fund, and certain fund-level expense reductions, if any, are allocated on a pro-rata basis to each class based on the relative net assets of each class to the total net assets of the Fund. Each class differs with respect to transfer agent fees incurred. Certain expense reductions may also differ by class.
2. Investments in Fidelity Central Funds.
The Fund invests in Fidelity Central Funds, which are open-end investment companies available only to other investment companies and accounts managed by Fidelity Management & Research Company (FMR) and its affiliates. The Fund's Schedule of Investments lists each of the Fidelity Central Funds held as of period end, if any, as an investment of the Fund, but does not include the underlying holdings of each Fidelity Central Fund. As an Investing Fund, the Fund indirectly bears its proportionate share of the expenses of the underlying Fidelity Central Funds.
The Money Market Central Funds seek preservation of capital and current income and are managed by Fidelity Investments Money Management, Inc. (FIMM), an affiliate of FMR.
A complete unaudited list of holdings for each Fidelity Central Fund is available upon request or at the Securities and Exchange Commission (the SEC) web site at www.sec.gov. In addition, the financial statements of the Fidelity Central Funds, which are not covered by the Fund's Report of Independent Registered Public Accounting Firm, are available on the SEC web site or upon request.
3. Significant Accounting Policies.
The financial statements have been prepared in conformity with accounting principles generally accepted in the United States of America (GAAP), which require management to make certain estimates and assumptions at the date of the financial statements. Actual results could differ from those estimates. Subsequent events, if any, through the date that the financial statements were issued have been evaluated in the preparation of the financial statements. The following summarizes the significant accounting policies of the Fund:
Annual Report
Notes to Financial Statements - continued
(Amounts in thousands except percentages)
3. Significant Accounting Policies - continued
Security Valuation. Investments are valued as of 4:00 p.m. Eastern time on the last calendar day of the period. In accordance with valuation policies and procedures approved by the Board of Trustees (the Board), the Fund attempts to obtain prices from one or more third party pricing vendor or broker to value its investments. When current market prices, quotations or rates are not readily available or reliable, securities will be fair valued in good faith by the FMR Fair Value Committee (the Committee), in accordance with procedures adopted by the Fund's Board. Factors used in determining fair value vary by security type and may include market or security specific events, changes in interest rates and credit quality. The frequency with which these procedures are used cannot be predicted and they may be utilized to a significant extent. The Committee oversees the Fund's valuation policies and procedures and is responsible for approving and reporting to the Board all fair value determinations.
The Fund categorizes the inputs to valuation techniques used to value its investments into a disclosure hierarchy consisting of three levels as shown below:
Level 1 - quoted prices in active markets for identical investments
Level 2 - other significant observable inputs (including quoted prices for similar investments, interest rates, prepayment speeds, etc.)
Level 3 - unobservable inputs (including the Fund's own assumptions based on the best information available)
Valuation techniques used to value the Fund's investments by major category are as follows:
Equity securities, including restricted securities, for which market quotations are readily available, are valued at the last reported sale price or official closing price as reported by a third party pricing vendor on the primary market or exchange on which they are traded and are categorized as Level 1 in the hierarchy. In the event there were no sales during the day or closing prices are not available, securities are valued at the last quoted bid price or may be valued using the last available price and are generally categorized as Level 2 in the hierarchy. For foreign equity securities, when significant market or security specific events arise, comparisons to the valuation of American Depositary Receipts (ADRs), futures contracts, Exchange-Traded Funds (ETFs)and certain indexes as well as quoted prices for similar securities are used and are categorized as Level 2 in the hierarchy. Utilizing these techniques may result in transfers between Level 1 and Level 2. For restricted equity securities and private placements where observable inputs are limited, assumptions about market activity and risk are used and these securities are categorized as Level 3 in the hierarchy.
Annual Report
3. Significant Accounting Policies - continued
Security Valuation - continued
Debt securities, including restricted securities, are valued based on evaluated prices received from third party pricing vendors or from brokers who make markets in such securities. For corporate bonds and floating rate loans, pricing vendors utilize matrix pricing which considers yield or price of bonds of comparable quality, coupon, maturity and type as well as broker-supplied prices and are generally categorized as Level 2 in the hierarchy. When independent prices are unavailable or unreliable, debt securities may be valued utilizing pricing methodologies which consider similar factors that would be used by third party pricing vendors. These are generally categorized as Level 2 in the hierarchy but may be Level 3 depending on the circumstances.
Investments in open-end mutual funds, including the Fidelity Central Funds, are valued at their closing net asset value each business day and are categorized as Level 1 in the hierarchy.
Changes in valuation techniques may result in transfers in or out of an assigned level within the disclosure hierarchy. The aggregate value of investments by input level, as of July 31, 2012, is included at the end of the Fund's Schedule of Investments.
Foreign Currency Translation. The Fund may use foreign currency contracts to facilitate transactions in foreign-denominated securities. Gains and losses from these transactions may arise from changes in the value of the foreign currency or if the counterparties do not perform under the contracts' terms.
Foreign-denominated assets, including investment securities, and liabilities are translated into U.S. dollars at the exchange rates at period end. Purchases and sales of investment securities, income and dividends received and expenses denominated in foreign currencies are translated into U.S. dollars at the exchange rate in effect on the transaction date.
The effects of exchange rate fluctuations on investments are included with the net realized and unrealized gain (loss) on investment securities. Other foreign currency transactions resulting in realized and unrealized gain (loss) are disclosed separately.
Investment Transactions and Income. For financial reporting purposes, the Fund's investment holdings and NAV include trades executed through the end of the last business day of the period. The NAV per share for processing shareholder transactions is calculated as of the close of business of the New York Stock Exchange (NYSE), normally 4:00 p.m. Eastern time and includes trades executed through the end of the prior business day. Gains and losses on securities sold are determined on the basis of identified cost and may include proceeds received from litigation. Dividend income is recorded on the ex-dividend date, except for certain dividends from foreign securities where the
Annual Report
Notes to Financial Statements - continued
(Amounts in thousands except percentages)
3. Significant Accounting Policies - continued
Investment Transactions and Income - continued
ex-dividend date may have passed, which are recorded as soon as the Fund is informed of the ex-dividend date. Non-cash dividends included in dividend income, if any, are recorded at the fair market value of the securities received. Distributions received on securities that represent a return of capital or capital gain are recorded as a reduction of cost of investments and/or as a realized gain. The Fund estimates the components of distributions received that may be considered return of capital distributions or capital gain distributions. Interest income and distributions from the Fidelity Central Funds are accrued as earned. Interest income includes coupon interest and amortization of premium and accretion of discount on debt securities. Investment income is recorded net of foreign taxes withheld where recovery of such taxes is uncertain. Debt obligations may be placed on non-accrual status and related interest income may be reduced by ceasing current accruals and writing off interest receivables when the collection of all or a portion of interest has become doubtful based on consistently applied procedures. A debt obligation is removed from non-accrual status when the issuer resumes interest payments or when collectability of interest is reasonably assured.
Expenses. Expenses directly attributable to a fund are charged to that fund. Expenses attributable to more than one fund are allocated among the respective funds on the basis of relative net assets or other appropriate methods. Expense estimates are accrued in the period to which they relate and adjustments are made when actual amounts are known.
Income Tax Information and Distributions to Shareholders. Each year, the Fund intends to qualify as a regulated investment company under Subchapter M of the Internal Revenue Code, including distributing substantially all of its taxable income and realized gains. As a result, no provision for income taxes is required. As of July 31, 2012, the Fund did not have any unrecognized tax benefits in the financial statements; nor is the Fund aware of any tax positions for which it is reasonably possible that the total amounts of unrecognized tax benefits will significantly change in the next twelve months. The Fund files a U.S. federal tax return, in addition to state and local tax returns as required. A fund's federal income tax returns are subject to examination by the Internal Revenue Service (IRS) for a period of three fiscal years after they are filed. State and local tax returns may be subject to examination for an additional fiscal year depending on the jurisdiction. Foreign taxes are provided for based on the Fund's understanding of the tax rules and rates that exist in the foreign markets in which it invests.
Distributions are declared and recorded on the ex-dividend date. Income dividends and capital gain distributions are declared separately for each class. Income and capital gain distributions are determined in accordance with income tax regulations, which may differ from GAAP.
Annual Report
3. Significant Accounting Policies - continued
Income Tax Information and Distributions to Shareholders - continued
Capital accounts within the financial statements are adjusted for permanent book-tax differences. These adjustments have no impact on net assets or the results of operations. Temporary book-tax differences will reverse in a subsequent period.
Book-tax differences are primarily due to foreign currency transactions, market discount, equity-debt classifications, non-taxable dividends, capital loss carryforwards, losses deferred due to wash sales and excise tax regulations.
The federal tax cost of investment securities and unrealized appreciation (depreciation) as of period end were as follows:
Gross unrealized appreciation | $ 744,010 |
Gross unrealized depreciation | (431,980) |
Net unrealized appreciation (depreciation) on securities and other investments | $ 312,030 |
| |
Tax Cost | $ 3,342,150 |
The tax-based components of distributable earnings as of period end were as follows:
Capital loss carryforward | $ (578,439) |
Net unrealized appreciation (depreciation) | $ 312,030 |
Capital loss carryforwards are only available to offset future capital gains of the Fund to the extent provided by regulations and may be limited. Under the Regulated Investment Company Modernization Act of 2010 (the Act), the Fund is permitted to carry forward capital losses incurred in taxable years beginning after December 22, 2010 for an unlimited period and such capital losses are required to be used prior to any losses that expire. Capital loss carryforwards were as follows:
Fiscal year of expiration | |
2018 | $ (578,439) |
The tax character of distributions paid was as follows:
| July 31, 2012 | July 31, 2011 |
Ordinary Income | $ 41,206 | $ 19,058 |
Short-Term Trading (Redemption) Fees. Shares held by investors in the Fund less than 90 days are subject to a redemption fee equal to 1.50% of the net asset value of shares redeemed. All redemption fees, which reduce the proceeds of the shareholder redemption, are retained by the Fund and accounted for as an addition to paid in capital.
Annual Report
Notes to Financial Statements - continued
(Amounts in thousands except percentages)
3. Significant Accounting Policies - continued
New Accounting Pronouncement. In December 2011, the Financial Accounting Standards Board issued Accounting Standard Update No. 2011-11, Disclosures about Offsetting Assets and Liabilities. The update creates new disclosure requirements requiring entities to disclose both gross and net information for derivatives and other financial instruments that are either offset in the Statement of Assets and Liabilities or subject to an enforceable master netting arrangement or similar agreement. The disclosure requirements are effective for interim and annual reporting periods beginning on or after January 1, 2013. Management is currently evaluating the impact of the update's adoption on the Fund's financial statement disclosures.
4. Operating Policies.
Restricted Securities. The Fund may invest in securities that are subject to legal or contractual restrictions on resale. These securities generally may be resold in transactions exempt from registration or to the public if the securities are registered. Disposal of these securities may involve time-consuming negotiations and expense, and prompt sale at an acceptable price may be difficult. Information regarding restricted securities is included at the end of the Fund's Schedule of Investments.
Loans and Other Direct Debt Instruments. The Fund invests in direct debt instruments which are interests in amounts owed to lenders by corporate or other borrowers. These instruments may be in the form of loans, trade claims or other receivables and may include standby financing commitments such as revolving credit facilities that obligate the Fund to supply additional cash to the borrower on demand. Loans may be acquired through assignment or participation, or may be made directly to a borrower. The Fund may be contractually obligated to receive approval from the agent bank and/or borrower prior to the sale of these loans.
5. Purchases and Sales of Investments.
Purchases and sales of securities, other than short-term securities, aggregated $1,027,974 and $1,844,527, respectively.
6. Fees and Other Transactions with Affiliates.
Management Fee. FMR and its affiliates provide the Fund with investment management related services for which the Fund pays a monthly management fee. The management fee is the sum of an individual fund fee rate that is based on an annual rate of .35% of the Fund's average net assets and an annualized group fee rate that averaged .26% during the period. The group fee rate is based upon the average net assets of all the mutual funds advised by FMR. The group fee rate decreases as assets under management increase and increases as assets under management decrease. For the period, the total annual management fee rate was .61% of the Fund's average net assets.
Annual Report
6. Fees and Other Transactions with Affiliates - continued
Transfer Agent Fees. Fidelity Investments Institutional Operations Company, Inc. (FIIOC), an affiliate of FMR, is the transfer, dividend disbursing and shareholder servicing agent for each class of the Fund. FIIOC receives account fees and asset-based fees that vary according to the account size and type of account of the shareholders of Leveraged Company Stock. FIIOC receives an asset-based fee of Class K's average net assets. FIIOC pays for typesetting, printing and mailing of shareholder reports, except proxy statements. For the period, transfer agent fees for each class were as follows:
| Amount | % of
Average
Net Assets |
Leveraged Company Stock | $ 6,665 | .21 |
Class K | 278 | .05 |
| $ 6,943 | |
Accounting and Security Lending Fees. Fidelity Service Company, Inc. (FSC), an affiliate of FMR, maintains the Fund's accounting records. The accounting fee is based on the level of average net assets for each month. Under a separate contract, FSC administers the security lending program. The security lending fee is based on the number and duration of lending transactions.
Brokerage Commissions. The Fund placed a portion of its portfolio transactions with brokerage firms which are affiliates of the investment adviser. The commissions paid to these affiliated firms were $77 for the period.
7. Committed Line of Credit.
The Fund participates with other funds managed by FMR or an affiliate in a $4.25 billion credit facility (the "line of credit") to be utilized for temporary or emergency purposes to fund shareholder redemptions or for other short-term liquidity purposes. The Fund has agreed to pay commitment fees on its pro-rata portion of the line of credit, which amounted to $11 and is reflected in Miscellaneous expenses on the Statement of Operations. During the period, there were no borrowings on this line of credit.
8. Security Lending.
The Fund lends portfolio securities through a lending agent from time to time in order to earn additional income. For equity securities, a lending agent is used and may loan securities to certain qualified borrowers, including Fidelity Capital Markets (FCM), a broker-dealer affiliated with the Fund. On the settlement date of the loan, the Fund receives collateral (in the form of U.S. Treasury obligations, letters of credit and/or cash) against the loaned securities and maintains collateral in an amount not less than 100% of
Annual Report
Notes to Financial Statements - continued
(Amounts in thousands except percentages)
8. Security Lending - continued
the market value of the loaned securities during the period of the loan. The market value of the loaned securities is determined at the close of business of the Fund and any additional required collateral is delivered to the Fund on the next business day. If the borrower defaults on its obligation to return the securities loaned because of insolvency or other reasons, a fund could experience delays and costs in recovering the securities loaned or in gaining access to the collateral. Any cash collateral received is invested in the Fidelity Securities Lending Cash Central Fund. The value of loaned securities and cash collateral at period end are disclosed on the Fund's Statement of Assets and Liabilities. The value of securities loaned to FCM at period end was $788. Security lending income represents the income earned on investing cash collateral, less rebates paid to borrowers and any lending agent fees associated with the loan, plus any premium payments received for lending certain types of securities. Security lending income is presented in the Statement of Operations as a component of income from Fidelity Central Funds. Total security lending income during the period amounted to $1,584, including $37 from securities loaned to FCM.
9. Expense Reductions.
Many of the brokers with whom FMR places trades on behalf of the Fund provided services to the Fund in addition to trade execution. These services included payments of certain expenses on behalf of the Fund totaling $256 for the period.
10. Distributions to Shareholders.
Distributions to shareholders of each class were as follows:
Years ended July 31, | 2012 | 2011 |
From net investment income | | |
Leveraged Company Stock | $ 35,167 | $ 16,431 |
Class K | 6,039 | 2,627 |
Total | $ 41,206 | $ 19,058 |
Annual Report
11. Share Transactions.
Transactions for each class of shares were as follows:
| Shares | Dollars |
Years ended July 31, | 2012 | 2011 | 2012 | 2011 |
Leveraged Company Stock | | | | |
Shares sold | 11,853 | 21,818 | $ 318,644 | $ 623,715 |
Reinvestment of distributions | 1,333 | 608 | 33,481 | 15,688 |
Shares redeemed | (42,830) | (55,621) | (1,123,666) | (1,504,254) |
Net increase (decrease) | (29,644) | (33,195) | $ (771,541) | $ (864,851) |
Class K | | | | |
Shares sold | 9,320 | 7,678 | $ 250,995 | $ 217,275 |
Reinvestment of distributions | 240 | 103 | 6,039 | 2,627 |
Shares redeemed | (7,542) | (5,983) | (200,469) | (165,301) |
Net increase (decrease) | 2,018 | 1,798 | $ 56,565 | $ 54,601 |
12. Other.
The Fund's organizational documents provide former and current trustees and officers with a limited indemnification against liabilities arising in connection with the performance of their duties to the Fund. In the normal course of business, the Fund may also enter into contracts that provide general indemnifications. The Fund's maximum exposure under these arrangements is unknown as this would be dependent on future claims that may be made against the Fund. The risk of material loss from such claims is considered remote.
Annual Report
To the Trustees of Fidelity Securities Fund and the Shareholders of Fidelity Leveraged Company Stock Fund:
In our opinion, the accompanying statement of assets and liabilities, including the schedule of investments, and the related statements of operations and of changes in net assets and the financial highlights present fairly, in all material respects, the financial position of Fidelity Leveraged Company Stock Fund (a fund of Fidelity Securities Fund) at July 31, 2012, the results of its operations for the year then ended, the changes in its net assets for each of the two years in the period then ended and the financial highlights for each of the periods indicated, in conformity with accounting principles generally accepted in the United States of America. These financial statements and financial highlights (hereafter referred to as "financial statements") are the responsibility of the Fidelity Leveraged Company Stock Fund's management. Our responsibility is to express an opinion on these financial statements based on our audits. We conducted our audits of these financial statements in accordance with the standards of the Public Company Accounting Oversight Board (United States). Those standards require that we plan and perform the audit to obtain reasonable assurance about whether the financial statements are free of material misstatement. An audit includes examining, on a test basis, evidence supporting the amounts and disclosures in the financial statements, assessing the accounting principles used and significant estimates made by management, and evaluating the overall financial statement presentation. We believe that our audits, which included confirmation of securities at July 31, 2012 by correspondence with the custodian, brokers, and agent banks, provide a reasonable basis for our opinion.
PricewaterhouseCoopers LLP
Boston, Massachusetts
September 17, 2012
Annual Report
The Trustees, Members of the Advisory Board, and executive officers of the trust and fund, as applicable, are listed below. The Board of Trustees governs the fund and is responsible for protecting the interests of shareholders. The Trustees are experienced executives who meet periodically throughout the year to oversee the fund's activities, review contractual arrangements with companies that provide services to the fund, oversee management of the risks associated with such activities and contractual arrangements, and review the fund's performance. Except for James C. Curvey, each of the Trustees oversees 228 funds advised by FMR or an affiliate. Mr. Curvey oversees 435 funds advised by FMR or an affiliate.
The Trustees hold office without limit in time except that (a) any Trustee may resign; (b) any Trustee may be removed by written instrument, signed by at least two-thirds of the number of Trustees prior to such removal; (c) any Trustee who requests to be retired or who has become incapacitated by illness or injury may be retired by written instrument signed by a majority of the other Trustees; and (d) any Trustee may be removed at any special meeting of shareholders by a two-thirds vote of the outstanding voting securities of the trust. Each Trustee who is not an interested person (as defined in the 1940 Act) (Independent Trustee), shall retire not later than the last day of the calendar year in which his or her 75th birthday occurs. The Independent Trustees may waive this mandatory retirement age policy with respect to individual Trustees. The executive officers and Advisory Board Members hold office without limit in time, except that any officer and Advisory Board Member may resign or may be removed by a vote of a majority of the Trustees at any regular meeting or any special meeting of the Trustees. Except as indicated, each individual has held the office shown or other offices in the same company for the past five years.
Experience, Skills, Attributes, and Qualifications of the Fund's Trustees. The Governance and Nominating Committee has adopted a statement of policy that describes the experience, qualifications, attributes, and skills that are necessary and desirable for potential Independent Trustee candidates (Statement of Policy). The Board believes that each Trustee satisfied at the time he or she was initially elected or appointed a Trustee, and continues to satisfy, the standards contemplated by the Statement of Policy. The Governance and Nominating Committee also engages professional search firms to help identify potential Independent Trustee candidates who have the experience, qualifications, attributes, and skills consistent with the Statement of Policy. From time to time, additional criteria based on the composition and skills of the current Independent Trustees, as well as experience or skills that may be appropriate in light of future changes to board composition, business conditions, and regulatory or other developments, have also been considered by the professional search firms and the Governance and Nominating Committee. In addition, the Board takes into account the Trustees' commitment and participation in Board and committee meetings, as well as their leadership of standing and ad hoc committees throughout their tenure.
In determining that a particular Trustee was and continues to be qualified to serve as a Trustee, the Board has considered a variety of criteria, none of which, in isolation, was controlling. The Board believes that, collectively, the Trustees have balanced and diverse experience, qualifications, attributes, and skills, which allow the Board to operate effectively in governing the fund and protecting the interests of shareholders. Information about the specific experience, skills, attributes, and qualifications of each Trustee, which in each case led to the Board's conclusion that the Trustee should serve (or continue to serve) as a trustee of the fund, is provided below.
Annual Report
Board Structure and Oversight Function. James C. Curvey is an interested person (as defined in the 1940 Act) and currently serves as Chairman. The Trustees have determined that an interested Chairman is appropriate and benefits shareholders because an interested Chairman has a personal and professional stake in the quality and continuity of services provided to the fund. Independent Trustees exercise their informed business judgment to appoint an individual of their choosing to serve as Chairman, regardless of whether the Trustee happens to be independent or a member of management. The Independent Trustees have determined that they can act independently and effectively without having an Independent Trustee serve as Chairman and that a key structural component for assuring that they are in a position to do so is for the Independent Trustees to constitute a substantial majority for the Board. The Independent Trustees also regularly meet in executive session. Ned C. Lautenbach serves as Chairman of the Independent Trustees and as such (i) acts as a liaison between the Independent Trustees and management with respect to matters important to the Independent Trustees and (ii) with management prepares agendas for Board meetings.
Fidelity funds are overseen by different Boards of Trustees. The fund's Board oversees Fidelity's equity and high income funds and another Board oversees Fidelity's investment-grade bond, money market, and asset allocation funds. The asset allocation funds may invest in Fidelity funds overseen by the fund's Board. The use of separate Boards, each with its own committee structure, allows the Trustees of each group of Fidelity funds to focus on the unique issues of the funds they oversee, including common research, investment, and operational issues. On occasion, the separate Boards establish joint committees to address issues of overlapping consequences for the Fidelity funds overseen by each Board.
The Trustees operate using a system of committees to facilitate the timely and efficient consideration of all matters of importance to the Trustees, the fund, and fund shareholders and to facilitate compliance with legal and regulatory requirements and oversight of the fund's activities and associated risks. The Board, acting through its committees, has charged FMR and its affiliates with (i) identifying events or circumstances the occurrence of which could have demonstrably adverse effects on the fund's business and/or reputation; (ii) implementing processes and controls to lessen the possibility that such events or circumstances occur or to mitigate the effects of such events or circumstances if they do occur; and (iii) creating and maintaining a system designed to evaluate continuously business and market conditions in order to facilitate the identification and implementation processes described in (i) and (ii) above. Because the day-to-day operations and activities of the fund are carried out by or through FMR, its affiliates and other service providers, the fund's exposure to risks is mitigated but not eliminated by the processes overseen by the Trustees. While each of the Board's committees has responsibility for overseeing different aspects of the fund's activities, oversight is exercised primarily through the Operations, Audit, and Compliance Committees. In addition, the Independent Trustees have worked with FMR to enhance the Board's oversight of investment and financial risks, legal and regulatory risks, technology risks, and operational risks, including the development of additional risk reporting to the Board. For example, a working group comprised of Independent Trustees and FMR has worked and continues to work to review the Fidelity funds' valuation-related activities, reporting and risk management. Appropriate personnel, including but not limited to the fund's Chief Compliance Officer (CCO), FMR's internal auditor, the independent accountants, the fund's Treasurer and portfolio management personnel, make periodic reports to the Board's committees, as appropriate, including an annual review of FMR's risk management program for the Fidelity funds. The responsibilities of each standing committee, including their oversight responsibilities, are described further under "Standing Committees of the Fund's Trustees."
Annual Report
Trustees and Officers - continued
The fund's Statement of Additional Information (SAI) includes more information about the Trustees. To request a free copy, call Fidelity at 1-800-835-5092.
Interested Trustees*:
Correspondence intended for each Trustee who is an interested person may be sent to Fidelity Investments, 82 Devonshire Street, Boston, Massachusetts 02109.
Name, Age; Principal Occupations and Other Relevant Experience+ |
James C. Curvey (77) |
| Year of Election or Appointment: 2007 Mr. Curvey is Trustee and Chairman of the Board of Trustees of certain Trusts. Mr. Curvey also serves as Trustee (2007-present) of other investment companies advised by FMR. Mr. Curvey is a Director of Fidelity Investments Money Management, Inc. (2009-present), Director of Fidelity Research & Analysis Co. (2009-present) and Director of FMR and FMR Co., Inc. (2007-present). Mr. Curvey is also Vice Chairman (2007-present) and Director of FMR LLC. In addition, Mr. Curvey serves as an Overseer for the Boston Symphony Orchestra and a member of the Trustees of Villanova University. Previously, Mr. Curvey was the Vice Chairman (2006-2007) and Director (2000-2007) of FMR Corp. |
Ronald P. O'Hanley (55) |
| Year of Election or Appointment: 2011 Mr. O'Hanley is Director of FMR Co., Inc. (2010-present), Director of Fidelity Investments Money Management, Inc. (2010-present), Director of Fidelity Research & Analysis Company (2010-present), President of Fidelity Asset Management and Corporate Services and a member of Fidelity's Executive Committee (2010-present). Previously, Mr. O'Hanley served as President and Chief Executive Officer of BNY Mellon Asset Management (2007-2010). Mr. O'Hanley also served as Vice Chairman of Bank New York Mellon Corp. and a member of that firm's Executive Committee. Prior to the 2007 merger of The Bank of New York and Mellon Financial Corporation, he was Vice Chairman of Mellon Financial Corporation and President and Chief Executive Officer of Mellon Asset Management. He joined Mellon in February 1997. Mr. O'Hanley currently serves as Chairman of the Boston Public Library Foundation Board of Directors and sits on the Board of Directors of Beth Israel Deaconess Medical Center, the Board of Trustees of the Marine Biological Laboratory and the Advisory Board of the Maxwell School of Citizenship and Public Administration at Syracuse University. Mr. O'Hanley also chairs the Council on Asset Management for the Financial Services Roundtable and is a member of the Board of Directors of Institutional Investor's U.S. Institute. |
* Trustees have been determined to be "Interested Trustees" by virtue of, among other things, their affiliation with the trust or various entities under common control with FMR.
+ The information above includes each Trustee's principal occupation during the last five years and other information relating to the experience, attributes, and skills relevant to each Trustee's qualifications to serve as a Trustee, which led to the conclusion that each Trustee should serve as a Trustee for the fund.
Annual Report
Trustees and Officers - continued
Independent Trustees:
Correspondence intended for each Independent Trustee (that is, the Trustees other than the Interested Trustees) may be sent to Fidelity Investments, P.O. Box 55235, Boston, Massachusetts 02205-5235.
Name, Age; Principal Occupations and Other Relevant Experience+ |
Dennis J. Dirks (64) |
| Year of Election or Appointment: 2005 Prior to his retirement in May 2003, Mr. Dirks was Chief Operating Officer and a member of the Board of The Depository Trust & Clearing Corporation (DTCC). He also served as President, Chief Operating Officer, and Board member of The Depository Trust Company (DTC) and President and Board member of the National Securities Clearing Corporation (NSCC). In addition, Mr. Dirks served as Chief Executive Officer and Board member of the Government Securities Clearing Corporation, Chief Executive Officer and Board member of the Mortgage-Backed Securities Clearing Corporation, as a Trustee and a member of the Finance Committee of Manhattan College (2005-2008), and as a Trustee and a member of the Finance Committee of AHRC of Nassau County (2006-2008). Mr. Dirks is a member of the Independent Directors Council (IDC) Governing Council (2010-present) and Board of Directors for The Brookville Center for Children's Services, Inc. (2009-present). |
Alan J. Lacy (58) |
| Year of Election or Appointment: 2008 Mr. Lacy serves as Senior Adviser (2007-present) of Oak Hill Capital Partners, L.P. (private equity). Mr. Lacy also served as Chief Executive Officer (2000-2005) and Vice Chairman (2005-2006) of Sears Holdings Corporation and Sears, Roebuck and Co. (retail). In addition, Mr. Lacy serves as a member of the Board of Directors of Dave & Buster's Entertainment, Inc. (restaurant and entertainment complexes, 2010-present), Earth Fare, Inc. (retail grocery, 2012-present), The Hillman Companies, Inc. (hardware wholesalers, 2010-present), and Bristol-Myers Squibb Company (global pharmaceuticals, 2007-present). Mr. Lacy is a member of the Board of Trustees of The National Parks Conservation Association (2006-present). Previously, Mr. Lacy served as Chairman of the Board of Trustees of the National Parks Conservation Association (2008-2011) and as a member of the Board of Directors for the Western Union Company (global money transfer, 2006-2011). |
Ned C. Lautenbach (68) |
| Year of Election or Appointment: 2000 Mr. Lautenbach is Chairman of the Independent Trustees of the Equity and High Income Funds (2006-present). Mr. Lautenbach currently serves as the Lead Director of the Eaton Corporation Board of Directors (diversified industrial, 1997-present). Mr. Lautenbach is Chairman of the Board of Directors of the Philharmonic Center for the Arts in Naples, Florida (2012-present) and a member of the Council on Foreign Relations (1994-present). Previously, Mr. Lautenbach was a Partner/Advisory Partner at Clayton, Dubilier & Rice, LLC (private equity investment, 1998-2010), as well as a Director of Sony Corporation (2006-2007). |
Joseph Mauriello (67) |
| Year of Election or Appointment: 2008 Prior to his retirement in January 2006, Mr. Mauriello served in numerous senior management positions including Deputy Chairman and Chief Operating Officer (2004-2005), and Vice Chairman of Financial Services (2002-2004) of KPMG LLP US (professional services, 1965-2005). Mr. Mauriello currently serves as a member of the Board of Directors of XL Group plc. (global insurance and re-insurance, 2006-present). Previously, Mr. Mauriello served as a Director of the Hamilton Funds of the Bank of New York (2006-2007) and of Arcadia Resources Inc. (health care services and products, 2007-2012). |
Robert W. Selander (61) |
| Year of Election or Appointment: 2011 Previously, Mr. Selander served as a Member of the Advisory Board of Fidelity's Equity and High Income Funds (2011), Executive Vice Chairman (2010), Chief Executive Officer (2009-2010), and President and Chief Executive Officer (1997-2009) of Mastercard, Inc. |
Cornelia M. Small (68) |
| Year of Election or Appointment: 2005 Ms. Small is a member of the Board of Directors of the Teagle Foundation (2009-present). Ms. Small is also a member of the Investment Committee, and Chair (2008-present) and a member of the Board of Trustees of Smith College. In addition, Ms. Small serves on the Investment Committee of the Berkshire Taconic Community Foundation (2008-present). Previously, Ms. Small served as Chairperson of the Investment Committee (2002-2008) of Smith College. In addition, Ms. Small served as Chief Investment Officer, Director of Global Equity Investments, and a member of the Board of Directors of Scudder, Stevens & Clark and Scudder Kemper Investments. |
William S. Stavropoulos (73) |
| Year of Election or Appointment: 2002 Mr. Stavropoulos is Vice Chairman of the Independent Trustees of the Equity and High Income Funds (2006-present). Mr. Stavropoulos serves as President and Founder of the Michigan Baseball Foundation, the Great Lakes Loons (2007-present). Mr. Stavropoulos is Chairman Emeritus of the Board of Directors of The Dow Chemical Company, where he previously served in numerous senior management positions, including President, CEO (1995-2000; 2002-2004), Chairman of the Executive Committee (2000-2006), and as a member of the Board of Directors (1990-2006). Currently, Mr. Stavropoulos is Chairman of Univar (global distributor of commodity and specialty chemicals, 2010-present), a Director of Teradata Corporation (data warehousing and technology solutions, 2008-present), Chemical Financial Corporation, Maersk Inc. (industrial conglomerate), Tyco International, Inc. (multinational manufacturing and services, 2007-present), and a member of the Advisory Board for Metalmark Capital (private equity investment, 2005-present). Mr. Stavropoulos is a special advisor to Clayton, Dubilier & Rice, LLC (private equity investment). In addition, Mr. Stavropoulos is a member of the University of Notre Dame Advisory Council for the College of Science. |
David M. Thomas (63) |
| Year of Election or Appointment: 2008 Previously, Mr. Thomas served as Executive Chairman (2005-2006) and Chairman and Chief Executive Officer (2000-2005) of IMS Health, Inc. (pharmaceutical and healthcare information solutions). In addition, Mr. Thomas serves as a member of the Board of Directors of Fortune Brands, Inc. (consumer products), and Interpublic Group of Companies, Inc. (marketing communication, 2004-present). |
Michael E. Wiley (61) |
| Year of Election or Appointment: 2008 Mr. Wiley also serves as a Director of Asia Pacific Exploration Consolidated (international oil and gas exploration and production, 2008-present). Mr. Wiley serves as a Director of Tesoro Corporation (independent oil refiner and marketer, 2005-present), and a Director of Bill Barrett Corporation (exploration and production, 2005-present). In addition, Mr. Wiley also serves as a Director of Post Oak Bank (privately-held bank, 2004-present). Previously, Mr. Wiley served as a member of the Board of Trustees of the University of Tulsa (2000-2006; 2007-2010), as a Senior Energy Advisor of Katzenbach Partners, LLC (consulting, 2006-2007), as an Advisory Director of Riverstone Holdings (private investment), Chairman, President, and CEO of Baker Hughes, Inc. (oilfield services, 2000-2004), and as Director of Spinnaker Exploration Company (exploration and production, 2001-2005). |
Annual Report
+ The information above includes each Trustee's principal occupation during the last five years and other information relating to the experience, attributes, and skills relevant to each Trustee's qualifications to serve as a Trustee, which led to the conclusion that each Trustee should serve as a Trustee for the fund.
Advisory Board Members and Executive Officers:
Correspondence intended for David A. Rosow and Garnett A. Smith may be sent to Fidelity Investments, P.O. Box 55235, Boston, Massachusetts 02205-5235. Correspondence intended for each executive officer, Edward C. Johnson 3d, and Peter S. Lynch may be sent to Fidelity Investments, 82 Devonshire Street, Boston, Massachusetts 02109.
Name, Age; Principal Occupation |
Edward C. Johnson 3d (82) |
| Year of Election or Appointment: 2011 Member of the Advisory Board of Fidelity's Equity and High Income Funds. Mr. Johnson serves as Chief Executive Officer, Chairman, and a Director of FMR LLC, and also serves as Chairman and Director of FIL Limited. Previously, Mr. Johnson served as a Trustee and Chairman of the Board of certain Fidelity Trusts, Chairman and a Director of FMR, Chairman and a Director of FMR Co., Inc., and President of FMR LLC (2006-2007). |
Peter S. Lynch (68) |
| Year of Election or Appointment: 2003 Member of the Advisory Board of Fidelity's Equity and High Income Funds. Mr. Lynch is Vice Chairman and a Director of FMR and FMR Co., Inc. In addition, Mr. Lynch serves as a Trustee of Boston College and as the Chairman of the Inner-City Scholarship Fund. Previously, Mr. Lynch served on the Special Olympics International Board of Directors (1997-2006). |
David A. Rosow (69) |
| Year of Election or Appointment: 2012 Member of the Advisory Board of Fidelity's Equity and High Income Funds. Chairman and Chief Executive Officer of International Golf Group, Inc. (golf course development, 1990-present). Previously, Mr. Rosow served as Chairman and Chief Executive Officer of Rosow & Company, Inc. (private investment company, 1989-2011), a Lead Director of Hudson United Bancorp (2001-2006) and as a Director of TD Banknorth (1996-2006). In addition, Mr. Rosow is a member (2008-present) and President (2009-present) of the Town Council of Palm Beach, Florida. |
Garnett A. Smith (64) |
| Year of Election or Appointment: 2012 Member of the Advisory Board of Fidelity's Equity and High Income Funds. Prior to Mr. Smith's retirement, he served as Chairman and Chief Executive Officer of Inbrand Corp. (manufacturer of personal absorbent products, 1990-1997). He also served as President (1986-1990) of Inbrand Corp. Prior to his employment with Inbrand Corp., he was employed by a retail fabric chain and North Carolina National Bank. In addition, Mr. Smith is a board member of the Jackson Hole Land Trust (2009-present). |
Kenneth B. Robins (42) |
| Year of Election or Appointment: 2008 President and Treasurer of Fidelity's Equity and High Income Funds. Mr. Robins also serves as President and Treasurer (2010-present) and Assistant Treasurer (2009-present) of other Fidelity funds and is an employee of Fidelity Investments (2004-present). Previously, Mr. Robins served as Deputy Treasurer of the Fidelity funds (2005-2008) and Treasurer and Chief Financial Officer of The North Carolina Capital Management Trust: Cash and Term Portfolios (2006-2008). |
Brian B. Hogan (47) |
| Year of Election or Appointment: 2009 Vice President of Equity and High Income Funds. Mr. Hogan also serves as President of FMR's Equity Division (2009-present). Previously, Mr. Hogan served as Senior Vice President, Equity Research of FMR (2006-2009) and as a portfolio manager. |
Thomas C. Hense (48) |
| Year of Election or Appointment: 2008 or 2010 Vice President of Fidelity's High Income (2008), Small Cap (2008), and Value (2010) Funds. Previously, Mr. Hense served as a portfolio manager for Fidelity's Institutional Money Management Group (Pyramis) (2003-2008). |
Scott C. Goebel (44) |
| Year of Election or Appointment: 2008 Secretary and Chief Legal Officer (CLO) of the Fidelity funds. Mr. Goebel also serves as Secretary of Fidelity Investments Money Management, Inc. (FIMM) (2010-present) and Fidelity Research and Analysis Company (FRAC) (2010-present); Secretary and CLO of The North Carolina Capital Management Trust: Cash and Term Portfolios (2008-present); General Counsel, Secretary, and Senior Vice President of FMR (2008-present) and FMR Co., Inc. (2008-present); employed by FMR LLC or an affiliate (2001-present); Chief Legal Officer of Fidelity Management & Research (Hong Kong) Limited (2008-present) and Assistant Secretary of Fidelity Management & Research (Japan) Inc. (2008-present), and Fidelity Management & Research (U.K.) Inc. (2008-present). Previously, Mr. Goebel served as Assistant Secretary of FIMM (2008-2010), FRAC (2008-2010), and the Funds (2007-2008) and as Vice President and Secretary of Fidelity Distributors Corporation (FDC) (2005-2007). |
William C. Coffey (43) |
| Year of Election or Appointment: 2009 Assistant Secretary of Fidelity's Equity and High Income Funds. Mr. Coffey also serves as Senior Vice President and Deputy General Counsel of FMR LLC (2010-present), and is an employee of Fidelity Investments. Previously, Mr. Coffey served as Vice President and Associate General Counsel of FMR LLC (2005-2009). |
Elizabeth Paige Baumann (44) |
| Year of Election or Appointment: 2012 Anti-Money Laundering (AML) Officer of the Fidelity funds. Ms. Baumann also serves as AML Officer of The North Carolina Capital Management Trust: Cash and Term Portfolios (2012-present), Chief AML Officer of FMR LLC (2012-present), and is an employee of Fidelity Investments. Previously, Ms. Baumann served as Vice President and Deputy Anti-Money Laundering Officer (2007-2012). |
Christine Reynolds (53) |
| Year of Election or Appointment: 2008 Chief Financial Officer of the Fidelity funds. Ms. Reynolds became President of Fidelity Pricing and Cash Management Services (FPCMS) in August 2008. Ms. Reynolds served as Chief Operating Officer of FPCMS (2007-2008). Previously, Ms. Reynolds served as President, Treasurer, and Anti-Money Laundering officer of the Fidelity funds (2004-2007). |
Joseph A. Hanlon (44) |
| Year of Election or Appointment: 2012 Chief Compliance Officer of Fidelity's Equity and High Income Funds. Mr. Hanlon serves as Compliance Officer of FMR, FMR Co., Inc., Fidelity Investments Money Management, Inc. (FIMM), Fidelity Research and Analysis Company (FRAC), Fidelity Management & Research (Japan) Inc., Fidelity Management & Research (U.K.) Inc., Fidelity Management & Research (Hong Kong), and Strategic Advisers, Inc. (2009-present), as Senior Vice President of the Fidelity Asset Management Division (2009-present), and is an employee of Fidelity Investments. |
Joseph F. Zambello (55) |
| Year of Election or Appointment: 2011 Deputy Treasurer of the Fidelity funds. Mr. Zambello is an employee of Fidelity Investments. Previously, Mr. Zambello served as Vice President of FMR's Program Management Group (2009-2011) and Vice President of the Transfer Agent Oversight Group (2005-2009). |
Adrien E. Deberghes (44) |
| Year of Election or Appointment: 2008 Deputy Treasurer of Fidelity's Equity and High Income Funds. Mr. Deberghes also serves as Vice President (2011-present) and Assistant Treasurer (2010-present) of other Fidelity funds, and is an employee of Fidelity Investments (2008-present). Previously, Mr. Deberghes served as Senior Vice President of Mutual Fund Administration at State Street Corporation (2007-2008), Senior Director of Mutual Fund Administration at Investors Bank & Trust (2005-2007), and Director of Finance for Dunkin' Brands (2000-2005). |
Stephanie J. Dorsey (43) |
| Year of Election or Appointment: 2010 Assistant Treasurer of Fidelity's Equity and High Income Funds. Ms. Dorsey also serves as Deputy Treasurer of other Fidelity funds (2008-present) and is an employee of Fidelity Investments (2008-present). Previously, Ms. Dorsey served as Treasurer (2004-2008) of the JPMorgan Mutual Funds and Vice President (2004-2008) of JPMorgan Chase Bank. |
John R. Hebble (54) |
| Year of Election or Appointment: 2009 Assistant Treasurer of Fidelity's Equity and High Income Funds. Mr. Hebble also serves as President (2011-present), Treasurer, and Chief Financial Officer of The North Carolina Capital Management Trust: Cash and Term Portfolios (2008-present), President and Treasurer of other Fidelity funds (2008-present) and is an employee of Fidelity Investments. |
Gary W. Ryan (53) |
| Year of Election or Appointment: 2005 Assistant Treasurer of the Fidelity funds. Mr. Ryan is an employee of Fidelity Investments. Previously, Mr. Ryan served as Vice President of Fund Reporting in Fidelity Pricing and Cash Management Services (FPCMS) (1999-2005). |
Jonathan Davis (44) |
| Year of Election or Appointment: 2010 Assistant Treasurer of the Fidelity funds. Mr. Davis is also Assistant Treasurer of Fidelity Rutland Square Trust II and Fidelity Commonwealth Trust II. Mr. Davis is an employee of Fidelity Investments. Previously, Mr. Davis served as Vice President and Associate General Counsel of FMR LLC (2003-2010). |
Annual Report
Class K designates 35% of the dividends distributed during the fiscal year as qualifying for the dividends-received deduction for corporate shareholders.
Class K designates 42% of the dividends distributed during the fiscal year as amounts which may be taken into account as a dividend for the purposes of the maximum rate under section 1(h)(11) of the Internal Revenue Code.
The fund will notify shareholders in January 2013 of amounts for use in preparing 2012 income tax returns.
Annual Report
Board Approval of Investment Advisory Contracts and Management Fees
Fidelity Leveraged Company Stock Fund
Each year, the Board of Trustees, including the Independent Trustees (together, the Board), votes on the renewal of the management contract and sub-advisory agreements (together, the Advisory Contracts) for the fund. The Board, assisted by the advice of fund counsel and Independent Trustees' counsel, requests and considers a broad range of information relevant to the renewal of the Advisory Contracts throughout the year.
The Board meets regularly and, at each of its meetings, considers factors that are relevant to its annual consideration of the renewal of the fund's Advisory Contracts, including the services and support provided to the fund and its shareholders. The Board has established various standing committees, each composed of and chaired by Independent Trustees with varying backgrounds, to which the Board has assigned specific subject matter responsibilities in order to enhance effective decision-making by the Board. The Board, acting directly and through its Committees, requests and receives information concerning the annual consideration of the renewal of the fund's Advisory Contracts. The Board also meets as needed to consider matters specifically related to the Board's annual consideration of the renewal of Advisory Contracts. Members of the Board may also meet with trustees of other Fidelity funds through ad hoc joint committees to discuss certain matters relevant to the Fidelity funds.
At its July 2012 meeting, the Board of Trustees, including the Independent Trustees, unanimously determined to renew the fund's Advisory Contracts. In reaching its determination, the Board considered all factors it believed relevant, including (i) the nature, extent, and quality of the services to be provided to the fund and its shareholders (including the investment performance of the fund); (ii) the competitiveness of the fund's management fee and total expense ratio relative to peer funds; (iii) the total costs of the services to be provided by and the profits to be realized by Fidelity from its relationship with the fund; (iv) the extent to which economies of scale exist and would be realized as the fund grows; and (v) whether fee levels reflect these economies of scale, if any, for the benefit of fund shareholders.
In considering whether to renew the Advisory Contracts for the fund, the Board reached a determination, with the assistance of fund counsel and Independent Trustees' counsel and through the exercise of its business judgment, that the renewal of the Advisory Contracts is in the best interests of the fund and its shareholders and that the compensation payable under the Advisory Contracts is fair and reasonable. The Board's decision to renew the Advisory Contracts was not based on any single factor, but rather was based on a comprehensive consideration of all the information provided to the Board at its meetings throughout the year. The Board, in reaching its determination to renew the Advisory Contracts, is aware that shareholders in the fund have a broad range of investment choices available to them, including a wide choice among mutual funds offered by Fidelity's competitors, and that the fund's shareholders, who have the opportunity to review and weigh the disclosure provided by the fund in its prospectus and other public disclosures, have chosen to invest in this fund, managed by Fidelity.
Annual Report
Board Approval of Investment Advisory Contracts and
Management Fees - continued
Nature, Extent, and Quality of Services Provided. The Board considered the staffing within the investment adviser, FMR, and the sub-advisers (together, the Investment Advisers), including the backgrounds of the fund's investment personnel, and also considered the fund's investment objective, strategies, and related investment philosophy. The Independent Trustees also had discussions with senior management of Fidelity's investment operations and investment groups. The Board considered the structure of the portfolio manager compensation program and whether this structure provides appropriate incentives to act in the best interests of the fund.
Resources Dedicated to Investment Management and Support Services. The Board and the Fund Oversight and Research Committees reviewed the general qualifications and capabilities of the Investment Advisers' investment staff, including its size, education, experience, and resources, as well as the Investment Advisers' approach to recruiting, training, managing, and compensating investment personnel. The Board also noted that FMR has continued to increase the resources devoted to non-U.S. offices, including expansion of Fidelity's global investment organization. The Board noted that Fidelity's analysts have extensive resources, tools and capabilities that allow them to conduct sophisticated quantitative and fundamental analysis, as well as credit analysis of issuers, counterparties and guarantors. The Board also believes that Fidelity's investment professionals have sufficient access to global information and data so as to provide competitive investment results over time, and that those professionals also have access to sophisticated tools that permit them to assess portfolio construction and risk and performance attribution characteristics continuously, as well as to transmit new information and research conclusions rapidly around the world. Additionally, in its deliberations, the Board considered the Investment Advisers' trading and risk management capabilities and resources, which are an integral part of the investment management process.
Shareholder and Administrative Services. The Board considered (i) the nature, extent, quality, and cost of advisory, administrative, and shareholder services performed by the Investment Advisers and their affiliates under the Advisory Contracts and under separate agreements covering transfer agency, pricing and bookkeeping, and securities lending services for the fund; (ii) the nature and extent of the supervision of third party service providers, principally custodians and subcustodians; and (iii) the resources devoted to, and the record of compliance with, the fund's compliance policies and procedures. The Board also reviewed the allocation of fund brokerage, including allocations to brokers affiliated with the Investment Advisers, the use of brokerage commissions to pay fund expenses, and the use of "soft" commission dollars to pay for research services.
Annual Report
The Board noted that the growth of fund assets over time across the complex allows Fidelity to reinvest in the development of services designed to enhance the value or convenience of the Fidelity funds as investment vehicles. These services include 24-hour access to account information and market information through telephone representatives and over the Internet, investor education materials and asset allocation tools, and the expanded availability of Fidelity Investor Centers.
Investment in a Large Fund Family. The Board considered the benefits to shareholders of investing in a Fidelity fund, including the benefits of investing in a fund that is part of a large family of funds offering a variety of investment disciplines and providing a large variety of mutual fund investor services. The Board noted that Fidelity had taken, or had made recommendations that resulted in the Fidelity funds taking, a number of actions over the previous year that benefited particular funds, including (i) continuing to dedicate additional resources to investment research and support of the senior management team that oversees asset management; (ii) persisting in efforts to enhance Fidelity's research capabilities, in particular, international research; (iii) launching new funds and making other enhancements to meet client needs for global and income-oriented solutions; (iv) continuing to launch dedicated lower cost underlying funds to meet investment management's portfolio construction needs related to expanding underlying fund options, specifically for the Freedom Fund product lines; (v) adopting a "Stock Selector" sector neutral investment approach and employing a team of portfolio managers who are sector specialists to manage certain funds; (vi) rationalizing product lines and gaining increased efficiencies through the mergers of several funds into other funds; (vii) strengthening the Spartan Index Fund product line by adding new funds and/or new low-cost institutional share classes, restructuring fund expenses to accommodate new classes, and reducing investment minimums for certain classes of shares; (viii) modifying the eligibility criteria for Institutional Class shares to increase their appeal to government entities and charitable investors; and (ix) reducing certain transfer agent fee rates.
Investment Performance. The Board considered whether the fund has operated in accordance with its investment objective, as well as its record of compliance with its investment restrictions. It also reviewed the fund's absolute investment performance for each class, as well as the fund's relative investment performance for each class measured over multiple periods against (i) a broad-based securities market index, and (ii) a custom peer group of mutual funds deemed appropriate by Fidelity and reviewed by the Board. The following charts considered by the Board show, over the one-, three-, and five-year periods ended December 31, 2011, as available, the cumulative total returns of Class K and the retail class of the fund, the cumulative total returns of a broad-based securities market index ("benchmark"), and a range of cumulative total returns of a custom peer group of mutual funds defined by FMR based on categories assigned by Morningstar, Inc. The box within each chart shows the 25th percentile return (top of box) and the 75th percentile return (bottom of box) of the peer group. Returns shown above the box are in the first quartile and returns shown below the box are in the fourth quartile. The percentage beaten numbers noted below each chart correspond to the percentile box and represent the percentage of funds in the peer group whose performance was equal to or lower than that of the class indicated. The fund's custom peer group, defined by FMR, is a peer group that FMR believes provides a more meaningful performance comparison than the peer group assigned by Morningstar, Inc., which assigns mutual funds to categories based on their investment styles as measured by their underlying portfolio holdings.
Annual Report
Board Approval of Investment Advisory Contracts and
Management Fees - continued
Fidelity Leveraged Company Stock Fund
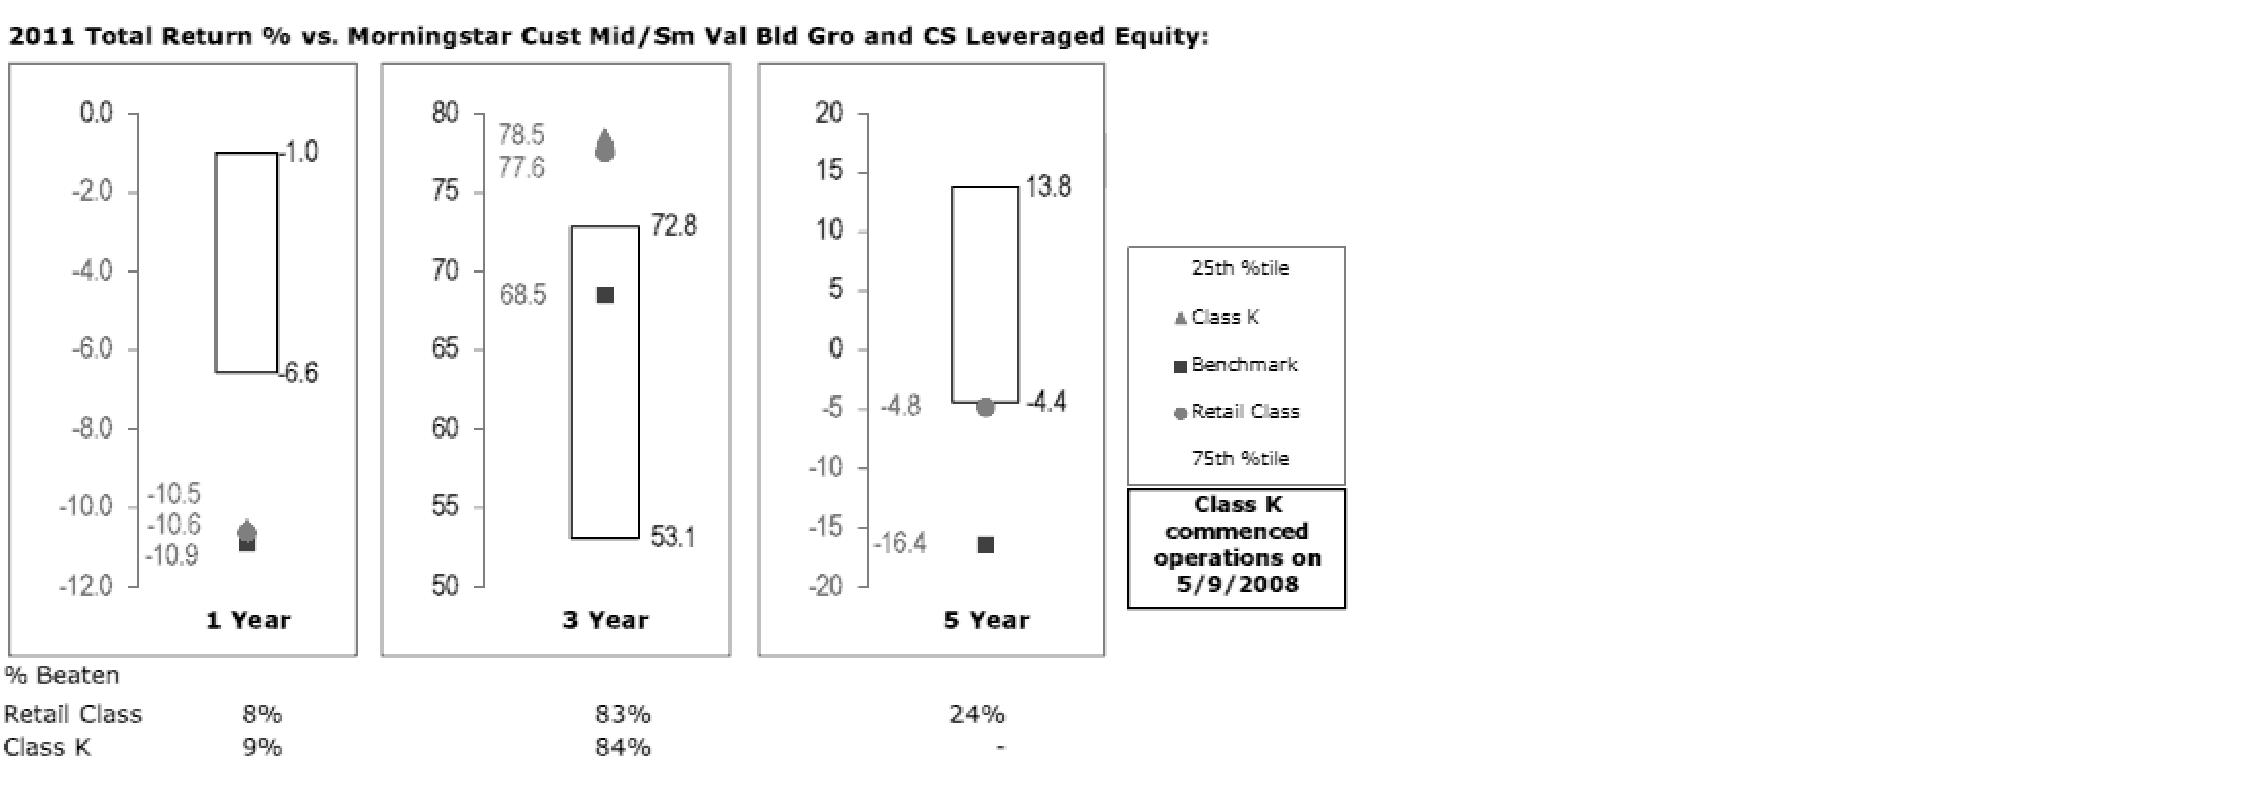
The Board reviewed the fund's relative investment performance against its peer group and noted that the performance of the retail class of the fund (the class with the longer performance record) was in the fourth quartile for the one- and five-year periods and the first quartile for the three-year period. The Board also noted that the investment performance of the retail class of the fund compared favorably to its benchmark for all the periods shown. The Board considered that the variations in performance between the fund's classes reflect the variations in class expenses, which result in lower performance for the higher expense class. The Board also reviewed the fund's performance since inception as well as performance in the current year.
Based on its review, the Board concluded that the nature, extent, and quality of services provided to the fund under the Advisory Contracts should benefit the fund's shareholders.
Competitiveness of Management Fee and Total Expense Ratio. The Board considered the fund's management fee and total expense ratio compared to "mapped groups" of competitive funds and classes. Fidelity creates "mapped groups" by combining similar Lipper investment objective categories that have comparable management fee characteristics. Combining Lipper investment objective categories aids the Board's management fee and total expense ratio comparisons by broadening the competitive group used for comparison and by reducing the number of universes to which various Fidelity funds are compared.
Annual Report
Management Fee. The Board considered two proprietary management fee comparisons for the 12-month periods shown in the chart below. The group of Lipper funds used by the Board for management fee comparisons is referred to below as the "Total Mapped Group." The Total Mapped Group comparison focuses on a fund's standing relative to the total universe of comparable funds available to investors in terms of gross management fees before expense reimbursements or caps. "TMG %" represents the percentage of funds in the Total Mapped Group that had management fees that were lower than the fund's. For example, a TMG % of 18% means that 82% of the funds in the Total Mapped Group had higher management fees than the fund. The "Asset-Size Peer Group" (ASPG) comparison focuses on a fund's standing relative to non-Fidelity funds similar in size to the fund within the Total Mapped Group. The ASPG represents at least 15% of the funds in the Total Mapped Group with comparable asset size and management fee characteristics, subject to a minimum of 50 funds (or all funds in the Total Mapped Group if fewer than 50). Additional information, such as the ASPG quartile in which the fund's management fee ranked, is also included in the chart and considered by the Board.
Fidelity Leveraged Company Stock Fund

Annual Report
Board Approval of Investment Advisory Contracts and
Management Fees - continued
The Board noted that the fund's management fee ranked below the median of its Total Mapped Group and below the median of its ASPG for 2011.
Based on its review, the Board concluded that the fund's management fee is fair and reasonable in light of the services that the fund receives and the other factors considered.
Total Expense Ratio. In its review of each class's total expense ratio, the Board considered the fund's management fee as well as other fund or class expenses, as applicable, such as transfer agent fees, pricing and bookkeeping fees, and custodial, legal, and audit fees. The Board also noted the effects of any waivers and reimbursements on fees and expenses. As part of its review, the Board also considered the current and historical total expense ratios of each class of the fund compared to competitive fund median expenses. Each class of the fund is compared to those funds and classes in the Total Mapped Group (used by the Board for management fee comparisons) that have a similar sales load structure.
The Board noted that the total expense ratio of each class ranked below its competitive median for 2011.
Fees Charged to Other Fidelity Clients. The Board also considered Fidelity fee structures and other information with respect to clients of FMR and its affiliates, such as other mutual funds advised or subadvised by FMR or its affiliates, pension plan clients, and other institutional clients. The Board noted the findings of the 2010 ad hoc joint committee (created with the board of other Fidelity funds), which reviewed and compared Fidelity's institutional investment advisory business with its business of providing services to the Fidelity funds, including the differences in services provided, fees charged, and costs incurred, as well as competition in their respective marketplaces.
Based on its review of total expense ratios and fees charged to other Fidelity clients, the Board concluded that the total expense ratio of each class of the fund was reasonable in light of the services that the fund and its shareholders receive and the other factors considered.
Costs of the Services and Profitability. The Board considered the revenues earned and the expenses incurred by Fidelity in conducting the business of developing, marketing, distributing, managing, administering and servicing the fund and its shareholders. The Board also considered the level of Fidelity's profits in respect of all the Fidelity funds.
On an annual basis, FMR presents to the Board Fidelity's profitability for the fund. Fidelity calculates the profitability for each fund, as well as aggregate profitability for groups of Fidelity funds and all Fidelity funds, using a series of detailed revenue and cost allocation methodologies which originate with the books and records of Fidelity on which Fidelity's audited financial statements are based. The Audit Committee of the Board reviews any significant changes from the prior year's methodologies.
Annual Report
PricewaterhouseCoopers LLP (PwC), independent registered public accounting firm and auditor to Fidelity and certain Fidelity funds, has been engaged annually by the Board as part of the Board's assessment of Fidelity's profitability analysis. PwC's engagement includes the review and assessment of Fidelity's methodologies used in determining the revenues and expenses attributable to Fidelity's mutual fund business, and completion of agreed-upon procedures surrounding the mathematical accuracy of fund profitability and its conformity to allocation methodologies. After considering PwC's reports issued under the engagement and information provided by Fidelity, the Board concluded that while other allocation methods may also be reasonable, Fidelity's profitability methodologies are reasonable in all material respects.
The Board also reviewed Fidelity's non-fund businesses and fall-out benefits related to the mutual fund business as well as cases where Fidelity's affiliates may benefit from or be related to the fund's business.
The Board considered the costs of the services provided by and the profits realized by Fidelity in connection with the operation of the fund and was satisfied that the profitability was not excessive in the circumstances.
Economies of Scale. The Board considered whether there have been economies of scale in respect of the management of the Fidelity funds, whether the Fidelity funds (including the fund) have appropriately benefited from any such economies of scale, and whether there is potential for realization of any further economies of scale. The Board considered the extent to which the fund will benefit from economies of scale through increased services to the fund, through waivers or reimbursements, or through fee or expense reductions. The Board also noted that in 2009, it and the board of other Fidelity funds created an ad hoc committee (the Economies of Scale Committee) to analyze whether FMR attains economies of scale in respect of the management and servicing of the Fidelity funds, whether the Fidelity funds have appropriately benefited from such economies of scale, and whether there is potential for realization of any further economies of scale.
The Board recognized that the fund's management contract incorporates a "group fee" structure, which provides for lower group fee rates as total fund assets under FMR's management increase, and for higher group fee rates as total fund assets under FMR's management decrease. FMR calculates the group fee rates based on a tiered asset "breakpoint" schedule that varies based on asset class. The Board considered that the group fee is designed to deliver the benefits of economies of scale to fund shareholders when total Fidelity fund assets increase, even if assets of any particular fund are unchanged or have declined, because some portion of Fidelity's costs are attributable to services provided to all Fidelity funds, and all funds benefit if those costs can be allocated among more assets. The Board concluded that, given the group fee structure, fund shareholders will benefit from lower management fees as assets under FMR's management increase at the fund complex level, regardless of whether Fidelity achieves any such economies of scale.
Annual Report
Board Approval of Investment Advisory Contracts and
Management Fees - continued
The Board concluded, taking into account the analysis of the Economies of Scale Committee, that economies of scale, if any, are being appropriately shared between fund shareholders and Fidelity.
Additional Information Requested by the Board. In order to develop fully the factual basis for consideration of the Fidelity funds' Advisory Contracts, the Board requested and received additional information on certain topics, including (i) fund performance trends, actions to be taken by FMR to improve certain funds' overall performance, and Fidelity's long-term strategies for certain funds; (ii) the potential to further rationalize the Fidelity fund lineup with the possibility of achieving savings for the funds and Fidelity; (iii) Fidelity's compensation structure for portfolio managers and other key investment personnel; (iv) the amount of the investment that each portfolio manager has made in the Fidelity fund(s) that he or she manages; (v) the realization of fall-out benefits in certain Fidelity business units; (vi) Fidelity's group fee structures, the potential impact of regulatory changes on such structures, and the rationale for the individual fee rates of certain funds; (vii) fund profitability methodology, including Fidelity's cost allocation methodology, and the impact of certain factors on fund profitability results; (viii) trends regarding industry use of performance fee structures and the possibility of implementing performance fee structures for additional funds; and (ix) the impact of net redemptions from the Fidelity funds.
Based on its evaluation of all of the conclusions noted above, and after considering all factors it believed relevant, the Board ultimately concluded that the advisory fee structures are fair and reasonable, and that the fund's Advisory Contracts should be renewed.
Annual Report
Investment Adviser
Fidelity Management & Research Company
Boston, MA
Investment Sub-Adviser
FMR Co., Inc.
Fidelity Management & Research
(U.K.) Inc.
Fidelity Management & Research
(Hong Kong) Limited
Fidelity Management & Research
(Japan) Inc.
General Distributor
Fidelity Distributors Corporation
Smithfield, RI
Transfer and Service Agents
Fidelity Investments Institutional
Operations Company, Inc.
Boston, MA
Fidelity Service Company, Inc.
Boston, MA
Custodian
JPMorgan Chase Bank
New York, NY
(Fidelity Investment logo)(registered trademark)
Corporate Headquarters
82 Devonshire St., Boston, MA 02109
www.fidelity.com
LSF-K-UANN-0912
1.863381.103
Fidelity®
Leveraged Company Stock
Fund
Annual Report
July 31, 2012
(Fidelity Cover Art)
Contents
Performance | (Click Here) | How the fund has done over time. |
Management's Discussion of Fund Performance | (Click Here) | The Portfolio Manager's review of fund performance and strategy. |
Shareholder Expense Example | (Click Here) | An example of shareholder expenses. |
Investment Changes | (Click Here) | A summary of major shifts in the fund's investments over the last six months. |
Investments | (Click Here) | A complete list of the fund's investments with their market values. |
Financial Statements | (Click Here) | Statements of assets and liabilities, operations, and changes in net assets, as well as financial highlights. |
Notes | (Click Here) | Notes to the financial statements. |
Report of Independent Registered Public Accounting Firm | (Click Here) | |
Trustees and Officers | (Click Here) | |
Distributions | (Click Here) | |
Board Approval of Investment Advisory Contracts and Management Fees | (Click Here) | |
To view a fund's proxy voting guidelines and proxy voting record for the 12-month period ended June 30, visit http://www.fidelity.com/proxyvotingresults or visit the Securities and Exchange Commission's (SEC) web site at http://www.sec.gov. You may also call 1-800-544-8544 to request a free copy of the proxy voting guidelines.
Standard & Poor's, S&P and S&P 500 are registered service marks of The McGraw-Hill Companies, Inc. and have been licensed for use by Fidelity Distributors Corporation.
Other third party marks appearing herein are the property of their respective owners.
All other marks appearing herein are registered or unregistered trademarks or service marks of FMR LLC or an affiliated company. © 2012 FMR LLC. All rights reserved.
Annual Report
This report and the financial statements contained herein are submitted for the general information of the shareholders of the fund. This report is not authorized for distribution to prospective investors in the fund unless preceded or accompanied by an effective prospectus.
A fund files its complete schedule of portfolio holdings with the SEC for the first and third quarters of each fiscal year on Form N-Q. Forms N-Q are available on the SEC's web site at http://www.sec.gov. A fund's Forms N-Q may be reviewed and copied at the SEC's Public Reference Room in Washington, DC. Information regarding the operation of the SEC's Public Reference Room may be obtained by calling 1-800-SEC-0330. For a complete list of a fund's portfolio holdings, view the most recent holdings listing, semiannual report, or annual report on Fidelity's web site at http://www.fidelity.com, http://www.advisor.fidelity.com, or http://www.401k.com, as applicable.
NOT FDIC INSURED • MAY LOSE VALUE • NO BANK GUARANTEE
Neither the fund nor Fidelity Distributors Corporation is a bank.
Annual Report
Average annual total return reflects the change in the value of an investment, assuming reinvestment of the class' distributions from dividend income and capital gains (the profits earned upon the sale of securities that have grown in value, if any) and assuming a constant rate of performance each year. The $10,000 table and the fund's returns do not reflect the deduction of taxes that a shareholder would pay on fund distributions or the redemption of fund shares. During periods of reimbursement by Fidelity, a fund's total return will be greater than it would be had the reimbursement not occurred. How a fund did yesterday is no guarantee of how it will do tomorrow.
Average Annual Total Returns
Periods ended July 31, 2012 | Past 1
year | Past 5
years | Past 10
years |
Fidelity® Leveraged Company Stock Fund | -1.05% | -1.71% | 17.22% |
$10,000 Over 10 Years
Let's say hypothetically that $10,000 was invested in Fidelity® Leveraged Company Stock Fund, a class of the fund, on July 31, 2002. The chart shows how the value of your investment would have changed, and also shows how the S&P 500® Index performed over the same period.
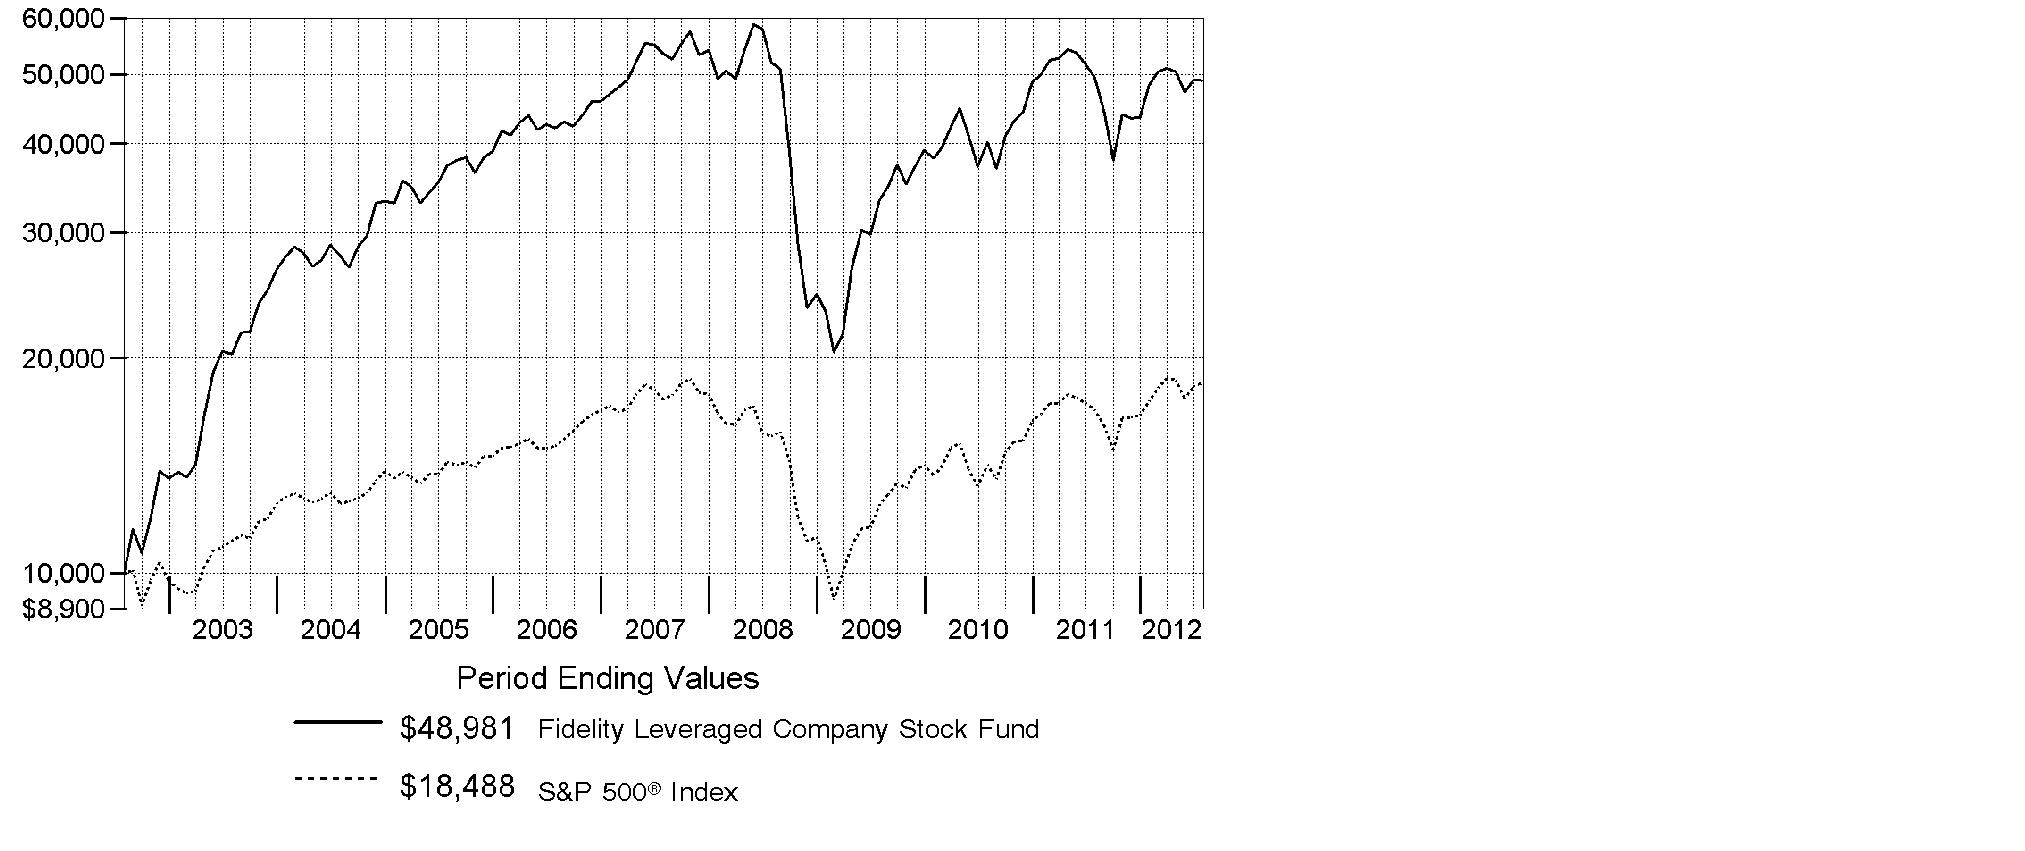
Annual Report
Market Recap: Major U.S. equity benchmarks posted solid gains for the year ending July 31, 2012, amid an uncertain investment environment. The broad-based S&P 500® Index returned 9.13%, while the blue-chip-laden Dow Jones Industrial AverageSM and technology-heavy Nasdaq Composite® Index gained 10.12% and 7.83%, respectively. Volatility spiked during the period's first half, as equities plummeted late last summer on Europe's debt woes, political wrangling over the U.S. debt ceiling and the sovereign credit-rating downgrade that followed. By October, a seemingly improved U.S. economy rejuvenated stocks, paving the way for major equity benchmarks to post their best first-quarter performance since 1998. However, more eurozone trouble, signs that the U.S. economy had turned sluggish and a slowdown in China caused stocks to slip in May, before a new wave of optimism took hold in June and July. Within the S&P 500®, more-defensive sectors such as telecommunication services (+30%) and consumer staples (+20%) fared best, while materials and energy significantly underperformed, returning -5%. Small- and mid-cap stocks trailed their less-volatile large-cap counterparts, with the Russell 2000® Index adding 0.19% and the Russell Midcap® Index rising 2.28%. Given turmoil and local currency weakness in Europe, foreign developed-markets stocks lost ground, with the MSCI® EAFE® Index returning -11.32%.
Comments from Thomas Soviero, Portfolio Manager of Fidelity® Leveraged Company Stock Fund: For the year, the fund's Retail Class shares returned -1.05%, underperforming the S&P 500® Index but beating the -7.76% return of the Credit Suisse Leveraged Equity Index. Relative to the S&P® index, the fund lost ground due to positioning in automobiles and components, an overweighting in materials - although the negative impact was more than offset by strong security selection here - positioning in health care and consumer staples, and stock selection in energy, capital goods and semiconductor/semiconductor equipment. Among individual stocks coal companies Peabody Energy and Alpha Natural Resources detracted, as did ON Semiconductor, video-game retailer GameStop and Ford Motor. On the plus side, the fund benefited from underweighting the weak financials sector. Contributors included chemicals company LyondellBasell Industries, pipeline provider El Paso and funeral home operator Service Corporation International. Some of the stocks I've mentioned in this report were not part of the S&P index and El Paso - which was acquired in May - was sold from the fund before period end.
The views expressed above reflect those of the portfolio manager(s) only through the end of the period as stated on the cover of this report and do not necessarily represent the views of Fidelity or any other person in the Fidelity organization. Any such views are subject to change at any time based upon market or other conditions and Fidelity disclaims any responsibility to update such views. These views may not be relied on as investment advice and, because investment decisions for a Fidelity fund are based on numerous factors, may not be relied on as an indication of trading intent on behalf of any Fidelity fund.
Annual Report
Shareholder Expense Example
As a shareholder of the Fund, you incur two types of costs: (1) transaction costs, including redemption fees and (2) ongoing costs, including management fees and other Fund expenses. This Example is intended to help you understand your ongoing costs (in dollars) of investing in the Fund and to compare these costs with the ongoing costs of investing in other mutual funds.
The Example is based on an investment of $1,000 invested at the beginning of the period and held for the entire period (February 1, 2012 to July 31, 2012).
Actual Expenses
The first line of the accompanying table for each class of the Fund provides information about actual account values and actual expenses. You may use the information in this line, together with the amount you invested, to estimate the expenses that you paid over the period. Simply divide your account value by $1,000.00 (for example, an $8,600 account value divided by $1,000.00 = 8.6), then multiply the result by the number in the first line for a class of the Fund under the heading entitled "Expenses Paid During Period" to estimate the expenses you paid on your account during this period. A small balance maintenance fee of $12.00 that is charged once a year may apply for certain accounts with a value of less than $2,000. This fee is not included in the table below. If it was, the estimate of expenses you paid during the period would be higher, and your ending account value lower, by this amount. In addition, the Fund, as a shareholder in the underlying Fidelity Central Funds, will indirectly bear its pro-rata share of the fees and expenses incurred by the underlying Fidelity Central Funds. These fees and expenses are not included in the Fund's annualized expense ratio used to calculate the expense estimate in the table below.
Hypothetical Example for Comparison Purposes
The second line of the accompanying table for each class of the Fund provides information about hypothetical account values and hypothetical expenses based on a Class' actual expense ratio and an assumed rate of return of 5% per year before expenses, which is not the Class' actual return. The hypothetical account values and expenses may not be used to estimate the actual ending account balance or expenses you paid for the period. You may use this information to compare the ongoing costs of investing in the Fund and other funds. To do so, compare this 5% hypothetical example with the 5% hypothetical examples that appear in the shareholder reports of the other funds. A small balance maintenance fee of $12.00 that is charged once a year may apply for certain accounts with a value of less than $2,000. This fee is not included in the table below. If it was, the estimate of expenses you paid during the period would be higher, and your ending account value lower, by this amount. In addition, the Fund, as a shareholder in the underlying Fidelity Central Funds, will indirectly bear its pro-rata share of the fees and expenses incurred by the underlying Fidelity Central Funds. These fees and expenses are not included in the Fund's annualized expense ratio used to calculate the expense estimate in the table below.
Please note that the expenses shown in the table are meant to highlight your ongoing costs only and do not reflect any transaction costs. Therefore, the second line of the table is useful in comparing ongoing costs only, and will not help you determine the relative total costs of owning different funds. In addition, if these transactional costs were included, your costs would have been higher.
Annual Report
Shareholder Expense Example - continued
| Annualized
Expense Ratio | Beginning
Account Value
February 1, 2012 | Ending
Account Value
July 31, 2012 | Expenses Paid
During Period*
February 1, 2012
to July 31, 2012 |
Leveraged Company Stock | .85% | | | |
Actual | | $ 1,000.00 | $ 1,015.80 | $ 4.26 |
HypotheticalA | | $ 1,000.00 | $ 1,020.64 | $ 4.27 |
Class K | .69% | | | |
Actual | | $ 1,000.00 | $ 1,016.50 | $ 3.46 |
HypotheticalA | | $ 1,000.00 | $ 1,021.43 | $ 3.47 |
A 5% return per year before expenses
* Expenses are equal to each Class' annualized expense ratio, multiplied by the average account value over the period, multiplied by 182/366 (to reflect the one-half year period).
Annual Report
Investment Changes (Unaudited)
Top Ten Stocks as of July 31, 2012 |
| % of fund's
net assets | % of fund's net assets
6 months ago |
LyondellBasell Industries NV Class A | 8.9 | 9.1 |
Service Corporation International | 4.9 | 4.6 |
Apple, Inc. | 4.4 | 3.7 |
The AES Corp. | 4.3 | 4.2 |
HollyFrontier Corp. | 3.1 | 2.1 |
Comcast Corp. Class A | 3.0 | 2.8 |
Merck & Co., Inc. | 1.9 | 1.0 |
Ford Motor Co. | 1.7 | 1.9 |
ON Semiconductor Corp. | 1.7 | 2.4 |
Cinemark Holdings, Inc. | 1.7 | 1.3 |
| 35.6 | |
Top Five Market Sectors as of July 31, 2012 |
| % of fund's
net assets | % of fund's net assets
6 months ago |
Consumer Discretionary | 21.5 | 22.4 |
Materials | 13.9 | 16.0 |
Energy | 11.3 | 9.5 |
Information Technology | 11.3 | 11.5 |
Industrials | 11.0 | 14.0 |
Asset Allocation (% of fund's net assets) |
As of July 31, 2012 * | As of January 31, 2012** |
 | Stocks 91.3% | | | Stocks 95.7% | |
 | Bonds 0.9% | | | Bonds 0.3% | |
 | Other Investments 0.4% | | | Other Investments 0.3% | |
 | Short-Term Investments and Net Other Assets (Liabilities) 7.4% | | | Short-Term Investments and Net Other Assets (Liabilities) 3.7% | |
* Foreign investments | 14.3% | | ** Foreign investments | 14.7% | |

Annual Report
Investments July 31, 2012
Showing Percentage of Net Assets
Common Stocks - 90.9% |
| Shares | | Value (000s) |
CONSUMER DISCRETIONARY - 20.7% |
Auto Components - 1.0% |
Delphi Automotive PLC | 163,300 | | $ 4,636 |
Exide Technologies (a)(f) | 3,930,293 | | 11,516 |
Tenneco, Inc. (a) | 97,700 | | 2,862 |
TRW Automotive Holdings Corp. (a) | 456,100 | | 17,925 |
| | 36,939 |
Automobiles - 3.4% |
Daimler AG (United States) | 209,400 | | 10,426 |
Ford Motor Co. | 6,790,633 | | 62,745 |
General Motors Co. (a) | 1,647,566 | | 32,474 |
General Motors Co.: | | | |
warrants 7/10/16 (a) | 445,805 | | 4,922 |
warrants 7/10/19 (a) | 445,805 | | 3,005 |
Motors Liquidation Co. GUC Trust (a) | 123,112 | | 1,741 |
Toyota Motor Corp. sponsored ADR | 89,500 | | 6,848 |
| | 122,161 |
Diversified Consumer Services - 5.2% |
Service Corporation International (f) | 13,723,282 | | 176,344 |
Stewart Enterprises, Inc. Class A (e) | 1,515,242 | | 10,349 |
| | 186,693 |
Hotels, Restaurants & Leisure - 0.5% |
Penn National Gaming, Inc. (a) | 416,040 | | 16,192 |
Station Holdco LLC warrants 6/15/18 (a)(i)(j) | 146,846 | | 7 |
| | 16,199 |
Household Durables - 2.0% |
Hovnanian Enterprises, Inc. Class A (a)(e) | 1,419,000 | | 3,292 |
Lennar Corp. Class A (e) | 983,400 | | 28,725 |
Newell Rubbermaid, Inc. | 2,341,747 | | 41,332 |
| | 73,349 |
Leisure Equipment & Products - 0.2% |
Callaway Golf Co. (e) | 1,630,035 | | 8,949 |
Media - 5.3% |
Belo Corp. Series A | 163,800 | | 1,122 |
Cablevision Systems Corp. - NY Group Class A | 541,324 | | 8,304 |
Cinemark Holdings, Inc. | 2,601,645 | | 60,826 |
Comcast Corp. Class A | 3,302,598 | | 107,500 |
Gray Television, Inc. (a)(f) | 3,766,164 | | 6,327 |
Nexstar Broadcasting Group, Inc. Class A (a) | 1,130,500 | | 7,371 |
| | 191,450 |
Common Stocks - continued |
| Shares | | Value (000s) |
CONSUMER DISCRETIONARY - continued |
Multiline Retail - 0.6% |
Target Corp. | 338,600 | | $ 20,536 |
Specialty Retail - 1.9% |
Asbury Automotive Group, Inc. (a) | 385,122 | | 10,075 |
GameStop Corp. Class A (e) | 3,156,107 | | 50,561 |
Sally Beauty Holdings, Inc. (a) | 300,000 | | 7,926 |
| | 68,562 |
Textiles, Apparel & Luxury Goods - 0.6% |
Coach, Inc. | 123,220 | | 6,078 |
PVH Corp. | 188,310 | | 14,957 |
| | 21,035 |
TOTAL CONSUMER DISCRETIONARY | | 745,873 |
CONSUMER STAPLES - 2.7% |
Food & Staples Retailing - 0.6% |
Whole Foods Market, Inc. | 222,009 | | 20,376 |
Food Products - 1.9% |
Darling International, Inc. (a) | 3,476,642 | | 57,434 |
Smithfield Foods, Inc. (a) | 559,606 | | 10,353 |
| | 67,787 |
Personal Products - 0.2% |
Revlon, Inc. (a) | 553,261 | | 8,050 |
TOTAL CONSUMER STAPLES | | 96,213 |
ENERGY - 11.3% |
Energy Equipment & Services - 3.1% |
Ensco PLC Class A | 110,000 | | 5,976 |
Halliburton Co. | 1,126,593 | | 37,324 |
Noble Corp. | 447,200 | | 16,546 |
Oil States International, Inc. (a) | 270,700 | | 19,680 |
Parker Drilling Co. (a) | 1,200,000 | | 5,556 |
Schlumberger Ltd. | 109,400 | | 7,796 |
Transocean Ltd. (United States) | 381,900 | | 17,884 |
| | 110,762 |
Oil, Gas & Consumable Fuels - 8.2% |
Alpha Natural Resources, Inc. (a) | 1,098,500 | | 7,700 |
Chesapeake Energy Corp. (e) | 1,090,491 | | 20,523 |
Continental Resources, Inc. (a)(e) | 534,087 | | 34,176 |
Common Stocks - continued |
| Shares | | Value (000s) |
ENERGY - continued |
Oil, Gas & Consumable Fuels - continued |
Forest Oil Corp. (a) | 1,205,652 | | $ 8,259 |
Hess Corp. | 109,600 | | 5,169 |
HollyFrontier Corp. | 2,997,133 | | 112,063 |
Nexen, Inc. | 188,000 | | 4,777 |
Peabody Energy Corp. | 822,825 | | 17,181 |
Range Resources Corp. | 247,200 | | 15,475 |
Valero Energy Corp. | 1,438,166 | | 39,550 |
Western Refining, Inc. (e) | 1,403,970 | | 33,035 |
| | 297,908 |
TOTAL ENERGY | | 408,670 |
FINANCIALS - 6.5% |
Capital Markets - 0.5% |
Morgan Stanley | 1,187,000 | | 16,214 |
Commercial Banks - 2.8% |
Huntington Bancshares, Inc. | 8,526,580 | | 52,993 |
Regions Financial Corp. | 3,284,894 | | 22,863 |
SunTrust Banks, Inc. | 1,019,600 | | 24,114 |
| | 99,970 |
Consumer Finance - 0.5% |
American Express Co. | 335,547 | | 19,364 |
Diversified Financial Services - 0.6% |
Citigroup, Inc. | 855,847 | | 23,219 |
Insurance - 1.4% |
AFLAC, Inc. | 641,700 | | 28,094 |
Assured Guaranty Ltd. | 1,249,684 | | 14,971 |
Lincoln National Corp. | 435,700 | | 8,736 |
| | 51,801 |
Real Estate Investment Trusts - 0.7% |
Host Hotels & Resorts, Inc. | 1,016,122 | | 14,917 |
Sabra Health Care REIT, Inc. | 547,507 | | 10,140 |
| | 25,057 |
TOTAL FINANCIALS | | 235,625 |
Common Stocks - continued |
| Shares | | Value (000s) |
HEALTH CARE - 7.5% |
Health Care Equipment & Supplies - 0.9% |
Alere, Inc. (a) | 419,708 | | $ 7,920 |
Boston Scientific Corp. (a) | 4,796,000 | | 24,795 |
| | 32,715 |
Health Care Providers & Services - 4.4% |
Community Health Systems, Inc. (a) | 784,376 | | 19,303 |
DaVita, Inc. (a) | 367,826 | | 36,201 |
HCA Holdings, Inc. | 1,216,779 | | 32,220 |
Kindred Healthcare, Inc. (a) | 108,330 | | 1,026 |
Sun Healthcare Group, Inc. (a) | 547,507 | | 4,577 |
Tenet Healthcare Corp. (a) | 10,697,206 | | 49,421 |
Universal Health Services, Inc. Class B | 385,505 | | 15,066 |
| | 157,814 |
Pharmaceuticals - 2.2% |
Johnson & Johnson | 153,000 | | 10,591 |
Merck & Co., Inc. | 1,577,900 | | 69,696 |
| | 80,287 |
TOTAL HEALTH CARE | | 270,816 |
INDUSTRIALS - 10.7% |
Aerospace & Defense - 1.0% |
Teledyne Technologies, Inc. (a) | 340,694 | | 21,225 |
Textron, Inc. | 602,700 | | 15,700 |
| | 36,925 |
Airlines - 2.1% |
Delta Air Lines, Inc. (a) | 4,757,234 | | 45,907 |
Southwest Airlines Co. | 571,283 | | 5,250 |
United Continental Holdings, Inc. (a) | 370,700 | | 7,003 |
US Airways Group, Inc. (a)(e) | 1,481,380 | | 16,977 |
| | 75,137 |
Building Products - 1.0% |
Armstrong World Industries, Inc. | 693,300 | | 26,796 |
Owens Corning (a) | 294,219 | | 7,903 |
Owens Corning warrants 10/31/13 (a) | 406,600 | | 305 |
| | 35,004 |
Common Stocks - continued |
| Shares | | Value (000s) |
INDUSTRIALS - continued |
Commercial Services & Supplies - 1.6% |
Deluxe Corp. | 1,786,873 | | $ 50,604 |
R.R. Donnelley & Sons Co. (e) | 450,900 | | 5,465 |
| | 56,069 |
Electrical Equipment - 1.4% |
Belden, Inc. | 777,664 | | 24,986 |
Emerson Electric Co. | 163,500 | | 7,810 |
General Cable Corp. (a) | 437,132 | | 11,422 |
Polypore International, Inc. (a)(e) | 217,800 | | 8,093 |
| | 52,311 |
Industrial Conglomerates - 1.3% |
Carlisle Companies, Inc. | 109,910 | | 5,549 |
General Electric Co. | 1,103,883 | | 22,906 |
Tyco International Ltd. | 328,233 | | 18,033 |
| | 46,488 |
Machinery - 1.5% |
Fiat Industrial SpA | 1,634,423 | | 16,088 |
Ingersoll-Rand PLC | 739,500 | | 31,362 |
Timken Co. | 228,734 | | 8,280 |
| | 55,730 |
Marine - 0.2% |
Navios Maritime Holdings, Inc. | 2,162,794 | | 7,591 |
Road & Rail - 0.5% |
Avis Budget Group, Inc. (a) | 719,914 | | 10,345 |
Hertz Global Holdings, Inc. (a) | 707,700 | | 7,969 |
| | 18,314 |
Trading Companies & Distributors - 0.1% |
Edgen Group, Inc. Class A | 482,300 | | 3,617 |
TOTAL INDUSTRIALS | | 387,186 |
INFORMATION TECHNOLOGY - 11.3% |
Communications Equipment - 1.1% |
Cisco Systems, Inc. | 2,383,049 | | 38,010 |
Computers & Peripherals - 4.4% |
Apple, Inc. | 260,413 | | 159,050 |
Electronic Equipment & Components - 1.0% |
Avnet, Inc. (a) | 594,313 | | 18,721 |
Common Stocks - continued |
| Shares | | Value (000s) |
INFORMATION TECHNOLOGY - continued |
Electronic Equipment & Components - continued |
Corning, Inc. | 726,800 | | $ 8,293 |
Viasystems Group, Inc. (a) | 540,460 | | 8,323 |
| | 35,337 |
Internet Software & Services - 0.2% |
VeriSign, Inc. (a) | 194,300 | | 8,631 |
Office Electronics - 0.3% |
Xerox Corp. | 1,756,342 | | 12,171 |
Semiconductors & Semiconductor Equipment - 3.6% |
Fairchild Semiconductor International, Inc. (a) | 1,122,274 | | 15,555 |
Freescale Semiconductor Holdings I Ltd. (a) | 584,500 | | 6,237 |
Intel Corp. | 454,981 | | 11,693 |
Intersil Corp. Class A | 1,460,387 | | 13,450 |
Micron Technology, Inc. (a) | 2,293,545 | | 14,243 |
NXP Semiconductors NV (a) | 275,200 | | 6,217 |
ON Semiconductor Corp. (a) | 8,823,313 | | 61,234 |
| | 128,629 |
Software - 0.7% |
Citrix Systems, Inc. (a) | 230,899 | | 16,782 |
Microsoft Corp. | 108,800 | | 3,206 |
Nuance Communications, Inc. (a) | 219,300 | | 4,463 |
| | 24,451 |
TOTAL INFORMATION TECHNOLOGY | | 406,279 |
MATERIALS - 13.9% |
Chemicals - 11.3% |
Dow Chemical Co. | 832,388 | | 23,956 |
H.B. Fuller Co. | 461,829 | | 13,495 |
LyondellBasell Industries NV Class A | 7,208,712 | | 321,002 |
OMNOVA Solutions, Inc. (a)(f) | 3,114,962 | | 22,677 |
Phosphate Holdings, Inc. (a) | 307,500 | | 1,122 |
W.R. Grace & Co. (a) | 480,404 | | 26,922 |
| | 409,174 |
Containers & Packaging - 1.7% |
Rock-Tenn Co. Class A | 733,723 | | 42,717 |
Sealed Air Corp. | 1,091,149 | | 17,677 |
| | 60,394 |
Metals & Mining - 0.6% |
AngloGold Ashanti Ltd. sponsored ADR | 526,100 | | 17,893 |
Common Stocks - continued |
| Shares | | Value (000s) |
MATERIALS - continued |
Metals & Mining - continued |
Ormet Corp. (a) | 330,000 | | $ 891 |
Ormet Corp. (a)(j) | 1,075,000 | | 2,903 |
| | 21,687 |
Paper & Forest Products - 0.3% |
Neenah Paper, Inc. | 418,300 | | 11,236 |
TOTAL MATERIALS | | 502,491 |
TELECOMMUNICATION SERVICES - 0.9% |
Diversified Telecommunication Services - 0.9% |
CenturyLink, Inc. | 771,680 | | 32,056 |
UTILITIES - 5.4% |
Independent Power Producers & Energy Traders - 5.4% |
Calpine Corp. (a) | 2,361,000 | | 40,349 |
The AES Corp. (a) | 12,738,524 | | 153,627 |
| | 193,976 |
TOTAL COMMON STOCKS (Cost $2,963,145) |
3,279,185
|
Nonconvertible Preferred Stocks - 0.4% |
| | | |
CONSUMER STAPLES - 0.1% |
Personal Products - 0.1% |
Revlon, Inc. Series A 12.75% | 639,576 | | 3,562 |
FINANCIALS - 0.3% |
Diversified Financial Services - 0.3% |
GMAC Capital Trust I Series 2, 8.125% | 439,013 | | 10,703 |
TOTAL NONCONVERTIBLE PREFERRED STOCKS (Cost $19,207) |
14,265
|
Nonconvertible Bonds - 0.9% |
| Principal Amount (000s) | | |
CONSUMER DISCRETIONARY - 0.8% |
Automobiles - 0.0% |
General Motors Corp.: | | | | |
6.75% 5/1/28 (d) | | $ 3,075 | | 0 |
Nonconvertible Bonds - continued |
| Principal Amount (000s) | | Value (000s) |
CONSUMER DISCRETIONARY - continued |
Automobiles - continued |
General Motors Corp.: - continued | | | | |
7.125% 7/15/13 (d) | | $ 8,320 | | $ 0 |
7.2% 1/15/11 (d) | | 22,980 | | 0 |
8.25% 7/15/23 (d) | | 25,035 | | 0 |
8.375% 7/15/33 (d) | | 50,210 | | 0 |
8.8% 3/1/21 (d) | | 10,765 | | 0 |
Household Durables - 0.0% |
K. Hovnanian Enterprises, Inc. 8.625% 1/15/17 | | 1,090 | | 861 |
Multiline Retail - 0.8% |
The Bon-Ton Department Stores, Inc. 10.625% 7/15/17 (g) | | 34,820 | | 27,856 |
TOTAL CONSUMER DISCRETIONARY | | 28,717 |
FINANCIALS - 0.1% |
Commercial Banks - 0.1% |
Regions Bank 6.45% 6/26/37 | | 5,430 | | 5,376 |
TOTAL NONCONVERTIBLE BONDS (Cost $32,981) |
34,093
|
Floating Rate Loans - 0.4% |
|
INDUSTRIALS - 0.3% |
Airlines - 0.3% |
US Airways Group, Inc. term loan 2.7462% 3/23/14 (h) | | 10,835 | | 10,402 |
UTILITIES - 0.1% |
Electric Utilities - 0.1% |
Texas Competitive Electric Holdings Co. LLC/Texas Competitive Electric Holdings Finance, Inc. Tranche B, term loan 4.7458% 10/10/17 (h) | | 5,458 | | 3,472 |
TOTAL FLOATING RATE LOANS (Cost $14,544) |
13,874
|
Money Market Funds - 8.7% |
| Shares | | Value (000s) |
Fidelity Cash Central Fund, 0.17% (b) | 269,397,752 | | $ 269,398 |
Fidelity Securities Lending Cash Central Fund, 0.18% (b)(c) | 43,365,490 | | 43,365 |
TOTAL MONEY MARKET FUNDS (Cost $312,763) |
312,763
|
TOTAL INVESTMENT PORTFOLIO - 101.3% (Cost $3,342,640) | 3,654,180 |
NET OTHER ASSETS (LIABILITIES) - (1.3)% | (45,114) |
NET ASSETS - 100% | $ 3,609,066 |
Legend |
(a) Non-income producing |
(b) Affiliated fund that is available only to investment companies and other accounts managed by Fidelity Investments. The rate quoted is the annualized seven-day yield of the fund at period end. A complete unaudited listing of the fund's holdings as of its most recent quarter end is available upon request. In addition, each Fidelity Central Fund's financial statements, which are not covered by the Fund's Report of Independent Registered Public Accounting Firm, are available on the SEC's website or upon request. |
(c) Investment made with cash collateral received from securities on loan. |
(d) Non-income producing - Security is in default. |
(e) Security or a portion of the security is on loan at period end. |
(f) Affiliated company |
(g) Security exempt from registration under Rule 144A of the Securities Act of 1933. These securities may be resold in transactions exempt from registration, normally to qualified institutional buyers. At the end of the period, the value of these securities amounted to $27,856,000 or 0.8% of net assets. |
(h) Coupon rates for floating and adjustable rate securities reflect the rates in effect at period end. |
(i) Investment is owned by an entity that is treated as a corporation for U.S. tax purposes which is owned by the Fund. |
(j) Restricted securities - Investment in securities not registered under the Securities Act of 1933 (excluding 144A issues). At the end of the period, the value of restricted securities (excluding 144A issues) amounted to $2,910,000 or 0.1% of net assets. |
Additional information on each restricted holding is as follows: |
Security | Acquisition Date | Acquisition Cost (000s) |
Ormet Corp. | 2/27/07 - 4/4/07 | $ 20,556 |
Station Holdco LLC warrants 6/15/18 | 10/28/08 - 12/1/08 | $ 5,990 |
Affiliated Central Funds |
Information regarding fiscal year to date income earned by the Fund from investments in Fidelity Central Funds is as follows: |
Fund | Income earned
(Amounts in thousands) |
Fidelity Cash Central Fund | $ 320 |
Fidelity Securities Lending Cash Central Fund | 1,584 |
Total | $ 1,904 |
Other Affiliated Issuers |
An affiliated company is a company in which the Fund has ownership of at least 5% of the voting securities. Fiscal year to date transactions with companies which are or were affiliates are as follows: |
Affiliate
(Amounts in thousands) | Value, beginning of period | Purchases | Sales Proceeds | Dividend Income | Value,
end of
period |
Cenveo, Inc. | $ 21,182 | $ - | $ 9,881 | $ - | $ - |
Exide Technologies | 26,087 | 897 | - | - | 11,516 |
Gray Television, Inc. | 9,152 | - | - | - | 6,327 |
OMNOVA Solutions, Inc. | 18,584 | 1,893 | - | - | 22,677 |
Service Corporation International | 160,784 | 4,160 | 22,896 | 3,090 | 176,344 |
Total | $ 235,789 | $ 6,950 | $ 32,777 | $ 3,090 | $ 216,864 |
Other Information |
The following is a summary of the inputs used, as of July 31, 2012, involving the Fund's assets and liabilities carried at fair value. The inputs or methodology used for valuing securities may not be an indication of the risk associated with investing in those securities. For more information on valuation inputs, and their aggregation into the levels used in the table below, please refer to the Security Valuation section in the accompanying Notes to Financial Statements. |
Valuation Inputs at Reporting Date: |
Description
(Amounts in thousands) | Total | Level 1 | Level 2 | Level 3 |
Investments in Securities: | | | | |
Equities: | | | | |
Consumer Discretionary | $ 745,873 | $ 745,866 | $ - | $ 7 |
Consumer Staples | 99,775 | 96,213 | - | 3,562 |
Energy | 408,670 | 408,670 | - | - |
Financials | 246,328 | 246,328 | - | - |
Health Care | 270,816 | 270,816 | - | - |
Industrials | 387,186 | 387,186 | - | - |
Information Technology | 406,279 | 406,279 | - | - |
Materials | 502,491 | 502,491 | - | - |
Telecommunication Services | 32,056 | 32,056 | - | - |
Utilities | 193,976 | 193,976 | - | - |
Corporate Bonds | 34,093 | - | 34,093 | - |
Floating Rate Loans | 13,874 | - | 13,874 | - |
Money Market Funds | 312,763 | 312,763 | - | - |
Total Investments in Securities: | $ 3,654,180 | $ 3,602,644 | $ 47,967 | $ 3,569 |
Distribution of investments by country or territory of incorporation, as a percentage of total net assets, is as follows. (Unaudited) |
United States of America | 85.7% |
Netherlands | 9.1% |
Switzerland | 1.5% |
Others (Individually Less Than 1%) | 3.7% |
| 100.0% |
See accompanying notes which are an integral part of the financial statements.
Annual Report
Statement of Assets and Liabilities
Amounts in thousands (except per-share amounts) | July 31, 2012 |
| | |
Assets | | |
Investment in securities, at value (including securities loaned of $42,040) - See accompanying schedule: Unaffiliated issuers (cost $2,850,762) | $ 3,124,553 | |
Fidelity Central Funds (cost $312,763) | 312,763 | |
Other affiliated issuers (cost $179,115) | 216,864 | |
Total Investments (cost $3,342,640) | | $ 3,654,180 |
Receivable for investments sold | | 3,306 |
Receivable for fund shares sold | | 1,879 |
Dividends receivable | | 426 |
Interest receivable | | 287 |
Distributions receivable from Fidelity Central Funds | | 127 |
Other receivables | | 68 |
Total assets | | 3,660,273 |
| | |
Liabilities | | |
Payable for fund shares redeemed | $ 5,325 | |
Accrued management fee | 1,836 | |
Other affiliated payables | 624 | |
Other payables and accrued expenses | 57 | |
Collateral on securities loaned, at value | 43,365 | |
Total liabilities | | 51,207 |
| | |
Net Assets | | $ 3,609,066 |
Net Assets consist of: | | |
Paid in capital | | $ 3,894,684 |
Distributions in excess of net investment income | | (18,505) |
Accumulated undistributed net realized gain (loss) on investments and foreign currency transactions | | (578,653) |
Net unrealized appreciation (depreciation) on investments | | 311,540 |
Net Assets | | $ 3,609,066 |
Leveraged Company Stock:
Net Asset Value, offering price and redemption price per share ($3,008,796 ÷ 106,617 shares) | | $ 28.22 |
| | |
Class K:
Net Asset Value, offering price and redemption price per share ($600,270 ÷ 21,243 shares) | | $ 28.26 |
See accompanying notes which are an integral part of the financial statements.
Annual Report
Statement of Operations
Amounts in thousands | Year ended July 31, 2012 |
| | |
Investment Income | | |
Dividends (including $3,090 earned from other affiliated issuers) | | $ 47,272 |
Interest | | 4,214 |
Income from Fidelity Central Funds | | 1,904 |
Total income | | 53,390 |
| | |
Expenses | | |
Management fee | $ 22,473 | |
Transfer agent fees | 6,943 | |
Accounting and security lending fees | 1,036 | |
Custodian fees and expenses | 45 | |
Independent trustees' compensation | 25 | |
Registration fees | 83 | |
Audit | 61 | |
Legal | 18 | |
Miscellaneous | 43 | |
Total expenses before reductions | 30,727 | |
Expense reductions | (256) | 30,471 |
Net investment income (loss) | | 22,919 |
Realized and Unrealized Gain (Loss) Net realized gain (loss) on: | | |
Investment securities: | | |
Unaffiliated issuers | 189,996 | |
Other affiliated issuers | (26,964) | |
Foreign currency transactions | (17) | |
Total net realized gain (loss) | | 163,015 |
Change in net unrealized appreciation (depreciation) on: Investment securities | (307,253) | |
Assets and liabilities in foreign currencies | (2) | |
Total change in net unrealized appreciation (depreciation) | | (307,255) |
Net gain (loss) | | (144,240) |
Net increase (decrease) in net assets resulting from operations | | $ (121,321) |
See accompanying notes which are an integral part of the financial statements.
Annual Report
Financial Statements - continued
Statement of Changes in Net Assets
Amounts in thousands | Year ended
July 31,
2012 | Year ended
July 31,
2011 |
Increase (Decrease) in Net Assets | | |
Operations | | |
Net investment income (loss) | $ 22,919 | $ 691 |
Net realized gain (loss) | 163,015 | 265,176 |
Change in net unrealized appreciation (depreciation) | (307,255) | 656,096 |
Net increase (decrease) in net assets resulting
from operations | (121,321) | 921,963 |
Distributions to shareholders from net investment income | (41,206) | (19,058) |
Share transactions - net increase (decrease) | (714,976) | (810,250) |
Redemption fees | 410 | 558 |
Total increase (decrease) in net assets | (877,093) | 93,213 |
| | |
Net Assets | | |
Beginning of period | 4,486,159 | 4,392,946 |
End of period (including distributions in excess of net investment income of $18,505 and distributions in excess of net investment income of $1,080, respectively) | $ 3,609,066 | $ 4,486,159 |
See accompanying notes which are an integral part of the financial statements.
Annual Report
Financial Highlights - Leveraged Company Stock
Years ended July 31, | 2012 | 2011 | 2010 | 2009 | 2008 |
Selected Per-Share Data | | | | | |
Net asset value, beginning of period | $ 28.85 | $ 23.50 | $ 19.55 | $ 31.09 | $ 33.78 |
Income from Investment Operations | | | | | |
Net investment income (loss) B | .16 | -G | .07 | .21 | .14 |
Net realized and unrealized gain (loss) | (.50) | 5.46 | 3.99 | (11.37) | (1.06) |
Total from investment operations | (.34) | 5.46 | 4.06 | (11.16) | (.92) |
Distributions from net investment income | (.29) | (.11) | (.11) | (.14) | (.39) |
Distributions from net realized gain | - | - | - | (.25) | (1.39) |
Total distributions | (.29) | (.11) | (.11) | (.39) | (1.78) |
Redemption fees added to paid in capital B | -G | - G | - G | .01 | .01 |
Net asset value, end of period | $ 28.22 | $ 28.85 | $ 23.50 | $ 19.55 | $ 31.09 |
Total Return A | (1.05)% | 23.27% | 20.84% | (35.99)% | (2.76)% |
Ratios to Average Net Assets C,F | | | | | |
Expenses before reductions | .86% | .85% | .88% | .92% | .83% |
Expenses net of fee waivers, if any | .86% | .85% | .88% | .92% | .83% |
Expenses net of all reductions | .85% | .84% | .88% | .92% | .83% |
Net investment income (loss) | .60% | -% E | .29% | 1.17% | .44% |
Supplemental Data | | | | | |
Net assets, end of period (in millions) | $ 3,009 | $ 3,931 | $ 3,983 | $ 3,714 | $ 8,032 |
Portfolio turnover rate D | 29% | 18% | 21% | 34% | 30% |
A Total returns would have been lower if certain expenses had not been reduced during the applicable periods shown.
B Calculated based on average shares outstanding during the period.
C Fees and expenses of any underlying Fidelity Central Funds are not included in the Fund's expense ratio. The Fund indirectly bears its proportionate share of the expenses of any underlying Fidelity Central Funds.
D Amount does not include the portfolio activity of any underlying Fidelity Central Funds.
E Amount represents less than .01%.
F Expense ratios reflect operating expenses of the class. Expenses before reductions do not reflect amounts reimbursed by the investment adviser or reductions from brokerage service arrangements or reductions from other expense offset arrangements and do not represent the amount paid by the class during periods when reimbursements or reductions occur. Expenses net of fee waivers reflect expenses after reimbursement by the investment adviser but prior to reductions from brokerage service arrangements or other expense offset arrangements. Expenses net of all reductions represent the net expenses paid by the class.
G Amount represents less than $.01 per share.
See accompanying notes which are an integral part of the financial statements.
Annual Report
Financial Highlights - Class K
Years ended July 31, | 2012 | 2011 | 2010 | 2009 | 2008 G |
Selected Per-Share Data | | | | | |
Net asset value, beginning of period | $ 28.86 | $ 23.52 | $ 19.56 | $ 31.11 | $ 34.10 |
Income from Investment Operations | | | | | |
Net investment income (loss) D | .20 | .04 | .11 | .21 | .05 |
Net realized and unrealized gain (loss) | (.49) | 5.45 | 4.00 | (11.35) | (3.04) |
Total from investment operations | (.29) | 5.49 | 4.11 | (11.14) | (2.99) |
Distributions from net investment income | (.31) | (.15) | (.15) | (.17) | - |
Distributions from net realized gain | - | - | - | (.25) | - |
Total distributions | (.31) | (.15) | (.15) | (.42) | - |
Redemption fees added to paid in capital D | - I | - I | - I | .01 | - I |
Net asset value, end of period | $ 28.26 | $ 28.86 | $ 23.52 | $ 19.56 | $ 31.11 |
Total Return B,C | (.87)% | 23.45% | 21.09% | (35.86)% | (8.77)% |
Ratios to Average Net Assets E,H | | | | | |
Expenses before reductions | .69% | .69% | .70% | .71% | .70% A |
Expenses net of fee waivers, if any | .69% | .69% | .70% | .71% | .70% A |
Expenses net of all reductions | .69% | .69% | .69% | .71% | .70% A |
Net investment income (loss) | .76% | .16% | .47% | 1.39% | .58% A |
Supplemental Data | | | | | |
Net assets, end of period
(000 omitted) | $ 600,270 | $ 554,907 | $ 409,934 | $ 267,351 | $ 91 |
Portfolio turnover rate F | 29% | 18% | 21% | 34% | 30% |
A Annualized
B Total returns for periods of less than one year are not annualized.
C Total returns would have been lower if certain expenses had not been reduced during the applicable periods shown.
D Calculated based on average shares outstanding during the period.
E Fees and expenses of any underlying Fidelity Central Funds are not included in the Fund's expense ratio. The Fund indirectly bears its proportionate share of the expenses of any underlying Fidelity Central Funds.
F Amount does not include the portfolio activity of any underlying Fidelity Central Funds.
G For the period May 9, 2008 (commencement of sale of shares) to July 31, 2008.
H Expense ratios reflect operating expenses of the class. Expenses before reductions do not reflect amounts reimbursed by the investment adviser or reductions from brokerage service arrangements or reductions from other expense offset arrangements and do not represent the amount paid by the class during periods when reimbursements or reductions occur. Expense ratios before reductions for start-up periods may not be representative of longer-term operating periods. Expenses net of fee waivers reflect expenses after reimbursement by the investment adviser but prior to reductions from brokerage service arrangements or other expense offset arrangements. Expenses net of all reductions represent the net expenses paid by the class.
I Amount represents less than $.01 per share.
See accompanying notes which are an integral part of the financial statements.
Annual Report
Notes to Financial Statements
For the period ended July 31, 2012
(Amounts in thousands except percentages)
1. Organization.
Fidelity Leveraged Company Stock Fund (the Fund) is a fund of Fidelity Securities Fund (the Trust) and is authorized to issue an unlimited number of shares. The Trust is registered under the Investment Company Act of 1940, as amended (the 1940 Act), as an open-end management investment company organized as a Massachusetts business trust. The Fund offers Leveraged Company Stock and Class K, each of which has equal rights as to assets and voting privileges. Each class has exclusive voting rights with respect to matters that affect that class. Investment income, realized and unrealized capital gains and losses, the common expenses of the Fund, and certain fund-level expense reductions, if any, are allocated on a pro-rata basis to each class based on the relative net assets of each class to the total net assets of the Fund. Each class differs with respect to transfer agent fees incurred. Certain expense reductions may also differ by class.
2. Investments in Fidelity Central Funds.
The Fund invests in Fidelity Central Funds, which are open-end investment companies available only to other investment companies and accounts managed by Fidelity Management & Research Company (FMR) and its affiliates. The Fund's Schedule of Investments lists each of the Fidelity Central Funds held as of period end, if any, as an investment of the Fund, but does not include the underlying holdings of each Fidelity Central Fund. As an Investing Fund, the Fund indirectly bears its proportionate share of the expenses of the underlying Fidelity Central Funds.
The Money Market Central Funds seek preservation of capital and current income and are managed by Fidelity Investments Money Management, Inc. (FIMM), an affiliate of FMR.
A complete unaudited list of holdings for each Fidelity Central Fund is available upon request or at the Securities and Exchange Commission (the SEC) web site at www.sec.gov. In addition, the financial statements of the Fidelity Central Funds, which are not covered by the Fund's Report of Independent Registered Public Accounting Firm, are available on the SEC web site or upon request.
3. Significant Accounting Policies.
The financial statements have been prepared in conformity with accounting principles generally accepted in the United States of America (GAAP), which require management to make certain estimates and assumptions at the date of the financial statements. Actual results could differ from those estimates. Subsequent events, if any, through the date that the financial statements were issued have been evaluated in the preparation of the financial statements. The following summarizes the significant accounting policies of the Fund:
Annual Report
Notes to Financial Statements - continued
(Amounts in thousands except percentages)
3. Significant Accounting Policies - continued
Security Valuation. Investments are valued as of 4:00 p.m. Eastern time on the last calendar day of the period. In accordance with valuation policies and procedures approved by the Board of Trustees (the Board), the Fund attempts to obtain prices from one or more third party pricing vendor or broker to value its investments. When current market prices, quotations or rates are not readily available or reliable, securities will be fair valued in good faith by the FMR Fair Value Committee (the Committee), in accordance with procedures adopted by the Fund's Board. Factors used in determining fair value vary by security type and may include market or security specific events, changes in interest rates and credit quality. The frequency with which these procedures are used cannot be predicted and they may be utilized to a significant extent. The Committee oversees the Fund's valuation policies and procedures and is responsible for approving and reporting to the Board all fair value determinations.
The Fund categorizes the inputs to valuation techniques used to value its investments into a disclosure hierarchy consisting of three levels as shown below:
Level 1 - quoted prices in active markets for identical investments
Level 2 - other significant observable inputs (including quoted prices for similar investments, interest rates, prepayment speeds, etc.)
Level 3 - unobservable inputs (including the Fund's own assumptions based on the best information available)
Valuation techniques used to value the Fund's investments by major category are as follows:
Equity securities, including restricted securities, for which market quotations are readily available, are valued at the last reported sale price or official closing price as reported by a third party pricing vendor on the primary market or exchange on which they are traded and are categorized as Level 1 in the hierarchy. In the event there were no sales during the day or closing prices are not available, securities are valued at the last quoted bid price or may be valued using the last available price and are generally categorized as Level 2 in the hierarchy. For foreign equity securities, when significant market or security specific events arise, comparisons to the valuation of American Depositary Receipts (ADRs), futures contracts, Exchange-Traded Funds (ETFs)and certain indexes as well as quoted prices for similar securities are used and are categorized as Level 2 in the hierarchy. Utilizing these techniques may result in transfers between Level 1 and Level 2. For restricted equity securities and private placements where observable inputs are limited, assumptions about market activity and risk are used and these securities are categorized as Level 3 in the hierarchy.
Annual Report
3. Significant Accounting Policies - continued
Security Valuation - continued
Debt securities, including restricted securities, are valued based on evaluated prices received from third party pricing vendors or from brokers who make markets in such securities. For corporate bonds and floating rate loans, pricing vendors utilize matrix pricing which considers yield or price of bonds of comparable quality, coupon, maturity and type as well as broker-supplied prices and are generally categorized as Level 2 in the hierarchy. When independent prices are unavailable or unreliable, debt securities may be valued utilizing pricing methodologies which consider similar factors that would be used by third party pricing vendors. These are generally categorized as Level 2 in the hierarchy but may be Level 3 depending on the circumstances.
Investments in open-end mutual funds, including the Fidelity Central Funds, are valued at their closing net asset value each business day and are categorized as Level 1 in the hierarchy.
Changes in valuation techniques may result in transfers in or out of an assigned level within the disclosure hierarchy. The aggregate value of investments by input level, as of July 31, 2012, is included at the end of the Fund's Schedule of Investments.
Foreign Currency Translation. The Fund may use foreign currency contracts to facilitate transactions in foreign-denominated securities. Gains and losses from these transactions may arise from changes in the value of the foreign currency or if the counterparties do not perform under the contracts' terms.
Foreign-denominated assets, including investment securities, and liabilities are translated into U.S. dollars at the exchange rates at period end. Purchases and sales of investment securities, income and dividends received and expenses denominated in foreign currencies are translated into U.S. dollars at the exchange rate in effect on the transaction date.
The effects of exchange rate fluctuations on investments are included with the net realized and unrealized gain (loss) on investment securities. Other foreign currency transactions resulting in realized and unrealized gain (loss) are disclosed separately.
Investment Transactions and Income. For financial reporting purposes, the Fund's investment holdings and NAV include trades executed through the end of the last business day of the period. The NAV per share for processing shareholder transactions is calculated as of the close of business of the New York Stock Exchange (NYSE), normally 4:00 p.m. Eastern time and includes trades executed through the end of the prior business day. Gains and losses on securities sold are determined on the basis of identified cost and may include proceeds received from litigation. Dividend income is recorded on the ex-dividend date, except for certain dividends from foreign securities where the
Annual Report
Notes to Financial Statements - continued
(Amounts in thousands except percentages)
3. Significant Accounting Policies - continued
Investment Transactions and Income - continued
ex-dividend date may have passed, which are recorded as soon as the Fund is informed of the ex-dividend date. Non-cash dividends included in dividend income, if any, are recorded at the fair market value of the securities received. Distributions received on securities that represent a return of capital or capital gain are recorded as a reduction of cost of investments and/or as a realized gain. The Fund estimates the components of distributions received that may be considered return of capital distributions or capital gain distributions. Interest income and distributions from the Fidelity Central Funds are accrued as earned. Interest income includes coupon interest and amortization of premium and accretion of discount on debt securities. Investment income is recorded net of foreign taxes withheld where recovery of such taxes is uncertain. Debt obligations may be placed on non-accrual status and related interest income may be reduced by ceasing current accruals and writing off interest receivables when the collection of all or a portion of interest has become doubtful based on consistently applied procedures. A debt obligation is removed from non-accrual status when the issuer resumes interest payments or when collectability of interest is reasonably assured.
Expenses. Expenses directly attributable to a fund are charged to that fund. Expenses attributable to more than one fund are allocated among the respective funds on the basis of relative net assets or other appropriate methods. Expense estimates are accrued in the period to which they relate and adjustments are made when actual amounts are known.
Income Tax Information and Distributions to Shareholders. Each year, the Fund intends to qualify as a regulated investment company under Subchapter M of the Internal Revenue Code, including distributing substantially all of its taxable income and realized gains. As a result, no provision for income taxes is required. As of July 31, 2012, the Fund did not have any unrecognized tax benefits in the financial statements; nor is the Fund aware of any tax positions for which it is reasonably possible that the total amounts of unrecognized tax benefits will significantly change in the next twelve months. The Fund files a U.S. federal tax return, in addition to state and local tax returns as required. A fund's federal income tax returns are subject to examination by the Internal Revenue Service (IRS) for a period of three fiscal years after they are filed. State and local tax returns may be subject to examination for an additional fiscal year depending on the jurisdiction. Foreign taxes are provided for based on the Fund's understanding of the tax rules and rates that exist in the foreign markets in which it invests.
Distributions are declared and recorded on the ex-dividend date. Income dividends and capital gain distributions are declared separately for each class. Income and capital gain distributions are determined in accordance with income tax regulations, which may differ from GAAP.
Annual Report
3. Significant Accounting Policies - continued
Income Tax Information and Distributions to Shareholders - continued
Capital accounts within the financial statements are adjusted for permanent book-tax differences. These adjustments have no impact on net assets or the results of operations. Temporary book-tax differences will reverse in a subsequent period.
Book-tax differences are primarily due to foreign currency transactions, market discount, equity-debt classifications, non-taxable dividends, capital loss carryforwards, losses deferred due to wash sales and excise tax regulations.
The federal tax cost of investment securities and unrealized appreciation (depreciation) as of period end were as follows:
Gross unrealized appreciation | $ 744,010 |
Gross unrealized depreciation | (431,980) |
Net unrealized appreciation (depreciation) on securities and other investments | $ 312,030 |
| |
Tax Cost | $ 3,342,150 |
The tax-based components of distributable earnings as of period end were as follows:
Capital loss carryforward | $ (578,439) |
Net unrealized appreciation (depreciation) | $ 312,030 |
Capital loss carryforwards are only available to offset future capital gains of the Fund to the extent provided by regulations and may be limited. Under the Regulated Investment Company Modernization Act of 2010 (the Act), the Fund is permitted to carry forward capital losses incurred in taxable years beginning after December 22, 2010 for an unlimited period and such capital losses are required to be used prior to any losses that expire. Capital loss carryforwards were as follows:
Fiscal year of expiration | |
2018 | $ (578,439) |
The tax character of distributions paid was as follows:
| July 31, 2012 | July 31, 2011 |
Ordinary Income | $ 41,206 | $ 19,058 |
Short-Term Trading (Redemption) Fees. Shares held by investors in the Fund less than 90 days are subject to a redemption fee equal to 1.50% of the net asset value of shares redeemed. All redemption fees, which reduce the proceeds of the shareholder redemption, are retained by the Fund and accounted for as an addition to paid in capital.
Annual Report
Notes to Financial Statements - continued
(Amounts in thousands except percentages)
3. Significant Accounting Policies - continued
New Accounting Pronouncement. In December 2011, the Financial Accounting Standards Board issued Accounting Standard Update No. 2011-11, Disclosures about Offsetting Assets and Liabilities. The update creates new disclosure requirements requiring entities to disclose both gross and net information for derivatives and other financial instruments that are either offset in the Statement of Assets and Liabilities or subject to an enforceable master netting arrangement or similar agreement. The disclosure requirements are effective for interim and annual reporting periods beginning on or after January 1, 2013. Management is currently evaluating the impact of the update's adoption on the Fund's financial statement disclosures.
4. Operating Policies.
Restricted Securities. The Fund may invest in securities that are subject to legal or contractual restrictions on resale. These securities generally may be resold in transactions exempt from registration or to the public if the securities are registered. Disposal of these securities may involve time-consuming negotiations and expense, and prompt sale at an acceptable price may be difficult. Information regarding restricted securities is included at the end of the Fund's Schedule of Investments.
Loans and Other Direct Debt Instruments. The Fund invests in direct debt instruments which are interests in amounts owed to lenders by corporate or other borrowers. These instruments may be in the form of loans, trade claims or other receivables and may include standby financing commitments such as revolving credit facilities that obligate the Fund to supply additional cash to the borrower on demand. Loans may be acquired through assignment or participation, or may be made directly to a borrower. The Fund may be contractually obligated to receive approval from the agent bank and/or borrower prior to the sale of these loans.
5. Purchases and Sales of Investments.
Purchases and sales of securities, other than short-term securities, aggregated $1,027,974 and $1,844,527, respectively.
6. Fees and Other Transactions with Affiliates.
Management Fee. FMR and its affiliates provide the Fund with investment management related services for which the Fund pays a monthly management fee. The management fee is the sum of an individual fund fee rate that is based on an annual rate of .35% of the Fund's average net assets and an annualized group fee rate that averaged .26% during the period. The group fee rate is based upon the average net assets of all the mutual funds advised by FMR. The group fee rate decreases as assets under management increase and increases as assets under management decrease. For the period, the total annual management fee rate was .61% of the Fund's average net assets.
Annual Report
6. Fees and Other Transactions with Affiliates - continued
Transfer Agent Fees. Fidelity Investments Institutional Operations Company, Inc. (FIIOC), an affiliate of FMR, is the transfer, dividend disbursing and shareholder servicing agent for each class of the Fund. FIIOC receives account fees and asset-based fees that vary according to the account size and type of account of the shareholders of Leveraged Company Stock. FIIOC receives an asset-based fee of Class K's average net assets. FIIOC pays for typesetting, printing and mailing of shareholder reports, except proxy statements. For the period, transfer agent fees for each class were as follows:
| Amount | % of
Average
Net Assets |
Leveraged Company Stock | $ 6,665 | .21 |
Class K | 278 | .05 |
| $ 6,943 | |
Accounting and Security Lending Fees. Fidelity Service Company, Inc. (FSC), an affiliate of FMR, maintains the Fund's accounting records. The accounting fee is based on the level of average net assets for each month. Under a separate contract, FSC administers the security lending program. The security lending fee is based on the number and duration of lending transactions.
Brokerage Commissions. The Fund placed a portion of its portfolio transactions with brokerage firms which are affiliates of the investment adviser. The commissions paid to these affiliated firms were $77 for the period.
7. Committed Line of Credit.
The Fund participates with other funds managed by FMR or an affiliate in a $4.25 billion credit facility (the "line of credit") to be utilized for temporary or emergency purposes to fund shareholder redemptions or for other short-term liquidity purposes. The Fund has agreed to pay commitment fees on its pro-rata portion of the line of credit, which amounted to $11 and is reflected in Miscellaneous expenses on the Statement of Operations. During the period, there were no borrowings on this line of credit.
8. Security Lending.
The Fund lends portfolio securities through a lending agent from time to time in order to earn additional income. For equity securities, a lending agent is used and may loan securities to certain qualified borrowers, including Fidelity Capital Markets (FCM), a broker-dealer affiliated with the Fund. On the settlement date of the loan, the Fund receives collateral (in the form of U.S. Treasury obligations, letters of credit and/or cash) against the loaned securities and maintains collateral in an amount not less than 100% of
Annual Report
Notes to Financial Statements - continued
(Amounts in thousands except percentages)
8. Security Lending - continued
the market value of the loaned securities during the period of the loan. The market value of the loaned securities is determined at the close of business of the Fund and any additional required collateral is delivered to the Fund on the next business day. If the borrower defaults on its obligation to return the securities loaned because of insolvency or other reasons, a fund could experience delays and costs in recovering the securities loaned or in gaining access to the collateral. Any cash collateral received is invested in the Fidelity Securities Lending Cash Central Fund. The value of loaned securities and cash collateral at period end are disclosed on the Fund's Statement of Assets and Liabilities. The value of securities loaned to FCM at period end was $788. Security lending income represents the income earned on investing cash collateral, less rebates paid to borrowers and any lending agent fees associated with the loan, plus any premium payments received for lending certain types of securities. Security lending income is presented in the Statement of Operations as a component of income from Fidelity Central Funds. Total security lending income during the period amounted to $1,584, including $37 from securities loaned to FCM.
9. Expense Reductions.
Many of the brokers with whom FMR places trades on behalf of the Fund provided services to the Fund in addition to trade execution. These services included payments of certain expenses on behalf of the Fund totaling $256 for the period.
10. Distributions to Shareholders.
Distributions to shareholders of each class were as follows:
Years ended July 31, | 2012 | 2011 |
From net investment income | | |
Leveraged Company Stock | $ 35,167 | $ 16,431 |
Class K | 6,039 | 2,627 |
Total | $ 41,206 | $ 19,058 |
Annual Report
11. Share Transactions.
Transactions for each class of shares were as follows:
| Shares | Dollars |
Years ended July 31, | 2012 | 2011 | 2012 | 2011 |
Leveraged Company Stock | | | | |
Shares sold | 11,853 | 21,818 | $ 318,644 | $ 623,715 |
Reinvestment of distributions | 1,333 | 608 | 33,481 | 15,688 |
Shares redeemed | (42,830) | (55,621) | (1,123,666) | (1,504,254) |
Net increase (decrease) | (29,644) | (33,195) | $ (771,541) | $ (864,851) |
Class K | | | | |
Shares sold | 9,320 | 7,678 | $ 250,995 | $ 217,275 |
Reinvestment of distributions | 240 | 103 | 6,039 | 2,627 |
Shares redeemed | (7,542) | (5,983) | (200,469) | (165,301) |
Net increase (decrease) | 2,018 | 1,798 | $ 56,565 | $ 54,601 |
12. Other.
The Fund's organizational documents provide former and current trustees and officers with a limited indemnification against liabilities arising in connection with the performance of their duties to the Fund. In the normal course of business, the Fund may also enter into contracts that provide general indemnifications. The Fund's maximum exposure under these arrangements is unknown as this would be dependent on future claims that may be made against the Fund. The risk of material loss from such claims is considered remote.
Annual Report
To the Trustees of Fidelity Securities Fund and the Shareholders of Fidelity Leveraged Company Stock Fund:
In our opinion, the accompanying statement of assets and liabilities, including the schedule of investments, and the related statements of operations and of changes in net assets and the financial highlights present fairly, in all material respects, the financial position of Fidelity Leveraged Company Stock Fund (a fund of Fidelity Securities Fund) at July 31, 2012, the results of its operations for the year then ended, the changes in its net assets for each of the two years in the period then ended and the financial highlights for each of the periods indicated, in conformity with accounting principles generally accepted in the United States of America. These financial statements and financial highlights (hereafter referred to as "financial statements") are the responsibility of the Fidelity Leveraged Company Stock Fund's management. Our responsibility is to express an opinion on these financial statements based on our audits. We conducted our audits of these financial statements in accordance with the standards of the Public Company Accounting Oversight Board (United States). Those standards require that we plan and perform the audit to obtain reasonable assurance about whether the financial statements are free of material misstatement. An audit includes examining, on a test basis, evidence supporting the amounts and disclosures in the financial statements, assessing the accounting principles used and significant estimates made by management, and evaluating the overall financial statement presentation. We believe that our audits, which included confirmation of securities at July 31, 2012 by correspondence with the custodian, brokers, and agent banks, provide a reasonable basis for our opinion.
PricewaterhouseCoopers LLP
Boston, Massachusetts
September 17, 2012
Annual Report
The Trustees, Members of the Advisory Board, and executive officers of the trust and fund, as applicable, are listed below. The Board of Trustees governs the fund and is responsible for protecting the interests of shareholders. The Trustees are experienced executives who meet periodically throughout the year to oversee the fund's activities, review contractual arrangements with companies that provide services to the fund, oversee management of the risks associated with such activities and contractual arrangements, and review the fund's performance. Except for James C. Curvey, each of the Trustees oversees 228 funds advised by FMR or an affiliate. Mr. Curvey oversees 435 funds advised by FMR or an affiliate.
The Trustees hold office without limit in time except that (a) any Trustee may resign; (b) any Trustee may be removed by written instrument, signed by at least two-thirds of the number of Trustees prior to such removal; (c) any Trustee who requests to be retired or who has become incapacitated by illness or injury may be retired by written instrument signed by a majority of the other Trustees; and (d) any Trustee may be removed at any special meeting of shareholders by a two-thirds vote of the outstanding voting securities of the trust. Each Trustee who is not an interested person (as defined in the 1940 Act) (Independent Trustee), shall retire not later than the last day of the calendar year in which his or her 75th birthday occurs. The Independent Trustees may waive this mandatory retirement age policy with respect to individual Trustees. The executive officers and Advisory Board Members hold office without limit in time, except that any officer and Advisory Board Member may resign or may be removed by a vote of a majority of the Trustees at any regular meeting or any special meeting of the Trustees. Except as indicated, each individual has held the office shown or other offices in the same company for the past five years.
Experience, Skills, Attributes, and Qualifications of the Fund's Trustees. The Governance and Nominating Committee has adopted a statement of policy that describes the experience, qualifications, attributes, and skills that are necessary and desirable for potential Independent Trustee candidates (Statement of Policy). The Board believes that each Trustee satisfied at the time he or she was initially elected or appointed a Trustee, and continues to satisfy, the standards contemplated by the Statement of Policy. The Governance and Nominating Committee also engages professional search firms to help identify potential Independent Trustee candidates who have the experience, qualifications, attributes, and skills consistent with the Statement of Policy. From time to time, additional criteria based on the composition and skills of the current Independent Trustees, as well as experience or skills that may be appropriate in light of future changes to board composition, business conditions, and regulatory or other developments, have also been considered by the professional search firms and the Governance and Nominating Committee. In addition, the Board takes into account the Trustees' commitment and participation in Board and committee meetings, as well as their leadership of standing and ad hoc committees throughout their tenure.
In determining that a particular Trustee was and continues to be qualified to serve as a Trustee, the Board has considered a variety of criteria, none of which, in isolation, was controlling. The Board believes that, collectively, the Trustees have balanced and diverse experience, qualifications, attributes, and skills, which allow the Board to operate effectively in governing the fund and protecting the interests of shareholders. Information about the specific experience, skills, attributes, and qualifications of each Trustee, which in each case led to the Board's conclusion that the Trustee should serve (or continue to serve) as a trustee of the fund, is provided below.
Annual Report
Board Structure and Oversight Function. James C. Curvey is an interested person (as defined in the 1940 Act) and currently serves as Chairman. The Trustees have determined that an interested Chairman is appropriate and benefits shareholders because an interested Chairman has a personal and professional stake in the quality and continuity of services provided to the fund. Independent Trustees exercise their informed business judgment to appoint an individual of their choosing to serve as Chairman, regardless of whether the Trustee happens to be independent or a member of management. The Independent Trustees have determined that they can act independently and effectively without having an Independent Trustee serve as Chairman and that a key structural component for assuring that they are in a position to do so is for the Independent Trustees to constitute a substantial majority for the Board. The Independent Trustees also regularly meet in executive session. Ned C. Lautenbach serves as Chairman of the Independent Trustees and as such (i) acts as a liaison between the Independent Trustees and management with respect to matters important to the Independent Trustees and (ii) with management prepares agendas for Board meetings.
Fidelity funds are overseen by different Boards of Trustees. The fund's Board oversees Fidelity's equity and high income funds and another Board oversees Fidelity's investment-grade bond, money market, and asset allocation funds. The asset allocation funds may invest in Fidelity funds overseen by the fund's Board. The use of separate Boards, each with its own committee structure, allows the Trustees of each group of Fidelity funds to focus on the unique issues of the funds they oversee, including common research, investment, and operational issues. On occasion, the separate Boards establish joint committees to address issues of overlapping consequences for the Fidelity funds overseen by each Board.
The Trustees operate using a system of committees to facilitate the timely and efficient consideration of all matters of importance to the Trustees, the fund, and fund shareholders and to facilitate compliance with legal and regulatory requirements and oversight of the fund's activities and associated risks. The Board, acting through its committees, has charged FMR and its affiliates with (i) identifying events or circumstances the occurrence of which could have demonstrably adverse effects on the fund's business and/or reputation; (ii) implementing processes and controls to lessen the possibility that such events or circumstances occur or to mitigate the effects of such events or circumstances if they do occur; and (iii) creating and maintaining a system designed to evaluate continuously business and market conditions in order to facilitate the identification and implementation processes described in (i) and (ii) above. Because the day-to-day operations and activities of the fund are carried out by or through FMR, its affiliates and other service providers, the fund's exposure to risks is mitigated but not eliminated by the processes overseen by the Trustees. While each of the Board's committees has responsibility for overseeing different aspects of the fund's activities, oversight is exercised primarily through the Operations, Audit, and Compliance Committees. In addition, the Independent Trustees have worked with FMR to enhance the Board's oversight of investment and financial risks, legal and regulatory risks, technology risks, and operational risks, including the development of additional risk reporting to the Board. For example, a working group comprised of Independent Trustees and FMR has worked and continues to work to review the Fidelity funds' valuation-related activities, reporting and risk management. Appropriate personnel, including but not limited to the fund's Chief Compliance Officer (CCO), FMR's internal auditor, the independent accountants, the fund's Treasurer and portfolio management personnel, make periodic reports to the Board's committees, as appropriate, including an annual review of FMR's risk management program for the Fidelity funds. The responsibilities of each standing committee, including their oversight responsibilities, are described further under "Standing Committees of the Fund's Trustees."
Annual Report
Trustees and Officers - continued
The fund's Statement of Additional Information (SAI) includes more information about the Trustees. To request a free copy, call Fidelity at 1-800-544-8544.
Interested Trustees*:
Correspondence intended for each Trustee who is an interested person may be sent to Fidelity Investments, 82 Devonshire Street, Boston, Massachusetts 02109.
Name, Age; Principal Occupations and Other Relevant Experience+ |
James C. Curvey (77) |
| Year of Election or Appointment: 2007 Mr. Curvey is Trustee and Chairman of the Board of Trustees of certain Trusts. Mr. Curvey also serves as Trustee (2007-present) of other investment companies advised by FMR. Mr. Curvey is a Director of Fidelity Investments Money Management, Inc. (2009-present), Director of Fidelity Research & Analysis Co. (2009-present) and Director of FMR and FMR Co., Inc. (2007-present). Mr. Curvey is also Vice Chairman (2007-present) and Director of FMR LLC. In addition, Mr. Curvey serves as an Overseer for the Boston Symphony Orchestra and a member of the Trustees of Villanova University. Previously, Mr. Curvey was the Vice Chairman (2006-2007) and Director (2000-2007) of FMR Corp. |
Ronald P. O'Hanley (55) |
| Year of Election or Appointment: 2011 Mr. O'Hanley is Director of FMR Co., Inc. (2010-present), Director of Fidelity Investments Money Management, Inc. (2010-present), Director of Fidelity Research & Analysis Company (2010-present), President of Fidelity Asset Management and Corporate Services and a member of Fidelity's Executive Committee (2010-present). Previously, Mr. O'Hanley served as President and Chief Executive Officer of BNY Mellon Asset Management (2007-2010). Mr. O'Hanley also served as Vice Chairman of Bank New York Mellon Corp. and a member of that firm's Executive Committee. Prior to the 2007 merger of The Bank of New York and Mellon Financial Corporation, he was Vice Chairman of Mellon Financial Corporation and President and Chief Executive Officer of Mellon Asset Management. He joined Mellon in February 1997. Mr. O'Hanley currently serves as Chairman of the Boston Public Library Foundation Board of Directors and sits on the Board of Directors of Beth Israel Deaconess Medical Center, the Board of Trustees of the Marine Biological Laboratory and the Advisory Board of the Maxwell School of Citizenship and Public Administration at Syracuse University. Mr. O'Hanley also chairs the Council on Asset Management for the Financial Services Roundtable and is a member of the Board of Directors of Institutional Investor's U.S. Institute. |
* Trustees have been determined to be "Interested Trustees" by virtue of, among other things, their affiliation with the trust or various entities under common control with FMR.
+ The information above includes each Trustee's principal occupation during the last five years and other information relating to the experience, attributes, and skills relevant to each Trustee's qualifications to serve as a Trustee, which led to the conclusion that each Trustee should serve as a Trustee for the fund.
Annual Report
Trustees and Officers - continued
Independent Trustees:
Correspondence intended for each Independent Trustee (that is, the Trustees other than the Interested Trustees) may be sent to Fidelity Investments, P.O. Box 55235, Boston, Massachusetts 02205-5235.
Name, Age; Principal Occupations and Other Relevant Experience+ |
Dennis J. Dirks (64) |
| Year of Election or Appointment: 2005 Prior to his retirement in May 2003, Mr. Dirks was Chief Operating Officer and a member of the Board of The Depository Trust & Clearing Corporation (DTCC). He also served as President, Chief Operating Officer, and Board member of The Depository Trust Company (DTC) and President and Board member of the National Securities Clearing Corporation (NSCC). In addition, Mr. Dirks served as Chief Executive Officer and Board member of the Government Securities Clearing Corporation, Chief Executive Officer and Board member of the Mortgage-Backed Securities Clearing Corporation, as a Trustee and a member of the Finance Committee of Manhattan College (2005-2008), and as a Trustee and a member of the Finance Committee of AHRC of Nassau County (2006-2008). Mr. Dirks is a member of the Independent Directors Council (IDC) Governing Council (2010-present) and Board of Directors for The Brookville Center for Children's Services, Inc. (2009-present). |
Alan J. Lacy (58) |
| Year of Election or Appointment: 2008 Mr. Lacy serves as Senior Adviser (2007-present) of Oak Hill Capital Partners, L.P. (private equity). Mr. Lacy also served as Chief Executive Officer (2000-2005) and Vice Chairman (2005-2006) of Sears Holdings Corporation and Sears, Roebuck and Co. (retail). In addition, Mr. Lacy serves as a member of the Board of Directors of Dave & Buster's Entertainment, Inc. (restaurant and entertainment complexes, 2010-present), Earth Fare, Inc. (retail grocery, 2012-present), The Hillman Companies, Inc. (hardware wholesalers, 2010-present), and Bristol-Myers Squibb Company (global pharmaceuticals, 2007-present). Mr. Lacy is a member of the Board of Trustees of The National Parks Conservation Association (2006-present). Previously, Mr. Lacy served as Chairman of the Board of Trustees of the National Parks Conservation Association (2008-2011) and as a member of the Board of Directors for the Western Union Company (global money transfer, 2006-2011). |
Ned C. Lautenbach (68) |
| Year of Election or Appointment: 2000 Mr. Lautenbach is Chairman of the Independent Trustees of the Equity and High Income Funds (2006-present). Mr. Lautenbach currently serves as the Lead Director of the Eaton Corporation Board of Directors (diversified industrial, 1997-present). Mr. Lautenbach is Chairman of the Board of Directors of the Philharmonic Center for the Arts in Naples, Florida (2012-present) and a member of the Council on Foreign Relations (1994-present). Previously, Mr. Lautenbach was a Partner/Advisory Partner at Clayton, Dubilier & Rice, LLC (private equity investment, 1998-2010), as well as a Director of Sony Corporation (2006-2007). |
Joseph Mauriello (67) |
| Year of Election or Appointment: 2008 Prior to his retirement in January 2006, Mr. Mauriello served in numerous senior management positions including Deputy Chairman and Chief Operating Officer (2004-2005), and Vice Chairman of Financial Services (2002-2004) of KPMG LLP US (professional services, 1965-2005). Mr. Mauriello currently serves as a member of the Board of Directors of XL Group plc. (global insurance and re-insurance, 2006-present). Previously, Mr. Mauriello served as a Director of the Hamilton Funds of the Bank of New York (2006-2007) and of Arcadia Resources Inc. (health care services and products, 2007-2012). |
Robert W. Selander (61) |
| Year of Election or Appointment: 2011 Previously, Mr. Selander served as a Member of the Advisory Board of Fidelity's Equity and High Income Funds (2011), Executive Vice Chairman (2010), Chief Executive Officer (2009-2010), and President and Chief Executive Officer (1997-2009) of Mastercard, Inc. |
Cornelia M. Small (68) |
| Year of Election or Appointment: 2005 Ms. Small is a member of the Board of Directors of the Teagle Foundation (2009-present). Ms. Small is also a member of the Investment Committee, and Chair (2008-present) and a member of the Board of Trustees of Smith College. In addition, Ms. Small serves on the Investment Committee of the Berkshire Taconic Community Foundation (2008-present). Previously, Ms. Small served as Chairperson of the Investment Committee (2002-2008) of Smith College. In addition, Ms. Small served as Chief Investment Officer, Director of Global Equity Investments, and a member of the Board of Directors of Scudder, Stevens & Clark and Scudder Kemper Investments. |
William S. Stavropoulos (73) |
| Year of Election or Appointment: 2002 Mr. Stavropoulos is Vice Chairman of the Independent Trustees of the Equity and High Income Funds (2006-present). Mr. Stavropoulos serves as President and Founder of the Michigan Baseball Foundation, the Great Lakes Loons (2007-present). Mr. Stavropoulos is Chairman Emeritus of the Board of Directors of The Dow Chemical Company, where he previously served in numerous senior management positions, including President, CEO (1995-2000; 2002-2004), Chairman of the Executive Committee (2000-2006), and as a member of the Board of Directors (1990-2006). Currently, Mr. Stavropoulos is Chairman of Univar (global distributor of commodity and specialty chemicals, 2010-present), a Director of Teradata Corporation (data warehousing and technology solutions, 2008-present), Chemical Financial Corporation, Maersk Inc. (industrial conglomerate), Tyco International, Inc. (multinational manufacturing and services, 2007-present), and a member of the Advisory Board for Metalmark Capital (private equity investment, 2005-present). Mr. Stavropoulos is a special advisor to Clayton, Dubilier & Rice, LLC (private equity investment). In addition, Mr. Stavropoulos is a member of the University of Notre Dame Advisory Council for the College of Science. |
David M. Thomas (63) |
| Year of Election or Appointment: 2008 Previously, Mr. Thomas served as Executive Chairman (2005-2006) and Chairman and Chief Executive Officer (2000-2005) of IMS Health, Inc. (pharmaceutical and healthcare information solutions). In addition, Mr. Thomas serves as a member of the Board of Directors of Fortune Brands, Inc. (consumer products), and Interpublic Group of Companies, Inc. (marketing communication, 2004-present). |
Michael E. Wiley (61) |
| Year of Election or Appointment: 2008 Mr. Wiley also serves as a Director of Asia Pacific Exploration Consolidated (international oil and gas exploration and production, 2008-present). Mr. Wiley serves as a Director of Tesoro Corporation (independent oil refiner and marketer, 2005-present), and a Director of Bill Barrett Corporation (exploration and production, 2005-present). In addition, Mr. Wiley also serves as a Director of Post Oak Bank (privately-held bank, 2004-present). Previously, Mr. Wiley served as a member of the Board of Trustees of the University of Tulsa (2000-2006; 2007-2010), as a Senior Energy Advisor of Katzenbach Partners, LLC (consulting, 2006-2007), as an Advisory Director of Riverstone Holdings (private investment), Chairman, President, and CEO of Baker Hughes, Inc. (oilfield services, 2000-2004), and as Director of Spinnaker Exploration Company (exploration and production, 2001-2005). |
Annual Report
+ The information above includes each Trustee's principal occupation during the last five years and other information relating to the experience, attributes, and skills relevant to each Trustee's qualifications to serve as a Trustee, which led to the conclusion that each Trustee should serve as a Trustee for the fund.
Advisory Board Members and Executive Officers:
Correspondence intended for David A. Rosow and Garnett A. Smith may be sent to Fidelity Investments, P.O. Box 55235, Boston, Massachusetts 02205-5235. Correspondence intended for each executive officer, Edward C. Johnson 3d, and Peter S. Lynch may be sent to Fidelity Investments, 82 Devonshire Street, Boston, Massachusetts 02109.
Name, Age; Principal Occupation |
Edward C. Johnson 3d (82) |
| Year of Election or Appointment: 2011 Member of the Advisory Board of Fidelity's Equity and High Income Funds. Mr. Johnson serves as Chief Executive Officer, Chairman, and a Director of FMR LLC, and also serves as Chairman and Director of FIL Limited. Previously, Mr. Johnson served as a Trustee and Chairman of the Board of certain Fidelity Trusts, Chairman and a Director of FMR, Chairman and a Director of FMR Co., Inc., and President of FMR LLC (2006-2007). |
Peter S. Lynch (68) |
| Year of Election or Appointment: 2003 Member of the Advisory Board of Fidelity's Equity and High Income Funds. Mr. Lynch is Vice Chairman and a Director of FMR and FMR Co., Inc. In addition, Mr. Lynch serves as a Trustee of Boston College and as the Chairman of the Inner-City Scholarship Fund. Previously, Mr. Lynch served on the Special Olympics International Board of Directors (1997-2006). |
David A. Rosow (69) |
| Year of Election or Appointment: 2012 Member of the Advisory Board of Fidelity's Equity and High Income Funds. Chairman and Chief Executive Officer of International Golf Group, Inc. (golf course development, 1990-present). Previously, Mr. Rosow served as Chairman and Chief Executive Officer of Rosow & Company, Inc. (private investment company, 1989-2011), a Lead Director of Hudson United Bancorp (2001-2006) and as a Director of TD Banknorth (1996-2006). In addition, Mr. Rosow is a member (2008-present) and President (2009-present) of the Town Council of Palm Beach, Florida. |
Garnett A. Smith (64) |
| Year of Election or Appointment: 2012 Member of the Advisory Board of Fidelity's Equity and High Income Funds. Prior to Mr. Smith's retirement, he served as Chairman and Chief Executive Officer of Inbrand Corp. (manufacturer of personal absorbent products, 1990-1997). He also served as President (1986-1990) of Inbrand Corp. Prior to his employment with Inbrand Corp., he was employed by a retail fabric chain and North Carolina National Bank. In addition, Mr. Smith is a board member of the Jackson Hole Land Trust (2009-present). |
Kenneth B. Robins (42) |
| Year of Election or Appointment: 2008 President and Treasurer of Fidelity's Equity and High Income Funds. Mr. Robins also serves as President and Treasurer (2010-present) and Assistant Treasurer (2009-present) of other Fidelity funds and is an employee of Fidelity Investments (2004-present). Previously, Mr. Robins served as Deputy Treasurer of the Fidelity funds (2005-2008) and Treasurer and Chief Financial Officer of The North Carolina Capital Management Trust: Cash and Term Portfolios (2006-2008). |
Brian B. Hogan (47) |
| Year of Election or Appointment: 2009 Vice President of Equity and High Income Funds. Mr. Hogan also serves as President of FMR's Equity Division (2009-present). Previously, Mr. Hogan served as Senior Vice President, Equity Research of FMR (2006-2009) and as a portfolio manager. |
Thomas C. Hense (48) |
| Year of Election or Appointment: 2008 or 2010 Vice President of Fidelity's High Income (2008), Small Cap (2008), and Value (2010) Funds. Previously, Mr. Hense served as a portfolio manager for Fidelity's Institutional Money Management Group (Pyramis) (2003-2008). |
Scott C. Goebel (44) |
| Year of Election or Appointment: 2008 Secretary and Chief Legal Officer (CLO) of the Fidelity funds. Mr. Goebel also serves as Secretary of Fidelity Investments Money Management, Inc. (FIMM) (2010-present) and Fidelity Research and Analysis Company (FRAC) (2010-present); Secretary and CLO of The North Carolina Capital Management Trust: Cash and Term Portfolios (2008-present); General Counsel, Secretary, and Senior Vice President of FMR (2008-present) and FMR Co., Inc. (2008-present); employed by FMR LLC or an affiliate (2001-present); Chief Legal Officer of Fidelity Management & Research (Hong Kong) Limited (2008-present) and Assistant Secretary of Fidelity Management & Research (Japan) Inc. (2008-present), and Fidelity Management & Research (U.K.) Inc. (2008-present). Previously, Mr. Goebel served as Assistant Secretary of FIMM (2008-2010), FRAC (2008-2010), and the Funds (2007-2008) and as Vice President and Secretary of Fidelity Distributors Corporation (FDC) (2005-2007). |
William C. Coffey (43) |
| Year of Election or Appointment: 2009 Assistant Secretary of Fidelity's Equity and High Income Funds. Mr. Coffey also serves as Senior Vice President and Deputy General Counsel of FMR LLC (2010-present), and is an employee of Fidelity Investments. Previously, Mr. Coffey served as Vice President and Associate General Counsel of FMR LLC (2005-2009). |
Elizabeth Paige Baumann (44) |
| Year of Election or Appointment: 2012 Anti-Money Laundering (AML) Officer of the Fidelity funds. Ms. Baumann also serves as AML Officer of The North Carolina Capital Management Trust: Cash and Term Portfolios (2012-present), Chief AML Officer of FMR LLC (2012-present), and is an employee of Fidelity Investments. Previously, Ms. Baumann served as Vice President and Deputy Anti-Money Laundering Officer (2007-2012). |
Christine Reynolds (53) |
| Year of Election or Appointment: 2008 Chief Financial Officer of the Fidelity funds. Ms. Reynolds became President of Fidelity Pricing and Cash Management Services (FPCMS) in August 2008. Ms. Reynolds served as Chief Operating Officer of FPCMS (2007-2008). Previously, Ms. Reynolds served as President, Treasurer, and Anti-Money Laundering officer of the Fidelity funds (2004-2007). |
Joseph A. Hanlon (44) |
| Year of Election or Appointment: 2012 Chief Compliance Officer of Fidelity's Equity and High Income Funds. Mr. Hanlon serves as Compliance Officer of FMR, FMR Co., Inc., Fidelity Investments Money Management, Inc. (FIMM), Fidelity Research and Analysis Company (FRAC), Fidelity Management & Research (Japan) Inc., Fidelity Management & Research (U.K.) Inc., Fidelity Management & Research (Hong Kong), and Strategic Advisers, Inc. (2009-present), as Senior Vice President of the Fidelity Asset Management Division (2009-present), and is an employee of Fidelity Investments. |
Joseph F. Zambello (55) |
| Year of Election or Appointment: 2011 Deputy Treasurer of the Fidelity funds. Mr. Zambello is an employee of Fidelity Investments. Previously, Mr. Zambello served as Vice President of FMR's Program Management Group (2009-2011) and Vice President of the Transfer Agent Oversight Group (2005-2009). |
Adrien E. Deberghes (44) |
| Year of Election or Appointment: 2008 Deputy Treasurer of Fidelity's Equity and High Income Funds. Mr. Deberghes also serves as Vice President (2011-present) and Assistant Treasurer (2010-present) of other Fidelity funds, and is an employee of Fidelity Investments (2008-present). Previously, Mr. Deberghes served as Senior Vice President of Mutual Fund Administration at State Street Corporation (2007-2008), Senior Director of Mutual Fund Administration at Investors Bank & Trust (2005-2007), and Director of Finance for Dunkin' Brands (2000-2005). |
Stephanie J. Dorsey (43) |
| Year of Election or Appointment: 2010 Assistant Treasurer of Fidelity's Equity and High Income Funds. Ms. Dorsey also serves as Deputy Treasurer of other Fidelity funds (2008-present) and is an employee of Fidelity Investments (2008-present). Previously, Ms. Dorsey served as Treasurer (2004-2008) of the JPMorgan Mutual Funds and Vice President (2004-2008) of JPMorgan Chase Bank. |
John R. Hebble (54) |
| Year of Election or Appointment: 2009 Assistant Treasurer of Fidelity's Equity and High Income Funds. Mr. Hebble also serves as President (2011-present), Treasurer, and Chief Financial Officer of The North Carolina Capital Management Trust: Cash and Term Portfolios (2008-present), President and Treasurer of other Fidelity funds (2008-present) and is an employee of Fidelity Investments. |
Gary W. Ryan (53) |
| Year of Election or Appointment: 2005 Assistant Treasurer of the Fidelity funds. Mr. Ryan is an employee of Fidelity Investments. Previously, Mr. Ryan served as Vice President of Fund Reporting in Fidelity Pricing and Cash Management Services (FPCMS) (1999-2005). |
Jonathan Davis (44) |
| Year of Election or Appointment: 2010 Assistant Treasurer of the Fidelity funds. Mr. Davis is also Assistant Treasurer of Fidelity Rutland Square Trust II and Fidelity Commonwealth Trust II. Mr. Davis is an employee of Fidelity Investments. Previously, Mr. Davis served as Vice President and Associate General Counsel of FMR LLC (2003-2010). |
Annual Report
Leveraged Company Stock designates 37% of the dividends distributed during the fiscal year as qualifying for the dividends-received deduction for corporate shareholders.
Leveraged Company Stock designates 44% of the dividends distributed during the fiscal year as amounts which may be taken into account as a dividend for the purposes of the maximum rate under section 1(h)(11) of the Internal Revenue Code.
The fund will notify shareholders in January 2013 of amounts for use in preparing 2012 income tax returns.
Annual Report
Board Approval of Investment Advisory Contracts and Management Fees
Fidelity Leveraged Company Stock Fund
Each year, the Board of Trustees, including the Independent Trustees (together, the Board), votes on the renewal of the management contract and sub-advisory agreements (together, the Advisory Contracts) for the fund. The Board, assisted by the advice of fund counsel and Independent Trustees' counsel, requests and considers a broad range of information relevant to the renewal of the Advisory Contracts throughout the year.
The Board meets regularly and, at each of its meetings, considers factors that are relevant to its annual consideration of the renewal of the fund's Advisory Contracts, including the services and support provided to the fund and its shareholders. The Board has established various standing committees, each composed of and chaired by Independent Trustees with varying backgrounds, to which the Board has assigned specific subject matter responsibilities in order to enhance effective decision-making by the Board. The Board, acting directly and through its Committees, requests and receives information concerning the annual consideration of the renewal of the fund's Advisory Contracts. The Board also meets as needed to consider matters specifically related to the Board's annual consideration of the renewal of Advisory Contracts. Members of the Board may also meet with trustees of other Fidelity funds through ad hoc joint committees to discuss certain matters relevant to the Fidelity funds.
At its July 2012 meeting, the Board of Trustees, including the Independent Trustees, unanimously determined to renew the fund's Advisory Contracts. In reaching its determination, the Board considered all factors it believed relevant, including (i) the nature, extent, and quality of the services to be provided to the fund and its shareholders (including the investment performance of the fund); (ii) the competitiveness of the fund's management fee and total expense ratio relative to peer funds; (iii) the total costs of the services to be provided by and the profits to be realized by Fidelity from its relationship with the fund; (iv) the extent to which economies of scale exist and would be realized as the fund grows; and (v) whether fee levels reflect these economies of scale, if any, for the benefit of fund shareholders.
In considering whether to renew the Advisory Contracts for the fund, the Board reached a determination, with the assistance of fund counsel and Independent Trustees' counsel and through the exercise of its business judgment, that the renewal of the Advisory Contracts is in the best interests of the fund and its shareholders and that the compensation payable under the Advisory Contracts is fair and reasonable. The Board's decision to renew the Advisory Contracts was not based on any single factor, but rather was based on a comprehensive consideration of all the information provided to the Board at its meetings throughout the year. The Board, in reaching its determination to renew the Advisory Contracts, is aware that shareholders in the fund have a broad range of investment choices available to them, including a wide choice among mutual funds offered by Fidelity's competitors, and that the fund's shareholders, who have the opportunity to review and weigh the disclosure provided by the fund in its prospectus and other public disclosures, have chosen to invest in this fund, managed by Fidelity.
Annual Report
Board Approval of Investment Advisory Contracts and
Management Fees - continued
Nature, Extent, and Quality of Services Provided. The Board considered the staffing within the investment adviser, FMR, and the sub-advisers (together, the Investment Advisers), including the backgrounds of the fund's investment personnel, and also considered the fund's investment objective, strategies, and related investment philosophy. The Independent Trustees also had discussions with senior management of Fidelity's investment operations and investment groups. The Board considered the structure of the portfolio manager compensation program and whether this structure provides appropriate incentives to act in the best interests of the fund.
Resources Dedicated to Investment Management and Support Services. The Board and the Fund Oversight and Research Committees reviewed the general qualifications and capabilities of the Investment Advisers' investment staff, including its size, education, experience, and resources, as well as the Investment Advisers' approach to recruiting, training, managing, and compensating investment personnel. The Board also noted that FMR has continued to increase the resources devoted to non-U.S. offices, including expansion of Fidelity's global investment organization. The Board noted that Fidelity's analysts have extensive resources, tools and capabilities that allow them to conduct sophisticated quantitative and fundamental analysis, as well as credit analysis of issuers, counterparties and guarantors. The Board also believes that Fidelity's investment professionals have sufficient access to global information and data so as to provide competitive investment results over time, and that those professionals also have access to sophisticated tools that permit them to assess portfolio construction and risk and performance attribution characteristics continuously, as well as to transmit new information and research conclusions rapidly around the world. Additionally, in its deliberations, the Board considered the Investment Advisers' trading and risk management capabilities and resources, which are an integral part of the investment management process.
Shareholder and Administrative Services. The Board considered (i) the nature, extent, quality, and cost of advisory, administrative, and shareholder services performed by the Investment Advisers and their affiliates under the Advisory Contracts and under separate agreements covering transfer agency, pricing and bookkeeping, and securities lending services for the fund; (ii) the nature and extent of the supervision of third party service providers, principally custodians and subcustodians; and (iii) the resources devoted to, and the record of compliance with, the fund's compliance policies and procedures. The Board also reviewed the allocation of fund brokerage, including allocations to brokers affiliated with the Investment Advisers, the use of brokerage commissions to pay fund expenses, and the use of "soft" commission dollars to pay for research services.
Annual Report
The Board noted that the growth of fund assets over time across the complex allows Fidelity to reinvest in the development of services designed to enhance the value or convenience of the Fidelity funds as investment vehicles. These services include 24-hour access to account information and market information through telephone representatives and over the Internet, investor education materials and asset allocation tools, and the expanded availability of Fidelity Investor Centers.
Investment in a Large Fund Family. The Board considered the benefits to shareholders of investing in a Fidelity fund, including the benefits of investing in a fund that is part of a large family of funds offering a variety of investment disciplines and providing a large variety of mutual fund investor services. The Board noted that Fidelity had taken, or had made recommendations that resulted in the Fidelity funds taking, a number of actions over the previous year that benefited particular funds, including (i) continuing to dedicate additional resources to investment research and support of the senior management team that oversees asset management; (ii) persisting in efforts to enhance Fidelity's research capabilities, in particular, international research; (iii) launching new funds and making other enhancements to meet client needs for global and income-oriented solutions; (iv) continuing to launch dedicated lower cost underlying funds to meet investment management's portfolio construction needs related to expanding underlying fund options, specifically for the Freedom Fund product lines; (v) adopting a "Stock Selector" sector neutral investment approach and employing a team of portfolio managers who are sector specialists to manage certain funds; (vi) rationalizing product lines and gaining increased efficiencies through the mergers of several funds into other funds; (vii) strengthening the Spartan Index Fund product line by adding new funds and/or new low-cost institutional share classes, restructuring fund expenses to accommodate new classes, and reducing investment minimums for certain classes of shares; (viii) modifying the eligibility criteria for Institutional Class shares to increase their appeal to government entities and charitable investors; and (ix) reducing certain transfer agent fee rates.
Investment Performance. The Board considered whether the fund has operated in accordance with its investment objective, as well as its record of compliance with its investment restrictions. It also reviewed the fund's absolute investment performance for each class, as well as the fund's relative investment performance for each class measured over multiple periods against (i) a broad-based securities market index, and (ii) a custom peer group of mutual funds deemed appropriate by Fidelity and reviewed by the Board. The following charts considered by the Board show, over the one-, three-, and five-year periods ended December 31, 2011, as available, the cumulative total returns of Class K and the retail class of the fund, the cumulative total returns of a broad-based securities market index ("benchmark"), and a range of cumulative total returns of a custom peer group of mutual funds defined by FMR based on categories assigned by Morningstar, Inc. The box within each chart shows the 25th percentile return (top of box) and the 75th percentile return (bottom of box) of the peer group. Returns shown above the box are in the first quartile and returns shown below the box are in the fourth quartile. The percentage beaten numbers noted below each chart correspond to the percentile box and represent the percentage of funds in the peer group whose performance was equal to or lower than that of the class indicated. The fund's custom peer group, defined by FMR, is a peer group that FMR believes provides a more meaningful performance comparison than the peer group assigned by Morningstar, Inc., which assigns mutual funds to categories based on their investment styles as measured by their underlying portfolio holdings.
Annual Report
Board Approval of Investment Advisory Contracts and
Management Fees - continued
Fidelity Leveraged Company Stock Fund

The Board reviewed the fund's relative investment performance against its peer group and noted that the performance of the retail class of the fund (the class with the longer performance record) was in the fourth quartile for the one- and five-year periods and the first quartile for the three-year period. The Board also noted that the investment performance of the retail class of the fund compared favorably to its benchmark for all the periods shown. The Board considered that the variations in performance between the fund's classes reflect the variations in class expenses, which result in lower performance for the higher expense class. The Board also reviewed the fund's performance since inception as well as performance in the current year.
Based on its review, the Board concluded that the nature, extent, and quality of services provided to the fund under the Advisory Contracts should benefit the fund's shareholders.
Competitiveness of Management Fee and Total Expense Ratio. The Board considered the fund's management fee and total expense ratio compared to "mapped groups" of competitive funds and classes. Fidelity creates "mapped groups" by combining similar Lipper investment objective categories that have comparable management fee characteristics. Combining Lipper investment objective categories aids the Board's management fee and total expense ratio comparisons by broadening the competitive group used for comparison and by reducing the number of universes to which various Fidelity funds are compared.
Annual Report
Management Fee. The Board considered two proprietary management fee comparisons for the 12-month periods shown in the chart below. The group of Lipper funds used by the Board for management fee comparisons is referred to below as the "Total Mapped Group." The Total Mapped Group comparison focuses on a fund's standing relative to the total universe of comparable funds available to investors in terms of gross management fees before expense reimbursements or caps. "TMG %" represents the percentage of funds in the Total Mapped Group that had management fees that were lower than the fund's. For example, a TMG % of 18% means that 82% of the funds in the Total Mapped Group had higher management fees than the fund. The "Asset-Size Peer Group" (ASPG) comparison focuses on a fund's standing relative to non-Fidelity funds similar in size to the fund within the Total Mapped Group. The ASPG represents at least 15% of the funds in the Total Mapped Group with comparable asset size and management fee characteristics, subject to a minimum of 50 funds (or all funds in the Total Mapped Group if fewer than 50). Additional information, such as the ASPG quartile in which the fund's management fee ranked, is also included in the chart and considered by the Board.
Fidelity Leveraged Company Stock Fund
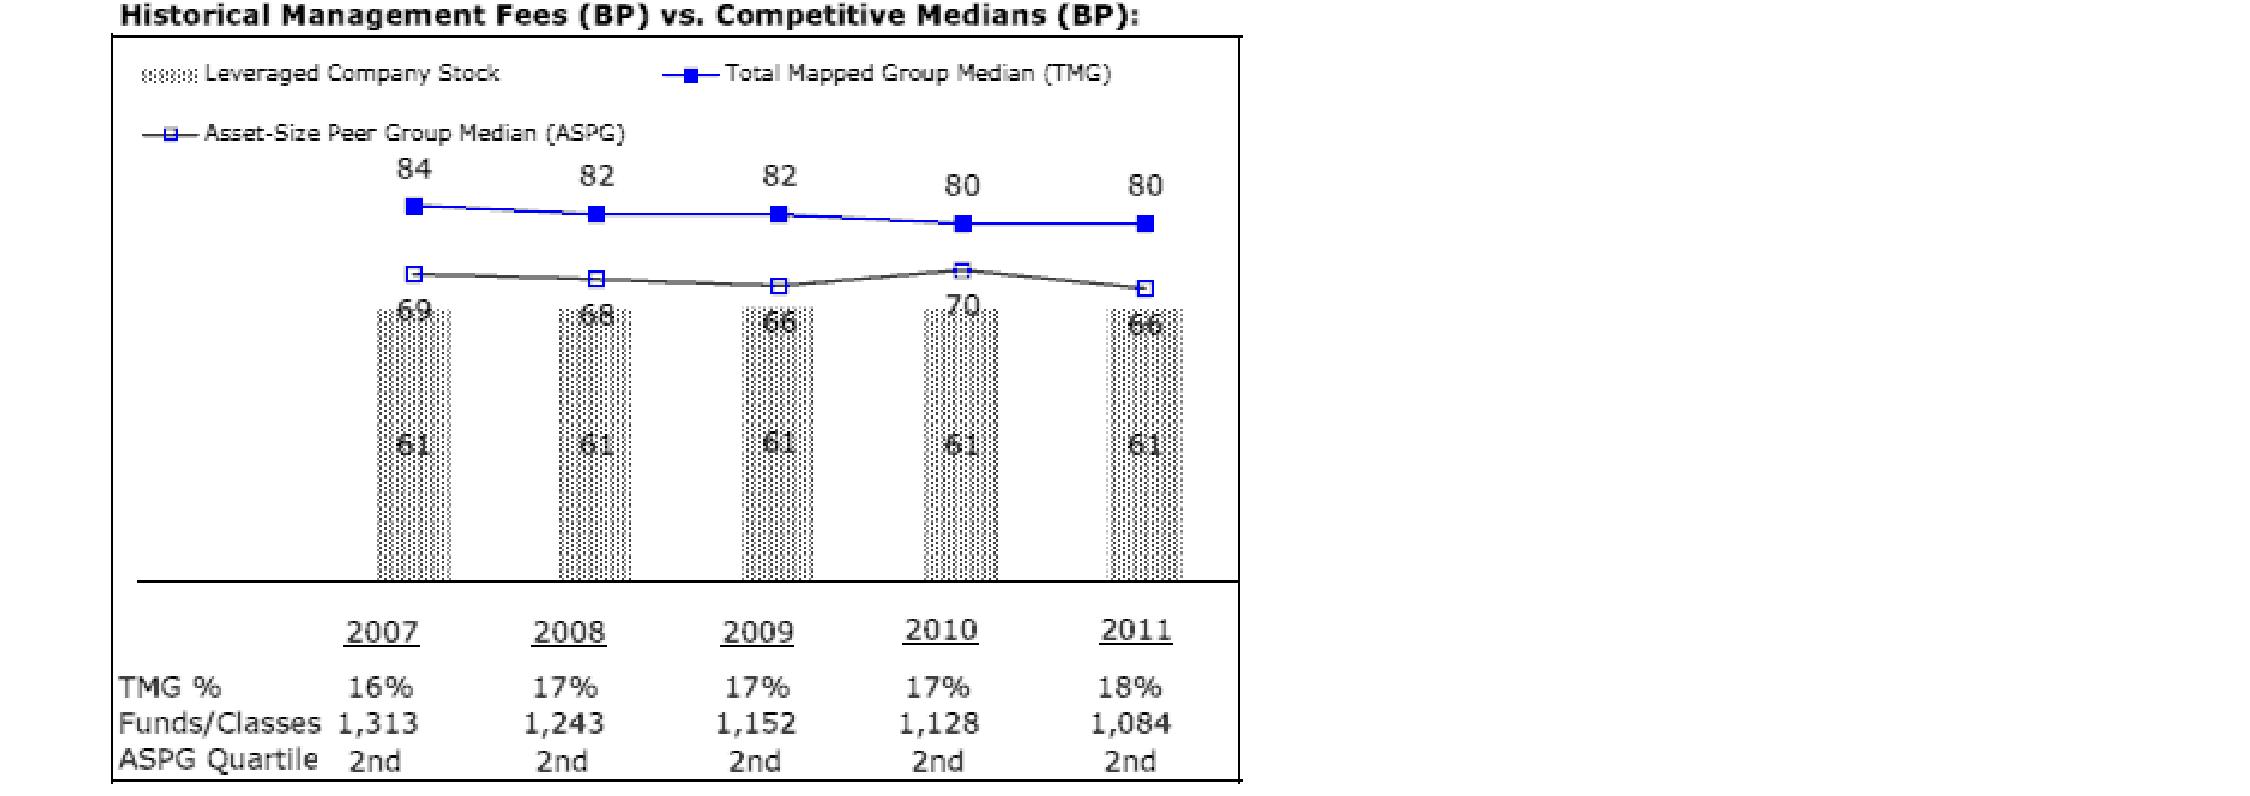
Annual Report
Board Approval of Investment Advisory Contracts and
Management Fees - continued
The Board noted that the fund's management fee ranked below the median of its Total Mapped Group and below the median of its ASPG for 2011.
Based on its review, the Board concluded that the fund's management fee is fair and reasonable in light of the services that the fund receives and the other factors considered.
Total Expense Ratio. In its review of each class's total expense ratio, the Board considered the fund's management fee as well as other fund or class expenses, as applicable, such as transfer agent fees, pricing and bookkeeping fees, and custodial, legal, and audit fees. The Board also noted the effects of any waivers and reimbursements on fees and expenses. As part of its review, the Board also considered the current and historical total expense ratios of each class of the fund compared to competitive fund median expenses. Each class of the fund is compared to those funds and classes in the Total Mapped Group (used by the Board for management fee comparisons) that have a similar sales load structure.
The Board noted that the total expense ratio of each class ranked below its competitive median for 2011.
Fees Charged to Other Fidelity Clients. The Board also considered Fidelity fee structures and other information with respect to clients of FMR and its affiliates, such as other mutual funds advised or subadvised by FMR or its affiliates, pension plan clients, and other institutional clients. The Board noted the findings of the 2010 ad hoc joint committee (created with the board of other Fidelity funds), which reviewed and compared Fidelity's institutional investment advisory business with its business of providing services to the Fidelity funds, including the differences in services provided, fees charged, and costs incurred, as well as competition in their respective marketplaces.
Based on its review of total expense ratios and fees charged to other Fidelity clients, the Board concluded that the total expense ratio of each class of the fund was reasonable in light of the services that the fund and its shareholders receive and the other factors considered.
Costs of the Services and Profitability. The Board considered the revenues earned and the expenses incurred by Fidelity in conducting the business of developing, marketing, distributing, managing, administering and servicing the fund and its shareholders. The Board also considered the level of Fidelity's profits in respect of all the Fidelity funds.
On an annual basis, FMR presents to the Board Fidelity's profitability for the fund. Fidelity calculates the profitability for each fund, as well as aggregate profitability for groups of Fidelity funds and all Fidelity funds, using a series of detailed revenue and cost allocation methodologies which originate with the books and records of Fidelity on which Fidelity's audited financial statements are based. The Audit Committee of the Board reviews any significant changes from the prior year's methodologies.
Annual Report
PricewaterhouseCoopers LLP (PwC), independent registered public accounting firm and auditor to Fidelity and certain Fidelity funds, has been engaged annually by the Board as part of the Board's assessment of Fidelity's profitability analysis. PwC's engagement includes the review and assessment of Fidelity's methodologies used in determining the revenues and expenses attributable to Fidelity's mutual fund business, and completion of agreed-upon procedures surrounding the mathematical accuracy of fund profitability and its conformity to allocation methodologies. After considering PwC's reports issued under the engagement and information provided by Fidelity, the Board concluded that while other allocation methods may also be reasonable, Fidelity's profitability methodologies are reasonable in all material respects.
The Board also reviewed Fidelity's non-fund businesses and fall-out benefits related to the mutual fund business as well as cases where Fidelity's affiliates may benefit from or be related to the fund's business.
The Board considered the costs of the services provided by and the profits realized by Fidelity in connection with the operation of the fund and was satisfied that the profitability was not excessive in the circumstances.
Economies of Scale. The Board considered whether there have been economies of scale in respect of the management of the Fidelity funds, whether the Fidelity funds (including the fund) have appropriately benefited from any such economies of scale, and whether there is potential for realization of any further economies of scale. The Board considered the extent to which the fund will benefit from economies of scale through increased services to the fund, through waivers or reimbursements, or through fee or expense reductions. The Board also noted that in 2009, it and the board of other Fidelity funds created an ad hoc committee (the Economies of Scale Committee) to analyze whether FMR attains economies of scale in respect of the management and servicing of the Fidelity funds, whether the Fidelity funds have appropriately benefited from such economies of scale, and whether there is potential for realization of any further economies of scale.
The Board recognized that the fund's management contract incorporates a "group fee" structure, which provides for lower group fee rates as total fund assets under FMR's management increase, and for higher group fee rates as total fund assets under FMR's management decrease. FMR calculates the group fee rates based on a tiered asset "breakpoint" schedule that varies based on asset class. The Board considered that the group fee is designed to deliver the benefits of economies of scale to fund shareholders when total Fidelity fund assets increase, even if assets of any particular fund are unchanged or have declined, because some portion of Fidelity's costs are attributable to services provided to all Fidelity funds, and all funds benefit if those costs can be allocated among more assets. The Board concluded that, given the group fee structure, fund shareholders will benefit from lower management fees as assets under FMR's management increase at the fund complex level, regardless of whether Fidelity achieves any such economies of scale.
Annual Report
Board Approval of Investment Advisory Contracts and
Management Fees - continued
The Board concluded, taking into account the analysis of the Economies of Scale Committee, that economies of scale, if any, are being appropriately shared between fund shareholders and Fidelity.
Additional Information Requested by the Board. In order to develop fully the factual basis for consideration of the Fidelity funds' Advisory Contracts, the Board requested and received additional information on certain topics, including (i) fund performance trends, actions to be taken by FMR to improve certain funds' overall performance, and Fidelity's long-term strategies for certain funds; (ii) the potential to further rationalize the Fidelity fund lineup with the possibility of achieving savings for the funds and Fidelity; (iii) Fidelity's compensation structure for portfolio managers and other key investment personnel; (iv) the amount of the investment that each portfolio manager has made in the Fidelity fund(s) that he or she manages; (v) the realization of fall-out benefits in certain Fidelity business units; (vi) Fidelity's group fee structures, the potential impact of regulatory changes on such structures, and the rationale for the individual fee rates of certain funds; (vii) fund profitability methodology, including Fidelity's cost allocation methodology, and the impact of certain factors on fund profitability results; (viii) trends regarding industry use of performance fee structures and the possibility of implementing performance fee structures for additional funds; and (ix) the impact of net redemptions from the Fidelity funds.
Based on its evaluation of all of the conclusions noted above, and after considering all factors it believed relevant, the Board ultimately concluded that the advisory fee structures are fair and reasonable, and that the fund's Advisory Contracts should be renewed.
Annual Report
Investment Adviser
Fidelity Management & Research Company
Boston, MA
Investment Sub-Adviser
FMR Co., Inc.
Fidelity Management & Research
(U.K.) Inc.
Fidelity Management & Research
(Hong Kong) Limited
Fidelity Management & Research
(Japan) Inc.
General Distributor
Fidelity Distributors Corporation
Smithfield, RI
Transfer and Service Agents
Fidelity Investments Institutional
Operations Company, Inc.
Boston, MA
Fidelity Service Company, Inc.
Boston, MA
Custodian
JPMorgan Chase Bank
New York, NY
The Fidelity Telephone Connection
Mutual Fund 24-Hour Service
Exchanges/Redemptions
and Account Assistance 1-800-544-6666
Product Information 1-800-544-6666
Retirement Accounts 1-800-544-4774
(8 a.m. - 9 p.m.)
TDD Service 1-800-544-0118
for the deaf and hearing impaired
(9 a.m. - 9 p.m. Eastern time)
Fidelity Automated Service
Telephone (FAST®)
1-800-544-5555
Automated line for quickest service
(Fidelity Investment logo)(registered trademark)
Corporate Headquarters
82 Devonshire St., Boston, MA 02109
www.fidelity.com
LSF-UANN-0912
1.789248.109
Fidelity®
Real Estate Income
Fund
Annual Report
July 31, 2012
(Fidelity Cover Art)
Contents
Performance | (Click Here) | How the fund has done over time. |
Management's Discussion of Fund Performance | (Click Here) | The Portfolio Manager's review of fund performance and strategy. |
Shareholder Expense Example | (Click Here) | An example of shareholder expenses. |
Investment Changes | (Click Here) | A summary of major shifts in the fund's investments over the past six months. |
Investments | (Click Here) | A complete list of the fund's investments with their market values. |
Financial Statements | (Click Here) | Statements of assets and liabilities, operations, and changes in net assets, as well as financial highlights. |
Notes | (Click Here) | Notes to the financial statements. |
Report of Independent Registered Public Accounting Firm | (Click Here) | |
Trustees and Officers | (Click Here) | |
Distributions | (Click Here) | |
Board Approval of Investment Advisory Contracts and Management Fees | (Click Here) | |
To view a fund's proxy voting guidelines and proxy voting record for the 12-month period ended June 30, visit http://www.fidelity.com/proxyvotingresults or visit the Securities and Exchange Commission's (SEC) web site at http://www.sec.gov. You may also call 1-800-544-8544 to request a free copy of the proxy voting guidelines.
Standard & Poor's, S&P and S&P 500 are registered service marks of The McGraw-Hill Companies, Inc. and have been licensed for use by Fidelity Distributors Corporation.
Other third party marks appearing herein are the property of their respective owners.
All other marks appearing herein are registered or unregistered trademarks or service marks of FMR LLC or an affiliated company. © 2012 FMR LLC. All rights reserved.
This report and the financial statements contained herein are submitted for the general information of the shareholders of the fund. This report is not authorized for distribution to prospective investors in the fund unless preceded or accompanied by an effective prospectus.
A fund files its complete schedule of portfolio holdings with the SEC for the first and third quarters of each fiscal year on Form N-Q. Forms N-Q are available on the SEC's web site at http://www.sec.gov. A fund's Forms N-Q may be reviewed and copied at the SEC's Public Reference Room in Washington, DC. Information regarding the operation of the SEC's Public Reference Room may be obtained by calling 1-800-SEC-0330. For a complete list of a fund's portfolio holdings, view the most recent holdings listing, semiannual report, or annual report on Fidelity's web site at http://www.fidelity.com, http://www.advisor.fidelity.com, or http://www.401k.com, as applicable.
NOT FDIC INSURED • MAY LOSE VALUE • NO BANK GUARANTEE
Neither the fund nor Fidelity Distributors Corporation is a bank.
Annual Report
Average annual total return reflects the change in the value of an investment, assuming reinvestment of the class' distributions from dividend income and capital gains (the profits earned upon the sale of securities that have grown in value, if any) and assuming a constant rate of performance each year. The $10,000 table and the fund's returns do not reflect the deduction of taxes that a shareholder would pay on fund distributions or the redemption of fund shares. During periods of reimbursement by Fidelity, a fund's total return will be greater than it would be had the reimbursement not occurred. How a fund did yesterday is no guarantee of how it will do tomorrow.
Average Annual Total Returns
Periods ended July 31, 2012 | Past 1
year | Past 5
years | Life of
fund A |
Fidelity® Real Estate Income Fund | 11.50% | 6.70% | 7.80% |
A From February 4, 2003.
$10,000 Over Life of Fund
Let's say hypothetically that $10,000 was invested in Fidelity® Real Estate Income Fund, a class of the fund, on February 4, 2003, when the fund started. The chart shows how the value of your investment would have changed, and also shows how the S&P 500® Index performed over the same period.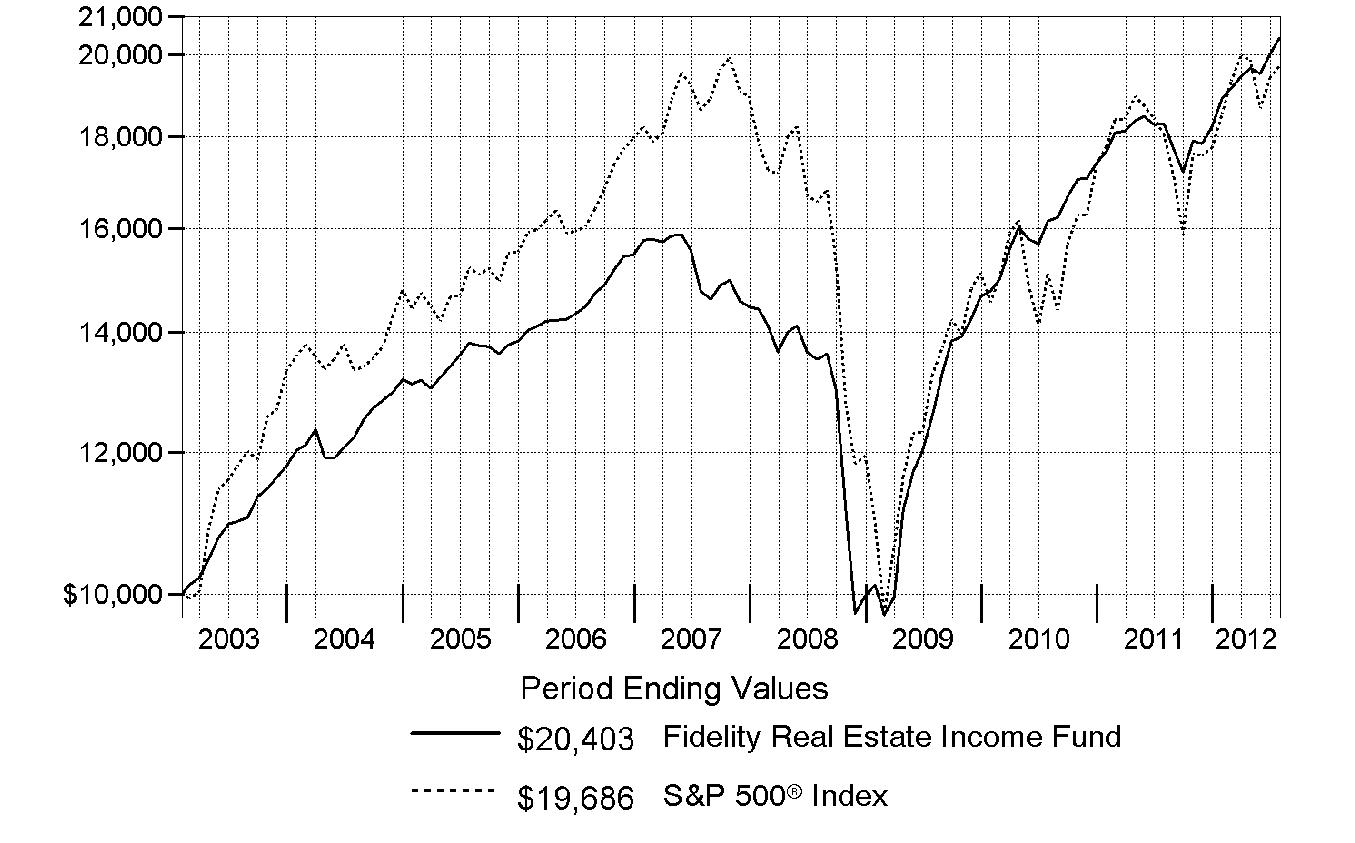
Annual Report
Market Recap: Market conditions shifted between intervals of "risk on" and "risk off" during the 12-month period ending July 31, 2012. During the risk-off times - including several extended stretches in the second half of 2011 as well as May 2012 - macro concerns about the eurozone debt crisis and slowing U.S. economic growth took center stage. For most of the first seven months of 2012, however, risk-on returned to the market, causing credit spreads across most asset classes to rally. For real estate, the story was a combination of lower interest rates and good property supply-and-demand fundamentals. Lower interest rates made income-generating real estate securities look more attractive, while good business fundamentals created rising earnings for property owners. In all, common stocks of real estate investment trusts (REITs), as measured by the FTSE® NAREIT® All REITs Index, gained 14.79%, while real estate bonds, reflected in The BofA Merrill LynchSM US Real Estate Index - a market-capitalization-weighted measure of the performance of investment-grade public debt of corporate issuers in the domestic real estate sector - rose 8.39%. The MSCI® REIT Preferred Index, which reflects the performance of real estate preferred stocks, returned 11.28%, while the broad U.S. equity market, as measured by the S&P 500® Index, returned 9.13%.
Comments from Mark Snyderman, Portfolio Manager of Fidelity® Real Estate Income Fund: For the year, the fund's Retail Class shares gained 11.50%. In comparison, the Fidelity Real Estate Income Composite IndexSM - a 40/40/20 blend of the MSCI® REIT Preferred Index, The BofA Merrill LynchSM US Real Estate Index and the FTSE® NAREIT® All REITs Index, respectively - rose 11.14%. In a favorable environment for real estate securities, all of the fund's asset classes enjoyed positive performance, led by REIT common stocks. Meanwhile, the fund's preferred real estate stocks modestly outpaced the average preferred stock in the MSCI index. Looking at the fund's fixed-income holdings, investments in high-yield real estate bonds and commercial mortgage-backed securities (CMBS) beat the BofA Merrill Lynch index by nearly three percentage points. One area of slight underperformance came from the portfolio's investment-grade real estate bond holdings, which, because of my decision to limit interest rate risk, returned somewhat less than the BofA Merrill Lynch index. In addition, holding a roughly 8% cash position limited the fund's upside in a generally rising market.
The views expressed above reflect those of the portfolio manager(s) only through the end of the period as stated on the cover of this report and do not necessarily represent the views of Fidelity or any other person in the Fidelity organization. Any such views are subject to change at any time based upon market or other conditions and Fidelity disclaims any responsibility to update such views. These views may not be relied on as investment advice and, because investment decisions for a Fidelity fund are based on numerous factors, may not be relied on as an indication of trading intent on behalf of any Fidelity fund.
Annual Report
Shareholder Expense Example
As a shareholder of the Fund, you incur two types of costs: (1) transaction costs, including sales charges (loads) on purchase payments or redemption proceeds, redemption fees and (2) ongoing costs, including management fees, distribution and/or service (12b-1) fees and other Fund expenses. This Example is intended to help you understand your ongoing costs (in dollars) of investing in the Fund and to compare these costs with the ongoing costs of investing in other mutual funds.
The Example is based on an investment of $1,000 invested at the beginning of the period and held for the entire period (February 1, 2012 to July 31, 2012).
Actual Expenses
The first line of the accompanying table for each class of the Fund provides information about actual account values and actual expenses. You may use the information in this line, together with the amount you invested, to estimate the expenses that you paid over the period. Simply divide your account value by $1,000.00 (for example, an $8,600 account value divided by $1,000.00 = 8.6), then multiply the result by the number in the first line for a class of the Fund under the heading entitled "Expenses Paid During Period" to estimate the expenses you paid on your account during this period. A small balance maintenance fee of $12.00 that is charged once a year may apply for certain accounts with a value of less than $2,000. This fee is not included in the table below. If it was, the estimate of expenses you paid during the period would be higher, and your ending account value lower, by this amount. In addition, the Fund, as a shareholder in the underlying Fidelity Central Funds, will indirectly bear its pro-rata share of the fees and expenses incurred by the underlying Fidelity Central Funds. These fees and expenses are not included in the Fund's annualized expense ratio used to calculate the expense estimate in the table below.
Hypothetical Example for Comparison Purposes
The second line of the accompanying table for each class of the Fund provides information about hypothetical account values and hypothetical expenses based on a Class' actual expense ratio and an assumed rate of return of 5% per year before expenses, which is not the Class' actual return. The hypothetical account values and expenses may not be used to estimate the actual ending account balance or expenses you paid for the period. You may use this information to compare the ongoing costs of investing in the Fund and other funds. To do so, compare this 5% hypothetical example with the 5% hypothetical examples that appear in the shareholder reports of the other funds. A small balance maintenance fee of $12.00 that is charged once a year may apply for certain accounts with a value of less than $2,000. This fee is not included in the table below. If it was, the estimate of expenses you paid during the period would be higher, and your ending account value lower, by this amount. In addition, the Fund, as a shareholder in the underlying Fidelity Central Funds, will indirectly bear its pro-rata share of the fees and expenses incurred by the underlying Fidelity Central Funds. These fees and expenses are not included in the Fund's annualized expense ratio used to calculate the expense estimate in the table below.
Please note that the expenses shown in the table are meant to highlight your ongoing costs only and do not reflect any transaction costs. Therefore, the second line of the table is useful in comparing ongoing costs only, and will not help you determine the relative total costs of owning different funds. In addition, if these transactional costs were included, your costs would have been higher.
Annual Report
Shareholder Expense Example - continued
| Annualized Expense Ratio | Beginning
Account Value
February 1, 2012 | Ending
Account Value
July 31, 2012 | Expenses Paid
During Period*
February 1, 2012
to July 31, 2012 |
Class A | 1.11% | | | |
Actual | | $ 1,000.00 | $ 1,079.20 | $ 5.74 |
HypotheticalA | | $ 1,000.00 | $ 1,019.34 | $ 5.57 |
Class T | 1.09% | | | |
Actual | | $ 1,000.00 | $ 1,078.30 | $ 5.63 |
HypotheticalA | | $ 1,000.00 | $ 1,019.44 | $ 5.47 |
Class C | 1.85% | | | |
Actual | | $ 1,000.00 | $ 1,074.60 | $ 9.54 |
HypotheticalA | | $ 1,000.00 | $ 1,015.66 | $ 9.27 |
Real Estate Income | .88% | | | |
Actual | | $ 1,000.00 | $ 1,079.80 | $ 4.55 |
HypotheticalA | | $ 1,000.00 | $ 1,020.49 | $ 4.42 |
Institutional Class | .82% | | | |
Actual | | $ 1,000.00 | $ 1,080.30 | $ 4.24 |
HypotheticalA | | $ 1,000.00 | $ 1,020.79 | $ 4.12 |
A 5% return per year before expenses
* Expenses are equal to each Class' annualized expense ratio, multiplied by the average account value over the period, multiplied by 182/366 (to reflect the one-half year period).
Annual Report
Investment Changes (Unaudited)
Top Five Stocks as of July 31, 2012 |
| % of fund's
net assets | % of fund's net assets
6 months ago |
Ventas, Inc. | 1.9 | 2.0 |
Equity Lifestyle Properties, Inc. | 1.8 | 1.5 |
MFA Financial, Inc. | 1.7 | 1.6 |
Acadia Realty Trust (SBI) | 1.5 | 1.6 |
Equity Lifestyle Properties, Inc. 8.034% | 1.0 | 1.1 |
| 7.9 | |
Top 5 Bonds as of July 31, 2012 |
| % of fund's
net assets | % of fund's net assets
6 months ago |
Banc of America Large Loan Trust floater Series 2010-HLTN Class HLTN, 1.992% 11/15/15 | 4.2 | 2.6 |
Annaly Capital Management, Inc. 5% 5/15/15 | 1.3 | 0.0 |
Forest City Enterprises, Inc. 7.625% 6/1/15 | 1.3 | 0.8 |
Standard Pacific Corp. 8.375% 5/15/18 | 1.2 | 1.4 |
iStar Financial, Inc. 5.875% 3/15/16 | 1.2 | 0.3 |
| 9.2 | |
Top Five REIT Sectors as of July 31, 2012 |
| % of fund's
net assets | % of fund's net assets
6 months ago |
REITs - Mortgage | 11.9 | 6.4 |
REITs - Management/Investment | 6.8 | 7.3 |
REITs - Shopping Centers | 6.5 | 6.9 |
REITs - Health Care Facilities | 6.0 | 6.6 |
REITs - Office Buildings | 3.5 | 3.8 |
Asset Allocation (% of fund's net assets) |
As of July 31, 2012 * | As of January 31, 2012 ** |
 | Common Stocks 23.1% | | | Common Stocks 24.2% | |
 | Preferred Stocks 13.3% | | | Preferred Stocks 11.2% | |
 | Bonds 48.6% | |  | Bonds 48.6% | |
 | Convertible Securities 4.0% | | | Convertible Securities 3.4% | |
 | Other Investments 4.9% | | | Other Investments 4.2% | |
 | Short-Term Investments and Net Other Assets (Liabilities) 6.1% | | | Short-Term Investments and Net Other Assets (Liabilities) 8.4% | |
* Foreign investments | 4.9% | | ** Foreign investments | 6.0% | |

Annual Report
Investments July 31, 2012
Showing Percentage of Net Assets
Common Stocks - 23.1% |
| Shares | | Value |
CONSUMER DISCRETIONARY - 1.2% |
Household Durables - 1.2% |
NVR, Inc. (a) | 6,700 | | $ 5,185,666 |
Standard Pacific Corp. (a)(f) | 3,120,100 | | 17,690,967 |
Stanley Martin Communities LLC Class B (a) | 4,620 | | 4,116,420 |
Toll Brothers, Inc. (a) | 183,100 | | 5,341,027 |
| | 32,334,080 |
FINANCIALS - 20.6% |
Capital Markets - 0.1% |
HFF, Inc. (a) | 243,214 | | 3,176,375 |
Real Estate Investment Trusts - 20.1% |
Acadia Realty Trust (SBI) | 1,709,649 | | 40,928,997 |
American Campus Communities, Inc. | 76,000 | | 3,622,160 |
American Residential Properties, Inc. (h) | 453,000 | | 9,060,000 |
American Tower Corp. | 190,500 | | 13,775,055 |
AmREIT, Inc. (g) | 200,000 | | 2,818,000 |
Annaly Capital Management, Inc. | 329,150 | | 5,737,085 |
Anworth Mortgage Asset Corp. | 1,065,710 | | 7,076,314 |
Apartment Investment & Management Co. Class A | 414,700 | | 11,375,221 |
Associated Estates Realty Corp. | 309,400 | | 4,619,342 |
Canadian (REIT) | 107,800 | | 4,529,782 |
CapLease, Inc. | 2,465,600 | | 11,218,480 |
CBL & Associates Properties, Inc. | 1,065,273 | | 21,017,836 |
Chartwell Seniors Housing (REIT) | 509,700 | | 5,102,845 |
Chartwell Seniors Housing (REIT) (h) | 78,500 | | 785,900 |
Chesapeake Lodging Trust | 223,500 | | 3,792,795 |
Chimera Investment Corp. | 813,000 | | 1,756,080 |
CommonWealth REIT | 333,000 | | 6,073,920 |
Cousins Properties, Inc. | 190,400 | | 1,445,136 |
Cys Investments, Inc. (f) | 915,339 | | 13,235,802 |
DCT Industrial Trust, Inc. | 1,008,900 | | 6,315,714 |
DiamondRock Hospitality Co. | 531,400 | | 5,027,044 |
Douglas Emmett, Inc. | 260,200 | | 6,117,302 |
Dynex Capital, Inc. | 1,546,243 | | 16,065,465 |
EastGroup Properties, Inc. | 67,900 | | 3,631,292 |
Education Realty Trust, Inc. | 281,800 | | 3,302,696 |
Equity Lifestyle Properties, Inc. | 672,130 | | 48,339,590 |
Excel Trust, Inc. | 717,228 | | 8,778,871 |
First Potomac Realty Trust | 430,815 | | 4,993,146 |
Glimcher Realty Trust | 600,500 | | 6,017,010 |
H&R REIT/H&R Finance Trust | 256,500 | | 6,394,276 |
Hatteras Financial Corp. | 214,100 | | 6,262,425 |
Common Stocks - continued |
| Shares | | Value |
FINANCIALS - continued |
Real Estate Investment Trusts - continued |
Highwoods Properties, Inc. (SBI) | 101,400 | | $ 3,434,418 |
Lexington Corporate Properties Trust | 2,623,482 | | 23,453,929 |
LTC Properties, Inc. | 357,113 | | 12,748,934 |
MFA Financial, Inc. | 5,645,781 | | 45,617,910 |
Mid-America Apartment Communities, Inc. | 58,900 | | 4,077,647 |
Monmouth Real Estate Investment Corp. Class A | 249,773 | | 2,782,471 |
National Health Investors, Inc. | 70,306 | | 3,774,729 |
National Retail Properties, Inc. | 114,100 | | 3,365,950 |
Newcastle Investment Corp. | 2,920,700 | | 21,759,215 |
Prologis, Inc. | 654,887 | | 21,172,497 |
Retail Properties America, Inc. | 216,700 | | 2,160,499 |
Select Income (REIT) | 155,600 | | 3,914,896 |
Senior Housing Properties Trust (SBI) | 505,300 | | 11,495,575 |
Stag Industrial, Inc. | 572,831 | | 8,283,136 |
Summit Hotel Properties, Inc. | 511,088 | | 4,242,030 |
Sunstone Hotel Investors, Inc. (a) | 211,700 | | 2,119,117 |
Terreno Realty Corp. | 190,264 | | 2,836,836 |
Two Harbors Investment Corp. | 470,480 | | 5,396,406 |
Ventas, Inc. | 765,946 | | 51,509,869 |
Washington (REIT) (SBI) | 44,700 | | 1,193,490 |
Western Asset Mortgage Capital Corp. | 163,100 | | 3,330,502 |
Weyerhaeuser Co. | 272,429 | | 6,361,217 |
Whitestone REIT Class B | 379,067 | | 5,174,265 |
| | 539,421,119 |
Real Estate Management & Development - 0.4% |
Brookfield Asset Management, Inc. Class A | 171,900 | | 5,831,418 |
Kennedy-Wilson Holdings, Inc. | 291,209 | | 3,983,739 |
| | 9,815,157 |
TOTAL FINANCIALS | | 552,412,651 |
HEALTH CARE - 1.1% |
Health Care Providers & Services - 1.1% |
Brookdale Senior Living, Inc. (a) | 828,300 | | 13,633,818 |
Capital Senior Living Corp. (a) | 852,950 | | 9,587,158 |
Emeritus Corp. (a) | 356,493 | | 6,042,556 |
| | 29,263,532 |
Common Stocks - continued |
| Shares | | Value |
TELECOMMUNICATION SERVICES - 0.2% |
Wireless Telecommunication Services - 0.2% |
SBA Communications Corp. Class A (a) | 101,900 | | $ 6,018,214 |
TOTAL COMMON STOCKS (Cost $502,122,859) |
620,028,477
|
Preferred Stocks - 14.7% |
| | | |
Convertible Preferred Stocks - 1.4% |
FINANCIALS - 1.4% |
Real Estate Investment Trusts - 1.4% |
Alexandria Real Estate Equities, Inc. Series D 7.00% | 95,000 | | 2,517,500 |
CommonWealth REIT 6.50% | 396,216 | | 9,449,752 |
Excel Trust, Inc. 7.00% (h) | 248,200 | | 5,924,038 |
Health Care REIT, Inc. Series I, 6.50% | 46,800 | | 2,652,975 |
Lexington Corporate Properties Trust Series C, 6.50% | 350,566 | | 16,578,266 |
Ramco-Gershenson Properties Trust (SBI) Series D, 7.25% | 40,000 | | 2,052,000 |
| | 39,174,531 |
Nonconvertible Preferred Stocks - 13.3% |
CONSUMER DISCRETIONARY - 0.0% |
Household Durables - 0.0% |
M/I Homes, Inc. Series A, 9.75% (a) | 36,700 | | 633,075 |
FINANCIALS - 13.3% |
Diversified Financial Services - 0.2% |
DRA CRT Acquisition Corp. Series A, 8.50% | 25,000 | | 425,000 |
Red Lion Hotels Capital Trust 9.50% | 163,225 | | 4,245,482 |
| | 4,670,482 |
Real Estate Investment Trusts - 12.4% |
American Capital Agency Corp. 8.00% | 200,000 | | 5,270,000 |
American Home Mortgage Investment Corp.: | | | |
Series A, 9.375% (a) | 120,300 | | 1,203 |
Series B, 9.25% (a) | 124,100 | | 124 |
Annaly Capital Management, Inc.: | | | |
Series A, 7.875% | 134,900 | | 3,616,669 |
Series C, 7.625% | 77,837 | | 2,000,411 |
Anworth Mortgage Asset Corp. Series A, 8.625% | 309,630 | | 8,112,306 |
Apollo Commercial Real Estate Finance, Inc. Series A, 8.625% (a) | 120,977 | | 3,039,547 |
Ashford Hospitality Trust, Inc. Series E, 9.00% | 85,751 | | 2,288,694 |
Preferred Stocks - continued |
| Shares | | Value |
Nonconvertible Preferred Stocks - continued |
FINANCIALS - continued |
Real Estate Investment Trusts - continued |
Brandywine Realty Trust Series D, 7.375% | 34,596 | | $ 888,079 |
Campus Crest Communities, Inc. Series A, 8.00% | 248,431 | | 6,608,265 |
CapLease, Inc.: | | | |
Series A, 8.125% | 132,510 | | 3,336,602 |
Series B, 8.375% | 320,000 | | 8,323,200 |
CBL & Associates Properties, Inc.: | | | |
(depositary shares) Series C, 7.75% | 147,962 | | 3,762,674 |
7.375% | 274,876 | | 7,006,589 |
Cedar Shopping Centers, Inc. 8.875% | 274,022 | | 7,050,586 |
CenterPoint Properties Trust Series D, 5.377% | 3,575 | | 2,162,875 |
Chesapeake Lodging Trust Series A, 7.75% (a) | 229,017 | | 5,796,420 |
Colony Financial, Inc. Series A, 8.50% | 282,171 | | 7,195,361 |
CommonWealth REIT 7.50% | 93,300 | | 2,035,806 |
Corporate Office Properties Trust: | | | |
Series H, 7.50% | 5,000 | | 126,800 |
Series L, 7.375% (a) | 80,000 | | 2,034,400 |
Cousins Properties, Inc. Series A, 7.75% | 205,970 | | 5,180,146 |
CubeSmart Series A, 7.75% | 40,000 | | 1,064,800 |
Cys Investments, Inc. Series A, 7.75% (a) | 117,824 | | 2,945,600 |
DDR Corp.: | | | |
Series I, 7.50% | 24,684 | | 621,049 |
Series J, 6.50% (a)(i) | 113,300 | | 2,809,840 |
Digital Realty Trust, Inc.: | | | |
Series E, 7.00% | 40,000 | | 1,067,600 |
Series F, 6.625% | 40,000 | | 1,050,000 |
Duke Realty LP: | | | |
8.375% | 128,517 | | 3,388,993 |
Series L, 6.60% | 10,666 | | 271,770 |
Dynex Capital, Inc. Series A, 8.50% (a) | 362,932 | | 9,000,714 |
Equity Lifestyle Properties, Inc. 8.034% | 1,075,325 | | 27,420,788 |
Essex Property Trust, Inc. Series H, 7.125% | 40,000 | | 1,072,800 |
Excel Trust, Inc. Series B, 8.125% | 400,000 | | 10,380,000 |
First Potomac Realty Trust 7.75% | 395,296 | | 10,250,025 |
Gladstone Commercial Corp. Series C, 7.125% | 232,238 | | 5,956,905 |
Glimcher Realty Trust: | | | |
Series F, 8.75% | 18,745 | | 475,917 |
Series G, 8.125% | 221,111 | | 5,576,419 |
Health Care REIT, Inc. Series J, 6.50% | 20,000 | | 538,800 |
Hersha Hospitality Trust Series B, 8.00% | 162,538 | | 4,214,610 |
Preferred Stocks - continued |
| Shares | | Value |
Nonconvertible Preferred Stocks - continued |
FINANCIALS - continued |
Real Estate Investment Trusts - continued |
HomeBanc Mortgage Corp. Series A (a) | 104,685 | | $ 1 |
Hospitality Properties Trust: | | | |
Series C, 7.00% | 58,500 | | 1,486,485 |
Series D, 7.125% | 40,800 | | 1,098,744 |
Hudson Pacific Properties, Inc. 8.375% | 303,800 | | 8,047,662 |
Inland Real Estate Corp. Series A, 8.125% | 423,500 | | 10,939,005 |
Invesco Mortgage Capital, Inc. Series A, | 113,342 | | 2,833,550 |
Investors Real Estate Trust Series B, 7.95% (a) | 126,572 | | 3,164,300 |
Kilroy Realty Corp. Series G, 6.875% | 40,000 | | 1,052,000 |
Kimco Realty Corp. Series G, 7.75% | 348,026 | | 8,850,301 |
Kite Realty Group Trust 8.25% | 96,100 | | 2,525,508 |
LaSalle Hotel Properties: | | | |
Series G, 7.25% | 114,485 | | 2,918,223 |
Series H, 7.50% | 126,308 | | 3,356,004 |
LBA Realty Fund II: | | | |
Series A, 8.75% (a) | 69,000 | | 2,622,000 |
Series B, 7.625% (a) | 31,240 | | 593,560 |
Lexington Realty Trust 7.55% | 23,800 | | 599,998 |
MFA Financial, Inc.: | | | |
8.00% | 529,991 | | 13,541,270 |
Series A, 8.50% | 485,381 | | 12,639,321 |
Monmouth Real Estate Investment Corp.: | | | |
7.625% | 80,000 | | 2,081,600 |
Series B, 7.875% | 95,000 | | 2,541,250 |
National Retail Properties, Inc. Series D, 6.625% | 62,437 | | 1,642,093 |
Newcastle Investment Corp. Series B, 9.75% | 34,530 | | 900,542 |
Parkway Properties, Inc. Series D, 8.00% | 306,382 | | 7,736,146 |
Pebblebrook Hotel Trust: | | | |
Series A, 7.875% | 372,000 | | 9,727,800 |
Series B, 8.00% | 185,085 | | 4,893,647 |
Prologis, Inc. Series Q, 8.54% | 94,446 | | 5,832,041 |
PS Business Parks, Inc.: | | | |
6.875% | 50,000 | | 1,349,500 |
Series P, 6.70% | 36,000 | | 912,240 |
Regency Centers Corp. Series 6, 6.625% | 62,261 | | 1,653,652 |
Saul Centers, Inc.: | | | |
8.00% | 93,700 | | 2,404,342 |
Series B (depositary shares) 9.00% | 118,550 | | 3,094,155 |
Stag Industrial, Inc. Series A, 9.00% | 280,000 | | 7,635,600 |
Preferred Stocks - continued |
| Shares | | Value |
Nonconvertible Preferred Stocks - continued |
FINANCIALS - continued |
Real Estate Investment Trusts - continued |
Summit Hotel Properties, Inc. Series A, 9.25% | 138,340 | | $ 3,733,797 |
Sunstone Hotel Investors, Inc.: | | | |
Series A, 8.00% | 366,039 | | 9,315,693 |
Series D, 8.00% | 60,362 | | 1,567,601 |
Terreno Realty Corp. Series A 7.75% | 165,690 | | 4,263,204 |
UMH Properties, Inc. Series A, 8.25% | 330,000 | | 8,738,400 |
Vornado Realty Trust 6.75% | 20,000 | | 511,000 |
Weingarten Realty Investors (SBI) Series F, 6.50% | 56,230 | | 1,420,370 |
Winthrop Realty Trust Series D, 9.25% | 65,000 | | 1,730,950 |
| | 333,896,942 |
Real Estate Management & Development - 0.7% |
Forest City Enterprises, Inc. 7.375% | 657,000 | | 15,623,460 |
Vornado Realty LP 7.875% | 54,682 | | 1,540,939 |
| | 17,164,399 |
TOTAL FINANCIALS | | 355,731,823 |
TOTAL NONCONVERTIBLE PREFERRED STOCKS | | 356,364,898 |
TOTAL PREFERRED STOCKS (Cost $385,286,514) |
395,539,429
|
Corporate Bonds - 25.8% |
| Principal Amount (e) | | |
Convertible Bonds - 2.6% |
CONSUMER DISCRETIONARY - 0.1% |
Hotels, Restaurants & Leisure - 0.1% |
Morgans Hotel Group Co. 2.375% 10/15/14 | | $ 4,510,000 | | 3,963,163 |
FINANCIALS - 2.5% |
Real Estate Investment Trusts - 2.1% |
Annaly Capital Management, Inc.: | | | | |
4% 2/15/15 | | 1,000,000 | | 1,268,750 |
5% 5/15/15 | | 34,396,000 | | 34,524,985 |
CapLease, Inc. 7.5% 10/1/27 (h) | | 5,180,000 | | 5,186,475 |
Northstar Realty Finance LP 8.875% 6/15/32 (h) | | 11,500,000 | | 11,873,750 |
Corporate Bonds - continued |
| Principal Amount (e) | | Value |
Convertible Bonds - continued |
FINANCIALS - continued |
Real Estate Investment Trusts - continued |
ProLogis LP: | | | | |
1.875% 11/15/37 | | $ 2,450,000 | | $ 2,443,875 |
2.625% 5/15/38 | | 1,500,000 | | 1,503,825 |
| | 56,801,660 |
Real Estate Management & Development - 0.4% |
Corporate Office Properties LP 4.25% 4/15/30 (h) | | 9,460,000 | | 9,318,100 |
Grubb & Ellis Co. 7.95% 5/1/15 (d)(h) | | 5,500,000 | | 27,500 |
| | 9,345,600 |
TOTAL FINANCIALS | | 66,147,260 |
TOTAL CONVERTIBLE BONDS | | 70,110,423 |
Nonconvertible Bonds - 23.2% |
CONSUMER DISCRETIONARY - 8.1% |
Hotels, Restaurants & Leisure - 0.8% |
CityCenter Holdings LLC/CityCenter Finance Corp.: | | | | |
7.625% 1/15/16 | | 1,945,000 | | 2,047,113 |
7.625% 1/15/16 (h) | | 1,560,000 | | 1,634,100 |
FelCor Lodging LP 6.75% 6/1/19 | | 5,875,000 | | 6,212,813 |
GWR Operating Partnership LLP/Great Wolf Finance Corp. 10.875% 4/1/17 | | 1,700,000 | | 1,925,250 |
Times Square Hotel Trust 8.528% 8/1/26 (h) | | 9,054,703 | | 10,370,959 |
| | 22,190,235 |
Household Durables - 6.7% |
D.R. Horton, Inc. 4.75% 5/15/17 | | 2,000,000 | | 2,090,000 |
KB Home: | | | | |
5.875% 1/15/15 | | 7,000,000 | | 7,070,000 |
6.25% 6/15/15 | | 10,000,000 | | 10,150,000 |
7.25% 6/15/18 | | 7,420,000 | | 7,494,200 |
8% 3/15/20 | | 8,465,000 | | 8,845,925 |
9.1% 9/15/17 | | 17,595,000 | | 19,090,575 |
Lennar Corp.: | | | | |
5.5% 9/1/14 | | 1,000,000 | | 1,048,750 |
5.6% 5/31/15 | | 6,000,000 | | 6,390,000 |
6.5% 4/15/16 | | 4,000,000 | | 4,270,000 |
6.95% 6/1/18 | | 14,280,000 | | 15,636,600 |
Corporate Bonds - continued |
| Principal Amount (e) | | Value |
Nonconvertible Bonds - continued |
CONSUMER DISCRETIONARY - continued |
Household Durables - continued |
M/I Homes, Inc. 8.625% 11/15/18 | | $ 26,055,000 | | $ 27,748,575 |
Meritage Homes Corp.: | | | | |
7% 4/1/22 (h) | | 7,525,000 | | 7,844,813 |
7.15% 4/15/20 | | 7,060,000 | | 7,413,000 |
Ryland Group, Inc.: | | | | |
6.625% 5/1/20 | | 1,555,000 | | 1,632,750 |
8.4% 5/15/17 | | 5,420,000 | | 6,233,000 |
Standard Pacific Corp.: | | | | |
7% 8/15/15 | | 4,000,000 | | 4,080,000 |
8.375% 5/15/18 | | 28,983,000 | | 32,205,910 |
10.75% 9/15/16 | | 8,415,000 | | 10,119,038 |
Toll Brothers Finance Corp. 5.875% 2/15/22 | | 1,550,000 | | 1,662,375 |
| | 181,025,511 |
Multiline Retail - 0.6% |
JC Penney Corp., Inc.: | | | | |
5.65% 6/1/20 | | 4,720,000 | | 3,958,900 |
5.75% 2/15/18 | | 2,845,000 | | 2,485,819 |
Sears Holdings Corp. 6.625% 10/15/18 | | 9,820,000 | | 8,813,450 |
| | 15,258,169 |
TOTAL CONSUMER DISCRETIONARY | | 218,473,915 |
CONSUMER STAPLES - 0.2% |
Food & Staples Retailing - 0.2% |
Ahold Lease Series 2001 A1 pass thru trust certificates 7.82% 1/2/20 | | 1,044,738 | | 1,196,225 |
C&S Group Enterprises LLC 8.375% 5/1/17 (h) | | 3,960,000 | | 4,078,800 |
| | 5,275,025 |
FINANCIALS - 13.6% |
Diversified Financial Services - 0.6% |
Icahn Enterprises LP/Icahn Enterprises Finance Corp.: | | | | |
7.75% 1/15/16 | | 10,820,000 | | 11,374,525 |
8% 1/15/18 | | 3,070,000 | | 3,261,875 |
8% 1/15/18 (h) | | 2,170,000 | | 2,300,200 |
| | 16,936,600 |
Real Estate Investment Trusts - 8.7% |
Camden Property Trust 5% 6/15/15 | | 1,100,000 | | 1,190,189 |
Corporate Bonds - continued |
| Principal Amount (e) | | Value |
Nonconvertible Bonds - continued |
FINANCIALS - continued |
Real Estate Investment Trusts - continued |
Commercial Net Lease Realty, Inc.: | | | | |
6.15% 12/15/15 | | $ 2,526,000 | | $ 2,808,867 |
6.25% 6/15/14 | | 5,005,000 | | 5,310,045 |
CubeSmart LP 4.8% 7/15/22 | | 2,000,000 | | 2,115,008 |
Developers Diversified Realty Corp.: | | | | |
5.5% 5/1/15 | | 4,000,000 | | 4,278,824 |
7.5% 4/1/17 | | 6,000,000 | | 6,906,234 |
7.5% 7/15/18 | | 8,756,000 | | 10,192,536 |
7.875% 9/1/20 | | 4,637,000 | | 5,730,808 |
9.625% 3/15/16 | | 3,836,000 | | 4,662,236 |
Duke Realty LP 6.25% 5/15/13 | | 750,000 | | 775,430 |
Equity One, Inc.: | | | | |
5.375% 10/15/15 | | 3,500,000 | | 3,715,376 |
6.25% 12/15/14 | | 4,081,000 | | 4,413,855 |
6.25% 1/15/17 | | 3,000,000 | | 3,338,346 |
Health Care Property Investors, Inc.: | | | | |
6% 6/15/14 | | 2,340,000 | | 2,503,051 |
6% 3/1/15 | | 1,000,000 | | 1,076,953 |
7.072% 6/8/15 | | 1,500,000 | | 1,672,376 |
Health Care REIT, Inc.: | | | | |
4.125% 4/1/19 | | 2,000,000 | | 2,080,408 |
6% 11/15/13 | | 1,000,000 | | 1,058,028 |
6.2% 6/1/16 | | 750,000 | | 848,000 |
Healthcare Realty Trust, Inc.: | | | | |
5.125% 4/1/14 | | 5,084,000 | | 5,310,746 |
5.75% 1/15/21 | | 2,000,000 | | 2,170,262 |
6.5% 1/17/17 | | 2,875,000 | | 3,229,051 |
Highwoods/Forsyth LP 5.85% 3/15/17 | | 2,800,000 | | 3,041,198 |
HMB Capital Trust V 4.0679% 12/15/36 (d)(h)(j) | | 2,530,000 | | 0 |
Hospitality Properties Trust: | | | | |
5.625% 3/15/17 | | 915,000 | | 978,621 |
6.75% 2/15/13 | | 1,765,000 | | 1,768,756 |
7.875% 8/15/14 | | 1,000,000 | | 1,080,051 |
HRPT Properties Trust: | | | | |
5.75% 11/1/15 | | 4,826,000 | | 5,089,369 |
6.25% 8/15/16 | | 7,500,000 | | 8,058,188 |
6.25% 6/15/17 | | 1,055,000 | | 1,147,254 |
6.65% 1/15/18 | | 3,000,000 | | 3,276,063 |
Corporate Bonds - continued |
| Principal Amount (e) | | Value |
Nonconvertible Bonds - continued |
FINANCIALS - continued |
Real Estate Investment Trusts - continued |
iStar Financial, Inc.: | | | | |
5.85% 3/15/17 | | $ 3,587,000 | | $ 3,264,170 |
5.875% 3/15/16 | | 34,260,000 | | 31,861,800 |
5.95% 10/15/13 | | 7,330,000 | | 7,073,450 |
6.05% 4/15/15 | | 4,725,000 | | 4,488,750 |
6.5% 12/15/13 | | 6,880,000 | | 6,759,600 |
8.625% 6/1/13 | | 6,155,000 | | 6,216,550 |
9% 6/1/17 (h) | | 13,000,000 | | 13,195,000 |
MPT Operating Partnership LP/MPT Finance Corp.: | | | | |
6.375% 2/15/22 | | 3,110,000 | | 3,218,850 |
6.875% 5/1/21 | | 2,000,000 | | 2,130,000 |
Nationwide Health Properties, Inc. 6.25% 2/1/13 | | 1,000,000 | | 1,025,376 |
Omega Healthcare Investors, Inc.: | | | | |
6.75% 10/15/22 | | 2,115,000 | | 2,326,500 |
7.5% 2/15/20 | | 1,000,000 | | 1,120,000 |
Pan Pacific Retail Properties, Inc. 5.95% 6/1/14 | | 1,750,000 | | 1,851,689 |
Potlatch Corp. 7.5% 11/1/19 | | 1,000,000 | | 1,060,000 |
ProLogis LP: | | | | |
6.625% 5/15/18 | | 6,480,000 | | 7,627,569 |
7.625% 7/1/17 | | 4,690,000 | | 5,544,879 |
Reckson Operating Partnership LP/SL Green Realty Corp./SL Green Operating Partnership LP 7.75% 3/15/20 | | 2,000,000 | | 2,325,200 |
Senior Housing Properties Trust: | | | | |
4.3% 1/15/16 | | 5,000,000 | | 5,130,325 |
6.75% 4/15/20 | | 11,000,000 | | 12,150,182 |
6.75% 12/15/21 | | 8,000,000 | | 8,915,800 |
United Dominion Realty Trust, Inc.: | | | | |
5.13% 1/15/14 | | 500,000 | | 521,752 |
5.25% 1/15/15 | | 1,000,000 | | 1,073,339 |
5.25% 1/15/16 | | 4,000,000 | | 4,320,060 |
| | 233,026,970 |
Real Estate Management & Development - 4.2% |
AMB Property LP 5.9% 8/15/13 | | 400,000 | | 415,579 |
BioMed Realty LP 3.85% 4/15/16 | | 2,000,000 | | 2,083,924 |
Brandywine Operating Partnership LP: | | | | |
5.4% 11/1/14 | | 6,750,000 | | 7,080,912 |
7.5% 5/15/15 | | 1,000,000 | | 1,122,373 |
Corporate Bonds - continued |
| Principal Amount (e) | | Value |
Nonconvertible Bonds - continued |
FINANCIALS - continued |
Real Estate Management & Development - continued |
CB Richard Ellis Services, Inc.: | | | | |
6.625% 10/15/20 | | $ 1,205,000 | | $ 1,293,929 |
11.625% 6/15/17 | | 1,500,000 | | 1,695,000 |
Colonial Properties Trust: | | | | |
6.15% 4/15/13 | | 1,500,000 | | 1,535,372 |
6.25% 6/15/14 | | 3,094,000 | | 3,279,779 |
6.875% 8/15/12 | | 1,000,000 | | 1,001,441 |
Colonial Realty LP 6.05% 9/1/16 | | 2,500,000 | | 2,706,523 |
Forest City Enterprises, Inc.: | | | | |
6.5% 2/1/17 | | 17,120,000 | | 16,478,000 |
7.625% 6/1/15 | | 34,050,000 | | 33,752,063 |
Host Hotels & Resorts LP: | | | | |
5.25% 3/15/22 (h) | | 2,000,000 | | 2,117,500 |
5.875% 6/15/19 | | 2,725,000 | | 2,997,500 |
9% 5/15/17 | | 750,000 | | 826,875 |
Kennedy-Wilson, Inc. 8.75% 4/1/19 | | 8,785,000 | | 9,312,100 |
Post Apartment Homes LP 6.3% 6/1/13 | | 2,000,000 | | 2,063,184 |
Realogy Corp.: | | | | |
7.875% 2/15/19 (h) | | 7,085,000 | | 7,138,138 |
9% 1/15/20 (h) | | 1,920,000 | | 2,011,200 |
Regency Centers LP: | | | | |
5.25% 8/1/15 | | 4,509,000 | | 4,859,191 |
5.875% 6/15/17 | | 400,000 | | 458,700 |
Toys 'R' Us Property Co. I LLC 10.75% 7/15/17 | | 2,490,000 | | 2,739,000 |
Ventas Realty LP 4% 4/30/19 | | 2,262,000 | | 2,411,407 |
Wells Operating Partnership II LP 5.875% 4/1/18 | | 3,000,000 | | 3,158,667 |
| | 112,538,357 |
Thrifts & Mortgage Finance - 0.1% |
Wrightwood Capital LLC 1.9% 4/20/20 (d) | | 4,349,567 | | 2,218,279 |
TOTAL FINANCIALS | | 364,720,206 |
HEALTH CARE - 1.3% |
Health Care Equipment & Supplies - 0.4% |
Aviv Healthcare Properties LP/Aviv Healthcare Capital Corp. 7.75% 2/15/19 | | 10,410,000 | | 10,800,375 |
Corporate Bonds - continued |
| Principal Amount (e) | | Value |
Nonconvertible Bonds - continued |
HEALTH CARE - continued |
Health Care Providers & Services - 0.9% |
Sabra Health Care LP/Sabra Capital Corp.: | | | | |
8.125% 11/1/18 | | $ 20,545,000 | | $ 22,188,600 |
8.125% 11/1/18 (h) | | 1,960,000 | | 2,111,900 |
| | 24,300,500 |
TOTAL HEALTH CARE | | 35,100,875 |
TOTAL NONCONVERTIBLE BONDS | | 623,570,021 |
TOTAL CORPORATE BONDS (Cost $657,449,686) |
693,680,444
|
Asset-Backed Securities - 4.5% |
|
Anthracite CDO I Ltd. Series 2002-CIBA Class B, 6.633% 5/24/37 (h) | | 1,384,000 | | 1,384,830 |
Anthracite CDO III Ltd./Anthracite CDO III Corp. Series 2004-1A Class A, 0.6068% 3/23/19 (h)(j) | | 280,455 | | 265,731 |
Capital Trust RE CDO Ltd. Series 2005-1A Class D, 1.7468% 3/20/50 (h)(j) | | 2,250,000 | | 157,500 |
Capital Trust RE CDO Ltd./Capital Trust RE CDO Corp. Series 2005-3A Class A2, 5.16% 6/25/35 (h) | | 4,260,637 | | 4,298,131 |
CapitalSource Real Estate Loan Trust Series 2006-1A Class A2A, 0.7076% 1/20/37 (h)(j) | | 1,157,230 | | 1,032,110 |
CapLease CDO Ltd. Series 2005-1A Class A, 4.926% 1/29/40 (h) | | 1,167,274 | | 1,015,528 |
CBRE Realty Finance CDO LLC Series 2007-1A Class A1, 0.7096% 4/7/52 (h)(j) | | 12,909,377 | | 9,274,613 |
Conseco Finance Securitizations Corp. Series 2002-2 Class M2, 9.163% 3/1/33 | | 500,000 | | 278,365 |
Crest Clarendon Street Ltd./Crest Clarendon Corp. Series 2002-1A: | | | | |
Class B1, 6.065% 12/28/35 (h) | | 1,570,000 | | 1,536,088 |
Class B2, 1.8106% 12/28/35 (h)(j) | | 1,575,000 | | 1,433,250 |
Class D, 9% 12/28/35 (h) | | 500,000 | | 96,600 |
Crest Dartmouth Street Ltd./Crest Dartmouth Street Corp. Series 2003-1A: | | | | |
Class B1, 1.9606% 6/28/38 (h)(j) | | 1,230,000 | | 1,174,650 |
Class D, 9% 6/28/38 (h) | | 1,012,573 | | 708,801 |
Asset-Backed Securities - continued |
| Principal Amount (e) | | Value |
Crest Ltd. Series 2002-IGA Class B, 1.7971% 7/28/35 (h)(j) | | $ 242,197 | | $ 242,197 |
Deutsche Financial Capital Securitization LLC Series 1997-I Class M, 7.275% 9/15/27 | | 9,500,000 | | 8,913,014 |
Fairfield Street Solar Corp. Series 2004-1A Class E1, 3.8319% 11/28/39 (h)(j) | | 566,085 | | 16,983 |
Green Tree Financial Corp.: | | | | |
Series 1996-4 Class M1, 7.75% 6/15/27 | | 1,788,179 | | 1,647,563 |
Series 1997-3 Class M1, 7.53% 3/15/28 | | 7,455,394 | | 4,911,043 |
GSR Mortgage Loan Trust Series 2005-HE3 Class B3, 2.7462% 6/25/35 (j)(l) | | 1,259,000 | | 32,633 |
Guggenheim Structured Real Estate Funding Ltd./Guggenheim Structured Real Estate Funding LLC Series 2005-2A: | | | | |
Class D, 1.7962% 8/26/30 (h)(j) | | 735,000 | | 606,375 |
Class E, 2.2462% 8/26/30 (h)(j) | | 1,517,957 | | 758,979 |
JPMorgan Chase Commercial Mortgage Securities Corp. Series 2009-IWST Class C, 7.4453% 12/5/27 (h) | | 3,000,000 | | 3,529,521 |
Lehman ABS Manufactured Housing Contract Trust Series 2001-B Class M2, 7.17% 4/15/40 | | 1,174,019 | | 481,734 |
Merit Securities Corp. Series 13 Class M1, 7.9015% 12/28/33 (j) | | 1,923,000 | | 1,819,939 |
N-Star Real Estate CDO Ltd. Series 1A Class C1B, 7.696% 8/28/38 (h) | | 899,989 | | 719,991 |
Newcastle Investment Trust Series 2011-MH1 Class A, 2.45% 12/10/33 (h) | | 3,391,764 | | 3,401,868 |
Prima Capital CDO Ltd./Prima Capital CDO Corp. Series 2005-1A Class D, 5.194% 7/24/39 (h) | | 2,950,302 | | 2,950,302 |
Prima Capital Ltd. Series 2006-CR1A Class A2, 5.533% 12/28/48 (h) | | 9,370,000 | | 9,182,600 |
Taberna Preferred Funding III Ltd. Series 2005-3A Class D, 3.1159% 2/5/36 (h)(j) | | 3,582,607 | | 358 |
Wachovia Ltd./Wachovia LLC: | | | | |
Series 2006-1 Class 1ML, 5.9676% 9/25/26 (h)(j) | | 2,000,000 | | 1,000,000 |
Series 2006-1A: | | | | |
Class A1A, 0.7276% 9/25/26 (h)(j) | | 19,445,048 | | 17,500,543 |
Class A1B, 0.7976% 9/25/26 (h)(j) | | 22,506,000 | | 18,792,510 |
Class A2A, 0.6876% 9/25/26 (h)(j) | | 6,083,741 | | 5,901,229 |
Class A2B, 0.7776% 9/25/26 (h)(j) | | 1,550,000 | | 1,367,875 |
Class B, 0.8276% 9/25/26 (h)(j) | | 890,000 | | 725,350 |
Class C 0.9976% 9/25/26 (h)(j) | | 3,830,000 | | 3,044,850 |
Class G, 1.8176% 9/25/26 (h)(j) | | 1,270,000 | | 916,051 |
Asset-Backed Securities - continued |
| Principal Amount (e) | | Value |
Wrightwood Capital Real Estate CDO Ltd. Series 2005-1A: | | | | |
Class A1, 0.7869% 11/21/40 (h)(j) | | $ 10,319,967 | | $ 8,565,573 |
Class F, 2.4169% 11/21/40 (h)(j) | | 250,000 | | 42,500 |
TOTAL ASSET-BACKED SECURITIES (Cost $119,902,454) |
119,727,778
|
Collateralized Mortgage Obligations - 0.7% |
|
Private Sponsor - 0.7% |
COMM pass-thru certificates Series 2007-FL14 Class AJ, 0.4288% 6/15/22 (h)(j) | | 1,898,329 | | 1,783,161 |
Countrywide Home Loans, Inc.: | | | | |
Series 2002-38 Class B3, 5% 2/25/18 (h) | | 63,646 | | 19,547 |
Series 2002-R2 Class 2B3, 3.7901% 7/25/33 (h)(j) | | 209,727 | | 99,715 |
Series 2003-40 Class B3, 4.5% 10/25/18 (h) | | 102,159 | | 65,408 |
Series 2003-R3: | | | | |
Class B2, 5.5% 11/25/33 (h) | | 1,403,239 | | 250,706 |
Class B3, 5.5% 11/25/33 | | 154,512 | | 8,302 |
Series 2004-R1 Class 1B3, 5.5% 11/25/34 (h)(j) | | 118,254 | | 5,405 |
FREMF Mortgage Trust: | | | | |
Series 2010 K7 Class B, 5.6186% 4/25/20 (h)(j) | | 3,200,000 | | 3,456,806 |
Series 2010-K6 Class B, 5.5326% 12/25/46 (h)(j) | | 4,500,000 | | 4,833,446 |
Merrill Lynch Mortgage Investors Trust Series 1998-C3 Class F, 6% 12/15/30 (h) | | 7,120,000 | | 7,166,529 |
RESI Finance LP/RESI Finance DE Corp. floater: | | | | |
Series 2003-B Class B9, 12.1958% 7/10/35 (h)(j) | | 323,594 | | 272,693 |
Series 2005-A Class B6, 2.2458% 3/10/37 (h)(j) | | 1,469,617 | | 109,193 |
Series 2005-B Class B6, 1.8458% 6/10/37 (h)(j) | | 855,663 | | 31,488 |
Residential Funding Securities Corp. Series 2002-RM1 Class BI1, 5.5% 12/25/17 (h) | | 44,135 | | 37,954 |
RESIX Finance Ltd. floater: | | | | |
Series 2003-D Class B8, 6.7458% 12/10/35 (h)(j) | | 303,961 | | 154,169 |
Series 2004-A Class B7, 4.4958% 2/10/36 (h)(j) | | 335,511 | | 182,652 |
Series 2004-B Class B7, 4.2458% 2/10/36 (h)(j) | | 406,093 | | 189,645 |
TOTAL PRIVATE SPONSOR | | 18,666,819 |
U.S. Government Agency - 0.0% |
Fannie Mae REMIC Trust: | | | | |
Series 2001-W3 subordinate REMIC pass thru certificates, Class B3, 7% 9/25/41 (l) | | 162,862 | | 86,330 |
Collateralized Mortgage Obligations - continued |
| Principal Amount (e) | | Value |
U.S. Government Agency - continued |
Fannie Mae REMIC Trust: - continued | | | | |
Series 2002-W1 subordinate REMIC pass thru certificates, Class 3B3, 3.2498% 2/25/42 (h)(j) | | $ 101,055 | | $ 56,166 |
Series 2003-W1 subordinate REMIC pass thru certificates, Class B3, 5.75% 12/25/42 (l) | | 237,912 | | 77,294 |
Series 2003-W10 subordinate REMIC pass thru certificates, Class 2B3, 3.3004% 6/25/43 (h)(j) | | 152,272 | | 59,561 |
Series 2003-W4 subordinate REMIC pass thru certificates, Class 2B3, 3.2829% 10/25/42 (h)(j) | | 66,047 | | 34,253 |
TOTAL U.S. GOVERNMENT AGENCY | | 313,604 |
TOTAL COLLATERALIZED MORTGAGE OBLIGATIONS (Cost $20,969,249) |
18,980,423
|
Commercial Mortgage Securities - 20.2% |
|
ACGS Series 2004-1 Class P, 7.4651% 8/1/19 (l) | | 4,936,312 | | 4,789,765 |
Americold LLC Trust Series 2010-ARTA Class D, 7.443% 1/14/29 (h) | | 2,000,000 | | 2,268,936 |
Asset Securitization Corp. Series 1997-D4 Class B2, 7.525% 4/14/29 | | 218,481 | | 223,872 |
Banc of America Commercial Mortgage, Inc.: | | | | |
sequential payer Series 2002-2 Class F, 5.487% 7/11/43 | | 4,185,000 | | 4,218,836 |
Series 2005-1 Class CJ, 5.3652% 11/10/42 (j) | | 3,580,000 | | 3,750,161 |
Series 2005-6 Class AJ, 5.3661% 9/10/47 (j) | | 5,000,000 | | 5,127,560 |
Banc of America Large Loan Trust floater Series 2010-HLTN Class HLTN, 1.992% 11/15/15 (h)(j) | | 118,988,060 | | 113,632,397 |
Banc of America Large Loan, Inc. floater Series 2005-MIB1: | | | | |
Class J, 1.2988% 3/15/22 (h)(j) | | 6,360,000 | | 5,819,826 |
Class K, 2.2488% 3/15/22 (h)(j) | | 4,190,000 | | 2,556,181 |
Bear Stearns Commercial Mortgage Securities, Inc. Series 2006-PW11 Class AJ, 5.6187% 3/11/39 (j) | | 5,700,000 | | 5,442,725 |
Bear Stearns Commercial Mortgage Securities Trust Series 2006-T22 Class B, 5.7126% 4/12/38 (h)(j) | | 2,520,000 | | 2,376,864 |
COMM pass-thru certificates: | | | | |
floater Series 2006-FL12 Class AJ, 0.3788% 12/15/20 (h)(j) | | 8,000,000 | | 7,261,968 |
sequential payer Series 2004-RS1 Class A, 5.648% 3/3/41 (h) | | 6,063,232 | | 6,108,706 |
Commercial Mortgage Securities - continued |
| Principal Amount (e) | | Value |
Commercial Mortgage pass-thru certificates: | | | | |
Series 2005-C6 Class AJ, 5.209% 6/10/44 (j) | | $ 5,000,000 | | $ 5,047,230 |
Series 2011-STRT Class C, 4.755% 12/10/24 (h) | | 2,000,000 | | 2,004,116 |
Series 2012-CR1: | | | | |
Class C, 5.547% 5/15/45 | | 1,000,000 | | 1,001,593 |
Class D, 5.547% 5/15/45 (h) | | 2,050,000 | | 1,606,852 |
Commercial Mortgage Trust pass-thru certificates Series 2012-LC4: | | | | |
Class C, 5.8248% 12/10/44 (j) | | 2,000,000 | | 2,062,884 |
Class D, 5.8248% 12/10/44 (h)(j) | | 8,000,000 | | 6,513,008 |
Communication Mortgage Trust Series 2011-THL: | | | | |
Class E, 5.949% 6/9/28 (h) | | 3,690,000 | | 3,757,014 |
Class F, 4.867% 6/9/28 (h) | | 11,090,000 | | 10,125,991 |
Credit Suisse First Boston Mortgage Securities Corp.: | | | | |
Series 1998-C1 Class F, 6% 5/17/40 (h) | | 2,442,446 | | 2,582,346 |
Series 1998-C2 Class F, 6.75% 11/15/30 (h) | | 3,000,000 | | 3,231,606 |
CRESI Finance Ltd. Partnership floater Series 2006-A Class E, 1.8962% 3/25/17 (h)(j) | | 891,217 | | 757,534 |
CRESIX Finance Ltd. Series 2006-AA: | | | | |
Class F, 4.4462% 3/25/17 (h)(j) | | 3,860,000 | | 3,203,800 |
Class G, 7.2462% 3/25/17 (h)(j) | | 3,272,000 | | 2,617,600 |
DBUBS Mortgage Trust Series 2011-LC1A Class E, 5.7284% 11/10/46 (h)(j) | | 12,490,000 | | 11,152,234 |
Deutsche Mortgage & Asset Receiving Corp. Series 1998-C1 Class J, 6.22% 6/15/31 | | 1,200,000 | | 1,015,564 |
DLJ Commercial Mortgage Corp.: | | | | |
Series 1998-CG1 Class B4, 7.4461% 6/10/31 (h)(j) | | 2,500,000 | | 2,564,625 |
Series 2000-CKP1 Class B3, 7.942% 11/10/33 (j) | | 2,970,000 | | 2,960,624 |
Extended Stay America Trust Series 2010-ESHA Class D, 5.4983% 11/5/27 (h) | | 6,000,000 | | 6,118,683 |
FHMLC Multi-class participation certificates guaranteed: | | | | |
Series K013 Class X3, 2.8846% 1/25/43 (j)(k) | | 14,360,000 | | 2,409,479 |
Series KAIV Class X2, 3.6146% 6/25/46 (j)(k) | | 7,430,000 | | 1,630,649 |
Freddie Mac: | | | | |
Series K011 Class X3, 2.6619% 12/25/43 (j)(k) | | 12,206,096 | | 1,868,936 |
Series K012 Class X3, 2.3657% 1/25/41 (j)(k) | | 21,072,886 | | 2,881,528 |
G-Force LLC sequential payer Series 2005-RRA Class A2, 4.83% 8/22/36 (h) | | 10,985,212 | | 10,710,582 |
GE Capital Commercial Mortgage Corp. Series 2002-1A Class H, 7.3556% 12/10/35 (h)(j) | | 991,000 | | 990,863 |
GMAC Commercial Mortgage Securities, Inc.: | | | | |
Series 1997-C2: | | | | |
Class F, 6.75% 4/15/29 (j) | | 786,432 | | 793,615 |
Commercial Mortgage Securities - continued |
| Principal Amount (e) | | Value |
GMAC Commercial Mortgage Securities, Inc.: - continued | | | | |
Series 1997-C2: | | | | |
Class G, 6.75% 4/15/29 (j) | | $ 1,250,000 | | $ 1,330,310 |
Series 1999-C3 Class J, 6.974% 8/15/36 | | 1,500,000 | | 1,484,156 |
Series 2000-C1 Class K, 7% 3/15/33 | | 224,908 | | 168,944 |
Series 2002-C3 Class D, 5.27% 7/10/39 | | 3,000,000 | | 3,025,728 |
Greenwich Capital Commercial Funding Corp.: | | | | |
sequential payer Series 2003-C1 Class D, 4.29% 7/5/35 (h) | | 2,000,000 | | 2,024,370 |
Series 2002-C1 Class H, 5.903% 1/11/35 (h) | | 880,000 | | 880,664 |
GS Mortgage Securities Corp. II: | | | | |
floater Series 2007-EOP Class L, 5.4585% 3/6/20 (h)(j) | | 1,400,000 | | 1,401,249 |
Series 2010-C1: | | | | |
Class D, 6.1357% 8/10/43 (h)(j) | | 4,000,000 | | 3,868,272 |
Class E, 4% 8/10/43 (h) | | 3,770,000 | | 2,798,392 |
Series 2012-GCJ7: | | | | |
Class C, 5.721% 5/10/45 (j) | | 4,000,000 | | 4,023,707 |
Class D, 5.721% 5/10/45 (h) | | 2,000,000 | | 1,615,022 |
GS Mortgage Securities Corp. Trust Series 2011-ALF Class E, 4.953% 2/10/21 (h) | | 9,185,000 | | 9,152,853 |
GS Mortgage Securities Trust: | | | | |
Series 2011-GC5 Class C, 5.4749% 8/10/44 (h)(j) | | 9,000,000 | | 9,145,854 |
Series 2012-GC6 Class C, 5.8273% 1/10/45 (h)(j) | | 3,600,000 | | 3,690,897 |
JPMorgan Chase Commercial Mortgage Securities Corp.: | | | | |
Series 2001-A: | | | | |
Class G, 6% 10/15/32 (h)(j) | | 2,036,910 | | 2,506 |
Class X, 0.627% 10/15/32 (h)(j)(k) | | 4,808,491 | | 20,025 |
Series 2002-C1 Class E, 6.135% 7/12/37 (h) | | 3,000,000 | | 2,998,143 |
Series 2009-IWST Class D, 7.6935% 12/5/27 (h)(j) | | 8,550,000 | | 9,453,419 |
Series 2010-CNTM Class MZ, 8.5% 8/5/20 (h) | | 9,000,000 | | 9,525,053 |
Series 2010-CNTR: | | | | |
Class D, 6.3899% 8/5/32 (h)(j) | | 4,500,000 | | 4,741,803 |
Class XB, 0.9305% 8/5/32 (h)(k) | | 32,655,000 | | 1,690,837 |
Series 2012-CBX Class C, 5.1909% 6/16/45 (j) | | 4,530,000 | | 4,521,666 |
JPMorgan Chase Commercial Mortgage Securities Trust: | | | | |
Series 2005-LDP5 Class AJ, 5.4825% 12/15/44 (j) | | 3,470,000 | | 3,475,804 |
Series 2011-C5 Class C, 5.4913% 8/15/46 (h)(j) | | 6,525,375 | | 6,534,824 |
JPMorgan Commercial Mortgage Finance Corp. Series 1999-C8: | | | | |
Class G, 6% 7/15/31 (h) | | 938,900 | | 956,183 |
Class H, 6% 7/15/31 (h) | | 1,341,102 | | 471,049 |
Commercial Mortgage Securities - continued |
| Principal Amount (e) | | Value |
LB Commercial Conduit Mortgage Trust Series 1998-C4 Class G, 5.6% 10/15/35 (h) | | $ 2,693,075 | | $ 2,799,279 |
LB-UBS Commercial Mortgage Trust: | | | | |
sequential payer: | | | | |
Series 2004-C2 Class E, 4.487% 3/15/36 | | 2,060,000 | | 2,077,442 |
Series 2005-C3 Class AJ, 4.843% 7/15/40 | | 6,620,000 | | 6,774,061 |
Series 2005-C7 Class AJ, 5.323% 11/15/40 | | 8,000,000 | | 8,211,360 |
Series 2006-C7 Class AM, 5.378% 11/15/38 | | 2,040,000 | | 2,082,862 |
Series 2004-C7 Class E, 4.918% 10/15/36 | | 5,120,000 | | 5,104,778 |
Series 2005-C1 Class E, 4.924% 2/15/40 | | 4,000,000 | | 3,628,624 |
Series 2006-C4: | | | | |
Class AJ, 6.0867% 6/15/38 (j) | | 7,005,000 | | 6,094,119 |
Class AM, 6.0867% 6/15/38 (j) | | 6,700,000 | | 7,138,709 |
Lehman Brothers Floating Rate Commercial Mortgage Trust floater Series 2007-LLFA Class E, 1.1488% 6/15/22 (h)(j) | | 6,230,000 | | 5,270,892 |
Lstar Commercial Mortgage Trust: | | | | |
Series 2011-1 Class D, 5.6245% 6/25/43 (h)(j) | | 4,699,000 | | 4,389,388 |
Series 2011-1 Class B, 5.6245% 6/25/43 (h)(j) | | 6,165,000 | | 6,309,878 |
Merrill Lynch Financial Asset, Inc. Series 2005-CA16: | | | | |
Class F, 4.384% 7/12/37 | CAD | 710,000 | | 528,500 |
Class G, 4.384% 7/12/37 | CAD | 355,000 | | 257,651 |
Class H, 4.384% 7/12/37 | CAD | 236,000 | | 167,031 |
Class J, 4.384% 7/12/37 | CAD | 355,000 | | 245,052 |
Class K, 4.384% 7/12/37 | CAD | 355,000 | | 239,038 |
Class L, 4.384% 7/12/37 | CAD | 236,000 | | 155,032 |
Class M, 4.384% 7/12/37 | CAD | 995,000 | | 552,140 |
Merrill Lynch Mortgage Investors Trust Series 1999-C1 Class G, 6.71% 11/15/31 (h) | | 715,093 | | 393,301 |
Merrill Lynch Mortgage Trust Series 2006-C1 Class AM, 5.8478% 5/12/39 (j) | | 1,200,000 | | 1,312,804 |
Mezz Capital Commercial Mortgage Trust: | | | | |
sequential payer: | | | | |
Series 2004-C1 Class A, 4.836% 1/15/37 (h) | | 4,105,302 | | 3,551,086 |
Series 2004-C2 Class A, 5.318% 10/15/40 (h) | | 9,995,195 | | 7,596,348 |
Series 2004-C1: | | | | |
Class D, 6.988% 1/15/37 (h) | | 750,000 | | 75 |
Class E, 7.983% 1/15/37 (h) | | 1,313,162 | | 131 |
Class IO, 8.9913% 1/15/37 (h)(j)(k) | | 4,287,713 | | 321,578 |
Morgan Stanley Capital I Trust: | | | | |
sequential payer: | | | | |
Series 2012-C4 Class E, 5.71% 3/15/45 (h) | | 4,630,000 | | 3,912,350 |
Series 2004-RR2 Class A2, 5.45% 10/28/33 (h) | | 948,263 | | 950,634 |
Commercial Mortgage Securities - continued |
| Principal Amount (e) | | Value |
Morgan Stanley Capital I Trust: - continued | | | | |
sequential payer: | | | | |
Series 2006-HQ10 Class AM, 5.36% 11/12/41 | | $ 8,200,000 | | $ 8,844,946 |
Series 1997-RR Class F, 7.35% 4/30/39 (h)(j) | | 1,363,287 | | 1,254,224 |
Series 1998-CF1 Class G, 7.35% 7/15/32 (h) | | 2,613,134 | | 1,837,540 |
Series 2005-HQ5 Class B, 5.272% 1/14/42 | | 2,000,000 | | 1,991,842 |
Series 2005-HQ6 Class AJ, 5.073% 8/13/42 (j) | | 2,500,000 | | 2,539,248 |
Series 2006-IQ12 Class AMFX, 5.37% 12/15/43 | | 7,500,000 | | 7,971,398 |
Series 2011-C1 Class C, 5.4216% 9/15/47 (h)(j) | | 3,000,000 | | 3,163,867 |
Series 2011-C2: | | | | |
Class D, 5.4951% 6/15/44 (h)(j) | | 4,610,000 | | 4,325,240 |
Class E, 5.4951% 6/15/44 (h)(j) | | 9,600,000 | | 7,959,360 |
Class F, 5.4951% 6/15/44 (h)(j) | | 4,440,000 | | 3,507,600 |
Class XB, 0.5396% 6/15/44 (h)(j)(k) | | 63,708,222 | | 2,019,551 |
Series 2011-C3 Class D, 5.357% 7/15/49 (h) | | 7,400,000 | | 6,811,892 |
NationsLink Funding Corp. Series 1999-SL Class X, 11/10/30 (j)(k) | | 1,077,337 | | 1,045,017 |
Providence Place Group Ltd. Partnership Series 2000-C1 Class A2, 7.75% 7/20/28 (h) | | 3,641,887 | | 4,299,248 |
RBSCF Trust Series 2010-MB1 Class D, 4.8317% 4/15/24 (h)(j) | | 8,320,000 | | 8,517,999 |
Salomon Brothers Mortgage Securities VII, Inc. Series 2001-MMA: | | | | |
Class E3, 6.5% 2/18/34 (h)(j) | | 3,000,000 | | 3,084,213 |
Class E5, 6.5% 2/18/34 (h)(j) | | 3,000,000 | | 3,004,545 |
TIAA Seasoned Commercial Mortgage Trust sequential payer Series 2007-C4 Class AJ, 5.6201% 8/15/39 (j) | | 2,080,000 | | 2,238,350 |
TimberStar Trust I Series 2006-1 Class F, 7.5296% 10/15/36 (h) | | 10,630,000 | | 10,988,996 |
UBS Commercial Mortgage Trust Series 2007-FL1 Class F, 0.8238% 7/15/24 (h)(j) | | 1,200,000 | | 817,702 |
UBS-Citigroup Commercial Mortgage Trust Series 2011-C1 Class B, 6.0708% 1/10/45 (h)(j) | | 3,000,000 | | 3,460,626 |
Vornado DP LLC Series 2010-VNO Class D, 6.3555% 9/13/28 (h) | | 2,540,000 | | 2,801,610 |
Wachovia Bank Commercial Mortgage Trust: | | | | |
Series 2004-C10 Class E, 4.931% 2/15/41 | | 2,000,000 | | 1,979,378 |
Series 2004-C11: | | | | |
Class D, 5.5668% 1/15/41 (j) | | 5,177,000 | | 4,801,010 |
Class E, 5.6168% 1/15/41 (j) | | 3,785,000 | | 3,261,595 |
Series 2004-C12 Class D, 5.4942% 7/15/41 (j) | | 2,750,000 | | 2,767,531 |
Series 2004-C14 Class B, 5.17% 8/15/41 | | 3,180,000 | | 3,354,261 |
WF-RBS Commercial Mortgage Trust Series 2011-C3: | | | | |
Class C, 5.335% 3/15/44 (h) | | 4,900,000 | | 5,092,149 |
Commercial Mortgage Securities - continued |
| Principal Amount (e) | | Value |
WF-RBS Commercial Mortgage Trust Series 2011-C3: - continued | | | | |
Class D, 5.7221% 3/15/44 (h)(j) | | $ 1,000,000 | | $ 863,933 |
WFDB Commercial Mortgage Trust Series 2011-BXR Class D, 5.914% 7/5/24 (h) | | 4,000,000 | | 4,140,892 |
TOTAL COMMERCIAL MORTGAGE SECURITIES (Cost $522,862,342) |
540,998,389
|
Floating Rate Loans - 4.9% |
|
CONSUMER DISCRETIONARY - 1.7% |
Hotels, Restaurants & Leisure - 1.6% |
Extended Stay America, Inc. term loan 9.75% 11/1/15 | | 9,000,000 | | 9,090,000 |
Hilton Hotels Corp.: | | | | |
term loan 3.999% 11/12/15 (j) | | 15,000,000 | | 13,462,500 |
Tranche B, term loan 11/12/15 (j) | | 12,000,000 | | 11,160,000 |
Tranche E term loan 11/12/15 (j) | | 10,000,000 | | 9,100,000 |
| | 42,812,500 |
Media - 0.1% |
PRIMEDIA, Inc. Tranche B, term loan 7.5% 1/13/18 (j) | | 2,821,500 | | 2,553,458 |
Specialty Retail - 0.0% |
The Pep Boys - Manny, Moe & Jack term loan 2.47% 10/27/13 (j) | | 1,967,498 | | 1,960,120 |
TOTAL CONSUMER DISCRETIONARY | | 47,326,078 |
FINANCIALS - 1.7% |
Diversified Financial Services - 0.2% |
Pilot Travel Centers LLC Tranche B, term loan 4.25% 3/30/18 (j) | | 3,885,475 | | 3,871,098 |
Real Estate Investment Trusts - 0.0% |
iStar Financial, Inc. Tranche A 1LN, term loan 5% 6/28/13 (j) | | 830,748 | | 829,710 |
Real Estate Management & Development - 1.4% |
CB Richard Ellis Group, Inc. Tranche B, term loan 3.4968% 11/9/16 (j) | | 2,984,810 | | 2,973,617 |
CB Richard Ellis Services, Inc. Tranche D, term loan 3.7488% 9/4/19 (j) | | 4,736,081 | | 4,696,629 |
CityCenter term loan 8.75% 7/1/13 (j) | | 4,169,750 | | 4,138,477 |
EOP Operating LP term loan 1.9958% 2/5/13 (j) | | 5,000,000 | | 4,775,000 |
Equity Inns Reality LLC: | | | | |
Tranche A, term loan 9.5% 11/2/12 (j) | | 2,184,917 | | 1,635,653 |
Floating Rate Loans - continued |
| Principal Amount (e) | | Value |
FINANCIALS - continued |
Real Estate Management & Development - continued |
Equity Inns Reality LLC: - continued | | | | |
Tranche B 2LN, term loan 6.55% 11/2/12 (j) | | $ 5,000,000 | | $ 4,475,000 |
Realogy Corp.: | | | | |
Credit-Linked Deposit 3.2458% 10/10/13 (j) | | 518,858 | | 485,132 |
Credit-Linked Deposit 4.4958% 10/10/16 (j) | | 926,858 | | 875,881 |
term loan 4.4988% 10/10/16 (j) | | 10,840,642 | | 10,244,406 |
Tranche 2LN, term loan 13.5% 10/15/17 | | 3,500,000 | | 3,570,000 |
| | 37,869,795 |
Thrifts & Mortgage Finance - 0.1% |
Ocwen Financial Corp. Tranche B, term loan 7% 9/1/16 (j) | | 2,307,756 | | 2,307,756 |
TOTAL FINANCIALS | | 44,878,359 |
HEALTH CARE - 0.6% |
Health Care Providers & Services - 0.6% |
Community Health Systems, Inc. term loan 3.9667% 1/25/17 (j) | | 2,903,247 | | 2,883,447 |
Health Management Associates, Inc. Tranche B, term loan 4.5% 11/18/18 (j) | | 1,990,000 | | 1,990,000 |
Skilled Healthcare Group, Inc. term loan 6.75% 4/9/16 (j) | | 10,379,665 | | 10,379,665 |
| | 15,253,112 |
INDUSTRIALS - 0.4% |
Construction & Engineering - 0.4% |
Drumm Investors LLC Tranche B, term loan 5% 5/4/18 (j) | | 11,877,133 | | 11,431,741 |
TELECOMMUNICATION SERVICES - 0.5% |
Wireless Telecommunication Services - 0.5% |
Crown Castle Operating Co. Tranche B, term loan 4% 1/31/19 (j) | | 8,983,803 | | 8,973,022 |
TowerCo Finance LLC Tranche B, term loan 4.5% 2/2/17 (j) | | 3,632,412 | | 3,636,953 |
| | 12,609,975 |
TOTAL FLOATING RATE LOANS (Cost $132,655,576) |
131,499,265
|
Preferred Securities - 0.0% |
| Principal Amount (e) | | Value |
FINANCIALS - 0.0% |
Diversified Financial Services - 0.0% |
Crest Clarendon Street 2002-1 Ltd. Series 2002-1A Class PS, 12/28/35 (h) | $ 500,000 | | $ 15,000 |
Crest Dartmouth Street 2003 1 Ltd. Series 2003-1A Class PS, 6/28/38 (h) | 1,220,000 | | 122,000 |
Ipswich Street CDO Series 2006-1, 6/27/46 (d)(h) | 1,350,000 | | 0 |
| | 137,000 |
TOTAL PREFERRED SECURITIES (Cost $2,594,645) |
137,000
|
Money Market Funds - 8.0% |
| Shares | | |
Fidelity Cash Central Fund, 0.17% (b) | 187,739,774 | | 187,739,774 |
Fidelity Securities Lending Cash Central Fund, 0.18% (b)(c) | 27,376,007 | | 27,376,007 |
TOTAL MONEY MARKET FUNDS (Cost $215,115,781) |
215,115,781
|
TOTAL INVESTMENT PORTFOLIO - 101.9% (Cost $2,558,959,106) | | 2,735,706,986 |
NET OTHER ASSETS (LIABILITIES) - (1.9)% | | (49,848,102) |
NET ASSETS - 100% | $ 2,685,858,884 |
Currency Abbreviations |
CAD | - | Canadian dollar |
Legend |
(a) Non-income producing |
(b) Affiliated fund that is available only to investment companies and other accounts managed by Fidelity Investments. The rate quoted is the annualized seven-day yield of the fund at period end. A complete unaudited listing of the fund's holdings as of its most recent quarter end is available upon request. In addition, each Fidelity Central Fund's financial statements, which are not covered by the Fund's Report of Independent Registered Public Accounting Firm, are available on the SEC's website or upon request. |
(c) Investment made with cash collateral received from securities on loan. |
(d) Non-income producing - Security is in default. |
(e) Principal amount is stated in United States dollars unless otherwise noted. |
(f) Security or a portion of the security is on loan at period end. |
(g) Affiliated company |
(h) Security exempt from registration under Rule 144A of the Securities Act of 1933. These securities may be resold in transactions exempt from registration, normally to qualified institutional buyers. At the end of the period, the value of these securities amounted to $607,946,631 or 22.6% of net assets. |
(i) Security or a portion of the security purchased on a delayed delivery or when-issued basis. |
(j) Coupon rates for floating and adjustable rate securities reflect the rates in effect at period end. |
(k) Security represents right to receive monthly interest payments on an underlying pool of mortgages or assets. Principal shown is the outstanding par amount of the pool as of the end of the period. |
(l) Restricted securities - Investment in securities not registered under the Securities Act of 1933 (excluding 144A issues). At the end of the period, the value of restricted securities (excluding 144A issues) amounted to $4,986,022 or 0.2% of net assets. |
Additional information on each restricted holding is as follows: |
Security | Acquisition Date | Acquisition Cost |
ACGS Series 2004-1 Class P, 7.4651% 8/1/19 | 2/17/11 | $ 4,780,148 |
Fannie Mae REMIC Trust Series 2001-W3 subordinate REMIC pass thru certificates, Class B3, 7% 9/25/41 | 5/21/03 | $ 141,130 |
Fannie Mae REMIC Trust Series 2003-W1 subordinate REMIC pass thru certificates, Class B3, 5.75% 12/25/42 | 3/25/03 | $ 179,289 |
GSR Mortgage Loan Trust Series 2005-HE3 Class B3, 2.7462% 6/25/35 | 6/3/05 | $ 1,110,697 |
Affiliated Central Funds |
Information regarding fiscal year to date income earned by the Fund from investments in Fidelity Central Funds is as follows: |
Fund | Income earned |
Fidelity Cash Central Fund | $ 227,690 |
Fidelity Securities Lending Cash Central Fund | 73,576 |
Total | $ 301,266 |
Other Affiliated Issuers |
An affiliated company is a company in which the Fund has ownership of at least 5% of the voting securities. Fiscal year to date transactions with companies which are or were affiliates are as follows: |
Affiliate | Value, beginning of period | Purchases | Sales Proceeds | Dividend Income | Value,
end of
period |
AmREIT, Inc. | $ - | $ 2,800,000 | $ - | $ - | $ 2,818,000 |
Total | $ - | $ 2,800,000 | $ - | $ - | $ 2,818,000 |
Other Information |
The following is a summary of the inputs used, as of July 31, 2012, involving the Fund's assets and liabilities carried at fair value. The inputs or methodology used for valuing securities may not be an indication of the risk associated with investing in those securities. For more information on valuation inputs, and their aggregation into the levels used in the tables below, please refer to the Security Valuation section in the accompanying Notes to Financial Statements. |
Valuation Inputs at Reporting Date: |
Description | Total | Level 1 | Level 2 | Level 3 |
Investments in Securities: |
Equities: | | | | |
Consumer Discretionary | $ 32,967,155 | $ 28,850,735 | $ - | $ 4,116,420 |
Financials | 947,319,005 | 889,631,220 | 46,463,582 | 11,224,203 |
Health Care | 29,263,532 | 29,263,532 | - | - |
Telecommunication Services | 6,018,214 | 6,018,214 | - | - |
Corporate Bonds | 693,680,444 | - | 691,462,165 | 2,218,279 |
Asset-Backed Securities | 119,727,778 | - | 83,414,055 | 36,313,723 |
Collateralized Mortgage Obligations | 18,980,423 | - | 17,239,942 | 1,740,481 |
Commercial Mortgage Securities | 540,998,389 | - | 487,014,384 | 53,984,005 |
Floating Rate Loans | 131,499,265 | - | 113,495,788 | 18,003,477 |
Preferred Securities | 137,000 | - | - | 137,000 |
Money Market Funds | 215,115,781 | 215,115,781 | - | - |
Total Investments in Securities: | $ 2,735,706,986 | $ 1,168,879,482 | $ 1,439,089,916 | $ 127,737,588 |
Valuation Inputs at Reporting Date: |
The following is a reconciliation of Investments in Securities for which Level 3 inputs were used in determining value: |
Investments in Securities: | |
Asset-Backed Securities | |
Beginning Balance | $ 79,390,084 |
Total Realized Gain (Loss) | 1,318,781 |
Total Unrealized Gain (Loss) | 4,471,824 |
Cost of Purchases | 183,524 |
Proceeds of Sales | (21,893,868) |
Amortization/Accretion | 1,481,337 |
Transfers in to Level 3 | 3,448,211 |
Transfers out of Level 3 | (32,086,170) |
Ending Balance | $ 36,313,723 |
The change in unrealized gain (loss) for the period attributable to Level 3 securities held at July 31, 2012 | $ 4,749,808 |
Investments in Securities: | |
Commercial Mortgage Securities | |
Beginning Balance | $ 31,940,633 |
Total Realized Gain (Loss) | 292,397 |
Total Unrealized Gain (Loss) | 1,669,669 |
Cost of Purchases | 18,454,173 |
Proceeds of Sales | (14,263,172) |
Amortization/Accretion | 297,301 |
Transfers in to Level 3 | 15,593,004 |
Transfers out of Level 3 | - |
Ending Balance | $ 53,984,005 |
The change in unrealized gain (loss) for the period attributable to Level 3 securities held at July 31, 2012 | $ 1,426,676 |
Other Investments in Securities | |
Beginning Balance | $ 28,158,749 |
Total Realized Gain (Loss) | (1,117,739) |
Total Unrealized Gain (Loss) | 2,178,452 |
Cost of Purchases | 18,084,567 |
Proceeds of Sales | (8,701,192) |
Amortization/Accretion | (23,513) |
Transfers in to Level 3 | 1,620,536 |
Transfers out of Level 3 | (2,760,000) |
Ending Balance | $ 37,439,860 |
The change in unrealized gain (loss) for the period attributable to Level 3 securities held at July 31, 2012 | $ (1,543,927) |
The information used in the above reconciliations represents fiscal year to date activity for any Investments in Securities identified as using Level 3 inputs at either the beginning or the end of the current fiscal period. Transfers in to Level 3 were attributable to a lack of observable market data resulting from decreases in market activity, decreases in liquidity, security restructurings or corporate actions. Transfers out of Level 3 were attributable to observable market data becoming available for those securities. Transfers in or out of Level 3 represent the beginning value of any Security or Instrument where a change in the pricing level occurred from the beginning to the end of the period. The cost of purchases and the proceeds of sales may include securities received or delivered through corporate actions or exchanges. Realized and unrealized gains (losses) disclosed in the reconciliations are included in Net Gain (Loss) on the Fund's Statement of Operations. |
The composition of credit quality ratings as a percentage of net assets is as follows (Unaudited): |
U.S. Government and U.S. Government Agency Obligations | 0.4% |
AAA,AA,A | 8.1% |
BBB | 12.7% |
BB | 5.1% |
B | 13.1% |
CCC,CC,C | 5.4% |
D | 0.3% |
Not Rated | 11.0% |
Equities | 37.8% |
Short-Term Investments and Net Other Assets | 6.1% |
| 100.0% |
We have used ratings from Moody's Investors Service, Inc. Where Moody's® ratings are not available, we have used S&P® ratings. All ratings are as of the date indicated and do not reflect subsequent changes. |
See accompanying notes which are an integral part of the financial statements.
Annual Report
Statement of Assets and Liabilities
| July 31, 2012 |
| | |
Assets | | |
Investment in securities, at value (including securities loaned of $24,897,474) - See accompanying schedule: Unaffiliated issuers (cost $2,341,043,325) | $ 2,517,773,205 | |
Fidelity Central Funds (cost $215,115,781) | 215,115,781 | |
Other affiliated issuers (cost $2,800,000) | 2,818,000 | |
Total Investments (cost $2,558,959,106) | | $ 2,735,706,986 |
Foreign currency held at value (cost $21,986) | | 21,986 |
Receivable for investments sold | | 3,946,789 |
Receivable for fund shares sold | | 15,938,587 |
Dividends receivable | | 1,674,674 |
Interest receivable | | 14,981,277 |
Distributions receivable from Fidelity Central Funds | | 33,415 |
Other receivables | | 6,563 |
Total assets | | 2,772,310,277 |
| | |
Liabilities | | |
Payable to custodian bank | $ 9,145 | |
Payable for investments purchased
Regular delivery | 51,958,020 | |
Delayed delivery | 2,832,500 | |
Payable for fund shares redeemed | 2,288,350 | |
Accrued management fee | 1,214,069 | |
Distribution and service plan fees payable | 73,831 | |
Other affiliated payables | 618,059 | |
Other payables and accrued expenses | 81,412 | |
Collateral on securities loaned, at value | 27,376,007 | |
Total liabilities | | 86,451,393 |
| | |
Net Assets | | $ 2,685,858,884 |
Net Assets consist of: | | |
Paid in capital | | $ 2,450,354,786 |
Undistributed net investment income | | 27,923,018 |
Accumulated undistributed net realized gain (loss) on investments and foreign currency transactions | | 30,806,996 |
Net unrealized appreciation (depreciation) on investments and assets and liabilities in foreign currencies | | 176,774,084 |
Net Assets | | $ 2,685,858,884 |
See accompanying notes which are an integral part of the financial statements.
Annual Report
Financial Statements - continued
Statement of Assets and Liabilities - continued
| July 31, 2012 |
| | |
Calculation of Maximum Offering Price Class A:
Net Asset Value and redemption price per share ($137,351,550 ÷ 12,199,652 shares) | | $ 11.26 |
| | |
Maximum offering price per share (100/96.00 of $11.26) | | $ 11.73 |
Class T:
Net Asset Value and redemption price per share ($26,142,720 ÷ 2,321,952 shares) | | $ 11.26 |
| | |
Maximum offering price per share (100/96.00 of $11.26) | | $ 11.73 |
Class C:
Net Asset Value and offering price per share ($52,780,495 ÷ 4,712,640 shares)A | | $ 11.20 |
| | |
Real Estate Income:
Net Asset Value, offering price and redemption price per share ($2,252,148,798 ÷ 199,406,118 shares) | | $ 11.29 |
| | |
Institutional Class:
Net Asset Value, offering price and redemption price per share ($217,435,321 ÷ 19,282,368 shares) | | $ 11.28 |
A Redemption price per share is equal to net asset value less any applicable contingent deferred sales charge.
See accompanying notes which are an integral part of the financial statements.
Annual Report
Statement of Operations
| Year ended July 31, 2012 |
| | |
Investment Income | | |
Dividends | | $ 39,342,877 |
Interest | | 85,494,070 |
Income from Fidelity Central Funds | | 301,266 |
Total income | | 125,138,213 |
| | |
Expenses | | |
Management fee | $ 11,636,191 | |
Transfer agent fees | 5,685,427 | |
Distribution and service plan fees | 559,397 | |
Accounting and security lending fees | 810,483 | |
Custodian fees and expenses | 32,894 | |
Independent trustees' compensation | 13,278 | |
Registration fees | 180,034 | |
Audit | 157,626 | |
Legal | 5,742 | |
Miscellaneous | 18,376 | |
Total expenses before reductions | 19,099,448 | |
Expense reductions | (42,648) | 19,056,800 |
Net investment income (loss) | | 106,081,413 |
Realized and Unrealized Gain (Loss) Net realized gain (loss) on: | | |
Investment securities: | | |
Unaffiliated issuers | 46,636,084 | |
Foreign currency transactions | (14,625) | |
Total net realized gain (loss) | | 46,621,459 |
Change in net unrealized appreciation (depreciation) on: Investment securities | 99,189,660 | |
Assets and liabilities in foreign currencies | 1,230 | |
Total change in net unrealized appreciation (depreciation) | | 99,190,890 |
Net gain (loss) | | 145,812,349 |
Net increase (decrease) in net assets resulting from operations | | $ 251,893,762 |
See accompanying notes which are an integral part of the financial statements.
Annual Report
Financial Statements - continued
Statement of Changes in Net Assets
| Year ended
July 31,
2012 | Year ended
July 31,
2011 |
Increase (Decrease) in Net Assets | | |
Operations | | |
Net investment income (loss) | $ 106,081,413 | $ 75,045,871 |
Net realized gain (loss) | 46,621,459 | 26,474,317 |
Change in net unrealized appreciation (depreciation) | 99,190,890 | 63,154,318 |
Net increase (decrease) in net assets resulting
from operations | 251,893,762 | 164,674,506 |
Distributions to shareholders from net investment income | (98,117,663) | (66,688,371) |
Distributions to shareholders from net realized gain | (16,498,521) | - |
Total distributions | (114,616,184) | (66,688,371) |
Share transactions - net increase (decrease) | 755,485,569 | 655,640,999 |
Redemption fees | 286,688 | 331,332 |
Total increase (decrease) in net assets | 893,049,835 | 753,958,466 |
| | |
Net Assets | | |
Beginning of period | 1,792,809,049 | 1,038,850,583 |
End of period (including undistributed net investment income of $27,923,018 and undistributed net investment income of $20,642,579, respectively) | $ 2,685,858,884 | $ 1,792,809,049 |
See accompanying notes which are an integral part of the financial statements.
Annual Report
Financial Highlights - Class A
Years ended July 31, | 2012 | 2011 | 2010 H |
Selected Per-Share Data | | | |
Net asset value, beginning of period | $ 10.73 | $ 9.94 | $ 9.95 |
Income from Investment Operations | | | |
Net investment income (loss) E | .52 | .53 | .18 |
Net realized and unrealized gain (loss) | .61 | .76 | (.04) |
Total from investment operations | 1.13 | 1.29 | .14 |
Distributions from net investment income | (.51) | (.50) | (.15) |
Distributions from net realized gain | (.10) | - | - |
Total distributions | (.60) K | (.50) | (.15) |
Redemption fees added to paid in capital E, J | - | - | - |
Net asset value, end of period | $ 11.26 | $ 10.73 | $ 9.94 |
Total Return B,C,D | 11.24% | 13.27% | 1.46% |
Ratios to Average Net Assets F,I | | | |
Expenses before reductions | 1.12% | 1.13% | 1.09% A |
Expenses net of fee waivers, if any | 1.12% | 1.13% | 1.09% A |
Expenses net of all reductions | 1.11% | 1.12% | 1.09% A |
Net investment income (loss) | 4.89% | 5.00% | 6.23% A |
Supplemental Data | | | |
Net assets, end of period (000 omitted) | $ 137,352 | $ 60,283 | $ 3,830 |
Portfolio turnover rate G | 27% | 25% | 28% |
A Annualized
B Total returns for periods of less than one year are not annualized.
C Total returns would have been lower if certain expenses had not been reduced during the applicable periods shown.
D Total returns do not include the effect of the sales charges.
E Calculated based on average shares outstanding during the period.
F Fees and expenses of any underlying Fidelity Central Funds are not included in the Fund's expense ratio. The Fund indirectly bears its proportionate share of the expenses of any underlying Fidelity Central Funds.
G Amount does not include the portfolio activity of any underlying Fidelity Central Funds.
H For the period April 14, 2010 (commencement of sale of shares) to July 31, 2010.
I Expense ratios reflect operating expenses of the class. Expenses before reductions do not reflect amounts reimbursed by the investment adviser or reductions from brokerage service arrangements or reductions from other expense offset arrangements and do not represent the amount paid by the class during periods when reimbursements or reductions occur. Expense ratios before reductions for start-up periods may not be representative of longer-term operating periods. Expenses net of fee waivers reflect expenses after reimbursement by the investment adviser but prior to reductions from brokerage service arrangements or other expense offset arrangements. Expenses net of all reductions represent the net expenses paid by the class.
J Amount represents less than $.01 per share.
K Total distributions of $.60 per share is comprised of distributions from net investment income of $.505 and distributions from net realized gain of $.097 per share.
See accompanying notes which are an integral part of the financial statements.
Annual Report
Financial Highlights - Class T
Years ended July 31, | 2012 | 2011 | 2010 H |
Selected Per-Share Data | | | |
Net asset value, beginning of period | $ 10.72 | $ 9.94 | $ 9.95 |
Income from Investment Operations | | | |
Net investment income (loss) E | .52 | .52 | .17 |
Net realized and unrealized gain (loss) | .62 | .76 | (.03) |
Total from investment operations | 1.14 | 1.28 | .14 |
Distributions from net investment income | (.50) | (.50) | (.15) |
Distributions from net realized gain | (.10) | - | - |
Total distributions | (.60) | (.50) | (.15) |
Redemption fees added to paid in capital E, J | - | - | - |
Net asset value, end of period | $ 11.26 | $ 10.72 | $ 9.94 |
Total Return B,C,D | 11.33% | 13.11% | 1.45% |
Ratios to Average Net Assets F,I | | | |
Expenses before reductions | 1.11% | 1.16% | 1.17% A |
Expenses net of fee waivers, if any | 1.11% | 1.16% | 1.17% A |
Expenses net of all reductions | 1.11% | 1.16% | 1.17% A |
Net investment income (loss) | 4.90% | 4.96% | 5.92% A |
Supplemental Data | | | |
Net assets, end of period (000 omitted) | $ 26,143 | $ 7,626 | $ 862 |
Portfolio turnover rate G | 27% | 25% | 28% |
A Annualized
B Total returns for periods of less than one year are not annualized.
C Total returns would have been lower if certain expenses had not been reduced during the applicable periods shown.
D Total returns do not include the effect of the sales charges.
E Calculated based on average shares outstanding during the period.
F Fees and expenses of any underlying Fidelity Central Funds are not included in the Fund's expense ratio. The Fund indirectly bears its proportionate share of the expenses of any underlying Fidelity Central Funds.
G Amount does not include the portfolio activity of any underlying Fidelity Central Funds.
H For the period April 14, 2010 (commencement of sale of shares) to July 31, 2010.
I Expense ratios reflect operating expenses of the class. Expenses before reductions do not reflect amounts reimbursed by the investment adviser or reductions from brokerage service arrangements or reductions from other expense offset arrangements and do not represent the amount paid by the class during periods when reimbursements or reductions occur. Expense ratios before reductions for start-up periods may not be representative of longer-term operating periods. Expenses net of fee waivers reflect expenses after reimbursement by the investment adviser but prior to reductions from brokerage service arrangements or other expense offset arrangements. Expenses net of all reductions represent the net expenses paid by the class.
J Amount represents less than $.01 per share.
See accompanying notes which are an integral part of the financial statements.
Annual Report
Financial Highlights - Class C
Years ended July 31, | 2012 | 2011 | 2010 H |
Selected Per-Share Data | | | |
Net asset value, beginning of period | $ 10.67 | $ 9.93 | $ 9.95 |
Income from Investment Operations | | | |
Net investment income (loss) E | .44 | .45 | .15 |
Net realized and unrealized gain (loss) | .62 | .74 | (.03) |
Total from investment operations | 1.06 | 1.19 | .12 |
Distributions from net investment income | (.43) | (.45) | (.14) |
Distributions from net realized gain | (.10) | - | - |
Total distributions | (.53) | (.45) | (.14) |
Redemption fees added to paid in capital E, J | - | - | - |
Net asset value, end of period | $ 11.20 | $ 10.67 | $ 9.93 |
Total Return B,C,D | 10.49% | 12.25% | 1.29% |
Ratios to Average Net Assets F,I | | | |
Expenses before reductions | 1.87% | 1.89% | 1.86% A |
Expenses net of fee waivers, if any | 1.87% | 1.89% | 1.86% A |
Expenses net of all reductions | 1.87% | 1.89% | 1.86% A |
Net investment income (loss) | 4.14% | 4.23% | 5.21% A |
Supplemental Data | | | |
Net assets, end of period (000 omitted) | $ 52,780 | $ 21,555 | $ 836 |
Portfolio turnover rate G | 27% | 25% | 28% |
A Annualized
B Total returns for periods of less than one year are not annualized.
C Total returns would have been lower if certain expenses had not been reduced during the applicable periods shown.
D Total returns do not include the effect of the contingent deferred sales charge.
E Calculated based on average shares outstanding during the period.
F Fees and expenses of any underlying Fidelity Central Funds are not included in the Fund's expense ratio. The Fund indirectly bears its proportionate share of the expenses of any underlying Fidelity Central Funds.
G Amount does not include the portfolio activity of any underlying Fidelity Central Funds.
H For the period April 14, 2010 (commencement of sale of shares) to July 31, 2010.
I Expense ratios reflect operating expenses of the class. Expenses before reductions do not reflect amounts reimbursed by the investment adviser or reductions from brokerage service arrangements or reductions from other expense offset arrangements and do not represent the amount paid by the class during periods when reimbursements or reductions occur. Expense ratios before reductions for start-up periods may not be representative of longer-term operating periods. Expenses net of fee waivers reflect expenses after reimbursement by the investment adviser but prior to reductions from brokerage service arrangements or other expense offset arrangements. Expenses net of all reductions represent the net expenses paid by the class.
J Amount represents less than $.01 per share.
See accompanying notes which are an integral part of the financial statements.
Annual Report
Financial Highlights - Real Estate Income
Years ended July 31, | 2012 | 2011 | 2010 | 2009 | 2008 |
Selected Per-Share Data | | | | | |
Net asset value, beginning of period | $ 10.75 | $ 9.95 | $ 8.21 | $ 9.43 | $ 11.22 |
Income from Investment Operations | | | | | |
Net investment income (loss) B | .54 | .55 | .53 | .54 | .59 |
Net realized and unrealized gain (loss) | .62 | .76 | 1.73 | (1.27) | (1.48) |
Total from investment operations | 1.16 | 1.31 | 2.26 | (.73) | (.89) |
Distributions from net investment income | (.52) | (.51) | (.52) | (.50) | (.66) |
Distributions from net realized gain | (.10) | - | - | - | (.24) |
Total distributions | (.62) | (.51) | (.52) | (.50) | (.90) |
Redemption fees added to paid in capital B | - F | - F | - F | .01 | - F |
Net asset value, end of period | $ 11.29 | $ 10.75 | $ 9.95 | $ 8.21 | $ 9.43 |
Total Return A | 11.50% | 13.41% | 28.29% | (6.92)% | (8.43)% |
Ratios to Average Net Assets C,E |
Expenses before reductions | .90% | .92% | .97% | 1.00% | .94% |
Expenses net of fee waivers, if any | .89% | .92% | .96% | 1.00% | .94% |
Expenses net of all reductions | .89% | .92% | .96% | 1.00% | .94% |
Net investment income (loss) | 5.12% | 5.21% | 5.60% | 7.15% | 5.77% |
Supplemental Data | | | | | |
Net assets, end of period (000 omitted) | $ 2,252,149 | $ 1,660,063 | $ 1,030,393 | $ 463,269 | $ 393,147 |
Portfolio turnover rate D | 27% | 25% | 28% | 47% | 32% |
A Total returns would have been lower if certain expenses had not been reduced during the applicable periods shown.
B Calculated based on average shares outstanding during the period.
C Fees and expenses of any underlying Fidelity Central Funds are not included in the Fund's expense ratio. The Fund indirectly bears its proportionate share of the expenses of any underlying Fidelity Central Funds.
D Amount does not include the portfolio activity of any underlying Fidelity Central Funds.
E Expense ratios reflect operating expenses of the class. Expenses before reductions do not reflect amounts reimbursed by the investment adviser or reductions from brokerage service arrangements or reductions from other expense offset arrangements and do not represent the amount paid by the class during periods when reimbursements or reductions occur. Expenses net of fee waivers reflect expenses after reimbursement by the investment adviser but prior to reductions from brokerage service arrangements or other expense offset arrangements. Expenses net of all reductions represent the net expenses paid by the class.
F Amount represents less than $.01 per share.
See accompanying notes which are an integral part of the financial statements.
Annual Report
Financial Highlights - Institutional Class
Years ended July 31, | 2012 | 2011 | 2010 G |
Selected Per-Share Data | | | |
Net asset value, beginning of period | $ 10.74 | $ 9.95 | $ 9.95 |
Income from Investment Operations | | | |
Net investment income (loss) D | .55 | .55 | .19 |
Net realized and unrealized gain (loss) | .62 | .76 | (.04) |
Total from investment operations | 1.17 | 1.31 | .15 |
Distributions from net investment income | (.53) | (.52) | (.15) |
Distributions from net realized gain | (.10) | - | - |
Total distributions | (.63) | (.52) | (.15) |
Redemption fees added to paid in capital D,I | - | - | - |
Net asset value, end of period | $ 11.28 | $ 10.74 | $ 9.95 |
Total Return B,C | 11.62% | 13.44% | 1.58% |
Ratios to Average Net Assets E,H | | | |
Expenses before reductions | .84% | .89% | .85% A |
Expenses net of fee waivers, if any | .84% | .89% | .85% A |
Expenses net of all reductions | .84% | .89% | .85% A |
Net investment income (loss) | 5.17% | 5.24% | 6.70% A |
Supplemental Data | | | |
Net assets, end of period (000 omitted) | $ 217,435 | $ 43,282 | $ 2,930 |
Portfolio turnover rate F | 27% | 25% | 28% |
A Annualized
B Total returns for periods of less than one year are not annualized.
C Total returns would have been lower if certain expenses had not been reduced during the applicable periods shown.
D Calculated based on average shares outstanding during the period.
E Fees and expenses of any underlying Fidelity Central Funds are not included in the Fund's expense ratio. The Fund indirectly bears its proportionate share of the expenses of any underlying Fidelity Central Funds.
F Amount does not include the portfolio activity of any underlying Fidelity Central Funds.
G For the period April 14, 2010 (commencement of sale of shares) to July 31, 2010.
H Expense ratios reflect operating expenses of the class. Expenses before reductions do not reflect amounts reimbursed by the investment adviser or reductions from brokerage service arrangements or reductions from other expense offset arrangements and do not represent the amount paid by the class during periods when reimbursements or reductions occur. Expense ratios before reductions for start-up periods may not be representative of longer-term operating periods. Expenses net of fee waivers reflect expenses after reimbursement by the investment adviser but prior to reductions from brokerage service arrangements or other expense offset arrangements. Expenses net of all reductions represent the net expenses paid by the class.
I Amount represents less than $.01 per share.
See accompanying notes which are an integral part of the financial statements.
Annual Report
Notes to Financial Statements
For the period ended July 31, 2012
1. Organization.
Fidelity Real Estate Income Fund (the Fund) is a fund of Fidelity Securities Fund (the Trust) and is authorized to issue an unlimited number of shares. The Trust is registered under the Investment Company Act of 1940, as amended (the 1940 Act), as an open-end management investment company organized as a Massachusetts business trust. The Fund offers Class A, Class T, Class C, Real Estate Income and Institutional Class shares, each of which has equal rights as to assets and voting privileges. Each class has exclusive voting rights with respect to matters that affect that class. Investment income, realized and unrealized capital gains and losses, the common expenses of the Fund, and certain fund-level expense reductions, if any, are allocated on a pro-rata basis to each class based on the relative net assets of each class to the total net assets of the Fund. Each class differs with respect to transfer agent and distribution and service plan fees incurred. Certain expense reductions may also differ by class.
2. Investments in Fidelity Central Funds.
The Fund invests in Fidelity Central Funds, which are open-end investment companies available only to other investment companies and accounts managed by Fidelity Management & Research Company (FMR) and its affiliates. The Fund's Schedule of Investments lists each of the Fidelity Central Funds held as of period end, if any, as an investment of the Fund, but does not include the underlying holdings of each Fidelity Central Fund. As an Investing Fund, the Fund indirectly bears its proportionate share of the expenses of the underlying Fidelity Central Funds.
The Money Market Central Funds seek preservation of capital and current income and are managed by Fidelity Investments Money Management, Inc. (FIMM), an affiliate of FMR.
A complete unaudited list of holdings for each Fidelity Central Fund is available upon request or at the Securities and Exchange Commission (the SEC) web site at www.sec.gov. In addition, the financial statements of the Fidelity Central Funds, which are not covered by the Fund's Report of Independent Registered Public Accounting Firm, are available on the SEC web site or upon request.
3. Significant Accounting Policies.
The financial statements have been prepared in conformity with accounting principles generally accepted in the United States of America (GAAP), which require management to make certain estimates and assumptions at the date of the financial statements. Actual results could differ from those estimates. Subsequent events, if any, through the date that the financial statements were issued have been evaluated in the preparation of the financial statements. The following summarizes the significant accounting policies of the Fund:
Annual Report
3. Significant Accounting Policies - continued
Security Valuation. Investments are valued as of 4:00 p.m. Eastern time on the last calendar day of the period. In accordance with valuation policies and procedures approved by the Board of Trustees (the Board), the Fund attempts to obtain prices from one or more third party pricing vendor or broker to value its investments. When current market prices, quotations or rates are not readily available or reliable, securities will be fair valued in good faith by the FMR Fair Value Committee (the Committee), in accordance with procedures adopted by the Fund's Board. Factors used in determining fair value vary by security type and may include market or security specific events, changes in interest rates and credit quality. The frequency with which these procedures are used cannot be predicted and they may be utilized to a significant extent. The Committee oversees the Fund's valuation policies and procedures and is responsible for approving and reporting to the Board all fair value determinations.
The Fund categorizes the inputs to valuation techniques used to value its investments into a disclosure hierarchy consisting of three levels as shown below:
Level 1 - quoted prices in active markets for identical investments
Level 2 - other significant observable inputs (including quoted prices for similar investments, interest rates, prepayment speeds, etc.)
Level 3 - unobservable inputs (including the Fund's own assumptions based on the best information available)
Valuation techniques used to value the Fund's investments by major category are as follows:
Equity securities, including restricted securities, for which market quotations are readily available, are valued at the last reported sale price or official closing price as reported by a third party pricing vendor on the primary market or exchange on which they are traded and are categorized as Level 1 in the hierarchy. In the event there were no sales during the day or closing prices are not available, securities are valued at the last quoted bid price or may be valued using the last available price and are generally categorized as Level 2 in the hierarchy. For foreign equity securities, when significant market or security specific events arise, comparisons to the valuation of American Depositary Receipts (ADRs), futures contracts, Exchange-Traded Funds (ETFs) and certain indexes as well as quoted prices for similar securities are used and are categorized as Level 2 in the hierarchy. Utilizing these techniques may result in transfers between Level 1 and Level 2. For restricted equity securities and private placements where observable inputs are limited, assumptions about market activity and risk are used and these securities are categorized as Level 3 in the hierarchy.
Annual Report
Notes to Financial Statements - continued
3. Significant Accounting Policies - continued
Security Valuation - continued
Debt securities, including restricted securities, are valued based on evaluated prices received from third party pricing vendors or from brokers who make markets in such securities. For corporate bonds, floating rate loans and preferred securities, pricing vendors utilize matrix pricing which considers yield or price of bonds of comparable quality, coupon, maturity and type as well as broker-supplied prices and are generally categorized as Level 2 in the hierarchy. For asset backed securities, collateralized mortgage obligations and commercial mortgage securities, pricing vendors utilize matrix pricing which considers prepayment speed assumptions, attributes of the collateral, yield or price of bonds of comparable quality, coupon, maturity and type as well as broker-supplied prices and, accordingly, such securities are generally categorized as Level 2 in the hierarchy. Independent prices obtained from a single source or broker are evaluated by management and may be categorized as Level 3 within the fair value hierarchy. When independent prices are unavailable or unreliable, debt securities may be valued utilizing pricing methodologies which consider similar factors that would be used by third party pricing vendors. These are generally categorized as Level 2 in the hierarchy but may be Level 3 depending on the circumstances.
Investments in open-end mutual funds, including the Fidelity Central Funds, are valued at their closing net asset value each business day and are categorized as Level 1 in the hierarchy.
Annual Report
3. Significant Accounting Policies - continued
Security Valuation - continued
The following provides information on Level 3 securities held by the Fund that were valued at period end based on unobservable inputs. These amounts exclude valuations provided by a broker.
Asset Type | Fair Value at
07/31/12 | Valuation
Technique(s) | Unobservable
Input | Range | Weighted
Average |
Asset-Backed Securities | $ 3,770,142 | Discounted cash flow | Internal rate of return | 20% | 20% |
| Discounted cash flow | Yield | 8.5% - 15.8% | 10.87% |
| | Market comparable | Spread | 4.75% | 4.75% |
Collateralized Mortgage Obligations | $ 800,642 | Discounted cash flow | Yield | 14% - 42% | 21% |
Commercial
MortgageSecurities | $ 9,977,496 | Discounted cash flow | Yield | 60% | 60% |
| Market comparable | Quoted price | $55 | $55 |
| Market comparable | Spread | 11.54% - 36.05% | 27% |
Common/ Preferred Stocks | $ 4,117,748 | Market comparable | Transaction price | $.001 - $.01 | $0.01 |
| Expected distribution | Recovery rate | 0% | 0% |
| Adjusted book value | Book value
multiple | 1.0 | 1.0 |
Corporate Bonds | $ 2,218,279 | Discounted cash flow | Constant
prepayment rate | 35% | 35% |
| | Expected distribution | Recovery rate | 0% | 0% |
Floating Rate Loans | $ 13,228,477 | Discounted cash flow | Yield | 9.6% - 9.75% | 9.65% |
Preferred
Securities | - | Expected distribution | Recovery rate | 0% | 0% |
For the unobservable inputs listed in the table above, a significant increase in yields, spreads, internal rates of return or constant prepayment rates could result in a significant decrease to the fair value measurement. A significant increase in estimated recovery rates, quoted prices, transactions prices or book value multiples would result in a significant increase to the fair value measurement.
Changes in valuation techniques may result in transfers in or out of an assigned level within the disclosure hierarchy. The aggregate value of investments by input level, as of July 31, 2012, as well as a roll forward of Level 3 securities, is included at the end of the Fund's Schedule of Investments.
Annual Report
Notes to Financial Statements - continued
3. Significant Accounting Policies - continued
Foreign Currency Translation. The Fund may use foreign currency contracts to facilitate transactions in foreign-denominated securities. Gains and losses from these transactions may arise from changes in the value of the foreign currency or if the counterparties do not perform under the contracts' terms.
Foreign-denominated assets, including investment securities, and liabilities are translated into U.S. dollars at the exchange rates at period end. Purchases and sales of investment securities, income and dividends received and expenses denominated in foreign currencies are translated into U.S. dollars at the exchange rate in effect on the transaction date.
The effects of exchange rate fluctuations on investments are included with the net realized and unrealized gain (loss) on investment securities. Other foreign currency transactions resulting in realized and unrealized gain (loss) are disclosed separately.
Investment Transactions and Income. For financial reporting purposes, the Fund's investment holdings and NAV include trades executed through the end of the last business day of the period. The NAV per share for processing shareholder transactions is calculated as of the close of business of the New York Stock Exchange (NYSE), normally 4:00 p.m. Eastern time and includes trades executed through the end of the prior business day. Gains and losses on securities sold are determined on the basis of identified cost and may include proceeds received from litigation. Dividend income is recorded on the ex-dividend date, except for certain dividends from foreign securities where the ex-dividend date may have passed, which are recorded as soon as the Fund is informed of the ex-dividend date. Non-cash dividends included in dividend income, if any, are recorded at the fair market value of the securities received. Distributions received on securities that represent a return of capital or capital gain are recorded as a reduction of cost of investments and/or as a realized gain. The Fund estimates the components of distributions received that may be considered return of capital distributions or capital gain distributions. Interest income and distributions from the Fidelity Central Funds are accrued as earned. Interest income includes coupon interest and amortization of premium and accretion of discount on debt securities. For certain lower credit quality securitized assets that have contractual cash flows (for example, asset backed securities, collateralized mortgage obligations and commercial mortgage-backed securities), changes in estimated cash flows are periodically evaluated and the estimated yield is adjusted on a prospective basis over the remaining life of the security, resulting in increases or decreases to Interest Income in the accompanying Statement of Operations. Investment income is recorded net of foreign taxes withheld where recovery of such taxes is uncertain. Debt obligations may be placed on non-accrual status and related interest income may be reduced by ceasing current accruals and writing off interest receivables when the collection of all or a portion of interest has become doubtful based on consistently applied procedures. A debt obligation is removed from non-accrual status when the issuer resumes interest payments or when collectability of interest is reasonably assured.
Annual Report
3. Significant Accounting Policies - continued
Expenses. Expenses directly attributable to a fund are charged to that fund. Expenses attributable to more than one fund are allocated among the respective funds on the basis of relative net assets or other appropriate methods. Expense estimates are accrued in the period to which they relate and adjustments are made when actual amounts are known.
Income Tax Information and Distributions to Shareholders. Each year, the Fund intends to qualify as a regulated investment company under Subchapter M of the Internal Revenue Code, including distributing substantially all of its taxable income and realized gains. As a result, no provision for income taxes is required. As of July 31, 2012, the Fund did not have any unrecognized tax benefits in the financial statements; nor is the Fund aware of any tax positions for which it is reasonably possible that the total amounts of unrecognized tax benefits will significantly change in the next twelve months. The Fund files a U.S. federal tax return, in addition to state and local tax returns as required. A fund's federal income tax returns are subject to examination by the Internal Revenue Service (IRS) for a period of three fiscal years after they are filed. State and local tax returns may be subject to examination for an additional fiscal year depending on the jurisdiction. Foreign taxes are provided for based on the Fund's understanding of the tax rules and rates that exist in the foreign markets in which it invests.
Distributions are declared and recorded on the ex-dividend date. Income dividends and capital gain distributions are declared separately for each class. Income and capital gain distributions are determined in accordance with income tax regulations, which may differ from GAAP. In addition, the Fund claimed a portion of the payment made to redeeming shareholders as a distribution for income tax purposes.
Capital accounts within the financial statements are adjusted for permanent book-tax differences. These adjustments have no impact on net assets or the results of operations. Temporary book-tax differences will reverse in a subsequent period.
Book-tax differences are primarily due to equity-debt classifications, foreign currency transactions, passive foreign investment companies (PFIC), market discount, partnerships and losses deferred due to wash sales.
The federal tax cost of investment securities and unrealized appreciation (depreciation) as of period end were as follows:
Gross unrealized appreciation | $ 229,881,115 |
Gross unrealized depreciation | (57,864,464) |
Net unrealized appreciation (depreciation) on securities and other investments | $ 172,016,651 |
| |
Tax Cost | $ 2,563,690,335 |
Annual Report
Notes to Financial Statements - continued
3. Significant Accounting Policies - continued
Income Tax Information and Distributions to Shareholders - continued
The tax-based components of distributable earnings as of period end were as follows:
Undistributed ordinary income | $ 37,796,939 |
Undistributed long-term capital gain | $ 25,839,411 |
Net unrealized appreciation (depreciation) | $ 172,042,855 |
The tax character of distributions paid was as follows:
| July 31, 2012 | July 31, 2011 |
Ordinary Income | $ 98,117,663 | $ 66,688,371 |
Long-term Capital Gains | 16,498,521 | - |
Total | $ 114,616,184 | $ 66,688,371 |
Short-Term Trading (Redemption) Fees. Shares held by investors in the Fund less than 90 days are subject to a redemption fee equal to .75% of the net asset value of shares redeemed. All redemption fees, which reduce the proceeds of the shareholder redemption, are retained by the Fund and accounted for as an addition to paid in capital.
New Accounting Pronouncement. In December 2011, the Financial Accounting Standards Board issued Accounting Standard Update No. 2011-11, Disclosures about Offsetting Assets and Liabilities. The update creates new disclosure requirements requiring entities to disclose both gross and net information for derivatives and other financial instruments that are either offset in the Statement of Assets and Liabilities or subject to an enforceable master netting arrangement or similar agreement. The disclosure requirements are effective for interim and annual reporting periods beginning on or after January 1, 2013. Management is currently evaluating the impact of the update's adoption on the Fund's financial statement disclosures.
4. Operating Policies.
Delayed Delivery Transactions and When-Issued Securities. During the period, the Fund transacted in securities on a delayed delivery or when-issued basis. Payment and delivery may take place after the customary settlement period for that security. The price of the underlying securities and the date when the securities will be delivered and paid for are fixed at the time the transaction is negotiated. The securities purchased on a delayed delivery or when-issued basis are identified as such in the Fund's Schedule of Investments. The Fund may receive compensation for interest forgone in the purchase of a delayed delivery or when-issued security. With respect to purchase commitments, the Fund identifies securities as segregated in its records with a value at least equal to the amount of the commitment. Losses may arise due to changes in the value of the underlying securities or if the counterparty does not perform under the contract's terms, or if the issuer does not issue the securities due to political, economic, or other factors.
Annual Report
4. Operating Policies - continued
Restricted Securities. The Fund may invest in securities that are subject to legal or contractual restrictions on resale. These securities generally may be resold in transactions exempt from registration or to the public if the securities are registered. Disposal of these securities may involve time-consuming negotiations and expense, and prompt sale at an acceptable price may be difficult. Information regarding restricted securities is included at the end of the Fund's Schedule of Investments.
Loans and Other Direct Debt Instruments. The Fund invests in direct debt instruments which are interests in amounts owed to lenders by corporate or other borrowers. These instruments may be in the form of loans, trade claims or other receivables and may include standby financing commitments such as revolving credit facilities that obligate the Fund to supply additional cash to the borrower on demand. Loans may be acquired through assignment or participation, or may be made directly to a borrower. The Fund may be contractually obligated to receive approval from the agent bank and/or borrower prior to the sale of these loans.
5. Purchases and Sales of Investments.
Purchases and sales of securities, other than short-term securities and U.S. government securities, aggregated $1,228,544,087 and $513,304,249, respectively.
6. Fees and Other Transactions with Affiliates.
Management Fee. FMR and its affiliates provide the Fund with investment management related services for which the Fund pays a monthly management fee. The management fee is the sum of an individual fund fee rate that is based on an annual rate of .30% of the Fund's average net assets and an annualized group fee rate that averaged .26% during the period. The group fee rate is based upon the average net assets of all the mutual funds advised by FMR. The group fee rate decreases as assets under management increase and increases as assets under management decrease. For the period, the total annual management fee rate was .56% of the Fund's average net assets.
Distribution and Service Plan Fees. In accordance with Rule 12b-1 of the 1940 Act, the Fund has adopted separate Distribution and Service Plans for each class of shares. Certain classes pay Fidelity Distributors Corporation (FDC), an affiliate of FMR, separate Distribution and Service Fees, each of which is based on an annual percentage of each class' average net assets. In addition, FDC may pay financial intermediaries for selling shares of the Fund and providing shareholder support services. For the period, the Distribution and Service Fee rates, total fees and amounts retained by FDC were as follows:
Annual Report
Notes to Financial Statements - continued
6. Fees and Other Transactions with Affiliates - continued
Distribution and Service Plan Fees - continued
| Distribution
Fee | Service
Fee | Total Fees | Retained
by FDC |
Class A | -% | .25% | $ 218,203 | $ 8,211 |
Class T | -% | .25% | 36,778 | - |
Class C | .75% | .25% | 304,416 | 166,771 |
| | | $ 559,397 | $ 174,982 |
Sales Load. FDC may receive a front-end sales charge of up to 4.00% for selling Class A shares and Class T shares, some of which is paid to financial intermediaries for selling shares of the Fund. Depending on the holding period, FDC may receive contingent deferred sales charges levied on Class A, Class T and Class C redemptions. The deferred sales charges range from 1.00% for Class C shares, 1.00% for certain purchases of Class A shares and .25% for certain purchases of Class T shares.
For the period, sales charge amounts retained by FDC were as follows:
| Retained
by FDC |
Class A | $ 42,872 |
Class T | 8,681 |
Class C* | 7,056 |
| $ 58,609 |
* When Class C shares are initially sold, FDC pays commissions from its own resources to financial intermediaries through which the sales are made.
Transfer Agent Fees. Fidelity Investments Institutional Operations Company, Inc. (FIIOC), an affiliate of FMR, is the transfer, dividend disbursing and shareholder servicing agent for each class of the Fund. FIIOC receives account fees and asset-based fees that vary according to the account size and type of account of the shareholders of the respective classes of the Fund. FIIOC pays for typesetting, printing and mailing of shareholder reports, except proxy statements. For the period, transfer agent fees for each class were as follows:
| Amount | % of
Average
Net Assets |
Class A | $ 216,059 | .25 |
Class T | 35,949 | .24 |
Class C | 75,984 | .25 |
Real Estate Income | 5,073,026 | .28 |
Institutional Class | 284,409 | .22 |
| $ 5,685,427 | |
Annual Report
6. Fees and Other Transactions with Affiliates - continued
Accounting and Security Lending Fees. Fidelity Service Company, Inc. (FSC), an affiliate of FMR, maintains the Fund's accounting records. The accounting fee is based on the level of average net assets for each month. Under a separate contract, FSC administers the security lending program. The security lending fee is based on the number and duration of lending transactions.
Brokerage Commissions. The Fund placed a portion of its portfolio transactions with brokerage firms which are affiliates of the investment adviser. The commissions paid to these affiliated firms were $20,704 for the period.
7. Committed Line of Credit.
The Fund participates with other funds managed by FMR or an affiliate in a $4.25 billion credit facility (the "line of credit") to be utilized for temporary or emergency purposes to fund shareholder redemptions or for other short-term liquidity purposes. The Fund has agreed to pay commitment fees on its pro-rata portion of the line of credit, which amounted to $5,657 and is reflected in Miscellaneous expenses on the Statement of Operations. During the period, there were no borrowings on this line of credit.
8. Security Lending.
The Fund lends portfolio securities through a lending agent from time to time in order to earn additional income. For equity securities, a lending agent is used and may loan securities to certain qualified borrowers, including Fidelity Capital Markets (FCM), a broker-dealer affiliated with the Fund. On the settlement date of the loan, the Fund receives collateral (in the form of U.S. Treasury obligations, letters of credit and/or cash) against the loaned securities and maintains collateral in an amount not less than 100% of the market value of the loaned securities during the period of the loan. The market value of the loaned securities is determined at the close of business of the Fund and any additional required collateral is delivered to the Fund on the next business day. If the borrower defaults on its obligation to return the securities loaned because of insolvency or other reasons, a fund could experience delays and costs in recovering the securities loaned or in gaining access to the collateral. Any cash collateral received is invested in the Fidelity Securities Lending Cash Central Fund. The value of loaned securities and cash collateral at period end are disclosed on the Fund's Statement of Assets and Liabilities. Security lending income represents the income earned on investing cash collateral, less rebates paid to borrowers and any lending agent fees associated with the loan, plus any premium payments received for lending certain types of securities. Security lending income is presented in the Statement of Operations as a component of income from Fidelity Central Funds. Total security lending income during the period amounted to $73,576. During the period, there were no securities loaned to FCM.
Annual Report
Notes to Financial Statements - continued
9. Expense Reductions.
FMR voluntarily agreed to reimburse a portion of the Real Estate Income's operating expenses. During the period, this reimbursement reduced Real Estate Income's expenses by $31,380.
Many of the brokers with whom FMR places trades on behalf of the Fund provided services to the Fund in addition to trade execution. These services included payments of certain expenses on behalf of the Fund totaling $10,839 for the period. In addition, through arrangements with the Fund's custodian, credits realized as a result of uninvested cash balances were used to reduce the Fund's expenses. During the period, these credits reduced the Fund's custody expenses by $429.
10. Distributions to Shareholders.
Distributions to shareholders of each class were as follows:
Years ended July 31, | 2012 | 2011 |
From net investment income | | |
Class A | $ 3,854,404 | $ 1,154,662 |
Class T | 609,057 | 160,366 |
Class C | 1,139,599 | 358,357 |
Real Estate Income | 86,666,891 | 64,149,915 |
Institutional Class | 5,847,712 | 865,071 |
Total | $ 98,117,663 | $ 66,688,371 |
From net realized gain | | |
Class A | $ 603,452 | $ - |
Class T | 83,752 | - |
Class C | 208,802 | - |
Real Estate Income | 14,865,902 | - |
Institutional Class | 736,613 | - |
Total | $ 16,498,521 | $ - |
Annual Report
11. Share Transactions.
Transactions for each class of shares were as follows:
| Shares | Dollars |
Years ended July 31, | 2012 | 2011 | 2012 | 2011 |
Class A | | | | |
Shares sold | 8,276,874 | 5,544,292 | $ 88,010,262 | $ 58,675,375 |
Reinvestment of distributions | 333,613 | 75,836 | 3,436,744 | 799,911 |
Shares redeemed | (2,031,559) | (384,554) | (21,254,183) | (4,105,728) |
Net increase (decrease) | 6,578,928 | 5,235,574 | $ 70,192,823 | $ 55,369,558 |
Class T | | | | |
Shares sold | 1,725,200 | 662,414 | $ 18,422,015 | $ 7,018,853 |
Reinvestment of distributions | 49,495 | 12,671 | 511,986 | 132,964 |
Shares redeemed | (163,799) | (50,669) | (1,727,688) | (536,547) |
Net increase (decrease) | 1,610,896 | 624,416 | $ 17,206,313 | $ 6,615,270 |
Class C | | | | |
Shares sold | 3,117,808 | 2,030,776 | $ 33,302,251 | $ 21,411,850 |
Reinvestment of distributions | 110,126 | 29,432 | 1,128,377 | 309,638 |
Shares redeemed | (534,569) | (125,083) | (5,534,157) | (1,328,625) |
Net increase (decrease) | 2,693,365 | 1,935,125 | $ 28,896,471 | $ 20,392,863 |
Real Estate Income | | | | |
Shares sold | 90,720,847 | 89,725,340 | $ 959,813,942 | $ 943,333,748 |
Reinvestment of distributions | 8,913,831 | 5,601,468 | 91,762,119 | 58,273,356 |
Shares redeemed | (54,623,988) | (44,449,757) | (572,115,634) | (467,916,333) |
Net increase (decrease) | 45,010,690 | 50,877,051 | $ 479,460,427 | $ 533,690,771 |
Institutional Class | | | | |
Shares sold | 16,926,727 | 4,361,479 | $ 177,564,635 | $ 46,245,871 |
Reinvestment of distributions | 472,572 | 55,523 | 4,899,349 | 583,903 |
Shares redeemed | (2,146,783) | (681,623) | (22,734,449) | (7,257,237) |
Net increase (decrease) | 15,252,516 | 3,735,379 | $ 159,729,535 | $ 39,572,537 |
12. Other.
The Fund's organizational documents provide former and current trustees and officers with a limited indemnification against liabilities arising in connection with the performance of their duties to the Fund. In the normal course of business, the Fund may also enter into contracts that provide general indemnifications. The Fund's maximum exposure under these arrangements is unknown as this would be dependent on future claims that may be made against the Fund. The risk of material loss from such claims is considered remote.
Annual Report
To the Trustees of Fidelity Securities Fund and Shareholders of Fidelity Real Estate Income Fund:
We have audited the accompanying statement of assets and liabilities of Fidelity Real Estate Income Fund (the Fund), a fund of Fidelity Securities Fund, including the schedule of investments, as of July 31, 2012, and the related statement of operations for the year then ended, the statement of changes in net assets for each of the two years in the period then ended, and the financial highlights for each of the five years in the period then ended. These financial statements and financial highlights are the responsibility of the Fund's management. Our responsibility is to express an opinion on these financial statements and financial highlights based on our audits.
We conducted our audits in accordance with the standards of the Public Company Accounting Oversight Board (United States). Those standards require that we plan and perform the audit to obtain reasonable assurance about whether the financial statements and financial highlights are free of material misstatement. The Fund is not required to have, nor were we engaged to perform, an audit of its internal control over financial reporting. Our audits included consideration of internal control over financial reporting as a basis for designing audit procedures that are appropriate in the circumstances, but not for the purpose of expressing an opinion on the effectiveness of the Fund's internal control over financial reporting. Accordingly, we express no such opinion. An audit also includes examining, on a test basis, evidence supporting the amounts and disclosures in the financial statements, assessing the accounting principles used and significant estimates made by management, as well as evaluating the overall financial statement presentation. Our procedures included confirmation of securities owned as of July 31, 2012, by correspondence with the custodians and brokers; where replies were not received from brokers, we performed other auditing procedures. We believe that our audits provide a reasonable basis for our opinion.
In our opinion, the financial statements and financial highlights referred to above present fairly, in all material respects, the financial position of Fidelity Real Estate Income Fund as of July 31, 2012, the results of its operations for the year then ended, the changes in its net assets for each of the two years in the period then ended, and the financial highlights for each of the five years in the period then ended, in conformity with accounting principles generally accepted in the United States of America.
DELOITTE & TOUCHE LLP
Boston, Massachusetts
September 19, 2012
Annual Report
The Trustees, Members of the Advisory Board, and executive officers of the trust and fund, as applicable, are listed below. The Board of Trustees governs the fund and is responsible for protecting the interests of shareholders. The Trustees are experienced executives who meet periodically throughout the year to oversee the fund's activities, review contractual arrangements with companies that provide services to the fund, oversee management of the risks associated with such activities and contractual arrangements, and review the fund's performance. Except for James C. Curvey, each of the Trustees oversees 228 funds advised by FMR or an affiliate. Mr. Curvey oversees 435 funds advised by FMR or an affiliate.
The Trustees hold office without limit in time except that (a) any Trustee may resign; (b) any Trustee may be removed by written instrument, signed by at least two-thirds of the number of Trustees prior to such removal; (c) any Trustee who requests to be retired or who has become incapacitated by illness or injury may be retired by written instrument signed by a majority of the other Trustees; and (d) any Trustee may be removed at any special meeting of shareholders by a two-thirds vote of the outstanding voting securities of the trust. Each Trustee who is not an interested person (as defined in the 1940 Act) (Independent Trustee), shall retire not later than the last day of the calendar year in which his or her 75th birthday occurs. The Independent Trustees may waive this mandatory retirement age policy with respect to individual Trustees. The executive officers and Advisory Board Members hold office without limit in time, except that any officer and Advisory Board Member may resign or may be removed by a vote of a majority of the Trustees at any regular meeting or any special meeting of the Trustees. Except as indicated, each individual has held the office shown or other offices in the same company for the past five years.
Experience, Skills, Attributes, and Qualifications of the Fund's Trustees. The Governance and Nominating Committee has adopted a statement of policy that describes the experience, qualifications, attributes, and skills that are necessary and desirable for potential Independent Trustee candidates (Statement of Policy). The Board believes that each Trustee satisfied at the time he or she was initially elected or appointed a Trustee, and continues to satisfy, the standards contemplated by the Statement of Policy. The Governance and Nominating Committee also engages professional search firms to help identify potential Independent Trustee candidates who have the experience, qualifications, attributes, and skills consistent with the Statement of Policy. From time to time, additional criteria based on the composition and skills of the current Independent Trustees, as well as experience or skills that may be appropriate in light of future changes to board composition, business conditions, and regulatory or other developments, have also been considered by the professional search firms and the Governance and Nominating Committee. In addition, the Board takes into account the Trustees' commitment and participation in Board and committee meetings, as well as their leadership of standing and ad hoc committees throughout their tenure.
In determining that a particular Trustee was and continues to be qualified to serve as a Trustee, the Board has considered a variety of criteria, none of which, in isolation, was controlling. The Board believes that, collectively, the Trustees have balanced and diverse experience, qualifications, attributes, and skills, which allow the Board to operate effectively in governing the fund and protecting the interests of shareholders. Information about the specific experience, skills, attributes, and qualifications of each Trustee, which in each case led to the Board's conclusion that the Trustee should serve (or continue to serve) as a trustee of the fund, is provided below.
Annual Report
Trustees and Officers - continued
Board Structure and Oversight Function. James C. Curvey is an interested person (as defined in the 1940 Act) and currently serves as Chairman. The Trustees have determined that an interested Chairman is appropriate and benefits shareholders because an interested Chairman has a personal and professional stake in the quality and continuity of services provided to the fund. Independent Trustees exercise their informed business judgment to appoint an individual of their choosing to serve as Chairman, regardless of whether the Trustee happens to be independent or a member of management. The Independent Trustees have determined that they can act independently and effectively without having an Independent Trustee serve as Chairman and that a key structural component for assuring that they are in a position to do so is for the Independent Trustees to constitute a substantial majority for the Board. The Independent Trustees also regularly meet in executive session. Ned C. Lautenbach serves as Chairman of the Independent Trustees and as such (i) acts as a liaison between the Independent Trustees and management with respect to matters important to the Independent Trustees and (ii) with management prepares agendas for Board meetings.
Fidelity funds are overseen by different Boards of Trustees. The fund's Board oversees Fidelity's equity and high income funds and another Board oversees Fidelity's investment-grade bond, money market, and asset allocation funds. The asset allocation funds may invest in Fidelity funds overseen by the fund's Board. The use of separate Boards, each with its own committee structure, allows the Trustees of each group of Fidelity funds to focus on the unique issues of the funds they oversee, including common research, investment, and operational issues. On occasion, the separate Boards establish joint committees to address issues of overlapping consequences for the Fidelity funds overseen by each Board.
The Trustees operate using a system of committees to facilitate the timely and efficient consideration of all matters of importance to the Trustees, the fund, and fund shareholders and to facilitate compliance with legal and regulatory requirements and oversight of the fund's activities and associated risks. The Board, acting through its committees, has charged FMR and its affiliates with (i) identifying events or circumstances the occurrence of which could have demonstrably adverse effects on the fund's business and/or reputation; (ii) implementing processes and controls to lessen the possibility that such events or circumstances occur or to mitigate the effects of such events or circumstances if they do occur; and (iii) creating and maintaining a system designed to evaluate continuously business and market conditions in order to facilitate the identification and implementation processes described in (i) and (ii) above. Because the day-to-day operations and activities of the fund are carried out by or through FMR, its affiliates and other service providers, the fund's exposure to risks is mitigated but not eliminated by the processes overseen by the Trustees. While each of the Board's committees has responsibility for overseeing different aspects of the fund's activities, oversight is exercised primarily through the Operations, Audit, and Compliance Committees. In addition, the Independent Trustees have worked with FMR to enhance the Board's oversight of investment and financial risks, legal and regulatory risks, technology risks, and operational risks, including the development of additional risk reporting to the Board. For example, a working group comprised of Independent Trustees and FMR has worked and continues to work to review the Fidelity funds' valuation-related activities, reporting and risk management. Appropriate personnel, including but not limited to the fund's Chief Compliance Officer (CCO), FMR's internal auditor, the independent accountants, the fund's Treasurer and portfolio management personnel, make periodic reports to the Board's committees, as appropriate, including an annual review of FMR's risk management program for the Fidelity funds. The responsibilities of each standing committee, including their oversight responsibilities, are described further under "Standing Committees of the Fund's Trustees."
Annual Report
The fund's Statement of Additional Information (SAI) includes more information about the Trustees. To request a free copy, call Fidelity at 1-800-544-8544.
Interested Trustees*:
Correspondence intended for each Trustee who is an interested person may be sent to Fidelity Investments, 82 Devonshire Street, Boston, Massachusetts 02109.
Name, Age; Principal Occupations and Other Relevant Experience+ |
James C. Curvey (77) |
| Year of Election or Appointment: 2007 Mr. Curvey is Trustee and Chairman of the Board of Trustees of certain Trusts. Mr. Curvey also serves as Trustee (2007-present) of other investment companies advised by FMR. Mr. Curvey is a Director of Fidelity Investments Money Management, Inc. (2009-present), Director of Fidelity Research & Analysis Co. (2009-present) and Director of FMR and FMR Co., Inc. (2007-present). Mr. Curvey is also Vice Chairman (2007-present) and Director of FMR LLC. In addition, Mr. Curvey serves as an Overseer for the Boston Symphony Orchestra and a member of the Trustees of Villanova University. Previously, Mr. Curvey was the Vice Chairman (2006-2007) and Director (2000-2007) of FMR Corp. |
Ronald P. O'Hanley (55) |
| Year of Election or Appointment: 2011 Mr. O'Hanley is Director of FMR Co., Inc. (2010-present), Director of Fidelity Investments Money Management, Inc. (2010-present), Director of Fidelity Research & Analysis Company (2010-present), President of Fidelity Asset Management and Corporate Services and a member of Fidelity's Executive Committee (2010-present). Previously, Mr. O'Hanley served as President and Chief Executive Officer of BNY Mellon Asset Management (2007-2010). Mr. O'Hanley also served as Vice Chairman of Bank New York Mellon Corp. and a member of that firm's Executive Committee. Prior to the 2007 merger of The Bank of New York and Mellon Financial Corporation, he was Vice Chairman of Mellon Financial Corporation and President and Chief Executive Officer of Mellon Asset Management. He joined Mellon in February 1997. Mr. O'Hanley currently serves as Chairman of the Boston Public Library Foundation Board of Directors and sits on the Board of Directors of Beth Israel Deaconess Medical Center, the Board of Trustees of the Marine Biological Laboratory and the Advisory Board of the Maxwell School of Citizenship and Public Administration at Syracuse University. Mr. O'Hanley also chairs the Council on Asset Management for the Financial Services Roundtable and is a member of the Board of Directors of Institutional Investor's U.S. Institute. |
* Trustees have been determined to be "Interested Trustees" by virtue of, among other things, their affiliation with the trust or various entities under common control with FMR.
+ The information above includes each Trustee's principal occupation during the last five years and other information relating to the experience, attributes, and skills relevant to each Trustee's qualifications to serve as a Trustee, which led to the conclusion that each Trustee should serve as a Trustee for the fund.
Annual Report
Independent Trustees:
Correspondence intended for each Independent Trustee (that is, the Trustees other than the Interested Trustees) may be sent to Fidelity Investments, P.O. Box 55235, Boston, Massachusetts 02205-5235.
Name, Age; Principal Occupations and Other Relevant Experience+ |
Dennis J. Dirks (64) |
| Year of Election or Appointment: 2005 Prior to his retirement in May 2003, Mr. Dirks was Chief Operating Officer and a member of the Board of The Depository Trust & Clearing Corporation (DTCC). He also served as President, Chief Operating Officer, and Board member of The Depository Trust Company (DTC) and President and Board member of the National Securities Clearing Corporation (NSCC). In addition, Mr. Dirks served as Chief Executive Officer and Board member of the Government Securities Clearing Corporation, Chief Executive Officer and Board member of the Mortgage-Backed Securities Clearing Corporation, as a Trustee and a member of the Finance Committee of Manhattan College (2005-2008), and as a Trustee and a member of the Finance Committee of AHRC of Nassau County (2006-2008). Mr. Dirks is a member of the Independent Directors Council (IDC) Governing Council (2010-present) and Board of Directors for The Brookville Center for Children's Services, Inc. (2009-present). |
Alan J. Lacy (58) |
| Year of Election or Appointment: 2008 Mr. Lacy serves as Senior Adviser (2007-present) of Oak Hill Capital Partners, L.P. (private equity). Mr. Lacy also served as Chief Executive Officer (2000-2005) and Vice Chairman (2005-2006) of Sears Holdings Corporation and Sears, Roebuck and Co. (retail). In addition, Mr. Lacy serves as a member of the Board of Directors of Dave & Buster's Entertainment, Inc. (restaurant and entertainment complexes, 2010-present), Earth Fare, Inc. (retail grocery, 2012-present), The Hillman Companies, Inc. (hardware wholesalers, 2010-present), and Bristol-Myers Squibb Company (global pharmaceuticals, 2007-present). Mr. Lacy is a member of the Board of Trustees of The National Parks Conservation Association (2006-present). Previously, Mr. Lacy served as Chairman of the Board of Trustees of the National Parks Conservation Association (2008-2011) and as a member of the Board of Directors for the Western Union Company (global money transfer, 2006-2011). |
Ned C. Lautenbach (68) |
| Year of Election or Appointment: 2000 Mr. Lautenbach is Chairman of the Independent Trustees of the Equity and High Income Funds (2006-present). Mr. Lautenbach currently serves as the Lead Director of the Eaton Corporation Board of Directors (diversified industrial, 1997-present). Mr. Lautenbach is Chairman of the Board of Directors of the Philharmonic Center for the Arts in Naples, Florida (2012-present) and a member of the Council on Foreign Relations (1994-present). Previously, Mr. Lautenbach was a Partner/Advisory Partner at Clayton, Dubilier & Rice, LLC (private equity investment, 1998-2010), as well as a Director of Sony Corporation (2006-2007). |
Joseph Mauriello (67) |
| Year of Election or Appointment: 2008 Prior to his retirement in January 2006, Mr. Mauriello served in numerous senior management positions including Deputy Chairman and Chief Operating Officer (2004-2005), and Vice Chairman of Financial Services (2002-2004) of KPMG LLP US (professional services, 1965-2005). Mr. Mauriello currently serves as a member of the Board of Directors of XL Group plc. (global insurance and re-insurance, 2006-present). Previously, Mr. Mauriello served as a Director of the Hamilton Funds of the Bank of New York (2006-2007) and of Arcadia Resources Inc. (health care services and products, 2007-2012). |
Robert W. Selander (61) |
| Year of Election or Appointment: 2011 Previously, Mr. Selander served as a Member of the Advisory Board of Fidelity's Equity and High Income Funds (2011), Executive Vice Chairman (2010), Chief Executive Officer (2009-2010), and President and Chief Executive Officer (1997-2009) of Mastercard, Inc. |
Cornelia M. Small (68) |
| Year of Election or Appointment: 2005 Ms. Small is a member of the Board of Directors of the Teagle Foundation (2009-present). Ms. Small is also a member of the Investment Committee, and Chair (2008-present) and a member of the Board of Trustees of Smith College. In addition, Ms. Small serves on the Investment Committee of the Berkshire Taconic Community Foundation (2008-present). Previously, Ms. Small served as Chairperson of the Investment Committee (2002-2008) of Smith College. In addition, Ms. Small served as Chief Investment Officer, Director of Global Equity Investments, and a member of the Board of Directors of Scudder, Stevens & Clark and Scudder Kemper Investments. |
William S. Stavropoulos (73) |
| Year of Election or Appointment: 2002 Mr. Stavropoulos is Vice Chairman of the Independent Trustees of the Equity and High Income Funds (2006-present). Mr. Stavropoulos serves as President and Founder of the Michigan Baseball Foundation, the Great Lakes Loons (2007-present). Mr. Stavropoulos is Chairman Emeritus of the Board of Directors of The Dow Chemical Company, where he previously served in numerous senior management positions, including President, CEO (1995-2000; 2002-2004), Chairman of the Executive Committee (2000-2006), and as a member of the Board of Directors (1990-2006). Currently, Mr. Stavropoulos is Chairman of Univar (global distributor of commodity and specialty chemicals, 2010-present), a Director of Teradata Corporation (data warehousing and technology solutions, 2008-present), Chemical Financial Corporation, Maersk Inc. (industrial conglomerate), Tyco International, Inc. (multinational manufacturing and services, 2007-present), and a member of the Advisory Board for Metalmark Capital (private equity investment, 2005-present). Mr. Stavropoulos is a special advisor to Clayton, Dubilier & Rice, LLC (private equity investment). In addition, Mr. Stavropoulos is a member of the University of Notre Dame Advisory Council for the College of Science. |
David M. Thomas (63) |
| Year of Election or Appointment: 2008 Previously, Mr. Thomas served as Executive Chairman (2005-2006) and Chairman and Chief Executive Officer (2000-2005) of IMS Health, Inc. (pharmaceutical and healthcare information solutions). In addition, Mr. Thomas serves as a member of the Board of Directors of Fortune Brands, Inc. (consumer products), and Interpublic Group of Companies, Inc. (marketing communication, 2004-present). |
Michael E. Wiley (61) |
| Year of Election or Appointment: 2008 Mr. Wiley also serves as a Director of Asia Pacific Exploration Consolidated (international oil and gas exploration and production, 2008-present). Mr. Wiley serves as a Director of Tesoro Corporation (independent oil refiner and marketer, 2005-present), and a Director of Bill Barrett Corporation (exploration and production, 2005-present). In addition, Mr. Wiley also serves as a Director of Post Oak Bank (privately-held bank, 2004-present). Previously, Mr. Wiley served as a member of the Board of Trustees of the University of Tulsa (2000-2006; 2007-2010), as a Senior Energy Advisor of Katzenbach Partners, LLC (consulting, 2006-2007), as an Advisory Director of Riverstone Holdings (private investment), Chairman, President, and CEO of Baker Hughes, Inc. (oilfield services, 2000-2004), and as Director of Spinnaker Exploration Company (exploration and production, 2001-2005). |
Annual Report
Trustees and Officers - continued
+ The information above includes each Trustee's principal occupation during the last five years and other information relating to the experience, attributes, and skills relevant to each Trustee's qualifications to serve as a Trustee, which led to the conclusion that each Trustee should serve as a Trustee for the fund.
Advisory Board Members and Executive Officers:
Correspondence intended for David A. Rosow and Garnett A. Smith may be sent to Fidelity Investments, P.O. Box 55235, Boston, Massachusetts 02205-5235. Correspondence intended for each executive officer, Edward C. Johnson 3d, and Peter S. Lynch may be sent to Fidelity Investments, 82 Devonshire Street, Boston, Massachusetts 02109.
Name, Age; Principal Occupation |
Edward C. Johnson 3d (82) |
| Year of Election or Appointment: 2011 Member of the Advisory Board of Fidelity's Equity and High Income Funds. Mr. Johnson serves as Chief Executive Officer, Chairman, and a Director of FMR LLC, and also serves as Chairman and Director of FIL Limited. Previously, Mr. Johnson served as a Trustee and Chairman of the Board of certain Fidelity Trusts, Chairman and a Director of FMR, Chairman and a Director of FMR Co., Inc., and President of FMR LLC (2006-2007). |
Peter S. Lynch (68) |
| Year of Election or Appointment: 2003 Member of the Advisory Board of Fidelity's Equity and High Income Funds. Mr. Lynch is Vice Chairman and a Director of FMR and FMR Co., Inc. In addition, Mr. Lynch serves as a Trustee of Boston College and as the Chairman of the Inner-City Scholarship Fund. Previously, Mr. Lynch served on the Special Olympics International Board of Directors (1997-2006). |
David A. Rosow (69) |
| Year of Election or Appointment: 2012 Member of the Advisory Board of Fidelity's Equity and High Income Funds. Chairman and Chief Executive Officer of International Golf Group, Inc. (golf course development, 1990-present). Previously, Mr. Rosow served as Chairman and Chief Executive Officer of Rosow & Company, Inc. (private investment company, 1989-2011), a Lead Director of Hudson United Bancorp (2001-2006) and as a Director of TD Banknorth (1996-2006). In addition, Mr. Rosow is a member (2008-present) and President (2009-present) of the Town Council of Palm Beach, Florida. |
Garnett A. Smith (64) |
| Year of Election or Appointment: 2012 Member of the Advisory Board of Fidelity's Equity and High Income Funds. Prior to Mr. Smith's retirement, he served as Chairman and Chief Executive Officer of Inbrand Corp. (manufacturer of personal absorbent products, 1990-1997). He also served as President (1986-1990) of Inbrand Corp. Prior to his employment with Inbrand Corp., he was employed by a retail fabric chain and North Carolina National Bank. In addition, Mr. Smith is a board member of the Jackson Hole Land Trust (2009-present). |
Kenneth B. Robins (42) |
| Year of Election or Appointment: 2008 President and Treasurer of Fidelity's Equity and High Income Funds. Mr. Robins also serves as President and Treasurer (2010-present) and Assistant Treasurer (2009-present) of other Fidelity funds and is an employee of Fidelity Investments (2004-present). Previously, Mr. Robins served as Deputy Treasurer of the Fidelity funds (2005-2008) and Treasurer and Chief Financial Officer of The North Carolina Capital Management Trust: Cash and Term Portfolios (2006-2008). |
Brian B. Hogan (47) |
| Year of Election or Appointment: 2009 Vice President of Equity and High Income Funds. Mr. Hogan also serves as President of FMR's Equity Division (2009-present). Previously, Mr. Hogan served as Senior Vice President, Equity Research of FMR (2006-2009) and as a portfolio manager. |
Christopher S. Bartel (40) |
| Year of Election or Appointment: 2009 Vice President of Fidelity's Sector and Real Estate Equity Funds. Mr. Bartel also serves as a Director, President, and Chief Executive Officer of Fidelity Management & Research (Japan) Inc. (2012-present), a Director of Fidelity Management & Research (Hong Kong) (2012-present), and Senior Vice President of Global Equity Research (2010-present). Previously, Mr. Bartel served as Senior Vice President of Equity Research (2009-2010), Managing Director of Research (2006-2009), and an analyst and portfolio manager (2000-2006). |
Scott C. Goebel (44) |
| Year of Election or Appointment: 2008 Secretary and Chief Legal Officer (CLO) of the Fidelity funds. Mr. Goebel also serves as Secretary of Fidelity Investments Money Management, Inc. (FIMM) (2010-present) and Fidelity Research and Analysis Company (FRAC) (2010-present); Secretary and CLO of The North Carolina Capital Management Trust: Cash and Term Portfolios (2008-present); General Counsel, Secretary, and Senior Vice President of FMR (2008-present) and FMR Co., Inc. (2008-present); employed by FMR LLC or an affiliate (2001-present); Chief Legal Officer of Fidelity Management & Research (Hong Kong) Limited (2008-present) and Assistant Secretary of Fidelity Management & Research (Japan) Inc. (2008-present), and Fidelity Management & Research (U.K.) Inc. (2008-present). Previously, Mr. Goebel served as Assistant Secretary of FIMM (2008-2010), FRAC (2008-2010), and the Funds (2007-2008) and as Vice President and Secretary of Fidelity Distributors Corporation (FDC) (2005-2007). |
William C. Coffey (43) |
| Year of Election or Appointment: 2009 Assistant Secretary of Fidelity's Equity and High Income Funds. Mr. Coffey also serves as Senior Vice President and Deputy General Counsel of FMR LLC (2010-present), and is an employee of Fidelity Investments. Previously, Mr. Coffey served as Vice President and Associate General Counsel of FMR LLC (2005-2009). |
Elizabeth Paige Baumann (44) |
| Year of Election or Appointment: 2012 Anti-Money Laundering (AML) Officer of the Fidelity funds. Ms. Baumann also serves as AML Officer of The North Carolina Capital Management Trust: Cash and Term Portfolios (2012-present), Chief AML Officer of FMR LLC (2012-present), and is an employee of Fidelity Investments. Previously, Ms. Baumann served as Vice President and Deputy Anti-Money Laundering Officer (2007-2012). |
Christine Reynolds (53) |
| Year of Election or Appointment: 2008 Chief Financial Officer of the Fidelity funds. Ms. Reynolds became President of Fidelity Pricing and Cash Management Services (FPCMS) in August 2008. Ms. Reynolds served as Chief Operating Officer of FPCMS (2007-2008). Previously, Ms. Reynolds served as President, Treasurer, and Anti-Money Laundering officer of the Fidelity funds (2004-2007). |
Joseph A. Hanlon (44) |
| Year of Election or Appointment: 2012 Chief Compliance Officer of Fidelity's Equity and High Income Funds. Mr. Hanlon serves as Compliance Officer of FMR, FMR Co., Inc., Fidelity Investments Money Management, Inc. (FIMM), Fidelity Research and Analysis Company (FRAC), Fidelity Management & Research (Japan) Inc., Fidelity Management & Research (U.K.) Inc., Fidelity Management & Research (Hong Kong), and Strategic Advisers, Inc. (2009-present), as Senior Vice President of the Fidelity Asset Management Division (2009-present), and is an employee of Fidelity Investments. |
Joseph F. Zambello (55) |
| Year of Election or Appointment: 2011 Deputy Treasurer of the Fidelity funds. Mr. Zambello is an employee of Fidelity Investments. Previously, Mr. Zambello served as Vice President of FMR's Program Management Group (2009-2011) and Vice President of the Transfer Agent Oversight Group (2005-2009). |
Adrien E. Deberghes (44) |
| Year of Election or Appointment: 2008 Deputy Treasurer of Fidelity's Equity and High Income Funds. Mr. Deberghes also serves as Vice President (2011-present) and Assistant Treasurer (2010-present) of other Fidelity funds, and is an employee of Fidelity Investments (2008-present). Previously, Mr. Deberghes served as Senior Vice President of Mutual Fund Administration at State Street Corporation (2007-2008), Senior Director of Mutual Fund Administration at Investors Bank & Trust (2005-2007), and Director of Finance for Dunkin' Brands (2000-2005). |
Stephanie J. Dorsey (43) |
| Year of Election or Appointment: 2010 Assistant Treasurer of Fidelity's Equity and High Income Funds. Ms. Dorsey also serves as Deputy Treasurer of other Fidelity funds (2008-present) and is an employee of Fidelity Investments (2008-present). Previously, Ms. Dorsey served as Treasurer (2004-2008) of the JPMorgan Mutual Funds and Vice President (2004-2008) of JPMorgan Chase Bank. |
John R. Hebble (54) |
| Year of Election or Appointment: 2009 Assistant Treasurer of Fidelity's Equity and High Income Funds. Mr. Hebble also serves as President (2011-present), Treasurer, and Chief Financial Officer of The North Carolina Capital Management Trust: Cash and Term Portfolios (2008-present), President and Treasurer of other Fidelity funds (2008-present) and is an employee of Fidelity Investments. |
Gary W. Ryan (53) |
| Year of Election or Appointment: 2005 Assistant Treasurer of the Fidelity funds. Mr. Ryan is an employee of Fidelity Investments. Previously, Mr. Ryan served as Vice President of Fund Reporting in Fidelity Pricing and Cash Management Services (FPCMS) (1999-2005). |
Jonathan Davis (44) |
| Year of Election or Appointment: 2010 Assistant Treasurer of the Fidelity funds. Mr. Davis is also Assistant Treasurer of Fidelity Rutland Square Trust II and Fidelity Commonwealth Trust II. Mr. Davis is an employee of Fidelity Investments. Previously, Mr. Davis served as Vice President and Associate General Counsel of FMR LLC (2003-2010). |
Annual Report
The Board of Trustees of Fidelity Real Estate Income Fund voted to pay on September 10, 2012, to shareholders of record at the opening of business on September 7, 2012, a distribution of $0.143 per share derived from capital gains realized from sales of portfolio securities and a dividend of $0.15 per share from net investment income.
The fund hereby designates as a capital gain dividend with respect to the taxable year ended July 31,2012, $34,246,008, or, if subsequently determined to be different, the net capital gain of such year.
A total of 0.05% of the dividends distributed during the fiscal year was derived from interest on U.S. Government securities which is generally exempt from state income tax.
The fund will notify shareholders in January 2013 of amounts for use in preparing 2012 income tax returns.
Annual Report
Board Approval of Investment Advisory Contracts and Management Fees
Fidelity Real Estate Income Fund
Each year, the Board of Trustees, including the Independent Trustees (together, the Board), votes on the renewal of the management contract and sub-advisory agreements (together, the Advisory Contracts) for the fund. The Board, assisted by the advice of fund counsel and Independent Trustees' counsel, requests and considers a broad range of information relevant to the renewal of the Advisory Contracts throughout the year.
The Board meets regularly and, at each of its meetings, considers factors that are relevant to its annual consideration of the renewal of the fund's Advisory Contracts, including the services and support provided to the fund and its shareholders. The Board has established various standing committees, each composed of and chaired by Independent Trustees with varying backgrounds, to which the Board has assigned specific subject matter responsibilities in order to enhance effective decision-making by the Board. The Board, acting directly and through its Committees, requests and receives information concerning the annual consideration of the renewal of the fund's Advisory Contracts. The Board also meets as needed to consider matters specifically related to the Board's annual consideration of the renewal of Advisory Contracts. Members of the Board may also meet with trustees of other Fidelity funds through ad hoc joint committees to discuss certain matters relevant to the Fidelity funds.
At its July 2012 meeting, the Board of Trustees, including the Independent Trustees, unanimously determined to renew the fund's Advisory Contracts. In reaching its determination, the Board considered all factors it believed relevant, including (i) the nature, extent, and quality of the services to be provided to the fund and its shareholders (including the investment performance of the fund); (ii) the competitiveness of the fund's management fee and total expense ratio relative to peer funds; (iii) the total costs of the services to be provided by and the profits to be realized by Fidelity from its relationship with the fund; (iv) the extent to which economies of scale exist and would be realized as the fund grows; and (v) whether fee levels reflect these economies of scale, if any, for the benefit of fund shareholders.
In considering whether to renew the Advisory Contracts for the fund, the Board reached a determination, with the assistance of fund counsel and Independent Trustees' counsel and through the exercise of its business judgment, that the renewal of the Advisory Contracts is in the best interests of the fund and its shareholders and that the compensation payable under the Advisory Contracts is fair and reasonable. The Board's decision to renew the Advisory Contracts was not based on any single factor, but rather was based on a comprehensive consideration of all the information provided to the Board at its meetings throughout the year. The Board, in reaching its determination to renew the Advisory Contracts, is aware that shareholders in the fund have a broad range of investment choices available to them, including a wide choice among mutual funds offered by Fidelity's competitors, and that the fund's shareholders, who have the opportunity to review and weigh the disclosure provided by the fund in its prospectus and other public disclosures, have chosen to invest in this fund, managed by Fidelity.
Annual Report
Nature, Extent, and Quality of Services Provided. The Board considered the staffing within the investment adviser, FMR, and the sub-advisers (together, the Investment Advisers), including the backgrounds of the fund's investment personnel, and also considered the fund's investment objective, strategies, and related investment philosophy. The Independent Trustees also had discussions with senior management of Fidelity's investment operations and investment groups. The Board considered the structure of the portfolio manager compensation program and whether this structure provides appropriate incentives to act in the best interests of the fund.
Resources Dedicated to Investment Management and Support Services. The Board and the Fund Oversight and Research Committees reviewed the general qualifications and capabilities of the Investment Advisers' investment staff, including its size, education, experience, and resources, as well as the Investment Advisers' approach to recruiting, training, managing, and compensating investment personnel. The Board also noted that FMR has continued to increase the resources devoted to non-U.S. offices, including expansion of Fidelity's global investment organization. The Board noted that Fidelity's analysts have extensive resources, tools and capabilities that allow them to conduct sophisticated quantitative and fundamental analysis, as well as credit analysis of issuers, counterparties and guarantors. The Board also believes that Fidelity's investment professionals have sufficient access to global information and data so as to provide competitive investment results over time, and that those professionals also have access to sophisticated tools that permit them to assess portfolio construction and risk and performance attribution characteristics continuously, as well as to transmit new information and research conclusions rapidly around the world. Additionally, in its deliberations, the Board considered the Investment Advisers' trading and risk management capabilities and resources, which are an integral part of the investment management process.
Shareholder and Administrative Services. The Board considered (i) the nature, extent, quality, and cost of advisory, administrative, and shareholder services performed by the Investment Advisers and their affiliates under the Advisory Contracts and under separate agreements covering transfer agency, pricing and bookkeeping, and securities lending services for the fund; (ii) the nature and extent of the supervision of third party service providers, principally custodians and subcustodians; and (iii) the resources devoted to, and the record of compliance with, the fund's compliance policies and procedures. The Board also reviewed the allocation of fund brokerage, including allocations to brokers affiliated with the Investment Advisers, the use of brokerage commissions to pay fund expenses, and the use of "soft" commission dollars to pay for research services.
Annual Report
Board Approval of Investment Advisory Contracts and
Management Fees - continued
The Board noted that the growth of fund assets over time across the complex allows Fidelity to reinvest in the development of services designed to enhance the value or convenience of the Fidelity funds as investment vehicles. These services include 24-hour access to account information and market information through telephone representatives and over the Internet, investor education materials and asset allocation tools, and the expanded availability of Fidelity Investor Centers.
Investment in a Large Fund Family. The Board considered the benefits to shareholders of investing in a Fidelity fund, including the benefits of investing in a fund that is part of a large family of funds offering a variety of investment disciplines and providing a large variety of mutual fund investor services. The Board noted that Fidelity had taken, or had made recommendations that resulted in the Fidelity funds taking, a number of actions over the previous year that benefited particular funds, including (i) continuing to dedicate additional resources to investment research and support of the senior management team that oversees asset management; (ii) persisting in efforts to enhance Fidelity's research capabilities, in particular, international research; (iii) launching new funds and making other enhancements to meet client needs for global and income-oriented solutions; (iv) continuing to launch dedicated lower cost underlying funds to meet investment management's portfolio construction needs related to expanding underlying fund options, specifically for the Freedom Fund product lines; (v) adopting a "Stock Selector" sector neutral investment approach and employing a team of portfolio managers who are sector specialists to manage certain funds; (vi) rationalizing product lines and gaining increased efficiencies through the mergers of several funds into other funds; (vii) strengthening the Spartan Index Fund product line by adding new funds and/or new low-cost institutional share classes, restructuring fund expenses to accommodate new classes, and reducing investment minimums for certain classes of shares; (viii) modifying the eligibility criteria for Institutional Class shares to increase their appeal to government entities and charitable investors; and (ix) reducing certain transfer agent fee rates.
Investment Performance. The Board considered whether the fund has operated in accordance with its investment objective, as well as its record of compliance with its investment restrictions. It also reviewed the fund's absolute investment performance for each class, as well as the fund's relative investment performance for each class measured over multiple periods against (i) a proprietary custom index, and (ii) a peer group of mutual funds deemed appropriate by Fidelity and reviewed by the Board. The following charts considered by the Board show, over the one-, three-, and five-year periods ended December 31, 2011, as available, the cumulative total returns of the retail class and Class C of the fund, the cumulative total returns of a proprietary custom index ("benchmark"), and a range of cumulative total returns of a peer group of mutual funds identified by Lipper Inc. as having an investment objective similar to that of the fund. The returns of the retail class and Class C show the performance of the highest performing class (based on five-year performance) and the lowest performing class (based on one-year performance), respectively. The box within each chart shows the 25th percentile return (top of box) and the 75th percentile return (bottom of box) of the peer group. Returns shown above the box are in the first quartile and returns shown below the box are in the fourth quartile. The percentage beaten numbers noted below each chart correspond to the percentile box and represent the percentage of funds in the peer group whose performance was equal to or lower than that of the class indicated. The fund's proprietary custom index is an index developed by FMR that represents the performance of the fund's unmanaged indexes.
Annual Report
Fidelity Real Estate Income Fund

The Board reviewed the fund's relative investment performance against its peer group and noted that the performance of the retail class of the fund (the class with the longest performance record) was in the fourth quartile for the one-year period and the first quartile for three- and five-year periods. The Board also noted that the investment performance of the fund was lower than its benchmark for all the periods shown. The Board considered that the variations in performance among the fund's classes reflect the variations in class expenses, which result in lower performance for higher expense classes. The Board discussed with FMR the fact that the fund underperformed its benchmark for each period measured. The Board also reviewed the fund's performance since inception as well as performance in the current year. The Board will continue to closely monitor performance of the fund in the coming year and discuss with FMR if other actions to address performance are appropriate.
Annual Report
Board Approval of Investment Advisory Contracts and
Management Fees - continued
Based on its review, the Board concluded that the nature, extent, and quality of services provided to the fund under the Advisory Contracts should benefit the fund's shareholders.
Competitiveness of Management Fee and Total Expense Ratio. The Board considered the fund's management fee and total expense ratio compared to "mapped groups" of competitive funds and classes. Fidelity creates "mapped groups" by combining similar Lipper investment objective categories that have comparable management fee characteristics. Combining Lipper investment objective categories aids the Board's management fee and total expense ratio comparisons by broadening the competitive group used for comparison and by reducing the number of universes to which various Fidelity funds are compared.
Management Fee. The Board considered two proprietary management fee comparisons for the 12-month periods shown in the chart below. The group of Lipper funds used by the Board for management fee comparisons is referred to below as the "Total Mapped Group." The Total Mapped Group is broader than the Lipper peer group used by the Board for performance comparisons because the Total Mapped Group combines several Lipper investment objective categories while the Lipper peer group does not. The Total Mapped Group comparison focuses on a fund's standing relative to the total universe of comparable funds available to investors in terms of gross management fees before expense reimbursements or caps. "TMG %" represents the percentage of funds in the Total Mapped Group that had management fees that were lower than the fund's. For example, a TMG % of 6% means that 94% of the funds in the Total Mapped Group had higher management fees than the fund. The "Asset-Size Peer Group" (ASPG) comparison focuses on a fund's standing relative to non-Fidelity funds similar in size to the fund within the Total Mapped Group. The ASPG represents at least 15% of the funds in the Total Mapped Group with comparable asset size and management fee characteristics, subject to a minimum of 50 funds (or all funds in the Total Mapped Group if fewer than 50). Additional information, such as the ASPG quartile in which the fund's management fee ranked, is also included in the chart and considered by the Board.
Annual Report
Fidelity Real Estate Income Fund
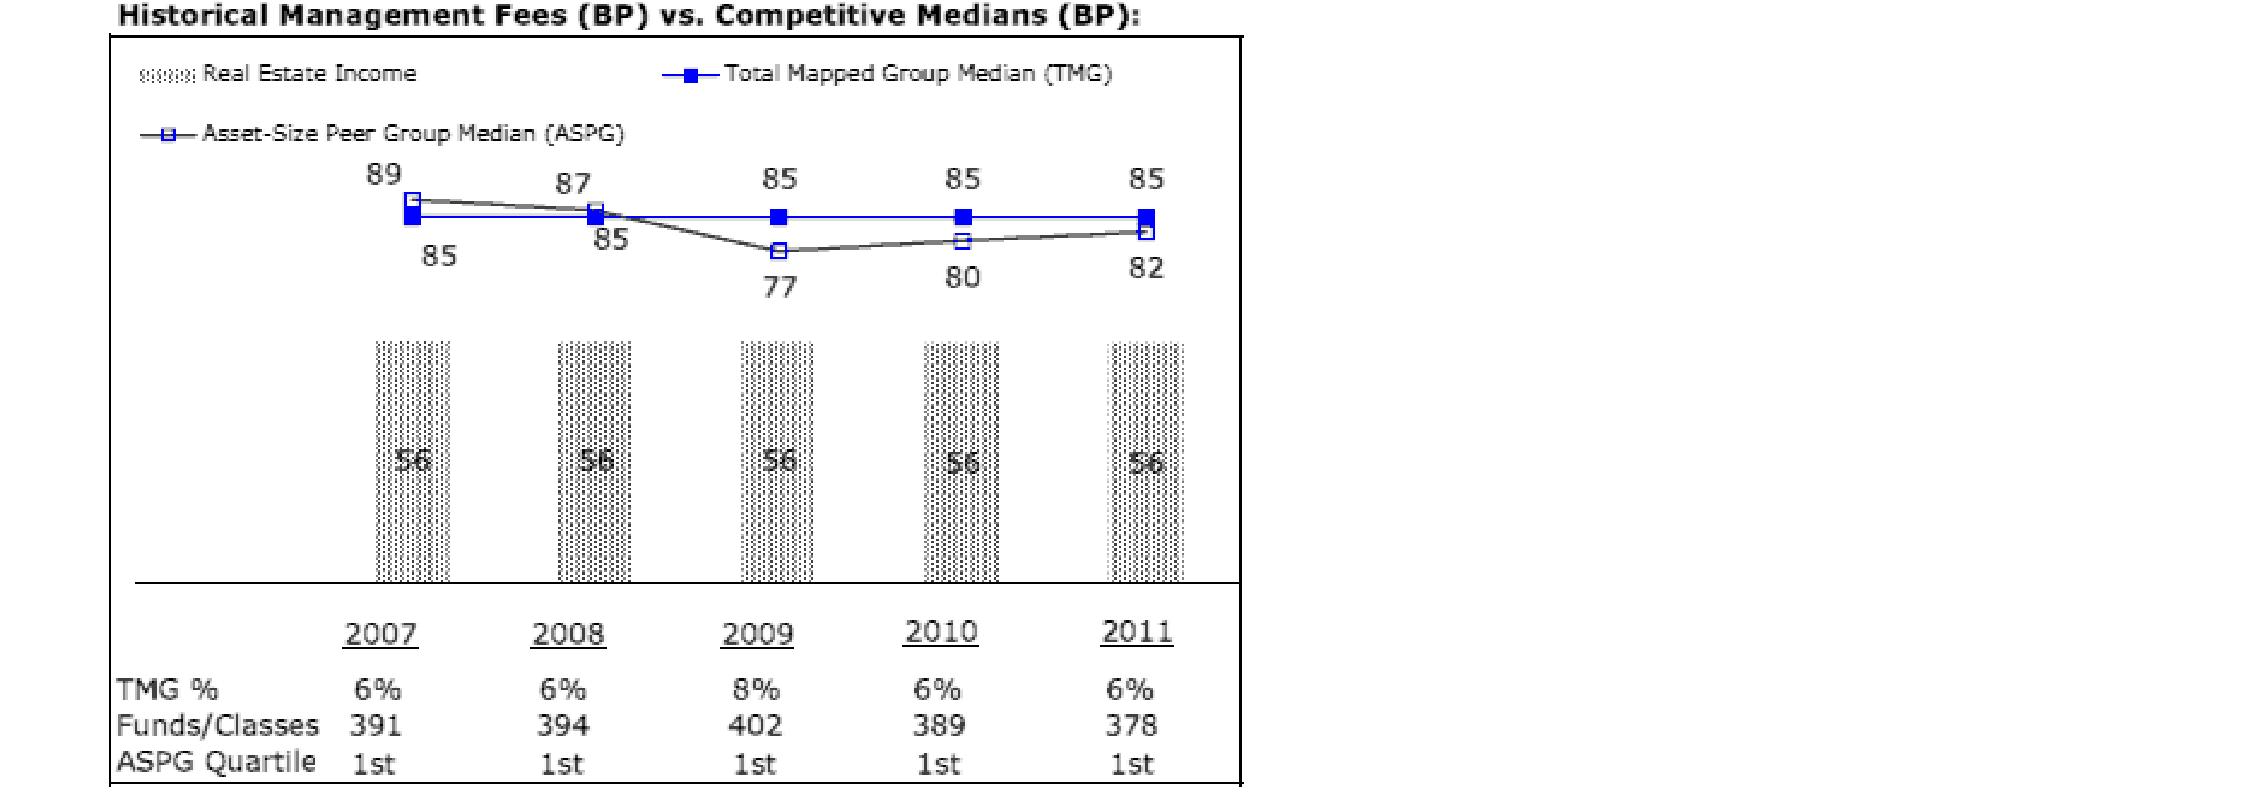
The Board noted that the fund's management fee ranked below the median of its Total Mapped Group and below the median of its ASPG for 2011.
Based on its review, the Board concluded that the fund's management fee is fair and reasonable in light of the services that the fund receives and the other factors considered.
Total Expense Ratio. In its review of each class's total expense ratio, the Board considered the fund's management fee as well as other fund or class expenses, as applicable, such as transfer agent fees, pricing and bookkeeping fees, fund-paid 12b-1 fees, and custodial, legal, and audit fees. The Board also noted the effects of any waivers and reimbursements on fees and expenses. As part of its review, the Board also considered the current and historical total expense ratios of each class of the fund compared to competitive fund median expenses. Each class of the fund is compared to those funds and classes in the Total Mapped Group (used by the Board for management fee comparisons) that have a similar sales load structure.
The Board noted that the total expense ratio of each class ranked below its competitive median for 2011.
Fees Charged to Other Fidelity Clients. The Board also considered Fidelity fee structures and other information with respect to clients of FMR and its affiliates, such as other mutual funds advised or subadvised by FMR or its affiliates, pension plan clients, and other institutional clients. The Board noted the findings of the 2010 ad hoc joint committee (created with the board of other Fidelity funds), which reviewed and compared Fidelity's institutional investment advisory business with its business of providing services to the Fidelity funds, including the differences in services provided, fees charged, and costs incurred, as well as competition in their respective marketplaces.
Annual Report
Board Approval of Investment Advisory Contracts and
Management Fees - continued
Based on its review of total expense ratios and fees charged to other Fidelity clients, the Board concluded that the total expense ratio of each class of the fund was reasonable in light of the services that the fund and its shareholders receive and the other factors considered.
Costs of the Services and Profitability. The Board considered the revenues earned and the expenses incurred by Fidelity in conducting the business of developing, marketing, distributing, managing, administering and servicing the fund and its shareholders. The Board also considered the level of Fidelity's profits in respect of all the Fidelity funds.
On an annual basis, FMR presents to the Board Fidelity's profitability for the fund. Fidelity calculates the profitability for each fund, as well as aggregate profitability for groups of Fidelity funds and all Fidelity funds, using a series of detailed revenue and cost allocation methodologies which originate with the books and records of Fidelity on which Fidelity's audited financial statements are based. The Audit Committee of the Board reviews any significant changes from the prior year's methodologies.
PricewaterhouseCoopers LLP (PwC), independent registered public accounting firm and auditor to Fidelity and certain Fidelity funds, has been engaged annually by the Board as part of the Board's assessment of Fidelity's profitability analysis. PwC's engagement includes the review and assessment of Fidelity's methodologies used in determining the revenues and expenses attributable to Fidelity's mutual fund business, and completion of agreed-upon procedures surrounding the mathematical accuracy of fund profitability and its conformity to allocation methodologies. After considering PwC's reports issued under the engagement and information provided by Fidelity, the Board concluded that while other allocation methods may also be reasonable, Fidelity's profitability methodologies are reasonable in all material respects.
The Board also reviewed Fidelity's non-fund businesses and fall-out benefits related to the mutual fund business as well as cases where Fidelity's affiliates may benefit from or be related to the fund's business.
The Board considered the costs of the services provided by and the profits realized by Fidelity in connection with the operation of the fund and was satisfied that the profitability was not excessive in the circumstances.
Economies of Scale. The Board considered whether there have been economies of scale in respect of the management of the Fidelity funds, whether the Fidelity funds (including the fund) have appropriately benefited from any such economies of scale, and whether there is potential for realization of any further economies of scale. The Board considered the extent to which the fund will benefit from economies of scale through increased services to the fund, through waivers or reimbursements, or through fee or expense reductions. The Board also noted that in 2009, it and the board of other Fidelity funds created an ad hoc committee (the Economies of Scale Committee) to analyze whether FMR attains economies of scale in respect of the management and servicing of the Fidelity funds, whether the Fidelity funds have appropriately benefited from such economies of scale, and whether there is potential for realization of any further economies of scale.
Annual Report
The Board recognized that the fund's management contract incorporates a "group fee" structure, which provides for lower group fee rates as total fund assets under FMR's management increase, and for higher group fee rates as total fund assets under FMR's management decrease. FMR calculates the group fee rates based on a tiered asset "breakpoint" schedule that varies based on asset class. The Board considered that the group fee is designed to deliver the benefits of economies of scale to fund shareholders when total Fidelity fund assets increase, even if assets of any particular fund are unchanged or have declined, because some portion of Fidelity's costs are attributable to services provided to all Fidelity funds, and all funds benefit if those costs can be allocated among more assets. The Board concluded that, given the group fee structure, fund shareholders will benefit from lower management fees as assets under FMR's management increase at the fund complex level, regardless of whether Fidelity achieves any such economies of scale.
The Board concluded, taking into account the analysis of the Economies of Scale Committee, that economies of scale, if any, are being appropriately shared between fund shareholders and Fidelity.
Additional Information Requested by the Board. In order to develop fully the factual basis for consideration of the Fidelity funds' Advisory Contracts, the Board requested and received additional information on certain topics, including (i) fund performance trends, actions to be taken by FMR to improve certain funds' overall performance, and Fidelity's long-term strategies for certain funds; (ii) the potential to further rationalize the Fidelity fund lineup with the possibility of achieving savings for the funds and Fidelity; (iii) Fidelity's compensation structure for portfolio managers and other key investment personnel; (iv) the amount of the investment that each portfolio manager has made in the Fidelity fund(s) that he or she manages; (v) the realization of fall-out benefits in certain Fidelity business units; (vi) Fidelity's group fee structures, the potential impact of regulatory changes on such structures, and the rationale for the individual fee rates of certain funds; (vii) fund profitability methodology, including Fidelity's cost allocation methodology, and the impact of certain factors on fund profitability results; (viii) trends regarding industry use of performance fee structures and the possibility of implementing performance fee structures for additional funds; and (ix) the impact of net redemptions from the Fidelity funds.
Annual Report
Board Approval of Investment Advisory Contracts and
Management Fees - continued
Based on its evaluation of all of the conclusions noted above, and after considering all factors it believed relevant, the Board ultimately concluded that the advisory fee structures are fair and reasonable, and that the fund's Advisory Contracts should be renewed.
Annual Report
Investment Adviser
Fidelity Management & Research Company
Boston, MA
Investment Sub-Advisers
FMR Co., Inc.
Fidelity Management & Research
(U.K.) Inc.
Fidelity Management & Research
(Hong Kong) Limited
Fidelity Management & Research
(Japan) Inc.
General Distributor
Fidelity Distributors Corporation
Smithfield, RI
Transfer and Service Agents
Fidelity Investments Institutional
Operations Company, Inc.
Boston, MA
Fidelity Service Company, Inc.
Boston, MA
Custodian
Citibank, N.A.
New York, NY
The Fidelity Telephone Connection
Mutual Fund 24-Hour Service
Exchanges/Redemptions
and Account Assistance 1-800-544-6666
Product Information 1-800-544-6666
Retirement Accounts 1-800-544-4774
(8 a.m. - 9 p.m.)
TDD Service 1-800-544-0118
for the deaf and hearing impaired
(9 a.m. - 9 p.m. Eastern time)
Fidelity Automated Service
Telephone (FAST®)
1-800-544-5555
Automated line for quickest service
(Fidelity Investment logo)(registered trademark)
Corporate Headquarters
82 Devonshire St., Boston, MA 02109
www.fidelity.com
REI-UANN-0912
1.789710.109
(Fidelity Investment logo)(registered trademark)
Fidelity Advisor®
Real Estate Income
Fund - Institutional Class
Annual Report
July 31, 2012
(Fidelity Cover Art)
Institutional Class
is a class of Fidelity®
Real Estate Income Fund
Contents
Performance | (Click Here) | How the fund has done over time. |
Management's Discussion of Fund Performance | (Click Here) | The Portfolio Manager's review of fund performance and strategy. |
Shareholder Expense Example | (Click Here) | An example of shareholder expenses. |
Investment Changes | (Click Here) | A summary of the fund's holdings. |
Investments | (Click Here) | A complete list of the fund's investments with their market values. |
Financial Statements | (Click Here) | Statements of assets and liabilities, operations, and changes in net assets, as well as financial highlights. |
Notes | (Click Here) | Notes to the financial statements. |
Report of Independent Registered Public Accounting Firm | (Click Here) | |
Trustees and Officers | (Click Here) | |
Distributions | (Click Here) | |
Board Approval of Investment Advisory Contracts and Management Fees | (Click Here) | |
To view a fund's proxy voting guidelines and proxy voting record for the 12-month period ended June 30, visit http://www.fidelity.com/proxyvotingresults or visit the Securities and Exchange Commission's (SEC) web site at http://www.sec.gov. You may also call 1-877-208-0098 to request a free copy of the proxy voting guidelines.
Standard & Poor's, S&P and S&P 500 are registered service marks of The McGraw-Hill Companies, Inc. and have been licensed for use by Fidelity Distributors Corporation.
Other third party marks appearing herein are the property of their respective owners.
All other marks appearing herein are registered or unregistered trademarks or service marks of FMR LLC or an affiliated company. © 2012 FMR LLC. All rights reserved.
This report and the financial statements contained herein are submitted for the general information of the shareholders of the fund. This report is not authorized for distribution to prospective investors in the fund unless preceded or accompanied by an effective prospectus.
A fund files its complete schedule of portfolio holdings with the SEC for the first and third quarters of each fiscal year on Form N-Q. Forms N-Q are available on the SEC's web site at http://www.sec.gov. A fund's Forms N-Q may be reviewed and copied at the SEC's Public Reference Room in Washington, DC. Information regarding the operation of the SEC's Public Reference Room may be obtained by calling 1-800-SEC-0330. For a complete list of a fund's portfolio holdings, view the most recent holdings listing, semiannual report, or annual report on Fidelity's web site at http://www.fidelity.com, http://www.advisor.fidelity.com, or http://www.401k.com, as applicable.
NOT FDIC INSURED • MAY LOSE VALUE • NO BANK GUARANTEE
Neither the fund nor Fidelity Distributors Corporation is a bank.
Annual Report
Average annual total return reflects the change in the value of an investment, assuming reinvestment of the class' distributions from dividend income and capital gains (the profits earned upon the sale of securities that have grown in value, if any) and assuming a constant rate of performance each year. The $10,000 table and the fund's returns do not reflect the deduction of taxes that a shareholder would pay on fund distributions or the redemption of fund shares. During periods of reimbursement by Fidelity, a fund's total return will be greater than it would be had the reimbursement not occurred. How a fund did yesterday is no guarantee of how it will do tomorrow.
Average Annual Total Returns
Periods ended July 31, 2012 | Past 1
year | Past 5
years | Life of
fund A |
Institutional ClassB | 11.62% | 6.73% | 7.82% |
A From February 4, 2003.
B The initial offering of Institutional Class shares took place on April 14, 2010. Returns prior to April 14, 2010 are those of Fidelity® Real Estate Income Fund, the original class of the fund.
$10,000 Over Life of Fund
Let's say hypothetically that $10,000 was invested in Fidelity Advisor® Real Estate Income Fund - Institutional Class on February 4, 2003, when the fund started. The chart shows how the value of your investment would have changed, and also shows how the S&P 500® Index performed over the same period. The initial offering of Institutional Class took place on April 14, 2010. See above for additional information regarding the performance of Institutional Class.
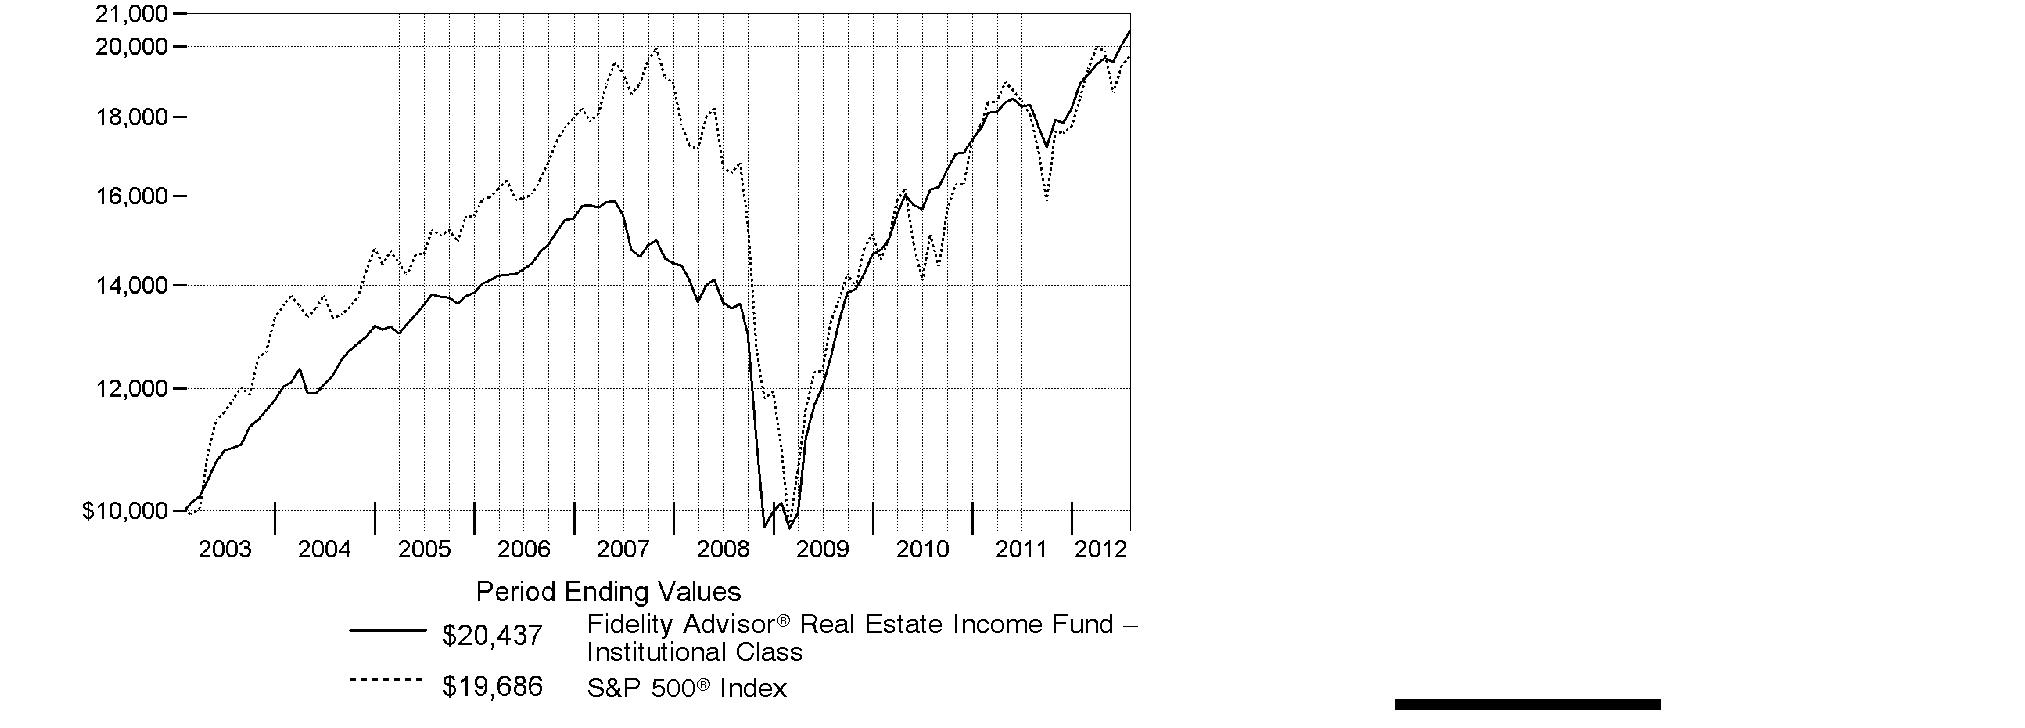
Annual Report
Market Recap: Market conditions shifted between intervals of "risk on" and "risk off" during the 12-month period ending July 31, 2012. During the risk-off times - including several extended stretches in the second half of 2011 as well as May 2012 - macro concerns about the eurozone debt crisis and slowing U.S. economic growth took center stage. For most of the first seven months of 2012, however, risk-on returned to the market, causing credit spreads across most asset classes to rally. For real estate, the story was a combination of lower interest rates and good property supply-and-demand fundamentals. Lower interest rates made income-generating real estate securities look more attractive, while good business fundamentals created rising earnings for property owners. In all, common stocks of real estate investment trusts (REITs), as measured by the FTSE® NAREIT® All REITs Index, gained 14.79%, while real estate bonds, reflected in The BofA Merrill LynchSM US Real Estate Index - a market-capitalization-weighted measure of the performance of investment-grade public debt of corporate issuers in the domestic real estate sector - rose 8.39%. The MSCI® REIT Preferred Index, which reflects the performance of real estate preferred stocks, returned 11.28%, while the broad U.S. equity market, as measured by the S&P 500® Index, returned 9.13%.
Comments from Mark Snyderman, Portfolio Manager of Fidelity Advisor® Real Estate Income Fund: For the year, the fund's Institutional Class shares returned 11.62%. In comparison, the Fidelity Real Estate Income Composite IndexSM - a 40/40/20 blend of the MSCI® REIT Preferred Index, The BofA Merrill LynchSM US Real Estate Index and the FTSE® NAREIT® All REITs Index, respectively - rose 11.14%. In a favorable environment for real estate securities, all of the fund's asset classes enjoyed positive performance, led by REIT common stocks. Meanwhile, the fund's preferred real estate stocks modestly outpaced the average preferred stock in the MSCI index. Looking at the fund's fixed-income holdings, investments in high-yield real estate bonds and commercial mortgage-backed securities (CMBS) beat the BofA Merrill Lynch index by nearly three percentage points. One area of slight underperformance came from the portfolio's investment-grade real estate bond holdings, which, because of my decision to limit interest rate risk, returned somewhat less than the BofA Merrill Lynch index. In addition, holding a roughly 8% cash position limited the fund's upside in a generally rising market.
The views expressed above reflect those of the portfolio manager(s) only through the end of the period as stated on the cover of this report and do not necessarily represent the views of Fidelity or any other person in the Fidelity organization. Any such views are subject to change at any time based upon market or other conditions and Fidelity disclaims any responsibility to update such views. These views may not be relied on as investment advice and, because investment decisions for a Fidelity fund are based on numerous factors, may not be relied on as an indication of trading intent on behalf of any Fidelity fund.
Annual Report
Shareholder Expense Example
As a shareholder of the Fund, you incur two types of costs: (1) transaction costs, including sales charges (loads) on purchase payments or redemption proceeds, redemption fees and (2) ongoing costs, including management fees, distribution and/or service (12b-1) fees and other Fund expenses. This Example is intended to help you understand your ongoing costs (in dollars) of investing in the Fund and to compare these costs with the ongoing costs of investing in other mutual funds.
The Example is based on an investment of $1,000 invested at the beginning of the period and held for the entire period (February 1, 2012 to July 31, 2012).
Actual Expenses
The first line of the accompanying table for each class of the Fund provides information about actual account values and actual expenses. You may use the information in this line, together with the amount you invested, to estimate the expenses that you paid over the period. Simply divide your account value by $1,000.00 (for example, an $8,600 account value divided by $1,000.00 = 8.6), then multiply the result by the number in the first line for a class of the Fund under the heading entitled "Expenses Paid During Period" to estimate the expenses you paid on your account during this period. A small balance maintenance fee of $12.00 that is charged once a year may apply for certain accounts with a value of less than $2,000. This fee is not included in the table below. If it was, the estimate of expenses you paid during the period would be higher, and your ending account value lower, by this amount. In addition, the Fund, as a shareholder in the underlying Fidelity Central Funds, will indirectly bear its pro-rata share of the fees and expenses incurred by the underlying Fidelity Central Funds. These fees and expenses are not included in the Fund's annualized expense ratio used to calculate the expense estimate in the table below.
Hypothetical Example for Comparison Purposes
The second line of the accompanying table for each class of the Fund provides information about hypothetical account values and hypothetical expenses based on a Class' actual expense ratio and an assumed rate of return of 5% per year before expenses, which is not the Class' actual return. The hypothetical account values and expenses may not be used to estimate the actual ending account balance or expenses you paid for the period. You may use this information to compare the ongoing costs of investing in the Fund and other funds. To do so, compare this 5% hypothetical example with the 5% hypothetical examples that appear in the shareholder reports of the other funds. A small balance maintenance fee of $12.00 that is charged once a year may apply for certain accounts with a value of less than $2,000. This fee is not included in the table below. If it was, the estimate of expenses you paid during the period would be higher, and your ending account value lower, by this amount. In addition, the Fund, as a shareholder in the underlying Fidelity Central Funds, will indirectly bear its pro-rata share of the fees and expenses incurred by the underlying Fidelity Central Funds. These fees and expenses are not included in the Fund's annualized expense ratio used to calculate the expense estimate in the table below.
Please note that the expenses shown in the table are meant to highlight your ongoing costs only and do not reflect any transaction costs. Therefore, the second line of the table is useful in comparing ongoing costs only, and will not help you determine the relative total costs of owning different funds. In addition, if these transactional costs were included, your costs would have been higher.
Annual Report
| Annualized Expense Ratio | Beginning
Account Value
February 1, 2012 | Ending
Account Value
July 31, 2012 | Expenses Paid
During Period*
February 1, 2012
to July 31, 2012 |
Class A | 1.11% | | | |
Actual | | $ 1,000.00 | $ 1,079.20 | $ 5.74 |
HypotheticalA | | $ 1,000.00 | $ 1,019.34 | $ 5.57 |
Class T | 1.09% | | | |
Actual | | $ 1,000.00 | $ 1,078.30 | $ 5.63 |
HypotheticalA | | $ 1,000.00 | $ 1,019.44 | $ 5.47 |
Class C | 1.85% | | | |
Actual | | $ 1,000.00 | $ 1,074.60 | $ 9.54 |
HypotheticalA | | $ 1,000.00 | $ 1,015.66 | $ 9.27 |
Real Estate Income | .88% | | | |
Actual | | $ 1,000.00 | $ 1,079.80 | $ 4.55 |
HypotheticalA | | $ 1,000.00 | $ 1,020.49 | $ 4.42 |
Institutional Class | .82% | | | |
Actual | | $ 1,000.00 | $ 1,080.30 | $ 4.24 |
HypotheticalA | | $ 1,000.00 | $ 1,020.79 | $ 4.12 |
A 5% return per year before expenses
* Expenses are equal to each Class' annualized expense ratio, multiplied by the average account value over the period, multiplied by 182/366 (to reflect the one-half year period).
Annual Report
Investment Changes (Unaudited)
Top Five Stocks as of July 31, 2012 |
| % of fund's
net assets | % of fund's net assets
6 months ago |
Ventas, Inc. | 1.9 | 2.0 |
Equity Lifestyle Properties, Inc. | 1.8 | 1.5 |
MFA Financial, Inc. | 1.7 | 1.6 |
Acadia Realty Trust (SBI) | 1.5 | 1.6 |
Equity Lifestyle Properties, Inc. 8.034% | 1.0 | 1.1 |
| 7.9 | |
Top 5 Bonds as of July 31, 2012 |
| % of fund's
net assets | % of fund's net assets
6 months ago |
Banc of America Large Loan Trust floater Series 2010-HLTN Class HLTN, 1.992% 11/15/15 | 4.2 | 2.6 |
Annaly Capital Management, Inc. 5% 5/15/15 | 1.3 | 0.0 |
Forest City Enterprises, Inc. 7.625% 6/1/15 | 1.3 | 0.8 |
Standard Pacific Corp. 8.375% 5/15/18 | 1.2 | 1.4 |
iStar Financial, Inc. 5.875% 3/15/16 | 1.2 | 0.3 |
| 9.2 | |
Top Five REIT Sectors as of July 31, 2012 |
| % of fund's
net assets | % of fund's net assets
6 months ago |
REITs - Mortgage | 11.9 | 6.4 |
REITs - Management/Investment | 6.8 | 7.3 |
REITs - Shopping Centers | 6.5 | 6.9 |
REITs - Health Care Facilities | 6.0 | 6.6 |
REITs - Office Buildings | 3.5 | 3.8 |
Asset Allocation (% of fund's net assets) |
As of July 31, 2012 * | As of January 31, 2012 ** |
 | Common Stocks 23.1% | | | Common Stocks 24.2% | |
 | Preferred Stocks 13.3% | | | Preferred Stocks 11.2% | |
 | Bonds 48.6% | |  | Bonds 48.6% | |
 | Convertible Securities 4.0% | | | Convertible Securities 3.4% | |
 | Other Investments 4.9% | | | Other Investments 4.2% | |
 | Short-Term Investments and Net Other Assets (Liabilities) 6.1% | | | Short-Term Investments and Net Other Assets (Liabilities) 8.4% | |
* Foreign investments | 4.9% | | ** Foreign investments | 6.0% | |

Annual Report
Investments July 31, 2012
Showing Percentage of Net Assets
Common Stocks - 23.1% |
| Shares | | Value |
CONSUMER DISCRETIONARY - 1.2% |
Household Durables - 1.2% |
NVR, Inc. (a) | 6,700 | | $ 5,185,666 |
Standard Pacific Corp. (a)(f) | 3,120,100 | | 17,690,967 |
Stanley Martin Communities LLC Class B (a) | 4,620 | | 4,116,420 |
Toll Brothers, Inc. (a) | 183,100 | | 5,341,027 |
| | 32,334,080 |
FINANCIALS - 20.6% |
Capital Markets - 0.1% |
HFF, Inc. (a) | 243,214 | | 3,176,375 |
Real Estate Investment Trusts - 20.1% |
Acadia Realty Trust (SBI) | 1,709,649 | | 40,928,997 |
American Campus Communities, Inc. | 76,000 | | 3,622,160 |
American Residential Properties, Inc. (h) | 453,000 | | 9,060,000 |
American Tower Corp. | 190,500 | | 13,775,055 |
AmREIT, Inc. (g) | 200,000 | | 2,818,000 |
Annaly Capital Management, Inc. | 329,150 | | 5,737,085 |
Anworth Mortgage Asset Corp. | 1,065,710 | | 7,076,314 |
Apartment Investment & Management Co. Class A | 414,700 | | 11,375,221 |
Associated Estates Realty Corp. | 309,400 | | 4,619,342 |
Canadian (REIT) | 107,800 | | 4,529,782 |
CapLease, Inc. | 2,465,600 | | 11,218,480 |
CBL & Associates Properties, Inc. | 1,065,273 | | 21,017,836 |
Chartwell Seniors Housing (REIT) | 509,700 | | 5,102,845 |
Chartwell Seniors Housing (REIT) (h) | 78,500 | | 785,900 |
Chesapeake Lodging Trust | 223,500 | | 3,792,795 |
Chimera Investment Corp. | 813,000 | | 1,756,080 |
CommonWealth REIT | 333,000 | | 6,073,920 |
Cousins Properties, Inc. | 190,400 | | 1,445,136 |
Cys Investments, Inc. (f) | 915,339 | | 13,235,802 |
DCT Industrial Trust, Inc. | 1,008,900 | | 6,315,714 |
DiamondRock Hospitality Co. | 531,400 | | 5,027,044 |
Douglas Emmett, Inc. | 260,200 | | 6,117,302 |
Dynex Capital, Inc. | 1,546,243 | | 16,065,465 |
EastGroup Properties, Inc. | 67,900 | | 3,631,292 |
Education Realty Trust, Inc. | 281,800 | | 3,302,696 |
Equity Lifestyle Properties, Inc. | 672,130 | | 48,339,590 |
Excel Trust, Inc. | 717,228 | | 8,778,871 |
First Potomac Realty Trust | 430,815 | | 4,993,146 |
Glimcher Realty Trust | 600,500 | | 6,017,010 |
H&R REIT/H&R Finance Trust | 256,500 | | 6,394,276 |
Hatteras Financial Corp. | 214,100 | | 6,262,425 |
Common Stocks - continued |
| Shares | | Value |
FINANCIALS - continued |
Real Estate Investment Trusts - continued |
Highwoods Properties, Inc. (SBI) | 101,400 | | $ 3,434,418 |
Lexington Corporate Properties Trust | 2,623,482 | | 23,453,929 |
LTC Properties, Inc. | 357,113 | | 12,748,934 |
MFA Financial, Inc. | 5,645,781 | | 45,617,910 |
Mid-America Apartment Communities, Inc. | 58,900 | | 4,077,647 |
Monmouth Real Estate Investment Corp. Class A | 249,773 | | 2,782,471 |
National Health Investors, Inc. | 70,306 | | 3,774,729 |
National Retail Properties, Inc. | 114,100 | | 3,365,950 |
Newcastle Investment Corp. | 2,920,700 | | 21,759,215 |
Prologis, Inc. | 654,887 | | 21,172,497 |
Retail Properties America, Inc. | 216,700 | | 2,160,499 |
Select Income (REIT) | 155,600 | | 3,914,896 |
Senior Housing Properties Trust (SBI) | 505,300 | | 11,495,575 |
Stag Industrial, Inc. | 572,831 | | 8,283,136 |
Summit Hotel Properties, Inc. | 511,088 | | 4,242,030 |
Sunstone Hotel Investors, Inc. (a) | 211,700 | | 2,119,117 |
Terreno Realty Corp. | 190,264 | | 2,836,836 |
Two Harbors Investment Corp. | 470,480 | | 5,396,406 |
Ventas, Inc. | 765,946 | | 51,509,869 |
Washington (REIT) (SBI) | 44,700 | | 1,193,490 |
Western Asset Mortgage Capital Corp. | 163,100 | | 3,330,502 |
Weyerhaeuser Co. | 272,429 | | 6,361,217 |
Whitestone REIT Class B | 379,067 | | 5,174,265 |
| | 539,421,119 |
Real Estate Management & Development - 0.4% |
Brookfield Asset Management, Inc. Class A | 171,900 | | 5,831,418 |
Kennedy-Wilson Holdings, Inc. | 291,209 | | 3,983,739 |
| | 9,815,157 |
TOTAL FINANCIALS | | 552,412,651 |
HEALTH CARE - 1.1% |
Health Care Providers & Services - 1.1% |
Brookdale Senior Living, Inc. (a) | 828,300 | | 13,633,818 |
Capital Senior Living Corp. (a) | 852,950 | | 9,587,158 |
Emeritus Corp. (a) | 356,493 | | 6,042,556 |
| | 29,263,532 |
Common Stocks - continued |
| Shares | | Value |
TELECOMMUNICATION SERVICES - 0.2% |
Wireless Telecommunication Services - 0.2% |
SBA Communications Corp. Class A (a) | 101,900 | | $ 6,018,214 |
TOTAL COMMON STOCKS (Cost $502,122,859) |
620,028,477
|
Preferred Stocks - 14.7% |
| | | |
Convertible Preferred Stocks - 1.4% |
FINANCIALS - 1.4% |
Real Estate Investment Trusts - 1.4% |
Alexandria Real Estate Equities, Inc. Series D 7.00% | 95,000 | | 2,517,500 |
CommonWealth REIT 6.50% | 396,216 | | 9,449,752 |
Excel Trust, Inc. 7.00% (h) | 248,200 | | 5,924,038 |
Health Care REIT, Inc. Series I, 6.50% | 46,800 | | 2,652,975 |
Lexington Corporate Properties Trust Series C, 6.50% | 350,566 | | 16,578,266 |
Ramco-Gershenson Properties Trust (SBI) Series D, 7.25% | 40,000 | | 2,052,000 |
| | 39,174,531 |
Nonconvertible Preferred Stocks - 13.3% |
CONSUMER DISCRETIONARY - 0.0% |
Household Durables - 0.0% |
M/I Homes, Inc. Series A, 9.75% (a) | 36,700 | | 633,075 |
FINANCIALS - 13.3% |
Diversified Financial Services - 0.2% |
DRA CRT Acquisition Corp. Series A, 8.50% | 25,000 | | 425,000 |
Red Lion Hotels Capital Trust 9.50% | 163,225 | | 4,245,482 |
| | 4,670,482 |
Real Estate Investment Trusts - 12.4% |
American Capital Agency Corp. 8.00% | 200,000 | | 5,270,000 |
American Home Mortgage Investment Corp.: | | | |
Series A, 9.375% (a) | 120,300 | | 1,203 |
Series B, 9.25% (a) | 124,100 | | 124 |
Annaly Capital Management, Inc.: | | | |
Series A, 7.875% | 134,900 | | 3,616,669 |
Series C, 7.625% | 77,837 | | 2,000,411 |
Anworth Mortgage Asset Corp. Series A, 8.625% | 309,630 | | 8,112,306 |
Apollo Commercial Real Estate Finance, Inc. Series A, 8.625% (a) | 120,977 | | 3,039,547 |
Ashford Hospitality Trust, Inc. Series E, 9.00% | 85,751 | | 2,288,694 |
Preferred Stocks - continued |
| Shares | | Value |
Nonconvertible Preferred Stocks - continued |
FINANCIALS - continued |
Real Estate Investment Trusts - continued |
Brandywine Realty Trust Series D, 7.375% | 34,596 | | $ 888,079 |
Campus Crest Communities, Inc. Series A, 8.00% | 248,431 | | 6,608,265 |
CapLease, Inc.: | | | |
Series A, 8.125% | 132,510 | | 3,336,602 |
Series B, 8.375% | 320,000 | | 8,323,200 |
CBL & Associates Properties, Inc.: | | | |
(depositary shares) Series C, 7.75% | 147,962 | | 3,762,674 |
7.375% | 274,876 | | 7,006,589 |
Cedar Shopping Centers, Inc. 8.875% | 274,022 | | 7,050,586 |
CenterPoint Properties Trust Series D, 5.377% | 3,575 | | 2,162,875 |
Chesapeake Lodging Trust Series A, 7.75% (a) | 229,017 | | 5,796,420 |
Colony Financial, Inc. Series A, 8.50% | 282,171 | | 7,195,361 |
CommonWealth REIT 7.50% | 93,300 | | 2,035,806 |
Corporate Office Properties Trust: | | | |
Series H, 7.50% | 5,000 | | 126,800 |
Series L, 7.375% (a) | 80,000 | | 2,034,400 |
Cousins Properties, Inc. Series A, 7.75% | 205,970 | | 5,180,146 |
CubeSmart Series A, 7.75% | 40,000 | | 1,064,800 |
Cys Investments, Inc. Series A, 7.75% (a) | 117,824 | | 2,945,600 |
DDR Corp.: | | | |
Series I, 7.50% | 24,684 | | 621,049 |
Series J, 6.50% (a)(i) | 113,300 | | 2,809,840 |
Digital Realty Trust, Inc.: | | | |
Series E, 7.00% | 40,000 | | 1,067,600 |
Series F, 6.625% | 40,000 | | 1,050,000 |
Duke Realty LP: | | | |
8.375% | 128,517 | | 3,388,993 |
Series L, 6.60% | 10,666 | | 271,770 |
Dynex Capital, Inc. Series A, 8.50% (a) | 362,932 | | 9,000,714 |
Equity Lifestyle Properties, Inc. 8.034% | 1,075,325 | | 27,420,788 |
Essex Property Trust, Inc. Series H, 7.125% | 40,000 | | 1,072,800 |
Excel Trust, Inc. Series B, 8.125% | 400,000 | | 10,380,000 |
First Potomac Realty Trust 7.75% | 395,296 | | 10,250,025 |
Gladstone Commercial Corp. Series C, 7.125% | 232,238 | | 5,956,905 |
Glimcher Realty Trust: | | | |
Series F, 8.75% | 18,745 | | 475,917 |
Series G, 8.125% | 221,111 | | 5,576,419 |
Health Care REIT, Inc. Series J, 6.50% | 20,000 | | 538,800 |
Hersha Hospitality Trust Series B, 8.00% | 162,538 | | 4,214,610 |
Preferred Stocks - continued |
| Shares | | Value |
Nonconvertible Preferred Stocks - continued |
FINANCIALS - continued |
Real Estate Investment Trusts - continued |
HomeBanc Mortgage Corp. Series A (a) | 104,685 | | $ 1 |
Hospitality Properties Trust: | | | |
Series C, 7.00% | 58,500 | | 1,486,485 |
Series D, 7.125% | 40,800 | | 1,098,744 |
Hudson Pacific Properties, Inc. 8.375% | 303,800 | | 8,047,662 |
Inland Real Estate Corp. Series A, 8.125% | 423,500 | | 10,939,005 |
Invesco Mortgage Capital, Inc. Series A, | 113,342 | | 2,833,550 |
Investors Real Estate Trust Series B, 7.95% (a) | 126,572 | | 3,164,300 |
Kilroy Realty Corp. Series G, 6.875% | 40,000 | | 1,052,000 |
Kimco Realty Corp. Series G, 7.75% | 348,026 | | 8,850,301 |
Kite Realty Group Trust 8.25% | 96,100 | | 2,525,508 |
LaSalle Hotel Properties: | | | |
Series G, 7.25% | 114,485 | | 2,918,223 |
Series H, 7.50% | 126,308 | | 3,356,004 |
LBA Realty Fund II: | | | |
Series A, 8.75% (a) | 69,000 | | 2,622,000 |
Series B, 7.625% (a) | 31,240 | | 593,560 |
Lexington Realty Trust 7.55% | 23,800 | | 599,998 |
MFA Financial, Inc.: | | | |
8.00% | 529,991 | | 13,541,270 |
Series A, 8.50% | 485,381 | | 12,639,321 |
Monmouth Real Estate Investment Corp.: | | | |
7.625% | 80,000 | | 2,081,600 |
Series B, 7.875% | 95,000 | | 2,541,250 |
National Retail Properties, Inc. Series D, 6.625% | 62,437 | | 1,642,093 |
Newcastle Investment Corp. Series B, 9.75% | 34,530 | | 900,542 |
Parkway Properties, Inc. Series D, 8.00% | 306,382 | | 7,736,146 |
Pebblebrook Hotel Trust: | | | |
Series A, 7.875% | 372,000 | | 9,727,800 |
Series B, 8.00% | 185,085 | | 4,893,647 |
Prologis, Inc. Series Q, 8.54% | 94,446 | | 5,832,041 |
PS Business Parks, Inc.: | | | |
6.875% | 50,000 | | 1,349,500 |
Series P, 6.70% | 36,000 | | 912,240 |
Regency Centers Corp. Series 6, 6.625% | 62,261 | | 1,653,652 |
Saul Centers, Inc.: | | | |
8.00% | 93,700 | | 2,404,342 |
Series B (depositary shares) 9.00% | 118,550 | | 3,094,155 |
Stag Industrial, Inc. Series A, 9.00% | 280,000 | | 7,635,600 |
Preferred Stocks - continued |
| Shares | | Value |
Nonconvertible Preferred Stocks - continued |
FINANCIALS - continued |
Real Estate Investment Trusts - continued |
Summit Hotel Properties, Inc. Series A, 9.25% | 138,340 | | $ 3,733,797 |
Sunstone Hotel Investors, Inc.: | | | |
Series A, 8.00% | 366,039 | | 9,315,693 |
Series D, 8.00% | 60,362 | | 1,567,601 |
Terreno Realty Corp. Series A 7.75% | 165,690 | | 4,263,204 |
UMH Properties, Inc. Series A, 8.25% | 330,000 | | 8,738,400 |
Vornado Realty Trust 6.75% | 20,000 | | 511,000 |
Weingarten Realty Investors (SBI) Series F, 6.50% | 56,230 | | 1,420,370 |
Winthrop Realty Trust Series D, 9.25% | 65,000 | | 1,730,950 |
| | 333,896,942 |
Real Estate Management & Development - 0.7% |
Forest City Enterprises, Inc. 7.375% | 657,000 | | 15,623,460 |
Vornado Realty LP 7.875% | 54,682 | | 1,540,939 |
| | 17,164,399 |
TOTAL FINANCIALS | | 355,731,823 |
TOTAL NONCONVERTIBLE PREFERRED STOCKS | | 356,364,898 |
TOTAL PREFERRED STOCKS (Cost $385,286,514) |
395,539,429
|
Corporate Bonds - 25.8% |
| Principal Amount (e) | | |
Convertible Bonds - 2.6% |
CONSUMER DISCRETIONARY - 0.1% |
Hotels, Restaurants & Leisure - 0.1% |
Morgans Hotel Group Co. 2.375% 10/15/14 | | $ 4,510,000 | | 3,963,163 |
FINANCIALS - 2.5% |
Real Estate Investment Trusts - 2.1% |
Annaly Capital Management, Inc.: | | | | |
4% 2/15/15 | | 1,000,000 | | 1,268,750 |
5% 5/15/15 | | 34,396,000 | | 34,524,985 |
CapLease, Inc. 7.5% 10/1/27 (h) | | 5,180,000 | | 5,186,475 |
Northstar Realty Finance LP 8.875% 6/15/32 (h) | | 11,500,000 | | 11,873,750 |
Corporate Bonds - continued |
| Principal Amount (e) | | Value |
Convertible Bonds - continued |
FINANCIALS - continued |
Real Estate Investment Trusts - continued |
ProLogis LP: | | | | |
1.875% 11/15/37 | | $ 2,450,000 | | $ 2,443,875 |
2.625% 5/15/38 | | 1,500,000 | | 1,503,825 |
| | 56,801,660 |
Real Estate Management & Development - 0.4% |
Corporate Office Properties LP 4.25% 4/15/30 (h) | | 9,460,000 | | 9,318,100 |
Grubb & Ellis Co. 7.95% 5/1/15 (d)(h) | | 5,500,000 | | 27,500 |
| | 9,345,600 |
TOTAL FINANCIALS | | 66,147,260 |
TOTAL CONVERTIBLE BONDS | | 70,110,423 |
Nonconvertible Bonds - 23.2% |
CONSUMER DISCRETIONARY - 8.1% |
Hotels, Restaurants & Leisure - 0.8% |
CityCenter Holdings LLC/CityCenter Finance Corp.: | | | | |
7.625% 1/15/16 | | 1,945,000 | | 2,047,113 |
7.625% 1/15/16 (h) | | 1,560,000 | | 1,634,100 |
FelCor Lodging LP 6.75% 6/1/19 | | 5,875,000 | | 6,212,813 |
GWR Operating Partnership LLP/Great Wolf Finance Corp. 10.875% 4/1/17 | | 1,700,000 | | 1,925,250 |
Times Square Hotel Trust 8.528% 8/1/26 (h) | | 9,054,703 | | 10,370,959 |
| | 22,190,235 |
Household Durables - 6.7% |
D.R. Horton, Inc. 4.75% 5/15/17 | | 2,000,000 | | 2,090,000 |
KB Home: | | | | |
5.875% 1/15/15 | | 7,000,000 | | 7,070,000 |
6.25% 6/15/15 | | 10,000,000 | | 10,150,000 |
7.25% 6/15/18 | | 7,420,000 | | 7,494,200 |
8% 3/15/20 | | 8,465,000 | | 8,845,925 |
9.1% 9/15/17 | | 17,595,000 | | 19,090,575 |
Lennar Corp.: | | | | |
5.5% 9/1/14 | | 1,000,000 | | 1,048,750 |
5.6% 5/31/15 | | 6,000,000 | | 6,390,000 |
6.5% 4/15/16 | | 4,000,000 | | 4,270,000 |
6.95% 6/1/18 | | 14,280,000 | | 15,636,600 |
Corporate Bonds - continued |
| Principal Amount (e) | | Value |
Nonconvertible Bonds - continued |
CONSUMER DISCRETIONARY - continued |
Household Durables - continued |
M/I Homes, Inc. 8.625% 11/15/18 | | $ 26,055,000 | | $ 27,748,575 |
Meritage Homes Corp.: | | | | |
7% 4/1/22 (h) | | 7,525,000 | | 7,844,813 |
7.15% 4/15/20 | | 7,060,000 | | 7,413,000 |
Ryland Group, Inc.: | | | | |
6.625% 5/1/20 | | 1,555,000 | | 1,632,750 |
8.4% 5/15/17 | | 5,420,000 | | 6,233,000 |
Standard Pacific Corp.: | | | | |
7% 8/15/15 | | 4,000,000 | | 4,080,000 |
8.375% 5/15/18 | | 28,983,000 | | 32,205,910 |
10.75% 9/15/16 | | 8,415,000 | | 10,119,038 |
Toll Brothers Finance Corp. 5.875% 2/15/22 | | 1,550,000 | | 1,662,375 |
| | 181,025,511 |
Multiline Retail - 0.6% |
JC Penney Corp., Inc.: | | | | |
5.65% 6/1/20 | | 4,720,000 | | 3,958,900 |
5.75% 2/15/18 | | 2,845,000 | | 2,485,819 |
Sears Holdings Corp. 6.625% 10/15/18 | | 9,820,000 | | 8,813,450 |
| | 15,258,169 |
TOTAL CONSUMER DISCRETIONARY | | 218,473,915 |
CONSUMER STAPLES - 0.2% |
Food & Staples Retailing - 0.2% |
Ahold Lease Series 2001 A1 pass thru trust certificates 7.82% 1/2/20 | | 1,044,738 | | 1,196,225 |
C&S Group Enterprises LLC 8.375% 5/1/17 (h) | | 3,960,000 | | 4,078,800 |
| | 5,275,025 |
FINANCIALS - 13.6% |
Diversified Financial Services - 0.6% |
Icahn Enterprises LP/Icahn Enterprises Finance Corp.: | | | | |
7.75% 1/15/16 | | 10,820,000 | | 11,374,525 |
8% 1/15/18 | | 3,070,000 | | 3,261,875 |
8% 1/15/18 (h) | | 2,170,000 | | 2,300,200 |
| | 16,936,600 |
Real Estate Investment Trusts - 8.7% |
Camden Property Trust 5% 6/15/15 | | 1,100,000 | | 1,190,189 |
Corporate Bonds - continued |
| Principal Amount (e) | | Value |
Nonconvertible Bonds - continued |
FINANCIALS - continued |
Real Estate Investment Trusts - continued |
Commercial Net Lease Realty, Inc.: | | | | |
6.15% 12/15/15 | | $ 2,526,000 | | $ 2,808,867 |
6.25% 6/15/14 | | 5,005,000 | | 5,310,045 |
CubeSmart LP 4.8% 7/15/22 | | 2,000,000 | | 2,115,008 |
Developers Diversified Realty Corp.: | | | | |
5.5% 5/1/15 | | 4,000,000 | | 4,278,824 |
7.5% 4/1/17 | | 6,000,000 | | 6,906,234 |
7.5% 7/15/18 | | 8,756,000 | | 10,192,536 |
7.875% 9/1/20 | | 4,637,000 | | 5,730,808 |
9.625% 3/15/16 | | 3,836,000 | | 4,662,236 |
Duke Realty LP 6.25% 5/15/13 | | 750,000 | | 775,430 |
Equity One, Inc.: | | | | |
5.375% 10/15/15 | | 3,500,000 | | 3,715,376 |
6.25% 12/15/14 | | 4,081,000 | | 4,413,855 |
6.25% 1/15/17 | | 3,000,000 | | 3,338,346 |
Health Care Property Investors, Inc.: | | | | |
6% 6/15/14 | | 2,340,000 | | 2,503,051 |
6% 3/1/15 | | 1,000,000 | | 1,076,953 |
7.072% 6/8/15 | | 1,500,000 | | 1,672,376 |
Health Care REIT, Inc.: | | | | |
4.125% 4/1/19 | | 2,000,000 | | 2,080,408 |
6% 11/15/13 | | 1,000,000 | | 1,058,028 |
6.2% 6/1/16 | | 750,000 | | 848,000 |
Healthcare Realty Trust, Inc.: | | | | |
5.125% 4/1/14 | | 5,084,000 | | 5,310,746 |
5.75% 1/15/21 | | 2,000,000 | | 2,170,262 |
6.5% 1/17/17 | | 2,875,000 | | 3,229,051 |
Highwoods/Forsyth LP 5.85% 3/15/17 | | 2,800,000 | | 3,041,198 |
HMB Capital Trust V 4.0679% 12/15/36 (d)(h)(j) | | 2,530,000 | | 0 |
Hospitality Properties Trust: | | | | |
5.625% 3/15/17 | | 915,000 | | 978,621 |
6.75% 2/15/13 | | 1,765,000 | | 1,768,756 |
7.875% 8/15/14 | | 1,000,000 | | 1,080,051 |
HRPT Properties Trust: | | | | |
5.75% 11/1/15 | | 4,826,000 | | 5,089,369 |
6.25% 8/15/16 | | 7,500,000 | | 8,058,188 |
6.25% 6/15/17 | | 1,055,000 | | 1,147,254 |
6.65% 1/15/18 | | 3,000,000 | | 3,276,063 |
Corporate Bonds - continued |
| Principal Amount (e) | | Value |
Nonconvertible Bonds - continued |
FINANCIALS - continued |
Real Estate Investment Trusts - continued |
iStar Financial, Inc.: | | | | |
5.85% 3/15/17 | | $ 3,587,000 | | $ 3,264,170 |
5.875% 3/15/16 | | 34,260,000 | | 31,861,800 |
5.95% 10/15/13 | | 7,330,000 | | 7,073,450 |
6.05% 4/15/15 | | 4,725,000 | | 4,488,750 |
6.5% 12/15/13 | | 6,880,000 | | 6,759,600 |
8.625% 6/1/13 | | 6,155,000 | | 6,216,550 |
9% 6/1/17 (h) | | 13,000,000 | | 13,195,000 |
MPT Operating Partnership LP/MPT Finance Corp.: | | | | |
6.375% 2/15/22 | | 3,110,000 | | 3,218,850 |
6.875% 5/1/21 | | 2,000,000 | | 2,130,000 |
Nationwide Health Properties, Inc. 6.25% 2/1/13 | | 1,000,000 | | 1,025,376 |
Omega Healthcare Investors, Inc.: | | | | |
6.75% 10/15/22 | | 2,115,000 | | 2,326,500 |
7.5% 2/15/20 | | 1,000,000 | | 1,120,000 |
Pan Pacific Retail Properties, Inc. 5.95% 6/1/14 | | 1,750,000 | | 1,851,689 |
Potlatch Corp. 7.5% 11/1/19 | | 1,000,000 | | 1,060,000 |
ProLogis LP: | | | | |
6.625% 5/15/18 | | 6,480,000 | | 7,627,569 |
7.625% 7/1/17 | | 4,690,000 | | 5,544,879 |
Reckson Operating Partnership LP/SL Green Realty Corp./SL Green Operating Partnership LP 7.75% 3/15/20 | | 2,000,000 | | 2,325,200 |
Senior Housing Properties Trust: | | | | |
4.3% 1/15/16 | | 5,000,000 | | 5,130,325 |
6.75% 4/15/20 | | 11,000,000 | | 12,150,182 |
6.75% 12/15/21 | | 8,000,000 | | 8,915,800 |
United Dominion Realty Trust, Inc.: | | | | |
5.13% 1/15/14 | | 500,000 | | 521,752 |
5.25% 1/15/15 | | 1,000,000 | | 1,073,339 |
5.25% 1/15/16 | | 4,000,000 | | 4,320,060 |
| | 233,026,970 |
Real Estate Management & Development - 4.2% |
AMB Property LP 5.9% 8/15/13 | | 400,000 | | 415,579 |
BioMed Realty LP 3.85% 4/15/16 | | 2,000,000 | | 2,083,924 |
Brandywine Operating Partnership LP: | | | | |
5.4% 11/1/14 | | 6,750,000 | | 7,080,912 |
7.5% 5/15/15 | | 1,000,000 | | 1,122,373 |
Corporate Bonds - continued |
| Principal Amount (e) | | Value |
Nonconvertible Bonds - continued |
FINANCIALS - continued |
Real Estate Management & Development - continued |
CB Richard Ellis Services, Inc.: | | | | |
6.625% 10/15/20 | | $ 1,205,000 | | $ 1,293,929 |
11.625% 6/15/17 | | 1,500,000 | | 1,695,000 |
Colonial Properties Trust: | | | | |
6.15% 4/15/13 | | 1,500,000 | | 1,535,372 |
6.25% 6/15/14 | | 3,094,000 | | 3,279,779 |
6.875% 8/15/12 | | 1,000,000 | | 1,001,441 |
Colonial Realty LP 6.05% 9/1/16 | | 2,500,000 | | 2,706,523 |
Forest City Enterprises, Inc.: | | | | |
6.5% 2/1/17 | | 17,120,000 | | 16,478,000 |
7.625% 6/1/15 | | 34,050,000 | | 33,752,063 |
Host Hotels & Resorts LP: | | | | |
5.25% 3/15/22 (h) | | 2,000,000 | | 2,117,500 |
5.875% 6/15/19 | | 2,725,000 | | 2,997,500 |
9% 5/15/17 | | 750,000 | | 826,875 |
Kennedy-Wilson, Inc. 8.75% 4/1/19 | | 8,785,000 | | 9,312,100 |
Post Apartment Homes LP 6.3% 6/1/13 | | 2,000,000 | | 2,063,184 |
Realogy Corp.: | | | | |
7.875% 2/15/19 (h) | | 7,085,000 | | 7,138,138 |
9% 1/15/20 (h) | | 1,920,000 | | 2,011,200 |
Regency Centers LP: | | | | |
5.25% 8/1/15 | | 4,509,000 | | 4,859,191 |
5.875% 6/15/17 | | 400,000 | | 458,700 |
Toys 'R' Us Property Co. I LLC 10.75% 7/15/17 | | 2,490,000 | | 2,739,000 |
Ventas Realty LP 4% 4/30/19 | | 2,262,000 | | 2,411,407 |
Wells Operating Partnership II LP 5.875% 4/1/18 | | 3,000,000 | | 3,158,667 |
| | 112,538,357 |
Thrifts & Mortgage Finance - 0.1% |
Wrightwood Capital LLC 1.9% 4/20/20 (d) | | 4,349,567 | | 2,218,279 |
TOTAL FINANCIALS | | 364,720,206 |
HEALTH CARE - 1.3% |
Health Care Equipment & Supplies - 0.4% |
Aviv Healthcare Properties LP/Aviv Healthcare Capital Corp. 7.75% 2/15/19 | | 10,410,000 | | 10,800,375 |
Corporate Bonds - continued |
| Principal Amount (e) | | Value |
Nonconvertible Bonds - continued |
HEALTH CARE - continued |
Health Care Providers & Services - 0.9% |
Sabra Health Care LP/Sabra Capital Corp.: | | | | |
8.125% 11/1/18 | | $ 20,545,000 | | $ 22,188,600 |
8.125% 11/1/18 (h) | | 1,960,000 | | 2,111,900 |
| | 24,300,500 |
TOTAL HEALTH CARE | | 35,100,875 |
TOTAL NONCONVERTIBLE BONDS | | 623,570,021 |
TOTAL CORPORATE BONDS (Cost $657,449,686) |
693,680,444
|
Asset-Backed Securities - 4.5% |
|
Anthracite CDO I Ltd. Series 2002-CIBA Class B, 6.633% 5/24/37 (h) | | 1,384,000 | | 1,384,830 |
Anthracite CDO III Ltd./Anthracite CDO III Corp. Series 2004-1A Class A, 0.6068% 3/23/19 (h)(j) | | 280,455 | | 265,731 |
Capital Trust RE CDO Ltd. Series 2005-1A Class D, 1.7468% 3/20/50 (h)(j) | | 2,250,000 | | 157,500 |
Capital Trust RE CDO Ltd./Capital Trust RE CDO Corp. Series 2005-3A Class A2, 5.16% 6/25/35 (h) | | 4,260,637 | | 4,298,131 |
CapitalSource Real Estate Loan Trust Series 2006-1A Class A2A, 0.7076% 1/20/37 (h)(j) | | 1,157,230 | | 1,032,110 |
CapLease CDO Ltd. Series 2005-1A Class A, 4.926% 1/29/40 (h) | | 1,167,274 | | 1,015,528 |
CBRE Realty Finance CDO LLC Series 2007-1A Class A1, 0.7096% 4/7/52 (h)(j) | | 12,909,377 | | 9,274,613 |
Conseco Finance Securitizations Corp. Series 2002-2 Class M2, 9.163% 3/1/33 | | 500,000 | | 278,365 |
Crest Clarendon Street Ltd./Crest Clarendon Corp. Series 2002-1A: | | | | |
Class B1, 6.065% 12/28/35 (h) | | 1,570,000 | | 1,536,088 |
Class B2, 1.8106% 12/28/35 (h)(j) | | 1,575,000 | | 1,433,250 |
Class D, 9% 12/28/35 (h) | | 500,000 | | 96,600 |
Crest Dartmouth Street Ltd./Crest Dartmouth Street Corp. Series 2003-1A: | | | | |
Class B1, 1.9606% 6/28/38 (h)(j) | | 1,230,000 | | 1,174,650 |
Class D, 9% 6/28/38 (h) | | 1,012,573 | | 708,801 |
Asset-Backed Securities - continued |
| Principal Amount (e) | | Value |
Crest Ltd. Series 2002-IGA Class B, 1.7971% 7/28/35 (h)(j) | | $ 242,197 | | $ 242,197 |
Deutsche Financial Capital Securitization LLC Series 1997-I Class M, 7.275% 9/15/27 | | 9,500,000 | | 8,913,014 |
Fairfield Street Solar Corp. Series 2004-1A Class E1, 3.8319% 11/28/39 (h)(j) | | 566,085 | | 16,983 |
Green Tree Financial Corp.: | | | | |
Series 1996-4 Class M1, 7.75% 6/15/27 | | 1,788,179 | | 1,647,563 |
Series 1997-3 Class M1, 7.53% 3/15/28 | | 7,455,394 | | 4,911,043 |
GSR Mortgage Loan Trust Series 2005-HE3 Class B3, 2.7462% 6/25/35 (j)(l) | | 1,259,000 | | 32,633 |
Guggenheim Structured Real Estate Funding Ltd./Guggenheim Structured Real Estate Funding LLC Series 2005-2A: | | | | |
Class D, 1.7962% 8/26/30 (h)(j) | | 735,000 | | 606,375 |
Class E, 2.2462% 8/26/30 (h)(j) | | 1,517,957 | | 758,979 |
JPMorgan Chase Commercial Mortgage Securities Corp. Series 2009-IWST Class C, 7.4453% 12/5/27 (h) | | 3,000,000 | | 3,529,521 |
Lehman ABS Manufactured Housing Contract Trust Series 2001-B Class M2, 7.17% 4/15/40 | | 1,174,019 | | 481,734 |
Merit Securities Corp. Series 13 Class M1, 7.9015% 12/28/33 (j) | | 1,923,000 | | 1,819,939 |
N-Star Real Estate CDO Ltd. Series 1A Class C1B, 7.696% 8/28/38 (h) | | 899,989 | | 719,991 |
Newcastle Investment Trust Series 2011-MH1 Class A, 2.45% 12/10/33 (h) | | 3,391,764 | | 3,401,868 |
Prima Capital CDO Ltd./Prima Capital CDO Corp. Series 2005-1A Class D, 5.194% 7/24/39 (h) | | 2,950,302 | | 2,950,302 |
Prima Capital Ltd. Series 2006-CR1A Class A2, 5.533% 12/28/48 (h) | | 9,370,000 | | 9,182,600 |
Taberna Preferred Funding III Ltd. Series 2005-3A Class D, 3.1159% 2/5/36 (h)(j) | | 3,582,607 | | 358 |
Wachovia Ltd./Wachovia LLC: | | | | |
Series 2006-1 Class 1ML, 5.9676% 9/25/26 (h)(j) | | 2,000,000 | | 1,000,000 |
Series 2006-1A: | | | | |
Class A1A, 0.7276% 9/25/26 (h)(j) | | 19,445,048 | | 17,500,543 |
Class A1B, 0.7976% 9/25/26 (h)(j) | | 22,506,000 | | 18,792,510 |
Class A2A, 0.6876% 9/25/26 (h)(j) | | 6,083,741 | | 5,901,229 |
Class A2B, 0.7776% 9/25/26 (h)(j) | | 1,550,000 | | 1,367,875 |
Class B, 0.8276% 9/25/26 (h)(j) | | 890,000 | | 725,350 |
Class C 0.9976% 9/25/26 (h)(j) | | 3,830,000 | | 3,044,850 |
Class G, 1.8176% 9/25/26 (h)(j) | | 1,270,000 | | 916,051 |
Asset-Backed Securities - continued |
| Principal Amount (e) | | Value |
Wrightwood Capital Real Estate CDO Ltd. Series 2005-1A: | | | | |
Class A1, 0.7869% 11/21/40 (h)(j) | | $ 10,319,967 | | $ 8,565,573 |
Class F, 2.4169% 11/21/40 (h)(j) | | 250,000 | | 42,500 |
TOTAL ASSET-BACKED SECURITIES (Cost $119,902,454) |
119,727,778
|
Collateralized Mortgage Obligations - 0.7% |
|
Private Sponsor - 0.7% |
COMM pass-thru certificates Series 2007-FL14 Class AJ, 0.4288% 6/15/22 (h)(j) | | 1,898,329 | | 1,783,161 |
Countrywide Home Loans, Inc.: | | | | |
Series 2002-38 Class B3, 5% 2/25/18 (h) | | 63,646 | | 19,547 |
Series 2002-R2 Class 2B3, 3.7901% 7/25/33 (h)(j) | | 209,727 | | 99,715 |
Series 2003-40 Class B3, 4.5% 10/25/18 (h) | | 102,159 | | 65,408 |
Series 2003-R3: | | | | |
Class B2, 5.5% 11/25/33 (h) | | 1,403,239 | | 250,706 |
Class B3, 5.5% 11/25/33 | | 154,512 | | 8,302 |
Series 2004-R1 Class 1B3, 5.5% 11/25/34 (h)(j) | | 118,254 | | 5,405 |
FREMF Mortgage Trust: | | | | |
Series 2010 K7 Class B, 5.6186% 4/25/20 (h)(j) | | 3,200,000 | | 3,456,806 |
Series 2010-K6 Class B, 5.5326% 12/25/46 (h)(j) | | 4,500,000 | | 4,833,446 |
Merrill Lynch Mortgage Investors Trust Series 1998-C3 Class F, 6% 12/15/30 (h) | | 7,120,000 | | 7,166,529 |
RESI Finance LP/RESI Finance DE Corp. floater: | | | | |
Series 2003-B Class B9, 12.1958% 7/10/35 (h)(j) | | 323,594 | | 272,693 |
Series 2005-A Class B6, 2.2458% 3/10/37 (h)(j) | | 1,469,617 | | 109,193 |
Series 2005-B Class B6, 1.8458% 6/10/37 (h)(j) | | 855,663 | | 31,488 |
Residential Funding Securities Corp. Series 2002-RM1 Class BI1, 5.5% 12/25/17 (h) | | 44,135 | | 37,954 |
RESIX Finance Ltd. floater: | | | | |
Series 2003-D Class B8, 6.7458% 12/10/35 (h)(j) | | 303,961 | | 154,169 |
Series 2004-A Class B7, 4.4958% 2/10/36 (h)(j) | | 335,511 | | 182,652 |
Series 2004-B Class B7, 4.2458% 2/10/36 (h)(j) | | 406,093 | | 189,645 |
TOTAL PRIVATE SPONSOR | | 18,666,819 |
U.S. Government Agency - 0.0% |
Fannie Mae REMIC Trust: | | | | |
Series 2001-W3 subordinate REMIC pass thru certificates, Class B3, 7% 9/25/41 (l) | | 162,862 | | 86,330 |
Collateralized Mortgage Obligations - continued |
| Principal Amount (e) | | Value |
U.S. Government Agency - continued |
Fannie Mae REMIC Trust: - continued | | | | |
Series 2002-W1 subordinate REMIC pass thru certificates, Class 3B3, 3.2498% 2/25/42 (h)(j) | | $ 101,055 | | $ 56,166 |
Series 2003-W1 subordinate REMIC pass thru certificates, Class B3, 5.75% 12/25/42 (l) | | 237,912 | | 77,294 |
Series 2003-W10 subordinate REMIC pass thru certificates, Class 2B3, 3.3004% 6/25/43 (h)(j) | | 152,272 | | 59,561 |
Series 2003-W4 subordinate REMIC pass thru certificates, Class 2B3, 3.2829% 10/25/42 (h)(j) | | 66,047 | | 34,253 |
TOTAL U.S. GOVERNMENT AGENCY | | 313,604 |
TOTAL COLLATERALIZED MORTGAGE OBLIGATIONS (Cost $20,969,249) |
18,980,423
|
Commercial Mortgage Securities - 20.2% |
|
ACGS Series 2004-1 Class P, 7.4651% 8/1/19 (l) | | 4,936,312 | | 4,789,765 |
Americold LLC Trust Series 2010-ARTA Class D, 7.443% 1/14/29 (h) | | 2,000,000 | | 2,268,936 |
Asset Securitization Corp. Series 1997-D4 Class B2, 7.525% 4/14/29 | | 218,481 | | 223,872 |
Banc of America Commercial Mortgage, Inc.: | | | | |
sequential payer Series 2002-2 Class F, 5.487% 7/11/43 | | 4,185,000 | | 4,218,836 |
Series 2005-1 Class CJ, 5.3652% 11/10/42 (j) | | 3,580,000 | | 3,750,161 |
Series 2005-6 Class AJ, 5.3661% 9/10/47 (j) | | 5,000,000 | | 5,127,560 |
Banc of America Large Loan Trust floater Series 2010-HLTN Class HLTN, 1.992% 11/15/15 (h)(j) | | 118,988,060 | | 113,632,397 |
Banc of America Large Loan, Inc. floater Series 2005-MIB1: | | | | |
Class J, 1.2988% 3/15/22 (h)(j) | | 6,360,000 | | 5,819,826 |
Class K, 2.2488% 3/15/22 (h)(j) | | 4,190,000 | | 2,556,181 |
Bear Stearns Commercial Mortgage Securities, Inc. Series 2006-PW11 Class AJ, 5.6187% 3/11/39 (j) | | 5,700,000 | | 5,442,725 |
Bear Stearns Commercial Mortgage Securities Trust Series 2006-T22 Class B, 5.7126% 4/12/38 (h)(j) | | 2,520,000 | | 2,376,864 |
COMM pass-thru certificates: | | | | |
floater Series 2006-FL12 Class AJ, 0.3788% 12/15/20 (h)(j) | | 8,000,000 | | 7,261,968 |
sequential payer Series 2004-RS1 Class A, 5.648% 3/3/41 (h) | | 6,063,232 | | 6,108,706 |
Commercial Mortgage Securities - continued |
| Principal Amount (e) | | Value |
Commercial Mortgage pass-thru certificates: | | | | |
Series 2005-C6 Class AJ, 5.209% 6/10/44 (j) | | $ 5,000,000 | | $ 5,047,230 |
Series 2011-STRT Class C, 4.755% 12/10/24 (h) | | 2,000,000 | | 2,004,116 |
Series 2012-CR1: | | | | |
Class C, 5.547% 5/15/45 | | 1,000,000 | | 1,001,593 |
Class D, 5.547% 5/15/45 (h) | | 2,050,000 | | 1,606,852 |
Commercial Mortgage Trust pass-thru certificates Series 2012-LC4: | | | | |
Class C, 5.8248% 12/10/44 (j) | | 2,000,000 | | 2,062,884 |
Class D, 5.8248% 12/10/44 (h)(j) | | 8,000,000 | | 6,513,008 |
Communication Mortgage Trust Series 2011-THL: | | | | |
Class E, 5.949% 6/9/28 (h) | | 3,690,000 | | 3,757,014 |
Class F, 4.867% 6/9/28 (h) | | 11,090,000 | | 10,125,991 |
Credit Suisse First Boston Mortgage Securities Corp.: | | | | |
Series 1998-C1 Class F, 6% 5/17/40 (h) | | 2,442,446 | | 2,582,346 |
Series 1998-C2 Class F, 6.75% 11/15/30 (h) | | 3,000,000 | | 3,231,606 |
CRESI Finance Ltd. Partnership floater Series 2006-A Class E, 1.8962% 3/25/17 (h)(j) | | 891,217 | | 757,534 |
CRESIX Finance Ltd. Series 2006-AA: | | | | |
Class F, 4.4462% 3/25/17 (h)(j) | | 3,860,000 | | 3,203,800 |
Class G, 7.2462% 3/25/17 (h)(j) | | 3,272,000 | | 2,617,600 |
DBUBS Mortgage Trust Series 2011-LC1A Class E, 5.7284% 11/10/46 (h)(j) | | 12,490,000 | | 11,152,234 |
Deutsche Mortgage & Asset Receiving Corp. Series 1998-C1 Class J, 6.22% 6/15/31 | | 1,200,000 | | 1,015,564 |
DLJ Commercial Mortgage Corp.: | | | | |
Series 1998-CG1 Class B4, 7.4461% 6/10/31 (h)(j) | | 2,500,000 | | 2,564,625 |
Series 2000-CKP1 Class B3, 7.942% 11/10/33 (j) | | 2,970,000 | | 2,960,624 |
Extended Stay America Trust Series 2010-ESHA Class D, 5.4983% 11/5/27 (h) | | 6,000,000 | | 6,118,683 |
FHMLC Multi-class participation certificates guaranteed: | | | | |
Series K013 Class X3, 2.8846% 1/25/43 (j)(k) | | 14,360,000 | | 2,409,479 |
Series KAIV Class X2, 3.6146% 6/25/46 (j)(k) | | 7,430,000 | | 1,630,649 |
Freddie Mac: | | | | |
Series K011 Class X3, 2.6619% 12/25/43 (j)(k) | | 12,206,096 | | 1,868,936 |
Series K012 Class X3, 2.3657% 1/25/41 (j)(k) | | 21,072,886 | | 2,881,528 |
G-Force LLC sequential payer Series 2005-RRA Class A2, 4.83% 8/22/36 (h) | | 10,985,212 | | 10,710,582 |
GE Capital Commercial Mortgage Corp. Series 2002-1A Class H, 7.3556% 12/10/35 (h)(j) | | 991,000 | | 990,863 |
GMAC Commercial Mortgage Securities, Inc.: | | | | |
Series 1997-C2: | | | | |
Class F, 6.75% 4/15/29 (j) | | 786,432 | | 793,615 |
Commercial Mortgage Securities - continued |
| Principal Amount (e) | | Value |
GMAC Commercial Mortgage Securities, Inc.: - continued | | | | |
Series 1997-C2: | | | | |
Class G, 6.75% 4/15/29 (j) | | $ 1,250,000 | | $ 1,330,310 |
Series 1999-C3 Class J, 6.974% 8/15/36 | | 1,500,000 | | 1,484,156 |
Series 2000-C1 Class K, 7% 3/15/33 | | 224,908 | | 168,944 |
Series 2002-C3 Class D, 5.27% 7/10/39 | | 3,000,000 | | 3,025,728 |
Greenwich Capital Commercial Funding Corp.: | | | | |
sequential payer Series 2003-C1 Class D, 4.29% 7/5/35 (h) | | 2,000,000 | | 2,024,370 |
Series 2002-C1 Class H, 5.903% 1/11/35 (h) | | 880,000 | | 880,664 |
GS Mortgage Securities Corp. II: | | | | |
floater Series 2007-EOP Class L, 5.4585% 3/6/20 (h)(j) | | 1,400,000 | | 1,401,249 |
Series 2010-C1: | | | | |
Class D, 6.1357% 8/10/43 (h)(j) | | 4,000,000 | | 3,868,272 |
Class E, 4% 8/10/43 (h) | | 3,770,000 | | 2,798,392 |
Series 2012-GCJ7: | | | | |
Class C, 5.721% 5/10/45 (j) | | 4,000,000 | | 4,023,707 |
Class D, 5.721% 5/10/45 (h) | | 2,000,000 | | 1,615,022 |
GS Mortgage Securities Corp. Trust Series 2011-ALF Class E, 4.953% 2/10/21 (h) | | 9,185,000 | | 9,152,853 |
GS Mortgage Securities Trust: | | | | |
Series 2011-GC5 Class C, 5.4749% 8/10/44 (h)(j) | | 9,000,000 | | 9,145,854 |
Series 2012-GC6 Class C, 5.8273% 1/10/45 (h)(j) | | 3,600,000 | | 3,690,897 |
JPMorgan Chase Commercial Mortgage Securities Corp.: | | | | |
Series 2001-A: | | | | |
Class G, 6% 10/15/32 (h)(j) | | 2,036,910 | | 2,506 |
Class X, 0.627% 10/15/32 (h)(j)(k) | | 4,808,491 | | 20,025 |
Series 2002-C1 Class E, 6.135% 7/12/37 (h) | | 3,000,000 | | 2,998,143 |
Series 2009-IWST Class D, 7.6935% 12/5/27 (h)(j) | | 8,550,000 | | 9,453,419 |
Series 2010-CNTM Class MZ, 8.5% 8/5/20 (h) | | 9,000,000 | | 9,525,053 |
Series 2010-CNTR: | | | | |
Class D, 6.3899% 8/5/32 (h)(j) | | 4,500,000 | | 4,741,803 |
Class XB, 0.9305% 8/5/32 (h)(k) | | 32,655,000 | | 1,690,837 |
Series 2012-CBX Class C, 5.1909% 6/16/45 (j) | | 4,530,000 | | 4,521,666 |
JPMorgan Chase Commercial Mortgage Securities Trust: | | | | |
Series 2005-LDP5 Class AJ, 5.4825% 12/15/44 (j) | | 3,470,000 | | 3,475,804 |
Series 2011-C5 Class C, 5.4913% 8/15/46 (h)(j) | | 6,525,375 | | 6,534,824 |
JPMorgan Commercial Mortgage Finance Corp. Series 1999-C8: | | | | |
Class G, 6% 7/15/31 (h) | | 938,900 | | 956,183 |
Class H, 6% 7/15/31 (h) | | 1,341,102 | | 471,049 |
Commercial Mortgage Securities - continued |
| Principal Amount (e) | | Value |
LB Commercial Conduit Mortgage Trust Series 1998-C4 Class G, 5.6% 10/15/35 (h) | | $ 2,693,075 | | $ 2,799,279 |
LB-UBS Commercial Mortgage Trust: | | | | |
sequential payer: | | | | |
Series 2004-C2 Class E, 4.487% 3/15/36 | | 2,060,000 | | 2,077,442 |
Series 2005-C3 Class AJ, 4.843% 7/15/40 | | 6,620,000 | | 6,774,061 |
Series 2005-C7 Class AJ, 5.323% 11/15/40 | | 8,000,000 | | 8,211,360 |
Series 2006-C7 Class AM, 5.378% 11/15/38 | | 2,040,000 | | 2,082,862 |
Series 2004-C7 Class E, 4.918% 10/15/36 | | 5,120,000 | | 5,104,778 |
Series 2005-C1 Class E, 4.924% 2/15/40 | | 4,000,000 | | 3,628,624 |
Series 2006-C4: | | | | |
Class AJ, 6.0867% 6/15/38 (j) | | 7,005,000 | | 6,094,119 |
Class AM, 6.0867% 6/15/38 (j) | | 6,700,000 | | 7,138,709 |
Lehman Brothers Floating Rate Commercial Mortgage Trust floater Series 2007-LLFA Class E, 1.1488% 6/15/22 (h)(j) | | 6,230,000 | | 5,270,892 |
Lstar Commercial Mortgage Trust: | | | | |
Series 2011-1 Class D, 5.6245% 6/25/43 (h)(j) | | 4,699,000 | | 4,389,388 |
Series 2011-1 Class B, 5.6245% 6/25/43 (h)(j) | | 6,165,000 | | 6,309,878 |
Merrill Lynch Financial Asset, Inc. Series 2005-CA16: | | | | |
Class F, 4.384% 7/12/37 | CAD | 710,000 | | 528,500 |
Class G, 4.384% 7/12/37 | CAD | 355,000 | | 257,651 |
Class H, 4.384% 7/12/37 | CAD | 236,000 | | 167,031 |
Class J, 4.384% 7/12/37 | CAD | 355,000 | | 245,052 |
Class K, 4.384% 7/12/37 | CAD | 355,000 | | 239,038 |
Class L, 4.384% 7/12/37 | CAD | 236,000 | | 155,032 |
Class M, 4.384% 7/12/37 | CAD | 995,000 | | 552,140 |
Merrill Lynch Mortgage Investors Trust Series 1999-C1 Class G, 6.71% 11/15/31 (h) | | 715,093 | | 393,301 |
Merrill Lynch Mortgage Trust Series 2006-C1 Class AM, 5.8478% 5/12/39 (j) | | 1,200,000 | | 1,312,804 |
Mezz Capital Commercial Mortgage Trust: | | | | |
sequential payer: | | | | |
Series 2004-C1 Class A, 4.836% 1/15/37 (h) | | 4,105,302 | | 3,551,086 |
Series 2004-C2 Class A, 5.318% 10/15/40 (h) | | 9,995,195 | | 7,596,348 |
Series 2004-C1: | | | | |
Class D, 6.988% 1/15/37 (h) | | 750,000 | | 75 |
Class E, 7.983% 1/15/37 (h) | | 1,313,162 | | 131 |
Class IO, 8.9913% 1/15/37 (h)(j)(k) | | 4,287,713 | | 321,578 |
Morgan Stanley Capital I Trust: | | | | |
sequential payer: | | | | |
Series 2012-C4 Class E, 5.71% 3/15/45 (h) | | 4,630,000 | | 3,912,350 |
Series 2004-RR2 Class A2, 5.45% 10/28/33 (h) | | 948,263 | | 950,634 |
Commercial Mortgage Securities - continued |
| Principal Amount (e) | | Value |
Morgan Stanley Capital I Trust: - continued | | | | |
sequential payer: | | | | |
Series 2006-HQ10 Class AM, 5.36% 11/12/41 | | $ 8,200,000 | | $ 8,844,946 |
Series 1997-RR Class F, 7.35% 4/30/39 (h)(j) | | 1,363,287 | | 1,254,224 |
Series 1998-CF1 Class G, 7.35% 7/15/32 (h) | | 2,613,134 | | 1,837,540 |
Series 2005-HQ5 Class B, 5.272% 1/14/42 | | 2,000,000 | | 1,991,842 |
Series 2005-HQ6 Class AJ, 5.073% 8/13/42 (j) | | 2,500,000 | | 2,539,248 |
Series 2006-IQ12 Class AMFX, 5.37% 12/15/43 | | 7,500,000 | | 7,971,398 |
Series 2011-C1 Class C, 5.4216% 9/15/47 (h)(j) | | 3,000,000 | | 3,163,867 |
Series 2011-C2: | | | | |
Class D, 5.4951% 6/15/44 (h)(j) | | 4,610,000 | | 4,325,240 |
Class E, 5.4951% 6/15/44 (h)(j) | | 9,600,000 | | 7,959,360 |
Class F, 5.4951% 6/15/44 (h)(j) | | 4,440,000 | | 3,507,600 |
Class XB, 0.5396% 6/15/44 (h)(j)(k) | | 63,708,222 | | 2,019,551 |
Series 2011-C3 Class D, 5.357% 7/15/49 (h) | | 7,400,000 | | 6,811,892 |
NationsLink Funding Corp. Series 1999-SL Class X, 11/10/30 (j)(k) | | 1,077,337 | | 1,045,017 |
Providence Place Group Ltd. Partnership Series 2000-C1 Class A2, 7.75% 7/20/28 (h) | | 3,641,887 | | 4,299,248 |
RBSCF Trust Series 2010-MB1 Class D, 4.8317% 4/15/24 (h)(j) | | 8,320,000 | | 8,517,999 |
Salomon Brothers Mortgage Securities VII, Inc. Series 2001-MMA: | | | | |
Class E3, 6.5% 2/18/34 (h)(j) | | 3,000,000 | | 3,084,213 |
Class E5, 6.5% 2/18/34 (h)(j) | | 3,000,000 | | 3,004,545 |
TIAA Seasoned Commercial Mortgage Trust sequential payer Series 2007-C4 Class AJ, 5.6201% 8/15/39 (j) | | 2,080,000 | | 2,238,350 |
TimberStar Trust I Series 2006-1 Class F, 7.5296% 10/15/36 (h) | | 10,630,000 | | 10,988,996 |
UBS Commercial Mortgage Trust Series 2007-FL1 Class F, 0.8238% 7/15/24 (h)(j) | | 1,200,000 | | 817,702 |
UBS-Citigroup Commercial Mortgage Trust Series 2011-C1 Class B, 6.0708% 1/10/45 (h)(j) | | 3,000,000 | | 3,460,626 |
Vornado DP LLC Series 2010-VNO Class D, 6.3555% 9/13/28 (h) | | 2,540,000 | | 2,801,610 |
Wachovia Bank Commercial Mortgage Trust: | | | | |
Series 2004-C10 Class E, 4.931% 2/15/41 | | 2,000,000 | | 1,979,378 |
Series 2004-C11: | | | | |
Class D, 5.5668% 1/15/41 (j) | | 5,177,000 | | 4,801,010 |
Class E, 5.6168% 1/15/41 (j) | | 3,785,000 | | 3,261,595 |
Series 2004-C12 Class D, 5.4942% 7/15/41 (j) | | 2,750,000 | | 2,767,531 |
Series 2004-C14 Class B, 5.17% 8/15/41 | | 3,180,000 | | 3,354,261 |
WF-RBS Commercial Mortgage Trust Series 2011-C3: | | | | |
Class C, 5.335% 3/15/44 (h) | | 4,900,000 | | 5,092,149 |
Commercial Mortgage Securities - continued |
| Principal Amount (e) | | Value |
WF-RBS Commercial Mortgage Trust Series 2011-C3: - continued | | | | |
Class D, 5.7221% 3/15/44 (h)(j) | | $ 1,000,000 | | $ 863,933 |
WFDB Commercial Mortgage Trust Series 2011-BXR Class D, 5.914% 7/5/24 (h) | | 4,000,000 | | 4,140,892 |
TOTAL COMMERCIAL MORTGAGE SECURITIES (Cost $522,862,342) |
540,998,389
|
Floating Rate Loans - 4.9% |
|
CONSUMER DISCRETIONARY - 1.7% |
Hotels, Restaurants & Leisure - 1.6% |
Extended Stay America, Inc. term loan 9.75% 11/1/15 | | 9,000,000 | | 9,090,000 |
Hilton Hotels Corp.: | | | | |
term loan 3.999% 11/12/15 (j) | | 15,000,000 | | 13,462,500 |
Tranche B, term loan 11/12/15 (j) | | 12,000,000 | | 11,160,000 |
Tranche E term loan 11/12/15 (j) | | 10,000,000 | | 9,100,000 |
| | 42,812,500 |
Media - 0.1% |
PRIMEDIA, Inc. Tranche B, term loan 7.5% 1/13/18 (j) | | 2,821,500 | | 2,553,458 |
Specialty Retail - 0.0% |
The Pep Boys - Manny, Moe & Jack term loan 2.47% 10/27/13 (j) | | 1,967,498 | | 1,960,120 |
TOTAL CONSUMER DISCRETIONARY | | 47,326,078 |
FINANCIALS - 1.7% |
Diversified Financial Services - 0.2% |
Pilot Travel Centers LLC Tranche B, term loan 4.25% 3/30/18 (j) | | 3,885,475 | | 3,871,098 |
Real Estate Investment Trusts - 0.0% |
iStar Financial, Inc. Tranche A 1LN, term loan 5% 6/28/13 (j) | | 830,748 | | 829,710 |
Real Estate Management & Development - 1.4% |
CB Richard Ellis Group, Inc. Tranche B, term loan 3.4968% 11/9/16 (j) | | 2,984,810 | | 2,973,617 |
CB Richard Ellis Services, Inc. Tranche D, term loan 3.7488% 9/4/19 (j) | | 4,736,081 | | 4,696,629 |
CityCenter term loan 8.75% 7/1/13 (j) | | 4,169,750 | | 4,138,477 |
EOP Operating LP term loan 1.9958% 2/5/13 (j) | | 5,000,000 | | 4,775,000 |
Equity Inns Reality LLC: | | | | |
Tranche A, term loan 9.5% 11/2/12 (j) | | 2,184,917 | | 1,635,653 |
Floating Rate Loans - continued |
| Principal Amount (e) | | Value |
FINANCIALS - continued |
Real Estate Management & Development - continued |
Equity Inns Reality LLC: - continued | | | | |
Tranche B 2LN, term loan 6.55% 11/2/12 (j) | | $ 5,000,000 | | $ 4,475,000 |
Realogy Corp.: | | | | |
Credit-Linked Deposit 3.2458% 10/10/13 (j) | | 518,858 | | 485,132 |
Credit-Linked Deposit 4.4958% 10/10/16 (j) | | 926,858 | | 875,881 |
term loan 4.4988% 10/10/16 (j) | | 10,840,642 | | 10,244,406 |
Tranche 2LN, term loan 13.5% 10/15/17 | | 3,500,000 | | 3,570,000 |
| | 37,869,795 |
Thrifts & Mortgage Finance - 0.1% |
Ocwen Financial Corp. Tranche B, term loan 7% 9/1/16 (j) | | 2,307,756 | | 2,307,756 |
TOTAL FINANCIALS | | 44,878,359 |
HEALTH CARE - 0.6% |
Health Care Providers & Services - 0.6% |
Community Health Systems, Inc. term loan 3.9667% 1/25/17 (j) | | 2,903,247 | | 2,883,447 |
Health Management Associates, Inc. Tranche B, term loan 4.5% 11/18/18 (j) | | 1,990,000 | | 1,990,000 |
Skilled Healthcare Group, Inc. term loan 6.75% 4/9/16 (j) | | 10,379,665 | | 10,379,665 |
| | 15,253,112 |
INDUSTRIALS - 0.4% |
Construction & Engineering - 0.4% |
Drumm Investors LLC Tranche B, term loan 5% 5/4/18 (j) | | 11,877,133 | | 11,431,741 |
TELECOMMUNICATION SERVICES - 0.5% |
Wireless Telecommunication Services - 0.5% |
Crown Castle Operating Co. Tranche B, term loan 4% 1/31/19 (j) | | 8,983,803 | | 8,973,022 |
TowerCo Finance LLC Tranche B, term loan 4.5% 2/2/17 (j) | | 3,632,412 | | 3,636,953 |
| | 12,609,975 |
TOTAL FLOATING RATE LOANS (Cost $132,655,576) |
131,499,265
|
Preferred Securities - 0.0% |
| Principal Amount (e) | | Value |
FINANCIALS - 0.0% |
Diversified Financial Services - 0.0% |
Crest Clarendon Street 2002-1 Ltd. Series 2002-1A Class PS, 12/28/35 (h) | $ 500,000 | | $ 15,000 |
Crest Dartmouth Street 2003 1 Ltd. Series 2003-1A Class PS, 6/28/38 (h) | 1,220,000 | | 122,000 |
Ipswich Street CDO Series 2006-1, 6/27/46 (d)(h) | 1,350,000 | | 0 |
| | 137,000 |
TOTAL PREFERRED SECURITIES (Cost $2,594,645) |
137,000
|
Money Market Funds - 8.0% |
| Shares | | |
Fidelity Cash Central Fund, 0.17% (b) | 187,739,774 | | 187,739,774 |
Fidelity Securities Lending Cash Central Fund, 0.18% (b)(c) | 27,376,007 | | 27,376,007 |
TOTAL MONEY MARKET FUNDS (Cost $215,115,781) |
215,115,781
|
TOTAL INVESTMENT PORTFOLIO - 101.9% (Cost $2,558,959,106) | | 2,735,706,986 |
NET OTHER ASSETS (LIABILITIES) - (1.9)% | | (49,848,102) |
NET ASSETS - 100% | $ 2,685,858,884 |
Currency Abbreviations |
CAD | - | Canadian dollar |
Legend |
(a) Non-income producing |
(b) Affiliated fund that is available only to investment companies and other accounts managed by Fidelity Investments. The rate quoted is the annualized seven-day yield of the fund at period end. A complete unaudited listing of the fund's holdings as of its most recent quarter end is available upon request. In addition, each Fidelity Central Fund's financial statements, which are not covered by the Fund's Report of Independent Registered Public Accounting Firm, are available on the SEC's website or upon request. |
(c) Investment made with cash collateral received from securities on loan. |
(d) Non-income producing - Security is in default. |
(e) Principal amount is stated in United States dollars unless otherwise noted. |
(f) Security or a portion of the security is on loan at period end. |
(g) Affiliated company |
(h) Security exempt from registration under Rule 144A of the Securities Act of 1933. These securities may be resold in transactions exempt from registration, normally to qualified institutional buyers. At the end of the period, the value of these securities amounted to $607,946,631 or 22.6% of net assets. |
(i) Security or a portion of the security purchased on a delayed delivery or when-issued basis. |
(j) Coupon rates for floating and adjustable rate securities reflect the rates in effect at period end. |
(k) Security represents right to receive monthly interest payments on an underlying pool of mortgages or assets. Principal shown is the outstanding par amount of the pool as of the end of the period. |
(l) Restricted securities - Investment in securities not registered under the Securities Act of 1933 (excluding 144A issues). At the end of the period, the value of restricted securities (excluding 144A issues) amounted to $4,986,022 or 0.2% of net assets. |
Additional information on each restricted holding is as follows: |
Security | Acquisition Date | Acquisition Cost |
ACGS Series 2004-1 Class P, 7.4651% 8/1/19 | 2/17/11 | $ 4,780,148 |
Fannie Mae REMIC Trust Series 2001-W3 subordinate REMIC pass thru certificates, Class B3, 7% 9/25/41 | 5/21/03 | $ 141,130 |
Fannie Mae REMIC Trust Series 2003-W1 subordinate REMIC pass thru certificates, Class B3, 5.75% 12/25/42 | 3/25/03 | $ 179,289 |
GSR Mortgage Loan Trust Series 2005-HE3 Class B3, 2.7462% 6/25/35 | 6/3/05 | $ 1,110,697 |
Affiliated Central Funds |
Information regarding fiscal year to date income earned by the Fund from investments in Fidelity Central Funds is as follows: |
Fund | Income earned |
Fidelity Cash Central Fund | $ 227,690 |
Fidelity Securities Lending Cash Central Fund | 73,576 |
Total | $ 301,266 |
Other Affiliated Issuers |
An affiliated company is a company in which the Fund has ownership of at least 5% of the voting securities. Fiscal year to date transactions with companies which are or were affiliates are as follows: |
Affiliate | Value, beginning of period | Purchases | Sales Proceeds | Dividend Income | Value,
end of
period |
AmREIT, Inc. | $ - | $ 2,800,000 | $ - | $ - | $ 2,818,000 |
Total | $ - | $ 2,800,000 | $ - | $ - | $ 2,818,000 |
Other Information |
The following is a summary of the inputs used, as of July 31, 2012, involving the Fund's assets and liabilities carried at fair value. The inputs or methodology used for valuing securities may not be an indication of the risk associated with investing in those securities. For more information on valuation inputs, and their aggregation into the levels used in the tables below, please refer to the Security Valuation section in the accompanying Notes to Financial Statements. |
Valuation Inputs at Reporting Date: |
Description | Total | Level 1 | Level 2 | Level 3 |
Investments in Securities: |
Equities: | | | | |
Consumer Discretionary | $ 32,967,155 | $ 28,850,735 | $ - | $ 4,116,420 |
Financials | 947,319,005 | 889,631,220 | 46,463,582 | 11,224,203 |
Health Care | 29,263,532 | 29,263,532 | - | - |
Telecommunication Services | 6,018,214 | 6,018,214 | - | - |
Corporate Bonds | 693,680,444 | - | 691,462,165 | 2,218,279 |
Asset-Backed Securities | 119,727,778 | - | 83,414,055 | 36,313,723 |
Collateralized Mortgage Obligations | 18,980,423 | - | 17,239,942 | 1,740,481 |
Commercial Mortgage Securities | 540,998,389 | - | 487,014,384 | 53,984,005 |
Floating Rate Loans | 131,499,265 | - | 113,495,788 | 18,003,477 |
Preferred Securities | 137,000 | - | - | 137,000 |
Money Market Funds | 215,115,781 | 215,115,781 | - | - |
Total Investments in Securities: | $ 2,735,706,986 | $ 1,168,879,482 | $ 1,439,089,916 | $ 127,737,588 |
Valuation Inputs at Reporting Date: |
The following is a reconciliation of Investments in Securities for which Level 3 inputs were used in determining value: |
Investments in Securities: | |
Asset-Backed Securities | |
Beginning Balance | $ 79,390,084 |
Total Realized Gain (Loss) | 1,318,781 |
Total Unrealized Gain (Loss) | 4,471,824 |
Cost of Purchases | 183,524 |
Proceeds of Sales | (21,893,868) |
Amortization/Accretion | 1,481,337 |
Transfers in to Level 3 | 3,448,211 |
Transfers out of Level 3 | (32,086,170) |
Ending Balance | $ 36,313,723 |
The change in unrealized gain (loss) for the period attributable to Level 3 securities held at July 31, 2012 | $ 4,749,808 |
Investments in Securities: | |
Commercial Mortgage Securities | |
Beginning Balance | $ 31,940,633 |
Total Realized Gain (Loss) | 292,397 |
Total Unrealized Gain (Loss) | 1,669,669 |
Cost of Purchases | 18,454,173 |
Proceeds of Sales | (14,263,172) |
Amortization/Accretion | 297,301 |
Transfers in to Level 3 | 15,593,004 |
Transfers out of Level 3 | - |
Ending Balance | $ 53,984,005 |
The change in unrealized gain (loss) for the period attributable to Level 3 securities held at July 31, 2012 | $ 1,426,676 |
Other Investments in Securities | |
Beginning Balance | $ 28,158,749 |
Total Realized Gain (Loss) | (1,117,739) |
Total Unrealized Gain (Loss) | 2,178,452 |
Cost of Purchases | 18,084,567 |
Proceeds of Sales | (8,701,192) |
Amortization/Accretion | (23,513) |
Transfers in to Level 3 | 1,620,536 |
Transfers out of Level 3 | (2,760,000) |
Ending Balance | $ 37,439,860 |
The change in unrealized gain (loss) for the period attributable to Level 3 securities held at July 31, 2012 | $ (1,543,927) |
The information used in the above reconciliations represents fiscal year to date activity for any Investments in Securities identified as using Level 3 inputs at either the beginning or the end of the current fiscal period. Transfers in to Level 3 were attributable to a lack of observable market data resulting from decreases in market activity, decreases in liquidity, security restructurings or corporate actions. Transfers out of Level 3 were attributable to observable market data becoming available for those securities. Transfers in or out of Level 3 represent the beginning value of any Security or Instrument where a change in the pricing level occurred from the beginning to the end of the period. The cost of purchases and the proceeds of sales may include securities received or delivered through corporate actions or exchanges. Realized and unrealized gains (losses) disclosed in the reconciliations are included in Net Gain (Loss) on the Fund's Statement of Operations. |
The composition of credit quality ratings as a percentage of net assets is as follows (Unaudited): |
U.S. Government and U.S. Government Agency Obligations | 0.4% |
AAA,AA,A | 8.1% |
BBB | 12.7% |
BB | 5.1% |
B | 13.1% |
CCC,CC,C | 5.4% |
D | 0.3% |
Not Rated | 11.0% |
Equities | 37.8% |
Short-Term Investments and Net Other Assets | 6.1% |
| 100.0% |
We have used ratings from Moody's Investors Service, Inc. Where Moody's® ratings are not available, we have used S&P® ratings. All ratings are as of the date indicated and do not reflect subsequent changes. |
See accompanying notes which are an integral part of the financial statements.
Annual Report
Statement of Assets and Liabilities
| July 31, 2012 |
| | |
Assets | | |
Investment in securities, at value (including securities loaned of $24,897,474) - See accompanying schedule: Unaffiliated issuers (cost $2,341,043,325) | $ 2,517,773,205 | |
Fidelity Central Funds (cost $215,115,781) | 215,115,781 | |
Other affiliated issuers (cost $2,800,000) | 2,818,000 | |
Total Investments (cost $2,558,959,106) | | $ 2,735,706,986 |
Foreign currency held at value (cost $21,986) | | 21,986 |
Receivable for investments sold | | 3,946,789 |
Receivable for fund shares sold | | 15,938,587 |
Dividends receivable | | 1,674,674 |
Interest receivable | | 14,981,277 |
Distributions receivable from Fidelity Central Funds | | 33,415 |
Other receivables | | 6,563 |
Total assets | | 2,772,310,277 |
| | |
Liabilities | | |
Payable to custodian bank | $ 9,145 | |
Payable for investments purchased
Regular delivery | 51,958,020 | |
Delayed delivery | 2,832,500 | |
Payable for fund shares redeemed | 2,288,350 | |
Accrued management fee | 1,214,069 | |
Distribution and service plan fees payable | 73,831 | |
Other affiliated payables | 618,059 | |
Other payables and accrued expenses | 81,412 | |
Collateral on securities loaned, at value | 27,376,007 | |
Total liabilities | | 86,451,393 |
| | |
Net Assets | | $ 2,685,858,884 |
Net Assets consist of: | | |
Paid in capital | | $ 2,450,354,786 |
Undistributed net investment income | | 27,923,018 |
Accumulated undistributed net realized gain (loss) on investments and foreign currency transactions | | 30,806,996 |
Net unrealized appreciation (depreciation) on investments and assets and liabilities in foreign currencies | | 176,774,084 |
Net Assets | | $ 2,685,858,884 |
See accompanying notes which are an integral part of the financial statements.
Annual Report
Statement of Assets and Liabilities - continued
| July 31, 2012 |
| | |
Calculation of Maximum Offering Price Class A:
Net Asset Value and redemption price per share ($137,351,550 ÷ 12,199,652 shares) | | $ 11.26 |
| | |
Maximum offering price per share (100/96.00 of $11.26) | | $ 11.73 |
Class T:
Net Asset Value and redemption price per share ($26,142,720 ÷ 2,321,952 shares) | | $ 11.26 |
| | |
Maximum offering price per share (100/96.00 of $11.26) | | $ 11.73 |
Class C:
Net Asset Value and offering price per share ($52,780,495 ÷ 4,712,640 shares)A | | $ 11.20 |
| | |
Real Estate Income:
Net Asset Value, offering price and redemption price per share ($2,252,148,798 ÷ 199,406,118 shares) | | $ 11.29 |
| | |
Institutional Class:
Net Asset Value, offering price and redemption price per share ($217,435,321 ÷ 19,282,368 shares) | | $ 11.28 |
A Redemption price per share is equal to net asset value less any applicable contingent deferred sales charge.
See accompanying notes which are an integral part of the financial statements.
Annual Report
Financial Statements - continued
Statement of Operations
| Year ended July 31, 2012 |
| | |
Investment Income | | |
Dividends | | $ 39,342,877 |
Interest | | 85,494,070 |
Income from Fidelity Central Funds | | 301,266 |
Total income | | 125,138,213 |
| | |
Expenses | | |
Management fee | $ 11,636,191 | |
Transfer agent fees | 5,685,427 | |
Distribution and service plan fees | 559,397 | |
Accounting and security lending fees | 810,483 | |
Custodian fees and expenses | 32,894 | |
Independent trustees' compensation | 13,278 | |
Registration fees | 180,034 | |
Audit | 157,626 | |
Legal | 5,742 | |
Miscellaneous | 18,376 | |
Total expenses before reductions | 19,099,448 | |
Expense reductions | (42,648) | 19,056,800 |
Net investment income (loss) | | 106,081,413 |
Realized and Unrealized Gain (Loss) Net realized gain (loss) on: | | |
Investment securities: | | |
Unaffiliated issuers | 46,636,084 | |
Foreign currency transactions | (14,625) | |
Total net realized gain (loss) | | 46,621,459 |
Change in net unrealized appreciation (depreciation) on: Investment securities | 99,189,660 | |
Assets and liabilities in foreign currencies | 1,230 | |
Total change in net unrealized appreciation (depreciation) | | 99,190,890 |
Net gain (loss) | | 145,812,349 |
Net increase (decrease) in net assets resulting from operations | | $ 251,893,762 |
See accompanying notes which are an integral part of the financial statements.
Annual Report
Statement of Changes in Net Assets
| Year ended
July 31,
2012 | Year ended
July 31,
2011 |
Increase (Decrease) in Net Assets | | |
Operations | | |
Net investment income (loss) | $ 106,081,413 | $ 75,045,871 |
Net realized gain (loss) | 46,621,459 | 26,474,317 |
Change in net unrealized appreciation (depreciation) | 99,190,890 | 63,154,318 |
Net increase (decrease) in net assets resulting
from operations | 251,893,762 | 164,674,506 |
Distributions to shareholders from net investment income | (98,117,663) | (66,688,371) |
Distributions to shareholders from net realized gain | (16,498,521) | - |
Total distributions | (114,616,184) | (66,688,371) |
Share transactions - net increase (decrease) | 755,485,569 | 655,640,999 |
Redemption fees | 286,688 | 331,332 |
Total increase (decrease) in net assets | 893,049,835 | 753,958,466 |
| | |
Net Assets | | |
Beginning of period | 1,792,809,049 | 1,038,850,583 |
End of period (including undistributed net investment income of $27,923,018 and undistributed net investment income of $20,642,579, respectively) | $ 2,685,858,884 | $ 1,792,809,049 |
See accompanying notes which are an integral part of the financial statements.
Annual Report
Financial Highlights - Class A
Years ended July 31, | 2012 | 2011 | 2010 H |
Selected Per-Share Data | | | |
Net asset value, beginning of period | $ 10.73 | $ 9.94 | $ 9.95 |
Income from Investment Operations | | | |
Net investment income (loss) E | .52 | .53 | .18 |
Net realized and unrealized gain (loss) | .61 | .76 | (.04) |
Total from investment operations | 1.13 | 1.29 | .14 |
Distributions from net investment income | (.51) | (.50) | (.15) |
Distributions from net realized gain | (.10) | - | - |
Total distributions | (.60) K | (.50) | (.15) |
Redemption fees added to paid in capital E, J | - | - | - |
Net asset value, end of period | $ 11.26 | $ 10.73 | $ 9.94 |
Total Return B,C,D | 11.24% | 13.27% | 1.46% |
Ratios to Average Net Assets F,I | | | |
Expenses before reductions | 1.12% | 1.13% | 1.09% A |
Expenses net of fee waivers, if any | 1.12% | 1.13% | 1.09% A |
Expenses net of all reductions | 1.11% | 1.12% | 1.09% A |
Net investment income (loss) | 4.89% | 5.00% | 6.23% A |
Supplemental Data | | | |
Net assets, end of period (000 omitted) | $ 137,352 | $ 60,283 | $ 3,830 |
Portfolio turnover rate G | 27% | 25% | 28% |
A Annualized
B Total returns for periods of less than one year are not annualized.
C Total returns would have been lower if certain expenses had not been reduced during the applicable periods shown.
D Total returns do not include the effect of the sales charges.
E Calculated based on average shares outstanding during the period.
F Fees and expenses of any underlying Fidelity Central Funds are not included in the Fund's expense ratio. The Fund indirectly bears its proportionate share of the expenses of any underlying Fidelity Central Funds.
G Amount does not include the portfolio activity of any underlying Fidelity Central Funds.
H For the period April 14, 2010 (commencement of sale of shares) to July 31, 2010.
I Expense ratios reflect operating expenses of the class. Expenses before reductions do not reflect amounts reimbursed by the investment adviser or reductions from brokerage service arrangements or reductions from other expense offset arrangements and do not represent the amount paid by the class during periods when reimbursements or reductions occur. Expense ratios before reductions for start-up periods may not be representative of longer-term operating periods. Expenses net of fee waivers reflect expenses after reimbursement by the investment adviser but prior to reductions from brokerage service arrangements or other expense offset arrangements. Expenses net of all reductions represent the net expenses paid by the class.
J Amount represents less than $.01 per share.
K Total distributions of $.60 per share is comprised of distributions from net investment income of $.505 and distributions from net realized gain of $.097 per share.
See accompanying notes which are an integral part of the financial statements.
Annual Report
Financial Highlights - Class T
Years ended July 31, | 2012 | 2011 | 2010 H |
Selected Per-Share Data | | | |
Net asset value, beginning of period | $ 10.72 | $ 9.94 | $ 9.95 |
Income from Investment Operations | | | |
Net investment income (loss) E | .52 | .52 | .17 |
Net realized and unrealized gain (loss) | .62 | .76 | (.03) |
Total from investment operations | 1.14 | 1.28 | .14 |
Distributions from net investment income | (.50) | (.50) | (.15) |
Distributions from net realized gain | (.10) | - | - |
Total distributions | (.60) | (.50) | (.15) |
Redemption fees added to paid in capital E, J | - | - | - |
Net asset value, end of period | $ 11.26 | $ 10.72 | $ 9.94 |
Total Return B,C,D | 11.33% | 13.11% | 1.45% |
Ratios to Average Net Assets F,I | | | |
Expenses before reductions | 1.11% | 1.16% | 1.17% A |
Expenses net of fee waivers, if any | 1.11% | 1.16% | 1.17% A |
Expenses net of all reductions | 1.11% | 1.16% | 1.17% A |
Net investment income (loss) | 4.90% | 4.96% | 5.92% A |
Supplemental Data | | | |
Net assets, end of period (000 omitted) | $ 26,143 | $ 7,626 | $ 862 |
Portfolio turnover rate G | 27% | 25% | 28% |
A Annualized
B Total returns for periods of less than one year are not annualized.
C Total returns would have been lower if certain expenses had not been reduced during the applicable periods shown.
D Total returns do not include the effect of the sales charges.
E Calculated based on average shares outstanding during the period.
F Fees and expenses of any underlying Fidelity Central Funds are not included in the Fund's expense ratio. The Fund indirectly bears its proportionate share of the expenses of any underlying Fidelity Central Funds.
G Amount does not include the portfolio activity of any underlying Fidelity Central Funds.
H For the period April 14, 2010 (commencement of sale of shares) to July 31, 2010.
I Expense ratios reflect operating expenses of the class. Expenses before reductions do not reflect amounts reimbursed by the investment adviser or reductions from brokerage service arrangements or reductions from other expense offset arrangements and do not represent the amount paid by the class during periods when reimbursements or reductions occur. Expense ratios before reductions for start-up periods may not be representative of longer-term operating periods. Expenses net of fee waivers reflect expenses after reimbursement by the investment adviser but prior to reductions from brokerage service arrangements or other expense offset arrangements. Expenses net of all reductions represent the net expenses paid by the class.
J Amount represents less than $.01 per share.
See accompanying notes which are an integral part of the financial statements.
Annual Report
Financial Highlights - Class C
Years ended July 31, | 2012 | 2011 | 2010 H |
Selected Per-Share Data | | | |
Net asset value, beginning of period | $ 10.67 | $ 9.93 | $ 9.95 |
Income from Investment Operations | | | |
Net investment income (loss) E | .44 | .45 | .15 |
Net realized and unrealized gain (loss) | .62 | .74 | (.03) |
Total from investment operations | 1.06 | 1.19 | .12 |
Distributions from net investment income | (.43) | (.45) | (.14) |
Distributions from net realized gain | (.10) | - | - |
Total distributions | (.53) | (.45) | (.14) |
Redemption fees added to paid in capital E, J | - | - | - |
Net asset value, end of period | $ 11.20 | $ 10.67 | $ 9.93 |
Total Return B,C,D | 10.49% | 12.25% | 1.29% |
Ratios to Average Net Assets F,I | | | |
Expenses before reductions | 1.87% | 1.89% | 1.86% A |
Expenses net of fee waivers, if any | 1.87% | 1.89% | 1.86% A |
Expenses net of all reductions | 1.87% | 1.89% | 1.86% A |
Net investment income (loss) | 4.14% | 4.23% | 5.21% A |
Supplemental Data | | | |
Net assets, end of period (000 omitted) | $ 52,780 | $ 21,555 | $ 836 |
Portfolio turnover rate G | 27% | 25% | 28% |
A Annualized
B Total returns for periods of less than one year are not annualized.
C Total returns would have been lower if certain expenses had not been reduced during the applicable periods shown.
D Total returns do not include the effect of the contingent deferred sales charge.
E Calculated based on average shares outstanding during the period.
F Fees and expenses of any underlying Fidelity Central Funds are not included in the Fund's expense ratio. The Fund indirectly bears its proportionate share of the expenses of any underlying Fidelity Central Funds.
G Amount does not include the portfolio activity of any underlying Fidelity Central Funds.
H For the period April 14, 2010 (commencement of sale of shares) to July 31, 2010.
I Expense ratios reflect operating expenses of the class. Expenses before reductions do not reflect amounts reimbursed by the investment adviser or reductions from brokerage service arrangements or reductions from other expense offset arrangements and do not represent the amount paid by the class during periods when reimbursements or reductions occur. Expense ratios before reductions for start-up periods may not be representative of longer-term operating periods. Expenses net of fee waivers reflect expenses after reimbursement by the investment adviser but prior to reductions from brokerage service arrangements or other expense offset arrangements. Expenses net of all reductions represent the net expenses paid by the class.
J Amount represents less than $.01 per share.
See accompanying notes which are an integral part of the financial statements.
Annual Report
Financial Highlights - Real Estate Income
Years ended July 31, | 2012 | 2011 | 2010 | 2009 | 2008 |
Selected Per-Share Data | | | | | |
Net asset value, beginning of period | $ 10.75 | $ 9.95 | $ 8.21 | $ 9.43 | $ 11.22 |
Income from Investment Operations | | | | | |
Net investment income (loss) B | .54 | .55 | .53 | .54 | .59 |
Net realized and unrealized gain (loss) | .62 | .76 | 1.73 | (1.27) | (1.48) |
Total from investment operations | 1.16 | 1.31 | 2.26 | (.73) | (.89) |
Distributions from net investment income | (.52) | (.51) | (.52) | (.50) | (.66) |
Distributions from net realized gain | (.10) | - | - | - | (.24) |
Total distributions | (.62) | (.51) | (.52) | (.50) | (.90) |
Redemption fees added to paid in capital B | - F | - F | - F | .01 | - F |
Net asset value, end of period | $ 11.29 | $ 10.75 | $ 9.95 | $ 8.21 | $ 9.43 |
Total Return A | 11.50% | 13.41% | 28.29% | (6.92)% | (8.43)% |
Ratios to Average Net Assets C,E |
Expenses before reductions | .90% | .92% | .97% | 1.00% | .94% |
Expenses net of fee waivers, if any | .89% | .92% | .96% | 1.00% | .94% |
Expenses net of all reductions | .89% | .92% | .96% | 1.00% | .94% |
Net investment income (loss) | 5.12% | 5.21% | 5.60% | 7.15% | 5.77% |
Supplemental Data | | | | | |
Net assets, end of period (000 omitted) | $ 2,252,149 | $ 1,660,063 | $ 1,030,393 | $ 463,269 | $ 393,147 |
Portfolio turnover rate D | 27% | 25% | 28% | 47% | 32% |
A Total returns would have been lower if certain expenses had not been reduced during the applicable periods shown.
B Calculated based on average shares outstanding during the period.
C Fees and expenses of any underlying Fidelity Central Funds are not included in the Fund's expense ratio. The Fund indirectly bears its proportionate share of the expenses of any underlying Fidelity Central Funds.
D Amount does not include the portfolio activity of any underlying Fidelity Central Funds.
E Expense ratios reflect operating expenses of the class. Expenses before reductions do not reflect amounts reimbursed by the investment adviser or reductions from brokerage service arrangements or reductions from other expense offset arrangements and do not represent the amount paid by the class during periods when reimbursements or reductions occur. Expenses net of fee waivers reflect expenses after reimbursement by the investment adviser but prior to reductions from brokerage service arrangements or other expense offset arrangements. Expenses net of all reductions represent the net expenses paid by the class.
F Amount represents less than $.01 per share.
See accompanying notes which are an integral part of the financial statements.
Annual Report
Financial Highlights - Institutional Class
Years ended July 31, | 2012 | 2011 | 2010 G |
Selected Per-Share Data | | | |
Net asset value, beginning of period | $ 10.74 | $ 9.95 | $ 9.95 |
Income from Investment Operations | | | |
Net investment income (loss) D | .55 | .55 | .19 |
Net realized and unrealized gain (loss) | .62 | .76 | (.04) |
Total from investment operations | 1.17 | 1.31 | .15 |
Distributions from net investment income | (.53) | (.52) | (.15) |
Distributions from net realized gain | (.10) | - | - |
Total distributions | (.63) | (.52) | (.15) |
Redemption fees added to paid in capital D,I | - | - | - |
Net asset value, end of period | $ 11.28 | $ 10.74 | $ 9.95 |
Total Return B,C | 11.62% | 13.44% | 1.58% |
Ratios to Average Net Assets E,H | | | |
Expenses before reductions | .84% | .89% | .85% A |
Expenses net of fee waivers, if any | .84% | .89% | .85% A |
Expenses net of all reductions | .84% | .89% | .85% A |
Net investment income (loss) | 5.17% | 5.24% | 6.70% A |
Supplemental Data | | | |
Net assets, end of period (000 omitted) | $ 217,435 | $ 43,282 | $ 2,930 |
Portfolio turnover rate F | 27% | 25% | 28% |
A Annualized
B Total returns for periods of less than one year are not annualized.
C Total returns would have been lower if certain expenses had not been reduced during the applicable periods shown.
D Calculated based on average shares outstanding during the period.
E Fees and expenses of any underlying Fidelity Central Funds are not included in the Fund's expense ratio. The Fund indirectly bears its proportionate share of the expenses of any underlying Fidelity Central Funds.
F Amount does not include the portfolio activity of any underlying Fidelity Central Funds.
G For the period April 14, 2010 (commencement of sale of shares) to July 31, 2010.
H Expense ratios reflect operating expenses of the class. Expenses before reductions do not reflect amounts reimbursed by the investment adviser or reductions from brokerage service arrangements or reductions from other expense offset arrangements and do not represent the amount paid by the class during periods when reimbursements or reductions occur. Expense ratios before reductions for start-up periods may not be representative of longer-term operating periods. Expenses net of fee waivers reflect expenses after reimbursement by the investment adviser but prior to reductions from brokerage service arrangements or other expense offset arrangements. Expenses net of all reductions represent the net expenses paid by the class.
I Amount represents less than $.01 per share.
See accompanying notes which are an integral part of the financial statements.
Annual Report
Notes to Financial Statements
For the period ended July 31, 2012
1. Organization.
Fidelity Real Estate Income Fund (the Fund) is a fund of Fidelity Securities Fund (the Trust) and is authorized to issue an unlimited number of shares. The Trust is registered under the Investment Company Act of 1940, as amended (the 1940 Act), as an open-end management investment company organized as a Massachusetts business trust. The Fund offers Class A, Class T, Class C, Real Estate Income and Institutional Class shares, each of which has equal rights as to assets and voting privileges. Each class has exclusive voting rights with respect to matters that affect that class. Investment income, realized and unrealized capital gains and losses, the common expenses of the Fund, and certain fund-level expense reductions, if any, are allocated on a pro-rata basis to each class based on the relative net assets of each class to the total net assets of the Fund. Each class differs with respect to transfer agent and distribution and service plan fees incurred. Certain expense reductions may also differ by class.
2. Investments in Fidelity Central Funds.
The Fund invests in Fidelity Central Funds, which are open-end investment companies available only to other investment companies and accounts managed by Fidelity Management & Research Company (FMR) and its affiliates. The Fund's Schedule of Investments lists each of the Fidelity Central Funds held as of period end, if any, as an investment of the Fund, but does not include the underlying holdings of each Fidelity Central Fund. As an Investing Fund, the Fund indirectly bears its proportionate share of the expenses of the underlying Fidelity Central Funds.
The Money Market Central Funds seek preservation of capital and current income and are managed by Fidelity Investments Money Management, Inc. (FIMM), an affiliate of FMR.
A complete unaudited list of holdings for each Fidelity Central Fund is available upon request or at the Securities and Exchange Commission (the SEC) web site at www.sec.gov. In addition, the financial statements of the Fidelity Central Funds, which are not covered by the Fund's Report of Independent Registered Public Accounting Firm, are available on the SEC web site or upon request.
3. Significant Accounting Policies.
The financial statements have been prepared in conformity with accounting principles generally accepted in the United States of America (GAAP), which require management to make certain estimates and assumptions at the date of the financial statements. Actual results could differ from those estimates. Subsequent events, if any, through the date that the financial statements were issued have been evaluated in the preparation of the financial statements. The following summarizes the significant accounting policies of the Fund:
Annual Report
Notes to Financial Statements - continued
3. Significant Accounting Policies - continued
Security Valuation. Investments are valued as of 4:00 p.m. Eastern time on the last calendar day of the period. In accordance with valuation policies and procedures approved by the Board of Trustees (the Board), the Fund attempts to obtain prices from one or more third party pricing vendor or broker to value its investments. When current market prices, quotations or rates are not readily available or reliable, securities will be fair valued in good faith by the FMR Fair Value Committee (the Committee), in accordance with procedures adopted by the Fund's Board. Factors used in determining fair value vary by security type and may include market or security specific events, changes in interest rates and credit quality. The frequency with which these procedures are used cannot be predicted and they may be utilized to a significant extent. The Committee oversees the Fund's valuation policies and procedures and is responsible for approving and reporting to the Board all fair value determinations.
The Fund categorizes the inputs to valuation techniques used to value its investments into a disclosure hierarchy consisting of three levels as shown below:
Level 1 - quoted prices in active markets for identical investments
Level 2 - other significant observable inputs (including quoted prices for similar investments, interest rates, prepayment speeds, etc.)
Level 3 - unobservable inputs (including the Fund's own assumptions based on the best information available)
Valuation techniques used to value the Fund's investments by major category are as follows:
Equity securities, including restricted securities, for which market quotations are readily available, are valued at the last reported sale price or official closing price as reported by a third party pricing vendor on the primary market or exchange on which they are traded and are categorized as Level 1 in the hierarchy. In the event there were no sales during the day or closing prices are not available, securities are valued at the last quoted bid price or may be valued using the last available price and are generally categorized as Level 2 in the hierarchy. For foreign equity securities, when significant market or security specific events arise, comparisons to the valuation of American Depositary Receipts (ADRs), futures contracts, Exchange-Traded Funds (ETFs) and certain indexes as well as quoted prices for similar securities are used and are categorized as Level 2 in the hierarchy. Utilizing these techniques may result in transfers between Level 1 and Level 2. For restricted equity securities and private placements where observable inputs are limited, assumptions about market activity and risk are used and these securities are categorized as Level 3 in the hierarchy.
Annual Report
3. Significant Accounting Policies - continued
Security Valuation - continued
Debt securities, including restricted securities, are valued based on evaluated prices received from third party pricing vendors or from brokers who make markets in such securities. For corporate bonds, floating rate loans and preferred securities, pricing vendors utilize matrix pricing which considers yield or price of bonds of comparable quality, coupon, maturity and type as well as broker-supplied prices and are generally categorized as Level 2 in the hierarchy. For asset backed securities, collateralized mortgage obligations and commercial mortgage securities, pricing vendors utilize matrix pricing which considers prepayment speed assumptions, attributes of the collateral, yield or price of bonds of comparable quality, coupon, maturity and type as well as broker-supplied prices and, accordingly, such securities are generally categorized as Level 2 in the hierarchy. Independent prices obtained from a single source or broker are evaluated by management and may be categorized as Level 3 within the fair value hierarchy. When independent prices are unavailable or unreliable, debt securities may be valued utilizing pricing methodologies which consider similar factors that would be used by third party pricing vendors. These are generally categorized as Level 2 in the hierarchy but may be Level 3 depending on the circumstances.
Investments in open-end mutual funds, including the Fidelity Central Funds, are valued at their closing net asset value each business day and are categorized as Level 1 in the hierarchy.
Annual Report
Notes to Financial Statements - continued
3. Significant Accounting Policies - continued
Security Valuation - continued
The following provides information on Level 3 securities held by the Fund that were valued at period end based on unobservable inputs. These amounts exclude valuations provided by a broker.
Asset Type | Fair Value at
07/31/12 | Valuation
Technique(s) | Unobservable
Input | Range | Weighted
Average |
Asset-Backed Securities | $ 3,770,142 | Discounted cash flow | Internal rate of return | 20% | 20% |
| Discounted cash flow | Yield | 8.5% - 15.8% | 10.87% |
| | Market comparable | Spread | 4.75% | 4.75% |
Collateralized Mortgage Obligations | $ 800,642 | Discounted cash flow | Yield | 14% - 42% | 21% |
Commercial
MortgageSecurities | $ 9,977,496 | Discounted cash flow | Yield | 60% | 60% |
| Market comparable | Quoted price | $55 | $55 |
| Market comparable | Spread | 11.54% - 36.05% | 27% |
Common/ Preferred Stocks | $ 4,117,748 | Market comparable | Transaction price | $.001 - $.01 | $0.01 |
| Expected distribution | Recovery rate | 0% | 0% |
| Adjusted book value | Book value
multiple | 1.0 | 1.0 |
Corporate Bonds | $ 2,218,279 | Discounted cash flow | Constant
prepayment rate | 35% | 35% |
| | Expected distribution | Recovery rate | 0% | 0% |
Floating Rate Loans | $ 13,228,477 | Discounted cash flow | Yield | 9.6% - 9.75% | 9.65% |
Preferred
Securities | - | Expected distribution | Recovery rate | 0% | 0% |
For the unobservable inputs listed in the table above, a significant increase in yields, spreads, internal rates of return or constant prepayment rates could result in a significant decrease to the fair value measurement. A significant increase in estimated recovery rates, quoted prices, transactions prices or book value multiples would result in a significant increase to the fair value measurement.
Changes in valuation techniques may result in transfers in or out of an assigned level within the disclosure hierarchy. The aggregate value of investments by input level, as of July 31, 2012, as well as a roll forward of Level 3 securities, is included at the end of the Fund's Schedule of Investments.
Annual Report
3. Significant Accounting Policies - continued
Foreign Currency Translation. The Fund may use foreign currency contracts to facilitate transactions in foreign-denominated securities. Gains and losses from these transactions may arise from changes in the value of the foreign currency or if the counterparties do not perform under the contracts' terms.
Foreign-denominated assets, including investment securities, and liabilities are translated into U.S. dollars at the exchange rates at period end. Purchases and sales of investment securities, income and dividends received and expenses denominated in foreign currencies are translated into U.S. dollars at the exchange rate in effect on the transaction date.
The effects of exchange rate fluctuations on investments are included with the net realized and unrealized gain (loss) on investment securities. Other foreign currency transactions resulting in realized and unrealized gain (loss) are disclosed separately.
Investment Transactions and Income. For financial reporting purposes, the Fund's investment holdings and NAV include trades executed through the end of the last business day of the period. The NAV per share for processing shareholder transactions is calculated as of the close of business of the New York Stock Exchange (NYSE), normally 4:00 p.m. Eastern time and includes trades executed through the end of the prior business day. Gains and losses on securities sold are determined on the basis of identified cost and may include proceeds received from litigation. Dividend income is recorded on the ex-dividend date, except for certain dividends from foreign securities where the ex-dividend date may have passed, which are recorded as soon as the Fund is informed of the ex-dividend date. Non-cash dividends included in dividend income, if any, are recorded at the fair market value of the securities received. Distributions received on securities that represent a return of capital or capital gain are recorded as a reduction of cost of investments and/or as a realized gain. The Fund estimates the components of distributions received that may be considered return of capital distributions or capital gain distributions. Interest income and distributions from the Fidelity Central Funds are accrued as earned. Interest income includes coupon interest and amortization of premium and accretion of discount on debt securities. For certain lower credit quality securitized assets that have contractual cash flows (for example, asset backed securities, collateralized mortgage obligations and commercial mortgage-backed securities), changes in estimated cash flows are periodically evaluated and the estimated yield is adjusted on a prospective basis over the remaining life of the security, resulting in increases or decreases to Interest Income in the accompanying Statement of Operations. Investment income is recorded net of foreign taxes withheld where recovery of such taxes is uncertain. Debt obligations may be placed on non-accrual status and related interest income may be reduced by ceasing current accruals and writing off interest receivables when the collection of all or a portion of interest has become doubtful based on consistently applied procedures. A debt obligation is removed from non-accrual status when the issuer resumes interest payments or when collectability of interest is reasonably assured.
Annual Report
Notes to Financial Statements - continued
3. Significant Accounting Policies - continued
Expenses. Expenses directly attributable to a fund are charged to that fund. Expenses attributable to more than one fund are allocated among the respective funds on the basis of relative net assets or other appropriate methods. Expense estimates are accrued in the period to which they relate and adjustments are made when actual amounts are known.
Income Tax Information and Distributions to Shareholders. Each year, the Fund intends to qualify as a regulated investment company under Subchapter M of the Internal Revenue Code, including distributing substantially all of its taxable income and realized gains. As a result, no provision for income taxes is required. As of July 31, 2012, the Fund did not have any unrecognized tax benefits in the financial statements; nor is the Fund aware of any tax positions for which it is reasonably possible that the total amounts of unrecognized tax benefits will significantly change in the next twelve months. The Fund files a U.S. federal tax return, in addition to state and local tax returns as required. A fund's federal income tax returns are subject to examination by the Internal Revenue Service (IRS) for a period of three fiscal years after they are filed. State and local tax returns may be subject to examination for an additional fiscal year depending on the jurisdiction. Foreign taxes are provided for based on the Fund's understanding of the tax rules and rates that exist in the foreign markets in which it invests.
Distributions are declared and recorded on the ex-dividend date. Income dividends and capital gain distributions are declared separately for each class. Income and capital gain distributions are determined in accordance with income tax regulations, which may differ from GAAP. In addition, the Fund claimed a portion of the payment made to redeeming shareholders as a distribution for income tax purposes.
Capital accounts within the financial statements are adjusted for permanent book-tax differences. These adjustments have no impact on net assets or the results of operations. Temporary book-tax differences will reverse in a subsequent period.
Book-tax differences are primarily due to equity-debt classifications, foreign currency transactions, passive foreign investment companies (PFIC), market discount, partnerships and losses deferred due to wash sales.
The federal tax cost of investment securities and unrealized appreciation (depreciation) as of period end were as follows:
Gross unrealized appreciation | $ 229,881,115 |
Gross unrealized depreciation | (57,864,464) |
Net unrealized appreciation (depreciation) on securities and other investments | $ 172,016,651 |
| |
Tax Cost | $ 2,563,690,335 |
Annual Report
3. Significant Accounting Policies - continued
Income Tax Information and Distributions to Shareholders - continued
The tax-based components of distributable earnings as of period end were as follows:
Undistributed ordinary income | $ 37,796,939 |
Undistributed long-term capital gain | $ 25,839,411 |
Net unrealized appreciation (depreciation) | $ 172,042,855 |
The tax character of distributions paid was as follows:
| July 31, 2012 | July 31, 2011 |
Ordinary Income | $ 98,117,663 | $ 66,688,371 |
Long-term Capital Gains | 16,498,521 | - |
Total | $ 114,616,184 | $ 66,688,371 |
Short-Term Trading (Redemption) Fees. Shares held by investors in the Fund less than 90 days are subject to a redemption fee equal to .75% of the net asset value of shares redeemed. All redemption fees, which reduce the proceeds of the shareholder redemption, are retained by the Fund and accounted for as an addition to paid in capital.
New Accounting Pronouncement. In December 2011, the Financial Accounting Standards Board issued Accounting Standard Update No. 2011-11, Disclosures about Offsetting Assets and Liabilities. The update creates new disclosure requirements requiring entities to disclose both gross and net information for derivatives and other financial instruments that are either offset in the Statement of Assets and Liabilities or subject to an enforceable master netting arrangement or similar agreement. The disclosure requirements are effective for interim and annual reporting periods beginning on or after January 1, 2013. Management is currently evaluating the impact of the update's adoption on the Fund's financial statement disclosures.
4. Operating Policies.
Delayed Delivery Transactions and When-Issued Securities. During the period, the Fund transacted in securities on a delayed delivery or when-issued basis. Payment and delivery may take place after the customary settlement period for that security. The price of the underlying securities and the date when the securities will be delivered and paid for are fixed at the time the transaction is negotiated. The securities purchased on a delayed delivery or when-issued basis are identified as such in the Fund's Schedule of Investments. The Fund may receive compensation for interest forgone in the purchase of a delayed delivery or when-issued security. With respect to purchase commitments, the Fund identifies securities as segregated in its records with a value at least equal to the amount of the commitment. Losses may arise due to changes in the value of the underlying securities or if the counterparty does not perform under the contract's terms, or if the issuer does not issue the securities due to political, economic, or other factors.
Annual Report
Notes to Financial Statements - continued
4. Operating Policies - continued
Restricted Securities. The Fund may invest in securities that are subject to legal or contractual restrictions on resale. These securities generally may be resold in transactions exempt from registration or to the public if the securities are registered. Disposal of these securities may involve time-consuming negotiations and expense, and prompt sale at an acceptable price may be difficult. Information regarding restricted securities is included at the end of the Fund's Schedule of Investments.
Loans and Other Direct Debt Instruments. The Fund invests in direct debt instruments which are interests in amounts owed to lenders by corporate or other borrowers. These instruments may be in the form of loans, trade claims or other receivables and may include standby financing commitments such as revolving credit facilities that obligate the Fund to supply additional cash to the borrower on demand. Loans may be acquired through assignment or participation, or may be made directly to a borrower. The Fund may be contractually obligated to receive approval from the agent bank and/or borrower prior to the sale of these loans.
5. Purchases and Sales of Investments.
Purchases and sales of securities, other than short-term securities and U.S. government securities, aggregated $1,228,544,087 and $513,304,249, respectively.
6. Fees and Other Transactions with Affiliates.
Management Fee. FMR and its affiliates provide the Fund with investment management related services for which the Fund pays a monthly management fee. The management fee is the sum of an individual fund fee rate that is based on an annual rate of .30% of the Fund's average net assets and an annualized group fee rate that averaged .26% during the period. The group fee rate is based upon the average net assets of all the mutual funds advised by FMR. The group fee rate decreases as assets under management increase and increases as assets under management decrease. For the period, the total annual management fee rate was .56% of the Fund's average net assets.
Distribution and Service Plan Fees. In accordance with Rule 12b-1 of the 1940 Act, the Fund has adopted separate Distribution and Service Plans for each class of shares. Certain classes pay Fidelity Distributors Corporation (FDC), an affiliate of FMR, separate Distribution and Service Fees, each of which is based on an annual percentage of each class' average net assets. In addition, FDC may pay financial intermediaries for selling shares of the Fund and providing shareholder support services. For the period, the Distribution and Service Fee rates, total fees and amounts retained by FDC were as follows:
Annual Report
6. Fees and Other Transactions with Affiliates - continued
Distribution and Service Plan Fees - continued
| Distribution
Fee | Service
Fee | Total Fees | Retained
by FDC |
Class A | -% | .25% | $ 218,203 | $ 8,211 |
Class T | -% | .25% | 36,778 | - |
Class C | .75% | .25% | 304,416 | 166,771 |
| | | $ 559,397 | $ 174,982 |
Sales Load. FDC may receive a front-end sales charge of up to 4.00% for selling Class A shares and Class T shares, some of which is paid to financial intermediaries for selling shares of the Fund. Depending on the holding period, FDC may receive contingent deferred sales charges levied on Class A, Class T and Class C redemptions. The deferred sales charges range from 1.00% for Class C shares, 1.00% for certain purchases of Class A shares and .25% for certain purchases of Class T shares.
For the period, sales charge amounts retained by FDC were as follows:
| Retained
by FDC |
Class A | $ 42,872 |
Class T | 8,681 |
Class C* | 7,056 |
| $ 58,609 |
* When Class C shares are initially sold, FDC pays commissions from its own resources to financial intermediaries through which the sales are made.
Transfer Agent Fees. Fidelity Investments Institutional Operations Company, Inc. (FIIOC), an affiliate of FMR, is the transfer, dividend disbursing and shareholder servicing agent for each class of the Fund. FIIOC receives account fees and asset-based fees that vary according to the account size and type of account of the shareholders of the respective classes of the Fund. FIIOC pays for typesetting, printing and mailing of shareholder reports, except proxy statements. For the period, transfer agent fees for each class were as follows:
| Amount | % of
Average
Net Assets |
Class A | $ 216,059 | .25 |
Class T | 35,949 | .24 |
Class C | 75,984 | .25 |
Real Estate Income | 5,073,026 | .28 |
Institutional Class | 284,409 | .22 |
| $ 5,685,427 | |
Annual Report
Notes to Financial Statements - continued
6. Fees and Other Transactions with Affiliates - continued
Accounting and Security Lending Fees. Fidelity Service Company, Inc. (FSC), an affiliate of FMR, maintains the Fund's accounting records. The accounting fee is based on the level of average net assets for each month. Under a separate contract, FSC administers the security lending program. The security lending fee is based on the number and duration of lending transactions.
Brokerage Commissions. The Fund placed a portion of its portfolio transactions with brokerage firms which are affiliates of the investment adviser. The commissions paid to these affiliated firms were $20,704 for the period.
7. Committed Line of Credit.
The Fund participates with other funds managed by FMR or an affiliate in a $4.25 billion credit facility (the "line of credit") to be utilized for temporary or emergency purposes to fund shareholder redemptions or for other short-term liquidity purposes. The Fund has agreed to pay commitment fees on its pro-rata portion of the line of credit, which amounted to $5,657 and is reflected in Miscellaneous expenses on the Statement of Operations. During the period, there were no borrowings on this line of credit.
8. Security Lending.
The Fund lends portfolio securities through a lending agent from time to time in order to earn additional income. For equity securities, a lending agent is used and may loan securities to certain qualified borrowers, including Fidelity Capital Markets (FCM), a broker-dealer affiliated with the Fund. On the settlement date of the loan, the Fund receives collateral (in the form of U.S. Treasury obligations, letters of credit and/or cash) against the loaned securities and maintains collateral in an amount not less than 100% of the market value of the loaned securities during the period of the loan. The market value of the loaned securities is determined at the close of business of the Fund and any additional required collateral is delivered to the Fund on the next business day. If the borrower defaults on its obligation to return the securities loaned because of insolvency or other reasons, a fund could experience delays and costs in recovering the securities loaned or in gaining access to the collateral. Any cash collateral received is invested in the Fidelity Securities Lending Cash Central Fund. The value of loaned securities and cash collateral at period end are disclosed on the Fund's Statement of Assets and Liabilities. Security lending income represents the income earned on investing cash collateral, less rebates paid to borrowers and any lending agent fees associated with the loan, plus any premium payments received for lending certain types of securities. Security lending income is presented in the Statement of Operations as a component of income from Fidelity Central Funds. Total security lending income during the period amounted to $73,576. During the period, there were no securities loaned to FCM.
Annual Report
9. Expense Reductions.
FMR voluntarily agreed to reimburse a portion of the Real Estate Income's operating expenses. During the period, this reimbursement reduced Real Estate Income's expenses by $31,380.
Many of the brokers with whom FMR places trades on behalf of the Fund provided services to the Fund in addition to trade execution. These services included payments of certain expenses on behalf of the Fund totaling $10,839 for the period. In addition, through arrangements with the Fund's custodian, credits realized as a result of uninvested cash balances were used to reduce the Fund's expenses. During the period, these credits reduced the Fund's custody expenses by $429.
10. Distributions to Shareholders.
Distributions to shareholders of each class were as follows:
Years ended July 31, | 2012 | 2011 |
From net investment income | | |
Class A | $ 3,854,404 | $ 1,154,662 |
Class T | 609,057 | 160,366 |
Class C | 1,139,599 | 358,357 |
Real Estate Income | 86,666,891 | 64,149,915 |
Institutional Class | 5,847,712 | 865,071 |
Total | $ 98,117,663 | $ 66,688,371 |
From net realized gain | | |
Class A | $ 603,452 | $ - |
Class T | 83,752 | - |
Class C | 208,802 | - |
Real Estate Income | 14,865,902 | - |
Institutional Class | 736,613 | - |
Total | $ 16,498,521 | $ - |
Annual Report
Notes to Financial Statements - continued
11. Share Transactions.
Transactions for each class of shares were as follows:
| Shares | Dollars |
Years ended July 31, | 2012 | 2011 | 2012 | 2011 |
Class A | | | | |
Shares sold | 8,276,874 | 5,544,292 | $ 88,010,262 | $ 58,675,375 |
Reinvestment of distributions | 333,613 | 75,836 | 3,436,744 | 799,911 |
Shares redeemed | (2,031,559) | (384,554) | (21,254,183) | (4,105,728) |
Net increase (decrease) | 6,578,928 | 5,235,574 | $ 70,192,823 | $ 55,369,558 |
Class T | | | | |
Shares sold | 1,725,200 | 662,414 | $ 18,422,015 | $ 7,018,853 |
Reinvestment of distributions | 49,495 | 12,671 | 511,986 | 132,964 |
Shares redeemed | (163,799) | (50,669) | (1,727,688) | (536,547) |
Net increase (decrease) | 1,610,896 | 624,416 | $ 17,206,313 | $ 6,615,270 |
Class C | | | | |
Shares sold | 3,117,808 | 2,030,776 | $ 33,302,251 | $ 21,411,850 |
Reinvestment of distributions | 110,126 | 29,432 | 1,128,377 | 309,638 |
Shares redeemed | (534,569) | (125,083) | (5,534,157) | (1,328,625) |
Net increase (decrease) | 2,693,365 | 1,935,125 | $ 28,896,471 | $ 20,392,863 |
Real Estate Income | | | | |
Shares sold | 90,720,847 | 89,725,340 | $ 959,813,942 | $ 943,333,748 |
Reinvestment of distributions | 8,913,831 | 5,601,468 | 91,762,119 | 58,273,356 |
Shares redeemed | (54,623,988) | (44,449,757) | (572,115,634) | (467,916,333) |
Net increase (decrease) | 45,010,690 | 50,877,051 | $ 479,460,427 | $ 533,690,771 |
Institutional Class | | | | |
Shares sold | 16,926,727 | 4,361,479 | $ 177,564,635 | $ 46,245,871 |
Reinvestment of distributions | 472,572 | 55,523 | 4,899,349 | 583,903 |
Shares redeemed | (2,146,783) | (681,623) | (22,734,449) | (7,257,237) |
Net increase (decrease) | 15,252,516 | 3,735,379 | $ 159,729,535 | $ 39,572,537 |
12. Other.
The Fund's organizational documents provide former and current trustees and officers with a limited indemnification against liabilities arising in connection with the performance of their duties to the Fund. In the normal course of business, the Fund may also enter into contracts that provide general indemnifications. The Fund's maximum exposure under these arrangements is unknown as this would be dependent on future claims that may be made against the Fund. The risk of material loss from such claims is considered remote.
Annual Report
To the Trustees of Fidelity Securities Fund and Shareholders of Fidelity Real Estate Income Fund:
We have audited the accompanying statement of assets and liabilities of Fidelity Real Estate Income Fund (the Fund), a fund of Fidelity Securities Fund, including the schedule of investments, as of July 31, 2012, and the related statement of operations for the year then ended, the statement of changes in net assets for each of the two years in the period then ended, and the financial highlights for each of the five years in the period then ended. These financial statements and financial highlights are the responsibility of the Fund's management. Our responsibility is to express an opinion on these financial statements and financial highlights based on our audits.
We conducted our audits in accordance with the standards of the Public Company Accounting Oversight Board (United States). Those standards require that we plan and perform the audit to obtain reasonable assurance about whether the financial statements and financial highlights are free of material misstatement. The Fund is not required to have, nor were we engaged to perform, an audit of its internal control over financial reporting. Our audits included consideration of internal control over financial reporting as a basis for designing audit procedures that are appropriate in the circumstances, but not for the purpose of expressing an opinion on the effectiveness of the Fund's internal control over financial reporting. Accordingly, we express no such opinion. An audit also includes examining, on a test basis, evidence supporting the amounts and disclosures in the financial statements, assessing the accounting principles used and significant estimates made by management, as well as evaluating the overall financial statement presentation. Our procedures included confirmation of securities owned as of July 31, 2012, by correspondence with the custodians and brokers; where replies were not received from brokers, we performed other auditing procedures. We believe that our audits provide a reasonable basis for our opinion.
In our opinion, the financial statements and financial highlights referred to above present fairly, in all material respects, the financial position of Fidelity Real Estate Income Fund as of July 31, 2012, the results of its operations for the year then ended, the changes in its net assets for each of the two years in the period then ended, and the financial highlights for each of the five years in the period then ended, in conformity with accounting principles generally accepted in the United States of America.
DELOITTE & TOUCHE LLP
Boston, Massachusetts
September 19, 2012
Annual Report
The Trustees, Members of the Advisory Board, and executive officers of the trust and fund, as applicable, are listed below. The Board of Trustees governs the fund and is responsible for protecting the interests of shareholders. The Trustees are experienced executives who meet periodically throughout the year to oversee the fund's activities, review contractual arrangements with companies that provide services to the fund, oversee management of the risks associated with such activities and contractual arrangements, and review the fund's performance. Except for James C. Curvey, each of the Trustees oversees 228 funds advised by FMR or an affiliate. Mr. Curvey oversees 435 funds advised by FMR or an affiliate.
The Trustees hold office without limit in time except that (a) any Trustee may resign; (b) any Trustee may be removed by written instrument, signed by at least two-thirds of the number of Trustees prior to such removal; (c) any Trustee who requests to be retired or who has become incapacitated by illness or injury may be retired by written instrument signed by a majority of the other Trustees; and (d) any Trustee may be removed at any special meeting of shareholders by a two-thirds vote of the outstanding voting securities of the trust. Each Trustee who is not an interested person (as defined in the 1940 Act) (Independent Trustee), shall retire not later than the last day of the calendar year in which his or her 75th birthday occurs. The Independent Trustees may waive this mandatory retirement age policy with respect to individual Trustees. The executive officers and Advisory Board Members hold office without limit in time, except that any officer and Advisory Board Member may resign or may be removed by a vote of a majority of the Trustees at any regular meeting or any special meeting of the Trustees. Except as indicated, each individual has held the office shown or other offices in the same company for the past five years.
Experience, Skills, Attributes, and Qualifications of the Fund's Trustees. The Governance and Nominating Committee has adopted a statement of policy that describes the experience, qualifications, attributes, and skills that are necessary and desirable for potential Independent Trustee candidates (Statement of Policy). The Board believes that each Trustee satisfied at the time he or she was initially elected or appointed a Trustee, and continues to satisfy, the standards contemplated by the Statement of Policy. The Governance and Nominating Committee also engages professional search firms to help identify potential Independent Trustee candidates who have the experience, qualifications, attributes, and skills consistent with the Statement of Policy. From time to time, additional criteria based on the composition and skills of the current Independent Trustees, as well as experience or skills that may be appropriate in light of future changes to board composition, business conditions, and regulatory or other developments, have also been considered by the professional search firms and the Governance and Nominating Committee. In addition, the Board takes into account the Trustees' commitment and participation in Board and committee meetings, as well as their leadership of standing and ad hoc committees throughout their tenure.
In determining that a particular Trustee was and continues to be qualified to serve as a Trustee, the Board has considered a variety of criteria, none of which, in isolation, was controlling. The Board believes that, collectively, the Trustees have balanced and diverse experience, qualifications, attributes, and skills, which allow the Board to operate effectively in governing the fund and protecting the interests of shareholders. Information about the specific experience, skills, attributes, and qualifications of each Trustee, which in each case led to the Board's conclusion that the Trustee should serve (or continue to serve) as a trustee of the fund, is provided below.
Annual Report
Board Structure and Oversight Function. James C. Curvey is an interested person (as defined in the 1940 Act) and currently serves as Chairman. The Trustees have determined that an interested Chairman is appropriate and benefits shareholders because an interested Chairman has a personal and professional stake in the quality and continuity of services provided to the fund. Independent Trustees exercise their informed business judgment to appoint an individual of their choosing to serve as Chairman, regardless of whether the Trustee happens to be independent or a member of management. The Independent Trustees have determined that they can act independently and effectively without having an Independent Trustee serve as Chairman and that a key structural component for assuring that they are in a position to do so is for the Independent Trustees to constitute a substantial majority for the Board. The Independent Trustees also regularly meet in executive session. Ned C. Lautenbach serves as Chairman of the Independent Trustees and as such (i) acts as a liaison between the Independent Trustees and management with respect to matters important to the Independent Trustees and (ii) with management prepares agendas for Board meetings.
Fidelity funds are overseen by different Boards of Trustees. The fund's Board oversees Fidelity's equity and high income funds and another Board oversees Fidelity's investment-grade bond, money market, and asset allocation funds. The asset allocation funds may invest in Fidelity funds overseen by the fund's Board. The use of separate Boards, each with its own committee structure, allows the Trustees of each group of Fidelity funds to focus on the unique issues of the funds they oversee, including common research, investment, and operational issues. On occasion, the separate Boards establish joint committees to address issues of overlapping consequences for the Fidelity funds overseen by each Board.
The Trustees operate using a system of committees to facilitate the timely and efficient consideration of all matters of importance to the Trustees, the fund, and fund shareholders and to facilitate compliance with legal and regulatory requirements and oversight of the fund's activities and associated risks. The Board, acting through its committees, has charged FMR and its affiliates with (i) identifying events or circumstances the occurrence of which could have demonstrably adverse effects on the fund's business and/or reputation; (ii) implementing processes and controls to lessen the possibility that such events or circumstances occur or to mitigate the effects of such events or circumstances if they do occur; and (iii) creating and maintaining a system designed to evaluate continuously business and market conditions in order to facilitate the identification and implementation processes described in (i) and (ii) above. Because the day-to-day operations and activities of the fund are carried out by or through FMR, its affiliates and other service providers, the fund's exposure to risks is mitigated but not eliminated by the processes overseen by the Trustees. While each of the Board's committees has responsibility for overseeing different aspects of the fund's activities, oversight is exercised primarily through the Operations, Audit, and Compliance Committees. In addition, the Independent Trustees have worked with FMR to enhance the Board's oversight of investment and financial risks, legal and regulatory risks, technology risks, and operational risks, including the development of additional risk reporting to the Board. For example, a working group comprised of Independent Trustees and FMR has worked and continues to work to review the Fidelity funds' valuation-related activities, reporting and risk management. Appropriate personnel, including but not limited to the fund's Chief Compliance Officer (CCO), FMR's internal auditor, the independent accountants, the fund's Treasurer and portfolio management personnel, make periodic reports to the Board's committees, as appropriate, including an annual review of FMR's risk management program for the Fidelity funds. The responsibilities of each standing committee, including their oversight responsibilities, are described further under "Standing Committees of the Fund's Trustees."
Annual Report
Trustees and Officers - continued
The fund's Statement of Additional Information (SAI) includes more information about the Trustees. To request a free copy, call Fidelity at 1-877-208-0098.
Interested Trustees*:
Correspondence intended for each Trustee who is an interested person may be sent to Fidelity Investments, 82 Devonshire Street, Boston, Massachusetts 02109.
Name, Age; Principal Occupations and Other Relevant Experience+ |
James C. Curvey (77) |
| Year of Election or Appointment: 2007 Mr. Curvey is Trustee and Chairman of the Board of Trustees of certain Trusts. Mr. Curvey also serves as Trustee (2007-present) of other investment companies advised by FMR. Mr. Curvey is a Director of Fidelity Investments Money Management, Inc. (2009-present), Director of Fidelity Research & Analysis Co. (2009-present) and Director of FMR and FMR Co., Inc. (2007-present). Mr. Curvey is also Vice Chairman (2007-present) and Director of FMR LLC. In addition, Mr. Curvey serves as an Overseer for the Boston Symphony Orchestra and a member of the Trustees of Villanova University. Previously, Mr. Curvey was the Vice Chairman (2006-2007) and Director (2000-2007) of FMR Corp. |
Ronald P. O'Hanley (55) |
| Year of Election or Appointment: 2011 Mr. O'Hanley is Director of FMR Co., Inc. (2010-present), Director of Fidelity Investments Money Management, Inc. (2010-present), Director of Fidelity Research & Analysis Company (2010-present), President of Fidelity Asset Management and Corporate Services and a member of Fidelity's Executive Committee (2010-present). Previously, Mr. O'Hanley served as President and Chief Executive Officer of BNY Mellon Asset Management (2007-2010). Mr. O'Hanley also served as Vice Chairman of Bank New York Mellon Corp. and a member of that firm's Executive Committee. Prior to the 2007 merger of The Bank of New York and Mellon Financial Corporation, he was Vice Chairman of Mellon Financial Corporation and President and Chief Executive Officer of Mellon Asset Management. He joined Mellon in February 1997. Mr. O'Hanley currently serves as Chairman of the Boston Public Library Foundation Board of Directors and sits on the Board of Directors of Beth Israel Deaconess Medical Center, the Board of Trustees of the Marine Biological Laboratory and the Advisory Board of the Maxwell School of Citizenship and Public Administration at Syracuse University. Mr. O'Hanley also chairs the Council on Asset Management for the Financial Services Roundtable and is a member of the Board of Directors of Institutional Investor's U.S. Institute. |
* Trustees have been determined to be "Interested Trustees" by virtue of, among other things, their affiliation with the trust or various entities under common control with FMR.
+ The information above includes each Trustee's principal occupation during the last five years and other information relating to the experience, attributes, and skills relevant to each Trustee's qualifications to serve as a Trustee, which led to the conclusion that each Trustee should serve as a Trustee for the fund.
Annual Report
Trustees and Officers - continued
Independent Trustees:
Correspondence intended for each Independent Trustee (that is, the Trustees other than the Interested Trustees) may be sent to Fidelity Investments, P.O. Box 55235, Boston, Massachusetts 02205-5235.
Name, Age; Principal Occupations and Other Relevant Experience+ |
Dennis J. Dirks (64) |
| Year of Election or Appointment: 2005 Prior to his retirement in May 2003, Mr. Dirks was Chief Operating Officer and a member of the Board of The Depository Trust & Clearing Corporation (DTCC). He also served as President, Chief Operating Officer, and Board member of The Depository Trust Company (DTC) and President and Board member of the National Securities Clearing Corporation (NSCC). In addition, Mr. Dirks served as Chief Executive Officer and Board member of the Government Securities Clearing Corporation, Chief Executive Officer and Board member of the Mortgage-Backed Securities Clearing Corporation, as a Trustee and a member of the Finance Committee of Manhattan College (2005-2008), and as a Trustee and a member of the Finance Committee of AHRC of Nassau County (2006-2008). Mr. Dirks is a member of the Independent Directors Council (IDC) Governing Council (2010-present) and Board of Directors for The Brookville Center for Children's Services, Inc. (2009-present). |
Alan J. Lacy (58) |
| Year of Election or Appointment: 2008 Mr. Lacy serves as Senior Adviser (2007-present) of Oak Hill Capital Partners, L.P. (private equity). Mr. Lacy also served as Chief Executive Officer (2000-2005) and Vice Chairman (2005-2006) of Sears Holdings Corporation and Sears, Roebuck and Co. (retail). In addition, Mr. Lacy serves as a member of the Board of Directors of Dave & Buster's Entertainment, Inc. (restaurant and entertainment complexes, 2010-present), Earth Fare, Inc. (retail grocery, 2012-present), The Hillman Companies, Inc. (hardware wholesalers, 2010-present), and Bristol-Myers Squibb Company (global pharmaceuticals, 2007-present). Mr. Lacy is a member of the Board of Trustees of The National Parks Conservation Association (2006-present). Previously, Mr. Lacy served as Chairman of the Board of Trustees of the National Parks Conservation Association (2008-2011) and as a member of the Board of Directors for the Western Union Company (global money transfer, 2006-2011). |
Ned C. Lautenbach (68) |
| Year of Election or Appointment: 2000 Mr. Lautenbach is Chairman of the Independent Trustees of the Equity and High Income Funds (2006-present). Mr. Lautenbach currently serves as the Lead Director of the Eaton Corporation Board of Directors (diversified industrial, 1997-present). Mr. Lautenbach is Chairman of the Board of Directors of the Philharmonic Center for the Arts in Naples, Florida (2012-present) and a member of the Council on Foreign Relations (1994-present). Previously, Mr. Lautenbach was a Partner/Advisory Partner at Clayton, Dubilier & Rice, LLC (private equity investment, 1998-2010), as well as a Director of Sony Corporation (2006-2007). |
Joseph Mauriello (67) |
| Year of Election or Appointment: 2008 Prior to his retirement in January 2006, Mr. Mauriello served in numerous senior management positions including Deputy Chairman and Chief Operating Officer (2004-2005), and Vice Chairman of Financial Services (2002-2004) of KPMG LLP US (professional services, 1965-2005). Mr. Mauriello currently serves as a member of the Board of Directors of XL Group plc. (global insurance and re-insurance, 2006-present). Previously, Mr. Mauriello served as a Director of the Hamilton Funds of the Bank of New York (2006-2007) and of Arcadia Resources Inc. (health care services and products, 2007-2012). |
Robert W. Selander (61) |
| Year of Election or Appointment: 2011 Previously, Mr. Selander served as a Member of the Advisory Board of Fidelity's Equity and High Income Funds (2011), Executive Vice Chairman (2010), Chief Executive Officer (2009-2010), and President and Chief Executive Officer (1997-2009) of Mastercard, Inc. |
Cornelia M. Small (68) |
| Year of Election or Appointment: 2005 Ms. Small is a member of the Board of Directors of the Teagle Foundation (2009-present). Ms. Small is also a member of the Investment Committee, and Chair (2008-present) and a member of the Board of Trustees of Smith College. In addition, Ms. Small serves on the Investment Committee of the Berkshire Taconic Community Foundation (2008-present). Previously, Ms. Small served as Chairperson of the Investment Committee (2002-2008) of Smith College. In addition, Ms. Small served as Chief Investment Officer, Director of Global Equity Investments, and a member of the Board of Directors of Scudder, Stevens & Clark and Scudder Kemper Investments. |
William S. Stavropoulos (73) |
| Year of Election or Appointment: 2002 Mr. Stavropoulos is Vice Chairman of the Independent Trustees of the Equity and High Income Funds (2006-present). Mr. Stavropoulos serves as President and Founder of the Michigan Baseball Foundation, the Great Lakes Loons (2007-present). Mr. Stavropoulos is Chairman Emeritus of the Board of Directors of The Dow Chemical Company, where he previously served in numerous senior management positions, including President, CEO (1995-2000; 2002-2004), Chairman of the Executive Committee (2000-2006), and as a member of the Board of Directors (1990-2006). Currently, Mr. Stavropoulos is Chairman of Univar (global distributor of commodity and specialty chemicals, 2010-present), a Director of Teradata Corporation (data warehousing and technology solutions, 2008-present), Chemical Financial Corporation, Maersk Inc. (industrial conglomerate), Tyco International, Inc. (multinational manufacturing and services, 2007-present), and a member of the Advisory Board for Metalmark Capital (private equity investment, 2005-present). Mr. Stavropoulos is a special advisor to Clayton, Dubilier & Rice, LLC (private equity investment). In addition, Mr. Stavropoulos is a member of the University of Notre Dame Advisory Council for the College of Science. |
David M. Thomas (63) |
| Year of Election or Appointment: 2008 Previously, Mr. Thomas served as Executive Chairman (2005-2006) and Chairman and Chief Executive Officer (2000-2005) of IMS Health, Inc. (pharmaceutical and healthcare information solutions). In addition, Mr. Thomas serves as a member of the Board of Directors of Fortune Brands, Inc. (consumer products), and Interpublic Group of Companies, Inc. (marketing communication, 2004-present). |
Michael E. Wiley (61) |
| Year of Election or Appointment: 2008 Mr. Wiley also serves as a Director of Asia Pacific Exploration Consolidated (international oil and gas exploration and production, 2008-present). Mr. Wiley serves as a Director of Tesoro Corporation (independent oil refiner and marketer, 2005-present), and a Director of Bill Barrett Corporation (exploration and production, 2005-present). In addition, Mr. Wiley also serves as a Director of Post Oak Bank (privately-held bank, 2004-present). Previously, Mr. Wiley served as a member of the Board of Trustees of the University of Tulsa (2000-2006; 2007-2010), as a Senior Energy Advisor of Katzenbach Partners, LLC (consulting, 2006-2007), as an Advisory Director of Riverstone Holdings (private investment), Chairman, President, and CEO of Baker Hughes, Inc. (oilfield services, 2000-2004), and as Director of Spinnaker Exploration Company (exploration and production, 2001-2005). |
Annual Report
+ The information above includes each Trustee's principal occupation during the last five years and other information relating to the experience, attributes, and skills relevant to each Trustee's qualifications to serve as a Trustee, which led to the conclusion that each Trustee should serve as a Trustee for the fund.
Advisory Board Members and Executive Officers:
Correspondence intended for David A. Rosow and Garnett A. Smith may be sent to Fidelity Investments, P.O. Box 55235, Boston, Massachusetts 02205-5235. Correspondence intended for each executive officer, Edward C. Johnson 3d, and Peter S. Lynch may be sent to Fidelity Investments, 82 Devonshire Street, Boston, Massachusetts 02109.
Name, Age; Principal Occupation |
Edward C. Johnson 3d (82) |
| Year of Election or Appointment: 2011 Member of the Advisory Board of Fidelity's Equity and High Income Funds. Mr. Johnson serves as Chief Executive Officer, Chairman, and a Director of FMR LLC, and also serves as Chairman and Director of FIL Limited. Previously, Mr. Johnson served as a Trustee and Chairman of the Board of certain Fidelity Trusts, Chairman and a Director of FMR, Chairman and a Director of FMR Co., Inc., and President of FMR LLC (2006-2007). |
Peter S. Lynch (68) |
| Year of Election or Appointment: 2003 Member of the Advisory Board of Fidelity's Equity and High Income Funds. Mr. Lynch is Vice Chairman and a Director of FMR and FMR Co., Inc. In addition, Mr. Lynch serves as a Trustee of Boston College and as the Chairman of the Inner-City Scholarship Fund. Previously, Mr. Lynch served on the Special Olympics International Board of Directors (1997-2006). |
David A. Rosow (69) |
| Year of Election or Appointment: 2012 Member of the Advisory Board of Fidelity's Equity and High Income Funds. Chairman and Chief Executive Officer of International Golf Group, Inc. (golf course development, 1990-present). Previously, Mr. Rosow served as Chairman and Chief Executive Officer of Rosow & Company, Inc. (private investment company, 1989-2011), a Lead Director of Hudson United Bancorp (2001-2006) and as a Director of TD Banknorth (1996-2006). In addition, Mr. Rosow is a member (2008-present) and President (2009-present) of the Town Council of Palm Beach, Florida. |
Garnett A. Smith (64) |
| Year of Election or Appointment: 2012 Member of the Advisory Board of Fidelity's Equity and High Income Funds. Prior to Mr. Smith's retirement, he served as Chairman and Chief Executive Officer of Inbrand Corp. (manufacturer of personal absorbent products, 1990-1997). He also served as President (1986-1990) of Inbrand Corp. Prior to his employment with Inbrand Corp., he was employed by a retail fabric chain and North Carolina National Bank. In addition, Mr. Smith is a board member of the Jackson Hole Land Trust (2009-present). |
Kenneth B. Robins (42) |
| Year of Election or Appointment: 2008 President and Treasurer of Fidelity's Equity and High Income Funds. Mr. Robins also serves as President and Treasurer (2010-present) and Assistant Treasurer (2009-present) of other Fidelity funds and is an employee of Fidelity Investments (2004-present). Previously, Mr. Robins served as Deputy Treasurer of the Fidelity funds (2005-2008) and Treasurer and Chief Financial Officer of The North Carolina Capital Management Trust: Cash and Term Portfolios (2006-2008). |
Brian B. Hogan (47) |
| Year of Election or Appointment: 2009 Vice President of Equity and High Income Funds. Mr. Hogan also serves as President of FMR's Equity Division (2009-present). Previously, Mr. Hogan served as Senior Vice President, Equity Research of FMR (2006-2009) and as a portfolio manager. |
Christopher S. Bartel (40) |
| Year of Election or Appointment: 2009 Vice President of Fidelity's Sector and Real Estate Equity Funds. Mr. Bartel also serves as a Director, President, and Chief Executive Officer of Fidelity Management & Research (Japan) Inc. (2012-present), a Director of Fidelity Management & Research (Hong Kong) (2012-present), and Senior Vice President of Global Equity Research (2010-present). Previously, Mr. Bartel served as Senior Vice President of Equity Research (2009-2010), Managing Director of Research (2006-2009), and an analyst and portfolio manager (2000-2006). |
Scott C. Goebel (44) |
| Year of Election or Appointment: 2008 Secretary and Chief Legal Officer (CLO) of the Fidelity funds. Mr. Goebel also serves as Secretary of Fidelity Investments Money Management, Inc. (FIMM) (2010-present) and Fidelity Research and Analysis Company (FRAC) (2010-present); Secretary and CLO of The North Carolina Capital Management Trust: Cash and Term Portfolios (2008-present); General Counsel, Secretary, and Senior Vice President of FMR (2008-present) and FMR Co., Inc. (2008-present); employed by FMR LLC or an affiliate (2001-present); Chief Legal Officer of Fidelity Management & Research (Hong Kong) Limited (2008-present) and Assistant Secretary of Fidelity Management & Research (Japan) Inc. (2008-present), and Fidelity Management & Research (U.K.) Inc. (2008-present). Previously, Mr. Goebel served as Assistant Secretary of FIMM (2008-2010), FRAC (2008-2010), and the Funds (2007-2008) and as Vice President and Secretary of Fidelity Distributors Corporation (FDC) (2005-2007). |
William C. Coffey (43) |
| Year of Election or Appointment: 2009 Assistant Secretary of Fidelity's Equity and High Income Funds. Mr. Coffey also serves as Senior Vice President and Deputy General Counsel of FMR LLC (2010-present), and is an employee of Fidelity Investments. Previously, Mr. Coffey served as Vice President and Associate General Counsel of FMR LLC (2005-2009). |
Elizabeth Paige Baumann (44) |
| Year of Election or Appointment: 2012 Anti-Money Laundering (AML) Officer of the Fidelity funds. Ms. Baumann also serves as AML Officer of The North Carolina Capital Management Trust: Cash and Term Portfolios (2012-present), Chief AML Officer of FMR LLC (2012-present), and is an employee of Fidelity Investments. Previously, Ms. Baumann served as Vice President and Deputy Anti-Money Laundering Officer (2007-2012). |
Christine Reynolds (53) |
| Year of Election or Appointment: 2008 Chief Financial Officer of the Fidelity funds. Ms. Reynolds became President of Fidelity Pricing and Cash Management Services (FPCMS) in August 2008. Ms. Reynolds served as Chief Operating Officer of FPCMS (2007-2008). Previously, Ms. Reynolds served as President, Treasurer, and Anti-Money Laundering officer of the Fidelity funds (2004-2007). |
Joseph A. Hanlon (44) |
| Year of Election or Appointment: 2012 Chief Compliance Officer of Fidelity's Equity and High Income Funds. Mr. Hanlon serves as Compliance Officer of FMR, FMR Co., Inc., Fidelity Investments Money Management, Inc. (FIMM), Fidelity Research and Analysis Company (FRAC), Fidelity Management & Research (Japan) Inc., Fidelity Management & Research (U.K.) Inc., Fidelity Management & Research (Hong Kong), and Strategic Advisers, Inc. (2009-present), as Senior Vice President of the Fidelity Asset Management Division (2009-present), and is an employee of Fidelity Investments. |
Joseph F. Zambello (55) |
| Year of Election or Appointment: 2011 Deputy Treasurer of the Fidelity funds. Mr. Zambello is an employee of Fidelity Investments. Previously, Mr. Zambello served as Vice President of FMR's Program Management Group (2009-2011) and Vice President of the Transfer Agent Oversight Group (2005-2009). |
Adrien E. Deberghes (44) |
| Year of Election or Appointment: 2008 Deputy Treasurer of Fidelity's Equity and High Income Funds. Mr. Deberghes also serves as Vice President (2011-present) and Assistant Treasurer (2010-present) of other Fidelity funds, and is an employee of Fidelity Investments (2008-present). Previously, Mr. Deberghes served as Senior Vice President of Mutual Fund Administration at State Street Corporation (2007-2008), Senior Director of Mutual Fund Administration at Investors Bank & Trust (2005-2007), and Director of Finance for Dunkin' Brands (2000-2005). |
Stephanie J. Dorsey (43) |
| Year of Election or Appointment: 2010 Assistant Treasurer of Fidelity's Equity and High Income Funds. Ms. Dorsey also serves as Deputy Treasurer of other Fidelity funds (2008-present) and is an employee of Fidelity Investments (2008-present). Previously, Ms. Dorsey served as Treasurer (2004-2008) of the JPMorgan Mutual Funds and Vice President (2004-2008) of JPMorgan Chase Bank. |
John R. Hebble (54) |
| Year of Election or Appointment: 2009 Assistant Treasurer of Fidelity's Equity and High Income Funds. Mr. Hebble also serves as President (2011-present), Treasurer, and Chief Financial Officer of The North Carolina Capital Management Trust: Cash and Term Portfolios (2008-present), President and Treasurer of other Fidelity funds (2008-present) and is an employee of Fidelity Investments. |
Gary W. Ryan (53) |
| Year of Election or Appointment: 2005 Assistant Treasurer of the Fidelity funds. Mr. Ryan is an employee of Fidelity Investments. Previously, Mr. Ryan served as Vice President of Fund Reporting in Fidelity Pricing and Cash Management Services (FPCMS) (1999-2005). |
Jonathan Davis (44) |
| Year of Election or Appointment: 2010 Assistant Treasurer of the Fidelity funds. Mr. Davis is also Assistant Treasurer of Fidelity Rutland Square Trust II and Fidelity Commonwealth Trust II. Mr. Davis is an employee of Fidelity Investments. Previously, Mr. Davis served as Vice President and Associate General Counsel of FMR LLC (2003-2010). |
Annual Report
The Board of Trustees of Fidelity Advisor Real Estate Income Fund voted to pay to shareholders of record at the opening of business, the following distributions per share derived from capital gains realized from sales of portfolio securities, and dividends derived from net investment income:
| Pay Date | Record Date | Dividends | Capital Gains |
Institutional Class | 09/10/12 | 09/07/12 | $0.152 | $0.143 |
The fund hereby designates as a capital gain dividend with respect to the taxable year ended July 31,2012, $34,246,008, or, if subsequently determined to be different, the net capital gain of such year.
A total of 0.05% of the dividends distributed during the fiscal year was derived from interest on U.S. Government securities which is generally exempt from state income tax.
The fund will notify shareholders in January 2013 of amounts for use in preparing 2012 income tax returns.
Annual Report
Board Approval of Investment Advisory Contracts and Management Fees
Fidelity Real Estate Income Fund
Each year, the Board of Trustees, including the Independent Trustees (together, the Board), votes on the renewal of the management contract and sub-advisory agreements (together, the Advisory Contracts) for the fund. The Board, assisted by the advice of fund counsel and Independent Trustees' counsel, requests and considers a broad range of information relevant to the renewal of the Advisory Contracts throughout the year.
The Board meets regularly and, at each of its meetings, considers factors that are relevant to its annual consideration of the renewal of the fund's Advisory Contracts, including the services and support provided to the fund and its shareholders. The Board has established various standing committees, each composed of and chaired by Independent Trustees with varying backgrounds, to which the Board has assigned specific subject matter responsibilities in order to enhance effective decision-making by the Board. The Board, acting directly and through its Committees, requests and receives information concerning the annual consideration of the renewal of the fund's Advisory Contracts. The Board also meets as needed to consider matters specifically related to the Board's annual consideration of the renewal of Advisory Contracts. Members of the Board may also meet with trustees of other Fidelity funds through ad hoc joint committees to discuss certain matters relevant to the Fidelity funds.
At its July 2012 meeting, the Board of Trustees, including the Independent Trustees, unanimously determined to renew the fund's Advisory Contracts. In reaching its determination, the Board considered all factors it believed relevant, including (i) the nature, extent, and quality of the services to be provided to the fund and its shareholders (including the investment performance of the fund); (ii) the competitiveness of the fund's management fee and total expense ratio relative to peer funds; (iii) the total costs of the services to be provided by and the profits to be realized by Fidelity from its relationship with the fund; (iv) the extent to which economies of scale exist and would be realized as the fund grows; and (v) whether fee levels reflect these economies of scale, if any, for the benefit of fund shareholders.
In considering whether to renew the Advisory Contracts for the fund, the Board reached a determination, with the assistance of fund counsel and Independent Trustees' counsel and through the exercise of its business judgment, that the renewal of the Advisory Contracts is in the best interests of the fund and its shareholders and that the compensation payable under the Advisory Contracts is fair and reasonable. The Board's decision to renew the Advisory Contracts was not based on any single factor, but rather was based on a comprehensive consideration of all the information provided to the Board at its meetings throughout the year. The Board, in reaching its determination to renew the Advisory Contracts, is aware that shareholders in the fund have a broad range of investment choices available to them, including a wide choice among mutual funds offered by Fidelity's competitors, and that the fund's shareholders, who have the opportunity to review and weigh the disclosure provided by the fund in its prospectus and other public disclosures, have chosen to invest in this fund, managed by Fidelity.
Annual Report
Board Approval of Investment Advisory Contracts and
Management Fees - continued
Nature, Extent, and Quality of Services Provided. The Board considered the staffing within the investment adviser, FMR, and the sub-advisers (together, the Investment Advisers), including the backgrounds of the fund's investment personnel, and also considered the fund's investment objective, strategies, and related investment philosophy. The Independent Trustees also had discussions with senior management of Fidelity's investment operations and investment groups. The Board considered the structure of the portfolio manager compensation program and whether this structure provides appropriate incentives to act in the best interests of the fund.
Resources Dedicated to Investment Management and Support Services. The Board and the Fund Oversight and Research Committees reviewed the general qualifications and capabilities of the Investment Advisers' investment staff, including its size, education, experience, and resources, as well as the Investment Advisers' approach to recruiting, training, managing, and compensating investment personnel. The Board also noted that FMR has continued to increase the resources devoted to non-U.S. offices, including expansion of Fidelity's global investment organization. The Board noted that Fidelity's analysts have extensive resources, tools and capabilities that allow them to conduct sophisticated quantitative and fundamental analysis, as well as credit analysis of issuers, counterparties and guarantors. The Board also believes that Fidelity's investment professionals have sufficient access to global information and data so as to provide competitive investment results over time, and that those professionals also have access to sophisticated tools that permit them to assess portfolio construction and risk and performance attribution characteristics continuously, as well as to transmit new information and research conclusions rapidly around the world. Additionally, in its deliberations, the Board considered the Investment Advisers' trading and risk management capabilities and resources, which are an integral part of the investment management process.
Shareholder and Administrative Services. The Board considered (i) the nature, extent, quality, and cost of advisory, administrative, and shareholder services performed by the Investment Advisers and their affiliates under the Advisory Contracts and under separate agreements covering transfer agency, pricing and bookkeeping, and securities lending services for the fund; (ii) the nature and extent of the supervision of third party service providers, principally custodians and subcustodians; and (iii) the resources devoted to, and the record of compliance with, the fund's compliance policies and procedures. The Board also reviewed the allocation of fund brokerage, including allocations to brokers affiliated with the Investment Advisers, the use of brokerage commissions to pay fund expenses, and the use of "soft" commission dollars to pay for research services.
Annual Report
The Board noted that the growth of fund assets over time across the complex allows Fidelity to reinvest in the development of services designed to enhance the value or convenience of the Fidelity funds as investment vehicles. These services include 24-hour access to account information and market information through telephone representatives and over the Internet, investor education materials and asset allocation tools, and the expanded availability of Fidelity Investor Centers.
Investment in a Large Fund Family. The Board considered the benefits to shareholders of investing in a Fidelity fund, including the benefits of investing in a fund that is part of a large family of funds offering a variety of investment disciplines and providing a large variety of mutual fund investor services. The Board noted that Fidelity had taken, or had made recommendations that resulted in the Fidelity funds taking, a number of actions over the previous year that benefited particular funds, including (i) continuing to dedicate additional resources to investment research and support of the senior management team that oversees asset management; (ii) persisting in efforts to enhance Fidelity's research capabilities, in particular, international research; (iii) launching new funds and making other enhancements to meet client needs for global and income-oriented solutions; (iv) continuing to launch dedicated lower cost underlying funds to meet investment management's portfolio construction needs related to expanding underlying fund options, specifically for the Freedom Fund product lines; (v) adopting a "Stock Selector" sector neutral investment approach and employing a team of portfolio managers who are sector specialists to manage certain funds; (vi) rationalizing product lines and gaining increased efficiencies through the mergers of several funds into other funds; (vii) strengthening the Spartan Index Fund product line by adding new funds and/or new low-cost institutional share classes, restructuring fund expenses to accommodate new classes, and reducing investment minimums for certain classes of shares; (viii) modifying the eligibility criteria for Institutional Class shares to increase their appeal to government entities and charitable investors; and (ix) reducing certain transfer agent fee rates.
Investment Performance. The Board considered whether the fund has operated in accordance with its investment objective, as well as its record of compliance with its investment restrictions. It also reviewed the fund's absolute investment performance for each class, as well as the fund's relative investment performance for each class measured over multiple periods against (i) a proprietary custom index, and (ii) a peer group of mutual funds deemed appropriate by Fidelity and reviewed by the Board. The following charts considered by the Board show, over the one-, three-, and five-year periods ended December 31, 2011, as available, the cumulative total returns of the retail class and Class C of the fund, the cumulative total returns of a proprietary custom index ("benchmark"), and a range of cumulative total returns of a peer group of mutual funds identified by Lipper Inc. as having an investment objective similar to that of the fund. The returns of the retail class and Class C show the performance of the highest performing class (based on five-year performance) and the lowest performing class (based on one-year performance), respectively. The box within each chart shows the 25th percentile return (top of box) and the 75th percentile return (bottom of box) of the peer group. Returns shown above the box are in the first quartile and returns shown below the box are in the fourth quartile. The percentage beaten numbers noted below each chart correspond to the percentile box and represent the percentage of funds in the peer group whose performance was equal to or lower than that of the class indicated. The fund's proprietary custom index is an index developed by FMR that represents the performance of the fund's unmanaged indexes.
Annual Report
Board Approval of Investment Advisory Contracts and
Management Fees - continued
Fidelity Real Estate Income Fund

The Board reviewed the fund's relative investment performance against its peer group and noted that the performance of the retail class of the fund (the class with the longest performance record) was in the fourth quartile for the one-year period and the first quartile for three- and five-year periods. The Board also noted that the investment performance of the fund was lower than its benchmark for all the periods shown. The Board considered that the variations in performance among the fund's classes reflect the variations in class expenses, which result in lower performance for higher expense classes. The Board discussed with FMR the fact that the fund underperformed its benchmark for each period measured. The Board also reviewed the fund's performance since inception as well as performance in the current year. The Board will continue to closely monitor performance of the fund in the coming year and discuss with FMR if other actions to address performance are appropriate.
Annual Report
Based on its review, the Board concluded that the nature, extent, and quality of services provided to the fund under the Advisory Contracts should benefit the fund's shareholders.
Competitiveness of Management Fee and Total Expense Ratio. The Board considered the fund's management fee and total expense ratio compared to "mapped groups" of competitive funds and classes. Fidelity creates "mapped groups" by combining similar Lipper investment objective categories that have comparable management fee characteristics. Combining Lipper investment objective categories aids the Board's management fee and total expense ratio comparisons by broadening the competitive group used for comparison and by reducing the number of universes to which various Fidelity funds are compared.
Management Fee. The Board considered two proprietary management fee comparisons for the 12-month periods shown in the chart below. The group of Lipper funds used by the Board for management fee comparisons is referred to below as the "Total Mapped Group." The Total Mapped Group is broader than the Lipper peer group used by the Board for performance comparisons because the Total Mapped Group combines several Lipper investment objective categories while the Lipper peer group does not. The Total Mapped Group comparison focuses on a fund's standing relative to the total universe of comparable funds available to investors in terms of gross management fees before expense reimbursements or caps. "TMG %" represents the percentage of funds in the Total Mapped Group that had management fees that were lower than the fund's. For example, a TMG % of 6% means that 94% of the funds in the Total Mapped Group had higher management fees than the fund. The "Asset-Size Peer Group" (ASPG) comparison focuses on a fund's standing relative to non-Fidelity funds similar in size to the fund within the Total Mapped Group. The ASPG represents at least 15% of the funds in the Total Mapped Group with comparable asset size and management fee characteristics, subject to a minimum of 50 funds (or all funds in the Total Mapped Group if fewer than 50). Additional information, such as the ASPG quartile in which the fund's management fee ranked, is also included in the chart and considered by the Board.
Annual Report
Board Approval of Investment Advisory Contracts and
Management Fees - continued
Fidelity Real Estate Income Fund

The Board noted that the fund's management fee ranked below the median of its Total Mapped Group and below the median of its ASPG for 2011.
Based on its review, the Board concluded that the fund's management fee is fair and reasonable in light of the services that the fund receives and the other factors considered.
Total Expense Ratio. In its review of each class's total expense ratio, the Board considered the fund's management fee as well as other fund or class expenses, as applicable, such as transfer agent fees, pricing and bookkeeping fees, fund-paid 12b-1 fees, and custodial, legal, and audit fees. The Board also noted the effects of any waivers and reimbursements on fees and expenses. As part of its review, the Board also considered the current and historical total expense ratios of each class of the fund compared to competitive fund median expenses. Each class of the fund is compared to those funds and classes in the Total Mapped Group (used by the Board for management fee comparisons) that have a similar sales load structure.
The Board noted that the total expense ratio of each class ranked below its competitive median for 2011.
Fees Charged to Other Fidelity Clients. The Board also considered Fidelity fee structures and other information with respect to clients of FMR and its affiliates, such as other mutual funds advised or subadvised by FMR or its affiliates, pension plan clients, and other institutional clients. The Board noted the findings of the 2010 ad hoc joint committee (created with the board of other Fidelity funds), which reviewed and compared Fidelity's institutional investment advisory business with its business of providing services to the Fidelity funds, including the differences in services provided, fees charged, and costs incurred, as well as competition in their respective marketplaces.
Annual Report
Based on its review of total expense ratios and fees charged to other Fidelity clients, the Board concluded that the total expense ratio of each class of the fund was reasonable in light of the services that the fund and its shareholders receive and the other factors considered.
Costs of the Services and Profitability. The Board considered the revenues earned and the expenses incurred by Fidelity in conducting the business of developing, marketing, distributing, managing, administering and servicing the fund and its shareholders. The Board also considered the level of Fidelity's profits in respect of all the Fidelity funds.
On an annual basis, FMR presents to the Board Fidelity's profitability for the fund. Fidelity calculates the profitability for each fund, as well as aggregate profitability for groups of Fidelity funds and all Fidelity funds, using a series of detailed revenue and cost allocation methodologies which originate with the books and records of Fidelity on which Fidelity's audited financial statements are based. The Audit Committee of the Board reviews any significant changes from the prior year's methodologies.
PricewaterhouseCoopers LLP (PwC), independent registered public accounting firm and auditor to Fidelity and certain Fidelity funds, has been engaged annually by the Board as part of the Board's assessment of Fidelity's profitability analysis. PwC's engagement includes the review and assessment of Fidelity's methodologies used in determining the revenues and expenses attributable to Fidelity's mutual fund business, and completion of agreed-upon procedures surrounding the mathematical accuracy of fund profitability and its conformity to allocation methodologies. After considering PwC's reports issued under the engagement and information provided by Fidelity, the Board concluded that while other allocation methods may also be reasonable, Fidelity's profitability methodologies are reasonable in all material respects.
The Board also reviewed Fidelity's non-fund businesses and fall-out benefits related to the mutual fund business as well as cases where Fidelity's affiliates may benefit from or be related to the fund's business.
The Board considered the costs of the services provided by and the profits realized by Fidelity in connection with the operation of the fund and was satisfied that the profitability was not excessive in the circumstances.
Economies of Scale. The Board considered whether there have been economies of scale in respect of the management of the Fidelity funds, whether the Fidelity funds (including the fund) have appropriately benefited from any such economies of scale, and whether there is potential for realization of any further economies of scale. The Board considered the extent to which the fund will benefit from economies of scale through increased services to the fund, through waivers or reimbursements, or through fee or expense reductions. The Board also noted that in 2009, it and the board of other Fidelity funds created an ad hoc committee (the Economies of Scale Committee) to analyze whether FMR attains economies of scale in respect of the management and servicing of the Fidelity funds, whether the Fidelity funds have appropriately benefited from such economies of scale, and whether there is potential for realization of any further economies of scale.
Annual Report
Board Approval of Investment Advisory Contracts and
Management Fees - continued
The Board recognized that the fund's management contract incorporates a "group fee" structure, which provides for lower group fee rates as total fund assets under FMR's management increase, and for higher group fee rates as total fund assets under FMR's management decrease. FMR calculates the group fee rates based on a tiered asset "breakpoint" schedule that varies based on asset class. The Board considered that the group fee is designed to deliver the benefits of economies of scale to fund shareholders when total Fidelity fund assets increase, even if assets of any particular fund are unchanged or have declined, because some portion of Fidelity's costs are attributable to services provided to all Fidelity funds, and all funds benefit if those costs can be allocated among more assets. The Board concluded that, given the group fee structure, fund shareholders will benefit from lower management fees as assets under FMR's management increase at the fund complex level, regardless of whether Fidelity achieves any such economies of scale.
The Board concluded, taking into account the analysis of the Economies of Scale Committee, that economies of scale, if any, are being appropriately shared between fund shareholders and Fidelity.
Additional Information Requested by the Board. In order to develop fully the factual basis for consideration of the Fidelity funds' Advisory Contracts, the Board requested and received additional information on certain topics, including (i) fund performance trends, actions to be taken by FMR to improve certain funds' overall performance, and Fidelity's long-term strategies for certain funds; (ii) the potential to further rationalize the Fidelity fund lineup with the possibility of achieving savings for the funds and Fidelity; (iii) Fidelity's compensation structure for portfolio managers and other key investment personnel; (iv) the amount of the investment that each portfolio manager has made in the Fidelity fund(s) that he or she manages; (v) the realization of fall-out benefits in certain Fidelity business units; (vi) Fidelity's group fee structures, the potential impact of regulatory changes on such structures, and the rationale for the individual fee rates of certain funds; (vii) fund profitability methodology, including Fidelity's cost allocation methodology, and the impact of certain factors on fund profitability results; (viii) trends regarding industry use of performance fee structures and the possibility of implementing performance fee structures for additional funds; and (ix) the impact of net redemptions from the Fidelity funds.
Annual Report
Based on its evaluation of all of the conclusions noted above, and after considering all factors it believed relevant, the Board ultimately concluded that the advisory fee structures are fair and reasonable, and that the fund's Advisory Contracts should be renewed.
Annual Report
Investment Adviser
Fidelity Management & Research Company
Boston, MA
Investment Sub-Advisers
FMR Co., Inc.
Fidelity Management & Research
(Hong Kong) Limited
Fidelity Management & Research
(Japan) Inc.
Fidelity Management & Research
(U.K.) Inc.
General Distributor
Fidelity Distributors Corporation
Smithfield, RI
Transfer and Service Agents
Fidelity Investments Institutional
Operations Company, Inc.
Boston, MA
Fidelity Service Company, Inc.
Boston, MA
Custodian
Citibank, N.A.
New York, NY
(Fidelity Investment logo)(registered trademark)
REII-UANN-0912
1.907540.102
(Fidelity Investment logo)(registered trademark)
Fidelity Advisor®
Real Estate Income
Fund - Class A, Class T, and Class C
Annual Report
July 31, 2012
(Fidelity Cover Art)
Class A , Class T, and
Class C are classes of Fidelity® Real Estate Income Fund
Contents
Performance | (Click Here) | How the fund has done over time. |
Management's Discussion of Fund Performance | (Click Here) | The Portfolio Manager's review of fund performance and strategy. |
Shareholder Expense Example | (Click Here) | An example of shareholder expenses. |
Investment Changes | (Click Here) | A summary of the fund's holdings. |
Investments | (Click Here) | A complete list of the fund's investments with their market values. |
Financial Statements | (Click Here) | Statements of assets and liabilities, operations, and changes in net assets, as well as financial highlights. |
Notes | (Click Here) | Notes to the financial statements. |
Report of Independent Registered Public Accounting Firm | (Click Here) | |
Trustees and Officers | (Click Here) | |
Distributions | (Click Here) | |
Board Approval of Investment Advisory Contracts and Management Fees | (Click Here) | |
To view a fund's proxy voting guidelines and proxy voting record for the 12-month period ended June 30, visit http://www.fidelity.com/proxyvotingresults or visit the Securities and Exchange Commission's (SEC) web site at http://www.sec.gov. You may also call 1-877-208-0098 to request a free copy of the proxy voting guidelines.
Standard & Poor's, S&P and S&P 500 are registered service marks of The McGraw-Hill Companies, Inc. and have been licensed for use by Fidelity Distributors Corporation.
Other third party marks appearing herein are the property of their respective owners.
All other marks appearing herein are registered or unregistered trademarks or service marks of FMR LLC or an affiliated company. © 2012 FMR LLC. All rights reserved.
This report and the financial statements contained herein are submitted for the general information of the shareholders of the fund. This report is not authorized for distribution to prospective investors in the fund unless preceded or accompanied by an effective prospectus.
A fund files its complete schedule of portfolio holdings with the SEC for the first and third quarters of each fiscal year on Form N-Q. Forms N-Q are available on the SEC's web site at http://www.sec.gov. A fund's Forms N-Q may be reviewed and copied at the SEC's Public Reference Room in Washington, DC. Information regarding the operation of the SEC's Public Reference Room may be obtained by calling 1-800-SEC-0330. For a complete list of a fund's portfolio holdings, view the most recent holdings listing, semiannual report, or annual report on Fidelity's web site at http://www.fidelity.com, http://www.advisor.fidelity.com, or http://www.401k.com, as applicable.
NOT FDIC INSURED • MAY LOSE VALUE • NO BANK GUARANTEE
Neither the fund nor Fidelity Distributors Corporation is a bank.
Annual Report
Average annual total return reflects the change in the value of an investment, assuming reinvestment of the class' distributions from dividend income and capital gains (the profits earned upon the sale of securities that have grown in value, if any) and assuming a constant rate of performance each year. The $10,000 table and the fund's returns do not reflect the deduction of taxes that a shareholder would pay on fund distributions or the redemption of fund shares. During periods of reimbursement by Fidelity, a fund's total return will be greater than it would be had the reimbursement not occurred. How a fund did yesterday is no guarantee of how it will do tomorrow.
Average Annual Total Returns
Periods ended July 31, 2012 | Past 1
year | Past 5
years | Life of
fundA |
Class A (incl. 4.00% sales charge) B | 6.79% | 5.73% | 7.29% |
Class T (incl. 4.00% sales charge) C | 6.88% | 5.72% | 7.28% |
Class C (incl. contingent deferred sales charge)D | 9.49% | 6.23% | 7.55% |
A From February 4, 2003.
B The initial offering of Class A shares took place on April 14, 2010. Returns prior to April 14, 2010 are those of Fidelity® Real Estate Income Fund, the original class of the fund, which has no 12b-1 fee. Had Class A's 12b-1 fee been reflected, returns prior to April 14, 2010 would have been lower.
C The initial offering of Class T shares took place on April 14, 2010. Returns prior to April 14, 2010 are those of Fidelity Real Estate Income Fund, the original class of the fund, which has no 12b-1 fee. Had Class T's 12b-1 fee been reflected, returns prior to April 14, 2010 would have been lower.
D The initial offering of Class C shares took place on April 14, 2010. Returns prior to April 14, 2010 are those of Fidelity Real Estate Income Fund, the original class of the fund, which has no 12b-1 fee. Had Class C's 12b-1 fee been reflected, returns prior to April 14, 2010 would have been lower. Class C shares' contingent deferred sales charges included in the past one year, past five years, and life of fund total return figures are 1%, 0%, and 0%, respectively.
Annual Report
$10,000 Over Life of Fund
Let's say hypothetically that $10,000 was invested in Fidelity Advisor® Real Estate Income Fund - Class A on February 4, 2003, when the fund started, and the current 4.00% sales charge was paid. The chart shows how the value of your investment would have changed, and also shows how the S&P 500® Index performed over the same period. The initial offering of Class A took place on April 14, 2010. See the previous page for additional information regarding the performance of Class A.
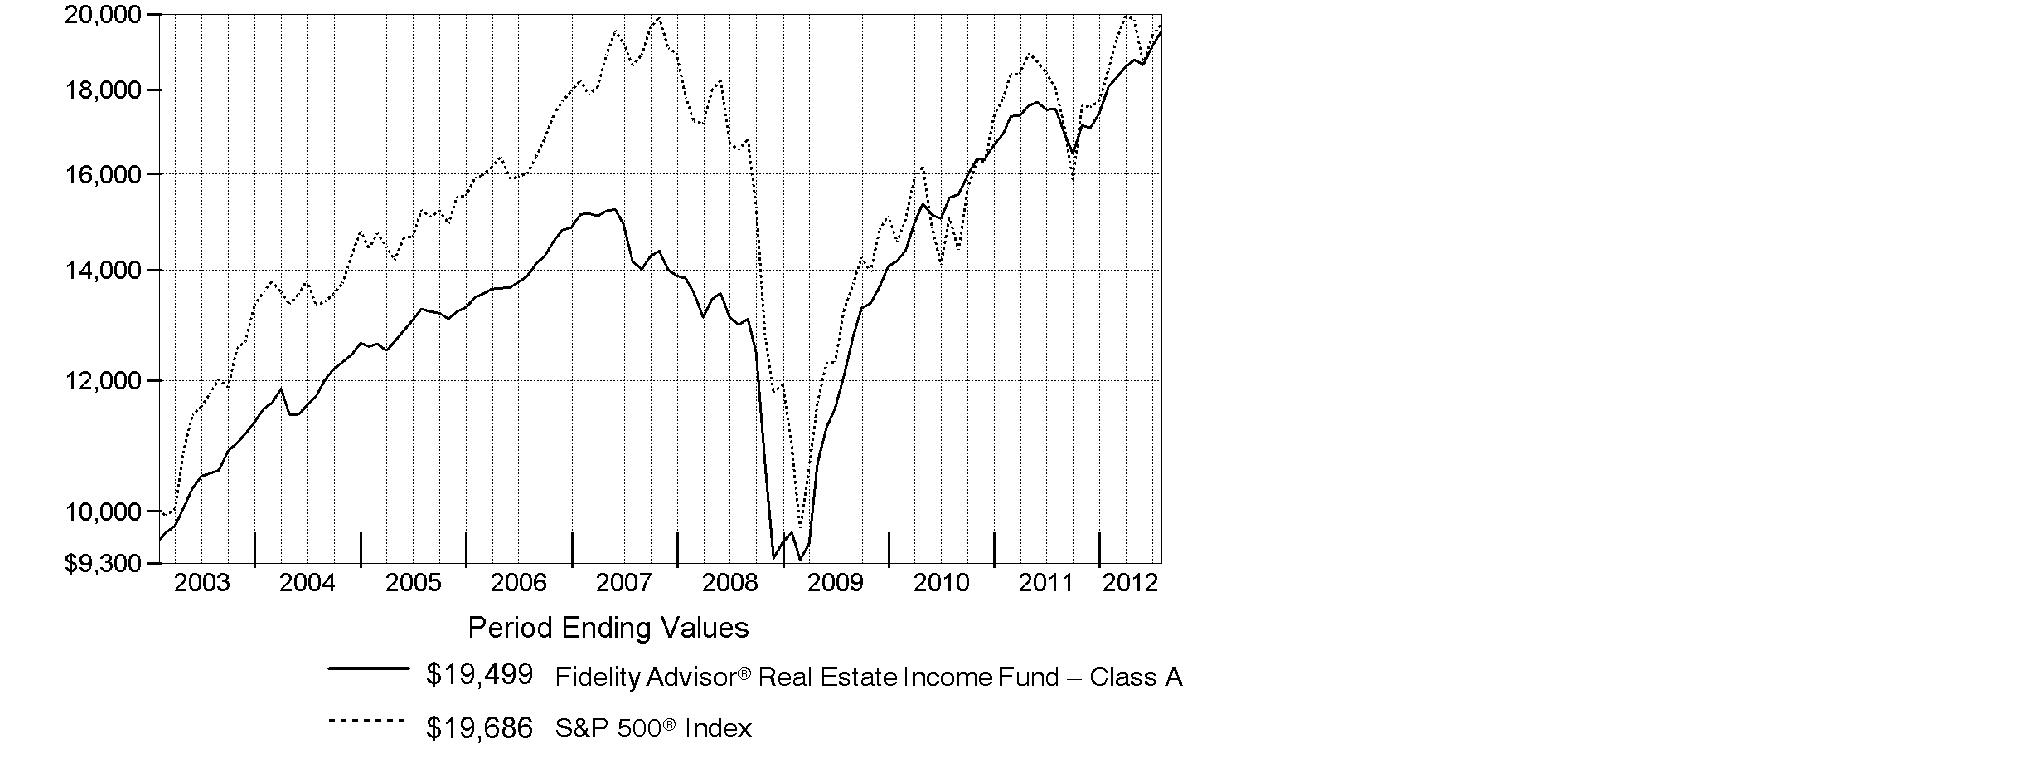
Annual Report
Market Recap: Market conditions shifted between intervals of "risk on" and "risk off" during the 12-month period ending July 31, 2012. During the risk-off times - including several extended stretches in the second half of 2011 as well as May 2012 - macro concerns about the eurozone debt crisis and slowing U.S. economic growth took center stage. For most of the first seven months of 2012, however, risk-on returned to the market, causing credit spreads across most asset classes to rally. For real estate, the story was a combination of lower interest rates and good property supply-and-demand fundamentals. Lower interest rates made income-generating real estate securities look more attractive, while good business fundamentals created rising earnings for property owners. In all, common stocks of real estate investment trusts (REITs), as measured by the FTSE® NAREIT® All REITs Index, gained 14.79%, while real estate bonds, reflected in The BofA Merrill LynchSM US Real Estate Index - a market-capitalization-weighted measure of the performance of investment-grade public debt of corporate issuers in the domestic real estate sector - rose 8.39%. The MSCI® REIT Preferred Index, which reflects the performance of real estate preferred stocks, returned 11.28%, while the broad U.S. equity market, as measured by the S&P 500® Index, returned 9.13%.
Comments from Mark Snyderman, Portfolio Manager of Fidelity Advisor® Real Estate Income Fund: For the year, the fund's Class A, Class T and Class C shares returned 11.24%, 11.33% and 10.49%, respectively (excluding sales charges). In comparison, the Fidelity Real Estate Income Composite IndexSM - a 40/40/20 blend of the MSCI® REIT Preferred Index, The BofA Merrill LynchSM US Real Estate Index and the FTSE® NAREIT® All REITs Index, respectively - rose 11.14%. In a favorable environment for real estate securities, all of the fund's asset classes enjoyed positive performance, led by REIT common stocks. Meanwhile, the fund's preferred real estate stocks modestly outpaced the average preferred stock in the MSCI index. Looking at the fund's fixed-income holdings, investments in high-yield real estate bonds and commercial mortgage-backed securities (CMBS) beat the BofA Merrill Lynch index by nearly three percentage points. One area of slight underperformance came from the portfolio's investment-grade real estate bond holdings, which, because of my decision to limit interest rate risk, returned somewhat less than the BofA Merrill Lynch index. In addition, holding a roughly 8% cash position limited the fund's upside in a generally rising market.
The views expressed above reflect those of the portfolio manager(s) only through the end of the period as stated on the cover of this report and do not necessarily represent the views of Fidelity or any other person in the Fidelity organization. Any such views are subject to change at any time based upon market or other conditions and Fidelity disclaims any responsibility to update such views. These views may not be relied on as investment advice and, because investment decisions for a Fidelity fund are based on numerous factors, may not be relied on as an indication of trading intent on behalf of any Fidelity fund.
Annual Report
Shareholder Expense Example
As a shareholder of the Fund, you incur two types of costs: (1) transaction costs, including sales charges (loads) on purchase payments or redemption proceeds, redemption fees and (2) ongoing costs, including management fees, distribution and/or service (12b-1) fees and other Fund expenses. This Example is intended to help you understand your ongoing costs (in dollars) of investing in the Fund and to compare these costs with the ongoing costs of investing in other mutual funds.
The Example is based on an investment of $1,000 invested at the beginning of the period and held for the entire period (February 1, 2012 to July 31, 2012).
Actual Expenses
The first line of the accompanying table for each class of the Fund provides information about actual account values and actual expenses. You may use the information in this line, together with the amount you invested, to estimate the expenses that you paid over the period. Simply divide your account value by $1,000.00 (for example, an $8,600 account value divided by $1,000.00 = 8.6), then multiply the result by the number in the first line for a class of the Fund under the heading entitled "Expenses Paid During Period" to estimate the expenses you paid on your account during this period. A small balance maintenance fee of $12.00 that is charged once a year may apply for certain accounts with a value of less than $2,000. This fee is not included in the table below. If it was, the estimate of expenses you paid during the period would be higher, and your ending account value lower, by this amount. In addition, the Fund, as a shareholder in the underlying Fidelity Central Funds, will indirectly bear its pro-rata share of the fees and expenses incurred by the underlying Fidelity Central Funds. These fees and expenses are not included in the Fund's annualized expense ratio used to calculate the expense estimate in the table below.
Hypothetical Example for Comparison Purposes
The second line of the accompanying table for each class of the Fund provides information about hypothetical account values and hypothetical expenses based on a Class' actual expense ratio and an assumed rate of return of 5% per year before expenses, which is not the Class' actual return. The hypothetical account values and expenses may not be used to estimate the actual ending account balance or expenses you paid for the period. You may use this information to compare the ongoing costs of investing in the Fund and other funds. To do so, compare this 5% hypothetical example with the 5% hypothetical examples that appear in the shareholder reports of the other funds. A small balance maintenance fee of $12.00 that is charged once a year may apply for certain accounts with a value of less than $2,000. This fee is not included in the table below. If it was, the estimate of expenses you paid during the period would be higher, and your ending account value lower, by this amount. In addition, the Fund, as a shareholder in the underlying Fidelity Central Funds, will indirectly bear its pro-rata share of the fees and expenses incurred by the underlying Fidelity Central Funds. These fees and expenses are not included in the Fund's annualized expense ratio used to calculate the expense estimate in the table below.
Please note that the expenses shown in the table are meant to highlight your ongoing costs only and do not reflect any transaction costs. Therefore, the second line of the table is useful in comparing ongoing costs only, and will not help you determine the relative total costs of owning different funds. In addition, if these transactional costs were included, your costs would have been higher.
Annual Report
| Annualized Expense Ratio | Beginning
Account Value
February 1, 2012 | Ending
Account Value
July 31, 2012 | Expenses Paid
During Period*
February 1, 2012
to July 31, 2012 |
Class A | 1.11% | | | |
Actual | | $ 1,000.00 | $ 1,079.20 | $ 5.74 |
HypotheticalA | | $ 1,000.00 | $ 1,019.34 | $ 5.57 |
Class T | 1.09% | | | |
Actual | | $ 1,000.00 | $ 1,078.30 | $ 5.63 |
HypotheticalA | | $ 1,000.00 | $ 1,019.44 | $ 5.47 |
Class C | 1.85% | | | |
Actual | | $ 1,000.00 | $ 1,074.60 | $ 9.54 |
HypotheticalA | | $ 1,000.00 | $ 1,015.66 | $ 9.27 |
Real Estate Income | .88% | | | |
Actual | | $ 1,000.00 | $ 1,079.80 | $ 4.55 |
HypotheticalA | | $ 1,000.00 | $ 1,020.49 | $ 4.42 |
Institutional Class | .82% | | | |
Actual | | $ 1,000.00 | $ 1,080.30 | $ 4.24 |
HypotheticalA | | $ 1,000.00 | $ 1,020.79 | $ 4.12 |
A 5% return per year before expenses
* Expenses are equal to each Class' annualized expense ratio, multiplied by the average account value over the period, multiplied by 182/366 (to reflect the one-half year period).
Annual Report
Investment Changes (Unaudited)
Top Five Stocks as of July 31, 2012 |
| % of fund's
net assets | % of fund's net assets
6 months ago |
Ventas, Inc. | 1.9 | 2.0 |
Equity Lifestyle Properties, Inc. | 1.8 | 1.5 |
MFA Financial, Inc. | 1.7 | 1.6 |
Acadia Realty Trust (SBI) | 1.5 | 1.6 |
Equity Lifestyle Properties, Inc. 8.034% | 1.0 | 1.1 |
| 7.9 | |
Top 5 Bonds as of July 31, 2012 |
| % of fund's
net assets | % of fund's net assets
6 months ago |
Banc of America Large Loan Trust floater Series 2010-HLTN Class HLTN, 1.992% 11/15/15 | 4.2 | 2.6 |
Annaly Capital Management, Inc. 5% 5/15/15 | 1.3 | 0.0 |
Forest City Enterprises, Inc. 7.625% 6/1/15 | 1.3 | 0.8 |
Standard Pacific Corp. 8.375% 5/15/18 | 1.2 | 1.4 |
iStar Financial, Inc. 5.875% 3/15/16 | 1.2 | 0.3 |
| 9.2 | |
Top Five REIT Sectors as of July 31, 2012 |
| % of fund's
net assets | % of fund's net assets
6 months ago |
REITs - Mortgage | 11.9 | 6.4 |
REITs - Management/Investment | 6.8 | 7.3 |
REITs - Shopping Centers | 6.5 | 6.9 |
REITs - Health Care Facilities | 6.0 | 6.6 |
REITs - Office Buildings | 3.5 | 3.8 |
Asset Allocation (% of fund's net assets) |
As of July 31, 2012 * | As of January 31, 2012 ** |
 | Common Stocks 23.1% | | | Common Stocks 24.2% | |
 | Preferred Stocks 13.3% | | | Preferred Stocks 11.2% | |
 | Bonds 48.6% | |  | Bonds 48.6% | |
 | Convertible Securities 4.0% | | | Convertible Securities 3.4% | |
 | Other Investments 4.9% | | | Other Investments 4.2% | |
 | Short-Term Investments and Net Other Assets (Liabilities) 6.1% | | | Short-Term Investments and Net Other Assets (Liabilities) 8.4% | |
* Foreign investments | 4.9% | | ** Foreign investments | 6.0% | |

Annual Report
Investments July 31, 2012
Showing Percentage of Net Assets
Common Stocks - 23.1% |
| Shares | | Value |
CONSUMER DISCRETIONARY - 1.2% |
Household Durables - 1.2% |
NVR, Inc. (a) | 6,700 | | $ 5,185,666 |
Standard Pacific Corp. (a)(f) | 3,120,100 | | 17,690,967 |
Stanley Martin Communities LLC Class B (a) | 4,620 | | 4,116,420 |
Toll Brothers, Inc. (a) | 183,100 | | 5,341,027 |
| | 32,334,080 |
FINANCIALS - 20.6% |
Capital Markets - 0.1% |
HFF, Inc. (a) | 243,214 | | 3,176,375 |
Real Estate Investment Trusts - 20.1% |
Acadia Realty Trust (SBI) | 1,709,649 | | 40,928,997 |
American Campus Communities, Inc. | 76,000 | | 3,622,160 |
American Residential Properties, Inc. (h) | 453,000 | | 9,060,000 |
American Tower Corp. | 190,500 | | 13,775,055 |
AmREIT, Inc. (g) | 200,000 | | 2,818,000 |
Annaly Capital Management, Inc. | 329,150 | | 5,737,085 |
Anworth Mortgage Asset Corp. | 1,065,710 | | 7,076,314 |
Apartment Investment & Management Co. Class A | 414,700 | | 11,375,221 |
Associated Estates Realty Corp. | 309,400 | | 4,619,342 |
Canadian (REIT) | 107,800 | | 4,529,782 |
CapLease, Inc. | 2,465,600 | | 11,218,480 |
CBL & Associates Properties, Inc. | 1,065,273 | | 21,017,836 |
Chartwell Seniors Housing (REIT) | 509,700 | | 5,102,845 |
Chartwell Seniors Housing (REIT) (h) | 78,500 | | 785,900 |
Chesapeake Lodging Trust | 223,500 | | 3,792,795 |
Chimera Investment Corp. | 813,000 | | 1,756,080 |
CommonWealth REIT | 333,000 | | 6,073,920 |
Cousins Properties, Inc. | 190,400 | | 1,445,136 |
Cys Investments, Inc. (f) | 915,339 | | 13,235,802 |
DCT Industrial Trust, Inc. | 1,008,900 | | 6,315,714 |
DiamondRock Hospitality Co. | 531,400 | | 5,027,044 |
Douglas Emmett, Inc. | 260,200 | | 6,117,302 |
Dynex Capital, Inc. | 1,546,243 | | 16,065,465 |
EastGroup Properties, Inc. | 67,900 | | 3,631,292 |
Education Realty Trust, Inc. | 281,800 | | 3,302,696 |
Equity Lifestyle Properties, Inc. | 672,130 | | 48,339,590 |
Excel Trust, Inc. | 717,228 | | 8,778,871 |
First Potomac Realty Trust | 430,815 | | 4,993,146 |
Glimcher Realty Trust | 600,500 | | 6,017,010 |
H&R REIT/H&R Finance Trust | 256,500 | | 6,394,276 |
Hatteras Financial Corp. | 214,100 | | 6,262,425 |
Common Stocks - continued |
| Shares | | Value |
FINANCIALS - continued |
Real Estate Investment Trusts - continued |
Highwoods Properties, Inc. (SBI) | 101,400 | | $ 3,434,418 |
Lexington Corporate Properties Trust | 2,623,482 | | 23,453,929 |
LTC Properties, Inc. | 357,113 | | 12,748,934 |
MFA Financial, Inc. | 5,645,781 | | 45,617,910 |
Mid-America Apartment Communities, Inc. | 58,900 | | 4,077,647 |
Monmouth Real Estate Investment Corp. Class A | 249,773 | | 2,782,471 |
National Health Investors, Inc. | 70,306 | | 3,774,729 |
National Retail Properties, Inc. | 114,100 | | 3,365,950 |
Newcastle Investment Corp. | 2,920,700 | | 21,759,215 |
Prologis, Inc. | 654,887 | | 21,172,497 |
Retail Properties America, Inc. | 216,700 | | 2,160,499 |
Select Income (REIT) | 155,600 | | 3,914,896 |
Senior Housing Properties Trust (SBI) | 505,300 | | 11,495,575 |
Stag Industrial, Inc. | 572,831 | | 8,283,136 |
Summit Hotel Properties, Inc. | 511,088 | | 4,242,030 |
Sunstone Hotel Investors, Inc. (a) | 211,700 | | 2,119,117 |
Terreno Realty Corp. | 190,264 | | 2,836,836 |
Two Harbors Investment Corp. | 470,480 | | 5,396,406 |
Ventas, Inc. | 765,946 | | 51,509,869 |
Washington (REIT) (SBI) | 44,700 | | 1,193,490 |
Western Asset Mortgage Capital Corp. | 163,100 | | 3,330,502 |
Weyerhaeuser Co. | 272,429 | | 6,361,217 |
Whitestone REIT Class B | 379,067 | | 5,174,265 |
| | 539,421,119 |
Real Estate Management & Development - 0.4% |
Brookfield Asset Management, Inc. Class A | 171,900 | | 5,831,418 |
Kennedy-Wilson Holdings, Inc. | 291,209 | | 3,983,739 |
| | 9,815,157 |
TOTAL FINANCIALS | | 552,412,651 |
HEALTH CARE - 1.1% |
Health Care Providers & Services - 1.1% |
Brookdale Senior Living, Inc. (a) | 828,300 | | 13,633,818 |
Capital Senior Living Corp. (a) | 852,950 | | 9,587,158 |
Emeritus Corp. (a) | 356,493 | | 6,042,556 |
| | 29,263,532 |
Common Stocks - continued |
| Shares | | Value |
TELECOMMUNICATION SERVICES - 0.2% |
Wireless Telecommunication Services - 0.2% |
SBA Communications Corp. Class A (a) | 101,900 | | $ 6,018,214 |
TOTAL COMMON STOCKS (Cost $502,122,859) |
620,028,477
|
Preferred Stocks - 14.7% |
| | | |
Convertible Preferred Stocks - 1.4% |
FINANCIALS - 1.4% |
Real Estate Investment Trusts - 1.4% |
Alexandria Real Estate Equities, Inc. Series D 7.00% | 95,000 | | 2,517,500 |
CommonWealth REIT 6.50% | 396,216 | | 9,449,752 |
Excel Trust, Inc. 7.00% (h) | 248,200 | | 5,924,038 |
Health Care REIT, Inc. Series I, 6.50% | 46,800 | | 2,652,975 |
Lexington Corporate Properties Trust Series C, 6.50% | 350,566 | | 16,578,266 |
Ramco-Gershenson Properties Trust (SBI) Series D, 7.25% | 40,000 | | 2,052,000 |
| | 39,174,531 |
Nonconvertible Preferred Stocks - 13.3% |
CONSUMER DISCRETIONARY - 0.0% |
Household Durables - 0.0% |
M/I Homes, Inc. Series A, 9.75% (a) | 36,700 | | 633,075 |
FINANCIALS - 13.3% |
Diversified Financial Services - 0.2% |
DRA CRT Acquisition Corp. Series A, 8.50% | 25,000 | | 425,000 |
Red Lion Hotels Capital Trust 9.50% | 163,225 | | 4,245,482 |
| | 4,670,482 |
Real Estate Investment Trusts - 12.4% |
American Capital Agency Corp. 8.00% | 200,000 | | 5,270,000 |
American Home Mortgage Investment Corp.: | | | |
Series A, 9.375% (a) | 120,300 | | 1,203 |
Series B, 9.25% (a) | 124,100 | | 124 |
Annaly Capital Management, Inc.: | | | |
Series A, 7.875% | 134,900 | | 3,616,669 |
Series C, 7.625% | 77,837 | | 2,000,411 |
Anworth Mortgage Asset Corp. Series A, 8.625% | 309,630 | | 8,112,306 |
Apollo Commercial Real Estate Finance, Inc. Series A, 8.625% (a) | 120,977 | | 3,039,547 |
Ashford Hospitality Trust, Inc. Series E, 9.00% | 85,751 | | 2,288,694 |
Preferred Stocks - continued |
| Shares | | Value |
Nonconvertible Preferred Stocks - continued |
FINANCIALS - continued |
Real Estate Investment Trusts - continued |
Brandywine Realty Trust Series D, 7.375% | 34,596 | | $ 888,079 |
Campus Crest Communities, Inc. Series A, 8.00% | 248,431 | | 6,608,265 |
CapLease, Inc.: | | | |
Series A, 8.125% | 132,510 | | 3,336,602 |
Series B, 8.375% | 320,000 | | 8,323,200 |
CBL & Associates Properties, Inc.: | | | |
(depositary shares) Series C, 7.75% | 147,962 | | 3,762,674 |
7.375% | 274,876 | | 7,006,589 |
Cedar Shopping Centers, Inc. 8.875% | 274,022 | | 7,050,586 |
CenterPoint Properties Trust Series D, 5.377% | 3,575 | | 2,162,875 |
Chesapeake Lodging Trust Series A, 7.75% (a) | 229,017 | | 5,796,420 |
Colony Financial, Inc. Series A, 8.50% | 282,171 | | 7,195,361 |
CommonWealth REIT 7.50% | 93,300 | | 2,035,806 |
Corporate Office Properties Trust: | | | |
Series H, 7.50% | 5,000 | | 126,800 |
Series L, 7.375% (a) | 80,000 | | 2,034,400 |
Cousins Properties, Inc. Series A, 7.75% | 205,970 | | 5,180,146 |
CubeSmart Series A, 7.75% | 40,000 | | 1,064,800 |
Cys Investments, Inc. Series A, 7.75% (a) | 117,824 | | 2,945,600 |
DDR Corp.: | | | |
Series I, 7.50% | 24,684 | | 621,049 |
Series J, 6.50% (a)(i) | 113,300 | | 2,809,840 |
Digital Realty Trust, Inc.: | | | |
Series E, 7.00% | 40,000 | | 1,067,600 |
Series F, 6.625% | 40,000 | | 1,050,000 |
Duke Realty LP: | | | |
8.375% | 128,517 | | 3,388,993 |
Series L, 6.60% | 10,666 | | 271,770 |
Dynex Capital, Inc. Series A, 8.50% (a) | 362,932 | | 9,000,714 |
Equity Lifestyle Properties, Inc. 8.034% | 1,075,325 | | 27,420,788 |
Essex Property Trust, Inc. Series H, 7.125% | 40,000 | | 1,072,800 |
Excel Trust, Inc. Series B, 8.125% | 400,000 | | 10,380,000 |
First Potomac Realty Trust 7.75% | 395,296 | | 10,250,025 |
Gladstone Commercial Corp. Series C, 7.125% | 232,238 | | 5,956,905 |
Glimcher Realty Trust: | | | |
Series F, 8.75% | 18,745 | | 475,917 |
Series G, 8.125% | 221,111 | | 5,576,419 |
Health Care REIT, Inc. Series J, 6.50% | 20,000 | | 538,800 |
Hersha Hospitality Trust Series B, 8.00% | 162,538 | | 4,214,610 |
Preferred Stocks - continued |
| Shares | | Value |
Nonconvertible Preferred Stocks - continued |
FINANCIALS - continued |
Real Estate Investment Trusts - continued |
HomeBanc Mortgage Corp. Series A (a) | 104,685 | | $ 1 |
Hospitality Properties Trust: | | | |
Series C, 7.00% | 58,500 | | 1,486,485 |
Series D, 7.125% | 40,800 | | 1,098,744 |
Hudson Pacific Properties, Inc. 8.375% | 303,800 | | 8,047,662 |
Inland Real Estate Corp. Series A, 8.125% | 423,500 | | 10,939,005 |
Invesco Mortgage Capital, Inc. Series A, | 113,342 | | 2,833,550 |
Investors Real Estate Trust Series B, 7.95% (a) | 126,572 | | 3,164,300 |
Kilroy Realty Corp. Series G, 6.875% | 40,000 | | 1,052,000 |
Kimco Realty Corp. Series G, 7.75% | 348,026 | | 8,850,301 |
Kite Realty Group Trust 8.25% | 96,100 | | 2,525,508 |
LaSalle Hotel Properties: | | | |
Series G, 7.25% | 114,485 | | 2,918,223 |
Series H, 7.50% | 126,308 | | 3,356,004 |
LBA Realty Fund II: | | | |
Series A, 8.75% (a) | 69,000 | | 2,622,000 |
Series B, 7.625% (a) | 31,240 | | 593,560 |
Lexington Realty Trust 7.55% | 23,800 | | 599,998 |
MFA Financial, Inc.: | | | |
8.00% | 529,991 | | 13,541,270 |
Series A, 8.50% | 485,381 | | 12,639,321 |
Monmouth Real Estate Investment Corp.: | | | |
7.625% | 80,000 | | 2,081,600 |
Series B, 7.875% | 95,000 | | 2,541,250 |
National Retail Properties, Inc. Series D, 6.625% | 62,437 | | 1,642,093 |
Newcastle Investment Corp. Series B, 9.75% | 34,530 | | 900,542 |
Parkway Properties, Inc. Series D, 8.00% | 306,382 | | 7,736,146 |
Pebblebrook Hotel Trust: | | | |
Series A, 7.875% | 372,000 | | 9,727,800 |
Series B, 8.00% | 185,085 | | 4,893,647 |
Prologis, Inc. Series Q, 8.54% | 94,446 | | 5,832,041 |
PS Business Parks, Inc.: | | | |
6.875% | 50,000 | | 1,349,500 |
Series P, 6.70% | 36,000 | | 912,240 |
Regency Centers Corp. Series 6, 6.625% | 62,261 | | 1,653,652 |
Saul Centers, Inc.: | | | |
8.00% | 93,700 | | 2,404,342 |
Series B (depositary shares) 9.00% | 118,550 | | 3,094,155 |
Stag Industrial, Inc. Series A, 9.00% | 280,000 | | 7,635,600 |
Preferred Stocks - continued |
| Shares | | Value |
Nonconvertible Preferred Stocks - continued |
FINANCIALS - continued |
Real Estate Investment Trusts - continued |
Summit Hotel Properties, Inc. Series A, 9.25% | 138,340 | | $ 3,733,797 |
Sunstone Hotel Investors, Inc.: | | | |
Series A, 8.00% | 366,039 | | 9,315,693 |
Series D, 8.00% | 60,362 | | 1,567,601 |
Terreno Realty Corp. Series A 7.75% | 165,690 | | 4,263,204 |
UMH Properties, Inc. Series A, 8.25% | 330,000 | | 8,738,400 |
Vornado Realty Trust 6.75% | 20,000 | | 511,000 |
Weingarten Realty Investors (SBI) Series F, 6.50% | 56,230 | | 1,420,370 |
Winthrop Realty Trust Series D, 9.25% | 65,000 | | 1,730,950 |
| | 333,896,942 |
Real Estate Management & Development - 0.7% |
Forest City Enterprises, Inc. 7.375% | 657,000 | | 15,623,460 |
Vornado Realty LP 7.875% | 54,682 | | 1,540,939 |
| | 17,164,399 |
TOTAL FINANCIALS | | 355,731,823 |
TOTAL NONCONVERTIBLE PREFERRED STOCKS | | 356,364,898 |
TOTAL PREFERRED STOCKS (Cost $385,286,514) |
395,539,429
|
Corporate Bonds - 25.8% |
| Principal Amount (e) | | |
Convertible Bonds - 2.6% |
CONSUMER DISCRETIONARY - 0.1% |
Hotels, Restaurants & Leisure - 0.1% |
Morgans Hotel Group Co. 2.375% 10/15/14 | | $ 4,510,000 | | 3,963,163 |
FINANCIALS - 2.5% |
Real Estate Investment Trusts - 2.1% |
Annaly Capital Management, Inc.: | | | | |
4% 2/15/15 | | 1,000,000 | | 1,268,750 |
5% 5/15/15 | | 34,396,000 | | 34,524,985 |
CapLease, Inc. 7.5% 10/1/27 (h) | | 5,180,000 | | 5,186,475 |
Northstar Realty Finance LP 8.875% 6/15/32 (h) | | 11,500,000 | | 11,873,750 |
Corporate Bonds - continued |
| Principal Amount (e) | | Value |
Convertible Bonds - continued |
FINANCIALS - continued |
Real Estate Investment Trusts - continued |
ProLogis LP: | | | | |
1.875% 11/15/37 | | $ 2,450,000 | | $ 2,443,875 |
2.625% 5/15/38 | | 1,500,000 | | 1,503,825 |
| | 56,801,660 |
Real Estate Management & Development - 0.4% |
Corporate Office Properties LP 4.25% 4/15/30 (h) | | 9,460,000 | | 9,318,100 |
Grubb & Ellis Co. 7.95% 5/1/15 (d)(h) | | 5,500,000 | | 27,500 |
| | 9,345,600 |
TOTAL FINANCIALS | | 66,147,260 |
TOTAL CONVERTIBLE BONDS | | 70,110,423 |
Nonconvertible Bonds - 23.2% |
CONSUMER DISCRETIONARY - 8.1% |
Hotels, Restaurants & Leisure - 0.8% |
CityCenter Holdings LLC/CityCenter Finance Corp.: | | | | |
7.625% 1/15/16 | | 1,945,000 | | 2,047,113 |
7.625% 1/15/16 (h) | | 1,560,000 | | 1,634,100 |
FelCor Lodging LP 6.75% 6/1/19 | | 5,875,000 | | 6,212,813 |
GWR Operating Partnership LLP/Great Wolf Finance Corp. 10.875% 4/1/17 | | 1,700,000 | | 1,925,250 |
Times Square Hotel Trust 8.528% 8/1/26 (h) | | 9,054,703 | | 10,370,959 |
| | 22,190,235 |
Household Durables - 6.7% |
D.R. Horton, Inc. 4.75% 5/15/17 | | 2,000,000 | | 2,090,000 |
KB Home: | | | | |
5.875% 1/15/15 | | 7,000,000 | | 7,070,000 |
6.25% 6/15/15 | | 10,000,000 | | 10,150,000 |
7.25% 6/15/18 | | 7,420,000 | | 7,494,200 |
8% 3/15/20 | | 8,465,000 | | 8,845,925 |
9.1% 9/15/17 | | 17,595,000 | | 19,090,575 |
Lennar Corp.: | | | | |
5.5% 9/1/14 | | 1,000,000 | | 1,048,750 |
5.6% 5/31/15 | | 6,000,000 | | 6,390,000 |
6.5% 4/15/16 | | 4,000,000 | | 4,270,000 |
6.95% 6/1/18 | | 14,280,000 | | 15,636,600 |
Corporate Bonds - continued |
| Principal Amount (e) | | Value |
Nonconvertible Bonds - continued |
CONSUMER DISCRETIONARY - continued |
Household Durables - continued |
M/I Homes, Inc. 8.625% 11/15/18 | | $ 26,055,000 | | $ 27,748,575 |
Meritage Homes Corp.: | | | | |
7% 4/1/22 (h) | | 7,525,000 | | 7,844,813 |
7.15% 4/15/20 | | 7,060,000 | | 7,413,000 |
Ryland Group, Inc.: | | | | |
6.625% 5/1/20 | | 1,555,000 | | 1,632,750 |
8.4% 5/15/17 | | 5,420,000 | | 6,233,000 |
Standard Pacific Corp.: | | | | |
7% 8/15/15 | | 4,000,000 | | 4,080,000 |
8.375% 5/15/18 | | 28,983,000 | | 32,205,910 |
10.75% 9/15/16 | | 8,415,000 | | 10,119,038 |
Toll Brothers Finance Corp. 5.875% 2/15/22 | | 1,550,000 | | 1,662,375 |
| | 181,025,511 |
Multiline Retail - 0.6% |
JC Penney Corp., Inc.: | | | | |
5.65% 6/1/20 | | 4,720,000 | | 3,958,900 |
5.75% 2/15/18 | | 2,845,000 | | 2,485,819 |
Sears Holdings Corp. 6.625% 10/15/18 | | 9,820,000 | | 8,813,450 |
| | 15,258,169 |
TOTAL CONSUMER DISCRETIONARY | | 218,473,915 |
CONSUMER STAPLES - 0.2% |
Food & Staples Retailing - 0.2% |
Ahold Lease Series 2001 A1 pass thru trust certificates 7.82% 1/2/20 | | 1,044,738 | | 1,196,225 |
C&S Group Enterprises LLC 8.375% 5/1/17 (h) | | 3,960,000 | | 4,078,800 |
| | 5,275,025 |
FINANCIALS - 13.6% |
Diversified Financial Services - 0.6% |
Icahn Enterprises LP/Icahn Enterprises Finance Corp.: | | | | |
7.75% 1/15/16 | | 10,820,000 | | 11,374,525 |
8% 1/15/18 | | 3,070,000 | | 3,261,875 |
8% 1/15/18 (h) | | 2,170,000 | | 2,300,200 |
| | 16,936,600 |
Real Estate Investment Trusts - 8.7% |
Camden Property Trust 5% 6/15/15 | | 1,100,000 | | 1,190,189 |
Corporate Bonds - continued |
| Principal Amount (e) | | Value |
Nonconvertible Bonds - continued |
FINANCIALS - continued |
Real Estate Investment Trusts - continued |
Commercial Net Lease Realty, Inc.: | | | | |
6.15% 12/15/15 | | $ 2,526,000 | | $ 2,808,867 |
6.25% 6/15/14 | | 5,005,000 | | 5,310,045 |
CubeSmart LP 4.8% 7/15/22 | | 2,000,000 | | 2,115,008 |
Developers Diversified Realty Corp.: | | | | |
5.5% 5/1/15 | | 4,000,000 | | 4,278,824 |
7.5% 4/1/17 | | 6,000,000 | | 6,906,234 |
7.5% 7/15/18 | | 8,756,000 | | 10,192,536 |
7.875% 9/1/20 | | 4,637,000 | | 5,730,808 |
9.625% 3/15/16 | | 3,836,000 | | 4,662,236 |
Duke Realty LP 6.25% 5/15/13 | | 750,000 | | 775,430 |
Equity One, Inc.: | | | | |
5.375% 10/15/15 | | 3,500,000 | | 3,715,376 |
6.25% 12/15/14 | | 4,081,000 | | 4,413,855 |
6.25% 1/15/17 | | 3,000,000 | | 3,338,346 |
Health Care Property Investors, Inc.: | | | | |
6% 6/15/14 | | 2,340,000 | | 2,503,051 |
6% 3/1/15 | | 1,000,000 | | 1,076,953 |
7.072% 6/8/15 | | 1,500,000 | | 1,672,376 |
Health Care REIT, Inc.: | | | | |
4.125% 4/1/19 | | 2,000,000 | | 2,080,408 |
6% 11/15/13 | | 1,000,000 | | 1,058,028 |
6.2% 6/1/16 | | 750,000 | | 848,000 |
Healthcare Realty Trust, Inc.: | | | | |
5.125% 4/1/14 | | 5,084,000 | | 5,310,746 |
5.75% 1/15/21 | | 2,000,000 | | 2,170,262 |
6.5% 1/17/17 | | 2,875,000 | | 3,229,051 |
Highwoods/Forsyth LP 5.85% 3/15/17 | | 2,800,000 | | 3,041,198 |
HMB Capital Trust V 4.0679% 12/15/36 (d)(h)(j) | | 2,530,000 | | 0 |
Hospitality Properties Trust: | | | | |
5.625% 3/15/17 | | 915,000 | | 978,621 |
6.75% 2/15/13 | | 1,765,000 | | 1,768,756 |
7.875% 8/15/14 | | 1,000,000 | | 1,080,051 |
HRPT Properties Trust: | | | | |
5.75% 11/1/15 | | 4,826,000 | | 5,089,369 |
6.25% 8/15/16 | | 7,500,000 | | 8,058,188 |
6.25% 6/15/17 | | 1,055,000 | | 1,147,254 |
6.65% 1/15/18 | | 3,000,000 | | 3,276,063 |
Corporate Bonds - continued |
| Principal Amount (e) | | Value |
Nonconvertible Bonds - continued |
FINANCIALS - continued |
Real Estate Investment Trusts - continued |
iStar Financial, Inc.: | | | | |
5.85% 3/15/17 | | $ 3,587,000 | | $ 3,264,170 |
5.875% 3/15/16 | | 34,260,000 | | 31,861,800 |
5.95% 10/15/13 | | 7,330,000 | | 7,073,450 |
6.05% 4/15/15 | | 4,725,000 | | 4,488,750 |
6.5% 12/15/13 | | 6,880,000 | | 6,759,600 |
8.625% 6/1/13 | | 6,155,000 | | 6,216,550 |
9% 6/1/17 (h) | | 13,000,000 | | 13,195,000 |
MPT Operating Partnership LP/MPT Finance Corp.: | | | | |
6.375% 2/15/22 | | 3,110,000 | | 3,218,850 |
6.875% 5/1/21 | | 2,000,000 | | 2,130,000 |
Nationwide Health Properties, Inc. 6.25% 2/1/13 | | 1,000,000 | | 1,025,376 |
Omega Healthcare Investors, Inc.: | | | | |
6.75% 10/15/22 | | 2,115,000 | | 2,326,500 |
7.5% 2/15/20 | | 1,000,000 | | 1,120,000 |
Pan Pacific Retail Properties, Inc. 5.95% 6/1/14 | | 1,750,000 | | 1,851,689 |
Potlatch Corp. 7.5% 11/1/19 | | 1,000,000 | | 1,060,000 |
ProLogis LP: | | | | |
6.625% 5/15/18 | | 6,480,000 | | 7,627,569 |
7.625% 7/1/17 | | 4,690,000 | | 5,544,879 |
Reckson Operating Partnership LP/SL Green Realty Corp./SL Green Operating Partnership LP 7.75% 3/15/20 | | 2,000,000 | | 2,325,200 |
Senior Housing Properties Trust: | | | | |
4.3% 1/15/16 | | 5,000,000 | | 5,130,325 |
6.75% 4/15/20 | | 11,000,000 | | 12,150,182 |
6.75% 12/15/21 | | 8,000,000 | | 8,915,800 |
United Dominion Realty Trust, Inc.: | | | | |
5.13% 1/15/14 | | 500,000 | | 521,752 |
5.25% 1/15/15 | | 1,000,000 | | 1,073,339 |
5.25% 1/15/16 | | 4,000,000 | | 4,320,060 |
| | 233,026,970 |
Real Estate Management & Development - 4.2% |
AMB Property LP 5.9% 8/15/13 | | 400,000 | | 415,579 |
BioMed Realty LP 3.85% 4/15/16 | | 2,000,000 | | 2,083,924 |
Brandywine Operating Partnership LP: | | | | |
5.4% 11/1/14 | | 6,750,000 | | 7,080,912 |
7.5% 5/15/15 | | 1,000,000 | | 1,122,373 |
Corporate Bonds - continued |
| Principal Amount (e) | | Value |
Nonconvertible Bonds - continued |
FINANCIALS - continued |
Real Estate Management & Development - continued |
CB Richard Ellis Services, Inc.: | | | | |
6.625% 10/15/20 | | $ 1,205,000 | | $ 1,293,929 |
11.625% 6/15/17 | | 1,500,000 | | 1,695,000 |
Colonial Properties Trust: | | | | |
6.15% 4/15/13 | | 1,500,000 | | 1,535,372 |
6.25% 6/15/14 | | 3,094,000 | | 3,279,779 |
6.875% 8/15/12 | | 1,000,000 | | 1,001,441 |
Colonial Realty LP 6.05% 9/1/16 | | 2,500,000 | | 2,706,523 |
Forest City Enterprises, Inc.: | | | | |
6.5% 2/1/17 | | 17,120,000 | | 16,478,000 |
7.625% 6/1/15 | | 34,050,000 | | 33,752,063 |
Host Hotels & Resorts LP: | | | | |
5.25% 3/15/22 (h) | | 2,000,000 | | 2,117,500 |
5.875% 6/15/19 | | 2,725,000 | | 2,997,500 |
9% 5/15/17 | | 750,000 | | 826,875 |
Kennedy-Wilson, Inc. 8.75% 4/1/19 | | 8,785,000 | | 9,312,100 |
Post Apartment Homes LP 6.3% 6/1/13 | | 2,000,000 | | 2,063,184 |
Realogy Corp.: | | | | |
7.875% 2/15/19 (h) | | 7,085,000 | | 7,138,138 |
9% 1/15/20 (h) | | 1,920,000 | | 2,011,200 |
Regency Centers LP: | | | | |
5.25% 8/1/15 | | 4,509,000 | | 4,859,191 |
5.875% 6/15/17 | | 400,000 | | 458,700 |
Toys 'R' Us Property Co. I LLC 10.75% 7/15/17 | | 2,490,000 | | 2,739,000 |
Ventas Realty LP 4% 4/30/19 | | 2,262,000 | | 2,411,407 |
Wells Operating Partnership II LP 5.875% 4/1/18 | | 3,000,000 | | 3,158,667 |
| | 112,538,357 |
Thrifts & Mortgage Finance - 0.1% |
Wrightwood Capital LLC 1.9% 4/20/20 (d) | | 4,349,567 | | 2,218,279 |
TOTAL FINANCIALS | | 364,720,206 |
HEALTH CARE - 1.3% |
Health Care Equipment & Supplies - 0.4% |
Aviv Healthcare Properties LP/Aviv Healthcare Capital Corp. 7.75% 2/15/19 | | 10,410,000 | | 10,800,375 |
Corporate Bonds - continued |
| Principal Amount (e) | | Value |
Nonconvertible Bonds - continued |
HEALTH CARE - continued |
Health Care Providers & Services - 0.9% |
Sabra Health Care LP/Sabra Capital Corp.: | | | | |
8.125% 11/1/18 | | $ 20,545,000 | | $ 22,188,600 |
8.125% 11/1/18 (h) | | 1,960,000 | | 2,111,900 |
| | 24,300,500 |
TOTAL HEALTH CARE | | 35,100,875 |
TOTAL NONCONVERTIBLE BONDS | | 623,570,021 |
TOTAL CORPORATE BONDS (Cost $657,449,686) |
693,680,444
|
Asset-Backed Securities - 4.5% |
|
Anthracite CDO I Ltd. Series 2002-CIBA Class B, 6.633% 5/24/37 (h) | | 1,384,000 | | 1,384,830 |
Anthracite CDO III Ltd./Anthracite CDO III Corp. Series 2004-1A Class A, 0.6068% 3/23/19 (h)(j) | | 280,455 | | 265,731 |
Capital Trust RE CDO Ltd. Series 2005-1A Class D, 1.7468% 3/20/50 (h)(j) | | 2,250,000 | | 157,500 |
Capital Trust RE CDO Ltd./Capital Trust RE CDO Corp. Series 2005-3A Class A2, 5.16% 6/25/35 (h) | | 4,260,637 | | 4,298,131 |
CapitalSource Real Estate Loan Trust Series 2006-1A Class A2A, 0.7076% 1/20/37 (h)(j) | | 1,157,230 | | 1,032,110 |
CapLease CDO Ltd. Series 2005-1A Class A, 4.926% 1/29/40 (h) | | 1,167,274 | | 1,015,528 |
CBRE Realty Finance CDO LLC Series 2007-1A Class A1, 0.7096% 4/7/52 (h)(j) | | 12,909,377 | | 9,274,613 |
Conseco Finance Securitizations Corp. Series 2002-2 Class M2, 9.163% 3/1/33 | | 500,000 | | 278,365 |
Crest Clarendon Street Ltd./Crest Clarendon Corp. Series 2002-1A: | | | | |
Class B1, 6.065% 12/28/35 (h) | | 1,570,000 | | 1,536,088 |
Class B2, 1.8106% 12/28/35 (h)(j) | | 1,575,000 | | 1,433,250 |
Class D, 9% 12/28/35 (h) | | 500,000 | | 96,600 |
Crest Dartmouth Street Ltd./Crest Dartmouth Street Corp. Series 2003-1A: | | | | |
Class B1, 1.9606% 6/28/38 (h)(j) | | 1,230,000 | | 1,174,650 |
Class D, 9% 6/28/38 (h) | | 1,012,573 | | 708,801 |
Asset-Backed Securities - continued |
| Principal Amount (e) | | Value |
Crest Ltd. Series 2002-IGA Class B, 1.7971% 7/28/35 (h)(j) | | $ 242,197 | | $ 242,197 |
Deutsche Financial Capital Securitization LLC Series 1997-I Class M, 7.275% 9/15/27 | | 9,500,000 | | 8,913,014 |
Fairfield Street Solar Corp. Series 2004-1A Class E1, 3.8319% 11/28/39 (h)(j) | | 566,085 | | 16,983 |
Green Tree Financial Corp.: | | | | |
Series 1996-4 Class M1, 7.75% 6/15/27 | | 1,788,179 | | 1,647,563 |
Series 1997-3 Class M1, 7.53% 3/15/28 | | 7,455,394 | | 4,911,043 |
GSR Mortgage Loan Trust Series 2005-HE3 Class B3, 2.7462% 6/25/35 (j)(l) | | 1,259,000 | | 32,633 |
Guggenheim Structured Real Estate Funding Ltd./Guggenheim Structured Real Estate Funding LLC Series 2005-2A: | | | | |
Class D, 1.7962% 8/26/30 (h)(j) | | 735,000 | | 606,375 |
Class E, 2.2462% 8/26/30 (h)(j) | | 1,517,957 | | 758,979 |
JPMorgan Chase Commercial Mortgage Securities Corp. Series 2009-IWST Class C, 7.4453% 12/5/27 (h) | | 3,000,000 | | 3,529,521 |
Lehman ABS Manufactured Housing Contract Trust Series 2001-B Class M2, 7.17% 4/15/40 | | 1,174,019 | | 481,734 |
Merit Securities Corp. Series 13 Class M1, 7.9015% 12/28/33 (j) | | 1,923,000 | | 1,819,939 |
N-Star Real Estate CDO Ltd. Series 1A Class C1B, 7.696% 8/28/38 (h) | | 899,989 | | 719,991 |
Newcastle Investment Trust Series 2011-MH1 Class A, 2.45% 12/10/33 (h) | | 3,391,764 | | 3,401,868 |
Prima Capital CDO Ltd./Prima Capital CDO Corp. Series 2005-1A Class D, 5.194% 7/24/39 (h) | | 2,950,302 | | 2,950,302 |
Prima Capital Ltd. Series 2006-CR1A Class A2, 5.533% 12/28/48 (h) | | 9,370,000 | | 9,182,600 |
Taberna Preferred Funding III Ltd. Series 2005-3A Class D, 3.1159% 2/5/36 (h)(j) | | 3,582,607 | | 358 |
Wachovia Ltd./Wachovia LLC: | | | | |
Series 2006-1 Class 1ML, 5.9676% 9/25/26 (h)(j) | | 2,000,000 | | 1,000,000 |
Series 2006-1A: | | | | |
Class A1A, 0.7276% 9/25/26 (h)(j) | | 19,445,048 | | 17,500,543 |
Class A1B, 0.7976% 9/25/26 (h)(j) | | 22,506,000 | | 18,792,510 |
Class A2A, 0.6876% 9/25/26 (h)(j) | | 6,083,741 | | 5,901,229 |
Class A2B, 0.7776% 9/25/26 (h)(j) | | 1,550,000 | | 1,367,875 |
Class B, 0.8276% 9/25/26 (h)(j) | | 890,000 | | 725,350 |
Class C 0.9976% 9/25/26 (h)(j) | | 3,830,000 | | 3,044,850 |
Class G, 1.8176% 9/25/26 (h)(j) | | 1,270,000 | | 916,051 |
Asset-Backed Securities - continued |
| Principal Amount (e) | | Value |
Wrightwood Capital Real Estate CDO Ltd. Series 2005-1A: | | | | |
Class A1, 0.7869% 11/21/40 (h)(j) | | $ 10,319,967 | | $ 8,565,573 |
Class F, 2.4169% 11/21/40 (h)(j) | | 250,000 | | 42,500 |
TOTAL ASSET-BACKED SECURITIES (Cost $119,902,454) |
119,727,778
|
Collateralized Mortgage Obligations - 0.7% |
|
Private Sponsor - 0.7% |
COMM pass-thru certificates Series 2007-FL14 Class AJ, 0.4288% 6/15/22 (h)(j) | | 1,898,329 | | 1,783,161 |
Countrywide Home Loans, Inc.: | | | | |
Series 2002-38 Class B3, 5% 2/25/18 (h) | | 63,646 | | 19,547 |
Series 2002-R2 Class 2B3, 3.7901% 7/25/33 (h)(j) | | 209,727 | | 99,715 |
Series 2003-40 Class B3, 4.5% 10/25/18 (h) | | 102,159 | | 65,408 |
Series 2003-R3: | | | | |
Class B2, 5.5% 11/25/33 (h) | | 1,403,239 | | 250,706 |
Class B3, 5.5% 11/25/33 | | 154,512 | | 8,302 |
Series 2004-R1 Class 1B3, 5.5% 11/25/34 (h)(j) | | 118,254 | | 5,405 |
FREMF Mortgage Trust: | | | | |
Series 2010 K7 Class B, 5.6186% 4/25/20 (h)(j) | | 3,200,000 | | 3,456,806 |
Series 2010-K6 Class B, 5.5326% 12/25/46 (h)(j) | | 4,500,000 | | 4,833,446 |
Merrill Lynch Mortgage Investors Trust Series 1998-C3 Class F, 6% 12/15/30 (h) | | 7,120,000 | | 7,166,529 |
RESI Finance LP/RESI Finance DE Corp. floater: | | | | |
Series 2003-B Class B9, 12.1958% 7/10/35 (h)(j) | | 323,594 | | 272,693 |
Series 2005-A Class B6, 2.2458% 3/10/37 (h)(j) | | 1,469,617 | | 109,193 |
Series 2005-B Class B6, 1.8458% 6/10/37 (h)(j) | | 855,663 | | 31,488 |
Residential Funding Securities Corp. Series 2002-RM1 Class BI1, 5.5% 12/25/17 (h) | | 44,135 | | 37,954 |
RESIX Finance Ltd. floater: | | | | |
Series 2003-D Class B8, 6.7458% 12/10/35 (h)(j) | | 303,961 | | 154,169 |
Series 2004-A Class B7, 4.4958% 2/10/36 (h)(j) | | 335,511 | | 182,652 |
Series 2004-B Class B7, 4.2458% 2/10/36 (h)(j) | | 406,093 | | 189,645 |
TOTAL PRIVATE SPONSOR | | 18,666,819 |
U.S. Government Agency - 0.0% |
Fannie Mae REMIC Trust: | | | | |
Series 2001-W3 subordinate REMIC pass thru certificates, Class B3, 7% 9/25/41 (l) | | 162,862 | | 86,330 |
Collateralized Mortgage Obligations - continued |
| Principal Amount (e) | | Value |
U.S. Government Agency - continued |
Fannie Mae REMIC Trust: - continued | | | | |
Series 2002-W1 subordinate REMIC pass thru certificates, Class 3B3, 3.2498% 2/25/42 (h)(j) | | $ 101,055 | | $ 56,166 |
Series 2003-W1 subordinate REMIC pass thru certificates, Class B3, 5.75% 12/25/42 (l) | | 237,912 | | 77,294 |
Series 2003-W10 subordinate REMIC pass thru certificates, Class 2B3, 3.3004% 6/25/43 (h)(j) | | 152,272 | | 59,561 |
Series 2003-W4 subordinate REMIC pass thru certificates, Class 2B3, 3.2829% 10/25/42 (h)(j) | | 66,047 | | 34,253 |
TOTAL U.S. GOVERNMENT AGENCY | | 313,604 |
TOTAL COLLATERALIZED MORTGAGE OBLIGATIONS (Cost $20,969,249) |
18,980,423
|
Commercial Mortgage Securities - 20.2% |
|
ACGS Series 2004-1 Class P, 7.4651% 8/1/19 (l) | | 4,936,312 | | 4,789,765 |
Americold LLC Trust Series 2010-ARTA Class D, 7.443% 1/14/29 (h) | | 2,000,000 | | 2,268,936 |
Asset Securitization Corp. Series 1997-D4 Class B2, 7.525% 4/14/29 | | 218,481 | | 223,872 |
Banc of America Commercial Mortgage, Inc.: | | | | |
sequential payer Series 2002-2 Class F, 5.487% 7/11/43 | | 4,185,000 | | 4,218,836 |
Series 2005-1 Class CJ, 5.3652% 11/10/42 (j) | | 3,580,000 | | 3,750,161 |
Series 2005-6 Class AJ, 5.3661% 9/10/47 (j) | | 5,000,000 | | 5,127,560 |
Banc of America Large Loan Trust floater Series 2010-HLTN Class HLTN, 1.992% 11/15/15 (h)(j) | | 118,988,060 | | 113,632,397 |
Banc of America Large Loan, Inc. floater Series 2005-MIB1: | | | | |
Class J, 1.2988% 3/15/22 (h)(j) | | 6,360,000 | | 5,819,826 |
Class K, 2.2488% 3/15/22 (h)(j) | | 4,190,000 | | 2,556,181 |
Bear Stearns Commercial Mortgage Securities, Inc. Series 2006-PW11 Class AJ, 5.6187% 3/11/39 (j) | | 5,700,000 | | 5,442,725 |
Bear Stearns Commercial Mortgage Securities Trust Series 2006-T22 Class B, 5.7126% 4/12/38 (h)(j) | | 2,520,000 | | 2,376,864 |
COMM pass-thru certificates: | | | | |
floater Series 2006-FL12 Class AJ, 0.3788% 12/15/20 (h)(j) | | 8,000,000 | | 7,261,968 |
sequential payer Series 2004-RS1 Class A, 5.648% 3/3/41 (h) | | 6,063,232 | | 6,108,706 |
Commercial Mortgage Securities - continued |
| Principal Amount (e) | | Value |
Commercial Mortgage pass-thru certificates: | | | | |
Series 2005-C6 Class AJ, 5.209% 6/10/44 (j) | | $ 5,000,000 | | $ 5,047,230 |
Series 2011-STRT Class C, 4.755% 12/10/24 (h) | | 2,000,000 | | 2,004,116 |
Series 2012-CR1: | | | | |
Class C, 5.547% 5/15/45 | | 1,000,000 | | 1,001,593 |
Class D, 5.547% 5/15/45 (h) | | 2,050,000 | | 1,606,852 |
Commercial Mortgage Trust pass-thru certificates Series 2012-LC4: | | | | |
Class C, 5.8248% 12/10/44 (j) | | 2,000,000 | | 2,062,884 |
Class D, 5.8248% 12/10/44 (h)(j) | | 8,000,000 | | 6,513,008 |
Communication Mortgage Trust Series 2011-THL: | | | | |
Class E, 5.949% 6/9/28 (h) | | 3,690,000 | | 3,757,014 |
Class F, 4.867% 6/9/28 (h) | | 11,090,000 | | 10,125,991 |
Credit Suisse First Boston Mortgage Securities Corp.: | | | | |
Series 1998-C1 Class F, 6% 5/17/40 (h) | | 2,442,446 | | 2,582,346 |
Series 1998-C2 Class F, 6.75% 11/15/30 (h) | | 3,000,000 | | 3,231,606 |
CRESI Finance Ltd. Partnership floater Series 2006-A Class E, 1.8962% 3/25/17 (h)(j) | | 891,217 | | 757,534 |
CRESIX Finance Ltd. Series 2006-AA: | | | | |
Class F, 4.4462% 3/25/17 (h)(j) | | 3,860,000 | | 3,203,800 |
Class G, 7.2462% 3/25/17 (h)(j) | | 3,272,000 | | 2,617,600 |
DBUBS Mortgage Trust Series 2011-LC1A Class E, 5.7284% 11/10/46 (h)(j) | | 12,490,000 | | 11,152,234 |
Deutsche Mortgage & Asset Receiving Corp. Series 1998-C1 Class J, 6.22% 6/15/31 | | 1,200,000 | | 1,015,564 |
DLJ Commercial Mortgage Corp.: | | | | |
Series 1998-CG1 Class B4, 7.4461% 6/10/31 (h)(j) | | 2,500,000 | | 2,564,625 |
Series 2000-CKP1 Class B3, 7.942% 11/10/33 (j) | | 2,970,000 | | 2,960,624 |
Extended Stay America Trust Series 2010-ESHA Class D, 5.4983% 11/5/27 (h) | | 6,000,000 | | 6,118,683 |
FHMLC Multi-class participation certificates guaranteed: | | | | |
Series K013 Class X3, 2.8846% 1/25/43 (j)(k) | | 14,360,000 | | 2,409,479 |
Series KAIV Class X2, 3.6146% 6/25/46 (j)(k) | | 7,430,000 | | 1,630,649 |
Freddie Mac: | | | | |
Series K011 Class X3, 2.6619% 12/25/43 (j)(k) | | 12,206,096 | | 1,868,936 |
Series K012 Class X3, 2.3657% 1/25/41 (j)(k) | | 21,072,886 | | 2,881,528 |
G-Force LLC sequential payer Series 2005-RRA Class A2, 4.83% 8/22/36 (h) | | 10,985,212 | | 10,710,582 |
GE Capital Commercial Mortgage Corp. Series 2002-1A Class H, 7.3556% 12/10/35 (h)(j) | | 991,000 | | 990,863 |
GMAC Commercial Mortgage Securities, Inc.: | | | | |
Series 1997-C2: | | | | |
Class F, 6.75% 4/15/29 (j) | | 786,432 | | 793,615 |
Commercial Mortgage Securities - continued |
| Principal Amount (e) | | Value |
GMAC Commercial Mortgage Securities, Inc.: - continued | | | | |
Series 1997-C2: | | | | |
Class G, 6.75% 4/15/29 (j) | | $ 1,250,000 | | $ 1,330,310 |
Series 1999-C3 Class J, 6.974% 8/15/36 | | 1,500,000 | | 1,484,156 |
Series 2000-C1 Class K, 7% 3/15/33 | | 224,908 | | 168,944 |
Series 2002-C3 Class D, 5.27% 7/10/39 | | 3,000,000 | | 3,025,728 |
Greenwich Capital Commercial Funding Corp.: | | | | |
sequential payer Series 2003-C1 Class D, 4.29% 7/5/35 (h) | | 2,000,000 | | 2,024,370 |
Series 2002-C1 Class H, 5.903% 1/11/35 (h) | | 880,000 | | 880,664 |
GS Mortgage Securities Corp. II: | | | | |
floater Series 2007-EOP Class L, 5.4585% 3/6/20 (h)(j) | | 1,400,000 | | 1,401,249 |
Series 2010-C1: | | | | |
Class D, 6.1357% 8/10/43 (h)(j) | | 4,000,000 | | 3,868,272 |
Class E, 4% 8/10/43 (h) | | 3,770,000 | | 2,798,392 |
Series 2012-GCJ7: | | | | |
Class C, 5.721% 5/10/45 (j) | | 4,000,000 | | 4,023,707 |
Class D, 5.721% 5/10/45 (h) | | 2,000,000 | | 1,615,022 |
GS Mortgage Securities Corp. Trust Series 2011-ALF Class E, 4.953% 2/10/21 (h) | | 9,185,000 | | 9,152,853 |
GS Mortgage Securities Trust: | | | | |
Series 2011-GC5 Class C, 5.4749% 8/10/44 (h)(j) | | 9,000,000 | | 9,145,854 |
Series 2012-GC6 Class C, 5.8273% 1/10/45 (h)(j) | | 3,600,000 | | 3,690,897 |
JPMorgan Chase Commercial Mortgage Securities Corp.: | | | | |
Series 2001-A: | | | | |
Class G, 6% 10/15/32 (h)(j) | | 2,036,910 | | 2,506 |
Class X, 0.627% 10/15/32 (h)(j)(k) | | 4,808,491 | | 20,025 |
Series 2002-C1 Class E, 6.135% 7/12/37 (h) | | 3,000,000 | | 2,998,143 |
Series 2009-IWST Class D, 7.6935% 12/5/27 (h)(j) | | 8,550,000 | | 9,453,419 |
Series 2010-CNTM Class MZ, 8.5% 8/5/20 (h) | | 9,000,000 | | 9,525,053 |
Series 2010-CNTR: | | | | |
Class D, 6.3899% 8/5/32 (h)(j) | | 4,500,000 | | 4,741,803 |
Class XB, 0.9305% 8/5/32 (h)(k) | | 32,655,000 | | 1,690,837 |
Series 2012-CBX Class C, 5.1909% 6/16/45 (j) | | 4,530,000 | | 4,521,666 |
JPMorgan Chase Commercial Mortgage Securities Trust: | | | | |
Series 2005-LDP5 Class AJ, 5.4825% 12/15/44 (j) | | 3,470,000 | | 3,475,804 |
Series 2011-C5 Class C, 5.4913% 8/15/46 (h)(j) | | 6,525,375 | | 6,534,824 |
JPMorgan Commercial Mortgage Finance Corp. Series 1999-C8: | | | | |
Class G, 6% 7/15/31 (h) | | 938,900 | | 956,183 |
Class H, 6% 7/15/31 (h) | | 1,341,102 | | 471,049 |
Commercial Mortgage Securities - continued |
| Principal Amount (e) | | Value |
LB Commercial Conduit Mortgage Trust Series 1998-C4 Class G, 5.6% 10/15/35 (h) | | $ 2,693,075 | | $ 2,799,279 |
LB-UBS Commercial Mortgage Trust: | | | | |
sequential payer: | | | | |
Series 2004-C2 Class E, 4.487% 3/15/36 | | 2,060,000 | | 2,077,442 |
Series 2005-C3 Class AJ, 4.843% 7/15/40 | | 6,620,000 | | 6,774,061 |
Series 2005-C7 Class AJ, 5.323% 11/15/40 | | 8,000,000 | | 8,211,360 |
Series 2006-C7 Class AM, 5.378% 11/15/38 | | 2,040,000 | | 2,082,862 |
Series 2004-C7 Class E, 4.918% 10/15/36 | | 5,120,000 | | 5,104,778 |
Series 2005-C1 Class E, 4.924% 2/15/40 | | 4,000,000 | | 3,628,624 |
Series 2006-C4: | | | | |
Class AJ, 6.0867% 6/15/38 (j) | | 7,005,000 | | 6,094,119 |
Class AM, 6.0867% 6/15/38 (j) | | 6,700,000 | | 7,138,709 |
Lehman Brothers Floating Rate Commercial Mortgage Trust floater Series 2007-LLFA Class E, 1.1488% 6/15/22 (h)(j) | | 6,230,000 | | 5,270,892 |
Lstar Commercial Mortgage Trust: | | | | |
Series 2011-1 Class D, 5.6245% 6/25/43 (h)(j) | | 4,699,000 | | 4,389,388 |
Series 2011-1 Class B, 5.6245% 6/25/43 (h)(j) | | 6,165,000 | | 6,309,878 |
Merrill Lynch Financial Asset, Inc. Series 2005-CA16: | | | | |
Class F, 4.384% 7/12/37 | CAD | 710,000 | | 528,500 |
Class G, 4.384% 7/12/37 | CAD | 355,000 | | 257,651 |
Class H, 4.384% 7/12/37 | CAD | 236,000 | | 167,031 |
Class J, 4.384% 7/12/37 | CAD | 355,000 | | 245,052 |
Class K, 4.384% 7/12/37 | CAD | 355,000 | | 239,038 |
Class L, 4.384% 7/12/37 | CAD | 236,000 | | 155,032 |
Class M, 4.384% 7/12/37 | CAD | 995,000 | | 552,140 |
Merrill Lynch Mortgage Investors Trust Series 1999-C1 Class G, 6.71% 11/15/31 (h) | | 715,093 | | 393,301 |
Merrill Lynch Mortgage Trust Series 2006-C1 Class AM, 5.8478% 5/12/39 (j) | | 1,200,000 | | 1,312,804 |
Mezz Capital Commercial Mortgage Trust: | | | | |
sequential payer: | | | | |
Series 2004-C1 Class A, 4.836% 1/15/37 (h) | | 4,105,302 | | 3,551,086 |
Series 2004-C2 Class A, 5.318% 10/15/40 (h) | | 9,995,195 | | 7,596,348 |
Series 2004-C1: | | | | |
Class D, 6.988% 1/15/37 (h) | | 750,000 | | 75 |
Class E, 7.983% 1/15/37 (h) | | 1,313,162 | | 131 |
Class IO, 8.9913% 1/15/37 (h)(j)(k) | | 4,287,713 | | 321,578 |
Morgan Stanley Capital I Trust: | | | | |
sequential payer: | | | | |
Series 2012-C4 Class E, 5.71% 3/15/45 (h) | | 4,630,000 | | 3,912,350 |
Series 2004-RR2 Class A2, 5.45% 10/28/33 (h) | | 948,263 | | 950,634 |
Commercial Mortgage Securities - continued |
| Principal Amount (e) | | Value |
Morgan Stanley Capital I Trust: - continued | | | | |
sequential payer: | | | | |
Series 2006-HQ10 Class AM, 5.36% 11/12/41 | | $ 8,200,000 | | $ 8,844,946 |
Series 1997-RR Class F, 7.35% 4/30/39 (h)(j) | | 1,363,287 | | 1,254,224 |
Series 1998-CF1 Class G, 7.35% 7/15/32 (h) | | 2,613,134 | | 1,837,540 |
Series 2005-HQ5 Class B, 5.272% 1/14/42 | | 2,000,000 | | 1,991,842 |
Series 2005-HQ6 Class AJ, 5.073% 8/13/42 (j) | | 2,500,000 | | 2,539,248 |
Series 2006-IQ12 Class AMFX, 5.37% 12/15/43 | | 7,500,000 | | 7,971,398 |
Series 2011-C1 Class C, 5.4216% 9/15/47 (h)(j) | | 3,000,000 | | 3,163,867 |
Series 2011-C2: | | | | |
Class D, 5.4951% 6/15/44 (h)(j) | | 4,610,000 | | 4,325,240 |
Class E, 5.4951% 6/15/44 (h)(j) | | 9,600,000 | | 7,959,360 |
Class F, 5.4951% 6/15/44 (h)(j) | | 4,440,000 | | 3,507,600 |
Class XB, 0.5396% 6/15/44 (h)(j)(k) | | 63,708,222 | | 2,019,551 |
Series 2011-C3 Class D, 5.357% 7/15/49 (h) | | 7,400,000 | | 6,811,892 |
NationsLink Funding Corp. Series 1999-SL Class X, 11/10/30 (j)(k) | | 1,077,337 | | 1,045,017 |
Providence Place Group Ltd. Partnership Series 2000-C1 Class A2, 7.75% 7/20/28 (h) | | 3,641,887 | | 4,299,248 |
RBSCF Trust Series 2010-MB1 Class D, 4.8317% 4/15/24 (h)(j) | | 8,320,000 | | 8,517,999 |
Salomon Brothers Mortgage Securities VII, Inc. Series 2001-MMA: | | | | |
Class E3, 6.5% 2/18/34 (h)(j) | | 3,000,000 | | 3,084,213 |
Class E5, 6.5% 2/18/34 (h)(j) | | 3,000,000 | | 3,004,545 |
TIAA Seasoned Commercial Mortgage Trust sequential payer Series 2007-C4 Class AJ, 5.6201% 8/15/39 (j) | | 2,080,000 | | 2,238,350 |
TimberStar Trust I Series 2006-1 Class F, 7.5296% 10/15/36 (h) | | 10,630,000 | | 10,988,996 |
UBS Commercial Mortgage Trust Series 2007-FL1 Class F, 0.8238% 7/15/24 (h)(j) | | 1,200,000 | | 817,702 |
UBS-Citigroup Commercial Mortgage Trust Series 2011-C1 Class B, 6.0708% 1/10/45 (h)(j) | | 3,000,000 | | 3,460,626 |
Vornado DP LLC Series 2010-VNO Class D, 6.3555% 9/13/28 (h) | | 2,540,000 | | 2,801,610 |
Wachovia Bank Commercial Mortgage Trust: | | | | |
Series 2004-C10 Class E, 4.931% 2/15/41 | | 2,000,000 | | 1,979,378 |
Series 2004-C11: | | | | |
Class D, 5.5668% 1/15/41 (j) | | 5,177,000 | | 4,801,010 |
Class E, 5.6168% 1/15/41 (j) | | 3,785,000 | | 3,261,595 |
Series 2004-C12 Class D, 5.4942% 7/15/41 (j) | | 2,750,000 | | 2,767,531 |
Series 2004-C14 Class B, 5.17% 8/15/41 | | 3,180,000 | | 3,354,261 |
WF-RBS Commercial Mortgage Trust Series 2011-C3: | | | | |
Class C, 5.335% 3/15/44 (h) | | 4,900,000 | | 5,092,149 |
Commercial Mortgage Securities - continued |
| Principal Amount (e) | | Value |
WF-RBS Commercial Mortgage Trust Series 2011-C3: - continued | | | | |
Class D, 5.7221% 3/15/44 (h)(j) | | $ 1,000,000 | | $ 863,933 |
WFDB Commercial Mortgage Trust Series 2011-BXR Class D, 5.914% 7/5/24 (h) | | 4,000,000 | | 4,140,892 |
TOTAL COMMERCIAL MORTGAGE SECURITIES (Cost $522,862,342) |
540,998,389
|
Floating Rate Loans - 4.9% |
|
CONSUMER DISCRETIONARY - 1.7% |
Hotels, Restaurants & Leisure - 1.6% |
Extended Stay America, Inc. term loan 9.75% 11/1/15 | | 9,000,000 | | 9,090,000 |
Hilton Hotels Corp.: | | | | |
term loan 3.999% 11/12/15 (j) | | 15,000,000 | | 13,462,500 |
Tranche B, term loan 11/12/15 (j) | | 12,000,000 | | 11,160,000 |
Tranche E term loan 11/12/15 (j) | | 10,000,000 | | 9,100,000 |
| | 42,812,500 |
Media - 0.1% |
PRIMEDIA, Inc. Tranche B, term loan 7.5% 1/13/18 (j) | | 2,821,500 | | 2,553,458 |
Specialty Retail - 0.0% |
The Pep Boys - Manny, Moe & Jack term loan 2.47% 10/27/13 (j) | | 1,967,498 | | 1,960,120 |
TOTAL CONSUMER DISCRETIONARY | | 47,326,078 |
FINANCIALS - 1.7% |
Diversified Financial Services - 0.2% |
Pilot Travel Centers LLC Tranche B, term loan 4.25% 3/30/18 (j) | | 3,885,475 | | 3,871,098 |
Real Estate Investment Trusts - 0.0% |
iStar Financial, Inc. Tranche A 1LN, term loan 5% 6/28/13 (j) | | 830,748 | | 829,710 |
Real Estate Management & Development - 1.4% |
CB Richard Ellis Group, Inc. Tranche B, term loan 3.4968% 11/9/16 (j) | | 2,984,810 | | 2,973,617 |
CB Richard Ellis Services, Inc. Tranche D, term loan 3.7488% 9/4/19 (j) | | 4,736,081 | | 4,696,629 |
CityCenter term loan 8.75% 7/1/13 (j) | | 4,169,750 | | 4,138,477 |
EOP Operating LP term loan 1.9958% 2/5/13 (j) | | 5,000,000 | | 4,775,000 |
Equity Inns Reality LLC: | | | | |
Tranche A, term loan 9.5% 11/2/12 (j) | | 2,184,917 | | 1,635,653 |
Floating Rate Loans - continued |
| Principal Amount (e) | | Value |
FINANCIALS - continued |
Real Estate Management & Development - continued |
Equity Inns Reality LLC: - continued | | | | |
Tranche B 2LN, term loan 6.55% 11/2/12 (j) | | $ 5,000,000 | | $ 4,475,000 |
Realogy Corp.: | | | | |
Credit-Linked Deposit 3.2458% 10/10/13 (j) | | 518,858 | | 485,132 |
Credit-Linked Deposit 4.4958% 10/10/16 (j) | | 926,858 | | 875,881 |
term loan 4.4988% 10/10/16 (j) | | 10,840,642 | | 10,244,406 |
Tranche 2LN, term loan 13.5% 10/15/17 | | 3,500,000 | | 3,570,000 |
| | 37,869,795 |
Thrifts & Mortgage Finance - 0.1% |
Ocwen Financial Corp. Tranche B, term loan 7% 9/1/16 (j) | | 2,307,756 | | 2,307,756 |
TOTAL FINANCIALS | | 44,878,359 |
HEALTH CARE - 0.6% |
Health Care Providers & Services - 0.6% |
Community Health Systems, Inc. term loan 3.9667% 1/25/17 (j) | | 2,903,247 | | 2,883,447 |
Health Management Associates, Inc. Tranche B, term loan 4.5% 11/18/18 (j) | | 1,990,000 | | 1,990,000 |
Skilled Healthcare Group, Inc. term loan 6.75% 4/9/16 (j) | | 10,379,665 | | 10,379,665 |
| | 15,253,112 |
INDUSTRIALS - 0.4% |
Construction & Engineering - 0.4% |
Drumm Investors LLC Tranche B, term loan 5% 5/4/18 (j) | | 11,877,133 | | 11,431,741 |
TELECOMMUNICATION SERVICES - 0.5% |
Wireless Telecommunication Services - 0.5% |
Crown Castle Operating Co. Tranche B, term loan 4% 1/31/19 (j) | | 8,983,803 | | 8,973,022 |
TowerCo Finance LLC Tranche B, term loan 4.5% 2/2/17 (j) | | 3,632,412 | | 3,636,953 |
| | 12,609,975 |
TOTAL FLOATING RATE LOANS (Cost $132,655,576) |
131,499,265
|
Preferred Securities - 0.0% |
| Principal Amount (e) | | Value |
FINANCIALS - 0.0% |
Diversified Financial Services - 0.0% |
Crest Clarendon Street 2002-1 Ltd. Series 2002-1A Class PS, 12/28/35 (h) | $ 500,000 | | $ 15,000 |
Crest Dartmouth Street 2003 1 Ltd. Series 2003-1A Class PS, 6/28/38 (h) | 1,220,000 | | 122,000 |
Ipswich Street CDO Series 2006-1, 6/27/46 (d)(h) | 1,350,000 | | 0 |
| | 137,000 |
TOTAL PREFERRED SECURITIES (Cost $2,594,645) |
137,000
|
Money Market Funds - 8.0% |
| Shares | | |
Fidelity Cash Central Fund, 0.17% (b) | 187,739,774 | | 187,739,774 |
Fidelity Securities Lending Cash Central Fund, 0.18% (b)(c) | 27,376,007 | | 27,376,007 |
TOTAL MONEY MARKET FUNDS (Cost $215,115,781) |
215,115,781
|
TOTAL INVESTMENT PORTFOLIO - 101.9% (Cost $2,558,959,106) | | 2,735,706,986 |
NET OTHER ASSETS (LIABILITIES) - (1.9)% | | (49,848,102) |
NET ASSETS - 100% | $ 2,685,858,884 |
Currency Abbreviations |
CAD | - | Canadian dollar |
Legend |
(a) Non-income producing |
(b) Affiliated fund that is available only to investment companies and other accounts managed by Fidelity Investments. The rate quoted is the annualized seven-day yield of the fund at period end. A complete unaudited listing of the fund's holdings as of its most recent quarter end is available upon request. In addition, each Fidelity Central Fund's financial statements, which are not covered by the Fund's Report of Independent Registered Public Accounting Firm, are available on the SEC's website or upon request. |
(c) Investment made with cash collateral received from securities on loan. |
(d) Non-income producing - Security is in default. |
(e) Principal amount is stated in United States dollars unless otherwise noted. |
(f) Security or a portion of the security is on loan at period end. |
(g) Affiliated company |
(h) Security exempt from registration under Rule 144A of the Securities Act of 1933. These securities may be resold in transactions exempt from registration, normally to qualified institutional buyers. At the end of the period, the value of these securities amounted to $607,946,631 or 22.6% of net assets. |
(i) Security or a portion of the security purchased on a delayed delivery or when-issued basis. |
(j) Coupon rates for floating and adjustable rate securities reflect the rates in effect at period end. |
(k) Security represents right to receive monthly interest payments on an underlying pool of mortgages or assets. Principal shown is the outstanding par amount of the pool as of the end of the period. |
(l) Restricted securities - Investment in securities not registered under the Securities Act of 1933 (excluding 144A issues). At the end of the period, the value of restricted securities (excluding 144A issues) amounted to $4,986,022 or 0.2% of net assets. |
Additional information on each restricted holding is as follows: |
Security | Acquisition Date | Acquisition Cost |
ACGS Series 2004-1 Class P, 7.4651% 8/1/19 | 2/17/11 | $ 4,780,148 |
Fannie Mae REMIC Trust Series 2001-W3 subordinate REMIC pass thru certificates, Class B3, 7% 9/25/41 | 5/21/03 | $ 141,130 |
Fannie Mae REMIC Trust Series 2003-W1 subordinate REMIC pass thru certificates, Class B3, 5.75% 12/25/42 | 3/25/03 | $ 179,289 |
GSR Mortgage Loan Trust Series 2005-HE3 Class B3, 2.7462% 6/25/35 | 6/3/05 | $ 1,110,697 |
Affiliated Central Funds |
Information regarding fiscal year to date income earned by the Fund from investments in Fidelity Central Funds is as follows: |
Fund | Income earned |
Fidelity Cash Central Fund | $ 227,690 |
Fidelity Securities Lending Cash Central Fund | 73,576 |
Total | $ 301,266 |
Other Affiliated Issuers |
An affiliated company is a company in which the Fund has ownership of at least 5% of the voting securities. Fiscal year to date transactions with companies which are or were affiliates are as follows: |
Affiliate | Value, beginning of period | Purchases | Sales Proceeds | Dividend Income | Value,
end of
period |
AmREIT, Inc. | $ - | $ 2,800,000 | $ - | $ - | $ 2,818,000 |
Total | $ - | $ 2,800,000 | $ - | $ - | $ 2,818,000 |
Other Information |
The following is a summary of the inputs used, as of July 31, 2012, involving the Fund's assets and liabilities carried at fair value. The inputs or methodology used for valuing securities may not be an indication of the risk associated with investing in those securities. For more information on valuation inputs, and their aggregation into the levels used in the tables below, please refer to the Security Valuation section in the accompanying Notes to Financial Statements. |
Valuation Inputs at Reporting Date: |
Description | Total | Level 1 | Level 2 | Level 3 |
Investments in Securities: |
Equities: | | | | |
Consumer Discretionary | $ 32,967,155 | $ 28,850,735 | $ - | $ 4,116,420 |
Financials | 947,319,005 | 889,631,220 | 46,463,582 | 11,224,203 |
Health Care | 29,263,532 | 29,263,532 | - | - |
Telecommunication Services | 6,018,214 | 6,018,214 | - | - |
Corporate Bonds | 693,680,444 | - | 691,462,165 | 2,218,279 |
Asset-Backed Securities | 119,727,778 | - | 83,414,055 | 36,313,723 |
Collateralized Mortgage Obligations | 18,980,423 | - | 17,239,942 | 1,740,481 |
Commercial Mortgage Securities | 540,998,389 | - | 487,014,384 | 53,984,005 |
Floating Rate Loans | 131,499,265 | - | 113,495,788 | 18,003,477 |
Preferred Securities | 137,000 | - | - | 137,000 |
Money Market Funds | 215,115,781 | 215,115,781 | - | - |
Total Investments in Securities: | $ 2,735,706,986 | $ 1,168,879,482 | $ 1,439,089,916 | $ 127,737,588 |
Valuation Inputs at Reporting Date: |
The following is a reconciliation of Investments in Securities for which Level 3 inputs were used in determining value: |
Investments in Securities: | |
Asset-Backed Securities | |
Beginning Balance | $ 79,390,084 |
Total Realized Gain (Loss) | 1,318,781 |
Total Unrealized Gain (Loss) | 4,471,824 |
Cost of Purchases | 183,524 |
Proceeds of Sales | (21,893,868) |
Amortization/Accretion | 1,481,337 |
Transfers in to Level 3 | 3,448,211 |
Transfers out of Level 3 | (32,086,170) |
Ending Balance | $ 36,313,723 |
The change in unrealized gain (loss) for the period attributable to Level 3 securities held at July 31, 2012 | $ 4,749,808 |
Investments in Securities: | |
Commercial Mortgage Securities | |
Beginning Balance | $ 31,940,633 |
Total Realized Gain (Loss) | 292,397 |
Total Unrealized Gain (Loss) | 1,669,669 |
Cost of Purchases | 18,454,173 |
Proceeds of Sales | (14,263,172) |
Amortization/Accretion | 297,301 |
Transfers in to Level 3 | 15,593,004 |
Transfers out of Level 3 | - |
Ending Balance | $ 53,984,005 |
The change in unrealized gain (loss) for the period attributable to Level 3 securities held at July 31, 2012 | $ 1,426,676 |
Other Investments in Securities | |
Beginning Balance | $ 28,158,749 |
Total Realized Gain (Loss) | (1,117,739) |
Total Unrealized Gain (Loss) | 2,178,452 |
Cost of Purchases | 18,084,567 |
Proceeds of Sales | (8,701,192) |
Amortization/Accretion | (23,513) |
Transfers in to Level 3 | 1,620,536 |
Transfers out of Level 3 | (2,760,000) |
Ending Balance | $ 37,439,860 |
The change in unrealized gain (loss) for the period attributable to Level 3 securities held at July 31, 2012 | $ (1,543,927) |
The information used in the above reconciliations represents fiscal year to date activity for any Investments in Securities identified as using Level 3 inputs at either the beginning or the end of the current fiscal period. Transfers in to Level 3 were attributable to a lack of observable market data resulting from decreases in market activity, decreases in liquidity, security restructurings or corporate actions. Transfers out of Level 3 were attributable to observable market data becoming available for those securities. Transfers in or out of Level 3 represent the beginning value of any Security or Instrument where a change in the pricing level occurred from the beginning to the end of the period. The cost of purchases and the proceeds of sales may include securities received or delivered through corporate actions or exchanges. Realized and unrealized gains (losses) disclosed in the reconciliations are included in Net Gain (Loss) on the Fund's Statement of Operations. |
The composition of credit quality ratings as a percentage of net assets is as follows (Unaudited): |
U.S. Government and U.S. Government Agency Obligations | 0.4% |
AAA,AA,A | 8.1% |
BBB | 12.7% |
BB | 5.1% |
B | 13.1% |
CCC,CC,C | 5.4% |
D | 0.3% |
Not Rated | 11.0% |
Equities | 37.8% |
Short-Term Investments and Net Other Assets | 6.1% |
| 100.0% |
We have used ratings from Moody's Investors Service, Inc. Where Moody's® ratings are not available, we have used S&P® ratings. All ratings are as of the date indicated and do not reflect subsequent changes. |
See accompanying notes which are an integral part of the financial statements.
Annual Report
Statement of Assets and Liabilities
| July 31, 2012 |
| | |
Assets | | |
Investment in securities, at value (including securities loaned of $24,897,474) - See accompanying schedule: Unaffiliated issuers (cost $2,341,043,325) | $ 2,517,773,205 | |
Fidelity Central Funds (cost $215,115,781) | 215,115,781 | |
Other affiliated issuers (cost $2,800,000) | 2,818,000 | |
Total Investments (cost $2,558,959,106) | | $ 2,735,706,986 |
Foreign currency held at value (cost $21,986) | | 21,986 |
Receivable for investments sold | | 3,946,789 |
Receivable for fund shares sold | | 15,938,587 |
Dividends receivable | | 1,674,674 |
Interest receivable | | 14,981,277 |
Distributions receivable from Fidelity Central Funds | | 33,415 |
Other receivables | | 6,563 |
Total assets | | 2,772,310,277 |
| | |
Liabilities | | |
Payable to custodian bank | $ 9,145 | |
Payable for investments purchased
Regular delivery | 51,958,020 | |
Delayed delivery | 2,832,500 | |
Payable for fund shares redeemed | 2,288,350 | |
Accrued management fee | 1,214,069 | |
Distribution and service plan fees payable | 73,831 | |
Other affiliated payables | 618,059 | |
Other payables and accrued expenses | 81,412 | |
Collateral on securities loaned, at value | 27,376,007 | |
Total liabilities | | 86,451,393 |
| | |
Net Assets | | $ 2,685,858,884 |
Net Assets consist of: | | |
Paid in capital | | $ 2,450,354,786 |
Undistributed net investment income | | 27,923,018 |
Accumulated undistributed net realized gain (loss) on investments and foreign currency transactions | | 30,806,996 |
Net unrealized appreciation (depreciation) on investments and assets and liabilities in foreign currencies | | 176,774,084 |
Net Assets | | $ 2,685,858,884 |
See accompanying notes which are an integral part of the financial statements.
Annual Report
Statement of Assets and Liabilities - continued
| July 31, 2012 |
| | |
Calculation of Maximum Offering Price Class A:
Net Asset Value and redemption price per share ($137,351,550 ÷ 12,199,652 shares) | | $ 11.26 |
| | |
Maximum offering price per share (100/96.00 of $11.26) | | $ 11.73 |
Class T:
Net Asset Value and redemption price per share ($26,142,720 ÷ 2,321,952 shares) | | $ 11.26 |
| | |
Maximum offering price per share (100/96.00 of $11.26) | | $ 11.73 |
Class C:
Net Asset Value and offering price per share ($52,780,495 ÷ 4,712,640 shares)A | | $ 11.20 |
| | |
Real Estate Income:
Net Asset Value, offering price and redemption price per share ($2,252,148,798 ÷ 199,406,118 shares) | | $ 11.29 |
| | |
Institutional Class:
Net Asset Value, offering price and redemption price per share ($217,435,321 ÷ 19,282,368 shares) | | $ 11.28 |
A Redemption price per share is equal to net asset value less any applicable contingent deferred sales charge.
See accompanying notes which are an integral part of the financial statements.
Annual Report
Financial Statements - continued
Statement of Operations
| Year ended July 31, 2012 |
| | |
Investment Income | | |
Dividends | | $ 39,342,877 |
Interest | | 85,494,070 |
Income from Fidelity Central Funds | | 301,266 |
Total income | | 125,138,213 |
| | |
Expenses | | |
Management fee | $ 11,636,191 | |
Transfer agent fees | 5,685,427 | |
Distribution and service plan fees | 559,397 | |
Accounting and security lending fees | 810,483 | |
Custodian fees and expenses | 32,894 | |
Independent trustees' compensation | 13,278 | |
Registration fees | 180,034 | |
Audit | 157,626 | |
Legal | 5,742 | |
Miscellaneous | 18,376 | |
Total expenses before reductions | 19,099,448 | |
Expense reductions | (42,648) | 19,056,800 |
Net investment income (loss) | | 106,081,413 |
Realized and Unrealized Gain (Loss) Net realized gain (loss) on: | | |
Investment securities: | | |
Unaffiliated issuers | 46,636,084 | |
Foreign currency transactions | (14,625) | |
Total net realized gain (loss) | | 46,621,459 |
Change in net unrealized appreciation (depreciation) on: Investment securities | 99,189,660 | |
Assets and liabilities in foreign currencies | 1,230 | |
Total change in net unrealized appreciation (depreciation) | | 99,190,890 |
Net gain (loss) | | 145,812,349 |
Net increase (decrease) in net assets resulting from operations | | $ 251,893,762 |
See accompanying notes which are an integral part of the financial statements.
Annual Report
Statement of Changes in Net Assets
| Year ended
July 31,
2012 | Year ended
July 31,
2011 |
Increase (Decrease) in Net Assets | | |
Operations | | |
Net investment income (loss) | $ 106,081,413 | $ 75,045,871 |
Net realized gain (loss) | 46,621,459 | 26,474,317 |
Change in net unrealized appreciation (depreciation) | 99,190,890 | 63,154,318 |
Net increase (decrease) in net assets resulting
from operations | 251,893,762 | 164,674,506 |
Distributions to shareholders from net investment income | (98,117,663) | (66,688,371) |
Distributions to shareholders from net realized gain | (16,498,521) | - |
Total distributions | (114,616,184) | (66,688,371) |
Share transactions - net increase (decrease) | 755,485,569 | 655,640,999 |
Redemption fees | 286,688 | 331,332 |
Total increase (decrease) in net assets | 893,049,835 | 753,958,466 |
| | |
Net Assets | | |
Beginning of period | 1,792,809,049 | 1,038,850,583 |
End of period (including undistributed net investment income of $27,923,018 and undistributed net investment income of $20,642,579, respectively) | $ 2,685,858,884 | $ 1,792,809,049 |
See accompanying notes which are an integral part of the financial statements.
Annual Report
Financial Highlights - Class A
Years ended July 31, | 2012 | 2011 | 2010 H |
Selected Per-Share Data | | | |
Net asset value, beginning of period | $ 10.73 | $ 9.94 | $ 9.95 |
Income from Investment Operations | | | |
Net investment income (loss) E | .52 | .53 | .18 |
Net realized and unrealized gain (loss) | .61 | .76 | (.04) |
Total from investment operations | 1.13 | 1.29 | .14 |
Distributions from net investment income | (.51) | (.50) | (.15) |
Distributions from net realized gain | (.10) | - | - |
Total distributions | (.60) K | (.50) | (.15) |
Redemption fees added to paid in capital E, J | - | - | - |
Net asset value, end of period | $ 11.26 | $ 10.73 | $ 9.94 |
Total Return B,C,D | 11.24% | 13.27% | 1.46% |
Ratios to Average Net Assets F,I | | | |
Expenses before reductions | 1.12% | 1.13% | 1.09% A |
Expenses net of fee waivers, if any | 1.12% | 1.13% | 1.09% A |
Expenses net of all reductions | 1.11% | 1.12% | 1.09% A |
Net investment income (loss) | 4.89% | 5.00% | 6.23% A |
Supplemental Data | | | |
Net assets, end of period (000 omitted) | $ 137,352 | $ 60,283 | $ 3,830 |
Portfolio turnover rate G | 27% | 25% | 28% |
A Annualized
B Total returns for periods of less than one year are not annualized.
C Total returns would have been lower if certain expenses had not been reduced during the applicable periods shown.
D Total returns do not include the effect of the sales charges.
E Calculated based on average shares outstanding during the period.
F Fees and expenses of any underlying Fidelity Central Funds are not included in the Fund's expense ratio. The Fund indirectly bears its proportionate share of the expenses of any underlying Fidelity Central Funds.
G Amount does not include the portfolio activity of any underlying Fidelity Central Funds.
H For the period April 14, 2010 (commencement of sale of shares) to July 31, 2010.
I Expense ratios reflect operating expenses of the class. Expenses before reductions do not reflect amounts reimbursed by the investment adviser or reductions from brokerage service arrangements or reductions from other expense offset arrangements and do not represent the amount paid by the class during periods when reimbursements or reductions occur. Expense ratios before reductions for start-up periods may not be representative of longer-term operating periods. Expenses net of fee waivers reflect expenses after reimbursement by the investment adviser but prior to reductions from brokerage service arrangements or other expense offset arrangements. Expenses net of all reductions represent the net expenses paid by the class.
J Amount represents less than $.01 per share.
K Total distributions of $.60 per share is comprised of distributions from net investment income of $.505 and distributions from net realized gain of $.097 per share.
See accompanying notes which are an integral part of the financial statements.
Annual Report
Financial Highlights - Class T
Years ended July 31, | 2012 | 2011 | 2010 H |
Selected Per-Share Data | | | |
Net asset value, beginning of period | $ 10.72 | $ 9.94 | $ 9.95 |
Income from Investment Operations | | | |
Net investment income (loss) E | .52 | .52 | .17 |
Net realized and unrealized gain (loss) | .62 | .76 | (.03) |
Total from investment operations | 1.14 | 1.28 | .14 |
Distributions from net investment income | (.50) | (.50) | (.15) |
Distributions from net realized gain | (.10) | - | - |
Total distributions | (.60) | (.50) | (.15) |
Redemption fees added to paid in capital E, J | - | - | - |
Net asset value, end of period | $ 11.26 | $ 10.72 | $ 9.94 |
Total Return B,C,D | 11.33% | 13.11% | 1.45% |
Ratios to Average Net Assets F,I | | | |
Expenses before reductions | 1.11% | 1.16% | 1.17% A |
Expenses net of fee waivers, if any | 1.11% | 1.16% | 1.17% A |
Expenses net of all reductions | 1.11% | 1.16% | 1.17% A |
Net investment income (loss) | 4.90% | 4.96% | 5.92% A |
Supplemental Data | | | |
Net assets, end of period (000 omitted) | $ 26,143 | $ 7,626 | $ 862 |
Portfolio turnover rate G | 27% | 25% | 28% |
A Annualized
B Total returns for periods of less than one year are not annualized.
C Total returns would have been lower if certain expenses had not been reduced during the applicable periods shown.
D Total returns do not include the effect of the sales charges.
E Calculated based on average shares outstanding during the period.
F Fees and expenses of any underlying Fidelity Central Funds are not included in the Fund's expense ratio. The Fund indirectly bears its proportionate share of the expenses of any underlying Fidelity Central Funds.
G Amount does not include the portfolio activity of any underlying Fidelity Central Funds.
H For the period April 14, 2010 (commencement of sale of shares) to July 31, 2010.
I Expense ratios reflect operating expenses of the class. Expenses before reductions do not reflect amounts reimbursed by the investment adviser or reductions from brokerage service arrangements or reductions from other expense offset arrangements and do not represent the amount paid by the class during periods when reimbursements or reductions occur. Expense ratios before reductions for start-up periods may not be representative of longer-term operating periods. Expenses net of fee waivers reflect expenses after reimbursement by the investment adviser but prior to reductions from brokerage service arrangements or other expense offset arrangements. Expenses net of all reductions represent the net expenses paid by the class.
J Amount represents less than $.01 per share.
See accompanying notes which are an integral part of the financial statements.
Annual Report
Financial Highlights - Class C
Years ended July 31, | 2012 | 2011 | 2010 H |
Selected Per-Share Data | | | |
Net asset value, beginning of period | $ 10.67 | $ 9.93 | $ 9.95 |
Income from Investment Operations | | | |
Net investment income (loss) E | .44 | .45 | .15 |
Net realized and unrealized gain (loss) | .62 | .74 | (.03) |
Total from investment operations | 1.06 | 1.19 | .12 |
Distributions from net investment income | (.43) | (.45) | (.14) |
Distributions from net realized gain | (.10) | - | - |
Total distributions | (.53) | (.45) | (.14) |
Redemption fees added to paid in capital E, J | - | - | - |
Net asset value, end of period | $ 11.20 | $ 10.67 | $ 9.93 |
Total Return B,C,D | 10.49% | 12.25% | 1.29% |
Ratios to Average Net Assets F,I | | | |
Expenses before reductions | 1.87% | 1.89% | 1.86% A |
Expenses net of fee waivers, if any | 1.87% | 1.89% | 1.86% A |
Expenses net of all reductions | 1.87% | 1.89% | 1.86% A |
Net investment income (loss) | 4.14% | 4.23% | 5.21% A |
Supplemental Data | | | |
Net assets, end of period (000 omitted) | $ 52,780 | $ 21,555 | $ 836 |
Portfolio turnover rate G | 27% | 25% | 28% |
A Annualized
B Total returns for periods of less than one year are not annualized.
C Total returns would have been lower if certain expenses had not been reduced during the applicable periods shown.
D Total returns do not include the effect of the contingent deferred sales charge.
E Calculated based on average shares outstanding during the period.
F Fees and expenses of any underlying Fidelity Central Funds are not included in the Fund's expense ratio. The Fund indirectly bears its proportionate share of the expenses of any underlying Fidelity Central Funds.
G Amount does not include the portfolio activity of any underlying Fidelity Central Funds.
H For the period April 14, 2010 (commencement of sale of shares) to July 31, 2010.
I Expense ratios reflect operating expenses of the class. Expenses before reductions do not reflect amounts reimbursed by the investment adviser or reductions from brokerage service arrangements or reductions from other expense offset arrangements and do not represent the amount paid by the class during periods when reimbursements or reductions occur. Expense ratios before reductions for start-up periods may not be representative of longer-term operating periods. Expenses net of fee waivers reflect expenses after reimbursement by the investment adviser but prior to reductions from brokerage service arrangements or other expense offset arrangements. Expenses net of all reductions represent the net expenses paid by the class.
J Amount represents less than $.01 per share.
See accompanying notes which are an integral part of the financial statements.
Annual Report
Financial Highlights - Real Estate Income
Years ended July 31, | 2012 | 2011 | 2010 | 2009 | 2008 |
Selected Per-Share Data | | | | | |
Net asset value, beginning of period | $ 10.75 | $ 9.95 | $ 8.21 | $ 9.43 | $ 11.22 |
Income from Investment Operations | | | | | |
Net investment income (loss) B | .54 | .55 | .53 | .54 | .59 |
Net realized and unrealized gain (loss) | .62 | .76 | 1.73 | (1.27) | (1.48) |
Total from investment operations | 1.16 | 1.31 | 2.26 | (.73) | (.89) |
Distributions from net investment income | (.52) | (.51) | (.52) | (.50) | (.66) |
Distributions from net realized gain | (.10) | - | - | - | (.24) |
Total distributions | (.62) | (.51) | (.52) | (.50) | (.90) |
Redemption fees added to paid in capital B | - F | - F | - F | .01 | - F |
Net asset value, end of period | $ 11.29 | $ 10.75 | $ 9.95 | $ 8.21 | $ 9.43 |
Total Return A | 11.50% | 13.41% | 28.29% | (6.92)% | (8.43)% |
Ratios to Average Net Assets C,E |
Expenses before reductions | .90% | .92% | .97% | 1.00% | .94% |
Expenses net of fee waivers, if any | .89% | .92% | .96% | 1.00% | .94% |
Expenses net of all reductions | .89% | .92% | .96% | 1.00% | .94% |
Net investment income (loss) | 5.12% | 5.21% | 5.60% | 7.15% | 5.77% |
Supplemental Data | | | | | |
Net assets, end of period (000 omitted) | $ 2,252,149 | $ 1,660,063 | $ 1,030,393 | $ 463,269 | $ 393,147 |
Portfolio turnover rate D | 27% | 25% | 28% | 47% | 32% |
A Total returns would have been lower if certain expenses had not been reduced during the applicable periods shown.
B Calculated based on average shares outstanding during the period.
C Fees and expenses of any underlying Fidelity Central Funds are not included in the Fund's expense ratio. The Fund indirectly bears its proportionate share of the expenses of any underlying Fidelity Central Funds.
D Amount does not include the portfolio activity of any underlying Fidelity Central Funds.
E Expense ratios reflect operating expenses of the class. Expenses before reductions do not reflect amounts reimbursed by the investment adviser or reductions from brokerage service arrangements or reductions from other expense offset arrangements and do not represent the amount paid by the class during periods when reimbursements or reductions occur. Expenses net of fee waivers reflect expenses after reimbursement by the investment adviser but prior to reductions from brokerage service arrangements or other expense offset arrangements. Expenses net of all reductions represent the net expenses paid by the class.
F Amount represents less than $.01 per share.
See accompanying notes which are an integral part of the financial statements.
Annual Report
Financial Highlights - Institutional Class
Years ended July 31, | 2012 | 2011 | 2010 G |
Selected Per-Share Data | | | |
Net asset value, beginning of period | $ 10.74 | $ 9.95 | $ 9.95 |
Income from Investment Operations | | | |
Net investment income (loss) D | .55 | .55 | .19 |
Net realized and unrealized gain (loss) | .62 | .76 | (.04) |
Total from investment operations | 1.17 | 1.31 | .15 |
Distributions from net investment income | (.53) | (.52) | (.15) |
Distributions from net realized gain | (.10) | - | - |
Total distributions | (.63) | (.52) | (.15) |
Redemption fees added to paid in capital D,I | - | - | - |
Net asset value, end of period | $ 11.28 | $ 10.74 | $ 9.95 |
Total Return B,C | 11.62% | 13.44% | 1.58% |
Ratios to Average Net Assets E,H | | | |
Expenses before reductions | .84% | .89% | .85% A |
Expenses net of fee waivers, if any | .84% | .89% | .85% A |
Expenses net of all reductions | .84% | .89% | .85% A |
Net investment income (loss) | 5.17% | 5.24% | 6.70% A |
Supplemental Data | | | |
Net assets, end of period (000 omitted) | $ 217,435 | $ 43,282 | $ 2,930 |
Portfolio turnover rate F | 27% | 25% | 28% |
A Annualized
B Total returns for periods of less than one year are not annualized.
C Total returns would have been lower if certain expenses had not been reduced during the applicable periods shown.
D Calculated based on average shares outstanding during the period.
E Fees and expenses of any underlying Fidelity Central Funds are not included in the Fund's expense ratio. The Fund indirectly bears its proportionate share of the expenses of any underlying Fidelity Central Funds.
F Amount does not include the portfolio activity of any underlying Fidelity Central Funds.
G For the period April 14, 2010 (commencement of sale of shares) to July 31, 2010.
H Expense ratios reflect operating expenses of the class. Expenses before reductions do not reflect amounts reimbursed by the investment adviser or reductions from brokerage service arrangements or reductions from other expense offset arrangements and do not represent the amount paid by the class during periods when reimbursements or reductions occur. Expense ratios before reductions for start-up periods may not be representative of longer-term operating periods. Expenses net of fee waivers reflect expenses after reimbursement by the investment adviser but prior to reductions from brokerage service arrangements or other expense offset arrangements. Expenses net of all reductions represent the net expenses paid by the class.
I Amount represents less than $.01 per share.
See accompanying notes which are an integral part of the financial statements.
Annual Report
Notes to Financial Statements
For the period ended July 31, 2012
1. Organization.
Fidelity Real Estate Income Fund (the Fund) is a fund of Fidelity Securities Fund (the Trust) and is authorized to issue an unlimited number of shares. The Trust is registered under the Investment Company Act of 1940, as amended (the 1940 Act), as an open-end management investment company organized as a Massachusetts business trust. The Fund offers Class A, Class T, Class C, Real Estate Income and Institutional Class shares, each of which has equal rights as to assets and voting privileges. Each class has exclusive voting rights with respect to matters that affect that class. Investment income, realized and unrealized capital gains and losses, the common expenses of the Fund, and certain fund-level expense reductions, if any, are allocated on a pro-rata basis to each class based on the relative net assets of each class to the total net assets of the Fund. Each class differs with respect to transfer agent and distribution and service plan fees incurred. Certain expense reductions may also differ by class.
2. Investments in Fidelity Central Funds.
The Fund invests in Fidelity Central Funds, which are open-end investment companies available only to other investment companies and accounts managed by Fidelity Management & Research Company (FMR) and its affiliates. The Fund's Schedule of Investments lists each of the Fidelity Central Funds held as of period end, if any, as an investment of the Fund, but does not include the underlying holdings of each Fidelity Central Fund. As an Investing Fund, the Fund indirectly bears its proportionate share of the expenses of the underlying Fidelity Central Funds.
The Money Market Central Funds seek preservation of capital and current income and are managed by Fidelity Investments Money Management, Inc. (FIMM), an affiliate of FMR.
A complete unaudited list of holdings for each Fidelity Central Fund is available upon request or at the Securities and Exchange Commission (the SEC) web site at www.sec.gov. In addition, the financial statements of the Fidelity Central Funds, which are not covered by the Fund's Report of Independent Registered Public Accounting Firm, are available on the SEC web site or upon request.
3. Significant Accounting Policies.
The financial statements have been prepared in conformity with accounting principles generally accepted in the United States of America (GAAP), which require management to make certain estimates and assumptions at the date of the financial statements. Actual results could differ from those estimates. Subsequent events, if any, through the date that the financial statements were issued have been evaluated in the preparation of the financial statements. The following summarizes the significant accounting policies of the Fund:
Annual Report
Notes to Financial Statements - continued
3. Significant Accounting Policies - continued
Security Valuation. Investments are valued as of 4:00 p.m. Eastern time on the last calendar day of the period. In accordance with valuation policies and procedures approved by the Board of Trustees (the Board), the Fund attempts to obtain prices from one or more third party pricing vendor or broker to value its investments. When current market prices, quotations or rates are not readily available or reliable, securities will be fair valued in good faith by the FMR Fair Value Committee (the Committee), in accordance with procedures adopted by the Fund's Board. Factors used in determining fair value vary by security type and may include market or security specific events, changes in interest rates and credit quality. The frequency with which these procedures are used cannot be predicted and they may be utilized to a significant extent. The Committee oversees the Fund's valuation policies and procedures and is responsible for approving and reporting to the Board all fair value determinations.
The Fund categorizes the inputs to valuation techniques used to value its investments into a disclosure hierarchy consisting of three levels as shown below:
Level 1 - quoted prices in active markets for identical investments
Level 2 - other significant observable inputs (including quoted prices for similar investments, interest rates, prepayment speeds, etc.)
Level 3 - unobservable inputs (including the Fund's own assumptions based on the best information available)
Valuation techniques used to value the Fund's investments by major category are as follows:
Equity securities, including restricted securities, for which market quotations are readily available, are valued at the last reported sale price or official closing price as reported by a third party pricing vendor on the primary market or exchange on which they are traded and are categorized as Level 1 in the hierarchy. In the event there were no sales during the day or closing prices are not available, securities are valued at the last quoted bid price or may be valued using the last available price and are generally categorized as Level 2 in the hierarchy. For foreign equity securities, when significant market or security specific events arise, comparisons to the valuation of American Depositary Receipts (ADRs), futures contracts, Exchange-Traded Funds (ETFs) and certain indexes as well as quoted prices for similar securities are used and are categorized as Level 2 in the hierarchy. Utilizing these techniques may result in transfers between Level 1 and Level 2. For restricted equity securities and private placements where observable inputs are limited, assumptions about market activity and risk are used and these securities are categorized as Level 3 in the hierarchy.
Annual Report
3. Significant Accounting Policies - continued
Security Valuation - continued
Debt securities, including restricted securities, are valued based on evaluated prices received from third party pricing vendors or from brokers who make markets in such securities. For corporate bonds, floating rate loans and preferred securities, pricing vendors utilize matrix pricing which considers yield or price of bonds of comparable quality, coupon, maturity and type as well as broker-supplied prices and are generally categorized as Level 2 in the hierarchy. For asset backed securities, collateralized mortgage obligations and commercial mortgage securities, pricing vendors utilize matrix pricing which considers prepayment speed assumptions, attributes of the collateral, yield or price of bonds of comparable quality, coupon, maturity and type as well as broker-supplied prices and, accordingly, such securities are generally categorized as Level 2 in the hierarchy. Independent prices obtained from a single source or broker are evaluated by management and may be categorized as Level 3 within the fair value hierarchy. When independent prices are unavailable or unreliable, debt securities may be valued utilizing pricing methodologies which consider similar factors that would be used by third party pricing vendors. These are generally categorized as Level 2 in the hierarchy but may be Level 3 depending on the circumstances.
Investments in open-end mutual funds, including the Fidelity Central Funds, are valued at their closing net asset value each business day and are categorized as Level 1 in the hierarchy.
Annual Report
Notes to Financial Statements - continued
3. Significant Accounting Policies - continued
Security Valuation - continued
The following provides information on Level 3 securities held by the Fund that were valued at period end based on unobservable inputs. These amounts exclude valuations provided by a broker.
Asset Type | Fair Value at
07/31/12 | Valuation
Technique(s) | Unobservable
Input | Range | Weighted
Average |
Asset-Backed Securities | $ 3,770,142 | Discounted cash flow | Internal rate of return | 20% | 20% |
| Discounted cash flow | Yield | 8.5% - 15.8% | 10.87% |
| | Market comparable | Spread | 4.75% | 4.75% |
Collateralized Mortgage Obligations | $ 800,642 | Discounted cash flow | Yield | 14% - 42% | 21% |
Commercial
MortgageSecurities | $ 9,977,496 | Discounted cash flow | Yield | 60% | 60% |
| Market comparable | Quoted price | $55 | $55 |
| Market comparable | Spread | 11.54% - 36.05% | 27% |
Common/ Preferred Stocks | $ 4,117,748 | Market comparable | Transaction price | $.001 - $.01 | $0.01 |
| Expected distribution | Recovery rate | 0% | 0% |
| Adjusted book value | Book value
multiple | 1.0 | 1.0 |
Corporate Bonds | $ 2,218,279 | Discounted cash flow | Constant
prepayment rate | 35% | 35% |
| | Expected distribution | Recovery rate | 0% | 0% |
Floating Rate Loans | $ 13,228,477 | Discounted cash flow | Yield | 9.6% - 9.75% | 9.65% |
Preferred
Securities | - | Expected distribution | Recovery rate | 0% | 0% |
For the unobservable inputs listed in the table above, a significant increase in yields, spreads, internal rates of return or constant prepayment rates could result in a significant decrease to the fair value measurement. A significant increase in estimated recovery rates, quoted prices, transactions prices or book value multiples would result in a significant increase to the fair value measurement.
Changes in valuation techniques may result in transfers in or out of an assigned level within the disclosure hierarchy. The aggregate value of investments by input level, as of July 31, 2012, as well as a roll forward of Level 3 securities, is included at the end of the Fund's Schedule of Investments.
Annual Report
3. Significant Accounting Policies - continued
Foreign Currency Translation. The Fund may use foreign currency contracts to facilitate transactions in foreign-denominated securities. Gains and losses from these transactions may arise from changes in the value of the foreign currency or if the counterparties do not perform under the contracts' terms.
Foreign-denominated assets, including investment securities, and liabilities are translated into U.S. dollars at the exchange rates at period end. Purchases and sales of investment securities, income and dividends received and expenses denominated in foreign currencies are translated into U.S. dollars at the exchange rate in effect on the transaction date.
The effects of exchange rate fluctuations on investments are included with the net realized and unrealized gain (loss) on investment securities. Other foreign currency transactions resulting in realized and unrealized gain (loss) are disclosed separately.
Investment Transactions and Income. For financial reporting purposes, the Fund's investment holdings and NAV include trades executed through the end of the last business day of the period. The NAV per share for processing shareholder transactions is calculated as of the close of business of the New York Stock Exchange (NYSE), normally 4:00 p.m. Eastern time and includes trades executed through the end of the prior business day. Gains and losses on securities sold are determined on the basis of identified cost and may include proceeds received from litigation. Dividend income is recorded on the ex-dividend date, except for certain dividends from foreign securities where the ex-dividend date may have passed, which are recorded as soon as the Fund is informed of the ex-dividend date. Non-cash dividends included in dividend income, if any, are recorded at the fair market value of the securities received. Distributions received on securities that represent a return of capital or capital gain are recorded as a reduction of cost of investments and/or as a realized gain. The Fund estimates the components of distributions received that may be considered return of capital distributions or capital gain distributions. Interest income and distributions from the Fidelity Central Funds are accrued as earned. Interest income includes coupon interest and amortization of premium and accretion of discount on debt securities. For certain lower credit quality securitized assets that have contractual cash flows (for example, asset backed securities, collateralized mortgage obligations and commercial mortgage-backed securities), changes in estimated cash flows are periodically evaluated and the estimated yield is adjusted on a prospective basis over the remaining life of the security, resulting in increases or decreases to Interest Income in the accompanying Statement of Operations. Investment income is recorded net of foreign taxes withheld where recovery of such taxes is uncertain. Debt obligations may be placed on non-accrual status and related interest income may be reduced by ceasing current accruals and writing off interest receivables when the collection of all or a portion of interest has become doubtful based on consistently applied procedures. A debt obligation is removed from non-accrual status when the issuer resumes interest payments or when collectability of interest is reasonably assured.
Annual Report
Notes to Financial Statements - continued
3. Significant Accounting Policies - continued
Expenses. Expenses directly attributable to a fund are charged to that fund. Expenses attributable to more than one fund are allocated among the respective funds on the basis of relative net assets or other appropriate methods. Expense estimates are accrued in the period to which they relate and adjustments are made when actual amounts are known.
Income Tax Information and Distributions to Shareholders. Each year, the Fund intends to qualify as a regulated investment company under Subchapter M of the Internal Revenue Code, including distributing substantially all of its taxable income and realized gains. As a result, no provision for income taxes is required. As of July 31, 2012, the Fund did not have any unrecognized tax benefits in the financial statements; nor is the Fund aware of any tax positions for which it is reasonably possible that the total amounts of unrecognized tax benefits will significantly change in the next twelve months. The Fund files a U.S. federal tax return, in addition to state and local tax returns as required. A fund's federal income tax returns are subject to examination by the Internal Revenue Service (IRS) for a period of three fiscal years after they are filed. State and local tax returns may be subject to examination for an additional fiscal year depending on the jurisdiction. Foreign taxes are provided for based on the Fund's understanding of the tax rules and rates that exist in the foreign markets in which it invests.
Distributions are declared and recorded on the ex-dividend date. Income dividends and capital gain distributions are declared separately for each class. Income and capital gain distributions are determined in accordance with income tax regulations, which may differ from GAAP. In addition, the Fund claimed a portion of the payment made to redeeming shareholders as a distribution for income tax purposes.
Capital accounts within the financial statements are adjusted for permanent book-tax differences. These adjustments have no impact on net assets or the results of operations. Temporary book-tax differences will reverse in a subsequent period.
Book-tax differences are primarily due to equity-debt classifications, foreign currency transactions, passive foreign investment companies (PFIC), market discount, partnerships and losses deferred due to wash sales.
The federal tax cost of investment securities and unrealized appreciation (depreciation) as of period end were as follows:
Gross unrealized appreciation | $ 229,881,115 |
Gross unrealized depreciation | (57,864,464) |
Net unrealized appreciation (depreciation) on securities and other investments | $ 172,016,651 |
| |
Tax Cost | $ 2,563,690,335 |
Annual Report
3. Significant Accounting Policies - continued
Income Tax Information and Distributions to Shareholders - continued
The tax-based components of distributable earnings as of period end were as follows:
Undistributed ordinary income | $ 37,796,939 |
Undistributed long-term capital gain | $ 25,839,411 |
Net unrealized appreciation (depreciation) | $ 172,042,855 |
The tax character of distributions paid was as follows:
| July 31, 2012 | July 31, 2011 |
Ordinary Income | $ 98,117,663 | $ 66,688,371 |
Long-term Capital Gains | 16,498,521 | - |
Total | $ 114,616,184 | $ 66,688,371 |
Short-Term Trading (Redemption) Fees. Shares held by investors in the Fund less than 90 days are subject to a redemption fee equal to .75% of the net asset value of shares redeemed. All redemption fees, which reduce the proceeds of the shareholder redemption, are retained by the Fund and accounted for as an addition to paid in capital.
New Accounting Pronouncement. In December 2011, the Financial Accounting Standards Board issued Accounting Standard Update No. 2011-11, Disclosures about Offsetting Assets and Liabilities. The update creates new disclosure requirements requiring entities to disclose both gross and net information for derivatives and other financial instruments that are either offset in the Statement of Assets and Liabilities or subject to an enforceable master netting arrangement or similar agreement. The disclosure requirements are effective for interim and annual reporting periods beginning on or after January 1, 2013. Management is currently evaluating the impact of the update's adoption on the Fund's financial statement disclosures.
4. Operating Policies.
Delayed Delivery Transactions and When-Issued Securities. During the period, the Fund transacted in securities on a delayed delivery or when-issued basis. Payment and delivery may take place after the customary settlement period for that security. The price of the underlying securities and the date when the securities will be delivered and paid for are fixed at the time the transaction is negotiated. The securities purchased on a delayed delivery or when-issued basis are identified as such in the Fund's Schedule of Investments. The Fund may receive compensation for interest forgone in the purchase of a delayed delivery or when-issued security. With respect to purchase commitments, the Fund identifies securities as segregated in its records with a value at least equal to the amount of the commitment. Losses may arise due to changes in the value of the underlying securities or if the counterparty does not perform under the contract's terms, or if the issuer does not issue the securities due to political, economic, or other factors.
Annual Report
Notes to Financial Statements - continued
4. Operating Policies - continued
Restricted Securities. The Fund may invest in securities that are subject to legal or contractual restrictions on resale. These securities generally may be resold in transactions exempt from registration or to the public if the securities are registered. Disposal of these securities may involve time-consuming negotiations and expense, and prompt sale at an acceptable price may be difficult. Information regarding restricted securities is included at the end of the Fund's Schedule of Investments.
Loans and Other Direct Debt Instruments. The Fund invests in direct debt instruments which are interests in amounts owed to lenders by corporate or other borrowers. These instruments may be in the form of loans, trade claims or other receivables and may include standby financing commitments such as revolving credit facilities that obligate the Fund to supply additional cash to the borrower on demand. Loans may be acquired through assignment or participation, or may be made directly to a borrower. The Fund may be contractually obligated to receive approval from the agent bank and/or borrower prior to the sale of these loans.
5. Purchases and Sales of Investments.
Purchases and sales of securities, other than short-term securities and U.S. government securities, aggregated $1,228,544,087 and $513,304,249, respectively.
6. Fees and Other Transactions with Affiliates.
Management Fee. FMR and its affiliates provide the Fund with investment management related services for which the Fund pays a monthly management fee. The management fee is the sum of an individual fund fee rate that is based on an annual rate of .30% of the Fund's average net assets and an annualized group fee rate that averaged .26% during the period. The group fee rate is based upon the average net assets of all the mutual funds advised by FMR. The group fee rate decreases as assets under management increase and increases as assets under management decrease. For the period, the total annual management fee rate was .56% of the Fund's average net assets.
Distribution and Service Plan Fees. In accordance with Rule 12b-1 of the 1940 Act, the Fund has adopted separate Distribution and Service Plans for each class of shares. Certain classes pay Fidelity Distributors Corporation (FDC), an affiliate of FMR, separate Distribution and Service Fees, each of which is based on an annual percentage of each class' average net assets. In addition, FDC may pay financial intermediaries for selling shares of the Fund and providing shareholder support services. For the period, the Distribution and Service Fee rates, total fees and amounts retained by FDC were as follows:
Annual Report
6. Fees and Other Transactions with Affiliates - continued
Distribution and Service Plan Fees - continued
| Distribution
Fee | Service
Fee | Total Fees | Retained
by FDC |
Class A | -% | .25% | $ 218,203 | $ 8,211 |
Class T | -% | .25% | 36,778 | - |
Class C | .75% | .25% | 304,416 | 166,771 |
| | | $ 559,397 | $ 174,982 |
Sales Load. FDC may receive a front-end sales charge of up to 4.00% for selling Class A shares and Class T shares, some of which is paid to financial intermediaries for selling shares of the Fund. Depending on the holding period, FDC may receive contingent deferred sales charges levied on Class A, Class T and Class C redemptions. The deferred sales charges range from 1.00% for Class C shares, 1.00% for certain purchases of Class A shares and .25% for certain purchases of Class T shares.
For the period, sales charge amounts retained by FDC were as follows:
| Retained
by FDC |
Class A | $ 42,872 |
Class T | 8,681 |
Class C* | 7,056 |
| $ 58,609 |
* When Class C shares are initially sold, FDC pays commissions from its own resources to financial intermediaries through which the sales are made.
Transfer Agent Fees. Fidelity Investments Institutional Operations Company, Inc. (FIIOC), an affiliate of FMR, is the transfer, dividend disbursing and shareholder servicing agent for each class of the Fund. FIIOC receives account fees and asset-based fees that vary according to the account size and type of account of the shareholders of the respective classes of the Fund. FIIOC pays for typesetting, printing and mailing of shareholder reports, except proxy statements. For the period, transfer agent fees for each class were as follows:
| Amount | % of
Average
Net Assets |
Class A | $ 216,059 | .25 |
Class T | 35,949 | .24 |
Class C | 75,984 | .25 |
Real Estate Income | 5,073,026 | .28 |
Institutional Class | 284,409 | .22 |
| $ 5,685,427 | |
Annual Report
Notes to Financial Statements - continued
6. Fees and Other Transactions with Affiliates - continued
Accounting and Security Lending Fees. Fidelity Service Company, Inc. (FSC), an affiliate of FMR, maintains the Fund's accounting records. The accounting fee is based on the level of average net assets for each month. Under a separate contract, FSC administers the security lending program. The security lending fee is based on the number and duration of lending transactions.
Brokerage Commissions. The Fund placed a portion of its portfolio transactions with brokerage firms which are affiliates of the investment adviser. The commissions paid to these affiliated firms were $20,704 for the period.
7. Committed Line of Credit.
The Fund participates with other funds managed by FMR or an affiliate in a $4.25 billion credit facility (the "line of credit") to be utilized for temporary or emergency purposes to fund shareholder redemptions or for other short-term liquidity purposes. The Fund has agreed to pay commitment fees on its pro-rata portion of the line of credit, which amounted to $5,657 and is reflected in Miscellaneous expenses on the Statement of Operations. During the period, there were no borrowings on this line of credit.
8. Security Lending.
The Fund lends portfolio securities through a lending agent from time to time in order to earn additional income. For equity securities, a lending agent is used and may loan securities to certain qualified borrowers, including Fidelity Capital Markets (FCM), a broker-dealer affiliated with the Fund. On the settlement date of the loan, the Fund receives collateral (in the form of U.S. Treasury obligations, letters of credit and/or cash) against the loaned securities and maintains collateral in an amount not less than 100% of the market value of the loaned securities during the period of the loan. The market value of the loaned securities is determined at the close of business of the Fund and any additional required collateral is delivered to the Fund on the next business day. If the borrower defaults on its obligation to return the securities loaned because of insolvency or other reasons, a fund could experience delays and costs in recovering the securities loaned or in gaining access to the collateral. Any cash collateral received is invested in the Fidelity Securities Lending Cash Central Fund. The value of loaned securities and cash collateral at period end are disclosed on the Fund's Statement of Assets and Liabilities. Security lending income represents the income earned on investing cash collateral, less rebates paid to borrowers and any lending agent fees associated with the loan, plus any premium payments received for lending certain types of securities. Security lending income is presented in the Statement of Operations as a component of income from Fidelity Central Funds. Total security lending income during the period amounted to $73,576. During the period, there were no securities loaned to FCM.
Annual Report
9. Expense Reductions.
FMR voluntarily agreed to reimburse a portion of the Real Estate Income's operating expenses. During the period, this reimbursement reduced Real Estate Income's expenses by $31,380.
Many of the brokers with whom FMR places trades on behalf of the Fund provided services to the Fund in addition to trade execution. These services included payments of certain expenses on behalf of the Fund totaling $10,839 for the period. In addition, through arrangements with the Fund's custodian, credits realized as a result of uninvested cash balances were used to reduce the Fund's expenses. During the period, these credits reduced the Fund's custody expenses by $429.
10. Distributions to Shareholders.
Distributions to shareholders of each class were as follows:
Years ended July 31, | 2012 | 2011 |
From net investment income | | |
Class A | $ 3,854,404 | $ 1,154,662 |
Class T | 609,057 | 160,366 |
Class C | 1,139,599 | 358,357 |
Real Estate Income | 86,666,891 | 64,149,915 |
Institutional Class | 5,847,712 | 865,071 |
Total | $ 98,117,663 | $ 66,688,371 |
From net realized gain | | |
Class A | $ 603,452 | $ - |
Class T | 83,752 | - |
Class C | 208,802 | - |
Real Estate Income | 14,865,902 | - |
Institutional Class | 736,613 | - |
Total | $ 16,498,521 | $ - |
Annual Report
Notes to Financial Statements - continued
11. Share Transactions.
Transactions for each class of shares were as follows:
| Shares | Dollars |
Years ended July 31, | 2012 | 2011 | 2012 | 2011 |
Class A | | | | |
Shares sold | 8,276,874 | 5,544,292 | $ 88,010,262 | $ 58,675,375 |
Reinvestment of distributions | 333,613 | 75,836 | 3,436,744 | 799,911 |
Shares redeemed | (2,031,559) | (384,554) | (21,254,183) | (4,105,728) |
Net increase (decrease) | 6,578,928 | 5,235,574 | $ 70,192,823 | $ 55,369,558 |
Class T | | | | |
Shares sold | 1,725,200 | 662,414 | $ 18,422,015 | $ 7,018,853 |
Reinvestment of distributions | 49,495 | 12,671 | 511,986 | 132,964 |
Shares redeemed | (163,799) | (50,669) | (1,727,688) | (536,547) |
Net increase (decrease) | 1,610,896 | 624,416 | $ 17,206,313 | $ 6,615,270 |
Class C | | | | |
Shares sold | 3,117,808 | 2,030,776 | $ 33,302,251 | $ 21,411,850 |
Reinvestment of distributions | 110,126 | 29,432 | 1,128,377 | 309,638 |
Shares redeemed | (534,569) | (125,083) | (5,534,157) | (1,328,625) |
Net increase (decrease) | 2,693,365 | 1,935,125 | $ 28,896,471 | $ 20,392,863 |
Real Estate Income | | | | |
Shares sold | 90,720,847 | 89,725,340 | $ 959,813,942 | $ 943,333,748 |
Reinvestment of distributions | 8,913,831 | 5,601,468 | 91,762,119 | 58,273,356 |
Shares redeemed | (54,623,988) | (44,449,757) | (572,115,634) | (467,916,333) |
Net increase (decrease) | 45,010,690 | 50,877,051 | $ 479,460,427 | $ 533,690,771 |
Institutional Class | | | | |
Shares sold | 16,926,727 | 4,361,479 | $ 177,564,635 | $ 46,245,871 |
Reinvestment of distributions | 472,572 | 55,523 | 4,899,349 | 583,903 |
Shares redeemed | (2,146,783) | (681,623) | (22,734,449) | (7,257,237) |
Net increase (decrease) | 15,252,516 | 3,735,379 | $ 159,729,535 | $ 39,572,537 |
12. Other.
The Fund's organizational documents provide former and current trustees and officers with a limited indemnification against liabilities arising in connection with the performance of their duties to the Fund. In the normal course of business, the Fund may also enter into contracts that provide general indemnifications. The Fund's maximum exposure under these arrangements is unknown as this would be dependent on future claims that may be made against the Fund. The risk of material loss from such claims is considered remote.
Annual Report
To the Trustees of Fidelity Securities Fund and Shareholders of Fidelity Real Estate Income Fund:
We have audited the accompanying statement of assets and liabilities of Fidelity Real Estate Income Fund (the Fund), a fund of Fidelity Securities Fund, including the schedule of investments, as of July 31, 2012, and the related statement of operations for the year then ended, the statement of changes in net assets for each of the two years in the period then ended, and the financial highlights for each of the five years in the period then ended. These financial statements and financial highlights are the responsibility of the Fund's management. Our responsibility is to express an opinion on these financial statements and financial highlights based on our audits.
We conducted our audits in accordance with the standards of the Public Company Accounting Oversight Board (United States). Those standards require that we plan and perform the audit to obtain reasonable assurance about whether the financial statements and financial highlights are free of material misstatement. The Fund is not required to have, nor were we engaged to perform, an audit of its internal control over financial reporting. Our audits included consideration of internal control over financial reporting as a basis for designing audit procedures that are appropriate in the circumstances, but not for the purpose of expressing an opinion on the effectiveness of the Fund's internal control over financial reporting. Accordingly, we express no such opinion. An audit also includes examining, on a test basis, evidence supporting the amounts and disclosures in the financial statements, assessing the accounting principles used and significant estimates made by management, as well as evaluating the overall financial statement presentation. Our procedures included confirmation of securities owned as of July 31, 2012, by correspondence with the custodians and brokers; where replies were not received from brokers, we performed other auditing procedures. We believe that our audits provide a reasonable basis for our opinion.
In our opinion, the financial statements and financial highlights referred to above present fairly, in all material respects, the financial position of Fidelity Real Estate Income Fund as of July 31, 2012, the results of its operations for the year then ended, the changes in its net assets for each of the two years in the period then ended, and the financial highlights for each of the five years in the period then ended, in conformity with accounting principles generally accepted in the United States of America.
DELOITTE & TOUCHE LLP
Boston, Massachusetts
September 19, 2012
Annual Report
The Trustees, Members of the Advisory Board, and executive officers of the trust and fund, as applicable, are listed below. The Board of Trustees governs the fund and is responsible for protecting the interests of shareholders. The Trustees are experienced executives who meet periodically throughout the year to oversee the fund's activities, review contractual arrangements with companies that provide services to the fund, oversee management of the risks associated with such activities and contractual arrangements, and review the fund's performance. Except for James C. Curvey, each of the Trustees oversees 228 funds advised by FMR or an affiliate. Mr. Curvey oversees 435 funds advised by FMR or an affiliate.
The Trustees hold office without limit in time except that (a) any Trustee may resign; (b) any Trustee may be removed by written instrument, signed by at least two-thirds of the number of Trustees prior to such removal; (c) any Trustee who requests to be retired or who has become incapacitated by illness or injury may be retired by written instrument signed by a majority of the other Trustees; and (d) any Trustee may be removed at any special meeting of shareholders by a two-thirds vote of the outstanding voting securities of the trust. Each Trustee who is not an interested person (as defined in the 1940 Act) (Independent Trustee), shall retire not later than the last day of the calendar year in which his or her 75th birthday occurs. The Independent Trustees may waive this mandatory retirement age policy with respect to individual Trustees. The executive officers and Advisory Board Members hold office without limit in time, except that any officer and Advisory Board Member may resign or may be removed by a vote of a majority of the Trustees at any regular meeting or any special meeting of the Trustees. Except as indicated, each individual has held the office shown or other offices in the same company for the past five years.
Experience, Skills, Attributes, and Qualifications of the Fund's Trustees. The Governance and Nominating Committee has adopted a statement of policy that describes the experience, qualifications, attributes, and skills that are necessary and desirable for potential Independent Trustee candidates (Statement of Policy). The Board believes that each Trustee satisfied at the time he or she was initially elected or appointed a Trustee, and continues to satisfy, the standards contemplated by the Statement of Policy. The Governance and Nominating Committee also engages professional search firms to help identify potential Independent Trustee candidates who have the experience, qualifications, attributes, and skills consistent with the Statement of Policy. From time to time, additional criteria based on the composition and skills of the current Independent Trustees, as well as experience or skills that may be appropriate in light of future changes to board composition, business conditions, and regulatory or other developments, have also been considered by the professional search firms and the Governance and Nominating Committee. In addition, the Board takes into account the Trustees' commitment and participation in Board and committee meetings, as well as their leadership of standing and ad hoc committees throughout their tenure.
In determining that a particular Trustee was and continues to be qualified to serve as a Trustee, the Board has considered a variety of criteria, none of which, in isolation, was controlling. The Board believes that, collectively, the Trustees have balanced and diverse experience, qualifications, attributes, and skills, which allow the Board to operate effectively in governing the fund and protecting the interests of shareholders. Information about the specific experience, skills, attributes, and qualifications of each Trustee, which in each case led to the Board's conclusion that the Trustee should serve (or continue to serve) as a trustee of the fund, is provided below.
Annual Report
Board Structure and Oversight Function. James C. Curvey is an interested person (as defined in the 1940 Act) and currently serves as Chairman. The Trustees have determined that an interested Chairman is appropriate and benefits shareholders because an interested Chairman has a personal and professional stake in the quality and continuity of services provided to the fund. Independent Trustees exercise their informed business judgment to appoint an individual of their choosing to serve as Chairman, regardless of whether the Trustee happens to be independent or a member of management. The Independent Trustees have determined that they can act independently and effectively without having an Independent Trustee serve as Chairman and that a key structural component for assuring that they are in a position to do so is for the Independent Trustees to constitute a substantial majority for the Board. The Independent Trustees also regularly meet in executive session. Ned C. Lautenbach serves as Chairman of the Independent Trustees and as such (i) acts as a liaison between the Independent Trustees and management with respect to matters important to the Independent Trustees and (ii) with management prepares agendas for Board meetings.
Fidelity funds are overseen by different Boards of Trustees. The fund's Board oversees Fidelity's equity and high income funds and another Board oversees Fidelity's investment-grade bond, money market, and asset allocation funds. The asset allocation funds may invest in Fidelity funds overseen by the fund's Board. The use of separate Boards, each with its own committee structure, allows the Trustees of each group of Fidelity funds to focus on the unique issues of the funds they oversee, including common research, investment, and operational issues. On occasion, the separate Boards establish joint committees to address issues of overlapping consequences for the Fidelity funds overseen by each Board.
The Trustees operate using a system of committees to facilitate the timely and efficient consideration of all matters of importance to the Trustees, the fund, and fund shareholders and to facilitate compliance with legal and regulatory requirements and oversight of the fund's activities and associated risks. The Board, acting through its committees, has charged FMR and its affiliates with (i) identifying events or circumstances the occurrence of which could have demonstrably adverse effects on the fund's business and/or reputation; (ii) implementing processes and controls to lessen the possibility that such events or circumstances occur or to mitigate the effects of such events or circumstances if they do occur; and (iii) creating and maintaining a system designed to evaluate continuously business and market conditions in order to facilitate the identification and implementation processes described in (i) and (ii) above. Because the day-to-day operations and activities of the fund are carried out by or through FMR, its affiliates and other service providers, the fund's exposure to risks is mitigated but not eliminated by the processes overseen by the Trustees. While each of the Board's committees has responsibility for overseeing different aspects of the fund's activities, oversight is exercised primarily through the Operations, Audit, and Compliance Committees. In addition, the Independent Trustees have worked with FMR to enhance the Board's oversight of investment and financial risks, legal and regulatory risks, technology risks, and operational risks, including the development of additional risk reporting to the Board. For example, a working group comprised of Independent Trustees and FMR has worked and continues to work to review the Fidelity funds' valuation-related activities, reporting and risk management. Appropriate personnel, including but not limited to the fund's Chief Compliance Officer (CCO), FMR's internal auditor, the independent accountants, the fund's Treasurer and portfolio management personnel, make periodic reports to the Board's committees, as appropriate, including an annual review of FMR's risk management program for the Fidelity funds. The responsibilities of each standing committee, including their oversight responsibilities, are described further under "Standing Committees of the Fund's Trustees."
Annual Report
Trustees and Officers - continued
The fund's Statement of Additional Information (SAI) includes more information about the Trustees. To request a free copy, call Fidelity at 1-877-208-0098.
Interested Trustees*:
Correspondence intended for each Trustee who is an interested person may be sent to Fidelity Investments, 82 Devonshire Street, Boston, Massachusetts 02109.
Name, Age; Principal Occupations and Other Relevant Experience+ |
James C. Curvey (77) |
| Year of Election or Appointment: 2007 Mr. Curvey is Trustee and Chairman of the Board of Trustees of certain Trusts. Mr. Curvey also serves as Trustee (2007-present) of other investment companies advised by FMR. Mr. Curvey is a Director of Fidelity Investments Money Management, Inc. (2009-present), Director of Fidelity Research & Analysis Co. (2009-present) and Director of FMR and FMR Co., Inc. (2007-present). Mr. Curvey is also Vice Chairman (2007-present) and Director of FMR LLC. In addition, Mr. Curvey serves as an Overseer for the Boston Symphony Orchestra and a member of the Trustees of Villanova University. Previously, Mr. Curvey was the Vice Chairman (2006-2007) and Director (2000-2007) of FMR Corp. |
Ronald P. O'Hanley (55) |
| Year of Election or Appointment: 2011 Mr. O'Hanley is Director of FMR Co., Inc. (2010-present), Director of Fidelity Investments Money Management, Inc. (2010-present), Director of Fidelity Research & Analysis Company (2010-present), President of Fidelity Asset Management and Corporate Services and a member of Fidelity's Executive Committee (2010-present). Previously, Mr. O'Hanley served as President and Chief Executive Officer of BNY Mellon Asset Management (2007-2010). Mr. O'Hanley also served as Vice Chairman of Bank New York Mellon Corp. and a member of that firm's Executive Committee. Prior to the 2007 merger of The Bank of New York and Mellon Financial Corporation, he was Vice Chairman of Mellon Financial Corporation and President and Chief Executive Officer of Mellon Asset Management. He joined Mellon in February 1997. Mr. O'Hanley currently serves as Chairman of the Boston Public Library Foundation Board of Directors and sits on the Board of Directors of Beth Israel Deaconess Medical Center, the Board of Trustees of the Marine Biological Laboratory and the Advisory Board of the Maxwell School of Citizenship and Public Administration at Syracuse University. Mr. O'Hanley also chairs the Council on Asset Management for the Financial Services Roundtable and is a member of the Board of Directors of Institutional Investor's U.S. Institute. |
* Trustees have been determined to be "Interested Trustees" by virtue of, among other things, their affiliation with the trust or various entities under common control with FMR.
+ The information above includes each Trustee's principal occupation during the last five years and other information relating to the experience, attributes, and skills relevant to each Trustee's qualifications to serve as a Trustee, which led to the conclusion that each Trustee should serve as a Trustee for the fund.
Annual Report
Trustees and Officers - continued
Independent Trustees:
Correspondence intended for each Independent Trustee (that is, the Trustees other than the Interested Trustees) may be sent to Fidelity Investments, P.O. Box 55235, Boston, Massachusetts 02205-5235.
Name, Age; Principal Occupations and Other Relevant Experience+ |
Dennis J. Dirks (64) |
| Year of Election or Appointment: 2005 Prior to his retirement in May 2003, Mr. Dirks was Chief Operating Officer and a member of the Board of The Depository Trust & Clearing Corporation (DTCC). He also served as President, Chief Operating Officer, and Board member of The Depository Trust Company (DTC) and President and Board member of the National Securities Clearing Corporation (NSCC). In addition, Mr. Dirks served as Chief Executive Officer and Board member of the Government Securities Clearing Corporation, Chief Executive Officer and Board member of the Mortgage-Backed Securities Clearing Corporation, as a Trustee and a member of the Finance Committee of Manhattan College (2005-2008), and as a Trustee and a member of the Finance Committee of AHRC of Nassau County (2006-2008). Mr. Dirks is a member of the Independent Directors Council (IDC) Governing Council (2010-present) and Board of Directors for The Brookville Center for Children's Services, Inc. (2009-present). |
Alan J. Lacy (58) |
| Year of Election or Appointment: 2008 Mr. Lacy serves as Senior Adviser (2007-present) of Oak Hill Capital Partners, L.P. (private equity). Mr. Lacy also served as Chief Executive Officer (2000-2005) and Vice Chairman (2005-2006) of Sears Holdings Corporation and Sears, Roebuck and Co. (retail). In addition, Mr. Lacy serves as a member of the Board of Directors of Dave & Buster's Entertainment, Inc. (restaurant and entertainment complexes, 2010-present), Earth Fare, Inc. (retail grocery, 2012-present), The Hillman Companies, Inc. (hardware wholesalers, 2010-present), and Bristol-Myers Squibb Company (global pharmaceuticals, 2007-present). Mr. Lacy is a member of the Board of Trustees of The National Parks Conservation Association (2006-present). Previously, Mr. Lacy served as Chairman of the Board of Trustees of the National Parks Conservation Association (2008-2011) and as a member of the Board of Directors for the Western Union Company (global money transfer, 2006-2011). |
Ned C. Lautenbach (68) |
| Year of Election or Appointment: 2000 Mr. Lautenbach is Chairman of the Independent Trustees of the Equity and High Income Funds (2006-present). Mr. Lautenbach currently serves as the Lead Director of the Eaton Corporation Board of Directors (diversified industrial, 1997-present). Mr. Lautenbach is Chairman of the Board of Directors of the Philharmonic Center for the Arts in Naples, Florida (2012-present) and a member of the Council on Foreign Relations (1994-present). Previously, Mr. Lautenbach was a Partner/Advisory Partner at Clayton, Dubilier & Rice, LLC (private equity investment, 1998-2010), as well as a Director of Sony Corporation (2006-2007). |
Joseph Mauriello (67) |
| Year of Election or Appointment: 2008 Prior to his retirement in January 2006, Mr. Mauriello served in numerous senior management positions including Deputy Chairman and Chief Operating Officer (2004-2005), and Vice Chairman of Financial Services (2002-2004) of KPMG LLP US (professional services, 1965-2005). Mr. Mauriello currently serves as a member of the Board of Directors of XL Group plc. (global insurance and re-insurance, 2006-present). Previously, Mr. Mauriello served as a Director of the Hamilton Funds of the Bank of New York (2006-2007) and of Arcadia Resources Inc. (health care services and products, 2007-2012). |
Robert W. Selander (61) |
| Year of Election or Appointment: 2011 Previously, Mr. Selander served as a Member of the Advisory Board of Fidelity's Equity and High Income Funds (2011), Executive Vice Chairman (2010), Chief Executive Officer (2009-2010), and President and Chief Executive Officer (1997-2009) of Mastercard, Inc. |
Cornelia M. Small (68) |
| Year of Election or Appointment: 2005 Ms. Small is a member of the Board of Directors of the Teagle Foundation (2009-present). Ms. Small is also a member of the Investment Committee, and Chair (2008-present) and a member of the Board of Trustees of Smith College. In addition, Ms. Small serves on the Investment Committee of the Berkshire Taconic Community Foundation (2008-present). Previously, Ms. Small served as Chairperson of the Investment Committee (2002-2008) of Smith College. In addition, Ms. Small served as Chief Investment Officer, Director of Global Equity Investments, and a member of the Board of Directors of Scudder, Stevens & Clark and Scudder Kemper Investments. |
William S. Stavropoulos (73) |
| Year of Election or Appointment: 2002 Mr. Stavropoulos is Vice Chairman of the Independent Trustees of the Equity and High Income Funds (2006-present). Mr. Stavropoulos serves as President and Founder of the Michigan Baseball Foundation, the Great Lakes Loons (2007-present). Mr. Stavropoulos is Chairman Emeritus of the Board of Directors of The Dow Chemical Company, where he previously served in numerous senior management positions, including President, CEO (1995-2000; 2002-2004), Chairman of the Executive Committee (2000-2006), and as a member of the Board of Directors (1990-2006). Currently, Mr. Stavropoulos is Chairman of Univar (global distributor of commodity and specialty chemicals, 2010-present), a Director of Teradata Corporation (data warehousing and technology solutions, 2008-present), Chemical Financial Corporation, Maersk Inc. (industrial conglomerate), Tyco International, Inc. (multinational manufacturing and services, 2007-present), and a member of the Advisory Board for Metalmark Capital (private equity investment, 2005-present). Mr. Stavropoulos is a special advisor to Clayton, Dubilier & Rice, LLC (private equity investment). In addition, Mr. Stavropoulos is a member of the University of Notre Dame Advisory Council for the College of Science. |
David M. Thomas (63) |
| Year of Election or Appointment: 2008 Previously, Mr. Thomas served as Executive Chairman (2005-2006) and Chairman and Chief Executive Officer (2000-2005) of IMS Health, Inc. (pharmaceutical and healthcare information solutions). In addition, Mr. Thomas serves as a member of the Board of Directors of Fortune Brands, Inc. (consumer products), and Interpublic Group of Companies, Inc. (marketing communication, 2004-present). |
Michael E. Wiley (61) |
| Year of Election or Appointment: 2008 Mr. Wiley also serves as a Director of Asia Pacific Exploration Consolidated (international oil and gas exploration and production, 2008-present). Mr. Wiley serves as a Director of Tesoro Corporation (independent oil refiner and marketer, 2005-present), and a Director of Bill Barrett Corporation (exploration and production, 2005-present). In addition, Mr. Wiley also serves as a Director of Post Oak Bank (privately-held bank, 2004-present). Previously, Mr. Wiley served as a member of the Board of Trustees of the University of Tulsa (2000-2006; 2007-2010), as a Senior Energy Advisor of Katzenbach Partners, LLC (consulting, 2006-2007), as an Advisory Director of Riverstone Holdings (private investment), Chairman, President, and CEO of Baker Hughes, Inc. (oilfield services, 2000-2004), and as Director of Spinnaker Exploration Company (exploration and production, 2001-2005). |
Annual Report
+ The information above includes each Trustee's principal occupation during the last five years and other information relating to the experience, attributes, and skills relevant to each Trustee's qualifications to serve as a Trustee, which led to the conclusion that each Trustee should serve as a Trustee for the fund.
Advisory Board Members and Executive Officers:
Correspondence intended for David A. Rosow and Garnett A. Smith may be sent to Fidelity Investments, P.O. Box 55235, Boston, Massachusetts 02205-5235. Correspondence intended for each executive officer, Edward C. Johnson 3d, and Peter S. Lynch may be sent to Fidelity Investments, 82 Devonshire Street, Boston, Massachusetts 02109.
Name, Age; Principal Occupation |
Edward C. Johnson 3d (82) |
| Year of Election or Appointment: 2011 Member of the Advisory Board of Fidelity's Equity and High Income Funds. Mr. Johnson serves as Chief Executive Officer, Chairman, and a Director of FMR LLC, and also serves as Chairman and Director of FIL Limited. Previously, Mr. Johnson served as a Trustee and Chairman of the Board of certain Fidelity Trusts, Chairman and a Director of FMR, Chairman and a Director of FMR Co., Inc., and President of FMR LLC (2006-2007). |
Peter S. Lynch (68) |
| Year of Election or Appointment: 2003 Member of the Advisory Board of Fidelity's Equity and High Income Funds. Mr. Lynch is Vice Chairman and a Director of FMR and FMR Co., Inc. In addition, Mr. Lynch serves as a Trustee of Boston College and as the Chairman of the Inner-City Scholarship Fund. Previously, Mr. Lynch served on the Special Olympics International Board of Directors (1997-2006). |
David A. Rosow (69) |
| Year of Election or Appointment: 2012 Member of the Advisory Board of Fidelity's Equity and High Income Funds. Chairman and Chief Executive Officer of International Golf Group, Inc. (golf course development, 1990-present). Previously, Mr. Rosow served as Chairman and Chief Executive Officer of Rosow & Company, Inc. (private investment company, 1989-2011), a Lead Director of Hudson United Bancorp (2001-2006) and as a Director of TD Banknorth (1996-2006). In addition, Mr. Rosow is a member (2008-present) and President (2009-present) of the Town Council of Palm Beach, Florida. |
Garnett A. Smith (64) |
| Year of Election or Appointment: 2012 Member of the Advisory Board of Fidelity's Equity and High Income Funds. Prior to Mr. Smith's retirement, he served as Chairman and Chief Executive Officer of Inbrand Corp. (manufacturer of personal absorbent products, 1990-1997). He also served as President (1986-1990) of Inbrand Corp. Prior to his employment with Inbrand Corp., he was employed by a retail fabric chain and North Carolina National Bank. In addition, Mr. Smith is a board member of the Jackson Hole Land Trust (2009-present). |
Kenneth B. Robins (42) |
| Year of Election or Appointment: 2008 President and Treasurer of Fidelity's Equity and High Income Funds. Mr. Robins also serves as President and Treasurer (2010-present) and Assistant Treasurer (2009-present) of other Fidelity funds and is an employee of Fidelity Investments (2004-present). Previously, Mr. Robins served as Deputy Treasurer of the Fidelity funds (2005-2008) and Treasurer and Chief Financial Officer of The North Carolina Capital Management Trust: Cash and Term Portfolios (2006-2008). |
Brian B. Hogan (47) |
| Year of Election or Appointment: 2009 Vice President of Equity and High Income Funds. Mr. Hogan also serves as President of FMR's Equity Division (2009-present). Previously, Mr. Hogan served as Senior Vice President, Equity Research of FMR (2006-2009) and as a portfolio manager. |
Christopher S. Bartel (40) |
| Year of Election or Appointment: 2009 Vice President of Fidelity's Sector and Real Estate Equity Funds. Mr. Bartel also serves as a Director, President, and Chief Executive Officer of Fidelity Management & Research (Japan) Inc. (2012-present), a Director of Fidelity Management & Research (Hong Kong) (2012-present), and Senior Vice President of Global Equity Research (2010-present). Previously, Mr. Bartel served as Senior Vice President of Equity Research (2009-2010), Managing Director of Research (2006-2009), and an analyst and portfolio manager (2000-2006). |
Scott C. Goebel (44) |
| Year of Election or Appointment: 2008 Secretary and Chief Legal Officer (CLO) of the Fidelity funds. Mr. Goebel also serves as Secretary of Fidelity Investments Money Management, Inc. (FIMM) (2010-present) and Fidelity Research and Analysis Company (FRAC) (2010-present); Secretary and CLO of The North Carolina Capital Management Trust: Cash and Term Portfolios (2008-present); General Counsel, Secretary, and Senior Vice President of FMR (2008-present) and FMR Co., Inc. (2008-present); employed by FMR LLC or an affiliate (2001-present); Chief Legal Officer of Fidelity Management & Research (Hong Kong) Limited (2008-present) and Assistant Secretary of Fidelity Management & Research (Japan) Inc. (2008-present), and Fidelity Management & Research (U.K.) Inc. (2008-present). Previously, Mr. Goebel served as Assistant Secretary of FIMM (2008-2010), FRAC (2008-2010), and the Funds (2007-2008) and as Vice President and Secretary of Fidelity Distributors Corporation (FDC) (2005-2007). |
William C. Coffey (43) |
| Year of Election or Appointment: 2009 Assistant Secretary of Fidelity's Equity and High Income Funds. Mr. Coffey also serves as Senior Vice President and Deputy General Counsel of FMR LLC (2010-present), and is an employee of Fidelity Investments. Previously, Mr. Coffey served as Vice President and Associate General Counsel of FMR LLC (2005-2009). |
Elizabeth Paige Baumann (44) |
| Year of Election or Appointment: 2012 Anti-Money Laundering (AML) Officer of the Fidelity funds. Ms. Baumann also serves as AML Officer of The North Carolina Capital Management Trust: Cash and Term Portfolios (2012-present), Chief AML Officer of FMR LLC (2012-present), and is an employee of Fidelity Investments. Previously, Ms. Baumann served as Vice President and Deputy Anti-Money Laundering Officer (2007-2012). |
Christine Reynolds (53) |
| Year of Election or Appointment: 2008 Chief Financial Officer of the Fidelity funds. Ms. Reynolds became President of Fidelity Pricing and Cash Management Services (FPCMS) in August 2008. Ms. Reynolds served as Chief Operating Officer of FPCMS (2007-2008). Previously, Ms. Reynolds served as President, Treasurer, and Anti-Money Laundering officer of the Fidelity funds (2004-2007). |
Joseph A. Hanlon (44) |
| Year of Election or Appointment: 2012 Chief Compliance Officer of Fidelity's Equity and High Income Funds. Mr. Hanlon serves as Compliance Officer of FMR, FMR Co., Inc., Fidelity Investments Money Management, Inc. (FIMM), Fidelity Research and Analysis Company (FRAC), Fidelity Management & Research (Japan) Inc., Fidelity Management & Research (U.K.) Inc., Fidelity Management & Research (Hong Kong), and Strategic Advisers, Inc. (2009-present), as Senior Vice President of the Fidelity Asset Management Division (2009-present), and is an employee of Fidelity Investments. |
Joseph F. Zambello (55) |
| Year of Election or Appointment: 2011 Deputy Treasurer of the Fidelity funds. Mr. Zambello is an employee of Fidelity Investments. Previously, Mr. Zambello served as Vice President of FMR's Program Management Group (2009-2011) and Vice President of the Transfer Agent Oversight Group (2005-2009). |
Adrien E. Deberghes (44) |
| Year of Election or Appointment: 2008 Deputy Treasurer of Fidelity's Equity and High Income Funds. Mr. Deberghes also serves as Vice President (2011-present) and Assistant Treasurer (2010-present) of other Fidelity funds, and is an employee of Fidelity Investments (2008-present). Previously, Mr. Deberghes served as Senior Vice President of Mutual Fund Administration at State Street Corporation (2007-2008), Senior Director of Mutual Fund Administration at Investors Bank & Trust (2005-2007), and Director of Finance for Dunkin' Brands (2000-2005). |
Stephanie J. Dorsey (43) |
| Year of Election or Appointment: 2010 Assistant Treasurer of Fidelity's Equity and High Income Funds. Ms. Dorsey also serves as Deputy Treasurer of other Fidelity funds (2008-present) and is an employee of Fidelity Investments (2008-present). Previously, Ms. Dorsey served as Treasurer (2004-2008) of the JPMorgan Mutual Funds and Vice President (2004-2008) of JPMorgan Chase Bank. |
John R. Hebble (54) |
| Year of Election or Appointment: 2009 Assistant Treasurer of Fidelity's Equity and High Income Funds. Mr. Hebble also serves as President (2011-present), Treasurer, and Chief Financial Officer of The North Carolina Capital Management Trust: Cash and Term Portfolios (2008-present), President and Treasurer of other Fidelity funds (2008-present) and is an employee of Fidelity Investments. |
Gary W. Ryan (53) |
| Year of Election or Appointment: 2005 Assistant Treasurer of the Fidelity funds. Mr. Ryan is an employee of Fidelity Investments. Previously, Mr. Ryan served as Vice President of Fund Reporting in Fidelity Pricing and Cash Management Services (FPCMS) (1999-2005). |
Jonathan Davis (44) |
| Year of Election or Appointment: 2010 Assistant Treasurer of the Fidelity funds. Mr. Davis is also Assistant Treasurer of Fidelity Rutland Square Trust II and Fidelity Commonwealth Trust II. Mr. Davis is an employee of Fidelity Investments. Previously, Mr. Davis served as Vice President and Associate General Counsel of FMR LLC (2003-2010). |
Annual Report
The Board of Trustees of Fidelity Advisor Real Estate Income Fund voted to pay to shareholders of record at the opening of business, the following distributions per share derived from capital gains realized from sales of portfolio securities, and dividends derived from net investment income:
| Pay Date | Record Date | Dividends | Capital Gains |
Class A | 09/10/12 | 09/07/12 | $0.145 | $0.143 |
Class T | 09/10/12 | 09/07/12 | $0.145 | $0.143 |
Class C | 09/10/12 | 09/07/12 | $0.127 | $0.143 |
The fund hereby designates as a capital gain dividend with respect to the taxable year ended July 31,2012, $34,246,008, or, if subsequently determined to be different, the net capital gain of such year.
A total of 0.05% of the dividends distributed during the fiscal year was derived from interest on U.S. Government securities which is generally exempt from state income tax.
The fund will notify shareholders in January 2013 of amounts for use in preparing 2012 income tax returns.
Annual Report
Board Approval of Investment Advisory Contracts and Management Fees
Fidelity Real Estate Income Fund
Each year, the Board of Trustees, including the Independent Trustees (together, the Board), votes on the renewal of the management contract and sub-advisory agreements (together, the Advisory Contracts) for the fund. The Board, assisted by the advice of fund counsel and Independent Trustees' counsel, requests and considers a broad range of information relevant to the renewal of the Advisory Contracts throughout the year.
The Board meets regularly and, at each of its meetings, considers factors that are relevant to its annual consideration of the renewal of the fund's Advisory Contracts, including the services and support provided to the fund and its shareholders. The Board has established various standing committees, each composed of and chaired by Independent Trustees with varying backgrounds, to which the Board has assigned specific subject matter responsibilities in order to enhance effective decision-making by the Board. The Board, acting directly and through its Committees, requests and receives information concerning the annual consideration of the renewal of the fund's Advisory Contracts. The Board also meets as needed to consider matters specifically related to the Board's annual consideration of the renewal of Advisory Contracts. Members of the Board may also meet with trustees of other Fidelity funds through ad hoc joint committees to discuss certain matters relevant to the Fidelity funds.
At its July 2012 meeting, the Board of Trustees, including the Independent Trustees, unanimously determined to renew the fund's Advisory Contracts. In reaching its determination, the Board considered all factors it believed relevant, including (i) the nature, extent, and quality of the services to be provided to the fund and its shareholders (including the investment performance of the fund); (ii) the competitiveness of the fund's management fee and total expense ratio relative to peer funds; (iii) the total costs of the services to be provided by and the profits to be realized by Fidelity from its relationship with the fund; (iv) the extent to which economies of scale exist and would be realized as the fund grows; and (v) whether fee levels reflect these economies of scale, if any, for the benefit of fund shareholders.
In considering whether to renew the Advisory Contracts for the fund, the Board reached a determination, with the assistance of fund counsel and Independent Trustees' counsel and through the exercise of its business judgment, that the renewal of the Advisory Contracts is in the best interests of the fund and its shareholders and that the compensation payable under the Advisory Contracts is fair and reasonable. The Board's decision to renew the Advisory Contracts was not based on any single factor, but rather was based on a comprehensive consideration of all the information provided to the Board at its meetings throughout the year. The Board, in reaching its determination to renew the Advisory Contracts, is aware that shareholders in the fund have a broad range of investment choices available to them, including a wide choice among mutual funds offered by Fidelity's competitors, and that the fund's shareholders, who have the opportunity to review and weigh the disclosure provided by the fund in its prospectus and other public disclosures, have chosen to invest in this fund, managed by Fidelity.
Annual Report
Board Approval of Investment Advisory Contracts and
Management Fees - continued
Nature, Extent, and Quality of Services Provided. The Board considered the staffing within the investment adviser, FMR, and the sub-advisers (together, the Investment Advisers), including the backgrounds of the fund's investment personnel, and also considered the fund's investment objective, strategies, and related investment philosophy. The Independent Trustees also had discussions with senior management of Fidelity's investment operations and investment groups. The Board considered the structure of the portfolio manager compensation program and whether this structure provides appropriate incentives to act in the best interests of the fund.
Resources Dedicated to Investment Management and Support Services. The Board and the Fund Oversight and Research Committees reviewed the general qualifications and capabilities of the Investment Advisers' investment staff, including its size, education, experience, and resources, as well as the Investment Advisers' approach to recruiting, training, managing, and compensating investment personnel. The Board also noted that FMR has continued to increase the resources devoted to non-U.S. offices, including expansion of Fidelity's global investment organization. The Board noted that Fidelity's analysts have extensive resources, tools and capabilities that allow them to conduct sophisticated quantitative and fundamental analysis, as well as credit analysis of issuers, counterparties and guarantors. The Board also believes that Fidelity's investment professionals have sufficient access to global information and data so as to provide competitive investment results over time, and that those professionals also have access to sophisticated tools that permit them to assess portfolio construction and risk and performance attribution characteristics continuously, as well as to transmit new information and research conclusions rapidly around the world. Additionally, in its deliberations, the Board considered the Investment Advisers' trading and risk management capabilities and resources, which are an integral part of the investment management process.
Shareholder and Administrative Services. The Board considered (i) the nature, extent, quality, and cost of advisory, administrative, and shareholder services performed by the Investment Advisers and their affiliates under the Advisory Contracts and under separate agreements covering transfer agency, pricing and bookkeeping, and securities lending services for the fund; (ii) the nature and extent of the supervision of third party service providers, principally custodians and subcustodians; and (iii) the resources devoted to, and the record of compliance with, the fund's compliance policies and procedures. The Board also reviewed the allocation of fund brokerage, including allocations to brokers affiliated with the Investment Advisers, the use of brokerage commissions to pay fund expenses, and the use of "soft" commission dollars to pay for research services.
Annual Report
The Board noted that the growth of fund assets over time across the complex allows Fidelity to reinvest in the development of services designed to enhance the value or convenience of the Fidelity funds as investment vehicles. These services include 24-hour access to account information and market information through telephone representatives and over the Internet, investor education materials and asset allocation tools, and the expanded availability of Fidelity Investor Centers.
Investment in a Large Fund Family. The Board considered the benefits to shareholders of investing in a Fidelity fund, including the benefits of investing in a fund that is part of a large family of funds offering a variety of investment disciplines and providing a large variety of mutual fund investor services. The Board noted that Fidelity had taken, or had made recommendations that resulted in the Fidelity funds taking, a number of actions over the previous year that benefited particular funds, including (i) continuing to dedicate additional resources to investment research and support of the senior management team that oversees asset management; (ii) persisting in efforts to enhance Fidelity's research capabilities, in particular, international research; (iii) launching new funds and making other enhancements to meet client needs for global and income-oriented solutions; (iv) continuing to launch dedicated lower cost underlying funds to meet investment management's portfolio construction needs related to expanding underlying fund options, specifically for the Freedom Fund product lines; (v) adopting a "Stock Selector" sector neutral investment approach and employing a team of portfolio managers who are sector specialists to manage certain funds; (vi) rationalizing product lines and gaining increased efficiencies through the mergers of several funds into other funds; (vii) strengthening the Spartan Index Fund product line by adding new funds and/or new low-cost institutional share classes, restructuring fund expenses to accommodate new classes, and reducing investment minimums for certain classes of shares; (viii) modifying the eligibility criteria for Institutional Class shares to increase their appeal to government entities and charitable investors; and (ix) reducing certain transfer agent fee rates.
Investment Performance. The Board considered whether the fund has operated in accordance with its investment objective, as well as its record of compliance with its investment restrictions. It also reviewed the fund's absolute investment performance for each class, as well as the fund's relative investment performance for each class measured over multiple periods against (i) a proprietary custom index, and (ii) a peer group of mutual funds deemed appropriate by Fidelity and reviewed by the Board. The following charts considered by the Board show, over the one-, three-, and five-year periods ended December 31, 2011, as available, the cumulative total returns of the retail class and Class C of the fund, the cumulative total returns of a proprietary custom index ("benchmark"), and a range of cumulative total returns of a peer group of mutual funds identified by Lipper Inc. as having an investment objective similar to that of the fund. The returns of the retail class and Class C show the performance of the highest performing class (based on five-year performance) and the lowest performing class (based on one-year performance), respectively. The box within each chart shows the 25th percentile return (top of box) and the 75th percentile return (bottom of box) of the peer group. Returns shown above the box are in the first quartile and returns shown below the box are in the fourth quartile. The percentage beaten numbers noted below each chart correspond to the percentile box and represent the percentage of funds in the peer group whose performance was equal to or lower than that of the class indicated. The fund's proprietary custom index is an index developed by FMR that represents the performance of the fund's unmanaged indexes.
Annual Report
Board Approval of Investment Advisory Contracts and
Management Fees - continued
Fidelity Real Estate Income Fund
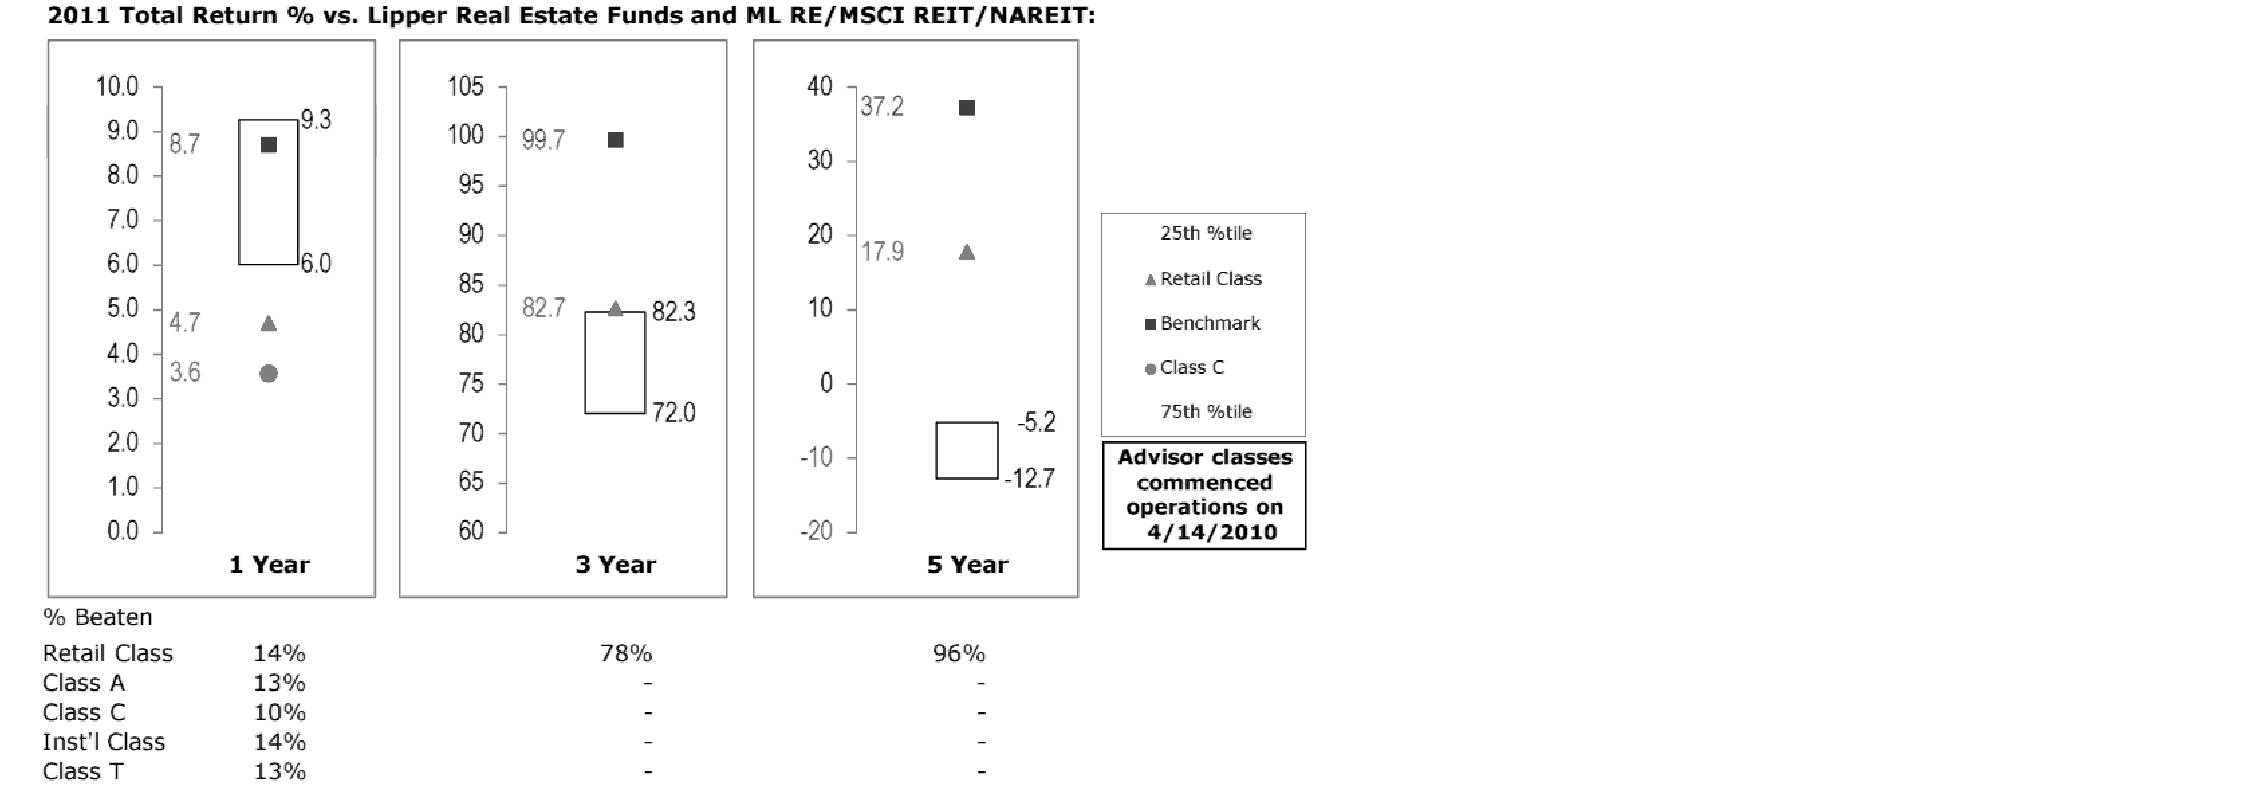
The Board reviewed the fund's relative investment performance against its peer group and noted that the performance of the retail class of the fund (the class with the longest performance record) was in the fourth quartile for the one-year period and the first quartile for three- and five-year periods. The Board also noted that the investment performance of the fund was lower than its benchmark for all the periods shown. The Board considered that the variations in performance among the fund's classes reflect the variations in class expenses, which result in lower performance for higher expense classes. The Board discussed with FMR the fact that the fund underperformed its benchmark for each period measured. The Board also reviewed the fund's performance since inception as well as performance in the current year. The Board will continue to closely monitor performance of the fund in the coming year and discuss with FMR if other actions to address performance are appropriate.
Annual Report
Based on its review, the Board concluded that the nature, extent, and quality of services provided to the fund under the Advisory Contracts should benefit the fund's shareholders.
Competitiveness of Management Fee and Total Expense Ratio. The Board considered the fund's management fee and total expense ratio compared to "mapped groups" of competitive funds and classes. Fidelity creates "mapped groups" by combining similar Lipper investment objective categories that have comparable management fee characteristics. Combining Lipper investment objective categories aids the Board's management fee and total expense ratio comparisons by broadening the competitive group used for comparison and by reducing the number of universes to which various Fidelity funds are compared.
Management Fee. The Board considered two proprietary management fee comparisons for the 12-month periods shown in the chart below. The group of Lipper funds used by the Board for management fee comparisons is referred to below as the "Total Mapped Group." The Total Mapped Group is broader than the Lipper peer group used by the Board for performance comparisons because the Total Mapped Group combines several Lipper investment objective categories while the Lipper peer group does not. The Total Mapped Group comparison focuses on a fund's standing relative to the total universe of comparable funds available to investors in terms of gross management fees before expense reimbursements or caps. "TMG %" represents the percentage of funds in the Total Mapped Group that had management fees that were lower than the fund's. For example, a TMG % of 6% means that 94% of the funds in the Total Mapped Group had higher management fees than the fund. The "Asset-Size Peer Group" (ASPG) comparison focuses on a fund's standing relative to non-Fidelity funds similar in size to the fund within the Total Mapped Group. The ASPG represents at least 15% of the funds in the Total Mapped Group with comparable asset size and management fee characteristics, subject to a minimum of 50 funds (or all funds in the Total Mapped Group if fewer than 50). Additional information, such as the ASPG quartile in which the fund's management fee ranked, is also included in the chart and considered by the Board.
Annual Report
Board Approval of Investment Advisory Contracts and
Management Fees - continued
Fidelity Real Estate Income Fund

The Board noted that the fund's management fee ranked below the median of its Total Mapped Group and below the median of its ASPG for 2011.
Based on its review, the Board concluded that the fund's management fee is fair and reasonable in light of the services that the fund receives and the other factors considered.
Total Expense Ratio. In its review of each class's total expense ratio, the Board considered the fund's management fee as well as other fund or class expenses, as applicable, such as transfer agent fees, pricing and bookkeeping fees, fund-paid 12b-1 fees, and custodial, legal, and audit fees. The Board also noted the effects of any waivers and reimbursements on fees and expenses. As part of its review, the Board also considered the current and historical total expense ratios of each class of the fund compared to competitive fund median expenses. Each class of the fund is compared to those funds and classes in the Total Mapped Group (used by the Board for management fee comparisons) that have a similar sales load structure.
The Board noted that the total expense ratio of each class ranked below its competitive median for 2011.
Fees Charged to Other Fidelity Clients. The Board also considered Fidelity fee structures and other information with respect to clients of FMR and its affiliates, such as other mutual funds advised or subadvised by FMR or its affiliates, pension plan clients, and other institutional clients. The Board noted the findings of the 2010 ad hoc joint committee (created with the board of other Fidelity funds), which reviewed and compared Fidelity's institutional investment advisory business with its business of providing services to the Fidelity funds, including the differences in services provided, fees charged, and costs incurred, as well as competition in their respective marketplaces.
Annual Report
Based on its review of total expense ratios and fees charged to other Fidelity clients, the Board concluded that the total expense ratio of each class of the fund was reasonable in light of the services that the fund and its shareholders receive and the other factors considered.
Costs of the Services and Profitability. The Board considered the revenues earned and the expenses incurred by Fidelity in conducting the business of developing, marketing, distributing, managing, administering and servicing the fund and its shareholders. The Board also considered the level of Fidelity's profits in respect of all the Fidelity funds.
On an annual basis, FMR presents to the Board Fidelity's profitability for the fund. Fidelity calculates the profitability for each fund, as well as aggregate profitability for groups of Fidelity funds and all Fidelity funds, using a series of detailed revenue and cost allocation methodologies which originate with the books and records of Fidelity on which Fidelity's audited financial statements are based. The Audit Committee of the Board reviews any significant changes from the prior year's methodologies.
PricewaterhouseCoopers LLP (PwC), independent registered public accounting firm and auditor to Fidelity and certain Fidelity funds, has been engaged annually by the Board as part of the Board's assessment of Fidelity's profitability analysis. PwC's engagement includes the review and assessment of Fidelity's methodologies used in determining the revenues and expenses attributable to Fidelity's mutual fund business, and completion of agreed-upon procedures surrounding the mathematical accuracy of fund profitability and its conformity to allocation methodologies. After considering PwC's reports issued under the engagement and information provided by Fidelity, the Board concluded that while other allocation methods may also be reasonable, Fidelity's profitability methodologies are reasonable in all material respects.
The Board also reviewed Fidelity's non-fund businesses and fall-out benefits related to the mutual fund business as well as cases where Fidelity's affiliates may benefit from or be related to the fund's business.
The Board considered the costs of the services provided by and the profits realized by Fidelity in connection with the operation of the fund and was satisfied that the profitability was not excessive in the circumstances.
Economies of Scale. The Board considered whether there have been economies of scale in respect of the management of the Fidelity funds, whether the Fidelity funds (including the fund) have appropriately benefited from any such economies of scale, and whether there is potential for realization of any further economies of scale. The Board considered the extent to which the fund will benefit from economies of scale through increased services to the fund, through waivers or reimbursements, or through fee or expense reductions. The Board also noted that in 2009, it and the board of other Fidelity funds created an ad hoc committee (the Economies of Scale Committee) to analyze whether FMR attains economies of scale in respect of the management and servicing of the Fidelity funds, whether the Fidelity funds have appropriately benefited from such economies of scale, and whether there is potential for realization of any further economies of scale.
Annual Report
Board Approval of Investment Advisory Contracts and
Management Fees - continued
The Board recognized that the fund's management contract incorporates a "group fee" structure, which provides for lower group fee rates as total fund assets under FMR's management increase, and for higher group fee rates as total fund assets under FMR's management decrease. FMR calculates the group fee rates based on a tiered asset "breakpoint" schedule that varies based on asset class. The Board considered that the group fee is designed to deliver the benefits of economies of scale to fund shareholders when total Fidelity fund assets increase, even if assets of any particular fund are unchanged or have declined, because some portion of Fidelity's costs are attributable to services provided to all Fidelity funds, and all funds benefit if those costs can be allocated among more assets. The Board concluded that, given the group fee structure, fund shareholders will benefit from lower management fees as assets under FMR's management increase at the fund complex level, regardless of whether Fidelity achieves any such economies of scale.
The Board concluded, taking into account the analysis of the Economies of Scale Committee, that economies of scale, if any, are being appropriately shared between fund shareholders and Fidelity.
Additional Information Requested by the Board. In order to develop fully the factual basis for consideration of the Fidelity funds' Advisory Contracts, the Board requested and received additional information on certain topics, including (i) fund performance trends, actions to be taken by FMR to improve certain funds' overall performance, and Fidelity's long-term strategies for certain funds; (ii) the potential to further rationalize the Fidelity fund lineup with the possibility of achieving savings for the funds and Fidelity; (iii) Fidelity's compensation structure for portfolio managers and other key investment personnel; (iv) the amount of the investment that each portfolio manager has made in the Fidelity fund(s) that he or she manages; (v) the realization of fall-out benefits in certain Fidelity business units; (vi) Fidelity's group fee structures, the potential impact of regulatory changes on such structures, and the rationale for the individual fee rates of certain funds; (vii) fund profitability methodology, including Fidelity's cost allocation methodology, and the impact of certain factors on fund profitability results; (viii) trends regarding industry use of performance fee structures and the possibility of implementing performance fee structures for additional funds; and (ix) the impact of net redemptions from the Fidelity funds.
Annual Report
Based on its evaluation of all of the conclusions noted above, and after considering all factors it believed relevant, the Board ultimately concluded that the advisory fee structures are fair and reasonable, and that the fund's Advisory Contracts should be renewed.
Annual Report
Investment Adviser
Fidelity Management & Research Company
Boston, MA
Investment Sub-Advisers
FMR Co., Inc.
Fidelity Management & Research
(Hong Kong) Limited
Fidelity Management & Research
(Japan) Inc.
Fidelity Management & Research
(U.K.) Inc.
General Distributor
Fidelity Distributors Corporation
Smithfield, RI
Transfer and Service Agents
Fidelity Investments Institutional Operations Company, Inc.
Boston, MA
Fidelity Service Company, Inc.
Boston, MA
Custodian
Citibank, N.A.
New York, NY
(Fidelity Investment logo)(registered trademark)
REIA-UANN-0912
1.907548.102
Fidelity®
Series Real Estate Income
Fund
Fidelity Series Real Estate Income Fund
Class F
Annual Report
July 31, 2012
(Fidelity Cover Art)
Contents
Performance | (Click Here) | How the fund has done over time. |
Management's Discussion of Fund Performance | (Click Here) | The Portfolio Manager's review of fund performance and strategy. |
Shareholder Expense Example | (Click Here) | An example of shareholder expenses. |
Investment Changes | (Click Here) | A summary of major shifts in the fund's investments over the past six months. |
Investments | (Click Here) | A complete list of the fund's investments with their market values. |
Financial Statements | (Click Here) | Statements of assets and liabilities, operations, and changes in net assets, as well as financial highlights. |
Notes | (Click Here) | Notes to the financial statements. |
Report of Independent Registered Public Accounting Firm | (Click Here) | |
Trustees and Officers | (Click Here) | |
Distributions | (Click Here) | |
Board Approval of Investment Advisory Contracts and Management Fees | (Click Here) | |
To view a fund's proxy voting guidelines and proxy voting record for the 12-month period ended June 30, visit http://www.fidelity.com/proxyvotingresults or visit the Securities and Exchange Commission's (SEC) web site at http://www.sec.gov. You may also call 1-800-544-8544 for Fidelity® Series Real Estate Income Fund or 1-800-835-5092 for Class F to request a free copy of the proxy voting guidelines.
Standard & Poor's, S&P and S&P 500 are registered service marks of The McGraw-Hill Companies, Inc. and have been licensed for use by Fidelity Distributors Corporation.
Other third party marks appearing herein are the property of their respective owners.
All other marks appearing herein are registered or unregistered trademarks or service marks of FMR LLC or an affiliated company. © 2012 FMR LLC. All rights reserved.
Annual Report
This report and the financial statements contained herein are submitted for the general information of the shareholders of the fund. This report is not authorized for distribution to prospective investors in the fund unless preceded or accompanied by an effective prospectus.
A fund files its complete schedule of portfolio holdings with the SEC for the first and third quarters of each fiscal year on Form N-Q. Forms N-Q are available on the SEC's web site at http://www.sec.gov. A fund's Forms N-Q may be reviewed and copied at the SEC's Public Reference Room in Washington, DC. Information regarding the operation of the SEC's Public Reference Room may be obtained by calling 1-800-SEC-0330. For a complete list of a fund's portfolio holdings, view the most recent holdings listing, semiannual report, or annual report on Fidelity's web site at http://www.fidelity.com, http://www.advisor.fidelity.com, or http://www.401k.com, as applicable.
NOT FDIC INSURED • MAY LOSE VALUE • NO BANK GUARANTEE
Neither the fund nor Fidelity Distributors Corporation is a bank.
Annual Report
Average annual total return reflects the change in the value of an investment, assuming reinvestment of the class' distributions from dividend income and capital gains (the profits earned upon the sale of securities that have grown in value, if any) and assuming a constant rate of performance each year. The $10,000 table and the fund's returns do not reflect the deduction of taxes that a shareholder would pay on fund distributions or the redemption of fund shares. During periods of reimbursement by Fidelity, a fund's total return will be greater than it would be had the reimbursement not occurred. How a fund did yesterday is no guarantee of how it will do tomorrow.
Average annual total returns take each class' cumulative total return and show you what would have happened if Fidelity® Series Real Estate Income Fund shares and Class F shares had performed at a constant rate each year. These numbers will be reported once the fund is a year old.
$10,000 Over Life of Fund
Let's say hypothetically that $10,000 was invested in Fidelity® Series Real Estate Income Fund, a class of the fund, on October 20, 2011, when the fund started. The chart shows how the value of your investment would have changed, and also shows how the S&P 500® Index performed over the same period.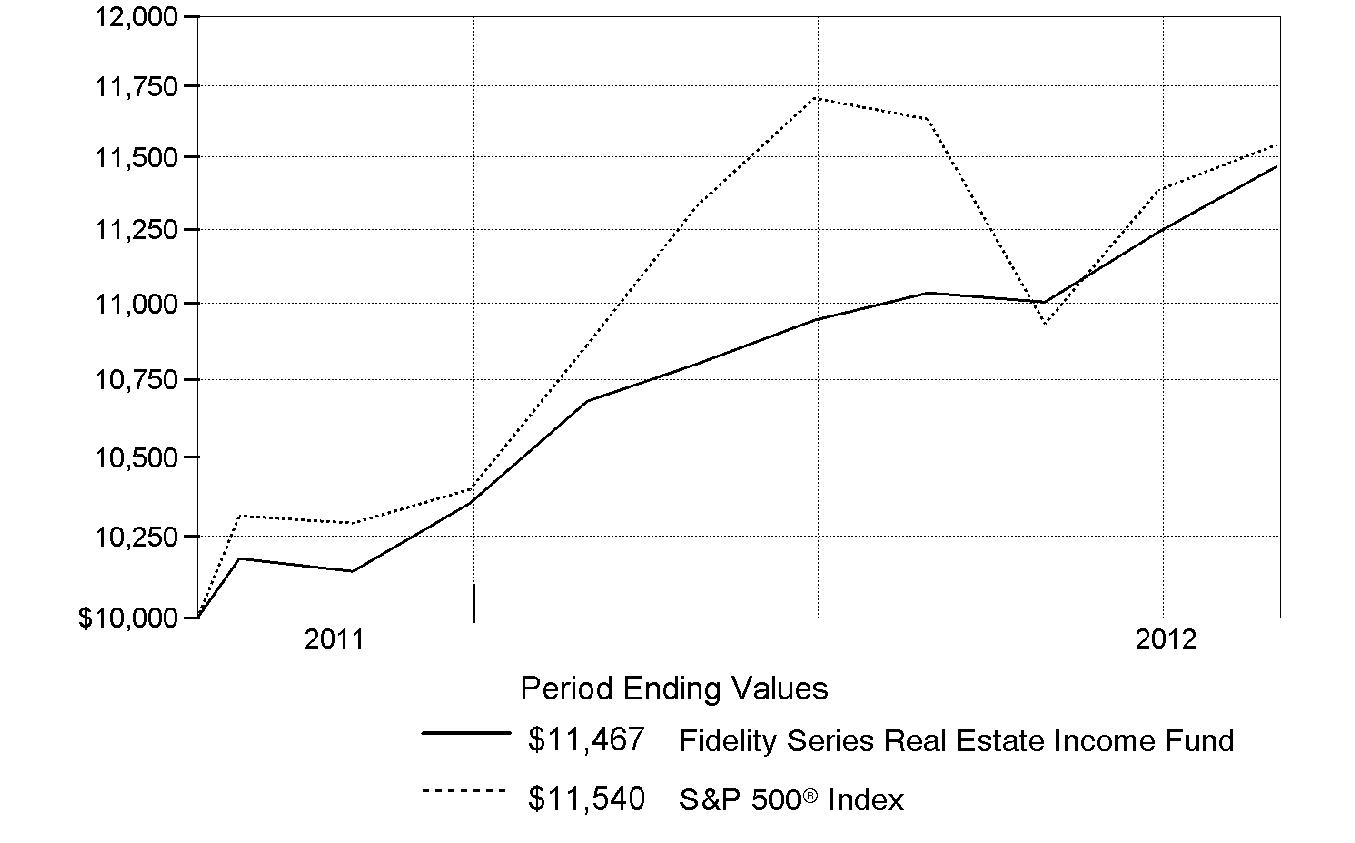
Annual Report
Market Recap: Market conditions shifted between intervals of "risk on" and "risk off" during the nine-month period ending July 31, 2012. During the risk-off times - which most notably included a stretch in late 2011 as well as May 2012 - macro concerns about the eurozone debt crisis and slowing U.S. economic growth took center stage. For most of the first seven months of 2012, however, risk-on returned to the market, causing credit spreads across most asset classes to rally. For real estate, the story was a combination of lower interest rates and good property supply-and-demand fundamentals. Lower interest rates made income-generating real estate securities look more attractive, while good business fundamentals created rising earnings for property owners. In all, common stocks of real estate investment trusts (REITs), as measured by the FTSE® NAREIT® All REITs Index, gained 19.10%, while real estate bonds, reflected in The BofA Merrill LynchSM US Real Estate Index - a market-capitalization-weighted measure of the performance of investment-grade public debt of corporate issuers in the domestic real estate sector - rose 9.84%. The MSCI® REIT Preferred Index, which reflects the performance of real estate preferred stocks, returned 10.37%, while the broad U.S. equity market, as measured by the S&P 500® Index, returned 11.90%.
Comments from Mark Snyderman, Portfolio Manager of Fidelity® Series Real Estate Income Fund: Between the fund's October 20, 2011, inception date and July 31, 2012, the fund's Series Real Estate Income and Class F shares gained 14.67% and 14.89%, respectively. In comparison, the Fidelity Series Real Estate Income Composite IndexSM - a 40/50/10 blend of the MSCI® REIT index, The BofA Merrill LynchSM US Real Estate Index and the FTSE® NAREIT® index, respectively - rose 13.31%. In a favorable environment for real estate securities, all of the fund's asset classes enjoyed solid performance, led by REIT common stocks. Meanwhile, the fund's preferred real estate stocks modestly outpaced the average preferred stock in the MSCI index. Looking at the fund's fixed-income holdings, investments in high-yield real estate bonds and commercial mortgage-backed securities (CMBS) beat the BofA Merrill Lynch index by several percentage points. One area of slight underperformance came from the portfolio's investment-grade real estate bond holdings, which, because of my decision to limit interest rate risk, returned somewhat less than the BofA Merrill Lynch index. In addition, holding a roughly 4% cash position limited the fund's upside in a generally rising market.
The views expressed above reflect those of the portfolio manager(s) only through the end of the period as stated on the cover of this report and do not necessarily represent the views of Fidelity or any other person in the Fidelity organization. Any such views are subject to change at any time based upon market or other conditions and Fidelity disclaims any responsibility to update such views. These views may not be relied on as investment advice and, because investment decisions for a Fidelity fund are based on numerous factors, may not be relied on as an indication of trading intent on behalf of any Fidelity fund.
Annual Report
Shareholder Expense Example
As a shareholder of the Fund, you incur two types of costs: (1) transaction costs, and (2) ongoing costs, including management fees and other Fund expenses. This Example is intended to help you understand your ongoing costs (in dollars) of investing in the Fund and to compare these costs with the ongoing costs of investing in other mutual funds.
The Example is based on an investment of $1,000 invested at the beginning of the period and held for the entire period (February 1, 2012 to July 31, 2012).
Actual Expenses
The first line of the accompanying table for each class of the Fund provides information about actual account values and actual expenses. You may use the information in this line, together with the amount you invested, to estimate the expenses that you paid over the period. Simply divide your account value by $1,000.00 (for example, an $8,600 account value divided by $1,000.00 = 8.6), then multiply the result by the number in the first line for a class of the Fund under the heading entitled "Expenses Paid During Period" to estimate the expenses you paid on your account during this period. In addition, the Fund, as a shareholder in the underlying Fidelity Central Funds, will indirectly bear its pro-rata share of the fees and expenses incurred by the underlying Fidelity Central Funds. These fees and expenses are not included in the Fund's annualized expense ratio used to calculate the expense estimate in the table below.
Hypothetical Example for Comparison Purposes
The second line of the accompanying table for each class of the Fund provides information about hypothetical account values and hypothetical expenses based on a Class' actual expense ratio and an assumed rate of return of 5% per year before expenses, which is not the Class' actual return. The hypothetical account values and expenses may not be used to estimate the actual ending account balance or expenses you paid for the period. You may use this information to compare the ongoing costs of investing in the Fund and other funds. To do so, compare this 5% hypothetical example with the 5% hypothetical examples that appear in the shareholder reports of the other funds. In addition, the Fund, as a shareholder in the underlying Fidelity Central Funds, will indirectly bear its pro-rata share of the fees and expenses incurred by the underlying Fidelity Central Funds. These fees and expenses are not included in the Fund's annualized expense ratio used to calculate the expense estimate in the table below.
Please note that the expenses shown in the table are meant to highlight your ongoing costs only and do not reflect any transaction costs. Therefore, the second line of the table is useful in comparing ongoing costs only, and will not help you determine the relative total costs of owning different funds.
Annual Report
Shareholder Expense Example - continued
| Annualized Expense Ratio | Beginning
Account Value
February 1, 2012 | Ending
Account Value
July 31, 2012 | Expenses Paid
During Period*
February 1, 2012
to July 31, 2012 |
Series Real Estate Income | .80% | | | |
Actual | | $ 1,000.00 | $ 1,073.90 | $ 4.13 |
HypotheticalA | | $ 1,000.00 | $ 1,020.89 | $ 4.02 |
Class F | .62% | | | |
Actual | | $ 1,000.00 | $ 1,075.50 | $ 3.20 |
HypotheticalA | | $ 1,000.00 | $ 1,021.78 | $ 3.12 |
A 5% return per year before expenses
* Expenses are equal to each Class' annualized expense ratio, multiplied by the average account value over the period, multiplied by 182/366 (to reflect the one-half year period).
Annual Report
Investment Changes (Unaudited)
Top Five Stocks as of July 31, 2012 |
| % of fund's
net assets | % of fund's net assets
6 months ago |
Ventas, Inc. | 1.6 | 1.6 |
MFA Financial, Inc. | 1.4 | 1.5 |
Acadia Realty Trust (SBI) | 1.4 | 1.5 |
Equity Lifestyle Properties, Inc. | 1.4 | 1.4 |
Excel Trust, Inc. Series B, 8.125% | 1.3 | 1.5 |
| 7.1 | |
Top Five Bonds as of July 31, 2012 |
| % of fund's
net assets | % of fund's net assets
6 months ago |
Banc of America Large Loan Trust floater Series 2010-HLTN Class HLTN, 1.992% 11/15/15 | 3.8 | 2.5 |
Wachovia Ltd./Wachovia LLC Series 2006-1A Class A1B, 0.7976% 9/25/26 | 1.3 | 1.4 |
Standard Pacific Corp. 8.375% 5/15/18 | 1.3 | 1.4 |
Forest City Enterprises, Inc. 7.625% 6/1/15 | 1.2 | 0.6 |
iStar Financial, Inc. 5.875% 3/15/16 | 1.1 | 0.3 |
| 8.7 | |
Top Five REIT Sectors as of July 31, 2012 |
| % of fund's
net assets | % of fund's net assets
6 months ago |
REITs - Mortgage | 12.4 | 7.5 |
REITs - Shopping Centers | 7.0 | 6.9 |
REITs - Health Care Facilities | 5.8 | 6.2 |
REITs - Management/Investment | 5.6 | 5.7 |
REITs - Hotels | 4.0 | 5.1 |
Asset Allocation (% of fund's net assets) |
As of July 31, 2012* | As of January 31, 2012** |
 | Common Stocks 15.4% | | | Common Stocks 16.4% | |
 | Preferred Stocks 18.7% | | | Preferred Stocks 15.8% | |
 | Bonds 55.9% | | | Bonds 55.1% | |
 | Convertible Securities 4.2% | | | Convertible Securities 3.3% | |
 | Other Investments 2.1% | | | Other Investments 2.4% | |
 | Short-Term
Investments and
Net Other Assets (Liabilities) 3.7% | | | Short-Term
Investments and
Net Other Assets (Liabilities) 7.0% | |

* Foreign investments | 5.8% | | ** Foreign investments | 6.1% | |
Annual Report
Investments July 31, 2012
Showing Percentage of Net Assets
Common Stocks - 15.4% |
| Shares | | Value |
CONSUMER DISCRETIONARY - 0.4% |
Household Durables - 0.4% |
Standard Pacific Corp. (a)(e) | 529,900 | | $ 3,004,533 |
FINANCIALS - 13.7% |
Capital Markets - 0.0% |
HFF, Inc. (a) | 30,400 | | 397,024 |
Real Estate Investment Trusts - 13.6% |
Acadia Realty Trust (SBI) | 420,200 | | 10,059,588 |
American Campus Communities, Inc. | 9,100 | | 433,706 |
American Residential Properties, Inc. (f) | 119,000 | | 2,380,000 |
American Tower Corp. | 25,200 | | 1,822,212 |
AmREIT, Inc. | 39,300 | | 553,737 |
Annaly Capital Management, Inc. | 51,200 | | 892,416 |
Anworth Mortgage Asset Corp. | 271,800 | | 1,804,752 |
Apartment Investment & Management Co. Class A | 51,900 | | 1,423,617 |
Associated Estates Realty Corp. | 67,100 | | 1,001,803 |
CapLease, Inc. | 342,800 | | 1,559,740 |
CBL & Associates Properties, Inc. | 164,200 | | 3,239,666 |
Chartwell Seniors Housing (REIT) (f) | 14,700 | | 147,169 |
Chesapeake Lodging Trust | 68,500 | | 1,162,445 |
Chimera Investment Corp. | 130,000 | | 280,800 |
CommonWealth REIT | 49,900 | | 910,176 |
Cousins Properties, Inc. | 26,100 | | 198,099 |
Cys Investments, Inc. (e) | 170,300 | | 2,462,538 |
DCT Industrial Trust, Inc. | 213,500 | | 1,336,510 |
DiamondRock Hospitality Co. | 71,700 | | 678,282 |
Douglas Emmett, Inc. | 35,100 | | 825,201 |
Dynex Capital, Inc. | 210,700 | | 2,189,173 |
EastGroup Properties, Inc. | 9,500 | | 508,060 |
Education Realty Trust, Inc. | 102,100 | | 1,196,612 |
Equity Lifestyle Properties, Inc. | 139,300 | | 10,018,456 |
Excel Trust, Inc. | 206,300 | | 2,525,112 |
First Potomac Realty Trust | 61,500 | | 712,785 |
Glimcher Realty Trust | 88,400 | | 885,768 |
Hatteras Financial Corp. | 22,200 | | 649,350 |
Highwoods Properties, Inc. (SBI) | 13,300 | | 450,471 |
Lexington Corporate Properties Trust (e) | 353,000 | | 3,155,820 |
LTC Properties, Inc. | 46,200 | | 1,649,340 |
MFA Financial, Inc. | 1,254,200 | | 10,133,936 |
Mid-America Apartment Communities, Inc. | 8,900 | | 616,147 |
Monmouth Real Estate Investment Corp. Class A | 34,000 | | 378,760 |
National Retail Properties, Inc. | 29,500 | | 870,250 |
Common Stocks - continued |
| Shares | | Value |
FINANCIALS - continued |
Real Estate Investment Trusts - continued |
Newcastle Investment Corp. | 450,000 | | $ 3,352,500 |
Prologis, Inc. | 126,900 | | 4,102,677 |
Retail Properties America, Inc. | 57,300 | | 571,281 |
Senior Housing Properties Trust (SBI) | 73,800 | | 1,678,950 |
Stag Industrial, Inc. | 154,500 | | 2,234,070 |
Summit Hotel Properties, Inc. | 87,100 | | 722,930 |
Sunstone Hotel Investors, Inc. (a) | 33,600 | | 336,336 |
Two Harbors Investment Corp. | 25,600 | | 293,632 |
Ventas, Inc. | 167,000 | | 11,230,750 |
Washington (REIT) (SBI) | 10,300 | | 275,010 |
Western Asset Mortgage Capital Corp. (e) | 19,400 | | 396,148 |
Weyerhaeuser Co. | 47,200 | | 1,102,120 |
| | 95,408,901 |
Real Estate Management & Development - 0.1% |
Kennedy-Wilson Holdings, Inc. | 50,600 | | 692,208 |
TOTAL FINANCIALS | | 96,498,133 |
HEALTH CARE - 1.3% |
Health Care Providers & Services - 1.3% |
Brookdale Senior Living, Inc. (a) | 204,300 | | 3,362,778 |
Capital Senior Living Corp. (a) | 219,900 | | 2,471,676 |
Emeritus Corp. (a) | 186,600 | | 3,162,870 |
| | 8,997,324 |
TOTAL COMMON STOCKS (Cost $90,233,241) |
108,499,990
|
Preferred Stocks - 19.7% |
| | | |
Convertible Preferred Stocks - 1.0% |
FINANCIALS - 1.0% |
Real Estate Investment Trusts - 1.0% |
CommonWealth REIT 6.50% | 127,200 | | 3,033,720 |
Health Care REIT, Inc. Series I, 6.50% | 16,200 | | 918,338 |
Lexington Corporate Properties Trust Series C, 6.50% | 58,800 | | 2,780,652 |
| | 6,732,710 |
Preferred Stocks - continued |
| Shares | | Value |
Nonconvertible Preferred Stocks - 18.7% |
FINANCIALS - 18.7% |
Diversified Financial Services - 0.4% |
DRA CRT Acquisition Corp. Series A, 8.50% | 1,400 | | $ 23,800 |
Red Lion Hotels Capital Trust 9.50% | 112,200 | | 2,918,322 |
| | 2,942,122 |
Real Estate Investment Trusts - 17.7% |
American Capital Agency Corp. 8.00% | 120,000 | | 3,162,000 |
Annaly Capital Management, Inc.: | | | |
Series A, 7.875% | 150,300 | | 4,029,543 |
Series C, 7.625% | 9,839 | | 252,862 |
Anworth Mortgage Asset Corp. Series A, 8.625% | 178,800 | | 4,684,560 |
Apollo Commercial Real Estate Finance, Inc. Series A, 8.625% (a) | 32,105 | | 806,638 |
Ashford Hospitality Trust, Inc. Series E, 9.00% | 35,948 | | 959,452 |
BioMed Realty Trust, Inc. Series A, 7.375% | 16,200 | | 413,100 |
Brandywine Realty Trust Series D, 7.375% | 9,200 | | 236,164 |
Campus Crest Communities, Inc. Series A, 8.00% | 71,569 | | 1,903,735 |
CapLease, Inc.: | | | |
Series A, 8.125% | 22,150 | | 557,737 |
Series B, 8.375% | 160,000 | | 4,161,600 |
CBL & Associates Properties, Inc.: | | | |
(depositary shares) Series C, 7.75% | 8,100 | | 205,983 |
7.375% | 67,200 | | 1,712,928 |
Cedar Shopping Centers, Inc. 8.875% | 38,598 | | 993,127 |
Chesapeake Lodging Trust Series A, 7.75% (a) | 64,034 | | 1,620,701 |
Colony Financial, Inc. Series A, 8.50% | 77,829 | | 1,984,640 |
CommonWealth REIT 7.50% | 24,923 | | 543,820 |
Corporate Office Properties Trust Series L, 7.375% (a) | 80,000 | | 2,034,400 |
Cousins Properties, Inc.: | | | |
Series A, 7.75% | 84,500 | | 2,125,175 |
Series B, 7.50% | 34,900 | | 881,225 |
CubeSmart Series A, 7.75% | 40,000 | | 1,064,800 |
Cys Investments, Inc. Series A, 7.75% (a) | 10,014 | | 250,350 |
DDR Corp. Series J, 6.50% (a)(g) | 30,181 | | 748,489 |
Digital Realty Trust, Inc. Series F, 6.625% | 20,000 | | 525,000 |
Duke Realty LP: | | | |
8.375% | 51,200 | | 1,350,144 |
Series L, 6.60% | 4,300 | | 109,564 |
Dynex Capital, Inc. Series A, 8.50% (a) | 96,313 | | 2,388,562 |
Equity Lifestyle Properties, Inc. 8.034% | 213,823 | | 5,452,487 |
Equity Residential (depositary shares) Series N, 6.48% | 17,200 | | 432,408 |
Preferred Stocks - continued |
| Shares | | Value |
Nonconvertible Preferred Stocks - continued |
FINANCIALS - continued |
Real Estate Investment Trusts - continued |
Essex Property Trust, Inc. Series H, 7.125% | 8,100 | | $ 217,242 |
Excel Trust, Inc. Series B, 8.125% | 360,000 | | 9,342,000 |
First Potomac Realty Trust 7.75% | 107,746 | | 2,793,854 |
Gladstone Commercial Corp. Series C, 7.125% | 67,762 | | 1,738,095 |
Glimcher Realty Trust: | | | |
Series F, 8.75% | 1,400 | | 35,545 |
Series G, 8.125% | 83,050 | | 2,094,521 |
Health Care REIT, Inc. Series J, 6.50% | 20,000 | | 538,800 |
Hersha Hospitality Trust Series B, 8.00% | 18,928 | | 490,803 |
Hospitality Properties Trust: | | | |
Series C, 7.00% | 60,600 | | 1,539,846 |
Series D, 7.125% | 40,200 | | 1,082,586 |
Hudson Pacific Properties, Inc. 8.375% | 77,800 | | 2,060,922 |
Inland Real Estate Corp. Series A, 8.125% | 200,000 | | 5,166,000 |
Invesco Mortgage Capital, Inc. Series A, | 30,151 | | 753,775 |
Investors Real Estate Trust Series B, 7.95% (a) | 33,428 | | 835,700 |
Kilroy Realty Corp. Series G, 6.875% | 20,000 | | 526,000 |
Kimco Realty Corp. Series G, 7.75% | 167,900 | | 4,269,697 |
Kite Realty Group Trust 8.25% | 4,100 | | 107,748 |
LaSalle Hotel Properties: | | | |
Series G, 7.25% | 71,100 | | 1,812,339 |
Series H, 7.50% | 7,192 | | 191,091 |
LBA Realty Fund II Series B, 7.625% (a) | 118,900 | | 2,259,100 |
Lexington Realty Trust 7.55% | 16,500 | | 415,965 |
MFA Financial, Inc.: | | | |
8.00% | 108,747 | | 2,778,486 |
Series A, 8.50% | 306,700 | | 7,986,468 |
Monmouth Real Estate Investment Corp. Series B, 7.875% | 30,000 | | 802,500 |
National Retail Properties, Inc. Series D, 6.625% | 17,563 | | 461,907 |
Parkway Properties, Inc. Series D, 8.00% | 18,518 | | 467,580 |
Pebblebrook Hotel Trust: | | | |
Series A, 7.875% | 49,000 | | 1,281,350 |
Series B, 8.00% | 37,400 | | 988,856 |
Prologis, Inc.: | | | |
Series O, 7.00% | 900 | | 22,788 |
Series Q, 8.54% | 15,800 | | 975,650 |
PS Business Parks, Inc. Series P, 6.70% | 52,700 | | 1,335,418 |
Regency Centers Corp. Series 6, 6.625% | 17,739 | | 471,148 |
Preferred Stocks - continued |
| Shares | | Value |
Nonconvertible Preferred Stocks - continued |
FINANCIALS - continued |
Real Estate Investment Trusts - continued |
Saul Centers, Inc.: | | | |
8.00% | 36,400 | | $ 934,024 |
Series B (depositary shares) 9.00% | 24,400 | | 636,840 |
Stag Industrial, Inc. Series A, 9.00% | 280,000 | | 7,635,600 |
Summit Hotel Properties, Inc. Series A, 9.25% | 173,700 | | 4,688,163 |
Sunstone Hotel Investors, Inc.: | | | |
Series A, 8.00% | 126,400 | | 3,216,880 |
Series D, 8.00% | 20,200 | | 524,594 |
Terreno Realty Corp. Series A 7.75% | 44,310 | | 1,140,096 |
UMH Properties, Inc. Series A, 8.25% | 70,500 | | 1,866,840 |
Weingarten Realty Investors (SBI) Series F, 6.50% | 62,800 | | 1,586,328 |
Winthrop Realty Trust Series D, 9.25% | 35,000 | | 932,050 |
| | 124,596,389 |
Real Estate Management & Development - 0.6% |
Forest City Enterprises, Inc. 7.375% | 180,500 | | 4,292,290 |
TOTAL FINANCIALS | | 131,830,801 |
TOTAL PREFERRED STOCKS (Cost $132,558,125) |
138,563,511
|
Corporate Bonds - 28.5% |
| Principal Amount | | |
Convertible Bonds - 3.2% |
CONSUMER DISCRETIONARY - 0.2% |
Hotels, Restaurants & Leisure - 0.2% |
Morgans Hotel Group Co. 2.375% 10/15/14 | | $ 1,365,000 | | 1,199,494 |
FINANCIALS - 3.0% |
Real Estate Investment Trusts - 2.7% |
Annaly Capital Management, Inc.: | | | | |
4% 2/15/15 | | 405,000 | | 513,844 |
5% 5/15/15 | | 6,690,000 | | 6,715,088 |
CapLease, Inc. 7.5% 10/1/27 (f) | | 4,458,000 | | 4,463,573 |
Northstar Realty Finance LP 8.875% 6/15/32 (f) | | 5,000,000 | | 5,162,500 |
Corporate Bonds - continued |
| Principal Amount | | Value |
Convertible Bonds - continued |
FINANCIALS - continued |
Real Estate Investment Trusts - continued |
ProLogis LP: | | | | |
1.875% 11/15/37 | | $ 1,783,000 | | $ 1,778,543 |
2.625% 5/15/38 | | 405,000 | | 406,033 |
| | 19,039,581 |
Real Estate Management & Development - 0.3% |
Corporate Office Properties LP 4.25% 4/15/30 (f) | | 1,940,000 | | 1,910,900 |
Grubb & Ellis Co. 7.95% 5/1/15 (d)(f) | | 1,540,000 | | 7,700 |
| | 1,918,600 |
TOTAL FINANCIALS | | 20,958,181 |
TOTAL CONVERTIBLE BONDS | | 22,157,675 |
Nonconvertible Bonds - 25.3% |
CONSUMER DISCRETIONARY - 8.0% |
Hotels, Restaurants & Leisure - 0.7% |
CityCenter Holdings LLC/CityCenter Finance Corp. 7.625% 1/15/16 (f) | | 440,000 | | 460,900 |
FelCor Lodging LP 6.75% 6/1/19 | | 1,375,000 | | 1,454,063 |
Times Square Hotel Trust 8.528% 8/1/26 (f) | | 2,821,382 | | 3,231,518 |
| | 5,146,481 |
Household Durables - 6.8% |
D.R. Horton, Inc. 6.5% 4/15/16 | | 811,000 | | 890,073 |
KB Home: | | | | |
5.875% 1/15/15 | | 1,216,000 | | 1,228,160 |
6.25% 6/15/15 | | 5,634,000 | | 5,718,510 |
7.25% 6/15/18 | | 2,110,000 | | 2,131,100 |
8% 3/15/20 | | 2,395,000 | | 2,502,775 |
9.1% 9/15/17 | | 3,230,000 | | 3,504,550 |
Lennar Corp.: | | | | |
5.5% 9/1/14 | | 3,242,000 | | 3,400,048 |
5.6% 5/31/15 | | 1,216,000 | | 1,295,040 |
6.95% 6/1/18 | | 1,720,000 | | 1,883,400 |
M/I Homes, Inc. 8.625% 11/15/18 | | 6,764,000 | | 7,203,660 |
Meritage Homes Corp.: | | | | |
7% 4/1/22 (f) | | 2,005,000 | | 2,090,213 |
7.15% 4/15/20 | | 440,000 | | 462,000 |
Corporate Bonds - continued |
| Principal Amount | | Value |
Nonconvertible Bonds - continued |
CONSUMER DISCRETIONARY - continued |
Household Durables - continued |
Ryland Group, Inc.: | | | | |
6.625% 5/1/20 | | $ 445,000 | | $ 467,250 |
8.4% 5/15/17 | | 1,446,000 | | 1,662,900 |
Standard Pacific Corp.: | | | | |
8.375% 5/15/18 | | 8,047,000 | | 8,941,826 |
10.75% 9/15/16 | | 2,284,000 | | 2,746,510 |
Standard Pacific Escrow LLC 10.75% 9/15/16 (f) | | 1,000,000 | | 1,090,000 |
Toll Brothers Finance Corp. 5.875% 2/15/22 | | 450,000 | | 482,625 |
| | 47,700,640 |
Multiline Retail - 0.5% |
JC Penney Corp., Inc.: | | | | |
5.65% 6/1/20 | | 1,280,000 | | 1,073,600 |
5.75% 2/15/18 | | 756,000 | | 660,555 |
Sears Holdings Corp. 6.625% 10/15/18 | | 2,053,000 | | 1,842,568 |
| | 3,576,723 |
TOTAL CONSUMER DISCRETIONARY | | 56,423,844 |
FINANCIALS - 15.5% |
Diversified Financial Services - 0.6% |
Icahn Enterprises LP/Icahn Enterprises Finance Corp.: | | | | |
7.75% 1/15/16 | | 2,172,000 | | 2,283,315 |
8% 1/15/18 | | 1,215,000 | | 1,290,938 |
8% 1/15/18 (f) | | 580,000 | | 614,800 |
| | 4,189,053 |
Real Estate Investment Trusts - 9.9% |
Camden Property Trust 5% 6/15/15 | | 1,135,000 | | 1,228,059 |
Commercial Net Lease Realty, Inc.: | | | | |
6.15% 12/15/15 | | 917,000 | | 1,019,687 |
6.25% 6/15/14 | | 949,000 | | 1,006,840 |
CubeSmart LP 4.8% 7/15/22 | | 1,000,000 | | 1,057,504 |
Developers Diversified Realty Corp.: | | | | |
7.5% 7/15/18 | | 2,407,000 | | 2,801,900 |
9.625% 3/15/16 | | 2,254,000 | | 2,739,489 |
Duke Realty LP 6.25% 5/15/13 | | 608,000 | | 628,615 |
Equity One, Inc.: | | | | |
5.375% 10/15/15 | | 405,000 | | 429,922 |
6% 9/15/16 | | 811,000 | | 893,264 |
Corporate Bonds - continued |
| Principal Amount | | Value |
Nonconvertible Bonds - continued |
FINANCIALS - continued |
Real Estate Investment Trusts - continued |
Equity One, Inc.: - continued | | | | |
6.25% 12/15/14 | | $ 811,000 | | $ 877,147 |
6.25% 1/15/17 | | 811,000 | | 902,466 |
Health Care Property Investors, Inc.: | | | | |
6% 6/15/14 | | 660,000 | | 705,989 |
6% 3/1/15 | | 1,216,000 | | 1,309,575 |
6.3% 9/15/16 | | 3,850,000 | | 4,404,046 |
7.072% 6/8/15 | | 405,000 | | 451,541 |
Health Care REIT, Inc. 4.125% 4/1/19 | | 1,000,000 | | 1,040,204 |
Healthcare Realty Trust, Inc.: | | | | |
5.125% 4/1/14 | | 811,000 | | 847,171 |
6.5% 1/17/17 | | 506,000 | | 568,313 |
Highwoods/Forsyth LP 5.85% 3/15/17 | | 2,593,000 | | 2,816,366 |
Hospitality Properties Trust: | | | | |
5.625% 3/15/17 | | 1,248,000 | | 1,334,775 |
6.7% 1/15/18 | | 811,000 | | 904,540 |
6.75% 2/15/13 | | 1,013,000 | | 1,015,156 |
7.875% 8/15/14 | | 405,000 | | 437,421 |
HRPT Properties Trust 6.25% 8/15/16 | | 4,000,000 | | 4,297,700 |
iStar Financial, Inc.: | | | | |
5.85% 3/15/17 | | 825,000 | | 750,750 |
5.875% 3/15/16 | | 8,610,000 | | 8,007,300 |
5.95% 10/15/13 | | 3,833,000 | | 3,698,845 |
6.05% 4/15/15 | | 332,000 | | 315,400 |
6.5% 12/15/13 | | 1,020,000 | | 1,002,150 |
8.625% 6/1/13 | | 1,745,000 | | 1,762,450 |
9% 6/1/17 (f) | | 3,440,000 | | 3,491,600 |
MPT Operating Partnership LP/MPT Finance Corp. 6.375% 2/15/22 | | 890,000 | | 921,150 |
National Retail Properties, Inc. 6.875% 10/15/17 | | 1,621,000 | | 1,842,526 |
Nationwide Health Properties, Inc.: | | | | |
6% 5/20/15 | | 1,540,000 | | 1,716,073 |
6.25% 2/1/13 | | 1,621,000 | | 1,662,135 |
Omega Healthcare Investors, Inc. 7.5% 2/15/20 | | 811,000 | | 908,320 |
Pan Pacific Retail Properties, Inc. 5.95% 6/1/14 | | 1,378,000 | | 1,458,073 |
Potlatch Corp. 7.5% 11/1/19 | | 811,000 | | 859,660 |
ProLogis LP 7.625% 7/1/17 | | 1,268,000 | | 1,499,127 |
Corporate Bonds - continued |
| Principal Amount | | Value |
Nonconvertible Bonds - continued |
FINANCIALS - continued |
Real Estate Investment Trusts - continued |
Reckson Operating Partnership LP/SL Green Realty Corp./SL Green Operating Partnership LP 7.75% 3/15/20 | | $ 811,000 | | $ 942,869 |
Senior Housing Properties Trust: | | | | |
6.75% 4/15/20 | | 576,000 | | 636,228 |
6.75% 12/15/21 | | 2,000,000 | | 2,228,950 |
UDR, Inc. 5.5% 4/1/14 | | 1,000,000 | | 1,052,347 |
United Dominion Realty Trust, Inc.: | | | | |
5.25% 1/15/15 | | 405,000 | | 434,702 |
5.25% 1/15/16 | | 811,000 | | 875,892 |
| | 69,784,237 |
Real Estate Management & Development - 5.0% |
AMB Property LP 5.9% 8/15/13 | | 486,000 | | 504,929 |
Brandywine Operating Partnership LP: | | | | |
5.4% 11/1/14 | | 1,216,000 | | 1,275,613 |
6% 4/1/16 | | 811,000 | | 886,154 |
7.5% 5/15/15 | | 405,000 | | 454,561 |
CB Richard Ellis Services, Inc. 11.625% 6/15/17 | | 811,000 | | 916,430 |
Colonial Properties Trust: | | | | |
6.15% 4/15/13 | | 1,013,000 | | 1,036,888 |
6.25% 6/15/14 | | 1,293,000 | | 1,370,638 |
6.875% 8/15/12 | | 811,000 | | 812,169 |
Colonial Realty LP 6.05% 9/1/16 | | 1,216,000 | | 1,316,453 |
First Industrial LP 5.75% 1/15/16 | | 811,000 | | 846,277 |
Forest City Enterprises, Inc.: | | | | |
6.5% 2/1/17 | | 6,171,000 | | 5,939,588 |
7.625% 6/1/15 | | 8,735,000 | | 8,658,569 |
Host Hotels & Resorts LP: | | | | |
6% 10/1/21 | | 485,000 | | 543,200 |
9% 5/15/17 | | 608,000 | | 670,320 |
Kennedy-Wilson, Inc. 8.75% 4/1/19 | | 215,000 | | 227,900 |
Post Apartment Homes LP 6.3% 6/1/13 | | 811,000 | | 836,621 |
Realogy Corp.: | | | | |
7.875% 2/15/19 (f) | | 1,450,000 | | 1,460,875 |
9% 1/15/20 (f) | | 560,000 | | 586,600 |
Regency Centers LP: | | | | |
5.25% 8/1/15 | | 3,250,000 | | 3,502,411 |
5.875% 6/15/17 | | 486,000 | | 557,320 |
Corporate Bonds - continued |
| Principal Amount | | Value |
Nonconvertible Bonds - continued |
FINANCIALS - continued |
Real Estate Management & Development - continued |
Toys 'R' Us Property Co. I LLC 10.75% 7/15/17 | | $ 2,035,000 | | $ 2,238,500 |
Ventas Realty LP 4% 4/30/19 | | 597,000 | | 636,432 |
| | 35,278,448 |
TOTAL FINANCIALS | | 109,251,738 |
HEALTH CARE - 1.5% |
Health Care Equipment & Supplies - 0.3% |
Aviv Healthcare Properties LP/Aviv Healthcare Capital Corp. 7.75% 2/15/19 | | 1,835,000 | | 1,903,813 |
Health Care Providers & Services - 1.2% |
Health Management Associates, Inc. 7.375% 1/15/20 (f) | | 385,000 | | 415,800 |
Sabra Health Care LP/Sabra Capital Corp.: | | | | |
8.125% 11/1/18 | | 7,047,000 | | 7,610,760 |
8.125% 11/1/18 (f) | | 520,000 | | 560,300 |
| | 8,586,860 |
TOTAL HEALTH CARE | | 10,490,673 |
MATERIALS - 0.3% |
Paper & Forest Products - 0.3% |
Plum Creek Timberlands LP 5.875% 11/15/15 | | 1,621,000 | | 1,792,894 |
TOTAL NONCONVERTIBLE BONDS | | 177,959,149 |
TOTAL CORPORATE BONDS (Cost $189,208,663) |
200,116,824
|
Asset-Backed Securities - 6.4% |
|
Anthracite CDO I Ltd. Series 2002-CIBA Class B, 6.633% 5/24/37 (f) | | 1,331,000 | | 1,331,799 |
Anthracite CDO III Ltd./Anthracite CDO III Corp. Series 2004-1A Class A, 0.6068% 3/23/19 (f)(h) | | 1,529,601 | | 1,449,297 |
Capital Trust RE CDO Ltd./Capital Trust RE CDO Corp. Series 2005-3A Class A2, 5.16% 6/25/35 (f) | | 2,552,044 | | 2,574,502 |
CapitalSource Real Estate Loan Trust Series 2006-1A Class A2A, 0.7076% 1/20/37 (f)(h) | | 1,076,250 | | 959,886 |
Asset-Backed Securities - continued |
| Principal Amount | | Value |
CBRE Realty Finance CDO LLC Series 2007-1A Class A1, 0.7096% 4/7/52 (f)(h) | | $ 3,845,307 | | $ 2,762,623 |
Conseco Finance Securitizations Corp.: | | | | |
Series 2002-1 Class M2, 9.546% 12/1/33 | | 1,216,000 | | 1,011,010 |
Series 2002-2 Class M2, 9.163% 3/1/33 | | 2,026,000 | | 1,127,937 |
Crest Clarendon Street Ltd./Crest Clarendon Corp. Series 2002-1A: | | | | |
Class B1, 6.065% 12/28/35 (f) | | 1,734,000 | | 1,696,546 |
Class B2, 1.8106% 12/28/35 (f)(h) | | 1,711,000 | | 1,557,010 |
Deutsche Financial Capital Securitization LLC Series 1997-I Class M, 7.275% 9/15/27 | | 1,627,000 | | 1,526,471 |
Lehman ABS Manufactured Housing Contract Trust Series 2001-B Class M2, 7.17% 4/15/40 | | 3,949,399 | | 1,620,554 |
N-Star Real Estate CDO Ltd. Series 1A Class B1, 2.1419% 8/28/38 (f)(h) | | 3,574,000 | | 3,180,860 |
Prima Capital Ltd. Series 2006-CR1A Class A2, 5.533% 12/28/48 (f) | | 2,570,000 | | 2,518,600 |
Residential Asset Securities Corp. Series 2003-KS10 Class MI3, 6.41% 12/25/33 | | 301,632 | | 113,357 |
Wachovia Ltd./Wachovia LLC: | | | | |
Series 2006-1 Class 1ML, 5.9676% 9/25/26 (f)(h) | | 2,432,000 | | 1,216,000 |
Series 2006-1A: | | | | |
Class A1A, 0.7276% 9/25/26 (f)(h) | | 2,162,706 | | 1,946,436 |
Class A1B, 0.7976% 9/25/26 (f)(h) | | 11,266,000 | | 9,407,110 |
Class A2A, 0.6876% 9/25/26 (f)(h) | | 3,379,280 | | 3,277,901 |
Class C 0.9976% 9/25/26 (f)(h) | | 1,010,000 | | 802,950 |
Class F, 1.6176% 9/25/26 (f)(h) | | 1,824,000 | | 1,349,760 |
Class G, 1.8176% 9/25/26 (f)(h) | | 1,273,000 | | 918,215 |
Class H, 2.1176% 9/25/26 (f)(h) | | 3,486,000 | | 2,431,485 |
TOTAL ASSET-BACKED SECURITIES (Cost $40,082,587) |
44,780,309
|
Collateralized Mortgage Obligations - 0.8% |
|
Private Sponsor - 0.8% |
COMM pass-thru certificates Series 2007-FL14 Class AJ, 0.4288% 6/15/22 (f)(h) | | 1,301,961 | | 1,222,974 |
FREMF Mortgage Trust: | | | | |
Series 2010 K7 Class B, 5.6186% 4/25/20 (f)(h) | | 2,605,000 | | 2,814,056 |
Collateralized Mortgage Obligations - continued |
| Principal Amount | | Value |
Private Sponsor - continued |
FREMF Mortgage Trust: - continued | | | | |
Series 2010-K6 Class B, 5.5326% 12/25/46 (f)(h) | | $ 811,000 | | $ 871,094 |
Merrill Lynch Mortgage Investors Trust Series 1998-C3 Class F, 6% 12/15/30 (f) | | 811,000 | | 816,300 |
TOTAL COLLATERALIZED MORTGAGE OBLIGATIONS (Cost $5,196,890) |
5,724,424
|
Commercial Mortgage Securities - 23.4% |
|
Banc of America Commercial Mortgage, Inc.: | | | | |
sequential payer: | | | | |
Series 2002-2 Class F, 5.487% 7/11/43 | | 3,242,000 | | 3,268,212 |
Series 2005-1 Class A3, 4.877% 11/10/42 | | 75,931 | | 75,875 |
Series 2005-1 Class CJ, 5.3652% 11/10/42 (h) | | 1,175,000 | | 1,230,849 |
Banc of America Large Loan Trust floater Series 2010-HLTN Class HLTN, 1.992% 11/15/15 (f)(h) | | 27,894,411 | | 26,638,868 |
Banc of America Large Loan, Inc. floater Series 2005-MIB1 Class K, 2.2488% 3/15/22 (f)(h) | | 2,132,000 | | 1,300,663 |
Bear Stearns Commercial Mortgage Securities, Inc. Series 2006-PW11 Class AJ, 5.6187% 3/11/39 (h) | | 2,432,000 | | 2,322,229 |
Chase Commercial Mortgage Securities Corp. Series 1998-1 Class H, 6.34% 5/18/30 (f) | | 1,621,000 | | 1,413,123 |
COMM pass-thru certificates: | | | | |
floater Series 2006-FL12 Class AJ, 0.3788% 12/15/20 (f)(h) | | 1,621,000 | | 1,471,456 |
sequential payer Series 2004-RS1 Class A, 5.648% 3/3/41 (f) | | 1,527,994 | | 1,539,454 |
Commercial Mortgage pass-thru certificates: | | | | |
Series 2005-C6 Class AJ, 5.209% 6/10/44 (h) | | 2,000,000 | | 2,018,892 |
Series 2011-STRT Class C, 4.755% 12/10/24 (f) | | 500,000 | | 501,029 |
Series 2012-CR1: | | | | |
Class C, 5.547% 5/15/45 | | 3,000,000 | | 3,004,779 |
Class D, 5.547% 5/15/45 (f) | | 1,350,000 | | 1,058,171 |
Commercial Mortgage Trust pass-thru certificates Series 2012-LC4: | | | | |
Class C, 5.8248% 12/10/44 (h) | | 780,000 | | 804,525 |
Class D, 5.8248% 12/10/44 (f)(h) | | 2,830,000 | | 2,303,977 |
Communication Mortgage Trust Series 2011-THL: | | | | |
Class E, 5.949% 6/9/28 (f) | | 2,260,000 | | 2,301,044 |
Class F, 4.867% 6/9/28 (f) | | 3,640,000 | | 3,323,589 |
Credit Suisse First Boston Mortgage Securities Corp.: | | | | |
Series 1998-C2 Class F, 6.75% 11/15/30 (f) | | 811,000 | | 873,611 |
Commercial Mortgage Securities - continued |
| Principal Amount | | Value |
Credit Suisse First Boston Mortgage Securities Corp.: - continued | | | | |
Series 2003-C3 Class D, 4.131% 5/15/38 | | $ 1,621,000 | | $ 1,627,375 |
CRESI Finance Ltd. Partnership floater Series 2006-A Class E, 1.8962% 3/25/17 (f)(h) | | 414,033 | | 351,928 |
CRESIX Finance Ltd. Series 2006-AA: | | | | |
Class F, 4.4462% 3/25/17 (f)(h) | | 1,783,000 | | 1,479,890 |
Class G, 7.2462% 3/25/17 (f)(h) | | 1,516,000 | | 1,212,800 |
DBUBS Mortgage Trust Series 2011-LC1A Class E, 5.7284% 11/10/46 (f)(h) | | 2,450,000 | | 2,187,588 |
Deutsche Mortgage & Asset Receiving Corp. Series 1998-C1 Class J, 6.22% 6/15/31 | | 1,946,000 | | 1,646,906 |
DLJ Commercial Mortgage Corp. Series 1998-CG1 Class B4, 7.4461% 6/10/31 (f)(h) | | 2,026,000 | | 2,078,372 |
Extended Stay America Trust Series 2010-ESHA Class D, 5.4983% 11/5/27 (f) | | 4,500,000 | | 4,589,012 |
FHMLC Multi-class participation certificates guaranteed Series K013 Class X3, 2.8846% 1/25/43 (h)(i) | | 4,806,000 | | 806,404 |
Freddie Mac: | | | | |
Series K011 Class X3, 2.6619% 12/25/43 (h)(i) | | 4,947,000 | | 757,460 |
Series K012 Class X3, 2.3657% 1/25/41 (h)(i) | | 2,846,999 | | 389,302 |
G-Force LLC sequential payer Series 2005-RRA Class A2, 4.83% 8/22/36 (f) | | 5,467,870 | | 5,331,173 |
GE Capital Commercial Mortgage Corp. Series 2002-1A Class H, 7.3556% 12/10/35 (f)(h) | | 1,035,000 | | 1,034,857 |
GMAC Commercial Mortgage Securities, Inc.: | | | | |
Series 1997-C2: | | | | |
Class F, 6.75% 4/15/29 (h) | | 234,196 | | 236,335 |
Class G, 6.75% 4/15/29 (h) | | 1,096,000 | | 1,166,416 |
Series 1999-C1 Class F, 6.02% 5/15/33 (f) | | 981,720 | | 1,008,659 |
Series 1999-C3 Class J, 6.974% 8/15/36 | | 2,204,000 | | 2,180,719 |
Series 2000-C1 Class K, 7% 3/15/33 | | 165,819 | | 124,558 |
Series 2003-C3 Class H, 5.9012% 4/10/40 (f)(h) | | 830,000 | | 717,708 |
Greenwich Capital Commercial Funding Corp.: | | | | |
sequential payer Series 2003-C1 Class D, 4.29% 7/5/35 (f) | | 811,000 | | 820,882 |
Series 2002-C1 Class H, 5.903% 1/11/35 (f) | | 925,000 | | 925,698 |
Series 2005-GG3 Class B, 4.894% 8/10/42 (h) | | 885,000 | | 866,716 |
GS Mortgage Securities Corp. II: | | | | |
floater Series 2007-EOP Class L, 5.4585% 3/6/20 (f)(h) | | 2,270,000 | | 2,272,025 |
Series 2012-GCJ7: | | | | |
Class C, 5.721% 5/10/45 (h) | | 3,500,000 | | 3,520,744 |
Class D, 5.721% 5/10/45 (f) | | 2,500,000 | | 2,018,777 |
Commercial Mortgage Securities - continued |
| Principal Amount | | Value |
GS Mortgage Securities Corp. Trust Series 2011-ALF Class E, 4.953% 2/10/21 (f) | | $ 6,300,000 | | $ 6,277,950 |
GS Mortgage Securities Trust Series 2012-GC6 Class C, 5.8273% 1/10/45 (f)(h) | | 2,400,000 | | 2,460,598 |
JPMorgan Chase Commercial Mortgage Securities Corp.: | | | | |
Series 2009-IWST Class D, 7.6935% 12/5/27 (f)(h) | | 2,779,000 | | 3,072,637 |
Series 2010-CNTM Class MZ, 8.5% 8/5/20 (f) | | 2,620,000 | | 2,772,849 |
Series 2010-CNTR Class D, 6.3899% 8/5/32 (f)(h) | | 1,216,000 | | 1,281,341 |
Series 2012-CBX Class C, 5.1909% 6/16/45 (h) | | 1,240,000 | | 1,237,719 |
LB Commercial Conduit Mortgage Trust Series 1998-C4 Class G, 5.6% 10/15/35 (f) | | 800,544 | | 832,114 |
LB-UBS Commercial Mortgage Trust: | | | | |
sequential payer: | | | | |
Series 2005-C3 Class AJ, 4.843% 7/15/40 | | 3,760,000 | | 3,847,503 |
Series 2005-C7 Class AJ, 5.323% 11/15/40 | | 1,240,000 | | 1,272,761 |
Series 2005-C1 Class E, 4.924% 2/15/40 | | 1,000,000 | | 907,156 |
Series 2006-C4 Class AJ, 6.0867% 6/15/38 (h) | | 2,511,000 | | 2,184,487 |
Lehman Brothers Floating Rate Commercial Mortgage Trust floater Series 2007-LLFA Class E, 1.1488% 6/15/22 (f)(h) | | 1,770,000 | | 1,497,509 |
Lstar Commercial Mortgage Trust: | | | | |
Series 2011-1 Class D, 5.6245% 6/25/43 (f)(h) | | 1,564,000 | | 1,460,950 |
Series 2011-1 Class B, 5.6245% 6/25/43 (f)(h) | | 1,897,000 | | 1,941,580 |
Mezz Capital Commercial Mortgage Trust sequential payer Series 2004-C2 Class A, 5.318% 10/15/40 (f) | | 2,638,984 | | 2,005,628 |
Morgan Stanley Capital I Trust: | | | | |
sequential payer: | | | | |
Series 2012-C4 Class E, 5.71% 3/15/45 (f) | | 1,250,000 | | 1,056,250 |
Series 2004-RR2 Class A2, 5.45% 10/28/33 (f) | | 1,446,665 | | 1,450,281 |
Series 2006-HQ10 Class AM, 5.36% 11/12/41 | | 3,769,000 | | 4,065,439 |
Series 1997-RR Class F, 7.35% 4/30/39 (f)(h) | | 290,271 | | 267,049 |
Series 1998-CF1 Class G, 7.35% 7/15/32 (f) | | 1,781,121 | | 1,252,473 |
Series 2006-IQ12 Class AMFX, 5.37% 12/15/43 | | 3,242,000 | | 3,445,769 |
Series 2011-C1 Class C, 5.4216% 9/15/47 (f)(h) | | 2,000,000 | | 2,109,245 |
Series 2011-C2: | | | | |
Class D, 5.4951% 6/15/44 (f)(h) | | 1,532,000 | | 1,437,368 |
Class E, 5.4951% 6/15/44 (f)(h) | | 1,946,000 | | 1,613,429 |
Class F, 5.4951% 6/15/44 (f)(h) | | 1,467,000 | | 1,158,930 |
Class XB, 0.5396% 6/15/44 (f)(h)(i) | | 51,641,000 | | 1,637,020 |
Providence Place Group Ltd. Partnership Series 2000-C1 Class A2, 7.75% 7/20/28 (f) | | 1,000,305 | | 1,180,860 |
RBSCF Trust Series 2010-MB1 Class D, 4.8317% 4/15/24 (f)(h) | | 2,500,000 | | 2,559,495 |
Commercial Mortgage Securities - continued |
| Principal Amount | | Value |
TimberStar Trust I Series 2006-1 Class F, 7.5296% 10/15/36 (f) | | $ 2,026,000 | | $ 2,094,422 |
UBS Commercial Mortgage Trust Series 2007-FL1 Class F, 0.8238% 7/15/24 (f)(h) | | 1,459,000 | | 994,189 |
Wachovia Bank Commercial Mortgage Trust: | | | | |
Series 2004-C10 Class E, 4.931% 2/15/41 | | 1,621,000 | | 1,604,286 |
Series 2004-C12 Class D, 5.4942% 7/15/41 (h) | | 1,824,000 | | 1,835,628 |
Series 2004-C14 Class B, 5.17% 8/15/41 | | 2,708,000 | | 2,856,396 |
WF-RBS Commercial Mortgage Trust: | | | | |
Series 2011-C3: | | | | |
Class C, 5.335% 3/15/44 (f) | | 2,100,000 | | 2,182,349 |
Class D, 5.7221% 3/15/44 (f)(h) | | 1,000,000 | | 863,933 |
Series 2011-C5 Class C, 5.8246% 11/15/44 (f)(h) | | 1,250,000 | | 1,328,314 |
TOTAL COMMERCIAL MORTGAGE SECURITIES (Cost $155,896,539) |
164,848,557
|
Floating Rate Loans - 2.1% |
|
CONSUMER DISCRETIONARY - 0.1% |
Specialty Retail - 0.1% |
The Pep Boys - Manny, Moe & Jack term loan 2.47% 10/27/13 (h) | | 393,832 | | 392,356 |
FINANCIALS - 0.6% |
Real Estate Management & Development - 0.6% |
CB Richard Ellis Services, Inc. Tranche D, term loan 3.7488% 9/4/19 (h) | | 1,022,804 | | 1,014,284 |
Realogy Corp.: | | | | |
Credit-Linked Deposit 3.2458% 10/10/13 (h) | | 235,637 | | 220,320 |
Credit-Linked Deposit 4.4958% 10/10/16 (h) | | 155,605 | | 147,047 |
term loan 4.4988% 10/10/16 (h) | | 1,988,611 | | 1,879,238 |
Tranche 2LN, term loan 13.5% 10/15/17 | | 1,219,000 | | 1,243,380 |
| | 4,504,269 |
HEALTH CARE - 0.6% |
Health Care Providers & Services - 0.6% |
Community Health Systems, Inc. term loan 3.9667% 1/25/17 (h) | | 393,006 | | 390,325 |
Floating Rate Loans - continued |
| Principal Amount | | Value |
HEALTH CARE - continued |
Health Care Providers & Services - continued |
Health Management Associates, Inc. Tranche B, term loan 4.5% 11/18/18 (h) | | $ 497,500 | | $ 497,500 |
Skilled Healthcare Group, Inc. term loan 6.75% 4/9/16 (h) | | 3,234,656 | | 3,234,656 |
| | 4,122,481 |
INDUSTRIALS - 0.4% |
Construction & Engineering - 0.4% |
Drumm Investors LLC Tranche B, term loan 5% 5/4/18 (h) | | 3,216,048 | | 3,095,446 |
TELECOMMUNICATION SERVICES - 0.4% |
Wireless Telecommunication Services - 0.4% |
Crown Castle Operating Co. Tranche B, term loan 4% 1/31/19 (h) | | 1,996,047 | | 1,993,652 |
TowerCo Finance LLC Tranche B, term loan 4.5% 2/2/17 (h) | | 671,306 | | 672,145 |
| | 2,665,797 |
TOTAL FLOATING RATE LOANS (Cost $14,416,993) |
14,780,349
|
Money Market Funds - 5.0% |
| Shares | | |
Fidelity Cash Central Fund, 0.17% (b) | 26,522,347 | | 26,522,347 |
Fidelity Securities Lending Cash Central Fund, 0.18% (b)(c) | 8,300,800 | | 8,300,800 |
TOTAL MONEY MARKET FUNDS (Cost $34,823,147) |
34,823,147
|
TOTAL INVESTMENT PORTFOLIO - 101.3% (Cost $662,416,185) | | 712,137,111 |
NET OTHER ASSETS (LIABILITIES) - (1.3)% | | (9,131,771) |
NET ASSETS - 100% | $ 703,005,340 |
Legend |
(a) Non-income producing |
(b) Affiliated fund that is available only to investment companies and other accounts managed by Fidelity Investments. The rate quoted is the annualized seven-day yield of the fund at period end. A complete unaudited listing of the fund's holdings as of its most recent quarter end is available upon request. In addition, each Fidelity Central Fund's financial statements, which are not covered by the Fund's Report of Independent Registered Public Accounting Firm, are available on the SEC's website or upon request. |
(c) Investment made with cash collateral received from securities on loan. |
(d) Non-income producing - Security is in default. |
(e) Security or a portion of the security is on loan at period end. |
(f) Security exempt from registration under Rule 144A of the Securities Act of 1933. These securities may be resold in transactions exempt from registration, normally to qualified institutional buyers. At the end of the period, the value of these securities amounted to $188,722,969 or 26.8% of net assets. |
(g) Security or a portion of the security purchased on a delayed delivery or when-issued basis. |
(h) Coupon rates for floating and adjustable rate securities reflect the rates in effect at period end. |
(i) Security represents right to receive monthly interest payments on an underlying pool of mortgages or assets. Principal shown is the outstanding par amount of the pool as of the end of the period. |
Affiliated Central Funds |
Information regarding fiscal year to date income earned by the Fund from investments in Fidelity Central Funds is as follows: |
Fund | Income earned |
Fidelity Cash Central Fund | $ 28,159 |
Fidelity Securities Lending Cash Central Fund | 16,499 |
Total | $ 44,658 |
Other Information |
The following is a summary of the inputs used, as of July 31, 2012, involving the Fund's assets and liabilities carried at fair value. The inputs or methodology used for valuing securities may not be an indication of the risk associated with investing in those securities. For more information on valuation inputs, and their aggregation into the levels used in the tables below, please refer to the Security Valuation section in the accompanying Notes to Financial Statements. |
Valuation Inputs at Reporting Date: |
Description | Total | Level 1 | Level 2 | Level 3 |
Investments in Securities: | | | | |
Equities: | | | | |
Consumer Discretionary | $ 3,004,533 | $ 3,004,533 | $ - | $ - |
Financials | 235,061,644 | 222,709,497 | 9,972,147 | 2,380,000 |
Health Care | 8,997,324 | 8,997,324 | - | - |
Corporate Bonds | 200,116,824 | - | 199,026,824 | 1,090,000 |
Asset-Backed Securities | 44,780,309 | - | 29,154,429 | 15,625,880 |
Collateralized Mortgage Obligations | 5,724,424 | - | 5,724,424 | - |
Commercial Mortgage Securities | 164,848,557 | - | 145,694,719 | 19,153,838 |
Floating Rate Loans | 14,780,349 | - | 14,780,349 | - |
Money Market Funds | 34,823,147 | 34,823,147 | - | - |
Total Investments in Securities: | $ 712,137,111 | $ 269,534,501 | $ 404,352,892 | $ 38,249,718 |
The following is a reconciliation of Investments in Securities for which Level 3 inputs were used in determining value: |
Investments in Securities: | |
Asset-Backed Securities | |
Beginning Balance | $ - |
Total Realized Gain (Loss) | 80,722 |
Total Unrealized Gain (Loss) | 2,990,883 |
Cost of Purchases | 16,746,457 |
Proceeds of Sales | (4,700,195) |
Amortization/Accretion | 508,013 |
Transfers in to Level 3 | - |
Transfers out of Level 3 | - |
Ending Balance | $ 15,625,880 |
The change in unrealized gain (loss) for the period attributable to Level 3 securities held at July 31, 2012 | $ 2,990,883 |
Commercial Mortgage Securities | |
Beginning Balance | $ - |
Total Realized Gain (Loss) | 302,885 |
Total Unrealized Gain (Loss) | 1,132,779 |
Cost of Purchases | 21,489,318 |
Proceeds of Sales | (4,606,959) |
Amortization/Accretion | 835,815 |
Transfers in to Level 3 | - |
Transfers out of Level 3 | - |
Ending Balance | $ 19,153,838 |
The change in unrealized gain (loss) for the period attributable to Level 3 securities held at July 31, 2012 | $ 1,132,779 |
Other Investments in Securities | |
Beginning Balance | $ - |
Total Realized Gain (Loss) | - |
Total Unrealized Gain (Loss) | 57,960 |
Cost of Purchases | 3,415,000 |
Proceeds of Sales | - |
Amortization/Accretion | (2,960) |
Transfers in to Level 3 | - |
Transfers out of Level 3 | - |
Ending Balance | $ 3,470,000 |
The change in unrealized gain (loss) for the period attributable to Level 3 securities held at July 31, 2012 | $ 57,960 |
The information used in the above reconciliations represents fiscal year to date activity for any Investments in Securities identified as using Level 3 inputs at either the beginning or the end of the current fiscal period, and includes the value of securities received through affiliated in-kind transactions. See Note 6 of the Notes to Financial Statements. Transfers in or out of Level 3 represent the beginning value of any Security or Instrument where a change in the pricing level occurred from the beginning to the end of the period. The cost of purchases and the proceeds of sales may include securities received or delivered through corporate actions or exchanges. Realized and unrealized gains (losses) disclosed in the reconciliations are included in Net Gain (Loss) on the Fund's Statement of Operations. |
Other Information |
The composition of credit quality ratings as a percentage of net assets is as follows (Unaudited): |
U.S. Government and U.S. Government Agency Obligations | 0.3% |
AAA,AA,A | 9.6% |
BBB | 15.0% |
BB | 6.6% |
B | 13.7% |
CCC,CC,C | 6.4% |
D | 0.2% |
Not Rated | 9.4% |
Equities | 35.1% |
Short-Term Investments and Net Other Assets | 3.7% |
| 100.0% |
We have used ratings from Moody's Investors Service, Inc. Where Moody's® ratings are not available, we have used S&P® ratings. All ratings are as of the date indicated and do not reflect subsequent changes. |
See accompanying notes which are an integral part of the financial statements.
Annual Report
Statement of Assets and Liabilities
| July 31, 2012 |
| | |
Assets | | |
Investment in securities, at value (including securities loaned of $7,764,432) - See accompanying schedule: Unaffiliated issuers (cost $627,593,038) | $ 677,313,964 | |
Fidelity Central Funds (cost $34,823,147) | 34,823,147 | |
Total Investments (cost $662,416,185) | | $ 712,137,111 |
Cash | | 862,984 |
Receivable for investments sold | | 440,096 |
Receivable for fund shares sold | | 59,400 |
Dividends receivable | | 402,823 |
Interest receivable | | 4,384,763 |
Distributions receivable from Fidelity Central Funds | | 6,441 |
Other receivables | | 574 |
Total assets | | 718,294,192 |
| | |
Liabilities | | |
Payable for investments purchased
Regular delivery | $ 5,760,431 | |
Delayed delivery | 754,525 | |
Accrued management fee | 323,740 | |
Other affiliated payables | 85,957 | |
Other payables and accrued expenses | 63,399 | |
Collateral on securities loaned, at value | 8,300,800 | |
Total liabilities | | 15,288,852 |
| | |
Net Assets | | $ 703,005,340 |
Net Assets consist of: | | |
Paid in capital | | $ 639,692,000 |
Undistributed net investment income | | 8,139,158 |
Accumulated undistributed net realized gain (loss) on investments and foreign currency transactions | | 5,453,252 |
Net unrealized appreciation (depreciation) on investments and assets and liabilities in foreign currencies | | 49,720,930 |
Net Assets | | $ 703,005,340 |
See accompanying notes which are an integral part of the financial statements.
Annual Report
Financial Statements - continued
Statement of Assets and Liabilities - continued
| July 31, 2012 |
| | |
Series Real Estate Income: Net Asset Value, offering price and redemption price per share ($416,151,002 ÷ 37,480,308 shares) | | $ 11.10 |
| | |
Class F:
Net Asset Value, offering price and redemption price per share ($286,854,338 ÷ 25,825,884 shares) | | $ 11.11 |
See accompanying notes which are an integral part of the financial statements.
Annual Report
Statement of Operations
For the period October 20, 2011
(commencement of operations)
to July 31, 2012 |
| | |
Investment Income | | |
Dividends | | $ 9,026,260 |
Interest | | 21,303,452 |
Income from Fidelity Central Funds | | 44,658 |
Total income | | 30,374,370 |
| | |
Expenses | | |
Management fee | $ 2,606,696 | |
Transfer agent fees | 544,307 | |
Accounting and security lending fees | 219,045 | |
Custodian fees and expenses | 7,920 | |
Independent trustees' compensation | 2,829 | |
Audit | 72,166 | |
Legal | 520 | |
Miscellaneous | 1,515 | |
Total expenses before reductions | 3,454,998 | |
Expense reductions | (2,276) | 3,452,722 |
Net investment income (loss) | | 26,921,648 |
Realized and Unrealized Gain (Loss) Net realized gain (loss) on: | | |
Investment securities: | | |
Unaffiliated issuers | 5,969,934 | |
Foreign currency transactions | (307) | |
Total net realized gain (loss) | | 5,969,627 |
Change in net unrealized appreciation (depreciation) on: Investment securities | 49,720,926 | |
Assets and liabilities in foreign currencies | 4 | |
Total change in net unrealized appreciation (depreciation) | | 49,720,930 |
Net gain (loss) | | 55,690,557 |
Net increase (decrease) in net assets resulting from operations | | $ 82,612,205 |
See accompanying notes which are an integral part of the financial statements.
Annual Report
Financial Statements - continued
Statement of Changes in Net Assets
| For the period October 20, 2011
(commencement of operations) to
July 31, 2012 |
Increase (Decrease) in Net Assets | |
Operations | |
Net investment income (loss) | $ 26,921,648 |
Net realized gain (loss) | 5,969,627 |
Change in net unrealized appreciation (depreciation) | 49,720,930 |
Net increase (decrease) in net assets resulting
from operations | 82,612,205 |
Distributions to shareholders from net investment income | (18,782,490) |
Distributions to shareholders from net realized gain | (516,375) |
Total distributions | (19,298,865) |
Share transactions - net increase (decrease) | 639,692,000 |
Total increase (decrease) in net assets | 703,005,340 |
| |
Net Assets | |
Beginning of period | - |
End of period (including undistributed net investment income of $8,139,158) | $ 703,005,340 |
See accompanying notes which are an integral part of the financial statements.
Annual Report
Financial Highlights - Series Real Estate Income
| Period ended
July 31, 2012 G |
Selected Per-Share Data | |
Net asset value, beginning of period | $ 10.00 |
Income from Investment Operations | |
Net investment income (loss) D | .47 |
Net realized and unrealized gain (loss) | .97 |
Total from investment operations | 1.44 |
Distributions from net investment income | (.33) |
Distributions from net realized gain | (.01) |
Total distributions | (.34) |
Net asset value, end of period | $ 11.10 |
Total Return B,C | 14.67% |
Ratios to Average Net Assets E,H | |
Expenses before reductions | .80% A |
Expenses net of fee waivers, if any | .80% A |
Expenses net of all reductions | .80% A |
Net investment income (loss) | 5.70% A |
Supplemental Data | |
Net assets, end of period (000 omitted) | $ 416,151 |
Portfolio turnover rate F | 29% A |
A Annualized
B Total returns for periods of less than one year are not annualized.
C Total returns would have been lower if certain expenses had not been reduced during the applicable periods shown.
D Calculated based on average shares outstanding during the period.
E Fees and expenses of any underlying Fidelity Central Funds are not included in the Fund's expense ratio. The Fund indirectly bears its proportionate share of the expenses of any underlying Fidelity Central Funds.
F Amount does not include the portfolio activity of any underlying Fidelity Central Funds.
G For the period October 20, 2011 (commencement of operations) to July 31, 2012.
H Expense ratios reflect operating expenses of the class. Expenses before reductions do not reflect amounts reimbursed by the investment adviser or reductions from brokerage service arrangements or reductions from other expense offset arrangements and do not represent the amount paid by the class during periods when reimbursements or reductions occur. Expense ratios before reductions for start-up periods may not be representative of longer-term operating periods. Expenses net of fee waivers reflect expenses after reimbursement by the investment adviser but prior to reductions from brokerage service arrangements or other expense offset arrangements. Expenses net of all reductions represent the net expenses paid by the class.
See accompanying notes which are an integral part of the financial statements.
Annual Report
Financial Highlights - Class F
| Period ended
July 31, 2012 G |
Selected Per-Share Data | |
Net asset value, beginning of period | $ 10.00 |
Income from Investment Operations | |
Net investment income (loss) D | .48 |
Net realized and unrealized gain (loss) | .98 |
Total from investment operations | 1.46 |
Distributions from net investment income | (.34) |
Distributions from net realized gain | (.01) |
Total distributions | (.35) |
Net asset value, end of period | $ 11.11 |
Total Return B,C | 14.89% |
Ratios to Average Net Assets E,H | |
Expenses before reductions | .62% A |
Expenses net of fee waivers, if any | .62% A |
Expenses net of all reductions | .62% A |
Net investment income (loss) | 5.88% A |
Supplemental Data | |
Net assets, end of period (000 omitted) | $ 286,854 |
Portfolio turnover rate F | 29% A |
A Annualized
B Total returns for periods of less than one year are not annualized.
C Total returns would have been lower if certain expenses had not been reduced during the applicable periods shown.
D Calculated based on average shares outstanding during the period.
E Fees and expenses of any underlying Fidelity Central Funds are not included in the Fund's expense ratio. The Fund indirectly bears its proportionate share of the expenses of any underlying Fidelity Central Funds.
F Amount does not include the portfolio activity of any underlying Fidelity Central Funds.
G For the period October 20, 2011 (commencement of operations) to July 31, 2012.
H Expense ratios reflect operating expenses of the class. Expenses before reductions do not reflect amounts reimbursed by the investment adviser or reductions from brokerage service arrangements or reductions from other expense offset arrangements and do not represent the amount paid by the class during periods when reimbursements or reductions occur. Expense ratios before reductions for start-up periods may not be representative of longer-term operating periods. Expenses net of fee waivers reflect expenses after reimbursement by the investment adviser but prior to reductions from brokerage service arrangements or other expense offset arrangements. Expenses net of all reductions represent the net expenses paid by the class.
See accompanying notes which are an integral part of the financial statements.
Annual Report
Notes to Financial Statements
For the period ended July 31, 2012
1. Organization.
Fidelity Series Real Estate Income Fund (the Fund) is a fund of Fidelity Securities Fund (the Trust) and is authorized to issue an unlimited number of shares. Shares of the Fund are only available for purchase by mutual funds for which Fidelity Management & Research Company (FMR) or an affiliate serves as an investment manager. The Trust is registered under the Investment Company Act of 1940, as amended (the 1940 Act), as an open-end management investment company organized as a Massachusetts business trust. The Fund offers Series Real Estate Income shares and Class F shares, each of which, has equal rights as to assets and voting privileges. Each class has exclusive voting rights with respect to matters that affect that class. Investment income, realized and unrealized capital gains and losses, the common expenses of the Fund, and certain fund-level expense reductions, if any, are allocated on a pro-rata basis to each class based on the relative net assets of each class to the total net assets of the Fund. Each class differs with respect to transfer agent fees incurred. Certain expense reductions may also differ by class.
2. Investments in Fidelity Central Funds.
The Fund invests in Fidelity Central Funds, which are open-end investment companies available only to other investment companies and accounts managed by FMR and its affiliates. The Fund's Schedule of Investments lists each of the Fidelity Central Funds held as of period end, if any, as an investment of the Fund, but does not include the underlying holdings of each Fidelity Central Fund. As an Investing Fund, the Fund indirectly bears its proportionate share of the expenses of the underlying Fidelity Central Funds.
The Money Market Central Funds seek preservation of capital and current income and are managed by Fidelity Investments Money Management, Inc. (FIMM), an affiliate of FMR.
A complete unaudited list of holdings for each Fidelity Central Fund is available upon request or at the Securities and Exchange Commission (the SEC) web site at www.sec.gov. In addition, the financial statements of the Fidelity Central Funds, which are not covered by the Fund's Report of Independent Registered Public Accounting Firm, are available on the SEC web site or upon request.
3. Significant Accounting Policies.
The financial statements have been prepared in conformity with accounting principles generally accepted in the United States of America (GAAP), which require management to make certain estimates and assumptions at the date of the financial statements. Actual results could differ from those estimates. Subsequent events, if any, through the date that the financial statements were issued have been evaluated in the preparation of the financial statements. The following summarizes the significant accounting policies of the Fund:
Annual Report
3. Significant Accounting Policies - continued
Security Valuation. Investments are valued as of 4:00 p.m. Eastern time on the last calendar day of the period. In accordance with valuation policies and procedures approved by the Board of Trustees (the Board), the Fund attempts to obtain prices from one or more third party pricing vendor or broker to value its investments. When current market prices, quotations or rates are not readily available or reliable, securities will be fair valued in good faith by the FMR Fair Value Committee (the Committee), in accordance with procedures adopted by the Fund's Board. Factors used in determining fair value vary by security type and may include market or security specific events, changes in interest rates and credit quality. The frequency with which these procedures are used cannot be predicted and they may be utilized to a significant extent. The Committee oversees the Fund's valuation policies and procedures and is responsible for approving and reporting to the Board all fair value determinations.
The Fund categorizes the inputs to valuation techniques used to value its investments into a disclosure hierarchy consisting of three levels as shown below:
Level 1 - quoted prices in active markets for identical investments
Level 2 - other significant observable inputs (including quoted prices for similar investments, interest rates, prepayment speeds, etc.)
Level 3 - unobservable inputs (including the Fund's own assumptions based on the best information available)
Valuation techniques used to value the Fund's investments by major category are as follows:
Equity securities, including restricted securities, for which market quotations are readily available, are valued at the last reported sale price or official closing price as reported by a third party pricing vendor on the primary market or exchange on which they are traded and are categorized as Level 1 in the hierarchy. In the event there were no sales during the day or closing prices are not available, securities are valued at the last quoted bid price or may be valued using the last available price and are generally categorized as Level 2 in the hierarchy. For foreign equity securities, when significant market or security specific events arise, comparisons to the valuation of American Depositary Receipts (ADRs), futures contracts, Exchange-Traded Funds (ETFs) and certain indexes as well as quoted prices for similar securities are used and are categorized as Level 2 in the hierarchy. Utilizing these techniques may result in transfers between Level 1 and Level 2.
Annual Report
Notes to Financial Statements - continued
3. Significant Accounting Policies - continued
Security Valuation - continued
Debt securities, including restricted securities, are valued based on evaluated prices received from third party pricing vendors or from brokers who make markets in such securities. For corporate bonds and floating rate loans, pricing vendors utilize matrix pricing which considers yield or price of bonds of comparable quality, coupon, maturity and type as well as broker-supplied prices and are generally categorized as Level 2 in the hierarchy. For asset backed securities, collateralized mortgage obligations and commercial mortgage securities, pricing vendors utilize matrix pricing which considers prepayment speed assumptions, attributes of the collateral, yield or price of bonds of comparable quality, coupon, maturity and type as well as broker-supplied prices and, accordingly, such securities are generally categorized as Level 2 in the hierarchy. Independent prices obtained from a single source or broker are evaluated by management and may be categorized as Level 3 within the fair value hierarchy. When independent prices are unavailable or unreliable, debt securities may be valued utilizing pricing methodologies which consider similar factors that would be used by third party pricing vendors. These are generally categorized as Level 2 in the hierarchy but may be Level 3 depending on the circumstances. The Fund invests a significant portion of its assets in below investment grade securities. The value of these securities can be more volatile due to changes in the credit quality of the issuer and is sensitive to changes in economic, market and regulatory conditions.
Investments in open-end mutual funds, including the Fidelity Central Funds, are valued at their closing net asset value each business day and are categorized as Level 1 in the hierarchy.
The following provides information on Level 3 securities held by the Fund that were valued at period end based on unobservable inputs. These amounts exclude valuations provided by a broker.
Asset Type | Fair Value at
07/31/12 | Valuation
Technique(s) | Unobservable
Input | Range | Weighted
Average |
Asset-Backed
Securities |
$ 3,141,701
| Discounted
cash flow
Market
comparable |
Yield
Spread
|
8.5%-12.5%
4.75%
|
8.75%
4.75%
|
Commercial Mortgage Securities |
$ 5,515,634
| Market
comparable |
Spread
|
11.54%-31.63%
|
21.75%
|
Significant increases in any of the unobservable inputs listed in the table above would result in a significant decrease to the fair value measurement.
Changes in valuation techniques may result in transfers in or out of an assigned level within the disclosure hierarchy. The aggregate value of investments by input level, as of July 31, 2012, as well as a roll forward of Level 3 securities, is included at the end of the Fund's Schedule of Investments.
Annual Report
3. Significant Accounting Policies - continued
Foreign Currency Translation. The Fund may use foreign currency contracts to facilitate transactions in foreign-denominated securities. Gains and losses from these transactions may arise from changes in the value of the foreign currency or if the counterparties do not perform under the contracts' terms.
Foreign-denominated assets, including investment securities, and liabilities are translated into U.S. dollars at the exchange rates at period end. Purchases and sales of investment securities, income and dividends received and expenses denominated in foreign currencies are translated into U.S. dollars at the exchange rate in effect on the transaction date.
The effects of exchange rate fluctuations on investments are included with the net realized and unrealized gain (loss) on investment securities. Other foreign currency transactions resulting in realized and unrealized gain (loss) are disclosed separately.
Investment Transactions and Income. For financial reporting purposes, the Fund's investment holdings and NAV include trades executed through the end of the last business day of the period. The NAV per share for processing shareholder transactions is calculated as of the close of business of the New York Stock Exchange (NYSE), normally 4:00 p.m. Eastern time and includes trades executed through the end of the prior business day. Gains and losses on securities sold are determined on the basis of identified cost. Dividend income is recorded on the ex-dividend date, except for certain dividends from foreign securities where the ex-dividend date may have passed, which are recorded as soon as the Fund is informed of the ex-dividend date. Non-cash dividends included in dividend income, if any, are recorded at the fair market value of the securities received. Distributions received on securities that represent a return of capital or capital gain are recorded as a reduction of cost of investments and/or as a realized gain. The Fund estimates the components of distributions received that may be considered return of capital distributions or capital gain distributions. Interest income and distributions from the Fidelity Central Funds are accrued as earned. Interest income includes coupon interest and amortization of premium and accretion of discount on debt securities. Investment income is recorded net of foreign taxes withheld where recovery of such taxes is uncertain. Debt obligations may be placed on non-accrual status and related interest income may be reduced by ceasing current accruals and writing off interest receivables when the collection of all or a portion of interest has become doubtful based on consistently applied procedures. A debt obligation is removed from non-accrual status when the issuer resumes interest payments or when collectability of interest is reasonably assured.
Annual Report
Notes to Financial Statements - continued
3. Significant Accounting Policies - continued
Expenses. Expenses directly attributable to a fund are charged to that fund. Expenses attributable to more than one fund are allocated among the respective funds on the basis of relative net assets or other appropriate methods. Expense estimates are accrued in the period to which they relate and adjustments are made when actual amounts are known.
Income Tax Information and Distributions to Shareholders. Each year, the Fund intends to qualify as a regulated investment company under Subchapter M of the Internal Revenue Code, including distributing substantially all of its taxable income and realized gains. As a result, no provision for income taxes is required. As of July 31, 2012, the Fund did not have any unrecognized tax benefits in the financial statements; nor is the Fund aware of any tax positions for which it is reasonably possible that the total amounts of unrecognized tax benefits will significantly change in the next twelve months. The Fund files a U.S. federal tax return, in addition to state and local tax returns as required. A fund's federal income tax returns are subject to examination by the Internal Revenue Service (IRS) for a period of three fiscal years after they are filed. State and local tax returns may be subject to examination for an additional fiscal year depending on the jurisdiction. Foreign taxes are provided for based on the Fund's understanding of the tax rules and rates that exist in the foreign markets in which it invests.
Distributions are declared and recorded on the ex-dividend date. Income dividends and capital gain distributions are declared separately for each class. Income and capital gain distributions are determined in accordance with income tax regulations, which may differ from GAAP.
Capital accounts within the financial statements are adjusted for permanent book-tax differences. These adjustments have no impact on net assets or the results of operations. Temporary book-tax differences will reverse in a subsequent period.
Book-tax differences are primarily due to foreign currency transactions, passive foreign investment companies (PFIC), market discount, equity-debt classifications, and losses deferred due to wash sales.
The federal tax cost of investment securities and unrealized appreciation (depreciation) as of period end were as follows:
Gross unrealized appreciation | $ 51,926,321 |
Gross unrealized depreciation | (2,720,362) |
Net unrealized appreciation (depreciation) on securities and other investments | $ 49,205,959 |
| |
Tax Cost | $ 662,931,152 |
Annual Report
3. Significant Accounting Policies - continued
Income Tax Information and Distributions to Shareholders - continued
The tax-based components of distributable earnings as of period end were as follows:
Undistributed ordinary income | $ 13,515,230 |
Undistributed long-term capital gain | $ 647,224 |
Net unrealized appreciation (depreciation) | $ 49,205,963 |
The tax character of distributions paid was as follows:
| July 31, 2012 |
Ordinary Income | $ 19,298,865 |
New Accounting Pronouncement. In December 2011, the Financial Accounting Standards Board issued Accounting Standard Update No. 2011-11, Disclosures about Offsetting Assets and Liabilities. The update creates new disclosure requirements requiring entities to disclose both gross and net information for derivatives and other financial instruments that are either offset in the Statement of Assets and Liabilities or subject to an enforceable master netting arrangement or similar agreement. The disclosure requirements are effective for interim and annual reporting periods beginning on or after January 1, 2013. Management is currently evaluating the impact of the update's adoption on the Fund's financial statement disclosures.
4. Operating Policies.
Delayed Delivery Transactions and When-Issued Securities. During the period, the Fund transacted in securities on a delayed delivery or when-issued basis. Payment and delivery may take place after the customary settlement period for that security. The price of the underlying securities and the date when the securities will be delivered and paid for are fixed at the time the transaction is negotiated. The securities purchased on a delayed delivery or when-issued basis are identified as such in the Fund's Schedule of Investments. The Fund may receive compensation for interest forgone in the purchase of a delayed delivery or when-issued security. With respect to purchase commitments, the Fund identifies securities as segregated in its records with a value at least equal to the amount of the commitment. Losses may arise due to changes in the value of the underlying securities or if the counterparty does not perform under the contract's terms, or if the issuer does not issue the securities due to political, economic, or other factors.
Annual Report
Notes to Financial Statements - continued
4. Operating Policies - continued
Restricted Securities. The Fund may invest in securities that are subject to legal or contractual restrictions on resale. These securities generally may be resold in transactions exempt from registration or to the public if the securities are registered. Disposal of these securities may involve time-consuming negotiations and expense, and prompt sale at an acceptable price may be difficult. Information regarding restricted securities is included at the end of the Fund's Schedule of Investments.
Loans and Other Direct Debt Instruments. The Fund invest in direct debt instruments which are interests in amounts owed to lenders by corporate or other borrowers. These instruments may be in the form of loans, trade claims or other receivables and may include standby financing commitments such as revolving credit facilities that obligate the Fund to supply additional cash to the borrower on demand. Loans may be acquired through assignment or participation, or may be made directly to a borrower. The Fund may be contractually obligated to receive approval from the agent bank and/or borrower prior to the sale of these loans.
5. Purchases and Sales of Investments.
Purchases and sales of securities, other than short-term securities and U.S. government securities, aggregated $745,773,733 and $129,718,961, respectively.
6. Fees and Other Transactions with Affiliates.
Management Fee. FMR and its affiliates provide the Fund with investment management related services for which the Fund pays a monthly management fee. The management fee is the sum of an individual fund fee rate that is based on an annual rate of .30% of the Fund's average net assets and an annualized group fee rate that averaged .26% during the period. The group fee rate is based upon the average net assets of all the mutual funds advised by FMR. The group fee rate decreases as assets under management increase and increases as assets under management decrease. For the period, the total annualized management fee rate was .56% of the Fund's average net assets.
Transfer Agent Fees. Fidelity Investments Institutional Operations Company, Inc. (FIIOC), an affiliate of FMR, is the transfer, dividend disbursing and shareholder servicing agent for each class of the Fund. FIIOC receives account fees and asset-based fees that vary according to the account size and type of account of the shareholders of Series Real Estate Income, except for Class F. FIIOC receives no fees for providing transfer agency services to Class F. FIIOC pays for typesetting, printing and mailing of shareholder reports, except proxy statements. For the period, transfer agent fees for each class were as follows:
Annual Report
6. Fees and Other Transactions with Affiliates - continued
Transfer Agent Fees - continued
| Amount | % of
Average
Net Assets* |
Series Real Estate Income | $ 544,307 | .18 |
* Annualized
Accounting and Security Lending Fees. Fidelity Service Company, Inc. (FSC), an affiliate of FMR, maintains the Fund's accounting records. The accounting fee is based on the level of average net assets for each month. Under a separate contract, FSC administers the security lending program. The security lending fee is based on the number and duration of lending transactions.
Brokerage Commissions. The Fund placed a portion of its portfolio transactions with brokerage firms which are affiliates of the investment adviser. The commissions paid to these affiliated firms were $1,982 for the period.
Exchanges In-Kind. During the period, certain investment companies managed by FMR or its affiliates (Investing Funds) completed exchanges in-kind with the Fund. The Investing Funds delivered cash and securities, including accrued interest, valued at $490,818,718 in exchange for 49,081,872 shares of the Fund. The amount of in-kind exchanges is included in share transactions in the accompanying Statement of Changes in Net Assets as well as Note 11: Share Transactions. The Fund recognized no gain or loss for federal income tax purposes.
7. Committed Line of Credit.
The Fund participates with other funds managed by FMR or an affiliate in a $4.25 billion credit facility (the "line of credit") to be utilized for temporary or emergency purposes to fund shareholder redemptions or for other short-term liquidity purposes. The Fund has agreed to pay commitment fees on its pro-rata portion of the line of credit, which amounted to $529 and is reflected in Miscellaneous expenses on the Statement of Operations. During the period, there were no borrowings on this line of credit.
Annual Report
Notes to Financial Statements - continued
8. Security Lending.
The Fund lends portfolio securities through a lending agent from time to time in order to earn additional income. For equity securities, a lending agent is used and may loan securities to certain qualified borrowers, including Fidelity Capital Markets (FCM), a broker-dealer affiliated with the Fund. On the settlement date of the loan, the Fund receives collateral (in the form of U.S. Treasury obligations, letters of credit and/or cash) against the loaned securities and maintains collateral in an amount not less than 100% of the market value of the loaned securities during the period of the loan. The market value of the loaned securities is determined at the close of business of the Fund and any additional required collateral is delivered to the Fund on the next business day. If the borrower defaults on its obligation to return the securities loaned because of insolvency or other reasons, a fund could experience delays and costs in recovering the securities loaned or in gaining access to the collateral. Any cash collateral received is invested in the Fidelity Securities Lending Cash Central Fund. The value of loaned securities and cash collateral at period end are disclosed on the Fund's Statement of Assets and Liabilities. Security lending income represents the income earned on investing cash collateral, less rebates paid to borrowers, plus any premium payments received for lending certain types of securities. Security lending income is presented in the Statement of Operations as a component of income from Fidelity Central Funds. Total security lending income during the period amounted to $16,499. During the period, there were no securities loaned to FCM.
9. Expense Reductions.
Many of the brokers with whom FMR places trades on behalf of the Fund provided services to the Fund in addition to trade execution. These services included payments of certain expenses on behalf of the Fund totaling $1,974 for the period. In addition, through arrangements with the Fund's custodian, credits realized as a result of uninvested cash balances were used to reduce the Fund's expenses. During the period, these credits reduced the Fund's custody expenses by $302.
10. Distributions to Shareholders.
Distributions to shareholders of each class were as follows:
| Period ended
July 31,
2012 A |
From net investment income | |
Series Real Estate Income | $ 12,027,607 |
Class F | 6,754,883 |
Total | $ 18,782,490 |
Annual Report
10. Distributions to Shareholders - continued
| Period ended
July 31,
2012 A |
From net realized gain | |
Series Real Estate Income | $ 360,160 |
Class F | 156,215 |
Total | $ 516,375 |
A For the period October 20, 2011 (commencement of operations) to July 31, 2012.
11. Share Transactions.
Transactions for each class of shares were as follows:
| Shares | Dollars |
| Period ended
July 31,
2012 A | Period ended
July 31,
2012 A |
Series Real Estate Income | | |
Shares sold | 37,244,380 B | $ 373,024,203 B |
Reinvestment of distributions | 1,190,173 | 12,387,767 |
Shares redeemed | (954,245) | (9,701,976) |
Net increase (decrease) | 37,480,308 | $ 375,709,994 |
Class F | | |
Shares sold | 25,373,246 B | $ 259,200,242 B |
Reinvestment of distributions | 661,737 | 6,911,098 |
Shares redeemed | (209,099) | (2,129,334) |
Net increase (decrease) | 25,825,884 | $ 263,982,006 |
A For the period October 20, 2011 (commencement of operations) to July 31, 2012.
B Amount includes in-kind exchanges (see Note 6: Exchanges In-Kind)
12. Other.
The Fund's organizational documents provide former and current trustees and officers with a limited indemnification against liabilities arising in connection with the performance of their duties to the Fund. In the normal course of business, the Fund may also enter into contracts that provide general indemnifications. The Fund's maximum exposure under these arrangements is unknown as this would be dependent on future claims that may be made against the Fund. The risk of material loss from such claims is considered remote.
At the end of the period, mutual funds managed by FMR or an affiliate were the owners of record of all of the outstanding shares of the Fund.
Annual Report
To the Trustees of Fidelity Securities Fund and Shareholders of Fidelity Series Real Estate Income Fund:
We have audited the accompanying statement of assets and liabilities of Fidelity Series Real Estate Income Fund (the Fund), a fund of Fidelity Securities Fund, including the schedule of investments, as of July 31, 2012, and the related statement of operations, the statement of changes in net assets and the financial highlights for the period from October 20, 2011 (commencement of operations) to July 31, 2012. These financial statements and financial highlights are the responsibility of the Fund's management. Our responsibility is to express an opinion on these financial statements and financial highlights based on our audit.
We conducted our audits in accordance with the standards of the Public Company Accounting Oversight Board (United States). Those standards require that we plan and perform the audit to obtain reasonable assurance about whether the financial statements and financial highlights are free of material misstatement. The Fund is not required to have, nor were we engaged to perform, an audit of its internal control over financial reporting. Our audits included consideration of internal control over financial reporting as a basis for designing audit procedures that are appropriate in the circumstances, but not for the purpose of expressing an opinion on the effectiveness of the Fund's internal control over financial reporting. Accordingly, we express no such opinion. An audit also includes examining, on a test basis, evidence supporting the amounts and disclosures in the financial statements, assessing the accounting principles used and significant estimates made by management, as well as evaluating the overall financial statement presentation. Our procedures included confirmation of securities owned as of July 31, 2012, by correspondence with the custodians and brokers; where replies were not received from brokers, we performed other auditing procedures. We believe that our audit provide a reasonable basis for our opinion.
In our opinion, the financial statements and financial highlights referred to above present fairly, in all material respects, the financial position of Fidelity Series Real Estate Income Fund as of July 31, 2012, the results of its operations, the changes in net assets, and the financial highlights for the period from October 20, 2011 (commencement of operations) to July 31, 2012, in conformity with accounting principles generally accepted in the United States of America.
DELOITTE & TOUCHE LLP
Boston, Massachusetts
September 19, 2012
Annual Report
The Trustees, Members of the Advisory Board, and executive officers of the trust and fund, as applicable, are listed below. The Board of Trustees governs the fund and is responsible for protecting the interests of shareholders. The Trustees are experienced executives who meet periodically throughout the year to oversee the fund's activities, review contractual arrangements with companies that provide services to the fund, oversee management of the risks associated with such activities and contractual arrangements, and review the fund's performance. Except for James C. Curvey, each of the Trustees oversees 228 funds advised by FMR or an affiliate. Mr. Curvey oversees 435 funds advised by FMR or an affiliate.
The Trustees hold office without limit in time except that (a) any Trustee may resign; (b) any Trustee may be removed by written instrument, signed by at least two-thirds of the number of Trustees prior to such removal; (c) any Trustee who requests to be retired or who has become incapacitated by illness or injury may be retired by written instrument signed by a majority of the other Trustees; and (d) any Trustee may be removed at any special meeting of shareholders by a two-thirds vote of the outstanding voting securities of the trust. Each Trustee who is not an interested person (as defined in the 1940 Act) (Independent Trustee), shall retire not later than the last day of the calendar year in which his or her 75th birthday occurs. The Independent Trustees may waive this mandatory retirement age policy with respect to individual Trustees. The executive officers and Advisory Board Members hold office without limit in time, except that any officer and Advisory Board Member may resign or may be removed by a vote of a majority of the Trustees at any regular meeting or any special meeting of the Trustees. Except as indicated, each individual has held the office shown or other offices in the same company for the past five years.
Experience, Skills, Attributes, and Qualifications of the Fund's Trustees. The Governance and Nominating Committee has adopted a statement of policy that describes the experience, qualifications, attributes, and skills that are necessary and desirable for potential Independent Trustee candidates (Statement of Policy). The Board believes that each Trustee satisfied at the time he or she was initially elected or appointed a Trustee, and continues to satisfy, the standards contemplated by the Statement of Policy. The Governance and Nominating Committee also engages professional search firms to help identify potential Independent Trustee candidates who have the experience, qualifications, attributes, and skills consistent with the Statement of Policy. From time to time, additional criteria based on the composition and skills of the current Independent Trustees, as well as experience or skills that may be appropriate in light of future changes to board composition, business conditions, and regulatory or other developments, have also been considered by the professional search firms and the Governance and Nominating Committee. In addition, the Board takes into account the Trustees' commitment and participation in Board and committee meetings, as well as their leadership of standing and ad hoc committees throughout their tenure.
In determining that a particular Trustee was and continues to be qualified to serve as a Trustee, the Board has considered a variety of criteria, none of which, in isolation, was controlling. The Board believes that, collectively, the Trustees have balanced and diverse experience, qualifications, attributes, and skills, which allow the Board to operate effectively in governing the fund and protecting the interests of shareholders. Information about the specific experience, skills, attributes, and qualifications of each Trustee, which in each case led to the Board's conclusion that the Trustee should serve (or continue to serve) as a trustee of the fund, is provided below.
Annual Report
Trustees and Officers - continued
Board Structure and Oversight Function. James C. Curvey is an interested person (as defined in the 1940 Act) and currently serves as Chairman. The Trustees have determined that an interested Chairman is appropriate and benefits shareholders because an interested Chairman has a personal and professional stake in the quality and continuity of services provided to the fund. Independent Trustees exercise their informed business judgment to appoint an individual of their choosing to serve as Chairman, regardless of whether the Trustee happens to be independent or a member of management. The Independent Trustees have determined that they can act independently and effectively without having an Independent Trustee serve as Chairman and that a key structural component for assuring that they are in a position to do so is for the Independent Trustees to constitute a substantial majority for the Board. The Independent Trustees also regularly meet in executive session. Ned C. Lautenbach serves as Chairman of the Independent Trustees and as such (i) acts as a liaison between the Independent Trustees and management with respect to matters important to the Independent Trustees and (ii) with management prepares agendas for Board meetings.
Fidelity funds are overseen by different Boards of Trustees. The fund's Board oversees Fidelity's equity and high income funds and another Board oversees Fidelity's investment-grade bond, money market, and asset allocation funds. The asset allocation funds may invest in Fidelity funds overseen by the fund's Board. The use of separate Boards, each with its own committee structure, allows the Trustees of each group of Fidelity funds to focus on the unique issues of the funds they oversee, including common research, investment, and operational issues. On occasion, the separate Boards establish joint committees to address issues of overlapping consequences for the Fidelity funds overseen by each Board.
The Trustees operate using a system of committees to facilitate the timely and efficient consideration of all matters of importance to the Trustees, the fund, and fund shareholders and to facilitate compliance with legal and regulatory requirements and oversight of the fund's activities and associated risks. The Board, acting through its committees, has charged FMR and its affiliates with (i) identifying events or circumstances the occurrence of which could have demonstrably adverse effects on the fund's business and/or reputation; (ii) implementing processes and controls to lessen the possibility that such events or circumstances occur or to mitigate the effects of such events or circumstances if they do occur; and (iii) creating and maintaining a system designed to evaluate continuously business and market conditions in order to facilitate the identification and implementation processes described in (i) and (ii) above. Because the day-to-day operations and activities of the fund are carried out by or through FMR, its affiliates and other service providers, the fund's exposure to risks is mitigated but not eliminated by the processes overseen by the Trustees. While each of the Board's committees has responsibility for overseeing different aspects of the fund's activities, oversight is exercised primarily through the Operations, Audit, and Compliance Committees. In addition, the Independent Trustees have worked with FMR to enhance the Board's oversight of investment and financial risks, legal and regulatory risks, technology risks, and operational risks, including the development of additional risk reporting to the Board. For example, a working group comprised of Independent Trustees and FMR has worked and continues to work to review the Fidelity funds' valuation-related activities, reporting and risk management. Appropriate personnel, including but not limited to the fund's Chief Compliance Officer (CCO), FMR's internal auditor, the independent accountants, the fund's Treasurer and portfolio management personnel, make periodic reports to the Board's committees, as appropriate, including an annual review of FMR's risk management program for the Fidelity funds. The responsibilities of each standing committee, including their oversight responsibilities, are described further under "Standing Committees of the Fund's Trustees."
Annual Report
The fund's Statements of Additional Information (SAIs) include more information about the Trustees. To request a free copy, call Fidelity at 1-800-544-8544 for Fidelity Series Real Estate Income Fund or 1-800-835-5092 for Class F.
Interested Trustees*:
Correspondence intended for each Trustee who is an interested person may be sent to Fidelity Investments, 82 Devonshire Street, Boston, Massachusetts 02109.
Name, Age; Principal Occupations and Other Relevant Experience+ |
James C. Curvey (77) |
| Year of Election or Appointment: 2007 Mr. Curvey is Trustee and Chairman of the Board of Trustees of certain Trusts. Mr. Curvey also serves as Trustee (2007-present) of other investment companies advised by FMR. Mr. Curvey is a Director of Fidelity Investments Money Management, Inc. (2009-present), Director of Fidelity Research & Analysis Co. (2009-present) and Director of FMR and FMR Co., Inc. (2007-present). Mr. Curvey is also Vice Chairman (2007-present) and Director of FMR LLC. In addition, Mr. Curvey serves as an Overseer for the Boston Symphony Orchestra and a member of the Trustees of Villanova University. Previously, Mr. Curvey was the Vice Chairman (2006-2007) and Director (2000-2007) of FMR Corp. |
Ronald P. O'Hanley (55) |
| Year of Election or Appointment: 2011 Mr. O'Hanley is Director of FMR Co., Inc. (2010-present), Director of Fidelity Investments Money Management, Inc. (2010-present), Director of Fidelity Research & Analysis Company (2010-present), President of Fidelity Asset Management and Corporate Services and a member of Fidelity's Executive Committee (2010-present). Previously, Mr. O'Hanley served as President and Chief Executive Officer of BNY Mellon Asset Management (2007-2010). Mr. O'Hanley also served as Vice Chairman of Bank New York Mellon Corp. and a member of that firm's Executive Committee. Prior to the 2007 merger of The Bank of New York and Mellon Financial Corporation, he was Vice Chairman of Mellon Financial Corporation and President and Chief Executive Officer of Mellon Asset Management. He joined Mellon in February 1997. Mr. O'Hanley currently serves as Chairman of the Boston Public Library Foundation Board of Directors and sits on the Board of Directors of Beth Israel Deaconess Medical Center, the Board of Trustees of the Marine Biological Laboratory and the Advisory Board of the Maxwell School of Citizenship and Public Administration at Syracuse University. Mr. O'Hanley also chairs the Council on Asset Management for the Financial Services Roundtable and is a member of the Board of Directors of Institutional Investor's U.S. Institute. |
* Trustees have been determined to be "Interested Trustees" by virtue of, among other things, their affiliation with the trust or various entities under common control with FMR.
+ The information above includes each Trustee's principal occupation during the last five years and other information relating to the experience, attributes, and skills relevant to each Trustee's qualifications to serve as a Trustee, which led to the conclusion that each Trustee should serve as a Trustee for the fund.
Annual Report
Independent Trustees:
Correspondence intended for each Independent Trustee (that is, the Trustees other than the Interested Trustees) may be sent to Fidelity Investments, P.O. Box 55235, Boston, Massachusetts 02205-5235.
Name, Age; Principal Occupations and Other Relevant Experience+ |
Dennis J. Dirks (64) |
| Year of Election or Appointment: 2005 Prior to his retirement in May 2003, Mr. Dirks was Chief Operating Officer and a member of the Board of The Depository Trust & Clearing Corporation (DTCC). He also served as President, Chief Operating Officer, and Board member of The Depository Trust Company (DTC) and President and Board member of the National Securities Clearing Corporation (NSCC). In addition, Mr. Dirks served as Chief Executive Officer and Board member of the Government Securities Clearing Corporation, Chief Executive Officer and Board member of the Mortgage-Backed Securities Clearing Corporation, as a Trustee and a member of the Finance Committee of Manhattan College (2005-2008), and as a Trustee and a member of the Finance Committee of AHRC of Nassau County (2006-2008). Mr. Dirks is a member of the Independent Directors Council (IDC) Governing Council (2010-present) and Board of Directors for The Brookville Center for Children's Services, Inc. (2009-present). |
Alan J. Lacy (58) |
| Year of Election or Appointment: 2008 Mr. Lacy serves as Senior Adviser (2007-present) of Oak Hill Capital Partners, L.P. (private equity). Mr. Lacy also served as Chief Executive Officer (2000-2005) and Vice Chairman (2005-2006) of Sears Holdings Corporation and Sears, Roebuck and Co. (retail). In addition, Mr. Lacy serves as a member of the Board of Directors of Dave & Buster's Entertainment, Inc. (restaurant and entertainment complexes, 2010-present), Earth Fare, Inc. (retail grocery, 2012-present), The Hillman Companies, Inc. (hardware wholesalers, 2010-present), and Bristol-Myers Squibb Company (global pharmaceuticals, 2007-present). Mr. Lacy is a member of the Board of Trustees of The National Parks Conservation Association (2006-present). Previously, Mr. Lacy served as Chairman of the Board of Trustees of the National Parks Conservation Association (2008-2011) and as a member of the Board of Directors for the Western Union Company (global money transfer, 2006-2011). |
Ned C. Lautenbach (68) |
| Year of Election or Appointment: 2000 Mr. Lautenbach is Chairman of the Independent Trustees of the Equity and High Income Funds (2006-present). Mr. Lautenbach currently serves as the Lead Director of the Eaton Corporation Board of Directors (diversified industrial, 1997-present). Mr. Lautenbach is Chairman of the Board of Directors of the Philharmonic Center for the Arts in Naples, Florida (2012-present) and a member of the Council on Foreign Relations (1994-present). Previously, Mr. Lautenbach was a Partner/Advisory Partner at Clayton, Dubilier & Rice, LLC (private equity investment, 1998-2010), as well as a Director of Sony Corporation (2006-2007). |
Joseph Mauriello (67) |
| Year of Election or Appointment: 2008 Prior to his retirement in January 2006, Mr. Mauriello served in numerous senior management positions including Deputy Chairman and Chief Operating Officer (2004-2005), and Vice Chairman of Financial Services (2002-2004) of KPMG LLP US (professional services, 1965-2005). Mr. Mauriello currently serves as a member of the Board of Directors of XL Group plc. (global insurance and re-insurance, 2006-present). Previously, Mr. Mauriello served as a Director of the Hamilton Funds of the Bank of New York (2006-2007) and of Arcadia Resources Inc. (health care services and products, 2007-2012). |
Robert W. Selander (61) |
| Year of Election or Appointment: 2011 Previously, Mr. Selander served as a Member of the Advisory Board of Fidelity's Equity and High Income Funds (2011), Executive Vice Chairman (2010), Chief Executive Officer (2009-2010), and President and Chief Executive Officer (1997-2009) of Mastercard, Inc. |
Cornelia M. Small (68) |
| Year of Election or Appointment: 2005 Ms. Small is a member of the Board of Directors of the Teagle Foundation (2009-present). Ms. Small is also a member of the Investment Committee, and Chair (2008-present) and a member of the Board of Trustees of Smith College. In addition, Ms. Small serves on the Investment Committee of the Berkshire Taconic Community Foundation (2008-present). Previously, Ms. Small served as Chairperson of the Investment Committee (2002-2008) of Smith College. In addition, Ms. Small served as Chief Investment Officer, Director of Global Equity Investments, and a member of the Board of Directors of Scudder, Stevens & Clark and Scudder Kemper Investments. |
William S. Stavropoulos (73) |
| Year of Election or Appointment: 2002 Mr. Stavropoulos is Vice Chairman of the Independent Trustees of the Equity and High Income Funds (2006-present). Mr. Stavropoulos serves as President and Founder of the Michigan Baseball Foundation, the Great Lakes Loons (2007-present). Mr. Stavropoulos is Chairman Emeritus of the Board of Directors of The Dow Chemical Company, where he previously served in numerous senior management positions, including President, CEO (1995-2000; 2002-2004), Chairman of the Executive Committee (2000-2006), and as a member of the Board of Directors (1990-2006). Currently, Mr. Stavropoulos is Chairman of Univar (global distributor of commodity and specialty chemicals, 2010-present), a Director of Teradata Corporation (data warehousing and technology solutions, 2008-present), Chemical Financial Corporation, Maersk Inc. (industrial conglomerate), Tyco International, Inc. (multinational manufacturing and services, 2007-present), and a member of the Advisory Board for Metalmark Capital (private equity investment, 2005-present). Mr. Stavropoulos is a special advisor to Clayton, Dubilier & Rice, LLC (private equity investment). In addition, Mr. Stavropoulos is a member of the University of Notre Dame Advisory Council for the College of Science. |
David M. Thomas (63) |
| Year of Election or Appointment: 2008 Previously, Mr. Thomas served as Executive Chairman (2005-2006) and Chairman and Chief Executive Officer (2000-2005) of IMS Health, Inc. (pharmaceutical and healthcare information solutions). In addition, Mr. Thomas serves as a member of the Board of Directors of Fortune Brands, Inc. (consumer products), and Interpublic Group of Companies, Inc. (marketing communication, 2004-present). |
Michael E. Wiley (61) |
| Year of Election or Appointment: 2008 Mr. Wiley also serves as a Director of Asia Pacific Exploration Consolidated (international oil and gas exploration and production, 2008-present). Mr. Wiley serves as a Director of Tesoro Corporation (independent oil refiner and marketer, 2005-present), and a Director of Bill Barrett Corporation (exploration and production, 2005-present). In addition, Mr. Wiley also serves as a Director of Post Oak Bank (privately-held bank, 2004-present). Previously, Mr. Wiley served as a member of the Board of Trustees of the University of Tulsa (2000-2006; 2007-2010), as a Senior Energy Advisor of Katzenbach Partners, LLC (consulting, 2006-2007), as an Advisory Director of Riverstone Holdings (private investment), Chairman, President, and CEO of Baker Hughes, Inc. (oilfield services, 2000-2004), and as Director of Spinnaker Exploration Company (exploration and production, 2001-2005). |
Annual Report
Trustees and Officers - continued
+ The information above includes each Trustee's principal occupation during the last five years and other information relating to the experience, attributes, and skills relevant to each Trustee's qualifications to serve as a Trustee, which led to the conclusion that each Trustee should serve as a Trustee for the fund.
Advisory Board Members and Executive Officers:
Correspondence intended for David A. Rosow and Garnett A. Smith may be sent to Fidelity Investments, P.O. Box 55235, Boston, Massachusetts 02205-5235. Correspondence intended for each executive officer, Edward C. Johnson 3d, and Peter S. Lynch may be sent to Fidelity Investments, 82 Devonshire Street, Boston, Massachusetts 02109.
Name, Age; Principal Occupation |
Edward C. Johnson 3d (82) |
| Year of Election or Appointment: 2011 Member of the Advisory Board of Fidelity's Equity and High Income Funds. Mr. Johnson serves as Chief Executive Officer, Chairman, and a Director of FMR LLC, and also serves as Chairman and Director of FIL Limited. Previously, Mr. Johnson served as a Trustee and Chairman of the Board of certain Fidelity Trusts, Chairman and a Director of FMR, Chairman and a Director of FMR Co., Inc., and President of FMR LLC (2006-2007). |
Peter S. Lynch (68) |
| Year of Election or Appointment: 2003 Member of the Advisory Board of Fidelity's Equity and High Income Funds. Mr. Lynch is Vice Chairman and a Director of FMR and FMR Co., Inc. In addition, Mr. Lynch serves as a Trustee of Boston College and as the Chairman of the Inner-City Scholarship Fund. Previously, Mr. Lynch served on the Special Olympics International Board of Directors (1997-2006). |
David A. Rosow (69) |
| Year of Election or Appointment: 2012 Member of the Advisory Board of Fidelity's Equity and High Income Funds. Chairman and Chief Executive Officer of International Golf Group, Inc. (golf course development, 1990-present). Previously, Mr. Rosow served as Chairman and Chief Executive Officer of Rosow & Company, Inc. (private investment company, 1989-2011), a Lead Director of Hudson United Bancorp (2001-2006) and as a Director of TD Banknorth (1996-2006). In addition, Mr. Rosow is a member (2008-present) and President (2009-present) of the Town Council of Palm Beach, Florida. |
Garnett A. Smith (64) |
| Year of Election or Appointment: 2012 Member of the Advisory Board of Fidelity's Equity and High Income Funds. Prior to Mr. Smith's retirement, he served as Chairman and Chief Executive Officer of Inbrand Corp. (manufacturer of personal absorbent products, 1990-1997). He also served as President (1986-1990) of Inbrand Corp. Prior to his employment with Inbrand Corp., he was employed by a retail fabric chain and North Carolina National Bank. In addition, Mr. Smith is a board member of the Jackson Hole Land Trust (2009-present). |
Kenneth B. Robins (42) |
| Year of Election or Appointment: 2008 President and Treasurer of Fidelity's Equity and High Income Funds. Mr. Robins also serves as President and Treasurer (2010-present) and Assistant Treasurer (2009-present) of other Fidelity funds and is an employee of Fidelity Investments (2004-present). Previously, Mr. Robins served as Deputy Treasurer of the Fidelity funds (2005-2008) and Treasurer and Chief Financial Officer of The North Carolina Capital Management Trust: Cash and Term Portfolios (2006-2008). |
Brian B. Hogan (47) |
| Year of Election or Appointment: 2009 Vice President of Equity and High Income Funds. Mr. Hogan also serves as President of FMR's Equity Division (2009-present). Previously, Mr. Hogan served as Senior Vice President, Equity Research of FMR (2006-2009) and as a portfolio manager. |
Christopher S. Bartel (40) |
| Year of Election or Appointment: 2009 Vice President of Fidelity's Sector and Real Estate Equity Funds. Mr. Bartel also serves as a Director, President, and Chief Executive Officer of Fidelity Management & Research (Japan) Inc. (2012-present), a Director of Fidelity Management & Research (Hong Kong) (2012-present), and Senior Vice President of Global Equity Research (2010-present). Previously, Mr. Bartel served as Senior Vice President of Equity Research (2009-2010), Managing Director of Research (2006-2009), and an analyst and portfolio manager (2000-2006). |
Scott C. Goebel (44) |
| Year of Election or Appointment: 2008 Secretary and Chief Legal Officer (CLO) of the Fidelity funds. Mr. Goebel also serves as Secretary of Fidelity Investments Money Management, Inc. (FIMM) (2010-present) and Fidelity Research and Analysis Company (FRAC) (2010-present); Secretary and CLO of The North Carolina Capital Management Trust: Cash and Term Portfolios (2008-present); General Counsel, Secretary, and Senior Vice President of FMR (2008-present) and FMR Co., Inc. (2008-present); employed by FMR LLC or an affiliate (2001-present); Chief Legal Officer of Fidelity Management & Research (Hong Kong) Limited (2008-present) and Assistant Secretary of Fidelity Management & Research (Japan) Inc. (2008-present), and Fidelity Management & Research (U.K.) Inc. (2008-present). Previously, Mr. Goebel served as Assistant Secretary of FIMM (2008-2010), FRAC (2008-2010), and the Funds (2007-2008) and as Vice President and Secretary of Fidelity Distributors Corporation (FDC) (2005-2007). |
William C. Coffey (43) |
| Year of Election or Appointment: 2009 Assistant Secretary of Fidelity's Equity and High Income Funds. Mr. Coffey also serves as Senior Vice President and Deputy General Counsel of FMR LLC (2010-present), and is an employee of Fidelity Investments. Previously, Mr. Coffey served as Vice President and Associate General Counsel of FMR LLC (2005-2009). |
Elizabeth Paige Baumann (44) |
| Year of Election or Appointment: 2012 Anti-Money Laundering (AML) Officer of the Fidelity funds. Ms. Baumann also serves as AML Officer of The North Carolina Capital Management Trust: Cash and Term Portfolios (2012-present), Chief AML Officer of FMR LLC (2012-present), and is an employee of Fidelity Investments. Previously, Ms. Baumann served as Vice President and Deputy Anti-Money Laundering Officer (2007-2012). |
Christine Reynolds (53) |
| Year of Election or Appointment: 2008 Chief Financial Officer of the Fidelity funds. Ms. Reynolds became President of Fidelity Pricing and Cash Management Services (FPCMS) in August 2008. Ms. Reynolds served as Chief Operating Officer of FPCMS (2007-2008). Previously, Ms. Reynolds served as President, Treasurer, and Anti-Money Laundering officer of the Fidelity funds (2004-2007). |
Joseph A. Hanlon (44) |
| Year of Election or Appointment: 2012 Chief Compliance Officer of Fidelity's Equity and High Income Funds. Mr. Hanlon serves as Compliance Officer of FMR, FMR Co., Inc., Fidelity Investments Money Management, Inc. (FIMM), Fidelity Research and Analysis Company (FRAC), Fidelity Management & Research (Japan) Inc., Fidelity Management & Research (U.K.) Inc., Fidelity Management & Research (Hong Kong), and Strategic Advisers, Inc. (2009-present), as Senior Vice President of the Fidelity Asset Management Division (2009-present), and is an employee of Fidelity Investments. |
Joseph F. Zambello (55) |
| Year of Election or Appointment: 2011 Deputy Treasurer of the Fidelity funds. Mr. Zambello is an employee of Fidelity Investments. Previously, Mr. Zambello served as Vice President of FMR's Program Management Group (2009-2011) and Vice President of the Transfer Agent Oversight Group (2005-2009). |
Adrien E. Deberghes (44) |
| Year of Election or Appointment: 2008 Deputy Treasurer of Fidelity's Equity and High Income Funds. Mr. Deberghes also serves as Vice President (2011-present) and Assistant Treasurer (2010-present) of other Fidelity funds, and is an employee of Fidelity Investments (2008-present). Previously, Mr. Deberghes served as Senior Vice President of Mutual Fund Administration at State Street Corporation (2007-2008), Senior Director of Mutual Fund Administration at Investors Bank & Trust (2005-2007), and Director of Finance for Dunkin' Brands (2000-2005). |
Stephanie J. Dorsey (43) |
| Year of Election or Appointment: 2010 Assistant Treasurer of Fidelity's Equity and High Income Funds. Ms. Dorsey also serves as Deputy Treasurer of other Fidelity funds (2008-present) and is an employee of Fidelity Investments (2008-present). Previously, Ms. Dorsey served as Treasurer (2004-2008) of the JPMorgan Mutual Funds and Vice President (2004-2008) of JPMorgan Chase Bank. |
John R. Hebble (54) |
| Year of Election or Appointment: 2009 Assistant Treasurer of Fidelity's Equity and High Income Funds. Mr. Hebble also serves as President (2011-present), Treasurer, and Chief Financial Officer of The North Carolina Capital Management Trust: Cash and Term Portfolios (2008-present), President and Treasurer of other Fidelity funds (2008-present) and is an employee of Fidelity Investments. |
Gary W. Ryan (53) |
| Year of Election or Appointment: 2005 Assistant Treasurer of the Fidelity funds. Mr. Ryan is an employee of Fidelity Investments. Previously, Mr. Ryan served as Vice President of Fund Reporting in Fidelity Pricing and Cash Management Services (FPCMS) (1999-2005). |
Jonathan Davis (44) |
| Year of Election or Appointment: 2010 Assistant Treasurer of the Fidelity funds. Mr. Davis is also Assistant Treasurer of Fidelity Rutland Square Trust II and Fidelity Commonwealth Trust II. Mr. Davis is an employee of Fidelity Investments. Previously, Mr. Davis served as Vice President and Associate General Counsel of FMR LLC (2003-2010). |
Annual Report
The Board of Trustees of Fidelity Series Real Estate Income Fund voted to pay shareholders of record at the opening of business on record date, the following distributions per share derived from capital gains realized from sales of portfolio securities, and dividends derived from net investment income:
| Pay
Date | Record
Date | Dividends | Capital
Gains |
Real Estate Income | 09/10/12 | 09/07/12 | $0.168 | $0.093 |
Class F | 09/10/12 | 09/07/12 | $0.173 | $0.093 |
The fund hereby designates as a capital gain dividend with respect to the taxable year ended July 31, 2012, $647,224, or, if subsequently determined to be different, the net capital gain of such year.
A total of 0.02% of the dividends distributed during the fiscal year was derived from interest on U.S. Government securities which is generally exempt from state income tax.
The fund will notify shareholders in January 2013 of amounts for use in preparing 2012 income tax returns.
Annual Report
Board Approval of Investment Advisory Contracts and Management Fees
Fidelity Series Real Estate Income Fund
Each year, the Board of Trustees, including the Independent Trustees (together, the Board), votes on the renewal of the management contract and sub-advisory agreements (together, the Advisory Contracts) for the fund. The Board, assisted by the advice of fund counsel and Independent Trustees' counsel, requests and considers a broad range of information relevant to the renewal of the Advisory Contracts throughout the year.
The Board meets regularly and, at each of its meetings, considers factors that are relevant to its annual consideration of the renewal of the fund's Advisory Contracts, including the services and support provided to the fund and its shareholders. The Board has established various standing committees, each composed of and chaired by Independent Trustees with varying backgrounds, to which the Board has assigned specific subject matter responsibilities in order to enhance effective decision-making by the Board. The Board, acting directly and through its Committees, requests and receives information concerning the annual consideration of the renewal of the fund's Advisory Contracts. The Board also meets as needed to consider matters specifically related to the Board's annual consideration of the renewal of Advisory Contracts. Members of the Board may also meet with trustees of other Fidelity funds through ad hoc joint committees to discuss certain matters relevant to the Fidelity funds.
At its July 2012 meeting, the Board of Trustees, including the Independent Trustees, unanimously determined to renew the fund's Advisory Contracts. In reaching its determination, the Board considered all factors it believed relevant, including (i) the nature, extent, and quality of the services to be provided to the fund and its shareholders (including the investment performance of the fund); (ii) the competitiveness of the fund's management fee and total expense ratio relative to peer funds; (iii) the total costs of the services to be provided by and the profits to be realized by Fidelity from its relationship with the fund; (iv) the extent to which economies of scale exist and would be realized as the fund grows; and (v) whether fee levels reflect these economies of scale, if any, for the benefit of fund shareholders.
In considering whether to renew the Advisory Contracts for the fund, the Board reached a determination, with the assistance of fund counsel and Independent Trustees' counsel and through the exercise of its business judgment, that the renewal of the Advisory Contracts is in the best interests of the fund and its shareholders and that the compensation payable under the Advisory Contracts is fair and reasonable. The Board's decision to renew the Advisory Contracts was not based on any single factor, but rather was based on a comprehensive consideration of all the information provided to the Board at its meetings throughout the year. The Board, in reaching its determination to renew the Advisory Contracts, is aware that shareholders in the fund have a broad range of investment choices available to them, including a wide choice among mutual funds offered by Fidelity's competitors, and that the fund's shareholders, who have the opportunity to review and weigh the disclosure provided by the fund in its prospectus and other public disclosures, have chosen to invest in this fund, managed by Fidelity.
Annual Report
Nature, Extent, and Quality of Services Provided. The Board considered the staffing within the investment adviser, FMR, and the sub-advisers (together, the Investment Advisers), including the backgrounds of the fund's investment personnel, and also considered the fund's investment objective, strategies, and related investment philosophy. The Independent Trustees also had discussions with senior management of Fidelity's investment operations and investment groups. The Board considered the structure of the portfolio manager compensation program and whether this structure provides appropriate incentives to act in the best interests of the fund.
Resources Dedicated to Investment Management and Support Services. The Board and the Fund Oversight and Research Committees reviewed the general qualifications and capabilities of the Investment Advisers' investment staff, including its size, education, experience, and resources, as well as the Investment Advisers' approach to recruiting, training, managing, and compensating investment personnel. The Board also noted that FMR has continued to increase the resources devoted to non-U.S. offices, including expansion of Fidelity's global investment organization. The Board noted that Fidelity's analysts have extensive resources, tools and capabilities that allow them to conduct sophisticated quantitative and fundamental analysis, as well as credit analysis of issuers, counterparties and guarantors. The Board also believes that Fidelity's investment professionals have sufficient access to global information and data so as to provide competitive investment results over time, and that those professionals also have access to sophisticated tools that permit them to assess portfolio construction and risk and performance attribution characteristics continuously, as well as to transmit new information and research conclusions rapidly around the world. Additionally, in its deliberations, the Board considered the Investment Advisers' trading and risk management capabilities and resources, which are an integral part of the investment management process.
Shareholder and Administrative Services. The Board considered (i) the nature, extent, quality, and cost of advisory, administrative, and shareholder services performed by the Investment Advisers and their affiliates under the Advisory Contracts and under separate agreements covering transfer agency, pricing and bookkeeping, and securities lending services for the fund; (ii) the nature and extent of the supervision of third party service providers, principally custodians and subcustodians; and (iii) the resources devoted to, and the record of compliance with, the fund's compliance policies and procedures. The Board also reviewed the allocation of fund brokerage, including allocations to brokers affiliated with the Investment Advisers, the use of brokerage commissions to pay fund expenses, and the use of "soft" commission dollars to pay for research services.
Annual Report
Board Approval of Investment Advisory Contracts and
Management Fees - continued
The Board noted that the growth of fund assets over time across the complex allows Fidelity to reinvest in the development of services designed to enhance the value or convenience of the Fidelity funds as investment vehicles. These services include 24-hour access to account information and market information through telephone representatives and over the Internet, investor education materials and asset allocation tools, and the expanded availability of Fidelity Investor Centers.
Investment in a Large Fund Family. The Board considered the benefits to shareholders of investing in a Fidelity fund, including the benefits of investing in a fund that is part of a large family of funds offering a variety of investment disciplines and providing a large variety of mutual fund investor services. The Board noted that Fidelity had taken, or had made recommendations that resulted in the Fidelity funds taking, a number of actions over the previous year that benefited particular funds, including (i) continuing to dedicate additional resources to investment research and support of the senior management team that oversees asset management; (ii) persisting in efforts to enhance Fidelity's research capabilities, in particular, international research; (iii) launching new funds and making other enhancements to meet client needs for global and income-oriented solutions; (iv) continuing to launch dedicated lower cost underlying funds to meet investment management's portfolio construction needs related to expanding underlying fund options, specifically for the Freedom Fund product lines; (v) adopting a "Stock Selector" sector neutral investment approach and employing a team of portfolio managers who are sector specialists to manage certain funds; (vi) rationalizing product lines and gaining increased efficiencies through the mergers of several funds into other funds; (vii) strengthening the Spartan Index Fund product line by adding new funds and/or new low-cost institutional share classes, restructuring fund expenses to accommodate new classes, and reducing investment minimums for certain classes of shares; (viii) modifying the eligibility criteria for Institutional Class shares to increase their appeal to government entities and charitable investors; and (ix) reducing certain transfer agent fee rates.
Investment Performance. The Board considered whether the fund has operated in accordance with its investment objective, as well as its record of compliance with its investment restrictions. As the fund recently commenced operations the Board did not believe that it was appropriate to assign significant weight to its limited investment performance.
Based on its review, the Board concluded that the nature, extent, and quality of services provided to the fund under the Advisory Contracts should benefit the fund's shareholders.
Competitiveness of Management Fee and Total Expense Ratio. The Board considered the fund's management fee and total expense ratio compared to "mapped groups" of competitive funds and classes. Fidelity creates "mapped groups" by combining similar Lipper investment objective categories that have comparable management fee characteristics. Combining Lipper investment objective categories aids the Board's management fee and total expense ratio comparisons by broadening the competitive group used for comparison and by reducing the number of universes to which various Fidelity funds are compared.
Annual Report
Management Fee. The Board considered two proprietary management fee comparisons for the period of the fund's operations shown in the chart below. The group of Lipper funds used by the Board for management fee comparisons is referred to below as the "Total Mapped Group." The Total Mapped Group comparison focuses on a fund's standing relative to the total universe of comparable funds available to investors in terms of gross management fees before expense reimbursements or caps. "TMG %" represents the percentage of funds in the Total Mapped Group that had management fees that were lower than the fund's. For example, a TMG % of 6% means that 94% of the funds in the Total Mapped Group had higher management fees than the fund. The "Asset-Size Peer Group" (ASPG) comparison focuses on a fund's standing relative to non-Fidelity funds similar in size to the fund within the Total Mapped Group. The ASPG represents at least 15% of the funds in the Total Mapped Group with comparable asset size and management fee characteristics, subject to a minimum of 50 funds (or all funds in the Total Mapped Group if fewer than 50). Additional information, such as the ASPG quartile in which the fund's management fee ranked, is also included in the chart and considered by the Board.
Fidelity Series Real Estate Income Fund
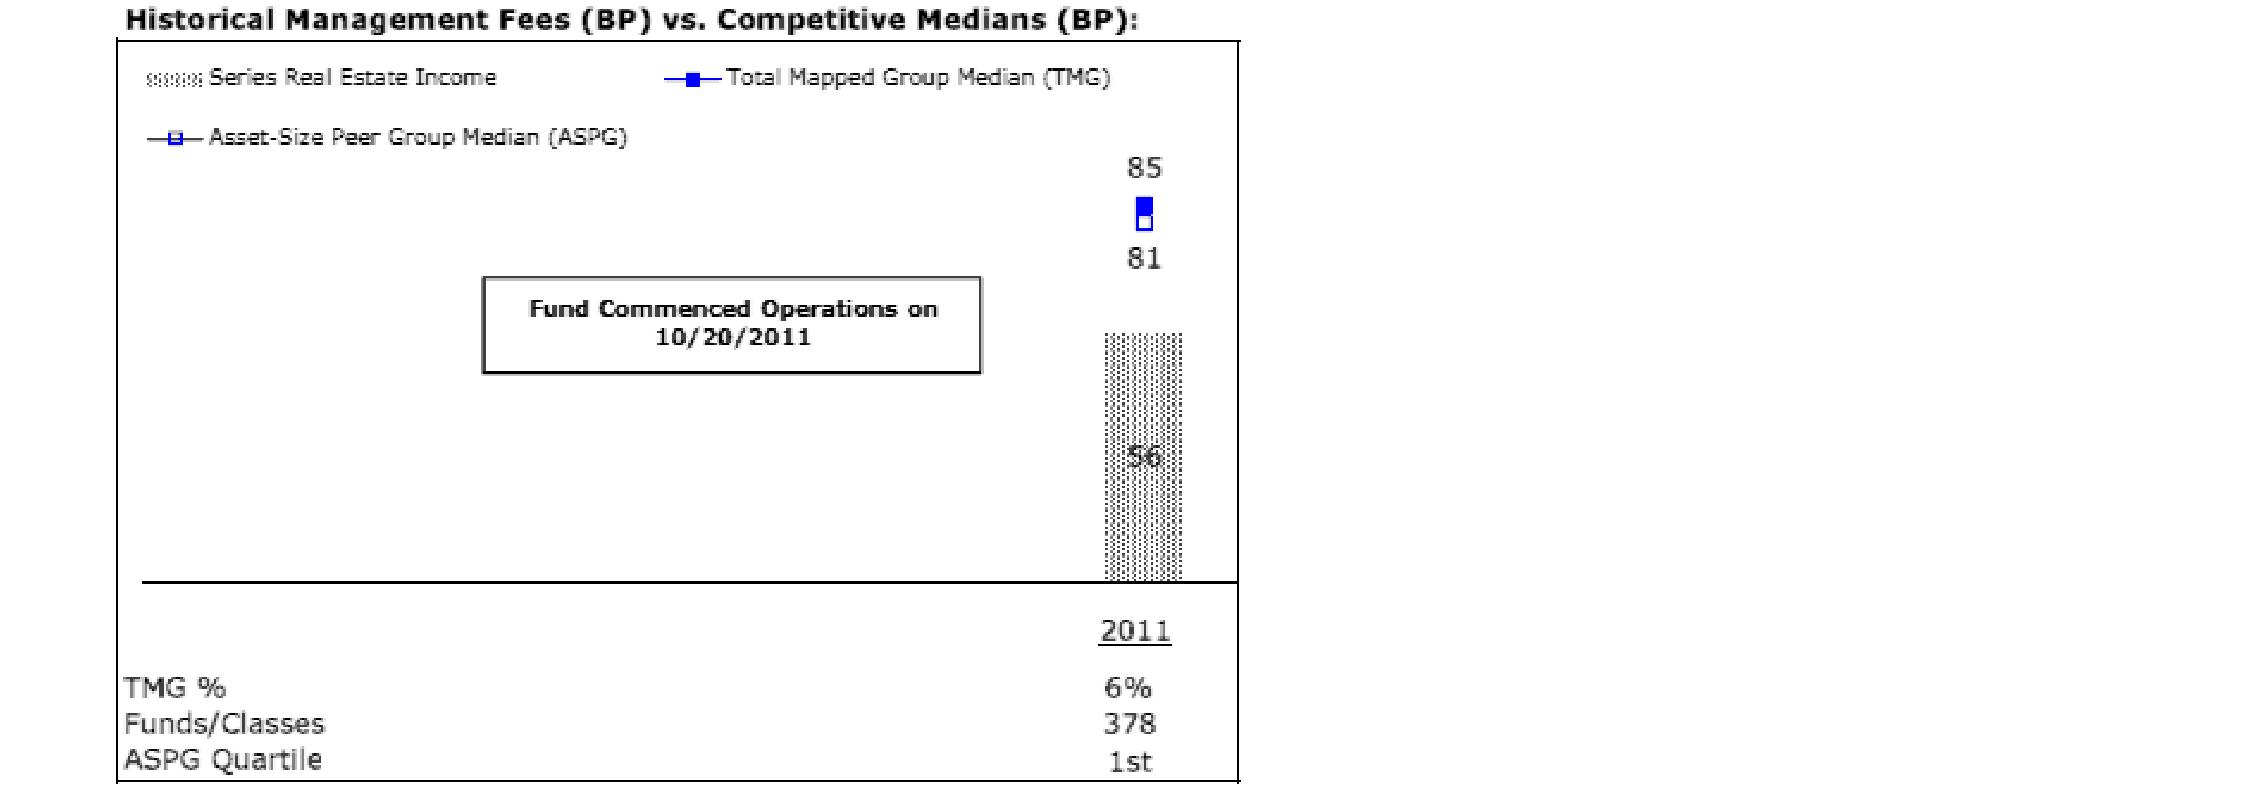
The Board noted that the fund's management fee ranked below the median of its Total Mapped Group and below the median of its ASPG for the period.
Annual Report
Board Approval of Investment Advisory Contracts and
Management Fees - continued
Based on its review, the Board concluded that the fund's management fee is fair and reasonable in light of the services that the fund receives and the other factors considered.
Total Expense Ratio. In its review of each class's total expense ratio, the Board considered the fund's management fee as well as other fund or class expenses, as applicable, such as transfer agent fees, pricing and bookkeeping fees, and custodial, legal, and audit fees. The Board also noted the effects of any waivers and reimbursements on fees and expenses. As part of its review, the Board also considered the current total expense ratios of each class of the fund compared to competitive fund median expenses. Each class of the fund is compared to those funds and classes in the Total Mapped Group (used by the Board for management fee comparisons) that have a similar sales load structure.
The Board noted that the total expense ratio of each class ranked below its competitive median for the period.
Fees Charged to Other Fidelity Clients. The Board also considered Fidelity fee structures and other information with respect to clients of FMR and its affiliates, such as other mutual funds advised or subadvised by FMR or its affiliates, pension plan clients, and other institutional clients. The Board noted the findings of the 2010 ad hoc joint committee (created with the board of other Fidelity funds), which reviewed and compared Fidelity's institutional investment advisory business with its business of providing services to the Fidelity funds, including the differences in services provided, fees charged, and costs incurred, as well as competition in their respective marketplaces.
Based on its review of total expense ratios and fees charged to other Fidelity clients, the Board concluded that the total expense ratio of each class of the fund was reasonable in light of the services that the fund and its shareholders receive and the other factors considered.
Costs of the Services and Profitability. The Board considered the revenues earned and the expenses incurred by Fidelity in conducting the business of developing, marketing, distributing, managing, administering and servicing the fund and its shareholders. The Board also considered the level of Fidelity's profits in respect of all the Fidelity funds.
On an annual basis, FMR presents to the Board Fidelity's profitability for the fund. Fidelity calculates the profitability for each fund, as well as aggregate profitability for groups of Fidelity funds and all Fidelity funds, using a series of detailed revenue and cost allocation methodologies which originate with the books and records of Fidelity on which Fidelity's audited financial statements are based. The Audit Committee of the Board reviews any significant changes from the prior year's methodologies.
PricewaterhouseCoopers LLP (PwC), independent registered public accounting firm and auditor to Fidelity and certain Fidelity funds, has been engaged annually by the Board as part of the Board's assessment of Fidelity's profitability analysis. PwC's engagement includes the review and assessment of Fidelity's methodologies used in determining the revenues and expenses attributable to Fidelity's mutual fund business, and completion of agreed-upon procedures surrounding the mathematical accuracy of fund profitability and its conformity to allocation methodologies. After considering PwC's reports issued under the engagement and information provided by Fidelity, the Board concluded that while other allocation methods may also be reasonable, Fidelity's profitability methodologies are reasonable in all material respects.
Annual Report
The Board also reviewed Fidelity's non-fund businesses and fall-out benefits related to the mutual fund business as well as cases where Fidelity's affiliates may benefit from or be related to the fund's business.
The Board considered the costs of the services provided by and the profits realized by Fidelity in connection with the operation of the fund and was satisfied that the profitability was not excessive in the circumstances.
Economies of Scale. The Board considered whether there have been economies of scale in respect of the management of the Fidelity funds, whether the Fidelity funds (including the fund) have appropriately benefited from any such economies of scale, and whether there is potential for realization of any further economies of scale. The Board considered the extent to which the fund will benefit from economies of scale through increased services to the fund, through waivers or reimbursements, or through fee or expense reductions. The Board also noted that in 2009, it and the board of other Fidelity funds created an ad hoc committee (the Economies of Scale Committee) to analyze whether FMR attains economies of scale in respect of the management and servicing of the Fidelity funds, whether the Fidelity funds have appropriately benefited from such economies of scale, and whether there is potential for realization of any further economies of scale.
The Board recognized that the fund's management contract incorporates a "group fee" structure, which provides for lower group fee rates as total fund assets under FMR's management increase, and for higher group fee rates as total fund assets under FMR's management decrease. FMR calculates the group fee rates based on a tiered asset "breakpoint" schedule that varies based on asset class. The Board considered that the group fee is designed to deliver the benefits of economies of scale to fund shareholders when total Fidelity fund assets increase, even if assets of any particular fund are unchanged or have declined, because some portion of Fidelity's costs are attributable to services provided to all Fidelity funds, and all funds benefit if those costs can be allocated among more assets. The Board also considered that although the fund is offered only to other funds advised by FMR or an affiliate, it continues to incur investment management expenses. The Board further noted that the fund may continue to realize benefits from the group fee structure, even though assets may not be expected to grow significantly at the fund level. The Board concluded that, given the group fee structure, fund shareholders will benefit from lower management fees as assets under FMR's management increase at the fund complex level, regardless of whether Fidelity achieves any such economies of scale.
Annual Report
Board Approval of Investment Advisory Contracts and
Management Fees - continued
The Board concluded, taking into account the analysis of the Economies of Scale Committee, that economies of scale, if any, are being appropriately shared between fund shareholders and Fidelity.
Additional Information Requested by the Board. In order to develop fully the factual basis for consideration of the Fidelity funds' Advisory Contracts, the Board requested and received additional information on certain topics, including (i) fund performance trends, actions to be taken by FMR to improve certain funds' overall performance, and Fidelity's long-term strategies for certain funds; (ii) the potential to further rationalize the Fidelity fund lineup with the possibility of achieving savings for the funds and Fidelity; (iii) Fidelity's compensation structure for portfolio managers and other key investment personnel; (iv) the amount of the investment that each portfolio manager has made in the Fidelity fund(s) that he or she manages; (v) the realization of fall-out benefits in certain Fidelity business units; (vi) Fidelity's group fee structures, the potential impact of regulatory changes on such structures, and the rationale for the individual fee rates of certain funds; (vii) fund profitability methodology, including Fidelity's cost allocation methodology, and the impact of certain factors on fund profitability results; (viii) trends regarding industry use of performance fee structures and the possibility of implementing performance fee structures for additional funds; and (ix) the impact of net redemptions from the Fidelity funds.
Based on its evaluation of all of the conclusions noted above, and after considering all factors it believed relevant, the Board ultimately concluded that the advisory fee structures are fair and reasonable, and that the fund's Advisory Contracts should be renewed.
Annual Report
Investment Adviser
Fidelity Management & Research Company
Boston, MA
Investment Sub-Advisers
FMR Co., Inc.
Fidelity Management & Research (U.K.) Inc.
Fidelity Management & Research
(Hong Kong) Limited
Fidelity Management & Research
(Japan) Inc.
General Distributor
Fidelity Distributors Corporation
Smithfield, RI
Transfer and Service Agents
Fidelity Investments Institutional Operations Company, Inc.
Boston, MA
Fidelity Service Company, Inc.
Boston, MA
Custodian
The Northern Trust Company
Chicago, IL
(Fidelity Investment logo)(registered trademark)
Corporate Headquarters
82 Devonshire St., Boston, MA 02109
www.fidelity.com
SRE-ANN-0912
1.924310.100
Item 2. Code of Ethics
As of the end of the period, July 31, 2012, Fidelity Securities Fund (the trust) has adopted a code of ethics, as defined in Item 2 of Form N-CSR, that applies to its President and Treasurer and its Chief Financial Officer. A copy of the code of ethics is filed as an exhibit to this Form N-CSR.
Item 3. Audit Committee Financial Expert
The Board of Trustees of the trust has determined that Joseph Mauriello is an audit committee financial expert, as defined in Item 3 of Form N-CSR. Mr. Mauriello is independent for purposes of Item 3 of Form N-CSR.
Item 4. Principal Accountant Fees and Services
Fees and Services
The following table presents fees billed by Deloitte & Touche LLP, the member firms of Deloitte Touche Tohmatsu, and their respective affiliates (collectively, "Deloitte Entities") in each of the last two fiscal years for services rendered to Fidelity Blue Chip Growth Fund, Fidelity OTC Portfolio, Fidelity Real Estate Income Fund, Fidelity Series Real Estate Equity Fund, Fidelity Series Real Estate Income Fund, and Fidelity Series Small Cap Opportunities Fund (the "Funds"):
Services Billed by Deloitte Entities
July 31, 2012 FeesA, B
| Audit Fees | Audit-Related Fees | Tax Fees | All Other Fees |
Fidelity Blue Chip Growth Fund | $52,000 | $- | $4,900 | $2,300 |
Fidelity OTC Portfolio | $43,000 | $- | $5,700 | $1,400 |
Fidelity Real Estate Income Fund | $142,000 | $- | $7,400 | $600 |
Fidelity Series Real Estate Equity Fund | $32,000 | $- | $5,700 | $300 |
Fidelity Series Real Estate Income Fund | $60,000 | $- | $5,700 | $300 |
Fidelity Series Small Cap Opportunities Fund | $46,000 | $- | $4,800 | $600 |
July 31, 2011 FeesA, B
| Audit Fees | Audit-Related Fees | Tax Fees | All Other Fees |
Fidelity Blue Chip Growth Fund | $50,000 | $- | $4,900 | $1,000 |
Fidelity OTC Portfolio | $43,000 | $- | $6,000 | $600 |
Fidelity Real Estate Income Fund | $144,000 | $- | $7,600 | $300 |
Fidelity Series Real Estate Equity Fund | $- | $- | $- | $- |
Fidelity Series Real Estate Income Fund | $- | $- | $- | $- |
Fidelity Series Small Cap Opportunities Fund | $46,000 | $- | $4,600 | $300 |
A Amounts may reflect rounding.
B Fidelity Series Real Estate Equity Fund and Fidelity Series Real Estate Income Fund commenced operations on October 20, 2011.
The following table presents fees billed by PricewaterhouseCoopers LLP ("PwC") in each of the last two fiscal years for services rendered to Fidelity Blue Chip Value Fund, Fidelity Dividend Growth Fund, Fidelity Growth & Income Portfolio, Fidelity International Real Estate Fund, Fidelity Leveraged Company Stock Fund, Fidelity Small Cap Growth Fund, and Fidelity Small Cap Value Fund (the "Funds"):
Services Billed by PwC
July 31, 2012 FeesA
| Audit Fees | Audit-Related Fees | Tax Fees | All Other Fees |
Fidelity Blue Chip Value Fund | $49,000 | $- | $3,300 | $1,700 |
Fidelity Dividend Growth Fund | $67,000 | $- | $3,300 | $5,100 |
Fidelity Growth & Income Portfolio | $70,000 | $- | $4,300 | $3,700 |
Fidelity International Real Estate Fund | $59,000 | $- | $7,400 | $1,600 |
Fidelity Leveraged Company Stock Fund | $53,000 | $- | $4,300 | $3,100 |
Fidelity Small Cap Growth Fund | $50,000 | $- | $3,300 | $2,300 |
Fidelity Small Cap Value Fund | $52,000 | $- | $3,300 | $2,500 |
July 31, 2011 FeesA
| Audit Fees | Audit-Related Fees | Tax Fees | All Other Fees |
Fidelity Blue Chip Value Fund | $50,000 | $- | $3,300 | $2,000 |
Fidelity Dividend Growth Fund | $69,000 | $- | $3,300 | $6,600 |
Fidelity Growth & Income Portfolio | $72,000 | $- | $4,300 | $4,900 |
Fidelity International Real Estate Fund | $59,000 | $- | $7,400 | $2,000 |
Fidelity Leveraged Company Stock Fund | $55,000 | $- | $4,300 | $4,100 |
Fidelity Small Cap Growth Fund | $51,000 | $- | $3,300 | $2,700 |
Fidelity Small Cap Value Fund | $53,000 | $- | $3,300 | $3,000 |
A Amounts may reflect rounding.
The following table presents fees billed by PwC and Deloitte Entities that were required to be approved by the Audit Committee for services that relate directly to the operations and financial reporting of the Funds and that are rendered on behalf of Fidelity Management & Research Company ("FMR") and entities controlling, controlled by, or under common control with FMR (not including any sub-adviser whose role is primarily portfolio management and is subcontracted with or overseen by another investment adviser) that provide ongoing services to the Funds ("Fund Service Providers"):
Services Billed by Deloitte Entities
| July 31, 2012A, B | July 31, 2011A, B |
Audit-Related Fees | $615,000 | $645,000 |
Tax Fees | $- | $- |
All Other Fees | $1,115,000 | $730,000 |
A Amounts may reflect rounding.
B May include amounts billed prior to the Fidelity Series Real Estate Equity Fund and Fidelity Series Real Estate Income Fund's commencement of operations.
Services Billed by PwC
| July 31, 2012A | July 31, 2011A |
Audit-Related Fees | $4,450,000 | $1,860,000 |
Tax Fees | $- | $- |
All Other Fees | $- | $365,000 |
A Amounts may reflect rounding.
"Audit-Related Fees" represent fees billed for assurance and related services that are reasonably related to the performance of the fund audit or the review of the fund's financial statements and that are not reported under Audit Fees.
"Tax Fees" represent fees billed for tax compliance, tax advice or tax planning that relate directly to the operations and financial reporting of the fund.
"All Other Fees" represent fees billed for services provided to the fund or Fund Service Provider, a significant portion of which are assurance related, that relate directly to the operations and financial reporting of the fund, excluding those services that are reported under Audit Fees, Audit-Related Fees or Tax Fees.
Assurance services must be performed by an independent public accountant.
* * *
The aggregate non-audit fees billed by PwC and Deloitte Entities for services rendered to the Funds, FMR (not including any sub-adviser whose role is primarily portfolio management and is subcontracted with or overseen by another investment adviser), and any Fund Service Provider for each of the last two fiscal years of the Funds are as follows:
Billed By | July 31, 2012 A, B | July 31, 2011 A, B |
PwC | $5,700,000 | $4,145,000 |
Deloitte Entities | $1,860,000 | $1,495,000 |
A Amounts may reflect rounding.
B May include amounts billed prior to the Fidelity Series Real Estate Equity Fund and Fidelity Series Real Estate Income Fund's commencement of operations.
The trust's Audit Committee has considered non-audit services that were not pre-approved that were provided by PwC and Deloitte Entities to Fund Service Providers to be compatible with maintaining the independence of PwC and Deloitte Entities in their audits of the Funds, taking into account representations from PwC and Deloitte Entities, in accordance with Public Company Accounting Oversight Board rules, regarding their independence from the Funds and their related entities and FMR's review of the appropriateness and permissibility under applicable law of such non-audit services prior to their provision to the Fund Service Providers.
Audit Committee Pre-Approval Policies and Procedures
The trust's Audit Committee must pre-approve all audit and non-audit services provided by a fund's independent registered public accounting firm relating to the operations or financial reporting of the fund. Prior to the commencement of any audit or non-audit services to a fund, the Audit Committee reviews the services to determine whether they are appropriate and permissible under applicable law.
The Audit Committee has adopted policies and procedures to, among other purposes, provide a framework for the Committee's consideration of non-audit services by the audit firms that audit the Fidelity funds. The policies and procedures require that any non-audit service provided by a fund audit firm to a Fidelity fund and any non-audit service provided by a fund auditor to a Fund Service Provider that relates directly to the operations and financial reporting of a Fidelity fund ("Covered Service") are subject to approval by the Audit Committee before such service is provided.
All Covered Services must be approved in advance of provision of the service either: (i) by formal resolution of the Audit Committee, or (ii) by oral or written approval of the service by the Chair of the Audit Committee (or if the Chair is unavailable, such other member of the Audit Committee as may be designated by the Chair to act in the Chair's absence). The approval contemplated by (ii) above is permitted where the Treasurer determines that action on such an engagement is necessary before the next meeting of the Audit Committee.
Non-audit services provided by a fund audit firm to a Fund Service Provider that do not relate directly to the operations and financial reporting of a Fidelity fund are reported to the Audit Committee on a periodic basis.
Non-Audit Services Approved Pursuant to Rule 2-01(c)(7)(i)(C) and (ii) of Regulation S-X ("De Minimis Exception")
There were no non-audit services approved or required to be approved by the Audit Committee pursuant to the De Minimis Exception during the Funds' last two fiscal years relating to services provided to (i) the Funds or (ii) any Fund Service Provider that relate directly to the operations and financial reporting of the Funds.
Item 5. Audit Committee of Listed Registrants
Not applicable.
Item 6. Investments
(a) Not applicable.
(b) Not applicable
Item 7. Disclosure of Proxy Voting Policies and Procedures for Closed-End Management Investment Companies
Not applicable.
Item 8. Portfolio Managers of Closed-End Management Investment Companies
Not applicable.
Item 9. Purchase of Equity Securities by Closed-End Management Investment Company and Affiliated Purchasers
Not applicable.
Item 10. Submission of Matters to a Vote of Security Holders
There were no material changes to the procedures by which shareholders may recommend nominees to the trust's Board of Trustees.
Item 11. Controls and Procedures
(a)(i) The President and Treasurer and the Chief Financial Officer have concluded that the trust's disclosure controls and procedures (as defined in Rule 30a-3(c) under the Investment Company Act) provide reasonable assurances that material information relating to the trust is made known to them by the appropriate persons, based on their evaluation of these controls and procedures as of a date within 90 days of the filing date of this report.
(a)(ii) There was no change in the trust's internal control over financial reporting (as defined in Rule 30a-3(d) under the Investment Company Act) that occurred during the second fiscal quarter of the period covered by this report that has materially affected, or is reasonably likely to materially affect, the trust's internal control over financial reporting.
Item 12. Exhibits
(a) | (1) | Code of Ethics pursuant to Item 2 of Form N-CSR is filed and attached hereto as EX-99.CODE ETH. |
(a) | (2) | Certification pursuant to Rule 30a-2(a) under the Investment Company Act of 1940 (17 CFR 270.30a-2(a)) is filed and attached hereto as Exhibit 99.CERT. |
(a) | (3) | Not applicable. |
(b) | | Certification pursuant to Rule 30a-2(b) under the Investment Company Act of 1940 (17 CFR 270.30a-2(b)) is furnished and attached hereto as Exhibit 99.906CERT. |
SIGNATURES
Pursuant to the requirements of the Securities Exchange Act of 1934 and the Investment Company Act of 1940, the registrant has duly caused this report to be signed on its behalf by the undersigned, thereunto duly authorized.
Fidelity Securities Fund
By: | /s/Kenneth B. Robins |
| Kenneth B. Robins |
| President and Treasurer |
| |
Date: | September 27, 2012 |
Pursuant to the requirements of the Securities Exchange Act of 1934 and the Investment Company Act of 1940, this report has been signed below by the following persons on behalf of the registrant and in the capacities and on the dates indicated.
By: | /s/Kenneth B. Robins |
| Kenneth B. Robins |
| President and Treasurer |
| |
Date: | September 27, 2012 |
By: | /s/Christine Reynolds |
| Christine Reynolds |
| Chief Financial Officer |
| |
Date: | September 27, 2012 |