UNITED STATES
SECURITIES AND EXCHANGE COMMISSION
Washington, D.C. 20549
FORM N-CSR
CERTIFIED SHAREHOLDER REPORT OF REGISTERED
MANAGEMENT INVESTMENT COMPANIES
Investment Company Act file number 811-4118
Fidelity Securities Fund
(Exact name of registrant as specified in charter)
245 Summer St., Boston, Massachusetts 02210
(Address of principal executive offices) (Zip code)
Scott C. Goebel, Secretary
245 Summer St.
Boston, Massachusetts 02210
(Name and address of agent for service)
Registrant's telephone number, including area code: 617-563-7000
Date of fiscal year end: | July 31 |
| |
Date of reporting period: | July 31, 2014 |
Item 1. Reports to Stockholders
Fidelity®
Blue Chip Growth
Fund -
Class K
Annual Report
July 31, 2014
(Fidelity Cover Art)
Contents
Performance | (Click Here) | How the fund has done over time. |
Management's Discussion of Fund Performance | (Click Here) | The Portfolio Manager's review of fund performance and strategy. |
Shareholder Expense Example | (Click Here) | An example of shareholder expenses. |
Investment Changes | (Click Here) | A summary of major shifts in the fund's investments over the past six months. |
Investments | (Click Here) | A complete list of the fund's investments with their market values. |
Financial Statements | (Click Here) | Statements of assets and liabilities, operations, and changes in net assets, as well as financial highlights. |
Notes | (Click Here) | Notes to the financial statements. |
Report of Independent Registered Public Accounting Firm | (Click Here) | |
Trustees and Officers | (Click Here) | |
Distributions | (Click Here) | |
Board Approval of Investment Advisory Contracts and Management Fees | (Click Here) | |
To view a fund's proxy voting guidelines and proxy voting record for the 12-month period ended June 30, visit http://www.fidelity.com/proxyvotingresults or visit the Securities and Exchange Commission's (SEC) web site at http://www.sec.gov. You may also call 1-800-835-5092 to request a free copy of the proxy voting guidelines.
Standard & Poor's, S&P and S&P 500 are registered service marks of The McGraw-Hill Companies, Inc. and have been licensed for use by Fidelity Distributors Corporation.
Other third-party marks appearing herein are the property of their respective owners.
All other marks appearing herein are registered or unregistered trademarks or service marks of FMR LLC or an affiliated company. © 2014 FMR LLC. All rights reserved.
Annual Report
This report and the financial statements contained herein are submitted for the general information of the shareholders of the fund. This report is not authorized for distribution to prospective investors in the fund unless preceded or accompanied by an effective prospectus.
A fund files its complete schedule of portfolio holdings with the SEC for the first and third quarters of each fiscal year on Form N-Q. Forms N-Q are available on the SEC's web site at http://www.sec.gov. A fund's Forms N-Q may be reviewed and copied at the SEC's Public Reference Room in Washington, DC. Information regarding the operation of the SEC's Public Reference Room may be obtained by calling 1-800-SEC-0330. For a complete list of a fund's portfolio holdings, view the most recent holdings listing, semiannual report, or annual report on Fidelity's web site at http://www.fidelity.com, http://www.advisor.fidelity.com, or http://www.401k.com, as applicable.
NOT FDIC INSURED • MAY LOSE VALUE • NO BANK GUARANTEE
Neither the fund nor Fidelity Distributors Corporation is a bank.
Annual Report
Average annual total return reflects the change in the value of an investment, assuming reinvestment of the class' distributions from dividend income and capital gains (the profits earned upon the sale of securities that have grown in value, if any) and assuming a constant rate of performance each year. The $10,000 table and the fund's returns do not reflect the deduction of taxes that a shareholder would pay on fund distributions or the redemption of fund shares. During periods of reimbursement by Fidelity, a fund's total return will be greater than it would be had the reimbursement not occurred. How a fund did yesterday is no guarantee of how it will do tomorrow.
Average Annual Total Returns
Periods ended July 31, 2014 | Past 1
year | Past 5
years | Past 10
years |
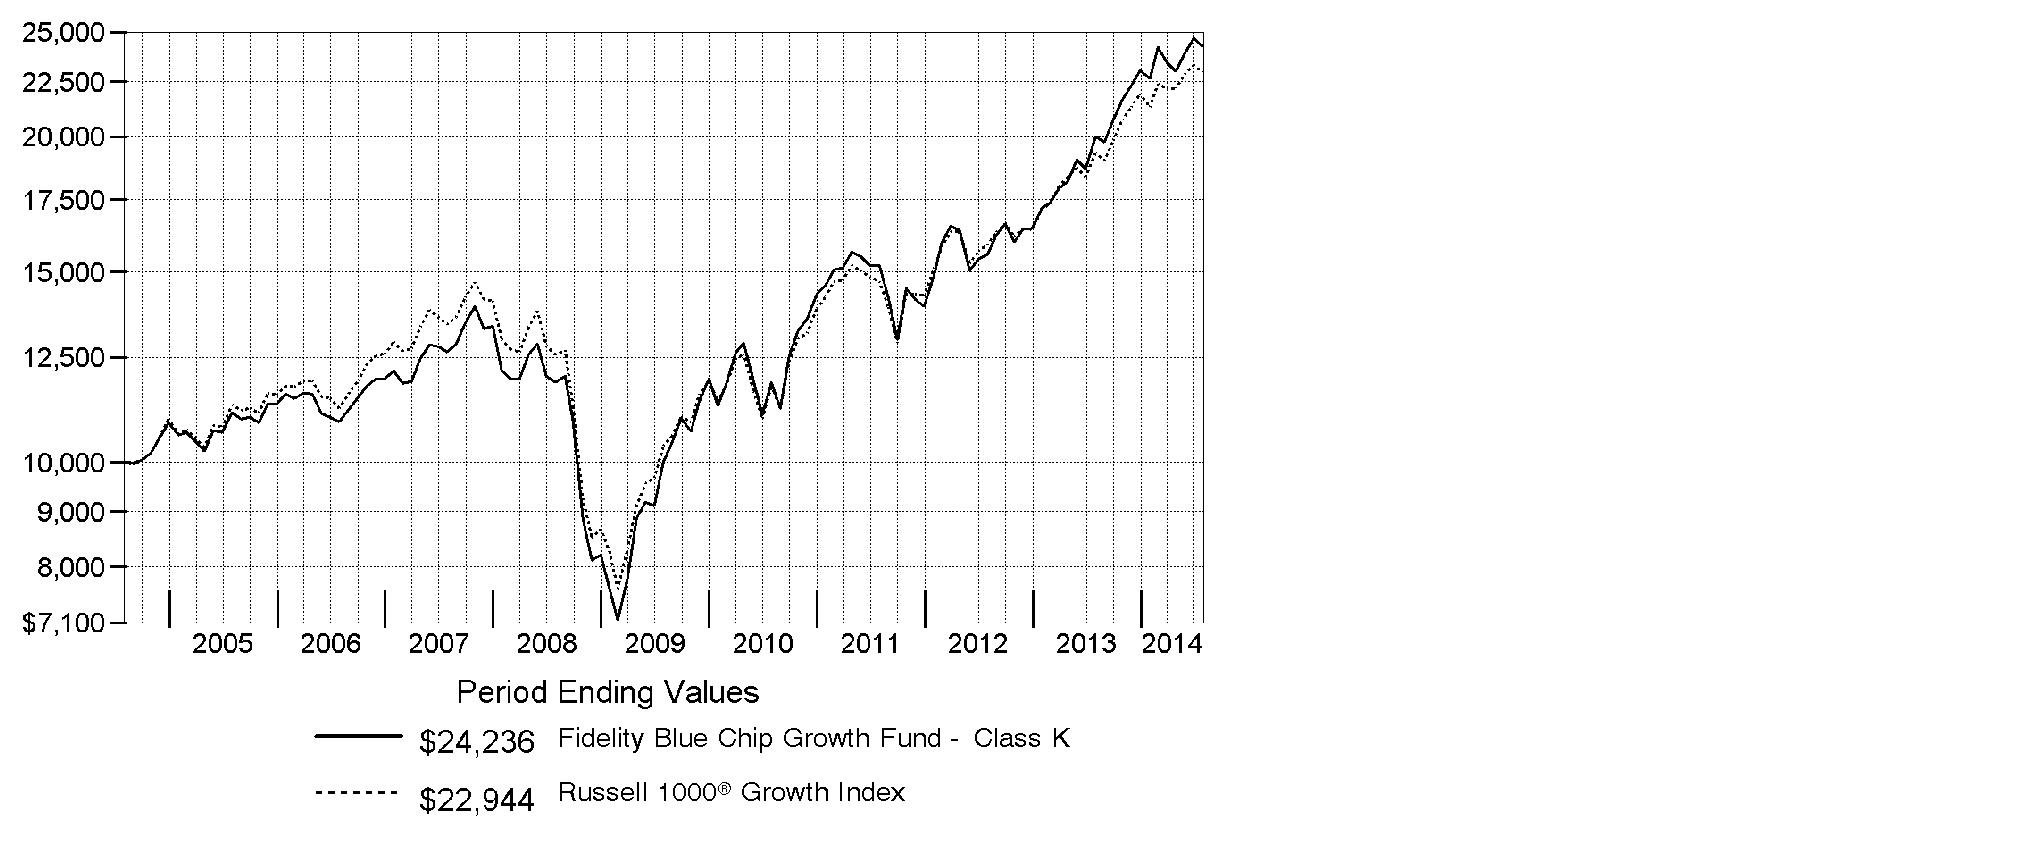
Class K A | 21.23% | 19.39% | 9.26% |
A The initial offering of Class K shares took place on May 9, 2008. Returns prior to May 9, 2008, are those of Fidelity® Blue Chip Growth Fund, the original class of the fund.
$10,000 Over 10 Years
Let's say hypothetically that $10,000 was invested in Fidelity® Blue Chip Growth Fund - Class K on July 31, 2004. The chart shows how the value of your investment would have changed, and also shows how the Russell 1000® Growth Index performed over the same period. See footnote A above for additional information regarding the performance of Class K.
Annual Report
Market Recap: U.S. stocks overcame a slowing economy early in 2014 to post a strong gain for the 12-month period ending July 31, 2014, supported by corporate profits and continued low interest rates. The S&P 500® Index rose 16.94%, reaching an all-time high near period end. The technology-heavy Nasdaq Composite Index® gained 22.00%. The Russell 2000® Index returned 8.56%, reflecting the relatively lackluster performance of small-cap stocks. Information technology (+28%) was the top-performing sector within the S&P 500®, driven by strong semiconductor and computer hardware sales. Materials (+23%) gained amid higher prices for many commodity products. Health care (+21%) rose, driven by gains in pharmaceuticals, biotechnology & life sciences companies. Energy stocks (+19%) advanced in the latter part of the period amid healthy U.S. output and the threat of supply disruptions in Iraq. Conversely, most defensive sectors, including consumer staples, utilities and telecommunication services, lagged the broader market. Volatility remained tame throughout most of the period, with markets supported by declining unemployment, near-record profit margins for companies, muted cost inflation and fairly low corporate debt levels. Geopolitical tension remained a concern at period end, with conflict in Ukraine and strained relations between Russia and the West posing a potential threat to global growth.
Comments from Sonu Kalra, Portfolio Manager of Fidelity® Blue Chip Growth Fund: For the year, the fund's Class K shares advanced 21.23%, outpacing the 18.69% gain of the Russell 1000® Growth Index. Security selection in the software & services industry helped the most, including social networking firm Facebook, our largest position, on average, and the fund's largest relative contributor. Strong revenue from its mobile advertising business helped Facebook produce much better-than-expected first- and second-quarter 2014 earnings and sales results, lifting its stock. Notably, Facebook's increasing popularity among consumers, including its website and mobile application, boosted its share of advertising dollars. I continued to believe in the company's growth potential due to its massive reach and its ability to target ads to very specific consumers. Conversely, not owning enough of software and index giant Microsoft hurt results. Shares began to rally just before the start of the period after the firm reported sales greater than analysts' estimates. The stock was further driven by an improved macroeconomic environment and a stabilizing market for personal computers. The company also appointed a new CEO in February, a move that prompted us to add to our position in the stock, even though Microsoft remained an underweighting at period end.
The views expressed above reflect those of the portfolio manager(s) only through the end of the period as stated on the cover of this report and do not necessarily represent the views of Fidelity or any other person in the Fidelity organization. Any such views are subject to change at any time based upon market or other conditions and Fidelity disclaims any responsibility to update such views. These views may not be relied on as investment advice and, because investment decisions for a Fidelity fund are based on numerous factors, may not be relied on as an indication of trading intent on behalf of any Fidelity fund.
Annual Report
Shareholder Expense Example
As a shareholder of the Fund, you incur two types of costs: (1) transaction costs and (2) ongoing costs, including management fees and other Fund expenses. This Example is intended to help you understand your ongoing costs (in dollars) of investing in the Fund and to compare these costs with the ongoing costs of investing in other mutual funds.
The Example is based on an investment of $1,000 invested at the beginning of the period and held for the entire period (February 1, 2014 to July 31, 2014).
Actual Expenses
The first line of the accompanying table for each class of the Fund provides information about actual account values and actual expenses. You may use the information in this line, together with the amount you invested, to estimate the expenses that you paid over the period. Simply divide your account value by $1,000.00 (for example, an $8,600 account value divided by $1,000.00 = 8.6), then multiply the result by the number in the first line for a class of the Fund under the heading entitled "Expenses Paid During Period" to estimate the expenses you paid on your account during this period. A small balance maintenance fee of $12.00 that is charged once a year may apply for certain accounts with a value of less than $2,000. This fee is not included in the table below. If it was, the estimate of expenses you paid during the period would be higher, and your ending account value lower, by this amount. In addition, the Fund, as a shareholder in the underlying Fidelity Central Funds, will indirectly bear its pro-rata share of the fees and expenses incurred by the underlying Fidelity Central Funds. These fees and expenses are not included in the Fund's annualized expense ratio used to calculate the expense estimate in the table below.
Hypothetical Example for Comparison Purposes
The second line of the accompanying table for each class of the Fund provides information about hypothetical account values and hypothetical expenses based on a Class' actual expense ratio and an assumed rate of return of 5% per year before expenses, which is not the Class' actual return. The hypothetical account values and expenses may not be used to estimate the actual ending account balance or expenses you paid for the period. You may use this information to compare the ongoing costs of investing in the Fund and other funds. To do so, compare this 5% hypothetical example with the 5% hypothetical examples that appear in the shareholder reports of the other funds. A small balance maintenance fee of $12.00 that is charged once a year may apply for certain accounts with a value of less than $2,000. This fee is not included in the table below. If it was, the estimate of expenses you paid during the period would be higher, and your ending account value lower, by this amount. In addition, the Fund, as a shareholder in the underlying Fidelity Central Funds, will indirectly bear its pro-rata share of the fees and expenses incurred by the underlying Fidelity Central Funds. These fees and expenses are not included in the Fund's annualized expense ratio used to calculate the expense estimate in the table below.
Please note that the expenses shown in the table are meant to highlight your ongoing costs only and do not reflect any transaction costs. Therefore, the second line of the table is useful in comparing ongoing costs only, and will not help you determine the relative total costs of owning different funds.
Annual Report
| Annualized
Expense RatioB | Beginning
Account Value
February 1, 2014 | Ending
Account Value
July 31, 2014 | Expenses Paid
During Period*
February 1, 2014
to July 31, 2014 |
Blue Chip Growth | .80% | | | |
Actual | | $ 1,000.00 | $ 1,069.20 | $ 4.10 |
HypotheticalA | | $ 1,000.00 | $ 1,020.83 | $ 4.01 |
Class K | .68% | | | |
Actual | | $ 1,000.00 | $ 1,070.00 | $ 3.49 |
HypotheticalA | | $ 1,000.00 | $ 1,021.42 | $ 3.41 |
A 5% return per year before expenses
B Annualized expense ratio reflects expenses net of applicable fee waivers.
* Expenses are equal to each Class' annualized expense ratio, multiplied by the average account value over the period, multiplied by 181/365 (to reflect the one-half year period).
Annual Report
Investment Changes (Unaudited)
Top Ten Stocks as of July 31, 2014 |
| % of fund's
net assets | % of fund's net assets
6 months ago |
Apple, Inc. | 6.5 | 3.7 |
Google, Inc. Class A | 2.9 | 6.0 |
Gilead Sciences, Inc. | 2.7 | 3.1 |
Google, Inc. Class C | 2.7 | 0.0 |
Facebook, Inc. Class A | 2.4 | 2.8 |
Amazon.com, Inc. | 2.3 | 2.3 |
Home Depot, Inc. | 1.6 | 1.5 |
The Walt Disney Co. | 1.6 | 0.3 |
Keurig Green Mountain, Inc. | 1.5 | 1.3 |
Comcast Corp. Class A | 1.5 | 1.5 |
| 25.7 | |
Top Five Market Sectors as of July 31, 2014 |
| % of fund's
net assets | % of fund's net assets
6 months ago |
Information Technology | 33.5 | 31.1 |
Consumer Discretionary | 21.2 | 21.2 |
Health Care | 15.3 | 16.4 |
Industrials | 9.1 | 10.5 |
Consumer Staples | 8.9 | 10.3 |
Asset Allocation (% of fund's net assets) |
As of July 31, 2014* | As of January 31, 2014** |
 | Stocks 99.3% | | | Stocks 99.8% | |
 | Convertible
Securities 0.6% | | | Convertible
Securities 0.1% | |
 | Short-Term
Investments and
Net Other Assets
(Liabilities) 0.1% | | | Short-Term
Investments and
Net Other Assets
(Liabilities) 0.1% | |
* Foreign investments | 10.8% | | ** Foreign investments | 9.8% | |

Annual Report
Investments July 31, 2014
Showing Percentage of Net Assets
Common Stocks - 99.3% |
| Shares | | Value (000s) |
CONSUMER DISCRETIONARY - 21.1% |
Auto Components - 0.4% |
Johnson Controls, Inc. | 549,600 | | $ 25,963 |
Magna International, Inc. Class A (sub. vtg.) | 319,725 | | 34,334 |
| | 60,297 |
Automobiles - 0.3% |
Mahindra & Mahindra Ltd. | 169,209 | | 3,331 |
Tesla Motors, Inc. (a)(e) | 202,856 | | 45,298 |
| | 48,629 |
Diversified Consumer Services - 0.5% |
H&R Block, Inc. | 1,229,500 | | 39,504 |
Kroton Educacional SA | 1,180,000 | | 31,425 |
ServiceMaster Global Holdings, Inc. | 490,500 | | 8,618 |
| | 79,547 |
Hotels, Restaurants & Leisure - 5.2% |
500.com Ltd. sponsored ADR Class A (e) | 342,236 | | 12,625 |
Buffalo Wild Wings, Inc. (a) | 77,538 | | 11,268 |
China Lodging Group Ltd. ADR (a) | 270,800 | | 6,756 |
Chipotle Mexican Grill, Inc. (a) | 228,417 | | 153,610 |
Domino's Pizza, Inc. | 116,300 | | 8,374 |
Dunkin' Brands Group, Inc. | 398,300 | | 17,071 |
Fiesta Restaurant Group, Inc. (a) | 253,700 | | 11,513 |
Hilton Worldwide Holdings, Inc. | 496,600 | | 12,023 |
Home Inns & Hotels Management, Inc. sponsored ADR (a) | 308,094 | | 10,993 |
Hyatt Hotels Corp. Class A (a) | 601,100 | | 35,363 |
Las Vegas Sands Corp. | 2,174,794 | | 160,609 |
Melco Crown Entertainment Ltd. sponsored ADR | 547,600 | | 18,180 |
MGM Mirage, Inc. (a) | 1,207,300 | | 32,404 |
Multimedia Games Holding Co., Inc. (a) | 263,585 | | 6,358 |
Panera Bread Co. Class A (a) | 344,256 | | 50,709 |
Starbucks Corp. | 2,555,922 | | 198,544 |
Whitbread PLC | 310,250 | | 22,539 |
Wynn Resorts Ltd. | 99,461 | | 21,205 |
Yum! Brands, Inc. | 1,023,649 | | 71,041 |
Zoe's Kitchen, Inc. (e) | 172,800 | | 5,013 |
| | 866,198 |
Household Durables - 0.4% |
D.R. Horton, Inc. | 1,166,200 | | 24,140 |
Whirlpool Corp. | 267,400 | | 38,142 |
| | 62,282 |
Common Stocks - continued |
| Shares | | Value (000s) |
CONSUMER DISCRETIONARY - continued |
Internet & Catalog Retail - 4.3% |
Amazon.com, Inc. (a) | 1,215,944 | | $ 380,578 |
Ctrip.com International Ltd. sponsored ADR (a) | 388,484 | | 24,875 |
Expedia, Inc. | 285,489 | | 22,674 |
Groupon, Inc. Class A (a)(e) | 1,564,200 | | 10,120 |
HomeAway, Inc. (a) | 376,500 | | 13,072 |
MakeMyTrip Ltd. (a) | 327,100 | | 9,901 |
Netflix, Inc. (a) | 66,623 | | 28,163 |
priceline.com, Inc. (a) | 156,700 | | 194,692 |
RetailMeNot, Inc. (e) | 223,500 | | 5,467 |
Vipshop Holdings Ltd. ADR (a) | 91,500 | | 18,807 |
| | 708,349 |
Leisure Products - 0.1% |
NJOY, Inc. (a)(f) | 1,178,168 | | 19,942 |
Media - 3.5% |
Comcast Corp. Class A | 4,620,836 | | 248,278 |
DISH Network Corp. Class A (a) | 221,600 | | 13,708 |
Lions Gate Entertainment Corp. | 285,400 | | 8,790 |
Naspers Ltd. Class N | 55,700 | | 6,912 |
The Walt Disney Co. | 3,018,200 | | 259,203 |
Time Warner Cable, Inc. | 118,545 | | 17,201 |
Time Warner, Inc. | 228,100 | | 18,937 |
| | 573,029 |
Multiline Retail - 1.1% |
Dollar General Corp. (a) | 165,700 | | 9,152 |
Macy's, Inc. | 1,396,785 | | 80,720 |
Target Corp. | 1,519,723 | | 90,560 |
| | 180,432 |
Specialty Retail - 3.7% |
Abercrombie & Fitch Co. Class A | 443,592 | | 17,451 |
AutoZone, Inc. (a) | 12,726 | | 6,580 |
Home Depot, Inc. | 3,296,500 | | 266,522 |
L Brands, Inc. | 754,082 | | 43,714 |
Lumber Liquidators Holdings, Inc. (a) | 195,600 | | 10,605 |
Murphy U.S.A., Inc. (a) | 792,770 | | 39,179 |
Restoration Hardware Holdings, Inc. (a) | 983,822 | | 80,467 |
Ross Stores, Inc. | 947,063 | | 60,991 |
TJX Companies, Inc. | 1,806,752 | | 96,282 |
| | 621,791 |
Common Stocks - continued |
| Shares | | Value (000s) |
CONSUMER DISCRETIONARY - continued |
Textiles, Apparel & Luxury Goods - 1.6% |
G-III Apparel Group Ltd. (a) | 65,000 | | $ 5,049 |
Kate Spade & Co. (a) | 1,493,804 | | 56,511 |
lululemon athletica, Inc. (a) | 369,881 | | 14,229 |
Michael Kors Holdings Ltd. (a) | 667,372 | | 54,377 |
NIKE, Inc. Class B | 556,575 | | 42,929 |
Pandora A/S | 240,500 | | 16,517 |
PVH Corp. | 424,176 | | 46,736 |
Ralph Lauren Corp. | 201,700 | | 31,437 |
Under Armour, Inc. Class A (sub. vtg.) (a) | 28,200 | | 1,882 |
| | 269,667 |
TOTAL CONSUMER DISCRETIONARY | | 3,490,163 |
CONSUMER STAPLES - 8.9% |
Beverages - 2.7% |
Anheuser-Busch InBev SA NV ADR | 444,891 | | 48,039 |
Monster Beverage Corp. (a) | 1,046,435 | | 66,930 |
PepsiCo, Inc. | 1,881,054 | | 165,721 |
The Coca-Cola Co. | 4,173,852 | | 163,991 |
| | 444,681 |
Food & Staples Retailing - 2.4% |
Costco Wholesale Corp. | 882,500 | | 103,729 |
CVS Caremark Corp. | 1,902,400 | | 145,267 |
Kroger Co. | 1,959,787 | | 95,990 |
Sprouts Farmers Market LLC (e) | 952,877 | | 29,072 |
Whole Foods Market, Inc. | 747,110 | | 28,555 |
| | 402,613 |
Food Products - 2.4% |
Associated British Foods PLC | 392,700 | | 18,418 |
Bunge Ltd. | 359,267 | | 28,325 |
Dean Foods Co. | 290,300 | | 4,447 |
Keurig Green Mountain, Inc. | 2,130,788 | | 254,160 |
Mead Johnson Nutrition Co. Class A | 885,994 | | 81,015 |
WhiteWave Foods Co. (a) | 470,269 | | 14,009 |
| | 400,374 |
Household Products - 0.6% |
Procter & Gamble Co. | 1,093,004 | | 84,511 |
Svenska Cellulosa AB (SCA) (B Shares) | 537,600 | | 13,288 |
| | 97,799 |
Common Stocks - continued |
| Shares | | Value (000s) |
CONSUMER STAPLES - continued |
Personal Products - 0.2% |
Coty, Inc. Class A | 521,400 | | $ 8,921 |
Herbalife Ltd. | 586,158 | | 30,715 |
Natura Cosmeticos SA | 89,700 | | 1,397 |
| | 41,033 |
Tobacco - 0.6% |
Lorillard, Inc. | 1,584,827 | | 95,850 |
TOTAL CONSUMER STAPLES | | 1,482,350 |
ENERGY - 5.0% |
Energy Equipment & Services - 1.0% |
Halliburton Co. | 2,035,876 | | 140,455 |
National Oilwell Varco, Inc. | 141,900 | | 11,500 |
Schlumberger Ltd. | 103,100 | | 11,175 |
Seventy Seven Energy, Inc. (a) | 17,719 | | 397 |
Transocean Partners LLC (a) | 113,800 | | 2,765 |
| | 166,292 |
Oil, Gas & Consumable Fuels - 4.0% |
Anadarko Petroleum Corp. | 908,400 | | 97,063 |
BG Group PLC | 317,500 | | 6,261 |
Cabot Oil & Gas Corp. | 297,078 | | 9,789 |
Canadian Natural Resources Ltd. | 297,800 | | 12,982 |
Carrizo Oil & Gas, Inc. (a) | 234,600 | | 14,407 |
Cheniere Energy, Inc. (a) | 220,880 | | 15,629 |
Chevron Corp. | 25,400 | | 3,283 |
Cimarex Energy Co. | 396,607 | | 55,136 |
Continental Resources, Inc. (a) | 434,000 | | 63,703 |
EOG Resources, Inc. | 832,524 | | 91,111 |
Golar LNG Ltd. | 143,000 | | 8,810 |
Hess Corp. | 293,178 | | 29,019 |
Marathon Petroleum Corp. | 185,900 | | 15,519 |
Memorial Resource Development Corp. | 276,000 | | 6,342 |
Navigator Holdings Ltd. (a) | 113,800 | | 3,169 |
Newfield Exploration Co. (a) | 986,600 | | 39,760 |
Phillips 66 Co. | 282,833 | | 22,941 |
Pioneer Natural Resources Co. | 451,000 | | 99,878 |
PrairieSky Royalty Ltd. | 191,600 | | 6,924 |
Rice Energy, Inc. | 543,200 | | 14,286 |
Scorpio Tankers, Inc. | 682,500 | | 6,409 |
Targa Resources Corp. | 69,700 | | 8,887 |
Common Stocks - continued |
| Shares | | Value (000s) |
ENERGY - continued |
Oil, Gas & Consumable Fuels - continued |
Teekay Corp. | 54,300 | | $ 3,022 |
Valero Energy Corp. | 414,944 | | 21,079 |
| | 655,409 |
TOTAL ENERGY | | 821,701 |
FINANCIALS - 4.6% |
Banks - 2.4% |
Axis Bank Ltd. | 953,180 | | 6,305 |
Bank of America Corp. | 6,449,587 | | 98,356 |
Citigroup, Inc. | 2,178,590 | | 106,555 |
HDFC Bank Ltd. sponsored ADR | 409,100 | | 19,391 |
ICICI Bank Ltd. sponsored ADR | 476,229 | | 23,821 |
JPMorgan Chase & Co. | 2,401,777 | | 138,510 |
Punjab National Bank | 189,600 | | 3,034 |
Yes Bank Ltd. | 170,103 | | 1,500 |
| | 397,472 |
Capital Markets - 1.1% |
Ameriprise Financial, Inc. | 187,753 | | 22,455 |
BlackRock, Inc. Class A | 179,900 | | 54,821 |
Carlyle Group LP | 275,200 | | 9,186 |
Invesco Ltd. | 620,572 | | 23,352 |
Morgan Stanley | 1,475,351 | | 47,713 |
Och-Ziff Capital Management Group LLC Class A | 936,700 | | 12,748 |
State Street Corp. | 72,100 | | 5,079 |
The Blackstone Group LP | 425,600 | | 13,909 |
| | 189,263 |
Consumer Finance - 0.7% |
American Express Co. | 1,193,544 | | 105,032 |
Capital One Financial Corp. | 137,900 | | 10,969 |
Shriram Transport Finance Co. Ltd. | 339,455 | | 5,006 |
| | 121,007 |
Insurance - 0.1% |
MetLife, Inc. | 275,700 | | 14,502 |
Real Estate Management & Development - 0.2% |
Howard Hughes Corp. (a) | 53,100 | | 7,722 |
Parsvnath Developers Ltd. (a)(d) | 21,771,340 | | 9,495 |
Realogy Holdings Corp. (a) | 465,467 | | 17,111 |
| | 34,328 |
Common Stocks - continued |
| Shares | | Value (000s) |
FINANCIALS - continued |
Thrifts & Mortgage Finance - 0.1% |
Housing Development Finance Corp. Ltd. | 697,722 | | $ 12,219 |
TOTAL FINANCIALS | | 768,791 |
HEALTH CARE - 15.3% |
Biotechnology - 8.4% |
Acceleron Pharma, Inc. | 42,800 | | 1,268 |
Agios Pharmaceuticals, Inc. | 161,640 | | 6,514 |
Alexion Pharmaceuticals, Inc. (a) | 628,996 | | 100,004 |
Alkermes PLC (a) | 711,400 | | 30,419 |
Alnylam Pharmaceuticals, Inc. (a) | 616,063 | | 33,298 |
Amgen, Inc. | 1,470,202 | | 187,289 |
Avalanche Biotechnologies, Inc. (a) | 22,200 | | 621 |
BioCryst Pharmaceuticals, Inc. (a) | 833,700 | | 10,438 |
Biogen Idec, Inc. (a) | 742,100 | | 248,151 |
BioMarin Pharmaceutical, Inc. (a) | 281,704 | | 17,415 |
Bluebird Bio, Inc. (a) | 124,700 | | 4,165 |
Celgene Corp. (a) | 28,000 | | 2,440 |
Dicerna Pharmaceuticals, Inc. | 161,260 | | 2,422 |
Exelixis, Inc. (a) | 2,632,000 | | 10,633 |
Gilead Sciences, Inc. (a) | 4,887,260 | | 447,429 |
Grifols SA | 130,700 | | 5,919 |
Intercept Pharmaceuticals, Inc. (a) | 85,300 | | 19,820 |
InterMune, Inc. (a) | 375,237 | | 16,462 |
Intrexon Corp. (e) | 234,059 | | 5,170 |
Ironwood Pharmaceuticals, Inc. Class A (a) | 907,481 | | 13,431 |
Isis Pharmaceuticals, Inc. (a) | 63,700 | | 1,974 |
Keryx Biopharmaceuticals, Inc. (a)(e) | 528,873 | | 7,960 |
KYTHERA Biopharmaceuticals, Inc. (a)(e) | 263,156 | | 8,837 |
Merrimack Pharmaceuticals, Inc. (a) | 1,594,658 | | 9,424 |
Neurocrine Biosciences, Inc. (a) | 442,100 | | 6,004 |
NPS Pharmaceuticals, Inc. (a) | 88,000 | | 2,459 |
Pharmacyclics, Inc. (a) | 170,900 | | 20,583 |
Puma Biotechnology, Inc. (a) | 51,700 | | 11,463 |
Regeneron Pharmaceuticals, Inc. (a) | 329,489 | | 104,191 |
Seattle Genetics, Inc. (a) | 158,900 | | 5,593 |
Synageva BioPharma Corp. (a) | 130,800 | | 8,948 |
Ultragenyx Pharmaceutical, Inc. (e) | 26,500 | | 1,158 |
uniQure B.V. | 305,687 | | 3,124 |
Vertex Pharmaceuticals, Inc. (a) | 421,660 | | 37,490 |
| | 1,392,516 |
Common Stocks - continued |
| Shares | | Value (000s) |
HEALTH CARE - continued |
Health Care Equipment & Supplies - 0.9% |
Accuray, Inc. (a)(e) | 935,165 | | $ 7,360 |
Boston Scientific Corp. (a) | 2,388,900 | | 30,530 |
Insulet Corp. (a) | 88,000 | | 3,110 |
Intuitive Surgical, Inc. (a) | 92,207 | | 42,189 |
Novadaq Technologies, Inc. (a) | 607,819 | | 9,324 |
The Cooper Companies, Inc. | 324,630 | | 52,226 |
Zeltiq Aesthetics, Inc. (a) | 203,500 | | 4,119 |
| | 148,858 |
Health Care Providers & Services - 0.7% |
Apollo Hospitals Enterprise Ltd. | 936,371 | | 15,608 |
Cardinal Health, Inc. | 313,331 | | 22,450 |
Express Scripts Holding Co. (a) | 48,000 | | 3,343 |
HCA Holdings, Inc. (a) | 762,500 | | 49,799 |
Healthequity, Inc. (a) | 41,900 | | 737 |
iKang Healthcare Group, Inc. sponsored ADR (e) | 270,505 | | 5,075 |
Qualicorp SA (a) | 1,151,000 | | 13,317 |
| | 110,329 |
Health Care Technology - 0.3% |
Allscripts Healthcare Solutions, Inc. (a) | 310,100 | | 4,937 |
athenahealth, Inc. (a) | 76,475 | | 9,513 |
Castlight Health, Inc. Class B (a)(e) | 133,859 | | 1,795 |
Cerner Corp. (a) | 751,218 | | 41,467 |
| | 57,712 |
Life Sciences Tools & Services - 0.9% |
Agilent Technologies, Inc. | 366,510 | | 20,558 |
Genfit (a) | 89,600 | | 3,370 |
Illumina, Inc. (a) | 688,535 | | 110,104 |
Lonza Group AG | 38,412 | | 4,269 |
Thermo Fisher Scientific, Inc. | 55,800 | | 6,780 |
| | 145,081 |
Pharmaceuticals - 4.1% |
AbbVie, Inc. | 2,397,806 | | 125,501 |
Achaogen, Inc. (a) | 331,200 | | 3,580 |
Actavis PLC (a) | 845,755 | | 181,211 |
Allergan, Inc. | 278,273 | | 46,154 |
GW Pharmaceuticals PLC ADR (a)(e) | 265,666 | | 22,475 |
Jazz Pharmaceuticals PLC (a) | 11,500 | | 1,607 |
Johnson & Johnson | 188,500 | | 18,867 |
Merck & Co., Inc. | 588,603 | | 33,397 |
Common Stocks - continued |
| Shares | | Value (000s) |
HEALTH CARE - continued |
Pharmaceuticals - continued |
Pacira Pharmaceuticals, Inc. (a) | 117,166 | | $ 10,779 |
Perrigo Co. PLC | 135,440 | | 20,377 |
Salix Pharmaceuticals Ltd. (a) | 235,837 | | 31,109 |
Shire PLC sponsored ADR | 160,659 | | 39,602 |
Teva Pharmaceutical Industries Ltd. sponsored ADR | 1,034,900 | | 55,367 |
Valeant Pharmaceuticals International (Canada) (a) | 824,300 | | 96,639 |
| | 686,665 |
TOTAL HEALTH CARE | | 2,541,161 |
INDUSTRIALS - 9.1% |
Aerospace & Defense - 1.8% |
Honeywell International, Inc. | 890,300 | | 81,756 |
Precision Castparts Corp. | 272,800 | | 62,417 |
The Boeing Co. | 983,626 | | 118,507 |
United Technologies Corp. | 277,900 | | 29,221 |
| | 291,901 |
Air Freight & Logistics - 0.7% |
C.H. Robinson Worldwide, Inc. | 80,900 | | 5,458 |
FedEx Corp. | 233,678 | | 34,323 |
Hub Group, Inc. Class A (a) | 168,200 | | 7,767 |
United Parcel Service, Inc. Class B | 551,800 | | 53,574 |
XPO Logistics, Inc. (a)(e) | 524,500 | | 16,202 |
| | 117,324 |
Airlines - 1.8% |
American Airlines Group, Inc. | 4,098,693 | | 159,234 |
Azul-Linhas Aereas Brasileiras warrants (f) | 165,571 | | 0 |
Delta Air Lines, Inc. | 1,778,500 | | 66,623 |
Southwest Airlines Co. | 421,502 | | 11,920 |
Spirit Airlines, Inc. (a) | 856,400 | | 56,026 |
United Continental Holdings, Inc. (a) | 167,700 | | 7,780 |
| | 301,583 |
Building Products - 0.1% |
A.O. Smith Corp. | 274,454 | | 12,817 |
Electrical Equipment - 0.7% |
Acuity Brands, Inc. | 145,800 | | 15,640 |
Eaton Corp. PLC | 684,100 | | 46,464 |
Generac Holdings, Inc. (a) | 187,701 | | 8,146 |
SolarCity Corp. (a)(e) | 410,032 | | 29,330 |
Common Stocks - continued |
| Shares | | Value (000s) |
INDUSTRIALS - continued |
Electrical Equipment - continued |
TCP International Holdings Ltd. | 470,900 | | $ 4,069 |
Vestas Wind Systems A/S (a) | 231,300 | | 10,464 |
| | 114,113 |
Industrial Conglomerates - 0.8% |
Danaher Corp. | 1,876,700 | | 138,651 |
Machinery - 1.4% |
Caterpillar, Inc. | 500,900 | | 50,466 |
Cummins, Inc. | 716,661 | | 99,895 |
Ingersoll-Rand PLC | 599,184 | | 35,226 |
ITT Corp. | 388,800 | | 17,873 |
Manitowoc Co., Inc. | 640,900 | | 17,022 |
Navistar International Corp. (a)(e) | 364,600 | | 12,823 |
| | 233,305 |
Professional Services - 0.2% |
Huron Consulting Group, Inc. (a) | 194,520 | | 11,757 |
Towers Watson & Co. | 205,587 | | 20,974 |
| | 32,731 |
Road & Rail - 1.4% |
Avis Budget Group, Inc. (a) | 260,463 | | 14,635 |
Canadian Pacific Railway Ltd. | 192,000 | | 36,509 |
Hertz Global Holdings, Inc. (a) | 1,182,296 | | 33,364 |
J.B. Hunt Transport Services, Inc. | 509,700 | | 39,379 |
Landstar System, Inc. | 76,700 | | 5,072 |
Union Pacific Corp. | 1,142,600 | | 112,329 |
| | 241,288 |
Trading Companies & Distributors - 0.2% |
United Rentals, Inc. (a) | 257,800 | | 27,301 |
TOTAL INDUSTRIALS | | 1,511,014 |
INFORMATION TECHNOLOGY - 33.0% |
Communications Equipment - 2.0% |
Arista Networks, Inc. (e) | 112,200 | | 7,419 |
Cisco Systems, Inc. | 195,100 | | 4,922 |
F5 Networks, Inc. (a) | 237,906 | | 26,786 |
Palo Alto Networks, Inc. (a) | 345,746 | | 27,957 |
QUALCOMM, Inc. | 3,153,414 | | 232,407 |
Riverbed Technology, Inc. (a) | 1,434,841 | | 25,684 |
| | 325,175 |
Common Stocks - continued |
| Shares | | Value (000s) |
INFORMATION TECHNOLOGY - continued |
Electronic Equipment & Components - 0.3% |
InvenSense, Inc. (a)(e) | 1,264,980 | | $ 29,107 |
Samsung SDI Co. Ltd. | 10,144 | | 1,562 |
TE Connectivity Ltd. | 360,812 | | 22,331 |
| | 53,000 |
Internet Software & Services - 11.2% |
Akamai Technologies, Inc. (a) | 563,430 | | 33,254 |
Baidu.com, Inc. sponsored ADR (a) | 313,600 | | 67,753 |
Cornerstone OnDemand, Inc. (a) | 264,000 | | 11,046 |
Dropbox, Inc. (a)(f) | 1,003,814 | | 19,174 |
Facebook, Inc. Class A (a) | 5,456,001 | | 396,378 |
Gogo, Inc. (a)(e) | 821,400 | | 13,315 |
Google, Inc.: | | | |
Class A (a) | 827,454 | | 479,551 |
Class C (a) | 776,454 | | 443,821 |
IAC/InterActiveCorp | 592,300 | | 39,803 |
INFO Edge India Ltd. | 405,018 | | 4,590 |
Just Dial Ltd. (a) | 669,562 | | 18,381 |
LinkedIn Corp. (a) | 58,500 | | 10,567 |
Naver Corp. | 54,864 | | 39,170 |
Rackspace Hosting, Inc. (a) | 1,746,801 | | 52,911 |
Tencent Holdings Ltd. | 3,704,500 | | 60,160 |
Twitter, Inc. | 1,214,700 | | 54,892 |
Wix.com Ltd. (a) | 172,600 | | 2,926 |
Xoom Corp. (a) | 418,275 | | 9,060 |
Xunlei Ltd. sponsored ADR (e) | 88,400 | | 1,062 |
Yahoo!, Inc. (a) | 2,666,576 | | 95,490 |
Zoopla Property Group PLC | 1,328,700 | | 5,653 |
| | 1,858,957 |
IT Services - 4.1% |
Cognizant Technology Solutions Corp. Class A (a) | 3,939,554 | | 193,235 |
MasterCard, Inc. Class A | 2,820,400 | | 209,133 |
VeriFone Systems, Inc. (a) | 991,400 | | 33,222 |
Visa, Inc. Class A | 1,127,999 | | 238,019 |
| | 673,609 |
Semiconductors & Semiconductor Equipment - 4.1% |
Broadcom Corp. Class A | 680,000 | | 26,017 |
Canadian Solar, Inc. (a)(e) | 484,500 | | 12,093 |
Cavium, Inc. (a) | 882,401 | | 41,164 |
Cree, Inc. (a) | 698,453 | | 32,988 |
Cypress Semiconductor Corp. (e) | 3,118,484 | | 31,528 |
Common Stocks - continued |
| Shares | | Value (000s) |
INFORMATION TECHNOLOGY - continued |
Semiconductors & Semiconductor Equipment - continued |
eMemory Technology, Inc. | 155,000 | | $ 1,405 |
First Solar, Inc. (a) | 1,142,300 | | 72,091 |
Freescale Semiconductor, Inc. (a) | 1,654,654 | | 33,126 |
GCL-Poly Energy Holdings Ltd. (a) | 11,669,000 | | 3,767 |
GT Advanced Technologies, Inc. (a)(e) | 320,400 | | 4,434 |
Integrated Device Technology, Inc. (a) | 796,400 | | 11,436 |
MediaTek, Inc. | 491,000 | | 7,580 |
Mellanox Technologies Ltd. (a) | 138,000 | | 5,748 |
Micron Technology, Inc. (a) | 3,097,500 | | 94,629 |
Monolithic Power Systems, Inc. | 201,194 | | 8,297 |
NVIDIA Corp. | 1,196,370 | | 20,936 |
NXP Semiconductors NV (a) | 3,689,907 | | 230,066 |
RF Micro Devices, Inc. (a) | 1,054,300 | | 11,766 |
Silicon Laboratories, Inc. (a) | 94,053 | | 3,831 |
SunEdison, Inc. (a) | 846,845 | | 16,937 |
SunPower Corp. (a)(e) | 145,100 | | 5,330 |
| | 675,169 |
Software - 4.2% |
Activision Blizzard, Inc. | 4,452,900 | | 99,656 |
Adobe Systems, Inc. (a) | 924,250 | | 63,875 |
CommVault Systems, Inc. (a) | 21,788 | | 1,046 |
Concur Technologies, Inc. (a) | 60,600 | | 5,633 |
Electronic Arts, Inc. (a) | 612,486 | | 20,580 |
Fortinet, Inc. (a) | 568,596 | | 13,959 |
Imperva, Inc. (a) | 129,076 | | 2,862 |
Intuit, Inc. | 122,800 | | 10,066 |
Microsoft Corp. | 5,376,644 | | 232,056 |
Red Hat, Inc. (a) | 212,400 | | 12,345 |
salesforce.com, Inc. (a) | 4,125,869 | | 223,828 |
Zynga, Inc. (a) | 2,267,483 | | 6,621 |
| | 692,527 |
Technology Hardware, Storage & Peripherals - 7.1% |
Apple, Inc. | 11,237,609 | | 1,073,976 |
BlackBerry Ltd. (a) | 4,993,900 | | 46,593 |
Cray, Inc. (a) | 60,000 | | 1,591 |
Hewlett-Packard Co. | 1,059,400 | | 37,725 |
Common Stocks - continued |
| Shares | | Value (000s) |
INFORMATION TECHNOLOGY - continued |
Technology Hardware, Storage & Peripherals - continued |
NCR Corp. (a) | 716,126 | | $ 22,164 |
Nimble Storage, Inc. | 119,706 | | 3,098 |
| | 1,185,147 |
TOTAL INFORMATION TECHNOLOGY | | 5,463,584 |
MATERIALS - 2.0% |
Chemicals - 1.9% |
Cabot Corp. | 319,799 | | 16,754 |
Celanese Corp. Class A | 251,250 | | 14,625 |
Eastman Chemical Co. | 751,300 | | 59,187 |
Huntsman Corp. | 675,161 | | 17,588 |
Intrepid Potash, Inc. (a)(e) | 515,965 | | 7,641 |
LyondellBasell Industries NV Class A | 167,425 | | 17,789 |
Monsanto Co. | 1,154,300 | | 130,540 |
Orion Engineered Carbons SA (a) | 195,700 | | 3,327 |
Potash Corp. of Saskatchewan, Inc. (e) | 433,661 | | 15,396 |
The Mosaic Co. | 315,219 | | 14,535 |
Westlake Chemical Corp. | 154,900 | | 13,537 |
| | 310,919 |
Construction Materials - 0.1% |
CaesarStone Sdot-Yam Ltd. | 221,500 | | 9,604 |
Metals & Mining - 0.0% |
Freeport-McMoRan Copper & Gold, Inc. | 226,200 | | 8,419 |
TOTAL MATERIALS | | 328,942 |
TELECOMMUNICATION SERVICES - 0.2% |
Diversified Telecommunication Services - 0.0% |
Jazztel PLC (a) | 573,300 | | 7,731 |
Wireless Telecommunication Services - 0.2% |
Bharti Infratel Ltd. (a) | 3,161,156 | | 13,351 |
RingCentral, Inc. | 140,250 | | 2,094 |
T-Mobile U.S., Inc. (a) | 305,909 | | 10,077 |
| | 25,522 |
TOTAL TELECOMMUNICATION SERVICES | | 33,253 |
Common Stocks - continued |
| Shares | | Value (000s) |
UTILITIES - 0.1% |
Independent Power and Renewable Electricity Producers - 0.1% |
Abengoa Yield PLC | 83,100 | | $ 3,007 |
NextEra Energy Partners LP | 229,100 | | 7,799 |
| | 10,806 |
Independent Power Producers & Energy Traders - 0.0% |
Dynegy, Inc. (a) | 390,232 | | 10,361 |
TOTAL UTILITIES | | 21,167 |
TOTAL COMMON STOCKS (Cost $11,209,369) |
16,462,126
|
Convertible Preferred Stocks - 0.6% |
| | | |
CONSUMER DISCRETIONARY - 0.1% |
Leisure Products - 0.1% |
NJOY, Inc.: | | | |
Series C (a)(f) | 607,766 | | 10,287 |
Series D (f) | 149,114 | | 2,524 |
| | 12,811 |
INDUSTRIALS - 0.0% |
Airlines - 0.0% |
Azul-Linhas Aereas Brasileiras Series B (f) | 165,571 | | 7,298 |
INFORMATION TECHNOLOGY - 0.5% |
Internet Software & Services - 0.5% |
New Relic, Inc. Series F (f) | 152,912 | | 4,127 |
Uber Technologies, Inc. 8.00% (f) | 1,289,237 | | 80,000 |
| | 84,127 |
Software - 0.0% |
Cloudera, Inc. Series F (f) | 186,078 | | 2,910 |
TOTAL INFORMATION TECHNOLOGY | | 87,037 |
TOTAL CONVERTIBLE PREFERRED STOCKS (Cost $101,593) |
107,146
|
Money Market Funds - 1.2% |
| Shares | | Value (000s) |
Fidelity Cash Central Fund, 0.11% (b) | 9,495,233 | | $ 9,495 |
Fidelity Securities Lending Cash Central Fund, 0.11% (b)(c) | 185,310,929 | | 185,311 |
TOTAL MONEY MARKET FUNDS (Cost $194,806) |
194,806
|
TOTAL INVESTMENT PORTFOLIO - 101.1% (Cost $11,505,768) | 16,764,078 |
NET OTHER ASSETS (LIABILITIES) - (1.1)% | | (182,107) |
NET ASSETS - 100% | $ 16,581,971 |
Legend |
(a) Non-income producing |
(b) Affiliated fund that is generally available only to investment companies and other accounts managed by Fidelity Investments. The rate quoted is the annualized seven-day yield of the fund at period end. A complete unaudited listing of the fund's holdings as of its most recent quarter end is available upon request. In addition, each Fidelity Central Fund's financial statements, which are not covered by the Fund's Report of Independent Registered Public Accounting Firm, are available on the SEC's website or upon request. |
(c) Investment made with cash collateral received from securities on loan. |
(d) Affiliated company |
(e) Security or a portion of the security is on loan at period end. |
(f) Restricted securities - Investment in securities not registered under the Securities Act of 1933 (excluding 144A issues). At the end of the period, the value of restricted securities (excluding 144A issues) amounted to $146,262,000 or 0.9% of net assets. |
Additional information on each restricted holding is as follows: |
Security | Acquisition Date | Acquisition Cost (000s) |
Azul-Linhas Aereas Brasileiras Series B | 12/24/13 | $ 7,023 |
Azul-Linhas Aereas Brasileiras warrants | 12/24/13 | $ 0 |
Cloudera, Inc. Series F | 2/5/14 | $ 2,709 |
Dropbox, Inc. | 5/2/12 | $ 9,084 |
New Relic, Inc. Series F | 4/17/14 | $ 4,424 |
NJOY, Inc. | 9/11/13 | $ 9,520 |
NJOY, Inc. Series C | 6/7/13 | $ 4,913 |
Security | Acquisition Date | Acquisition Cost (000s) |
NJOY, Inc. Series D | 2/14/14 | $ 2,524 |
Uber Technologies, Inc. 8.00% | 6/6/14 | $ 80,000 |
Affiliated Central Funds |
Information regarding fiscal year to date income earned by the Fund from investments in Fidelity Central Funds is as follows: |
Fund | Income earned
(Amounts in thousands) |
Fidelity Cash Central Fund | $ 24 |
Fidelity Securities Lending Cash Central Fund | 1,908 |
Total | $ 1,932 |
Other Affiliated Issuers |
An affiliated company is a company in which the Fund has ownership of at least 5% of the voting securities. Fiscal year to date transactions with companies which are or were affiliates are as follows: |
Affiliate
(Amounts in thousands) | Value,
beginning of
period | Purchases | Sales
Proceeds | Dividend
Income | Value,
end of
period |
Parsvnath Developers Ltd. | $ 10,232 | $ - | $ - | $ - | $ 9,495 |
Other Information |
The following is a summary of the inputs used, as of July 31, 2014, involving the Fund's assets and liabilities carried at fair value. The inputs or methodology used for valuing securities may not be an indication of the risk associated with investing in those securities. For more information on valuation inputs, and their aggregation into the levels used in the table below, please refer to the Investment Valuation section in the accompanying Notes to Financial Statements. |
Valuation Inputs at Reporting Date: |
Description
(Amounts in thousands) | Total | Level 1 | Level 2 | Level 3 |
Investments in Securities: | | | | |
Equities: | | | | |
Consumer Discretionary | $ 3,502,974 | $ 3,466,890 | $ 3,331 | $ 32,753 |
Consumer Staples | 1,482,350 | 1,482,350 | - | - |
Energy | 821,701 | 815,440 | 6,261 | - |
Financials | 768,791 | 731,232 | 37,559 | - |
Health Care | 2,541,161 | 2,525,553 | 15,608 | - |
Industrials | 1,518,312 | 1,511,014 | - | 7,298 |
Information Technology | 5,550,621 | 5,307,795 | 136,615 | 106,211 |
Materials | 328,942 | 328,942 | - | - |
Telecommunication Services | 33,253 | 19,902 | 13,351 | - |
Utilities | 21,167 | 21,167 | - | - |
Money Market Funds | 194,806 | 194,806 | - | - |
Total Investments in Securities: | $ 16,764,078 | $ 16,405,091 | $ 212,725 | $ 146,262 |
Distribution of investments by country or territory of incorporation, as a percentage of total net assets, is as follows (Unaudited): |
United States of America | 89.2% |
Ireland | 1.9% |
Canada | 1.9% |
Cayman Islands | 1.5% |
Netherlands | 1.5% |
Others (Individually Less Than 1%) | 4.0% |
| 100.0% |
See accompanying notes which are an integral part of the financial statements.
Annual Report
Statement of Assets and Liabilities
Amounts in thousands (except per-share amounts) | July 31, 2014 |
| | |
Assets | | |
Investment in securities, at value (including securities loaned of $175,711) - See accompanying schedule: Unaffiliated issuers (cost $11,280,111) | $ 16,559,777 | |
Fidelity Central Funds (cost $194,806) | 194,806 | |
Other affiliated issuers (cost $30,851) | 9,495 | |
Total Investments (cost $11,505,768) | | $ 16,764,078 |
Cash | | 443 |
Foreign currency held at value (cost $2,445) | | 2,445 |
Receivable for investments sold | | 113,939 |
Receivable for fund shares sold | | 19,313 |
Dividends receivable | | 6,394 |
Distributions receivable from Fidelity Central Funds | | 248 |
Receivable from investment adviser for expense reductions | | 7 |
Other receivables | | 820 |
Total assets | | 16,907,687 |
| | |
Liabilities | | |
Payable for investments purchased | $ 107,464 | |
Payable for fund shares redeemed | 20,068 | |
Accrued management fee | 8,550 | |
Other affiliated payables | 2,007 | |
Other payables and accrued expenses | 2,316 | |
Collateral on securities loaned, at value | 185,311 | |
Total liabilities | | 325,716 |
| | |
Net Assets | | $ 16,581,971 |
Net Assets consist of: | | |
Paid in capital | | $ 10,478,889 |
Undistributed net investment income | | 17,541 |
Accumulated undistributed net realized gain (loss) on investments and foreign currency transactions | | 828,668 |
Net unrealized appreciation (depreciation) on investments and assets and liabilities in foreign currencies | | 5,256,873 |
Net Assets | | $ 16,581,971 |
See accompanying notes which are an integral part of the financial statements.
Annual Report
Statement of Assets and Liabilities - continued
Amounts in thousands (except per-share amounts) | July 31, 2014 |
| | |
Blue Chip Growth:
Net Asset Value, offering price and redemption price per share ($11,969,523 ÷ 179,406 shares) | | $ 66.72 |
| | |
Class K:
Net Asset Value, offering price and redemption price per share ($4,612,448 ÷ 69,033 shares) | | $ 66.82 |
See accompanying notes which are an integral part of the financial statements.
Annual Report
Financial Statements - continued
Statement of Operations
Amounts in thousands | Year ended July 31, 2014 |
| | |
Investment Income | | |
Dividends | | $ 176,722 |
Income from Fidelity Central Funds | | 1,932 |
Total income | | 178,654 |
| | |
Expenses | | |
Management fee
Basic fee | $ 95,242 | |
Performance adjustment | 11,359 | |
Transfer agent fees | 22,396 | |
Accounting and security lending fees | 1,655 | |
Custodian fees and expenses | 403 | |
Independent trustees' compensation | 75 | |
Appreciation in deferred trustee compensation account | 1 | |
Registration fees | 157 | |
Audit | 97 | |
Legal | 65 | |
Interest | 6 | |
Miscellaneous | 163 | |
Total expenses before reductions | 131,619 | |
Expense reductions | (481) | 131,138 |
Net investment income (loss) | | 47,516 |
Realized and Unrealized Gain (Loss) Net realized gain (loss) on: | | |
Investment securities: | | |
Unaffiliated issuers | 1,380,300 | |
Redemption in-kind with affiliated entities | 3,310,457 | |
Foreign currency transactions | (452) | |
Total net realized gain (loss) | | 4,690,305 |
Change in net unrealized appreciation (depreciation) on: Investment securities | (1,368,324) | |
Assets and liabilities in foreign currencies | 47 | |
Total change in net unrealized appreciation (depreciation) | | (1,368,277) |
Net gain (loss) | | 3,322,028 |
Net increase (decrease) in net assets resulting from operations | | $ 3,369,544 |
See accompanying notes which are an integral part of the financial statements.
Annual Report
Statement of Changes in Net Assets
Amounts in thousands | Year ended
July 31,
2014 | Year ended
July 31,
2013 |
Increase (Decrease) in Net Assets | | |
Operations | | |
Net investment income (loss) | $ 47,516 | $ 139,090 |
Net realized gain (loss) | 4,690,305 | 1,392,019 |
Change in net unrealized appreciation (depreciation) | (1,368,277) | 2,900,667 |
Net increase (decrease) in net assets resulting
from operations | 3,369,544 | 4,431,776 |
Distributions to shareholders from net investment income | (80,757) | (85,342) |
Distributions to shareholders from net realized gain | (1,378,625) | (230,904) |
Total distributions | (1,459,382) | (316,246) |
Share transactions - net increase (decrease) | (5,511,393) | 1,247,958 |
Total increase (decrease) in net assets | (3,601,231) | 5,363,488 |
| | |
Net Assets | | |
Beginning of period | 20,183,202 | 14,819,714 |
End of period (including undistributed net investment income of $17,541 and undistributed net investment income of $56,036, respectively) | $ 16,581,971 | $ 20,183,202 |
See accompanying notes which are an integral part of the financial statements.
Annual Report
Financial Highlights - Blue Chip Growth
Years ended July 31, | 2014 | 2013 | 2012 | 2011 | 2010 |
Selected Per-Share Data | | | | | |
Net asset value, beginning of period | $ 59.65 | $ 47.38 | $ 48.17 | $ 37.63 | $ 31.97 |
Income from Investment Operations | | | | | |
Net investment income (loss) B | .15 | .39 | .10 | (.03) | .04 |
Net realized and unrealized gain (loss) | 11.63 | 12.79 | .75 | 10.61 | 5.80 |
Total from investment operations | 11.78 | 13.18 | .85 | 10.58 | 5.84 |
Distributions from net investment income | (.24) | (.23) | (.04) | .00 E, G | (.18) |
Distributions from net realized gain | (4.47) | (.68) | (1.60) | (.04) E | - |
Total distributions | (4.71) | (.91) | (1.64) | (.04) | (.18) |
Net asset value, end of period | $ 66.72 | $ 59.65 | $ 47.38 | $ 48.17 | $ 37.63 |
Total ReturnA | 21.07% | 28.25% | 2.27% | 28.12% | 18.29% |
Ratios to Average Net Assets C, F | | | | | |
Expenses before reductions | .80% | .76% | .90% | .94% | .94% |
Expenses net of fee waivers, if any | .80% | .76% | .90% | .94% | .94% |
Expenses net of all reductions | .80% | .74% | .89% | .92% | .93% |
Net investment income (loss) | .23% | .75% | .21% | (.06)% | .10% |
Supplemental Data | | | | | |
Net assets, end of period (in millions) | $ 11,970 | $ 12,927 | $ 10,595 | $ 12,024 | $ 10,295 |
Portfolio turnover rateD | 57% H | 75% | 95% | 132% | 135% |
A Total returns would have been lower if certain expenses had not been reduced during the applicable periods shown.
B Calculated based on average shares outstanding during the period.
C Fees and expenses of any underlying Fidelity Central Funds are not included in the Fund's expense ratio. The Fund indirectly bears its proportionate share of the expenses of any underlying Fidelity Central Funds.
D Amount does not include the portfolio activity of any underlying Fidelity Central Funds.
E The amounts shown reflect certain reclassifications related to book to tax differences that were made in the year shown.
F Expense ratios reflect operating expenses of the class. Expenses before reductions do not reflect amounts reimbursed by the investment adviser or reductions from brokerage service arrangements or reductions from other expense offset arrangements and do not represent the amount paid by the class during periods when reimbursements or reductions occur. Expenses net of fee waivers reflect expenses after reimbursement by the investment adviser but prior to reductions from brokerage service arrangements or other expense offset arrangements. Expenses net of all reductions represent the net expenses paid by the class.
G Amount represents less than $.01 per share.
H Portfolio turnover rate excludes securities received or delivered in-kind.
See accompanying notes which are an integral part of the financial statements.
Annual Report
Financial Highlights - Class K
Years ended July 31, | 2014 | 2013 | 2012 | 2011 | 2010 |
Selected Per-Share Data | | | | | |
Net asset value, beginning of period | $ 59.74 | $ 47.46 | $ 48.21 | $ 37.66 | $ 32.01 |
Income from Investment Operations | | | | | |
Net investment income (loss) B | .23 | .47 | .17 | .05 | .11 |
Net realized and unrealized gain (loss) | 11.64 | 12.79 | .75 | 10.62 | 5.79 |
Total from investment operations | 11.87 | 13.26 | .92 | 10.67 | 5.90 |
Distributions from net investment income | (.33) | (.30) | (.08) | (.05) E | (.25) |
Distributions from net realized gain | (4.47) | (.68) | (1.60) | (.07) E | - |
Total distributions | (4.79)I | (.98) | (1.67) H | (.12) | (.25) |
Net asset value, end of period | $ 66.82 | $ 59.74 | $ 47.46 | $ 48.21 | $ 37.66 |
Total ReturnA | 21.23% | 28.42% | 2.43% | 28.37% | 18.48% |
Ratios to Average Net Assets C, F | | | | | |
Expenses before reductions | .68% | .61% | .74% | .77% | .75% |
Expenses net of fee waivers, if any | .68% | .61% | .74% | .77% | .75% |
Expenses net of all reductions | .67% | .60% | .73% | .76% | .74% |
Net investment income (loss) | .36% | .89% | .37% | .11% | .30% |
Supplemental Data | | | | | |
Net assets, end of period (in millions) | $ 4,612 | $ 3,506 | $ 2,467 | $ 1,455 | $ 932 |
Portfolio turnover rateD | 57%G | 75% | 95% | 132% | 135% |
A Total returns would have been lower if certain expenses had not been reduced during the applicable periods shown.
B Calculated based on average shares outstanding during the period.
C Fees and expenses of any underlying Fidelity Central Funds are not included in the Fund's expense ratio. The Fund indirectly bears its proportionate share of the expenses of any underlying Fidelity Central Funds.
D Amount does not include the portfolio activity of any underlying Fidelity Central Funds.
E The amounts shown reflect certain reclassifications related to book to tax differences that were made in the year shown.
F Expense ratios reflect operating expenses of the class. Expenses before reductions do not reflect amounts reimbursed by the investment adviser or reductions from brokerage service arrangements or reductions from other expense offset arrangements and do not represent the amount paid by the class during periods when reimbursements or reductions occur. Expenses net of fee waivers reflect expenses after reimbursement by the investment adviser but prior to reductions from brokerage service arrangements or other expense offset arrangements. Expenses net of all reductions represent the net expenses paid by the class.
G Portfolio turnover rate excludes securities received or delivered in-kind.
H Total distributions of $1.67 per share is comprised of distributions from net investment income of $.076 and distributions from net realized gain of $1.598 per share.
I Total distributions of $4.79 per share is comprised of distributions from net investment income of $.325 and distributions from net realized gain of $4.466 per share.
See accompanying notes which are an integral part of the financial statements.
Annual Report
Notes to Financial Statements
For the period ended July 31, 2014
(Amounts in thousands except percentages)
1. Organization.
Fidelity Blue Chip Growth Fund (the Fund) is a fund of Fidelity Securities Fund (the Trust) and is authorized to issue an unlimited number of shares. The Trust is registered under the Investment Company Act of 1940, as amended (the 1940 Act), as an open-end management investment company organized as a Massachusetts business trust. The Fund offers Blue Chip Growth and Class K shares, each of which has equal rights as to assets and voting privileges. The Fund offered Class F shares during the period June 26, 2009 through November 19, 2013, and all outstanding shares were redeemed by November 19, 2013. Each class has exclusive voting rights with respect to matters that affect that class.
2. Investments in Fidelity Central Funds.
The Fund invests in Fidelity Central Funds, which are open-end investment companies generally available only to other investment companies and accounts managed by the investment adviser and its affiliates. The Fund's Schedule of Investments lists each of the Fidelity Central Funds held as of period end, if any, as an investment of the Fund, but does not include the underlying holdings of each Fidelity Central Fund. As an Investing Fund, the Fund indirectly bears its proportionate share of the expenses of the underlying Fidelity Central Funds.
The Money Market Central Funds seek preservation of capital and current income and are managed by Fidelity Investments Money Management, Inc. (FIMM), an affiliate of the investment adviser. Annualized expenses of the Money Market Central Funds as of their most recent shareholder report date are less than .01%.
A complete unaudited list of holdings for each Fidelity Central Fund is available upon request or at the Securities and Exchange Commission (the SEC) website at www.sec.gov. In addition, the financial statements of the Fidelity Central Funds are available on the SEC website or upon request.
3. Significant Accounting Policies.
The financial statements have been prepared in conformity with accounting principles generally accepted in the United States of America (GAAP), which require management to make certain estimates and assumptions at the date of the financial statements. Actual results could differ from those estimates. Subsequent events, if any, through the date that the financial statements were issued have been evaluated in the preparation of the financial statements. The following summarizes the significant accounting policies of the Fund:
Investment Valuation. Investments are valued as of 4:00 p.m. Eastern time on the last calendar day of the period. In accordance with valuation policies and procedures
Annual Report
Notes to Financial Statements - continued
(Amounts in thousands except percentages)
3. Significant Accounting Policies - continued
Investment Valuation - continued
approved by the Board of Trustees (the Board), the Fund attempts to obtain prices from one or more third party pricing vendors or brokers to value its investments. When current market prices, quotations or currency exchange rates are not readily available or reliable, investments will be fair valued in good faith by the Fidelity Management & Research Company (FMR) Fair Value Committee (the Committee), in accordance with procedures adopted by the Board. Factors used in determining fair value vary by investment type and may include market or investment specific events. The frequency with which these procedures are used cannot be predicted and they may be utilized to a significant extent. The Committee oversees the Fund's valuation policies and procedures and is responsible for approving and reporting to the Board all fair value determinations.
The Fund categorizes the inputs to valuation techniques used to value its investments into a disclosure hierarchy consisting of three levels as shown below:
Level 1 - quoted prices in active markets for identical investments
Level 2 - other significant observable inputs (including quoted prices for similar investments, interest rates, prepayment speeds, etc.)
Level 3 - unobservable inputs (including the Fund's own assumptions based on the best information available)
Valuation techniques used to value the Fund's investments by major category are as follows:
Equity securities, including restricted securities, for which market quotations are readily available, are valued at the last reported sale price or official closing price as reported by a third party pricing vendor on the primary market or exchange on which they are traded and are categorized as Level 1 in the hierarchy. In the event there were no sales during the day or closing prices are not available, securities are valued at the last quoted bid price or may be valued using the last available price and are generally categorized as Level 2 in the hierarchy. For foreign equity securities, when market or security specific events arise, comparisons to the valuation of American Depositary Receipts (ADRs), futures contracts, Exchange-Traded Funds (ETFs) and certain indexes as well as quoted prices for similar securities may be used and would be categorized as Level 2 in the hierarchy. Utilizing these techniques may result in transfers between Level 1 and Level 2. For equity securities, including restricted securities, where observable inputs are limited, assumptions about market activity and risk are used and these securities may be categorized as Level 3 in the hierarchy.
Annual Report
3. Significant Accounting Policies - continued
Investment Valuation - continued
Investments in open-end mutual funds, including the Fidelity Central Funds, are valued at their closing net asset value (NAV) each business day and are categorized as Level 1 in the hierarchy.
Changes in valuation techniques may result in transfers in or out of an assigned level within the disclosure hierarchy. The aggregate value of investments by input level, as of July 31, 2014, is included at the end of the Fund's Schedule of Investments.
Foreign Currency. The Fund may use foreign currency contracts to facilitate transactions in foreign-denominated securities. Gains and losses from these transactions may arise from changes in the value of the foreign currency or if the counterparties do not perform under the contracts' terms.
Foreign-denominated assets, including investment securities, and liabilities are translated into U.S. dollars at the exchange rates at period end. Purchases and sales of investment securities, income and dividends received and expenses denominated in foreign currencies are translated into U.S. dollars at the exchange rate in effect on the transaction date.
The effects of exchange rate fluctuations on investments are included with the net realized and unrealized gain (loss) on investment securities. Other foreign currency transactions resulting in realized and unrealized gain (loss) are disclosed separately.
Investment Transactions and Income. For financial reporting purposes, the Fund's investment holdings and NAV include trades executed through the end of the last business day of the period. The NAV per share for processing shareholder transactions is calculated as of the close of business of the New York Stock Exchange (NYSE), normally 4:00 p.m. Eastern time and includes trades executed through the end of the prior business day. Gains and losses on securities sold are determined on the basis of identified cost and may include proceeds received from litigation. Dividend income is recorded on the ex-dividend date, except for certain dividends from foreign securities where the ex-dividend date may have passed, which are recorded as soon as the Fund is informed of the ex-dividend date. Non-cash dividends included in dividend income, if any, are recorded at the fair market value of the securities received. Income and capital gain distributions from Fidelity Central Funds, if any, are recorded on the ex-dividend date. Distributions received on securities that represent a return of capital or capital gain are recorded as a reduction of cost of investments and/or as a realized gain. Subsequent to ex-dividend date the Fund determines the components of these distributions, based upon receipt of tax filings or other correspondence relating to the underlying investment. Interest income is accrued as earned and includes coupon interest and amortization of
Annual Report
Notes to Financial Statements - continued
(Amounts in thousands except percentages)
3. Significant Accounting Policies - continued
Investment Transactions and Income - continued
premium and accretion of discount on debt securities as applicable. Investment income is recorded net of foreign taxes withheld where recovery of such taxes is uncertain.
Class Allocations and Expenses. Investment income, realized and unrealized capital gains and losses, common expenses of the Fund, and certain fund-level expense reductions, if any, are allocated daily on a pro-rata basis to each class based on the relative net assets of each class to the total net assets of the Fund. Each class differs with respect to transfer agent fees incurred. Certain expense reductions may also differ by class. For the reporting period, the allocated portion of income and expenses to each class as a percent of its average net assets may vary due to the timing of recording these transactions in relation to fluctuating net assets of the classes. Expenses directly attributable to a fund are charged to that fund. Expenses attributable to more than one fund are allocated among the respective funds on the basis of relative net assets or other appropriate methods. Expense estimates are accrued in the period to which they relate and adjustments are made when actual amounts are known.
Deferred Trustee Compensation. Under a Deferred Compensation Plan (the Plan), independent Trustees may elect to defer receipt of a portion of their annual compensation. Deferred amounts are invested in a cross-section of Fidelity funds, are marked-to-market and remain in the Fund until distributed in accordance with the Plan. The investment of deferred amounts and the offsetting payable to the Trustees are included in the accompanying Statement of Assets and Liabilities.
Income Tax Information and Distributions to Shareholders. Each year, the Fund intends to qualify as a regulated investment company under Subchapter M of the Internal Revenue Code, including distributing substantially all of its taxable income and realized gains. As a result, no provision for U.S. Federal income taxes is required. As of July 31, 2014, the Fund did not have any unrecognized tax benefits in the financial statements; nor is the Fund aware of any tax positions for which it is reasonably possible that the total amounts of unrecognized tax benefits will significantly change in the next twelve months. The Fund files a U.S. federal tax return, in addition to state and local tax returns as required. The Fund's federal income tax returns are subject to examination by the Internal Revenue Service (IRS) for a period of three fiscal years after they are filed. State and local tax returns may be subject to examination for an additional fiscal year depending on the jurisdiction. Foreign taxes are provided for based on the Fund's understanding of the tax rules and rates that exist in the foreign markets in which it invests. The Fund is subject to a tax imposed on capital gains by certain countries in which it invests. An estimated deferred tax liability for net unrealized appreciation on the applicable securities is included in Other payables and accrued expenses on the Statement of Assets & Liabilities.
Annual Report
3. Significant Accounting Policies - continued
Income Tax Information and Distributions to Shareholders - continued
Distributions are declared and recorded on the ex-dividend date. Income dividends and capital gain distributions are declared separately for each class. Income and capital gain distributions are determined in accordance with income tax regulations, which may differ from GAAP. In addition, the Fund claimed a portion of the payment made to redeeming shareholders as a distribution for income tax purposes.
Capital accounts within the financial statements are adjusted for permanent book-tax differences. These adjustments have no impact on net assets or the results of operations. Capital accounts are not adjusted for temporary book-tax differences which will reverse in a subsequent period.
Book-tax differences are primarily due to foreign currency transactions, redemptions in kind, partnerships, deferred trustees compensation and losses deferred due to wash sales.
The federal tax cost of investment securities and unrealized appreciation (depreciation) as of period end were as follows:
Gross unrealized appreciation | $ 5,476,623 |
Gross unrealized depreciation | (245,385) |
Net unrealized appreciation (depreciation) on securities | $ 5,231,238 |
| |
Tax Cost | $ 11,532,840 |
The tax-based components of distributable earnings as of period end were as follows:
Undistributed ordinary income | $ 80,477 |
Undistributed long-term capital gain | $ 793,526 |
Net unrealized appreciation (depreciation) on securities and other investments | $ 5,231,281 |
The tax character of distributions paid was as follows:
| July 31, 2014 | July 31, 2013 |
Ordinary Income | $ 155,664 | $ 85,342 |
Long-term Capital Gains | 1,303,718 | 230,904 |
Total | $ 1,459,382 | $ 316,246 |
Restricted Securities. The Fund may invest in securities that are subject to legal or contractual restrictions on resale. These securities generally may be resold in transactions exempt from registration or to the public if the securities are registered. Disposal of these securities may involve time-consuming negotiations and expense, and prompt sale at an acceptable price may be difficult. Information regarding restricted securities is included at the end of the Fund's Schedule of Investments.
Annual Report
Notes to Financial Statements - continued
(Amounts in thousands except percentages)
4. Purchases and Sales of Investments.
Purchases and sales of securities, other than short-term securities and in-kind transactions, aggregated $10,440,292 and $10,009,929, respectively.
5. Fees and Other Transactions with Affiliates.
Management Fee. Fidelity Management & Research Company (the investment adviser) and its affiliates provide the Fund with investment management related services for which the Fund pays a monthly management fee. The management fee is the sum of an individual fund fee rate that is based on an annual rate of .30% of the Fund's average net assets and an annualized group fee rate that averaged .25% during the period. The group fee rate is based upon the average net assets of all the mutual funds advised by the investment adviser, including any mutual funds previously advised by the investment adviser that are currently advised by Fidelity SelectCo, LLC, an affiliate of the investment adviser. The group fee rate decreases as assets under management increase and increases as assets under management decrease. In addition, the management fee is subject to a performance adjustment (up to a maximum of ± .20% of the Fund's average net assets over a 36 month performance period). The upward or downward adjustment to the management fee is based on the relative investment performance of Blue Chip Growth as compared to its benchmark index, the Russell 1000 Growth Index, over the same 36 month performance period. For the reporting period, the total annual management fee rate, including the performance adjustment, was .62% of the Fund's average net assets. The performance adjustment included in the management fee rate may be higher or lower than the maximum performance adjustment rate due to the difference between the average net assets for the reporting and performance periods.
Transfer Agent Fees. Fidelity Investments Institutional Operations Company, Inc., (FIIOC), an affiliate of the investment adviser is the transfer, dividend disbursing and shareholder servicing agent for each class of the Fund. FIIOC receives account fees and asset-based fees that vary according to the account size and type of account of the shareholders of Blue Chip Growth. FIIOC receives an asset-based fee of Class K's average net assets. FIIOC pays for typesetting, printing and mailing of shareholder reports, except proxy statements.
For the period, transfer agent fees for each class were as follows:
| Amount | % of
Average
Net Assets |
Blue Chip Growth | $ 20,474 | .17 |
Class K | 1,922 | .05 |
| $ 22,396 | |
Annual Report
5. Fees and Other Transactions with Affiliates - continued
Accounting and Security Lending Fees. Fidelity Service Company, Inc. (FSC), an affiliate of the investment adviser, maintains the Fund's accounting records. The accounting fee is based on the level of average net assets for each month. Under a separate contract, FSC administers the security lending program. The security lending fee is based on the number and duration of lending transactions.
Brokerage Commissions. The Fund placed a portion of its portfolio transactions with brokerage firms which are affiliates of the investment adviser. Brokerage commissions are included in net realized gain (loss) and change in net unrealized appreciation (depreciation) in the Statement of Operations. The commissions paid to these affiliated firms were $93 for the period.
Interfund Lending Program. Pursuant to an Exemptive Order issued by the SEC, the Fund, along with other registered investment companies having management contracts with FMR or other affiliated entities of FMR, may participate in an interfund lending program. This program provides an alternative credit facility allowing the funds to borrow from, or lend money to, other participating affiliated funds. At period end, there were no interfund loans outstanding. The Fund's activity in this program during the period for which loans were outstanding was as follows:
Borrower or Lender | Average Loan
Balance | Weighted Average
Interest Rate | Interest Expense |
Borrower | $ 18,386 | .32% | $ 6 |
Redemptions In-Kind. During the period, 120,385 shares of the Fund held by affiliated entities were redeemed for investments with a value of $7,325,217. The net realized gain of $3,310,457 on investments delivered through in-kind redemptions is included in the accompanying Statement of Operations. The amount of in-kind redemptions is included in share transactions in the accompanying Statement of Changes in Net Assets as well as Note 10: Share Transactions. The Fund recognized no gain or loss for federal income tax purposes.
Other. During the period, the investment adviser reimbursed the Fund for certain losses in the amount of $390.
6. Committed Line of Credit.
The Fund participates with other funds managed by the investment adviser or an affiliate in a $4.25 billion credit facility (the "line of credit") to be utilized for temporary or emergency purposes to fund shareholder redemptions or for other short-term liquidity purposes. The Fund has agreed to pay commitment fees on its pro-rata portion of the line of credit, which amounted to $30 and is reflected in Miscellaneous expenses on the Statement of Operations. During the period, the Fund did not borrow on this line of credit.
Annual Report
Notes to Financial Statements - continued
(Amounts in thousands except percentages)
7. Security Lending.
The Fund lends portfolio securities through a lending agent from time to time in order to earn additional income. For equity securities, a lending agent is used and may loan securities to certain qualified borrowers, including Fidelity Capital Markets (FCM), a broker-dealer affiliated with the Fund. On the settlement date of the loan, the Fund receives collateral (in the form of U.S. Treasury obligations, letters of credit and/or cash) against the loaned securities and maintains collateral in an amount not less than 100% of the market value of the loaned securities during the period of the loan. The market value of the loaned securities is determined at the close of business of the Fund and any additional required collateral is delivered to the Fund on the next business day. If the borrower defaults on its obligation to return the securities loaned because of insolvency or other reasons, the Fund may apply collateral received from the borrower against the obligation. The Fund may experience delays and costs in recovering the securities loaned. Any cash collateral received is invested in the Fidelity Securities Lending Cash Central Fund. The value of loaned securities and cash collateral at period end are disclosed on the Fund's Statement of Assets and Liabilities. The value of securities loaned to FCM at period end was $699. Security lending income represents the income earned on investing cash collateral, less rebates paid to borrowers and any lending agent fees associated with the loan, plus any premium payments received for lending certain types of securities. Security lending income is presented in the Statement of Operations as a component of income from Fidelity Central Funds. Total security lending income during the period amounted to $1,908, including $50 from securities loaned to FCM.
8. Expense Reductions.
Commissions paid to certain brokers with whom the investment adviser, or its affiliates, places trades on behalf of the Fund include an amount in addition to trade execution, which may be rebated back to the Fund to offset certain expenses. This amount totaled $290 for the period.
In addition, the investment adviser reimbursed a portion of the Fund's operating expenses during the period in the amount of $191.
9. Distributions to Shareholders.
Distributions to shareholders of each class were as follows:
Years ended July 31, | 2014 A | 2013 |
From net investment income | | |
Blue Chip Growth | $ 47,730 | $ 51,844 |
Class K | 19,791 | 16,348 |
Class F | 13,236 | 17,150 |
Total | $ 80,757 | $ 85,342 |
Annual Report
9. Distributions to Shareholders - continued
Years ended July 31, | 2014 A | 2013 |
From net realized gain | | |
Blue Chip Growth | $ 908,543 | $ 155,106 |
Class K | 269,912 | 36,829 |
Class F | 200,170 | 38,969 |
Total | $ 1,378,625 | $ 230,904 |
A All Class F shares were redeemed on November 19, 2013.
10. Share Transactions.
Transactions for each class of shares were as follows:
| Shares | Dollars |
Years ended July 31, | 2014 A | 2013 | 2014 A | 2013 |
Blue Chip Growth | | | | |
Shares sold | 30,779 | 41,304 C | $ 1,939,078 | $ 2,121,491 C |
Reinvestment of distributions | 16,131 | 4,171 | 933,288 | 202,506 |
Shares redeemed | (84,222) B | (52,364) | (5,182,185) B | (2,708,546) |
Net increase (decrease) | (37,312) | (6,889) | $ (2,309,819) | $ (384,549) |
Class K | | | | |
Shares sold | 17,861 | 17,299 | $ 1,132,520 | $ 899,333 |
Reinvestment of distributions | 4,984 | 1,092 | 289,703 | 53,178 |
Shares redeemed | (12,491) | (11,703) | (788,832) | (608,221) |
Net increase (decrease) | 10,354 | 6,688 | $ 633,391 | $ 344,290 |
Class F | | | | |
Shares sold | 3,759 | 28,168 C | $ 226,491 | $ 1,424,726 C |
Reinvestment of distributions | 3,740 | 1,153 | 213,405 | 56,119 |
Shares redeemed | (70,205) B | (3,595) | (4,274,861) B | (192,628) |
Net increase (decrease) | (62,706) | 25,726 | $ (3,834,965) | $ 1,288,217 |
A All Class F shares were redeemed on November 19, 2013.
B Amount includes in-kind redemptions (see note 5: Redemptions In-Kind).
C Amount includes in-kind exchanges.
11. Other.
The Fund's organizational documents provide former and current trustees and officers with a limited indemnification against liabilities arising in connection with the performance of their duties to the Fund. In the normal course of business, the Fund may also enter into contracts that provide general indemnifications. The Fund's maximum exposure under these arrangements is unknown as this would be dependent on future claims that may be made against the Fund. The risk of material loss from such claims is considered remote.
Annual Report
To the Trustees of Fidelity Securities Fund and Shareholders of Fidelity Blue Chip Growth Fund:
We have audited the accompanying statement of assets and liabilities of Fidelity Blue Chip Growth Fund (the Fund), a fund of Fidelity Securities Fund, including the schedule of investments, as of July 31, 2014, and the related statement of operations for the year then ended, the statement of changes in net assets for each of the two years in the period then ended, and the financial highlights for each of the five years in the period then ended. These financial statements and financial highlights are the responsibility of the Fund's management. Our responsibility is to express an opinion on these financial statements and financial highlights based on our audits.
We conducted our audits in accordance with the standards of the Public Company Accounting Oversight Board (United States). Those standards require that we plan and perform the audit to obtain reasonable assurance about whether the financial statements and financial highlights are free of material misstatement. The Fund is not required to have, nor were we engaged to perform, an audit of its internal control over financial reporting. Our audits included consideration of internal control over financial reporting as a basis for designing audit procedures that are appropriate in the circumstances, but not for the purpose of expressing an opinion on the effectiveness of the Fund's internal control over financial reporting. Accordingly, we express no such opinion. An audit also includes examining, on a test basis, evidence supporting the amounts and disclosures in the financial statements, assessing the accounting principles used and significant estimates made by management, as well as evaluating the overall financial statement presentation. Our procedures included confirmation of securities owned as of July 31, 2014, by correspondence with the custodians and brokers; where replies were not received from brokers, we performed other auditing procedures. We believe that our audits provide a reasonable basis for our opinion.
In our opinion, the financial statements and financial highlights referred to above present fairly, in all material respects, the financial position of Fidelity Blue Chip Growth Fund as of July 31, 2014, the results of its operations for the year then ended, the changes in its net assets for each of the two years in the period then ended, and the financial highlights for each of the five years in the period then ended, in conformity with accounting principles generally accepted in the United States of America.
DELOITTE & TOUCHE LLP
Boston, Massachusetts
September 15, 2014
Annual Report
The Trustees, Member of the Advisory Board, and officers of the trust and fund, as applicable, are listed below. The Board of Trustees governs the fund and is responsible for protecting the interests of shareholders. The Trustees are experienced executives who meet periodically throughout the year to oversee the fund's activities, review contractual arrangements with companies that provide services to the fund, oversee management of the risks associated with such activities and contractual arrangements, and review the fund's performance. Except for James C. Curvey, each of the Trustees oversees 173 funds. Mr. Curvey oversees 397 funds.
The Trustees hold office without limit in time except that (a) any Trustee may resign; (b) any Trustee may be removed by written instrument, signed by at least two-thirds of the number of Trustees prior to such removal; (c) any Trustee who requests to be retired or who has become incapacitated by illness or injury may be retired by written instrument signed by a majority of the other Trustees; and (d) any Trustee may be removed at any special meeting of shareholders by a two-thirds vote of the outstanding voting securities of the trust. Each Trustee who is not an interested person (as defined in the 1940 Act) of the trust and the fund (Independent Trustee), shall retire not later than the last day of the calendar year in which his or her 75th birthday occurs. The Independent Trustees may waive this mandatory retirement age policy with respect to individual Trustees. The officers and Advisory Board Member hold office without limit in time, except that any officer and Advisory Board Member may resign or may be removed by a vote of a majority of the Trustees at any regular meeting or any special meeting of the Trustees. Except as indicated, each individual has held the office shown or other offices in the same company for the past five years.
Experience, Skills, Attributes, and Qualifications of the Fund's Trustees. The Governance and Nominating Committee has adopted a statement of policy that describes the experience, qualifications, attributes, and skills that are necessary and desirable for potential Independent Trustee candidates (Statement of Policy). The Board believes that each Trustee satisfied at the time he or she was initially elected or appointed a Trustee, and continues to satisfy, the standards contemplated by the Statement of Policy. The Governance and Nominating Committee also engages professional search firms to help identify potential Independent Trustee candidates who have the experience, qualifications, attributes, and skills consistent with the Statement of Policy. From time to time, additional criteria based on the composition and skills of the current Independent Trustees, as well as experience or skills that may be appropriate in light of future changes to board composition, business conditions, and regulatory or other developments, have also been considered by the professional search firms and the Governance and Nominating Committee. In addition, the Board takes into account the Trustees' commitment and participation in Board and committee meetings, as well as their leadership of standing and ad hoc committees throughout their tenure.
In determining that a particular Trustee was and continues to be qualified to serve as a Trustee, the Board has considered a variety of criteria, none of which, in isolation, was controlling. The Board believes that, collectively, the Trustees have balanced and diverse experience, qualifications, attributes, and skills, which allow the Board to operate effectively in governing the fund and protecting the interests of shareholders. Information about the specific experience, skills, attributes, and qualifications of each Trustee, which in each case led to the Board's conclusion that the Trustee should serve (or continue to serve) as a trustee of the fund, is provided below.
Annual Report
Board Structure and Oversight Function. James C. Curvey is an interested person (as defined in the 1940 Act) and currently serves as Chairman. The Trustees have determined that an interested Chairman is appropriate and benefits shareholders because an interested Chairman has a personal and professional stake in the quality and continuity of services provided to the fund. Independent Trustees exercise their informed business judgment to appoint an individual of their choosing to serve as Chairman, regardless of whether the Trustee happens to be independent or a member of management. The Independent Trustees have determined that they can act independently and effectively without having an Independent Trustee serve as Chairman and that a key structural component for assuring that they are in a position to do so is for the Independent Trustees to constitute a substantial majority for the Board. The Independent Trustees also regularly meet in executive session. Ned C. Lautenbach serves as Chairman of the Independent Trustees and as such (i) acts as a liaison between the Independent Trustees and management with respect to matters important to the Independent Trustees and (ii) with management prepares agendas for Board meetings.
Fidelity funds are overseen by different Boards of Trustees. The fund's Board oversees Fidelity's equity and high income funds and another Board oversees Fidelity's investment-grade bond, money market, and asset allocation funds. The asset allocation funds may invest in Fidelity funds overseen by the fund's Board. The use of separate Boards, each with its own committee structure, allows the Trustees of each group of Fidelity funds to focus on the unique issues of the funds they oversee, including common research, investment, and operational issues. On occasion, the separate Boards establish joint committees to address issues of overlapping consequences for the Fidelity funds overseen by each Board.
The Trustees operate using a system of committees to facilitate the timely and efficient consideration of all matters of importance to the Trustees, the fund, and fund shareholders and to facilitate compliance with legal and regulatory requirements and oversight of the fund's activities and associated risks. The Board, acting through its committees, has charged FMR and its affiliates with (i) identifying events or circumstances the occurrence of which could have demonstrably adverse effects on the fund's business and/or reputation; (ii) implementing processes and controls to lessen the possibility that such events or circumstances occur or to mitigate the effects of such events or circumstances if they do occur; and (iii) creating and maintaining a system designed to evaluate continuously business and market conditions in order to facilitate the identification and implementation processes described in (i) and (ii) above. Because the day-to-day operations and activities of the fund are carried out by or through FMR, its affiliates and other service providers, the fund's exposure to risks is mitigated but not eliminated by the processes overseen by the Trustees. While each of the Board's committees has responsibility for overseeing different aspects of the fund's activities, oversight is exercised primarily through the Operations, Audit, and Compliance Committees. In addition, the Independent Trustees have worked with FMR to enhance the Board's oversight of investment and financial risks, legal and regulatory risks, technology risks, and operational risks, including the development of additional risk reporting to the Board. For example, a working group comprised of Independent Trustees and FMR has worked and continues to work to review the Fidelity funds' valuation-related activities, reporting and risk management. Appropriate personnel, including but not limited to the fund's Chief Compliance Officer (CCO), FMR's internal auditor, the independent accountants, the fund's Treasurer and portfolio management personnel, make periodic reports to the Board's committees, as appropriate, including an annual review of FMR's risk management program for the Fidelity funds. The responsibilities of each standing committee, including their oversight responsibilities, are described further under "Standing Committees of the Fund's Trustees."
Annual Report
Trustees and Officers - continued
The fund's Statements of Additional Information (SAI) includes more information about the Trustees. To request a free copy, call Fidelity at 1-800-835-5092.
Interested Trustees*:
Correspondence intended for each Trustee who is an interested person may be sent to Fidelity Investments, 245 Summer Street, Boston, Massachusetts 02210.
Name, Year of Birth; Principal Occupations and Other Relevant Experience+ |
James C. Curvey (1935) |
Year of Election or Appointment: 2007 Trustee Chairman of the Board of Trustees |
| Mr. Curvey also serves as Trustee of other Fidelity funds. Mr. Curvey is a Director of Fidelity Research & Analysis Co. (2009-present), and Vice Chairman (2007-present) and Director of FMR LLC. In addition, Mr. Curvey serves as an Overseer for the Boston Symphony Orchestra and a member of the Trustees of Villanova University. Previously, Mr. Curvey served as a Director of Fidelity Investments Money Management, Inc. (2009-2014), a Director of FMR (2007-2014), a Director of FMR Co., Inc. (2007-2014) and was the Vice Chairman (2006-2007) and Director (2000-2007) of FMR Corp. |
Charles S. Morrison (1960) |
Year of Election or Appointment: 2014 Trustee |
| Mr. Morrison also serves as Trustee of other funds. He serves as President, Asset Management (2014-present) and is an employee of Fidelity Investments. Previously, Mr. Morrison served as Vice President of Fidelity's Fixed Income and Asset Allocation Funds (2012-2014), President, Fixed Income (2011-2014), Vice President of Fidelity's Money Market Funds (2005-2009), President, Money Market Group Leader of FMR (2009), and Senior Vice President, Money Market Group of FMR (2004-2009). Mr. Morrison also served as Vice President of Fidelity's Bond Funds (2002-2005), certain Balanced Funds (2002-2005), and certain Asset Allocation Funds (2002-2007), and as Senior Vice President (2002-2005) of Fidelity's Bond Division. |
* Trustees have been determined to be "Interested Trustees" by virtue of, among other things, their affiliation with the trust or various entities under common control with FMR.
+ The information above includes each Trustee's principal occupation during the last five years and other information relating to the experience, attributes, and skills relevant to each Trustee's qualifications to serve as a Trustee, which led to the conclusion that each Trustee should serve as a Trustee for the fund.
Annual Report
Trustees and Officers - continued
Independent Trustees:
Correspondence intended for each Independent Trustee (that is, the Trustees other than the Interested Trustees) may be sent to Fidelity Investments, P.O. Box 55235, Boston, Massachusetts 02205-5235.
Name, Year of Birth; Principal Occupations and Other Relevant Experience+ |
Dennis J. Dirks (1948) |
Year of Election or Appointment: 2005 Trustee |
| Mr. Dirks also serves as Trustee of other Fidelity funds. Prior to his retirement in May 2003, Mr. Dirks was Chief Operating Officer and a member of the Board of The Depository Trust & Clearing Corporation (DTCC). He also served as President, Chief Operating Officer, and Board member of The Depository Trust Company (DTC) and President and Board member of the National Securities Clearing Corporation (NSCC). In addition, Mr. Dirks served as Chief Executive Officer and Board member of the Government Securities Clearing Corporation, Chief Executive Officer and Board member of the Mortgage-Backed Securities Clearing Corporation, as a Trustee and a member of the Finance Committee of Manhattan College (2005-2008), and as a Trustee and a member of the Finance Committee of AHRC of Nassau County (2006-2008). Mr. Dirks is a member of the Independent Directors Council (IDC) Governing Council (2010-present) and Board of Directors for The Brookville Center for Children's Services, Inc. (2009-present). |
Alan J. Lacy (1953) |
Year of Election or Appointment: 2008 Trustee |
| Mr. Lacy also serves as Trustee of other Fidelity funds. Mr. Lacy serves as Senior Adviser (2007-present) of Oak Hill Capital Partners, L.P. (private equity). Mr. Lacy also served as Chief Executive Officer (2000-2005) and Vice Chairman (2005-2006) of Sears Holdings Corporation and Sears, Roebuck and Co. (retail). In addition, Mr. Lacy serves as a member of the Board of Directors of Dave & Buster's Entertainment, Inc. (restaurant and entertainment complexes, 2010-present), Earth Fare, Inc. (retail grocery, 2012-present), The Hillman Companies, Inc. (hardware wholesalers, 2010-present), and Bristol-Myers Squibb Company (global pharmaceuticals, 2008-present). Mr. Lacy is a member of the Board of Trustees of The National Parks Conservation Association (2006-present). Previously, Mr. Lacy served as Chairman of the Board of Trustees of the National Parks Conservation Association (2008-2011) and as a member of the Board of Directors for the Western Union Company (global money transfer, 2006-2011). |
Ned C. Lautenbach (1944) |
Year of Election or Appointment: 2000 Trustee Chairman of the Independent Trustees |
| Mr. Lautenbach also serves as Trustee of other Fidelity funds. Mr. Lautenbach currently serves as the Lead Director of the Eaton Corporation Board of Directors (diversified industrial, 1997-present). Mr. Lautenbach is Chairman of the Board of Directors of the Philharmonic Center for the Arts in Naples, Florida (2012-present) and a member of the Council on Foreign Relations (1994-present). Previously, Mr. Lautenbach was a Partner/Advisory Partner at Clayton, Dubilier & Rice, LLC (private equity investment, 1998-2010), as well as a Director of Sony Corporation (2006-2007). |
Joseph Mauriello (1944) |
Year of Election or Appointment: 2008 Trustee |
| Mr. Mauriello also serves as Trustee of other Fidelity funds. Prior to his retirement in January 2006, Mr. Mauriello served in numerous senior management positions including Deputy Chairman and Chief Operating Officer (2004-2005), and Vice Chairman of Financial Services (2002-2004) of KPMG LLP US (professional services, 1965-2005). Mr. Mauriello currently serves as a member of the Board of Directors of XL Group plc. (global insurance and re-insurance, 2006-present). Previously, Mr. Mauriello served as a Director of the Hamilton Funds of the Bank of New York (2006-2007) and of Arcadia Resources Inc. (health care services and products, 2007-2012). |
Robert W. Selander (1950) |
Year of Election or Appointment: 2011 Trustee |
| Mr. Selander also serves as Trustee of other Fidelity funds. Previously, Mr. Selander served as a Member of the Advisory Board of other Fidelity funds (2011), and Executive Vice Chairman (2010), Chief Executive Officer (2009-2010), and President and Chief Executive Officer (1997-2009) of Mastercard, Inc. |
Cornelia M. Small (1944) |
Year of Election or Appointment: 2005 Trustee |
| Ms. Small also serves as Trustee of other Fidelity funds. Ms. Small is a member of the Board of Directors (2009-present) and Chair of the Investment Committee (2010-present) of the Teagle Foundation. Ms. Small also serves on the Investment Committee of the Berkshire Taconic Community Foundation (2008-present). Previously, Ms. Small served as Chairperson (2002-2008) and a member of the Investment Committee and Chairperson (2008-2012) and a member of the Board of Trustees of Smith College. In addition, Ms. Small served as Chief Investment Officer, Director of Global Equity Investments, and a member of the Board of Directors of Scudder, Stevens & Clark and Scudder Kemper Investments. |
William S. Stavropoulos (1939) |
Year of Election or Appointment: 2002 Trustee Vice Chairman of the Independent Trustees |
| Mr. Stavropoulos also serves as Trustee of other Fidelity funds. Mr. Stavropoulos serves as President and Founder of the Michigan Baseball Foundation, the Great Lakes Loons (2007-present). Mr. Stavropoulos is Chairman Emeritus of the Board of Directors of The Dow Chemical Company, where he previously served in numerous senior management positions, including President, CEO (1995-2000; 2002-2004), Chairman of the Executive Committee (2000-2006), and as a member of the Board of Directors (1990-2006). Currently, Mr. Stavropoulos is Chairman of the Board of Directors of Univar Inc. (global distributor of commodity and specialty chemicals), a Director of Teradata Corporation (data warehousing and technology solutions), and Maersk Inc. (industrial conglomerate), and a member of the Advisory Board for Metalmark Capital LLC (private equity investment, 2005-present). Mr. Stavropoulos is an operating advisor to Clayton, Dubilier & Rice, LLC (private equity investment). In addition, Mr. Stavropoulos is a member of the University of Notre Dame Advisory Council for the College of Science, a Trustee of the Rollin L. Gerstacker Foundation, and a Director of the Naples Philharmonic Center for the Arts. Previously, Mr. Stavropoulos served as a Director of Chemical Financial Corporation (bank holding company, 1993-2012) and Tyco International, Ltd. (multinational manufacturing and services, 2007-2012). |
David M. Thomas (1949) |
Year of Election or Appointment: 2008 Trustee |
| Mr. Thomas also serves as Trustee of other Fidelity funds. Mr. Thomas serves as Non-Executive Chairman of the Board of Directors of Fortune Brands Home and Security (home and security products, 2011-present), and as a member of the Board of Directors of Interpublic Group of Companies, Inc. (marketing communication, 2004-present). Previously, Mr. Thomas served as Executive Chairman (2005-2006) and Chairman and Chief Executive Officer (2000-2005) of IMS Health, Inc. (pharmaceutical and healthcare information solutions), and a Director of Fortune Brands, Inc. (consumer products, 2000-2011). |
+ The information above includes each Trustee's principal occupation during the last five years and other information relating to the experience, attributes, and skills relevant to each Trustee's qualifications to serve as a Trustee, which led to the conclusion that each Trustee should serve as a Trustee for the fund.
Advisory Board Member and Officers:
Correspondence intended for each officer and Peter S. Lynch may be sent to Fidelity Investments, 245 Summer Street, Boston, Massachusetts 02210. Officers appear below in alphabetical order.
Name, Year of Birth; Principal Occupation |
Peter S. Lynch (1944) |
Year of Election or Appointment: 2003 Member of the Advisory Board |
| Mr. Lynch also serves as Member of the Advisory Board of other Fidelity funds. Mr. Lynch is Vice Chairman and a Director of FMR and FMR Co., Inc. In addition, Mr. Lynch serves as a Trustee of Boston College and as the Chairman of the Inner-City Scholarship Fund. Previously, Mr. Lynch served on the Special Olympics International Board of Directors (1997-2006). |
Elizabeth Paige Baumann (1968) |
Year of Election or Appointment: 2012 Anti-Money Laundering (AML) Officer |
| Ms. Baumann also serves as AML Officer of other funds. She is Chief AML Officer of FMR LLC (2012-present) and is an employee of Fidelity Investments. Previously, Ms. Baumann served as Vice President and Deputy Anti-Money Laundering Officer (2007-2012). |
William C. Coffey (1969) |
Year of Election or Appointment: 2009 Assistant Secretary |
| Mr. Coffey also serves as Assistant Secretary of other funds. He is Senior Vice President and Deputy General Counsel of FMR LLC (2010-present), and is an employee of Fidelity Investments. Previously, Mr. Coffey served as Vice President and Associate General Counsel of FMR LLC (2005-2009). |
Jonathan Davis (1968) |
Year of Election or Appointment: 2010 Assistant Treasurer |
| Mr. Davis also serves as Assistant Treasurer of other funds. Mr. Davis is an employee of Fidelity Investments. Previously, Mr. Davis served as Vice President and Associate General Counsel of FMR LLC (2003-2010). |
Adrien E. Deberghes (1967) |
Year of Election or Appointment: 2008 Deputy Treasurer |
| Mr. Deberghes also serves as an officer of other funds. He is an employee of Fidelity Investments (2008-present). Prior to joining Fidelity Investments, Mr. Deberghes was Senior Vice President of Mutual Fund Administration at State Street Corporation (2007-2008), Senior Director of Mutual Fund Administration at Investors Bank & Trust (2005-2007), and Director of Finance for Dunkin' Brands (2000-2005). |
Stephanie J. Dorsey (1969) |
Year of Election or Appointment: 2010 Assistant Treasurer |
| Ms. Dorsey also serves as an officer of other funds. She is an employee of Fidelity Investments (2008-present) and has served in other fund officer roles. Prior to joining Fidelity Investments, Ms. Dorsey served as Treasurer (2004-2008) of the JPMorgan Mutual Funds and Vice President (2004-2008) of JPMorgan Chase Bank. |
Howard J. Galligan III (1966) |
Year of Election or Appointment: 2014 Chief Financial Officer |
| Mr. Galligan also serves as Chief Financial Officer of other funds. Mr. Galligan serves as President of Fidelity Pricing and Cash Management Services (FPCMS) (2014-present) and as a Director of Strategic Advisers, Inc. (2008-present). Previously, Mr. Galligan served as Chief Administrative Officer of Asset Management (2011-2014) and Chief Operating Officer and Senior Vice President of Investment Support for Strategic Advisers, Inc. (2003-2011). |
Scott C. Goebel (1968) |
Year of Election or Appointment: 2008 Secretary and Chief Legal Officer (CLO) |
| Mr. Goebel serves as Secretary and CLO of other funds. Mr. Goebel also serves as Secretary of Fidelity SelectCo, LLC (2013-present), Fidelity Investments Money Management, Inc. (FIMM) (2010-present) and Fidelity Research and Analysis Company (FRAC) (2010-present); General Counsel, Secretary, and Senior Vice President of FMR (2008-present) and FMR Co., Inc. (2008-present); Chief Legal Officer of Fidelity Management & Research (Hong Kong) Limited (2008-present); and Assistant Secretary of Fidelity Management & Research (Japan) Inc. (2008-present) and Fidelity Management & Research (U.K.) Inc. (2008-present). Previously, Mr. Goebel served as Secretary and CLO of other Fidelity funds (2008-2013), Assistant Secretary of FIMM (2008-2010), FRAC (2008-2010), and certain funds (2007-2008); and as Vice President and Secretary of Fidelity Distributors Corporation (FDC) (2005-2007). Mr. Goebel has been employed by FMR LLC or an affiliate since 2001. |
Brian B. Hogan (1964) |
Year of Election or Appointment: 2009 Vice President |
| Mr. Hogan also serves as Trustee or Vice President of other funds. Mr. Hogan serves as President of FMR's Equity Division (2009-present). Previously, Mr. Hogan served as Senior Vice President, Equity Research of FMR (2006-2009) and as a portfolio manager. |
Chris Maher (1972) |
Year of Election or Appointment: 2013 Assistant Treasurer |
| Mr. Maher serves as Assistant Treasurer of other funds. Mr. Maher is Vice President of Valuation Oversight and is an employee of Fidelity Investments. Previously, Mr. Maher served as Vice President of Asset Management Compliance (2013), Vice President of FMR's Program Management Group (2010-2013), and Vice President of Valuation Oversight (2008-2010). |
Melissa M. Reilly (1971) |
Year of Election or Appointment: 2014 Vice President of certain Equity Funds |
| Ms. Reilly also serves as Vice President of other funds. Ms. Reilly is an employee of Fidelity Investments (2004-present). |
Kenneth B. Robins (1969) |
Year of Election or Appointment: 2008 President and Treasurer |
| Mr. Robins also serves as an officer of other funds. Mr. Robins serves as Executive Vice President of Fidelity Investments Money Management, Inc. (FIMM) (2013-present) and is an employee of Fidelity Investments (2004-present). Previously, Mr. Robins served in other fund officer roles. |
Stephen Sadoski (1971) |
Year of Election or Appointment: 2012 Deputy Treasurer |
| Mr. Sadoski also serves as Deputy Treasurer of other funds. He is an employee of Fidelity Investments (2012-present) and has served in another fund officer role. Prior to joining Fidelity Investments, Mr. Sadoski served as an assistant chief accountant in the Division of Investment Management of the Securities and Exchange Commission (SEC) (2009-2012) and as a senior manager at Deloitte & Touche LLP (1997-2009). |
Stacie M. Smith (1974) |
Year of Election or Appointment: 2013 Deputy Treasurer |
| Ms. Smith also serves as an officer of other funds. She is an employee of Fidelity Investments (2009-present) and has served in other fund officer roles. Prior to joining Fidelity Investments, Ms. Smith served as Senior Audit Manager of Ernst & Young LLP (1996-2009). |
Renee Stagnone (1975) |
Year of Election or Appointment: 2013 Deputy Treasurer |
| Ms. Stagnone also serves as Deputy Treasurer of other funds. Ms. Stagnone is an employee of Fidelity Investments. |
Linda J. Wondrack (1964) |
Year of Election or Appointment: 2014 Chief Compliance Officer |
| Ms. Wondrack also serves as Chief Compliance Officer of other funds. Ms. Wondrack is Executive Vice President and head of the Ethics Office and Asset Management Compliance for Fidelity Investments (2012-present). Ms. Wondrack also serves as Chief Compliance Officer of Fidelity SelectCo, LLC (2014-present); Chief Compliance Officer of Impresa Management LLC (2013-present); and Chief Compliance Officer of FMR Co., Inc., Fidelity Investments Money Management, Inc., Fidelity Management & Research (Japan) Inc., Fidelity Management & Research (U.K.) Inc., Fidelity Management & Research (Hong Kong), Fidelity Management & Research Company, Pyramis Global Advisors, LLC, and Strategic Advisers, Inc., Ballyrock Investment Advisors LLC, and Northern Neck Investors LLC (2012-present). Previously, Ms. Wondrack served as Senior Vice President and Chief Compliance Officer for Columbia Management Investment Advisers, LLC (2005-2012); Chief Compliance Officer for certain funds within the Columbia Family of Funds (2007-2012); and Senior Vice President of Compliance Risk Management at Bank of America (2005-2010). |
Joseph F. Zambello (1957) |
Year of Election or Appointment: 2011 Deputy Treasurer |
| Mr. Zambello also serves as Deputy Treasurer of other funds. Mr. Zambello is an employee of Fidelity Investments. Previously, Mr. Zambello served as Vice President of FMR's Program Management Group (2009-2011) and Vice President of the Transfer Agent Oversight Group (2005-2009). |
Annual Report
The Board of Trustees of Fidelity Blue Chip Growth Fund voted to pay to shareholders of record at the opening of business on record date, the following distributions per share derived from capital gains realized from sales of portfolio securities; and dividends derived from net investment income:
| Pay Date | Record Date | Dividends | Capital Gains |
Class K | 09/08/14 | 09/05/14 | $0.107 | $3.421 |
The fund hereby designates as a capital gain dividend with respect to the taxable year ended July 31, 2014, $1,099,559,018, or, if subsequently determined to be different, the net capital gain of such year.
Class K designates 100% of the dividends distributed during the fiscal year as qualifying for the dividends-received deduction for corporate shareholders.
Class K designates 100% of the dividends distributed during the fiscal year as amounts which can be taken into account as a dividend for the purposes of the maximum rate under section 1(h)(11) of the Internal Revenue Code.
The fund will notify shareholders in January 2015 of amounts for use in preparing 2014 income tax returns.
Annual Report
Board Approval of Investment Advisory Contracts and Management Fees
Fidelity Blue Chip Growth Fund
Each year, the Board of Trustees, including the Independent Trustees (together, the Board), votes on the renewal of the management contract with Fidelity Management & Research Company (FMR) and the sub-advisory agreements (together, the Advisory Contracts) for the fund. The Board, assisted by the advice of fund counsel and Independent Trustees' counsel, requests and considers a broad range of information relevant to the renewal of the Advisory Contracts throughout the year.
The Board meets regularly and, at each of its meetings, covers an extensive agenda of topics and materials and considers factors that are relevant to its annual consideration of the renewal of the fund's Advisory Contracts, including the services and support provided to the fund and its shareholders. The Board has established various standing committees (Committees), each composed of and chaired by Independent Trustees with varying backgrounds, to which the Board has assigned specific subject matter responsibilities in order to enhance effective decision-making by the Board. The Board, acting directly and through its Committees, requests and receives information concerning the annual consideration of the renewal of the fund's Advisory Contracts. The Board also meets as needed to consider matters specifically related to the Board's annual consideration of the renewal of the Advisory Contracts. Members of the Board may also meet with trustees of other Fidelity funds through ad hoc joint committees to discuss certain matters relevant to the Fidelity funds.
At its July 2014 meeting, the Board, including the Independent Trustees, unanimously determined to renew the fund's Advisory Contracts. In reaching its determination, the Board considered all factors it believed relevant, including (i) the nature, extent, and quality of the services to be provided to the fund and its shareholders (including the investment performance of the fund); (ii) the competitiveness of the fund's management fee and total expense ratio relative to peer funds; (iii) the total costs of the services to be provided by and the profits to be realized by Fidelity from its relationship with the fund; (iv) the extent to which economies of scale exist and would be realized as the fund grows; and (v) whether fee levels reflect these economies of scale, if any, for the benefit of fund shareholders. In connection with separate internal corporate reorganizations involving Fidelity Management & Research (U.K.) Inc. (FMR U.K.) and Fidelity Management & Research (Japan) Inc. (FMR Japan), the Board approved certain non-material amendments to the fund's sub-advisory agreements with FMR U.K. and FMR Japan to reflect that, after these reorganizations, FMR Investment Management (UK) Limited and Fidelity Management & Research (Japan) Limited will carry on the business of FMR U.K. and FMR Japan, respectively. The Board noted that no changes to the portfolio managers or to the foreign research or investment advisory services provided to the fund were expected in connection with either reorganization and that the same personnel and resources would continue to be available to the fund at the new entities.
Annual Report
Board Approval of Investment Advisory Contracts and
Management Fees - continued
In considering whether to renew the Advisory Contracts for the fund, the Board reached a determination, with the assistance of fund counsel and Independent Trustees' counsel and through the exercise of its business judgment, that the renewal of the Advisory Contracts was in the best interests of the fund and its shareholders and that the compensation payable under the Advisory Contracts was fair and reasonable. The Board's decision to renew the Advisory Contracts was not based on any single factor, but rather was based on a comprehensive consideration of all the information provided to the Board at its meetings throughout the year. The Board, in reaching its determination to renew the Advisory Contracts, was aware that shareholders of the fund have a broad range of investment choices available to them, including a wide choice among funds offered by Fidelity's competitors, and that the fund's shareholders, who have the opportunity to review and weigh the disclosure provided by the fund in its prospectus and other public disclosures, have chosen to invest in this fund, which is part of the Fidelity family of funds.
Nature, Extent, and Quality of Services Provided. The Board considered Fidelity's staffing as it relates to the fund, including the backgrounds of investment personnel of FMR and the sub-advisers (together, the Investment Advisers), and also considered the fund's investment objective, strategies, and related investment philosophy. The Independent Trustees also had discussions with senior management of Fidelity's investment operations and investment groups. The Board considered the structure of the portfolio manager compensation program and whether this structure provides appropriate incentives to act in the best interests of the fund. Additionally, the Board considered the portfolio managers' investments, if any, in the funds that they manage.
Resources Dedicated to Investment Management and Support Services. The Board and the Fund Oversight and Research Committees reviewed the general qualifications and capabilities of Fidelity's investment staff, including its size, education, experience, and resources, as well as Fidelity's approach to recruiting, training, managing, and compensating investment personnel. The Board noted that Fidelity has continued to increase the resources devoted to non-U.S. offices, including expansion of Fidelity's global investment organization. The Board also noted that Fidelity's analysts have extensive resources, tools and capabilities that allow them to conduct sophisticated quantitative and fundamental analysis, as well as credit analysis of issuers, counterparties and guarantors. Further, the Board believes that Fidelity's investment professionals have sufficient access to global information and data so as to provide competitive investment results over time, and that those professionals also have access to sophisticated tools that permit them to assess portfolio construction and risk and performance attribution characteristics continuously, as well as to transmit new information and research conclusions rapidly around the world. Additionally, in its deliberations, the Board considered Fidelity's trading and risk management capabilities and resources and global compliance infrastructure, which are an integral part of the investment management process.
Annual Report
Shareholder and Administrative Services. The Board considered (i) the nature, extent, quality, and cost of advisory, administrative, and shareholder services performed by the Investment Advisers and their affiliates under the Advisory Contracts and under separate agreements covering transfer agency, pricing and bookkeeping, and securities lending services for the fund; (ii) the nature and extent of the supervision of third party service providers, principally custodians and subcustodians; and (iii) the resources devoted to, and the record of compliance with, the fund's compliance policies and procedures. The Board also reviewed the allocation of fund brokerage, including allocations to brokers affiliated with the Investment Advisers, the use of brokerage commissions to pay fund expenses, and the use of "soft" commission dollars to pay for research services.
The Board noted that the growth of fund assets over time across the complex allows Fidelity to reinvest in the development of services designed to enhance the value or convenience of the Fidelity funds as investment vehicles. These services include 24-hour access to account information and market information through telephone representatives and over the Internet, investor education materials and asset allocation tools, and the expanded availability of Fidelity Investor Centers.
In 2014, the Board formed an ad hoc Committee on Transfer Agency Fees to review the variety of transfer agency fee structures throughout the industry and Fidelity's competitive positioning with respect to industry participants.
Investment in a Large Fund Family. The Board considered the benefits to shareholders of investing in a Fidelity fund, including the benefits of investing in a fund that is part of a large family of funds offering a variety of investment disciplines and providing a large variety of mutual fund investor services. The Board noted that Fidelity had taken, or had made recommendations that resulted in the Fidelity funds taking, a number of actions over the previous year that benefited particular funds, including (i) continuing to dedicate additional resources to investment research and to the support of the senior management team that oversees asset management; (ii) persisting in efforts to enhance Fidelity's global research capabilities; (iii) launching new funds and making other enhancements to meet client needs for income-oriented solutions; (iv) reducing fund expenses for certain index funds; (v) continuing to launch dedicated lower cost underlying funds to meet portfolio construction needs related to expanding underlying fund options for Fidelity funds of funds, specifically for the Freedom Fund product lines; (vi) rationalizing product lines and gaining increased efficiencies through fund mergers; (vii) launching sector-based exchange-traded funds and establishing a new Fidelity adviser to manage sector-based funds and products; (viii) continuing to develop and implement technology to improve security and increase efficiency; (ix) modifying the eligibility criteria for certain share classes to increase their marketability to a portion of the defined contribution plan market; (x) waiving redemption fees for certain qualified fund-of-fund and wrap programs and certain retirement plan transactions; and (xi) launching new Institutional Class shares of certain money market funds to attract and retain assets and to fill a gap in the money market fund lineup.
Annual Report
Board Approval of Investment Advisory Contracts and
Management Fees - continued
Investment Performance. The Board considered whether the fund has operated in accordance with its investment objective, as well as its record of compliance with its investment restrictions and its performance history.
The Board took into account discussions with the Investment Advisers about fund investment performance that occur at Board meetings throughout the year. In this regard the Board noted that as part of regularly scheduled fund reviews and other reports to the Board on fund performance, the Board periodically considers annualized return information for the fund, for different time periods, measured against a securities market index ("benchmark index") and a peer group of funds with similar objectives ("peer group"). In its evaluation of fund investment performance, the Board gave particular attention to information indicating changes in performance of certain Fidelity funds for specific time periods and the Investment Advisers' explanations for any overperformance or underperformance.
In addition to reviewing absolute and relative fund performance, the Independent Trustees periodically consider the appropriateness of fund performance metrics in evaluating the results achieved. In general, the Independent Trustees believe that fund performance should be evaluated based on net performance (after fees and expenses) of both the highest performing and lowest performing classes, where applicable, compared to appropriate benchmark indices, over appropriate time periods which may include full market cycles, and compared to peer groups, as applicable, over the same periods, taking into account relevant factors including the following: general market conditions; issuer-specific information; tactical opportunities for investment; and fund cash flows and other factors.
The Independent Trustees recognize that shareholders evaluate performance on a net basis over their own holding periods, for which one-, three-, and five-year periods are often used as a proxy. For this reason, the performance information reviewed by the Board also included net cumulative calendar year total return information for the fund and an appropriate benchmark index and peer group for the most recent one-, three-, and five-year periods, as shown below. Returns are shown compared to the 25th percentile (top of box, 75% beaten) and 75th percentile (bottom of box, 25% beaten) of the peer universe.
Annual Report
Fidelity Blue Chip Growth Fund
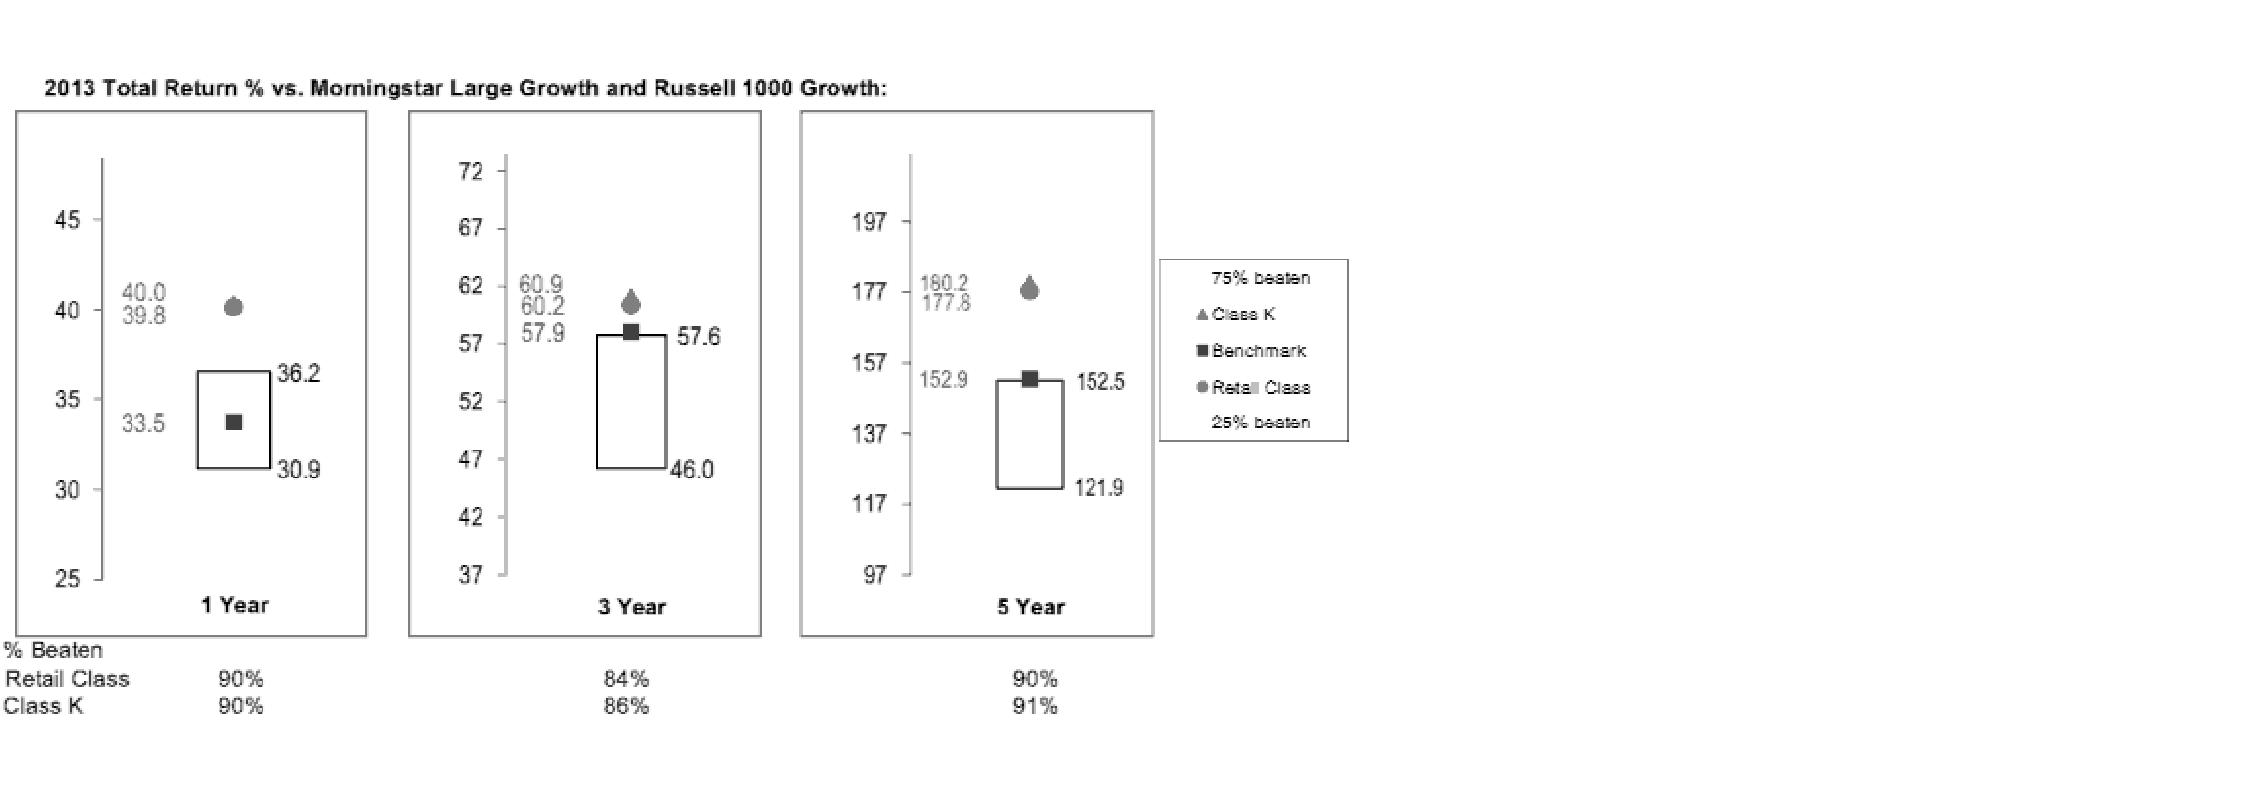
The Board also considered that the fund's management fee is subject to upward or downward adjustment depending upon whether, and to what extent, the fund's investment performance for the performance period exceeds, or is exceeded by, a securities index, thus leading to a performance adjustment for the same period. The Board noted that the performance adjustment provides FMR with a strong economic incentive to seek to achieve superior performance for the fund's shareholders and helps to more closely align the interests of FMR and the fund's shareholders.
Based on its review, the Board concluded that the nature, extent, and quality of services provided to the fund under the Advisory Contracts should benefit the fund's shareholders.
Competitiveness of Management Fee and Total Expense Ratio. The Board considered the fund's management fee and total expense ratio compared to "mapped groups" of competitive funds and classes. Fidelity creates "mapped groups" by combining similar Lipper investment objective categories that have comparable investment mandates. Combining Lipper investment objective categories aids the Board's management fee and total expense ratio comparisons by broadening the competitive group used for comparison and by reducing the number of universes to which various Fidelity funds are compared.
Management Fee. The Board considered two proprietary management fee comparisons for the 12-month periods shown in the chart below. The group of Lipper funds used by the Board for management fee comparisons is referred to below as the "Total Mapped Group." The Total Mapped Group comparison focuses on a fund's standing in terms of gross management fees before expense reimbursements or caps, and without giving effect to the fund's performance adjustment, relative to the total universe of funds with comparable investment mandates, regardless of whether their management fee structures also are comparable. Funds with comparable investment mandates offer exposure to similar types of securities. Funds with comparable management fee structures have similar management fee contractual arrangements (e.g., flat rate charged for advisory services, all-inclusive fee rate, etc.). "TMG %" represents the percentage of funds in the Total Mapped Group that had management fees that were lower than the fund's. For example, a hypothetical TMG % of 20% would mean that 80% of the funds in the Total Mapped Group had higher, and 20% had lower, management fees than the fund. The fund's actual TMG %s are in the chart below. The "Asset-Size Peer Group" (ASPG) comparison focuses on a fund's standing relative to a subset of non-Fidelity funds within the Total Mapped Group that are similar in size and management fee structure. For example, if a fund is in the first quartile of the ASPG, the fund's management fee ranks in the least expensive or lowest 25% of funds in the ASPG. The ASPG represents at least 15% of the funds in the Total Mapped Group with comparable asset size and management fee structures, subject to a minimum of 50 funds (or all funds in the Total Mapped Group if fewer than 50). Additional information, such as the ASPG quartile in which the fund's management fee rate ranked and the impact of the fund's performance adjustment, is also included in the chart and considered by the Board.
Annual Report
Board Approval of Investment Advisory Contracts and
Management Fees - continued
Fidelity Blue Chip Growth Fund

The Board noted that the fund's management fee rate ranked below the median of its Total Mapped Group and below the median of its ASPG for 2013. The Board also noted the effect of the fund's positive performance adjustment on the fund's management fee ranking.
Annual Report
Furthermore, the Board considered that shareholders approved a prospective change in the index used to calculate the fund's performance adjustment beginning June 1, 2006. The Board also considered that, because the performance adjustment is based on a rolling 36- month measurement period, during a transition period the fund's performance is compared to a blended index return that reflects the performance of the former index for the portion of the measurement period prior to June 1, 2006 and the performance of the current index for the remainder of the measurement period. The Board noted that the fund's performance adjustment for 2009 shown in the chart above reflects the effect of using the blended index return to calculate the fund's performance adjustment.
The Board also noted that, in August 2013, the ad hoc Committee on Management Fees was formed to conduct an in-depth review of the management fee rates of Fidelity's active equity mutual funds. The Committee focused on the following areas: (i) standard fee structures; (ii) research consumption and trading evolution; (iii) management fee competitiveness/profitability by category; and (iv) factors that drive institutional pricing.
Based on its review, the Board concluded that the fund's management fee is fair and reasonable in light of the services that the fund receives and the other factors considered.
Total Expense Ratio. In its review of each class's total expense ratio, the Board considered the fund's management fee as well as other fund or class expenses, as applicable, such as transfer agent fees, pricing and bookkeeping fees, and custodial, legal, and audit fees. The Board also noted the effects of any waivers and reimbursements on fees and expenses, as well as the impact of the fund's performance adjustment. As part of its review, the Board also considered the current and historical total expense ratios of each class of the fund compared to competitive fund median expenses. Each class of the fund is compared to those funds and classes in the Total Mapped Group (used by the Board for management fee comparisons) that have a similar sales load structure.
The Board noted that the total expense ratio of each class ranked below its competitive median for 2013.
Fees Charged to Other Fidelity Clients. The Board also considered Fidelity fee structures and other information with respect to clients of Fidelity, such as other funds advised or subadvised by Fidelity, pension plan clients, and other institutional clients. The Board noted the findings of the 2013 ad hoc joint committee (created with the board of other Fidelity funds), which reviewed and compared Fidelity's institutional investment advisory business with its business of providing services to the Fidelity funds, including the differences in services provided, fees charged, and costs incurred, as well as competition in their respective marketplaces.
Annual Report
Board Approval of Investment Advisory Contracts and
Management Fees - continued
Based on its review of total expense ratios and fees charged to other Fidelity clients, the Board concluded that the total expense ratio of each class of the fund was reasonable in light of the services that the fund and its shareholders receive and the other factors considered.
Costs of the Services and Profitability. The Board considered the revenues earned and the expenses incurred by Fidelity in conducting the business of developing, marketing, distributing, managing, administering and servicing the fund and servicing the fund's shareholders. The Board also considered the level of Fidelity's profits in respect of all the Fidelity funds.
On an annual basis, Fidelity presents to the Board Fidelity's profitability for the fund. Fidelity calculates the profitability for each fund, as well as aggregate profitability for groups of Fidelity funds and all Fidelity funds, using a series of detailed revenue and cost allocation methodologies which originate with the books and records of Fidelity on which Fidelity's audited financial statements are based. The Audit Committee of the Board reviews any significant changes from the prior year's methodologies.
PricewaterhouseCoopers LLP (PwC), independent registered public accounting firm and auditor to Fidelity and certain Fidelity funds, has been engaged annually by the Board as part of the Board's assessment of Fidelity's profitability analysis. PwC's engagement includes the review and assessment of the methodologies used by Fidelity in determining the revenues and expenses attributable to Fidelity's mutual fund business, and completion of agreed-upon procedures in respect of the mathematical accuracy of fund profitability and its conformity to established allocation methodologies. After considering PwC's reports issued under the engagement and information provided by Fidelity, the Board concluded that while other allocation methods may also be reasonable, Fidelity's profitability methodologies are reasonable in all material respects.
The Board also reviewed Fidelity's non-fund businesses and fall-out benefits related to the mutual fund business as well as cases where Fidelity's affiliates may benefit from or be related to the fund's business.
The Board considered the costs of the services provided by and the profits realized by Fidelity in connection with the operation of the fund and was satisfied that the profitability was not excessive in the circumstances.
Economies of Scale. The Board considered whether there have been economies of scale in respect of the management of the Fidelity funds, whether the Fidelity funds (including the fund) have appropriately benefited from any such economies of scale, and whether there is potential for realization of any further economies of scale. The Board considered the extent to which the fund will benefit from economies of scale through increased services to the fund, through waivers or reimbursements, or through fee or expense ratio reductions. The Board also noted that in 2013, it and the boards of other Fidelity funds created an ad hoc committee (the Economies of Scale Committee) to analyze whether Fidelity attains economies of scale in respect of the management and servicing of the Fidelity funds, whether the Fidelity funds have appropriately benefited from such economies of scale, and whether there is potential for realization of any further economies of scale.
Annual Report
The Board recognized that the fund's management contract incorporates a "group fee" structure, which provides for lower group fee rates as total group assets increase, and for higher group fee rates as total group assets decrease (with "group assets" defined to include fund assets under FMR's management plus sector fund assets previously under FMR's management and currently managed by Fidelity SelectCo, LLC). FMR calculates the group fee rates based on a tiered asset "breakpoint" schedule that varies based on asset class. The Board considered that the group fee is designed to deliver the benefits of economies of scale to fund shareholders when total Fidelity fund assets increase, even if assets of any particular fund are unchanged or have declined, because some portion of Fidelity's costs are attributable to services provided to all Fidelity funds, and all funds benefit if those costs can be allocated among more assets. The Board concluded that, given the group fee structure, fund shareholders will benefit from lower management fees as group assets increase at the fund complex level, regardless of whether Fidelity achieves any such economies of scale.
The Board concluded, taking into account the analysis of the Economies of Scale Committee, that economies of scale, if any, are being appropriately shared between fund shareholders and Fidelity.
Additional Information Requested by the Board. In order to develop fully the factual basis for consideration of the Fidelity funds' Advisory Contracts, the Board requested and received additional information on certain topics, including: (i) fund performance trends and Fidelity's long-term strategies for certain funds; (ii) Fidelity's strategic marketing and product lineup goals; (iii) the methodology with respect to competitive fund data and peer group classifications; (iv) the arrangements with, and performance of, certain sub-advisers on behalf of the Fidelity funds, as well as certain proposed participating affiliate arrangements; (v) the realization of fall-out benefits in certain Fidelity business units; (vi) Fidelity's group fee structures, including the rationale for the individual fee rates of certain categories of funds and the definition of group assets; (vii) trends regarding industry use of performance fee structures and the performance adjustment methodologies applicable to the Fidelity funds; (viii) additional competitive analysis regarding the total expenses for certain classes; (ix) fund profitability methodology, including Fidelity's cost allocation methodology, and the impact of certain factors on fund profitability results; and (x) the process by which Fidelity determines sub-advisory fees for funds it advises.
Annual Report
Board Approval of Investment Advisory Contracts and
Management Fees - continued
Based on its evaluation of all of the conclusions noted above, and after considering all factors it believed relevant, the Board ultimately concluded that the advisory fee structures are fair and reasonable, and that the fund's Advisory Contracts should be renewed.
Annual Report
Investment Adviser
Fidelity Management & Research Company
Boston, MA
Investment Sub-Advisers
FMR Co., Inc.
Fidelity Management & Research
(U.K.) Inc.
Fidelity Management & Research
(Hong Kong) Limited
Fidelity Management & Research
(Japan) Inc.
General Distributor
Fidelity Distributors Corporation
Smithfield, RI
Transfer and Service Agents
Fidelity Investments Institutional
Operations Company, Inc.
Boston, MA
Fidelity Service Company, Inc.
Boston, MA
Custodian
Citibank, N.A.
New York, NY
(Fidelity Investment logo)(registered trademark)
Corporate Headquarters
245 Summer St., Boston, MA 02210
www.fidelity.com
BCF-K-UANN-0914
1.863112.105
Fidelity®
Blue Chip Value
Fund
Annual Report
July 31, 2014
(Fidelity Cover Art)
Contents
Performance | (Click Here) | How the fund has done over time. |
Management's Discussion of Fund Performance | (Click Here) | The Portfolio Manager's review of fund performance and strategy. |
Shareholder Expense Example | (Click Here) | An example of shareholder expenses. |
Investment Changes | (Click Here) | A summary of major shifts in the fund's investments over the past 6 months. |
Investments | (Click Here) | A complete list of the fund's investments with their market values. |
Financial Statements | (Click Here) | Statements of assets and liabilities, operations, and changes in net assets, as well as financial highlights. |
Notes | (Click Here) | Notes to the financial statements. |
Report of Independent Registered Public Accounting Firm | (Click Here) | |
Trustees and Officers | (Click Here) | |
Distributions | (Click Here) | |
Board Approval of Investment Advisory Contracts and Management Fees | (Click Here) | |
To view a fund's proxy voting guidelines and proxy voting record for the 12-month period ended June 30, visit http://www.fidelity.com/proxyvotingresults or visit the Securities and Exchange Commission's (SEC) web site at http://www.sec.gov. You may also call 1-800-544-8544 to request a free copy of the proxy voting guidelines.
Standard & Poor's, S&P and S&P 500 are registered service marks of The McGraw-Hill Companies, Inc. and have been licensed for use by Fidelity Distributors Corporation.
Other third-party marks appearing herein are the property of their respective owners.
All other marks appearing herein are registered or unregistered trademarks or service marks of FMR LLC or an affiliated company. © 2014 FMR LLC. All rights reserved.
Annual Report
This report and the financial statements contained herein are submitted for the general information of the shareholders of the fund. This report is not authorized for distribution to prospective investors in the fund unless preceded or accompanied by an effective prospectus.
A fund files its complete schedule of portfolio holdings with the SEC for the first and third quarters of each fiscal year on Form N-Q. Forms N-Q are available on the SEC's web site at http://www.sec.gov. A fund's Forms N-Q may be reviewed and copied at the SEC's Public Reference Room in Washington, DC. Information regarding the operation of the SEC's Public Reference Room may be obtained by calling 1-800-SEC-0330. For a complete list of a fund's portfolio holdings, view the most recent holdings listing, semiannual report, or annual report on Fidelity's web site at http://www.fidelity.com, http://www.advisor.fidelity.com, or http://www.401k.com, as applicable.
NOT FDIC INSURED • MAY LOSE VALUE • NO BANK GUARANTEE
Neither the fund nor Fidelity Distributors Corporation is a bank.
Annual Report
Average annual total return reflects the change in the value of an investment, assuming reinvestment of the fund's distributions from dividend income and capital gains (the profits earned upon the sale of securities that have grown in value, if any) and assuming a constant rate of performance each year. The $10,000 table and the fund's returns do not reflect the deduction of taxes that a shareholder would pay on fund distributions or the redemption of fund shares. During periods of reimbursement by Fidelity, a fund's total return will be greater than it would be had the reimbursement not occurred. How a fund did yesterday is no guarantee of how it will do tomorrow.
Average Annual Total Returns
Periods ended July 31, 2014 | Past 1
year | Past 5
years | Past 10
years |
Fidelity® Blue Chip Value Fund | 14.99% | 12.92% | 5.59% |
$10,000 Over 10 Years
Let's say hypothetically that $10,000 was invested in Fidelity® Blue Chip Value Fund on July 31, 2004. The chart shows how the value of your investment would have changed, and also shows how the Russell 1000® Value Index performed over the same period.
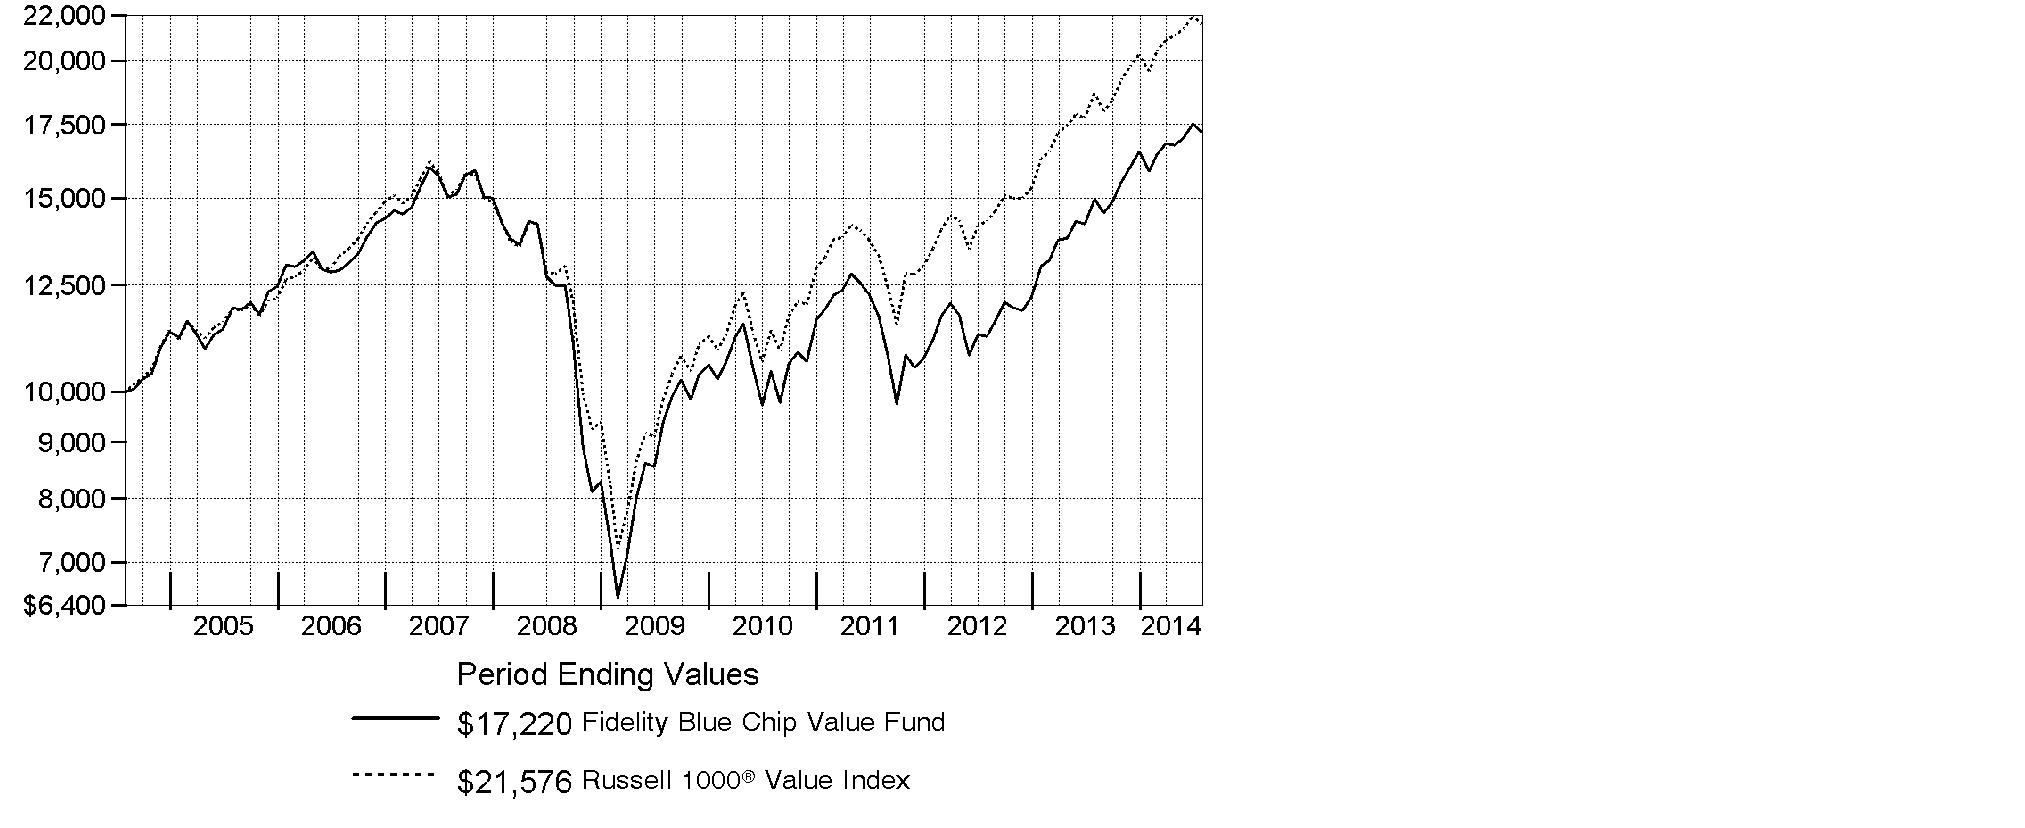
Annual Report
Market Recap: U.S. stocks overcame a slowing economy early in 2014 to post a strong gain for the 12-months ending July 31, 2014, supported by corporate profits and continued low interest rates. The S&P 500® Index rose 16.94%, reaching an all-time high near period end. The technology-heavy Nasdaq Composite Index® gained 22.00%. The Russell 2000® Index returned 8.56%, reflecting the relatively lackluster performance of small-cap stocks. Information technology (+28%) was the top-performing sector within the S&P 500®, driven by strong semiconductor and computer hardware sales. Materials (+23%) gained amid higher prices for many commodity products. Health care (+21%) rose, driven by gains in pharmaceuticals, biotechnology & life sciences companies. Energy stocks (+19%) advanced in the latter part of the period amid healthy U.S. output and the threat of supply disruptions in Iraq. Conversely, most defensive sectors, including consumer staples, utilities and telecommunication services, lagged the broader market. Volatility remained tame throughout most of the period, with markets supported by declining unemployment, near-record profit margins for companies, muted cost inflation and fairly low corporate debt levels. Geopolitical tension remained a concern at period end, with conflict in Ukraine and strained relations between Russia and the West posing a potential threat to global growth.
Comments from Michael Chren, Portfolio Manager of Fidelity® Blue Chip Value Fund: For the year ending July 31, 2014, the fund gained 14.99%, modestly trailing the benchmark Russell 1000® Value Index, which advanced 15.47%. The fund's average cash stake of roughly 5% was detrimental amid strong gains for global stocks. Security selection in the materials sector also hurt results, especially my position in gold producer Newmont Mining, which struggled as gold prices fell. Roughly midway through the period, I sold the fund's position in search of other opportunities. The fund's non-index position in software and services provider Comverse also detracted from performance. When the company reported weaker-than-expected revenue in April 2014, investors quickly exited the stock, though I took advantage of the lower price to increase the fund's position. On the positive side, security selection in telecommunication services added value, especially Level 3 Communications. As the integrated network communications company's shares approached my target price, I scaled back the fund's position. Stock picking in consumer discretionary also was helpful, particularly Apollo Education Group, a for-profit education provider. When the stock came relatively close to my target price, I sold the fund's stake in the first quarter of 2014.
The views expressed above reflect those of the portfolio manager(s) only through the end of the period as stated on the cover of this report and do not necessarily represent the views of Fidelity or any other person in the Fidelity organization. Any such views are subject to change at any time based upon market or other conditions and Fidelity disclaims any responsibility to update such views. These views may not be relied on as investment advice and, because investment decisions for a Fidelity fund are based on numerous factors, may not be relied on as an indication of trading intent on behalf of any Fidelity fund.
Annual Report
Shareholder Expense Example
As a shareholder of the Fund, you incur two types of costs: (1) transaction costs, and (2) ongoing costs, including management fees and other Fund expenses. This Example is intended to help you understand your ongoing costs (in dollars) of investing in the Fund and to compare these costs with the ongoing costs of investing in other mutual funds.
The Example is based on an investment of $1,000 invested at the beginning of the period and held for the entire period (February 1, 2014 to July 31, 2014).
Actual Expenses
The first line of the accompanying table provides information about actual account values and actual expenses. You may use the information in this line, together with the amount you invested, to estimate the expenses that you paid over the period. Simply divide your account value by $1,000.00 (for example, an $8,600 account value divided by $1,000.00 = 8.6), then multiply the result by the number in the first line under the heading entitled "Expenses Paid During Period" to estimate the expenses you paid on your account during this period. A small balance maintenance fee of $12.00 that is charged once a year may apply for certain accounts with a value of less than $2,000. This fee is not included in the table below. If it was, the estimate of expenses you paid during the period would be higher, and your ending account value lower, by this amount. In addition, the Fund, as a shareholder in the underlying Fidelity Central Funds, will indirectly bear its pro-rata share of the fees and expenses incurred by the underlying Fidelity Central Funds. These fees and expenses are not included in the Fund's annualized expense ratio used to calculate the expense estimate in the table below.
Hypothetical Example for Comparison Purposes
The second line of the accompanying table provides information about hypothetical account values and hypothetical expenses based on the Fund's actual expense ratio and an assumed rate of return of 5% per year before expenses, which is not the Fund's actual return. The hypothetical account values and expenses may not be used to estimate the actual ending account balance or expenses you paid for the period. You may use this information to compare the ongoing costs of investing in the Fund and other funds. To do so, compare this 5% hypothetical example with the 5% hypothetical examples that appear in the shareholder reports of the other funds. A small balance maintenance fee of $12.00 that is charged once a year may apply for certain accounts with a value of less than $2,000. This fee is not included in the table below. If it was, the estimate of expenses you paid during the period would be higher, and your ending account value lower, by this amount. In addition, the Fund, as a shareholder in the underlying Fidelity Central Funds, will indirectly bear its pro-rata share of the fees and expenses incurred by the underlying Fidelity Central Funds. These fees and expenses are not included in the Fund's annualized expense ratio used to calculate the expense estimate in the table below.
Please note that the expenses shown in the table are meant to highlight your ongoing costs only and do not reflect any transaction costs. Therefore, the second line of the table is useful in comparing ongoing costs only, and will not help you determine the relative total costs of owning different funds.
Annual Report
Shareholder Expense Example - continued
| Annualized
Expense RatioB | Beginning
Account Value
February 1, 2014 | Ending
Account Value
July 31, 2014 | Expenses Paid
During Period*
February 1, 2014
to July 31, 2014 |
Actual | .67% | $ 1,000.00 | $ 1,086.40 | $ 3.47 |
HypotheticalA | | $ 1,000.00 | $ 1,021.47 | $ 3.36 |
A 5% return per year before expenses
B Annualized expense ratio reflects expenses net of applicable fee waivers.
* Expenses are equal to the Fund's annualized expense ratio, multiplied by the average account value over the period, multiplied by 181/365 (to reflect the one-half year period).
Annual Report
Investment Changes (Unaudited)
Top Ten Stocks as of July 31, 2014 |
| % of fund's
net assets | % of fund's net assets
6 months ago |
Exxon Mobil Corp. | 4.7 | 4.3 |
General Electric Co. | 4.5 | 4.4 |
Pfizer, Inc. | 3.9 | 4.0 |
Merck & Co., Inc. | 3.1 | 3.9 |
JPMorgan Chase & Co. | 2.7 | 3.0 |
Citigroup, Inc. | 2.7 | 2.9 |
Johnson & Johnson | 2.6 | 0.0 |
Anadarko Petroleum Corp. | 2.3 | 0.4 |
Verint Systems, Inc. | 2.0 | 1.1 |
Comverse, Inc. | 2.0 | 1.4 |
| 30.5 | |
Top Five Market Sectors as of July 31, 2014 |
| % of fund's
net assets | % of fund's net assets
6 months ago |
Financials | 26.6 | 26.4 |
Health Care | 14.0 | 12.6 |
Information Technology | 13.0 | 14.7 |
Energy | 13.0 | 11.6 |
Industrials | 7.3 | 7.6 |
Asset Allocation (% of fund's net assets) |
As of July 31, 2014* | As of January 31, 2014** |
| Stocks 95.1% | | | Stocks and
Equity Futures 94.3% | |
| Short-Term
Investments and
Net Other Assets
(Liabilities) 4.9% | | | Short-Term
Investments and
Net Other Assets
(Liabilities) 5.7% | |
* Foreign investments | 4.4% | | ** Foreign investments | 1.1% | |

Annual Report
Investments July 31, 2014
Showing Percentage of Net Assets
Common Stocks - 95.1% |
| Shares | | Value |
CONSUMER DISCRETIONARY - 6.1% |
Auto Components - 1.1% |
Johnson Controls, Inc. | 79,014 | | $ 3,732,621 |
Automobiles - 2.0% |
Ford Motor Co. | 174,879 | | 2,976,441 |
General Motors Co. | 110,851 | | 3,748,981 |
| | 6,725,422 |
Diversified Consumer Services - 0.3% |
DeVry, Inc. | 24,272 | | 970,152 |
Media - 1.3% |
Time Warner Cable, Inc. | 14,700 | | 2,132,970 |
Time Warner, Inc. | 25,400 | | 2,108,708 |
| | 4,241,678 |
Specialty Retail - 1.4% |
Foot Locker, Inc. | 31,700 | | 1,506,701 |
Gap, Inc. | 33,300 | | 1,335,663 |
Office Depot, Inc. (a) | 339,400 | | 1,700,394 |
| | 4,542,758 |
TOTAL CONSUMER DISCRETIONARY | | 20,212,631 |
CONSUMER STAPLES - 6.2% |
Beverages - 0.4% |
PepsiCo, Inc. | 15,136 | | 1,333,482 |
Food & Staples Retailing - 1.9% |
CVS Caremark Corp. | 29,782 | | 2,274,154 |
Wal-Mart Stores, Inc. | 52,543 | | 3,866,114 |
| | 6,140,268 |
Food Products - 2.0% |
Dean Foods Co. | 99,400 | | 1,522,808 |
Kraft Foods Group, Inc. | 54,194 | | 2,903,985 |
Mondelez International, Inc. | 60,906 | | 2,192,616 |
| | 6,619,409 |
Household Products - 1.9% |
Procter & Gamble Co. | 81,804 | | 6,325,085 |
TOTAL CONSUMER STAPLES | | 20,418,244 |
ENERGY - 13.0% |
Energy Equipment & Services - 1.8% |
National Oilwell Varco, Inc. | 16,300 | | 1,320,952 |
Common Stocks - continued |
| Shares | | Value |
ENERGY - continued |
Energy Equipment & Services - continued |
Schlumberger Ltd. | 21,500 | | $ 2,330,385 |
Weatherford International Ltd. (a) | 108,611 | | 2,429,628 |
| | 6,080,965 |
Oil, Gas & Consumable Fuels - 11.2% |
Anadarko Petroleum Corp. | 70,800 | | 7,564,980 |
Apache Corp. | 49,875 | | 5,120,168 |
Chevron Corp. | 20,735 | | 2,679,791 |
Exxon Mobil Corp. | 155,230 | | 15,358,451 |
Occidental Petroleum Corp. | 62,322 | | 6,089,483 |
| | 36,812,873 |
TOTAL ENERGY | | 42,893,838 |
FINANCIALS - 26.6% |
Banks - 12.6% |
Bank of America Corp. | 290,735 | | 4,433,709 |
Citigroup, Inc. | 179,387 | | 8,773,818 |
Fifth Third Bancorp | 211,900 | | 4,339,712 |
JPMorgan Chase & Co. | 154,516 | | 8,910,938 |
KeyCorp | 325,635 | | 4,409,098 |
U.S. Bancorp | 68,297 | | 2,870,523 |
Wells Fargo & Co. | 122,798 | | 6,250,418 |
Zions Bancorporation | 60,580 | | 1,745,916 |
| | 41,734,132 |
Capital Markets - 4.9% |
Ares Capital Corp. | 181,403 | | 3,031,244 |
Bank of New York Mellon Corp. | 20,600 | | 804,224 |
E*TRADE Financial Corp. (a) | 157,345 | | 3,307,392 |
Goldman Sachs Group, Inc. | 15,487 | | 2,677,238 |
Raymond James Financial, Inc. | 56,181 | | 2,862,422 |
State Street Corp. | 48,004 | | 3,381,402 |
| | 16,063,922 |
Consumer Finance - 2.0% |
Capital One Financial Corp. | 61,733 | | 4,910,243 |
Springleaf Holdings, Inc. (d) | 60,700 | | 1,589,126 |
| | 6,499,369 |
Diversified Financial Services - 0.4% |
IntercontinentalExchange Group, Inc. | 6,300 | | 1,210,986 |
Common Stocks - continued |
| Shares | | Value |
FINANCIALS - continued |
Insurance - 4.1% |
AFLAC, Inc. | 70,200 | | $ 4,193,748 |
Allstate Corp. | 31,900 | | 1,864,555 |
American International Group, Inc. | 51,275 | | 2,665,275 |
FNF Group | 90,455 | | 2,452,235 |
MetLife, Inc. | 30,400 | | 1,599,040 |
The Chubb Corp. | 9,616 | | 833,803 |
| | 13,608,656 |
Real Estate Investment Trusts - 2.6% |
CBL & Associates Properties, Inc. | 125,900 | | 2,354,330 |
Senior Housing Properties Trust (SBI) | 80,400 | | 1,837,944 |
Washington Prime Group, Inc. (a) | 230,300 | | 4,350,367 |
| | 8,542,641 |
TOTAL FINANCIALS | | 87,659,706 |
HEALTH CARE - 14.0% |
Health Care Equipment & Supplies - 0.4% |
Boston Scientific Corp. (a) | 92,300 | | 1,179,594 |
Health Care Providers & Services - 1.4% |
HCA Holdings, Inc. (a) | 15,491 | | 1,011,717 |
Humana, Inc. | 31,000 | | 3,647,150 |
| | 4,658,867 |
Life Sciences Tools & Services - 0.6% |
Agilent Technologies, Inc. | 35,600 | | 1,996,804 |
Pharmaceuticals - 11.6% |
AbbVie, Inc. | 17,000 | | 889,780 |
Johnson & Johnson | 87,100 | | 8,717,839 |
Merck & Co., Inc. | 178,932 | | 10,152,602 |
Pfizer, Inc. | 443,601 | | 12,731,349 |
Teva Pharmaceutical Industries Ltd. sponsored ADR | 54,900 | | 2,937,150 |
Zoetis, Inc. Class A | 85,432 | | 2,811,567 |
| | 38,240,287 |
TOTAL HEALTH CARE | | 46,075,552 |
INDUSTRIALS - 7.3% |
Air Freight & Logistics - 1.3% |
FedEx Corp. | 28,000 | | 4,112,640 |
Common Stocks - continued |
| Shares | | Value |
INDUSTRIALS - continued |
Construction & Engineering - 0.5% |
URS Corp. | 29,765 | | $ 1,704,642 |
Industrial Conglomerates - 4.5% |
General Electric Co. | 590,873 | | 14,860,456 |
Machinery - 0.3% |
Caterpillar, Inc. | 11,265 | | 1,134,949 |
Road & Rail - 0.7% |
Hertz Global Holdings, Inc. (a) | 81,700 | | 2,305,574 |
TOTAL INDUSTRIALS | | 24,118,261 |
INFORMATION TECHNOLOGY - 13.0% |
Communications Equipment - 1.5% |
Cisco Systems, Inc. | 131,185 | | 3,309,798 |
Juniper Networks, Inc. | 73,400 | | 1,727,836 |
| | 5,037,634 |
Internet Software & Services - 0.3% |
Yahoo!, Inc. (a) | 30,800 | | 1,102,948 |
IT Services - 1.4% |
EVERTEC, Inc. | 128,500 | | 2,873,260 |
Xerox Corp. | 117,519 | | 1,558,302 |
| | 4,431,562 |
Semiconductors & Semiconductor Equipment - 1.7% |
Intel Corp. | 167,315 | | 5,670,305 |
Software - 7.6% |
Activision Blizzard, Inc. | 228,046 | | 5,103,669 |
Citrix Systems, Inc. (a) | 50,100 | | 3,393,273 |
Comverse, Inc. (a) | 252,348 | | 6,480,297 |
Symantec Corp. | 155,455 | | 3,678,065 |
Verint Systems, Inc. (a) | 138,337 | | 6,493,539 |
| | 25,148,843 |
Technology Hardware, Storage & Peripherals - 0.5% |
Hewlett-Packard Co. | 46,867 | | 1,668,934 |
TOTAL INFORMATION TECHNOLOGY | | 43,060,226 |
MATERIALS - 3.8% |
Chemicals - 0.3% |
Axiall Corp. | 11,100 | | 475,413 |
Common Stocks - continued |
| Shares | | Value |
MATERIALS - continued |
Chemicals - continued |
The Dow Chemical Co. | 4,992 | | $ 254,941 |
Tronox Ltd. Class A | 6,300 | | 167,202 |
| | 897,556 |
Containers & Packaging - 0.7% |
Crown Holdings, Inc. (a) | 47,612 | | 2,216,339 |
Metals & Mining - 2.8% |
Agnico Eagle Mines Ltd. (Canada) | 96,700 | | 3,595,376 |
Freeport-McMoRan Copper & Gold, Inc. | 153,745 | | 5,722,389 |
| | 9,317,765 |
TOTAL MATERIALS | | 12,431,660 |
TELECOMMUNICATION SERVICES - 2.6% |
Diversified Telecommunication Services - 2.0% |
AT&T, Inc. | 144,077 | | 5,127,700 |
Level 3 Communications, Inc. (a) | 32,262 | | 1,418,883 |
| | 6,546,583 |
Wireless Telecommunication Services - 0.6% |
T-Mobile U.S., Inc. (a) | 59,791 | | 1,969,516 |
TOTAL TELECOMMUNICATION SERVICES | | 8,516,099 |
UTILITIES - 2.5% |
Electric Utilities - 2.1% |
Exelon Corp. | 177,000 | | 5,501,160 |
FirstEnergy Corp. | 28,600 | | 892,606 |
PPL Corp. | 20,600 | | 679,594 |
| | 7,073,360 |
Independent Power Producers & Energy Traders - 0.4% |
Calpine Corp. (a) | 51,600 | | 1,137,264 |
TOTAL UTILITIES | | 8,210,624 |
TOTAL COMMON STOCKS (Cost $296,312,551) |
313,596,841
|
U.S. Treasury Obligations - 0.0% |
| Principal Amount | | Value |
U.S. Treasury Bills, yield at date of purchase 0.02% 9/25/14
(Cost $149,995) | | $ 150,000 | | $ 149,998 |
Money Market Funds - 5.1% |
| Shares | | |
Fidelity Cash Central Fund, 0.11% (b) | 16,080,806 | | 16,080,806 |
Fidelity Securities Lending Cash Central Fund, 0.11% (b)(c) | 770,000 | | 770,000 |
TOTAL MONEY MARKET FUNDS (Cost $16,850,806) |
16,850,806
|
TOTAL INVESTMENT PORTFOLIO - 100.2% (Cost $313,313,352) | | 330,597,645 |
NET OTHER ASSETS (LIABILITIES) - (0.2)% | | (771,677) |
NET ASSETS - 100% | $ 329,825,968 |
Legend |
(a) Non-income producing |
(b) Affiliated fund that is generally available only to investment companies and other accounts managed by Fidelity Investments. The rate quoted is the annualized seven-day yield of the fund at period end. A complete unaudited listing of the fund's holdings as of its most recent quarter end is available upon request. In addition, each Fidelity Central Fund's financial statements, which are not covered by the Fund's Report of Independent Registered Public Accounting Firm, are available on the SEC's website or upon request. |
(c) Investment made with cash collateral received from securities on loan. |
(d) Security or a portion of the security is on loan at period end. |
Affiliated Central Funds |
Information regarding fiscal year to date income earned by the Fund from investments in Fidelity Central Funds is as follows: |
Fund | Income earned |
Fidelity Cash Central Fund | $ 25,799 |
Fidelity Securities Lending Cash Central Fund | 3,555 |
Total | $ 29,354 |
Other Information |
The following is a summary of the inputs used, as of July 31, 2014, involving the Fund's assets and liabilities carried at fair value. The inputs or methodology used for valuing securities may not be an indication of the risk associated with investing in those securities. For more information on valuation inputs, and their aggregation into the levels used in the table below, please refer to the Investment Valuation section in the accompanying Notes to Financial Statements. |
Valuation Inputs at Reporting Date: |
Description | Total | Level 1 | Level 2 | Level 3 |
Investments in Securities: | | | | |
Equities: | | | | |
Consumer Discretionary | $ 20,212,631 | $ 20,212,631 | $ - | $ - |
Consumer Staples | 20,418,244 | 20,418,244 | - | - |
Energy | 42,893,838 | 42,893,838 | - | - |
Financials | 87,659,706 | 87,659,706 | - | - |
Health Care | 46,075,552 | 46,075,552 | - | - |
Industrials | 24,118,261 | 24,118,261 | - | - |
Information Technology | 43,060,226 | 43,060,226 | - | - |
Materials | 12,431,660 | 12,431,660 | - | - |
Telecommunication Services | 8,516,099 | 8,516,099 | - | - |
Utilities | 8,210,624 | 8,210,624 | - | - |
U.S. Government and Government Agency Obligations | 149,998 | - | 149,998 | - |
Money Market Funds | 16,850,806 | 16,850,806 | - | - |
Total Investments in Securities: | $ 330,597,645 | $ 330,447,647 | $ 149,998 | $ - |
See accompanying notes which are an integral part of the financial statements.
Annual Report
Statement of Assets and Liabilities
| July 31, 2014 |
| | |
Assets | | |
Investment in securities, at value (including securities loaned of $733,040) - See accompanying schedule: Unaffiliated issuers (cost $296,462,546) | $ 313,746,839 | |
Fidelity Central Funds (cost $16,850,806) | 16,850,806 | |
Total Investments (cost $313,313,352) | | $ 330,597,645 |
Receivable for investments sold | | 4,057,915 |
Receivable for fund shares sold | | 429,128 |
Dividends receivable | | 423,864 |
Distributions receivable from Fidelity Central Funds | | 1,924 |
Receivable from investment adviser for expense reductions | | 255 |
Other receivables | | 367,936 |
Total assets | | 335,878,667 |
| | |
Liabilities | | |
Payable for investments purchased | $ 4,402,906 | |
Payable for fund shares redeemed | 638,668 | |
Accrued management fee | 110,174 | |
Other affiliated payables | 79,911 | |
Other payables and accrued expenses | 51,040 | |
Collateral on securities loaned, at value | 770,000 | |
Total liabilities | | 6,052,699 |
| | |
Net Assets | | $ 329,825,968 |
Net Assets consist of: | | |
Paid in capital | | $ 412,355,197 |
Undistributed net investment income | | 2,682,966 |
Accumulated undistributed net realized gain (loss) on investments and foreign currency transactions | | (102,496,473) |
Net unrealized appreciation (depreciation) on investments and assets and liabilities in foreign currencies | | 17,284,278 |
Net Assets, for 21,669,899 shares outstanding | | $ 329,825,968 |
Net Asset Value, offering price and redemption price per share ($329,825,968 ÷ 21,669,899 shares) | | $ 15.22 |
See accompanying notes which are an integral part of the financial statements.
Annual Report
Statement of Operations
| Year ended July 31, 2014 |
| | |
Investment Income | | |
Dividends | | $ 6,662,222 |
Interest | | 83 |
Income from Fidelity Central Funds | | 29,354 |
Total income | | 6,691,659 |
| | |
Expenses | | |
Management fee
Basic fee | $ 1,899,113 | |
Performance adjustment | (647,159) | |
Transfer agent fees | 782,426 | |
Accounting and security lending fees | 134,414 | |
Custodian fees and expenses | 22,396 | |
Independent trustees' compensation | 1,389 | |
Registration fees | 26,063 | |
Audit | 56,714 | |
Legal | 1,406 | |
Miscellaneous | 2,432 | |
Total expenses before reductions | 2,279,194 | |
Expense reductions | (9,687) | 2,269,507 |
Net investment income (loss) | | 4,422,152 |
Realized and Unrealized Gain (Loss) Net realized gain (loss) on: | | |
Investment securities: | | |
Unaffiliated issuers | 40,420,523 | |
Redemption in-kind with affiliated entities | 6,806,604 | |
Foreign currency transactions | 880 | |
Futures contracts | 2,036,529 | |
Total net realized gain (loss) | | 49,264,536 |
Change in net unrealized appreciation (depreciation) on: Investment securities | (4,025,518) | |
Assets and liabilities in foreign currencies | (13) | |
Total change in net unrealized appreciation (depreciation) | | (4,025,531) |
Net gain (loss) | | 45,239,005 |
Net increase (decrease) in net assets resulting from operations | | $ 49,661,157 |
See accompanying notes which are an integral part of the financial statements.
Annual Report
Financial Statements - continued
Statement of Changes in Net Assets
| Year ended
July 31,
2014 | Year ended
July 31,
2013 |
Increase (Decrease) in Net Assets | | |
Operations | | |
Net investment income (loss) | $ 4,422,152 | $ 4,052,295 |
Net realized gain (loss) | 49,264,536 | 24,688,456 |
Change in net unrealized appreciation (depreciation) | (4,025,531) | 44,945,456 |
Net increase (decrease) in net assets resulting
from operations | 49,661,157 | 73,686,207 |
Distributions to shareholders from net investment income | (2,139,474) | (6,479,162) |
Share transactions
Proceeds from sales of shares | 137,673,635 | 49,942,277 |
Reinvestment of distributions | 2,081,150 | 6,279,261 |
Cost of shares redeemed | (139,310,785) | (79,700,390) |
Net increase (decrease) in net assets resulting from share transactions | 444,000 | (23,478,852) |
Total increase (decrease) in net assets | 47,965,683 | 43,728,193 |
| | |
Net Assets | | |
Beginning of period | 281,860,285 | 238,132,092 |
End of period (including undistributed net investment income of $2,682,966 and undistributed net investment income of $459,935, respectively) | $ 329,825,968 | $ 281,860,285 |
Other Information Shares | | |
Sold | 9,827,800 | 4,200,000 |
Issued in reinvestment of distributions | 150,333 | 585,069 |
Redeemed | (9,464,241) | (6,830,380) |
Net increase (decrease) | 513,892 | (2,045,311) |
See accompanying notes which are an integral part of the financial statements.
Annual Report
Financial Highlights
Years ended July 31, | 2014 | 2013 | 2012 | 2011 | 2010 |
Selected Per-Share Data | | | | | |
Net asset value, beginning of period | $ 13.32 | $ 10.26 | $ 10.86 | $ 9.82 | $ 8.95 |
Income from Investment Operations | | | | | |
Net investment income (loss) B | .18 | .18 | .18 | .14 | .10 |
Net realized and unrealized gain (loss) | 1.81 | 3.17 | (.62) | 1.04 | .90 |
Total from investment operations | 1.99 | 3.35 | (.44) | 1.18 | 1.00 |
Distributions from net investment income | (.09) | (.29) | (.16) | (.14) | (.13) |
Distributions from net realized gain | - | - | - | (.01) | - |
Total distributions | (.09) | (.29) | (.16) | (.14) F | (.13) |
Net asset value, end of period | $ 15.22 | $ 13.32 | $ 10.26 | $ 10.86 | $ 9.82 |
Total ReturnA | 14.99% | 33.33% | (3.95)% | 12.14% | 11.20% |
Ratios to Average Net AssetsC, E | | | | | |
Expenses before reductions | .66% | .64% | .77% | .75% | .87% |
Expenses net of fee waivers, if any | .66% | .64% | .77% | .75% | .87% |
Expenses net of all reductions | .66% | .62% | .76% | .74% | .86% |
Net investment income (loss) | 1.28% | 1.58% | 1.76% | 1.31% | 1.05% |
Supplemental Data | | | | | |
Net assets, end of period (000 omitted) | $ 329,826 | $ 281,860 | $ 238,132 | $ 433,047 | $ 324,913 |
Portfolio turnover rateD | 102% G | 88% | 102% | 141% | 59% |
A Total returns would have been lower if certain expenses had not been reduced during the applicable periods shown.
B Calculated based on average shares outstanding during the period.
C Fees and expenses of any underlying Fidelity Central Funds are not included in the Fund's expense ratio. The Fund indirectly bears its proportionate share of the expenses of any underlying Fidelity Central Funds.
D Amount does not include the portfolio activity of any underlying Fidelity Central Funds.
E Expense ratios reflect operating expenses of the Fund. Expenses before reductions do not reflect amounts reimbursed by the investment adviser or reductions from brokerage service arrangements or reductions from other expense offset arrangements and do not represent the amount paid by the Fund during periods when reimbursements or reductions occur. Expenses net of fee waivers reflect expenses after reimbursement by the investment adviser but prior to reductions from brokerage service arrangements or other expense offset arrangements. Expenses net of all reductions represent the net expenses paid by the Fund.
F Total distributions of $.14 per share is comprised of distributions from net investment income of $.135 and distributions from net realized gain of $.005 per share.
G Portfolio turnover rate excludes securities received or delivered in-kind.
See accompanying notes which are an integral part of the financial statements.
Annual Report
Notes to Financial Statements
For the period ended July 31, 2014
1. Organization.
Fidelity Blue Chip Value Fund (the Fund) is a fund of Fidelity Securities Fund (the Trust) and is authorized to issue an unlimited number of shares. The Trust is registered under the Investment Company Act of 1940, as amended (the 1940 Act), as an open-end management investment company organized as a Massachusetts business trust.
2. Investments in Fidelity Central Funds.
The Fund invests in Fidelity Central Funds, which are open-end investment companies generally available only to other investment companies and accounts managed by the investment adviser and its affiliates. The Fund's Schedule of Investments lists each of the Fidelity Central Funds held as of period end, if any, as an investment of the Fund, but does not include the underlying holdings of each Fidelity Central Fund. As an Investing Fund, the Fund indirectly bears its proportionate share of the expenses of the underlying Fidelity Central Funds.
The Money Market Central Funds seek preservation of capital and current income and are managed by Fidelity Investments Money Management, Inc. (FIMM), an affiliate of the investment adviser. Annualized expenses of the Money Market Central Funds as of their most recent shareholder report date are less than .01%.
A complete unaudited list of holdings for each Fidelity Central Fund is available upon request or at the Securities and Exchange Commission (the SEC) website at www.sec.gov. In addition, the financial statements of the Fidelity Central Funds, which are not covered by the Fund's Report of Independent Registered Public Accounting Firm, are available on the SEC website or upon request.
3. Significant Accounting Policies.
The financial statements have been prepared in conformity with accounting principles generally accepted in the United States of America (GAAP), which require management to make certain estimates and assumptions at the date of the financial statements. Actual results could differ from those estimates. Subsequent events, if any, through the date that the financial statements were issued have been evaluated in the preparation of the financial statements. The following summarizes the significant accounting policies of the Fund:
Investment Valuation. Investments are valued as of 4:00 p.m. Eastern time on the last calendar day of the period. In accordance with valuation policies and procedures approved by the Board of Trustees (the Board), the Fund attempts to obtain prices from one or more third party pricing vendors or brokers to value its investments. When current market prices, quotations or currency exchange rates are not readily available or
Annual Report
3. Significant Accounting Policies - continued
Investment Valuation - continued
reliable, investments will be fair valued in good faith by the Fidelity Management & Research Company (FMR) Fair Value Committee (the Committee), in accordance with procedures adopted by the Board. Factors used in determining fair value vary by investment type and may include market or investment specific events, changes in interest rates and credit quality. The frequency with which these procedures are used cannot be predicted and they may be utilized to a significant extent. The Committee oversees the Fund's valuation policies and procedures and is responsible for approving and reporting to the Board all fair value determinations.
The Fund categorizes the inputs to valuation techniques used to value its investments into a disclosure hierarchy consisting of three levels as shown below:
Level 1 - quoted prices in active markets for identical investments
Level 2 - other significant observable inputs (including quoted prices for similar investments, interest rates, prepayment speeds, etc.)
Level 3 - unobservable inputs (including the Fund's own assumptions based on the best information available)
Valuation techniques used to value the Fund's investments by major category are as follows:
Equity securities, including restricted securities, for which market quotations are readily available, are valued at the last reported sale price or official closing price as reported by a third party pricing vendor on the primary market or exchange on which they are traded and are categorized as Level 1 in the hierarchy. In the event there were no sales during the day or closing prices are not available, securities are valued at the last quoted bid price or may be valued using the last available price and are generally categorized as Level 2 in the hierarchy. For foreign equity securities, when market or security specific events arise, comparisons to the valuation of American Depositary Receipts (ADRs), futures contracts, Exchange-Traded Funds (ETFs) and certain indexes as well as quoted prices for similar securities may be used and would be categorized as Level 2 in the hierarchy. Utilizing these techniques may result in transfers between Level 1 and Level 2. For equity securities, including restricted securities, where observable inputs are limited, assumptions about market activity and risk are used and these securities may be categorized as Level 3 in the hierarchy.
Debt securities, including restricted securities, are valued based on evaluated prices received from third party pricing vendors or from brokers who make markets in such securities. U.S. government and government agency obligations are valued by pricing
Annual Report
Notes to Financial Statements - continued
3. Significant Accounting Policies - continued
Investment Valuation - continued
vendors who utilize matrix pricing which considers yield or price of bonds of comparable quality, coupon, maturity and type or by broker-supplied prices. When independent prices are unavailable or unreliable, debt securities may be valued utilizing pricing methodologies which consider similar factors that would be used by third party pricing vendors. Debt securities are generally categorized as Level 2 in the hierarchy but may be Level 3 depending on the circumstances.
Investments in open-end mutual funds, including the Fidelity Central Funds, are valued at their closing net asset value (NAV) each business day and are categorized as Level 1 in the hierarchy.
Changes in valuation techniques may result in transfers in or out of an assigned level within the disclosure hierarchy. The aggregate value of investments by input level, as of July 31, 2014 is included at the end of the Fund's Schedule of Investments.
Foreign Currency. The Fund may use foreign currency contracts to facilitate transactions in foreign-denominated securities. Gains and losses from these transactions may arise from changes in the value of the foreign currency or if the counterparties do not perform under the contracts' terms.
Foreign-denominated assets, including investment securities, and liabilities are translated into U.S. dollars at the exchange rates at period end. Purchases and sales of investment securities, income and dividends received and expenses denominated in foreign currencies are translated into U.S. dollars at the exchange rate in effect on the transaction date.
The effects of exchange rate fluctuations on investments are included with the net realized and unrealized gain (loss) on investment securities. Other foreign currency transactions resulting in realized and unrealized gain (loss) are disclosed separately.
Investment Transactions and Income. For financial reporting purposes, the Fund's investment holdings and NAV include trades executed through the end of the last business day of the period. The NAV per share for processing shareholder transactions is calculated as of the close of business of the New York Stock Exchange (NYSE), normally 4:00 p.m. Eastern time and includes trades executed through the end of the prior business day. Gains and losses on securities sold are determined on the basis of identified cost and may include proceeds received from litigation. Dividend income is recorded on the ex-dividend date, except for certain dividends from foreign securities where the ex-dividend date may have passed, which are recorded as soon as the Fund is informed of the ex-dividend date. Non-cash dividends included in dividend income, if any, are
Annual Report
3. Significant Accounting Policies - continued
Investment Transactions and Income - continued
recorded at the fair market value of the securities received. Income and capital gain distributions from Fidelity Central Funds, if any, are recorded on the ex-dividend date. Distributions received on securities that represent a return of capital or capital gain are recorded as a reduction of cost of investments and/or as a realized gain. Subsequent to ex-dividend date the Fund determines the components of these distributions, based upon receipt of tax filings or other correspondence relating to the underlying investment. Interest income is accrued as earned and includes coupon interest and amortization of premium and accretion of discount on debt securities as applicable. Investment income is recorded net of foreign taxes withheld where recovery of such taxes is uncertain.
Expenses. Expenses directly attributable to a fund are charged to that fund. Expenses attributable to more than one fund are allocated among the respective funds on the basis of relative net assets or other appropriate methods. Expense estimates are accrued in the period to which they relate and adjustments are made when actual amounts are known.
Income Tax Information and Distributions to Shareholders. Each year, the Fund intends to qualify as a regulated investment company under Subchapter M of the Internal Revenue Code, including distributing substantially all of its taxable income and realized gains. As a result, no provision for U.S. Federal income taxes is required. As of July 31, 2014, the Fund did not have any unrecognized tax benefits in the financial statements; nor is the Fund aware of any tax positions for which it is reasonably possible that the total amounts of unrecognized tax benefits will significantly change in the next twelve months. The Fund files a U.S. federal tax return, in addition to state and local tax returns as required. The Fund's federal income tax returns are subject to examination by the Internal Revenue Service (IRS) for a period of three fiscal years after they are filed. State and local tax returns may be subject to examination for an additional fiscal year depending on the jurisdiction. Foreign taxes are provided for based on the Fund's understanding of the tax rules and rates that exist in the foreign markets in which it invests.
Distributions are declared and recorded on the ex-dividend date. Income and capital gain distributions are determined in accordance with income tax regulations, which may differ from GAAP.
Capital accounts within the financial statements are adjusted for permanent book-tax differences. These adjustments have no impact on net assets or the results of operations. Capital accounts are not adjusted for temporary book-tax differences which will reverse in a subsequent period.
Annual Report
Notes to Financial Statements - continued
3. Significant Accounting Policies - continued
Income Tax Information and Distributions to Shareholders - continued
Book-tax differences are primarily due to in-kind transactions, futures contracts, foreign currency transactions, partnerships, capital loss carryforwards and losses deferred due to wash sales.
The federal tax cost of investment securities and unrealized appreciation (depreciation) as of period end were as follows:
Gross unrealized appreciation | $ 26,413,395 |
Gross unrealized depreciation | (14,616,673) |
Net unrealized appreciation (depreciation) on securities | $ 11,796,722 |
| |
Tax Cost | $ 318,800,923 |
The tax-based components of distributable earnings as of period end were as follows:
Undistributed ordinary income | $ 2,682,966 |
Capital loss carryforward | $ (97,008,902) |
Net unrealized appreciation (depreciation) on securities and other investments | $ 11,796,707 |
Capital loss carryforwards are only available to offset future capital gains of the Fund to the extent provided by regulations and may be limited. Under the Regulated Investment Company Modernization Act of 2010 (the Act), the Fund is permitted to carry forward capital losses incurred in taxable years beginning after December 22, 2010 for an unlimited period and such capital losses are required to be used prior to any losses that expire. The capital loss carryforward information presented below, including any applicable limitation, is estimated as of fiscal period end and is subject to adjustment.
Fiscal year of expiration |
2017 | $ (41,508,774) |
2018 | (55,500,128) |
Total capital loss carryforward | $ (97,008,902) |
The tax character of distributions paid was as follows:
| July 31, 2014 | July 31, 2013 |
Ordinary Income | $ 2,139,474 | $ 6,479,162 |
Annual Report
4. Derivative Instruments.
Risk Exposures and the Use of Derivative Instruments. The Fund's investment objective allows the Fund to enter into various types of derivative contracts, including futures contracts. Derivatives are investments whose value is primarily derived from underlying assets, indices or reference rates and may be transacted on an exchange or over-the-counter (OTC). Derivatives may involve a future commitment to buy or sell a specified asset based on specified terms, to exchange future cash flows at periodic intervals based on a notional principal amount, or for one party to make one or more payments upon the occurrence of specified events in exchange for periodic payments from the other party.
The Fund used derivatives to increase returns and to manage exposure to certain risks as defined below. The success of any strategy involving derivatives depends on analysis of numerous economic factors, and if the strategies for investment do not work as intended, the Fund may not achieve its objectives.
The Fund's use of derivatives increased or decreased its exposure to the following risk:
Equity Risk | Equity risk relates to the fluctuations in the value of financial instruments as a result of changes in market prices (other than those arising from interest rate risk or foreign exchange risk), whether caused by factors specific to an individual investment, its issuer, or all factors affecting all instruments traded in a market or market segment. |
The Fund is also exposed to additional risks from investing in derivatives, such as liquidity risk and counterparty credit risk. Liquidity risk is the risk that the Fund will be unable to close out the derivative in the open market in a timely manner. Counterparty credit risk is the risk that the counterparty will not be able to fulfill its obligation to the Fund. Counterparty credit risk related to exchange-traded futures contracts may be mitigated by the protection provided by the exchange on which they trade.
Investing in derivatives may involve greater risks than investing in the underlying assets directly and, to varying degrees, may involve risk of loss in excess of any initial investment and collateral received and amounts recognized in the Statement of Assets and Liabilities. In addition, there may be the risk that the change in value of the derivative contract does not correspond to the change in value of the underlying instrument.
Futures Contracts. A futures contract is an agreement between two parties to buy or sell a specified underlying instrument for a fixed price at a specified future date. The Fund used futures contracts to manage its exposure to the stock market.
Upon entering into a futures contract, a fund is required to deposit either cash or securities (initial margin) with a clearing broker in an amount equal to a certain percentage of the face value of the contract. Futures contracts are marked-to-market daily and subsequent daily payments (variation margin) are made or received by a fund depending on
Annual Report
Notes to Financial Statements - continued
4. Derivative Instruments - continued
Futures Contracts - continued
the daily fluctuations in the value of the futures contracts and are recorded as unrealized appreciation or (depreciation). This receivable and/or payable, if any, is included in daily variation margin for derivative instruments in the Statement of Assets and Liabilities. Realized gain or (loss) is recorded upon the expiration or closing of a futures contract.
Any open futures contracts at period end are presented in the Schedule of Investments under the caption "Futures Contracts." The underlying face amount at value reflects each contract's exposure to the underlying instrument or index at period end.
During the period the Fund recognized net realized gain (loss) of $2,036,529 related to its investment in futures contracts. This amount is included in the Statement of Operations.
5. Purchases and Sales of Investments.
Purchases and sales of securities, other than short-term securities and in-kind transactions, aggregated $368,255,871 and $322,094,618, respectively.
6. Fees and Other Transactions with Affiliates.
Management Fee. Fidelity Management & Research Company (the investment adviser) and its affiliates provide the Fund with investment management related services for which the Fund pays a monthly management fee. The management fee is the sum of an individual fund fee rate that is based on an annual rate of .30% of the Fund's average net assets and an annualized group fee rate that averaged .25% during the period. The group fee rate is based upon the average net assets of all the mutual funds advised by the investment adviser, including any mutual funds previously advised by the investment adviser that are currently advised by Fidelity SelectCo, LLC, an affiliate of the investment adviser. The group fee rate decreases as assets under management increase and increases as assets under management decrease. In addition, the management fee is subject to a performance adjustment (up to a maximum of ± .20% of the Fund's average net assets over a 36 month performance period). The upward or downward adjustment to the management fee is based on the Fund's relative investment performance as compared to its benchmark index, the Russell 1000® Value Index, over the same 36 month performance period. For the reporting period, the total annual management fee rate, including the performance adjustment, was .36% of the Fund's average net assets. The performance adjustment included in the management fee rate may be higher or lower than the maximum performance adjustment rate due to the difference between the average net assets for the reporting and performance periods.
Annual Report
6. Fees and Other Transactions with Affiliates - continued
Transfer Agent Fees. Fidelity Investments Institutional Operations Company, Inc. (FIIOC), an affiliate of the investment adviser, is the Fund's transfer, dividend disbursing and shareholder servicing agent. FIIOC receives account fees and asset-based fees that vary according to account size and type of account. FIIOC pays for typesetting, printing and mailing of shareholder reports, except proxy statements. For the period, the transfer agent fees were equivalent to an annual rate of .23% of average net assets.
Accounting and Security Lending Fees. Fidelity Service Company, Inc. (FSC), an affiliate of the investment adviser, maintains the Fund's accounting records. The accounting fee is based on the level of average net assets for each month. Under a separate contract, FSC administers the security lending program. The security lending fee is based on the number and duration of lending transactions.
Brokerage Commissions. The Fund placed a portion of its portfolio transactions with brokerage firms which are affiliates of the investment adviser. Brokerage commissions are included in net realized gain (loss) and change in net unrealized appreciation (depreciation) in the Statement of Operations. The commissions paid to these affiliated firms were $20,737 for the period.
Redemptions In-Kind. During the period, 2,660,518 shares of the Fund held by affiliated entities were redeemed in kind for cash and investments, with a value of $41,211,423. The net realized gain of $6,806,604 on securities delivered through the in-kind redemption is included in the accompanying Statement of Operations. The amount of in-kind redemptions is included in share transactions in the accompanying Statement of Changes in Net Assets. The Fund recognized no gain or loss for federal income tax purposes.
7. Committed Line of Credit.
The Fund participates with other funds managed by the investment adviser or an affiliate in a $4.25 billion credit facility (the "line of credit") to be utilized for temporary or emergency purposes to fund shareholder redemptions or for other short-term liquidity purposes. The Fund has agreed to pay commitment fees on its pro-rata portion of the line of credit, which amounted to $576 and is reflected in Miscellaneous expenses on the Statement of Operations. During the period, the Fund did not borrow on this line of credit.
Annual Report
Notes to Financial Statements - continued
8. Security Lending.
The Fund lends portfolio securities through a lending agent from time to time in order to earn additional income. For equity securities, a lending agent is used and may loan securities to certain qualified borrowers, including Fidelity Capital Markets (FCM), a broker-dealer affiliated with the Fund. On the settlement date of the loan, the Fund receives collateral (in the form of U.S. Treasury obligations, letters of credit and/or cash) against the loaned securities and maintains collateral in an amount not less than 100% of the market value of the loaned securities during the period of the loan. The market value of the loaned securities is determined at the close of business of the Fund and any additional required collateral is delivered to the Fund on the next business day. If the borrower defaults on its obligation to return the securities loaned because of insolvency or other reasons, the Fund may apply collateral received from the borrower against the obligation. The Fund may experience delays and costs in recovering the securities loaned. Any cash collateral received is invested in the Fidelity Securities Lending Cash Central Fund. The value of loaned securities and cash collateral at period end are disclosed on the Fund's Statement of Assets and Liabilities. Security lending income represents the income earned on investing cash collateral, less rebates paid to borrowers and any lending agent fees associated with the loan, plus any premium payments received for lending certain types of securities. Security lending income is presented in the Statement of Operations as a component of income from Fidelity Central Funds. Total security lending income during the period amounted to $3,555. During the period, there were no securities loaned to FCM.
9. Expense Reductions.
Commissions paid to certain brokers with whom the investment adviser, or its affiliates, places trades on behalf of the Fund include an amount in addition to trade execution, which may be rebated back to the Fund to offset certain expenses. This amount totaled $5,868 for the period. In addition, through arrangements with the Fund's custodian, credits realized as a result of uninvested cash balances were used to reduce the Fund's expenses. During the period, these credits reduced the Fund's custody expenses by $26.
In addition, the investment adviser reimbursed a portion of the Fund's operating expenses during the period in the amount of $3,793.
10. Other.
The Fund's organizational documents provide former and current trustees and officers with a limited indemnification against liabilities arising in connection with the performance of their duties to the Fund. In the normal course of business, the Fund may also enter into contracts that provide general indemnifications. The Fund's maximum exposure under these arrangements is unknown as this would be dependent on future claims that may be made against the Fund. The risk of material loss from such claims is considered remote.
Annual Report
To the Trustees of Fidelity Securities Fund and the Shareholders of Fidelity Blue Chip Value Fund:
In our opinion, the accompanying statement of assets and liabilities, including the schedule of investments, and the related statements of operations and of changes in net assets and the financial highlights present fairly, in all material respects, the financial position of Fidelity Blue Chip Value Fund (a fund of Fidelity Securities Fund) at July 31, 2014, the results of its operations for the year then ended, the changes in its net assets for each of the two years in the period then ended and the financial highlights for each of the five years in the period then ended, in conformity with accounting principles generally accepted in the United States of America. These financial statements and financial highlights (hereafter referred to as "financial statements") are the responsibility of the Fidelity Blue Chip Value Fund's management. Our responsibility is to express an opinion on these financial statements based on our audits. We conducted our audits of these financial statements in accordance with the standards of the Public Company Accounting Oversight Board (United States). Those standards require that we plan and perform the audit to obtain reasonable assurance about whether the financial statements are free of material misstatement. An audit includes examining, on a test basis, evidence supporting the amounts and disclosures in the financial statements, assessing the accounting principles used and significant estimates made by management, and evaluating the overall financial statement presentation. We believe that our audits, which included confirmation of securities at July 31, 2014 by correspondence with the custodian and brokers, provide a reasonable basis for our opinion.
PricewaterhouseCoopers LLP
Boston, Massachusetts
September 12, 2014
Annual Report
The Trustees, Member of the Advisory Board, and officers of the trust and fund, as applicable, are listed below. The Board of Trustees governs the fund and is responsible for protecting the interests of shareholders. The Trustees are experienced executives who meet periodically throughout the year to oversee the fund's activities, review contractual arrangements with companies that provide services to the fund, oversee management of the risks associated with such activities and contractual arrangements, and review the fund's performance. Except for James C. Curvey, each of the Trustees oversees 173 funds. Mr. Curvey oversees 397 funds.
The Trustees hold office without limit in time except that (a) any Trustee may resign; (b) any Trustee may be removed by written instrument, signed by at least two-thirds of the number of Trustees prior to such removal; (c) any Trustee who requests to be retired or who has become incapacitated by illness or injury may be retired by written instrument signed by a majority of the other Trustees; and (d) any Trustee may be removed at any special meeting of shareholders by a two-thirds vote of the outstanding voting securities of the trust. Each Trustee who is not an interested person (as defined in the 1940 Act) of the trust and the fund (Independent Trustee), shall retire not later than the last day of the calendar year in which his or her 75th birthday occurs. The Independent Trustees may waive this mandatory retirement age policy with respect to individual Trustees. The officers and Advisory Board Member hold office without limit in time, except that any officer and Advisory Board Member may resign or may be removed by a vote of a majority of the Trustees at any regular meeting or any special meeting of the Trustees. Except as indicated, each individual has held the office shown or other offices in the same company for the past five years.
Experience, Skills, Attributes, and Qualifications of the Fund's Trustees. The Governance and Nominating Committee has adopted a statement of policy that describes the experience, qualifications, attributes, and skills that are necessary and desirable for potential Independent Trustee candidates (Statement of Policy). The Board believes that each Trustee satisfied at the time he or she was initially elected or appointed a Trustee, and continues to satisfy, the standards contemplated by the Statement of Policy. The Governance and Nominating Committee also engages professional search firms to help identify potential Independent Trustee candidates who have the experience, qualifications, attributes, and skills consistent with the Statement of Policy. From time to time, additional criteria based on the composition and skills of the current Independent Trustees, as well as experience or skills that may be appropriate in light of future changes to board composition, business conditions, and regulatory or other developments, have also been considered by the professional search firms and the Governance and Nominating Committee. In addition, the Board takes into account the Trustees' commitment and participation in Board and committee meetings, as well as their leadership of standing and ad hoc committees throughout their tenure.
In determining that a particular Trustee was and continues to be qualified to serve as a Trustee, the Board has considered a variety of criteria, none of which, in isolation, was controlling. The Board believes that, collectively, the Trustees have balanced and diverse experience, qualifications, attributes, and skills, which allow the Board to operate effectively in governing the fund and protecting the interests of shareholders. Information about the specific experience, skills, attributes, and qualifications of each Trustee, which in each case led to the Board's conclusion that the Trustee should serve (or continue to serve) as a trustee of the fund, is provided below.
Annual Report
Board Structure and Oversight Function. James C. Curvey is an interested person (as defined in the 1940 Act) and currently serves as Chairman. The Trustees have determined that an interested Chairman is appropriate and benefits shareholders because an interested Chairman has a personal and professional stake in the quality and continuity of services provided to the fund. Independent Trustees exercise their informed business judgment to appoint an individual of their choosing to serve as Chairman, regardless of whether the Trustee happens to be independent or a member of management. The Independent Trustees have determined that they can act independently and effectively without having an Independent Trustee serve as Chairman and that a key structural component for assuring that they are in a position to do so is for the Independent Trustees to constitute a substantial majority for the Board. The Independent Trustees also regularly meet in executive session. Ned C. Lautenbach serves as Chairman of the Independent Trustees and as such (i) acts as a liaison between the Independent Trustees and management with respect to matters important to the Independent Trustees and (ii) with management prepares agendas for Board meetings.
Fidelity funds are overseen by different Boards of Trustees. The fund's Board oversees Fidelity's equity and high income funds and another Board oversees Fidelity's investment-grade bond, money market, and asset allocation funds. The asset allocation funds may invest in Fidelity funds overseen by the fund's Board. The use of separate Boards, each with its own committee structure, allows the Trustees of each group of Fidelity funds to focus on the unique issues of the funds they oversee, including common research, investment, and operational issues. On occasion, the separate Boards establish joint committees to address issues of overlapping consequences for the Fidelity funds overseen by each Board.
The Trustees operate using a system of committees to facilitate the timely and efficient consideration of all matters of importance to the Trustees, the fund, and fund shareholders and to facilitate compliance with legal and regulatory requirements and oversight of the fund's activities and associated risks. The Board, acting through its committees, has charged FMR and its affiliates with (i) identifying events or circumstances the occurrence of which could have demonstrably adverse effects on the fund's business and/or reputation; (ii) implementing processes and controls to lessen the possibility that such events or circumstances occur or to mitigate the effects of such events or circumstances if they do occur; and (iii) creating and maintaining a system designed to evaluate continuously business and market conditions in order to facilitate the identification and implementation processes described in (i) and (ii) above. Because the day-to-day operations and activities of the fund are carried out by or through FMR, its affiliates and other service providers, the fund's exposure to risks is mitigated but not eliminated by the processes overseen by the Trustees. While each of the Board's committees has responsibility for overseeing different aspects of the fund's activities, oversight is exercised primarily through the Operations, Audit, and Compliance Committees. In addition, the Independent Trustees have worked with FMR to enhance the Board's oversight of investment and financial risks, legal and regulatory risks, technology risks, and operational risks, including the development of additional risk reporting to the Board. For example, a working group comprised of Independent Trustees and FMR has worked and continues to work to review the Fidelity funds' valuation-related activities, reporting and risk management. Appropriate personnel, including but not limited to the fund's Chief Compliance Officer (CCO), FMR's internal auditor, the independent accountants, the fund's Treasurer and portfolio management personnel, make periodic reports to the Board's committees, as appropriate, including an annual review of FMR's risk management program for the Fidelity funds. The responsibilities of each standing committee, including their oversight responsibilities, are described further under "Standing Committees of the Fund's Trustees."
Annual Report
Trustees and Officers - continued
The fund's Statement of Additional Information (SAI) includes more information about the Trustees. To request a free copy, call Fidelity at 1-800-544-8544.
Interested Trustees*:
Correspondence intended for each Trustee who is an interested person may be sent to Fidelity Investments, 245 Summer Street, Boston, Massachusetts 02210.
Name, Year of Birth; Principal Occupations and Other Relevant Experience+ |
James C. Curvey (1935) |
Year of Election or Appointment: 2007 Trustee Chairman of the Board of Trustees |
| Mr. Curvey also serves as Trustee of other Fidelity funds. Mr. Curvey is a Director of Fidelity Research & Analysis Co. (2009-present), and Vice Chairman (2007-present) and Director of FMR LLC. In addition, Mr. Curvey serves as an Overseer for the Boston Symphony Orchestra and a member of the Trustees of Villanova University. Previously, Mr. Curvey served as a Director of Fidelity Investments Money Management, Inc. (2009-2014), a Director of FMR (2007-2014), a Director of FMR Co., Inc. (2007-2014) and was the Vice Chairman (2006-2007) and Director (2000-2007) of FMR Corp. |
Charles S. Morrison (1960) |
Year of Election or Appointment: 2014 Trustee |
| Mr. Morrison also serves as Trustee of other funds. He serves as President, Asset Management (2014-present) and is an employee of Fidelity Investments. Previously, Mr. Morrison served as Vice President of Fidelity's Fixed Income and Asset Allocation Funds (2012-2014), President, Fixed Income (2011-2014), Vice President of Fidelity's Money Market Funds (2005-2009), President, Money Market Group Leader of FMR (2009), and Senior Vice President, Money Market Group of FMR (2004-2009). Mr. Morrison also served as Vice President of Fidelity's Bond Funds (2002-2005), certain Balanced Funds (2002-2005), and certain Asset Allocation Funds (2002-2007), and as Senior Vice President (2002-2005) of Fidelity's Bond Division. |
* Trustees have been determined to be "Interested Trustees" by virtue of, among other things, their affiliation with the trust or various entities under common control with FMR.
+ The information above includes each Trustee's principal occupation during the last five years and other information relating to the experience, attributes, and skills relevant to each Trustee's qualifications to serve as a Trustee, which led to the conclusion that each Trustee should serve as a Trustee for the fund.
Annual Report
Trustees and Officers - continued
Independent Trustees:
Correspondence intended for each Independent Trustee (that is, the Trustees other than the Interested Trustees) may be sent to Fidelity Investments, P.O. Box 55235, Boston, Massachusetts 02205-5235.
Name, Year of Birth; Principal Occupations and Other Relevant Experience+ |
Dennis J. Dirks (1948) |
Year of Election or Appointment: 2005 Trustee |
| Mr. Dirks also serves as Trustee of other Fidelity funds. Prior to his retirement in May 2003, Mr. Dirks was Chief Operating Officer and a member of the Board of The Depository Trust & Clearing Corporation (DTCC). He also served as President, Chief Operating Officer, and Board member of The Depository Trust Company (DTC) and President and Board member of the National Securities Clearing Corporation (NSCC). In addition, Mr. Dirks served as Chief Executive Officer and Board member of the Government Securities Clearing Corporation, Chief Executive Officer and Board member of the Mortgage-Backed Securities Clearing Corporation, as a Trustee and a member of the Finance Committee of Manhattan College (2005-2008), and as a Trustee and a member of the Finance Committee of AHRC of Nassau County (2006-2008). Mr. Dirks is a member of the Independent Directors Council (IDC) Governing Council (2010-present) and Board of Directors for The Brookville Center for Children's Services, Inc. (2009-present). |
Alan J. Lacy (1953) |
Year of Election or Appointment: 2008 Trustee |
| Mr. Lacy also serves as Trustee of other Fidelity funds. Mr. Lacy serves as Senior Adviser (2007-present) of Oak Hill Capital Partners, L.P. (private equity). Mr. Lacy also served as Chief Executive Officer (2000-2005) and Vice Chairman (2005-2006) of Sears Holdings Corporation and Sears, Roebuck and Co. (retail). In addition, Mr. Lacy serves as a member of the Board of Directors of Dave & Buster's Entertainment, Inc. (restaurant and entertainment complexes, 2010-present), Earth Fare, Inc. (retail grocery, 2012-present), The Hillman Companies, Inc. (hardware wholesalers, 2010-present), and Bristol-Myers Squibb Company (global pharmaceuticals, 2008-present). Mr. Lacy is a member of the Board of Trustees of The National Parks Conservation Association (2006-present). Previously, Mr. Lacy served as Chairman of the Board of Trustees of the National Parks Conservation Association (2008-2011) and as a member of the Board of Directors for the Western Union Company (global money transfer, 2006-2011). |
Ned C. Lautenbach (1944) |
Year of Election or Appointment: 2000 Trustee Chairman of the Independent Trustees |
| Mr. Lautenbach also serves as Trustee of other Fidelity funds. Mr. Lautenbach currently serves as the Lead Director of the Eaton Corporation Board of Directors (diversified industrial, 1997-present). Mr. Lautenbach is Chairman of the Board of Directors of the Philharmonic Center for the Arts in Naples, Florida (2012-present) and a member of the Council on Foreign Relations (1994-present). Previously, Mr. Lautenbach was a Partner/Advisory Partner at Clayton, Dubilier & Rice, LLC (private equity investment, 1998-2010), as well as a Director of Sony Corporation (2006-2007). |
Joseph Mauriello (1944) |
Year of Election or Appointment: 2008 Trustee |
| Mr. Mauriello also serves as Trustee of other Fidelity funds. Prior to his retirement in January 2006, Mr. Mauriello served in numerous senior management positions including Deputy Chairman and Chief Operating Officer (2004-2005), and Vice Chairman of Financial Services (2002-2004) of KPMG LLP US (professional services, 1965-2005). Mr. Mauriello currently serves as a member of the Board of Directors of XL Group plc. (global insurance and re-insurance, 2006-present). Previously, Mr. Mauriello served as a Director of the Hamilton Funds of the Bank of New York (2006-2007) and of Arcadia Resources Inc. (health care services and products, 2007-2012). |
Robert W. Selander (1950) |
Year of Election or Appointment: 2011 Trustee |
| Mr. Selander also serves as Trustee of other Fidelity funds. Previously, Mr. Selander served as a Member of the Advisory Board of other Fidelity funds (2011), and Executive Vice Chairman (2010), Chief Executive Officer (2009-2010), and President and Chief Executive Officer (1997-2009) of Mastercard, Inc. |
Cornelia M. Small (1944) |
Year of Election or Appointment: 2005 Trustee |
| Ms. Small also serves as Trustee of other Fidelity funds. Ms. Small is a member of the Board of Directors (2009-present) and Chair of the Investment Committee (2010-present) of the Teagle Foundation. Ms. Small also serves on the Investment Committee of the Berkshire Taconic Community Foundation (2008-present). Previously, Ms. Small served as Chairperson (2002-2008) and a member of the Investment Committee and Chairperson (2008-2012) and a member of the Board of Trustees of Smith College. In addition, Ms. Small served as Chief Investment Officer, Director of Global Equity Investments, and a member of the Board of Directors of Scudder, Stevens & Clark and Scudder Kemper Investments. |
William S. Stavropoulos (1939) |
Year of Election or Appointment: 2002 Trustee Vice Chairman of the Independent Trustees |
| Mr. Stavropoulos also serves as Trustee of other Fidelity funds. Mr. Stavropoulos serves as President and Founder of the Michigan Baseball Foundation, the Great Lakes Loons (2007-present). Mr. Stavropoulos is Chairman Emeritus of the Board of Directors of The Dow Chemical Company, where he previously served in numerous senior management positions, including President, CEO (1995-2000; 2002-2004), Chairman of the Executive Committee (2000-2006), and as a member of the Board of Directors (1990-2006). Currently, Mr. Stavropoulos is Chairman of the Board of Directors of Univar Inc. (global distributor of commodity and specialty chemicals), a Director of Teradata Corporation (data warehousing and technology solutions), and Maersk Inc. (industrial conglomerate), and a member of the Advisory Board for Metalmark Capital LLC (private equity investment, 2005-present). Mr. Stavropoulos is an operating advisor to Clayton, Dubilier & Rice, LLC (private equity investment). In addition, Mr. Stavropoulos is a member of the University of Notre Dame Advisory Council for the College of Science, a Trustee of the Rollin L. Gerstacker Foundation, and a Director of the Naples Philharmonic Center for the Arts. Previously, Mr. Stavropoulos served as a Director of Chemical Financial Corporation (bank holding company, 1993-2012) and Tyco International, Ltd. (multinational manufacturing and services, 2007-2012). |
David M. Thomas (1949) |
Year of Election or Appointment: 2008 Trustee |
| Mr. Thomas also serves as Trustee of other Fidelity funds. Mr. Thomas serves as Non-Executive Chairman of the Board of Directors of Fortune Brands Home and Security (home and security products, 2011-present), and as a member of the Board of Directors of Interpublic Group of Companies, Inc. (marketing communication, 2004-present). Previously, Mr. Thomas served as Executive Chairman (2005-2006) and Chairman and Chief Executive Officer (2000-2005) of IMS Health, Inc. (pharmaceutical and healthcare information solutions), and a Director of Fortune Brands, Inc. (consumer products, 2000-2011). |
+ The information above includes each Trustee's principal occupation during the last five years and other information relating to the experience, attributes, and skills relevant to each Trustee's qualifications to serve as a Trustee, which led to the conclusion that each Trustee should serve as a Trustee for the fund.
Advisory Board Member and Officers:
Correspondence intended for each officer and Peter S. Lynch may be sent to Fidelity Investments, 245 Summer Street, Boston, Massachusetts 02210. Officers appear below in alphabetical order.
Name, Year of Birth; Principal Occupation |
Peter S. Lynch (1944) |
Year of Election or Appointment: 2003 Member of the Advisory Board |
| Mr. Lynch also serves as Member of the Advisory Board of other Fidelity funds. Mr. Lynch is Vice Chairman and a Director of FMR and FMR Co., Inc. In addition, Mr. Lynch serves as a Trustee of Boston College and as the Chairman of the Inner-City Scholarship Fund. Previously, Mr. Lynch served on the Special Olympics International Board of Directors (1997-2006). |
Elizabeth Paige Baumann (1968) |
Year of Election or Appointment: 2012 Anti-Money Laundering (AML) Officer |
| Ms. Baumann also serves as AML Officer of other funds. She is Chief AML Officer of FMR LLC (2012-present) and is an employee of Fidelity Investments. Previously, Ms. Baumann served as Vice President and Deputy Anti-Money Laundering Officer (2007-2012). |
William C. Coffey (1969) |
Year of Election or Appointment: 2009 Assistant Secretary |
| Mr. Coffey also serves as Assistant Secretary of other funds. He is Senior Vice President and Deputy General Counsel of FMR LLC (2010-present), and is an employee of Fidelity Investments. Previously, Mr. Coffey served as Vice President and Associate General Counsel of FMR LLC (2005-2009). |
Jonathan Davis (1968) |
Year of Election or Appointment: 2010 Assistant Treasurer |
| Mr. Davis also serves as Assistant Treasurer of other funds. Mr. Davis is an employee of Fidelity Investments. Previously, Mr. Davis served as Vice President and Associate General Counsel of FMR LLC (2003-2010). |
Adrien E. Deberghes (1967) |
Year of Election or Appointment: 2008 Deputy Treasurer |
| Mr. Deberghes also serves as an officer of other funds. He is an employee of Fidelity Investments (2008-present). Prior to joining Fidelity Investments, Mr. Deberghes was Senior Vice President of Mutual Fund Administration at State Street Corporation (2007-2008), Senior Director of Mutual Fund Administration at Investors Bank & Trust (2005-2007), and Director of Finance for Dunkin' Brands (2000-2005). |
Stephanie J. Dorsey (1969) |
Year of Election or Appointment: 2010 Assistant Treasurer |
| Ms. Dorsey also serves as an officer of other funds. She is an employee of Fidelity Investments (2008-present) and has served in other fund officer roles. Prior to joining Fidelity Investments, Ms. Dorsey served as Treasurer (2004-2008) of the JPMorgan Mutual Funds and Vice President (2004-2008) of JPMorgan Chase Bank. |
Howard J. Galligan III (1966) |
Year of Election or Appointment: 2014 Chief Financial Officer |
| Mr. Galligan also serves as Chief Financial Officer of other funds. Mr. Galligan serves as President of Fidelity Pricing and Cash Management Services (FPCMS) (2014-present) and as a Director of Strategic Advisers, Inc. (2008-present). Previously, Mr. Galligan served as Chief Administrative Officer of Asset Management (2011-2014) and Chief Operating Officer and Senior Vice President of Investment Support for Strategic Advisers, Inc. (2003-2011). |
Scott C. Goebel (1968) |
Year of Election or Appointment: 2008 Secretary and Chief Legal Officer (CLO) |
| Mr. Goebel serves as Secretary and CLO of other funds. Mr. Goebel also serves as Secretary of Fidelity SelectCo, LLC (2013-present), Fidelity Investments Money Management, Inc. (FIMM) (2010-present) and Fidelity Research and Analysis Company (FRAC) (2010-present); General Counsel, Secretary, and Senior Vice President of FMR (2008-present) and FMR Co., Inc. (2008-present); Chief Legal Officer of Fidelity Management & Research (Hong Kong) Limited (2008-present); and Assistant Secretary of Fidelity Management & Research (Japan) Inc. (2008-present) and Fidelity Management & Research (U.K.) Inc. (2008-present). Previously, Mr. Goebel served as Secretary and CLO of other Fidelity funds (2008-2013), Assistant Secretary of FIMM (2008-2010), FRAC (2008-2010), and certain funds (2007-2008); and as Vice President and Secretary of Fidelity Distributors Corporation (FDC) (2005-2007). Mr. Goebel has been employed by FMR LLC or an affiliate since 2001. |
Thomas C. Hense (1964) |
Year of Election or Appointment: 2008/2010 Vice President |
| Mr. Hense also serves as Vice President of other funds (High Income (2008), Small Cap (2008), and Value (2010) funds). Previously, Mr. Hense served as a portfolio manager for Fidelity's Institutional Money Management Group (Pyramis) (2003-2008). |
Brian B. Hogan (1964) |
Year of Election or Appointment: 2009 Vice President |
| Mr. Hogan also serves as Trustee or Vice President of other funds. Mr. Hogan serves as President of FMR's Equity Division (2009-present). Previously, Mr. Hogan served as Senior Vice President, Equity Research of FMR (2006-2009) and as a portfolio manager. |
Chris Maher (1972) |
Year of Election or Appointment: 2013 Assistant Treasurer |
| Mr. Maher serves as Assistant Treasurer of other funds. Mr. Maher is Vice President of Valuation Oversight and is an employee of Fidelity Investments. Previously, Mr. Maher served as Vice President of Asset Management Compliance (2013), Vice President of FMR's Program Management Group (2010-2013), and Vice President of Valuation Oversight (2008-2010). |
Kenneth B. Robins (1969) |
Year of Election or Appointment: 2008 President and Treasurer |
| Mr. Robins also serves as an officer of other funds. Mr. Robins serves as Executive Vice President of Fidelity Investments Money Management, Inc. (FIMM) (2013-present) and is an employee of Fidelity Investments (2004-present). Previously, Mr. Robins served in other fund officer roles. |
Stephen Sadoski (1971) |
Year of Election or Appointment: 2012 Deputy Treasurer |
| Mr. Sadoski also serves as Deputy Treasurer of other funds. He is an employee of Fidelity Investments (2012-present) and has served in another fund officer role. Prior to joining Fidelity Investments, Mr. Sadoski served as an assistant chief accountant in the Division of Investment Management of the Securities and Exchange Commission (SEC) (2009-2012) and as a senior manager at Deloitte & Touche LLP (1997-2009). |
Stacie M. Smith (1974) |
Year of Election or Appointment: 2013 Deputy Treasurer |
| Ms. Smith also serves as an officer of other funds. She is an employee of Fidelity Investments (2009-present) and has served in other fund officer roles. Prior to joining Fidelity Investments, Ms. Smith served as Senior Audit Manager of Ernst & Young LLP (1996-2009). |
Renee Stagnone (1975) |
Year of Election or Appointment: 2013 Deputy Treasurer |
| Ms. Stagnone also serves as Deputy Treasurer of other funds. Ms. Stagnone is an employee of Fidelity Investments. |
Linda J. Wondrack (1964) |
Year of Election or Appointment: 2014 Chief Compliance Officer |
| Ms. Wondrack also serves as Chief Compliance Officer of other funds. Ms. Wondrack is Executive Vice President and head of the Ethics Office and Asset Management Compliance for Fidelity Investments (2012-present). Ms. Wondrack also serves as Chief Compliance Officer of Fidelity SelectCo, LLC (2014-present); Chief Compliance Officer of Impresa Management LLC (2013-present); and Chief Compliance Officer of FMR Co., Inc., Fidelity Investments Money Management, Inc., Fidelity Management & Research (Japan) Inc., Fidelity Management & Research (U.K.) Inc., Fidelity Management & Research (Hong Kong), Fidelity Management & Research Company, Pyramis Global Advisors, LLC, and Strategic Advisers, Inc., Ballyrock Investment Advisors LLC, and Northern Neck Investors LLC (2012-present). Previously, Ms. Wondrack served as Senior Vice President and Chief Compliance Officer for Columbia Management Investment Advisers, LLC (2005-2012); Chief Compliance Officer for certain funds within the Columbia Family of Funds (2007-2012); and Senior Vice President of Compliance Risk Management at Bank of America (2005-2010). |
Joseph F. Zambello (1957) |
Year of Election or Appointment: 2011 Deputy Treasurer |
| Mr. Zambello also serves as Deputy Treasurer of other funds. Mr. Zambello is an employee of Fidelity Investments. Previously, Mr. Zambello served as Vice President of FMR's Program Management Group (2009-2011) and Vice President of the Transfer Agent Oversight Group (2005-2009). |
Annual Report
The fund designates 100% of the dividends distributed during the fiscal year as qualifying for the dividends-received deduction for corporate shareholders.
The fund designates 100% of the dividends distributed during the fiscal year as amounts which may be taken into account as a dividend for the purposes of the maximum rate under section 1(h)(11) of the Internal Revenue Code.
The fund will notify shareholders in January 2015 of amounts for use in preparing 2014 income tax returns.
Annual Report
Board Approval of Investment Advisory Contracts and Management Fees
Fidelity Blue Chip Value Fund
Each year, the Board of Trustees, including the Independent Trustees (together, the Board), votes on the renewal of the management contract with Fidelity Management & Research Company (FMR) and the sub-advisory agreements (together, the Advisory Contracts) for the fund. The Board, assisted by the advice of fund counsel and Independent Trustees' counsel, requests and considers a broad range of information relevant to the renewal of the Advisory Contracts throughout the year.
The Board meets regularly and, at each of its meetings, covers an extensive agenda of topics and materials and considers factors that are relevant to its annual consideration of the renewal of the fund's Advisory Contracts, including the services and support provided to the fund and its shareholders. The Board has established various standing committees (Committees), each composed of and chaired by Independent Trustees with varying backgrounds, to which the Board has assigned specific subject matter responsibilities in order to enhance effective decision-making by the Board. The Board, acting directly and through its Committees, requests and receives information concerning the annual consideration of the renewal of the fund's Advisory Contracts. The Board also meets as needed to consider matters specifically related to the Board's annual consideration of the renewal of the Advisory Contracts. Members of the Board may also meet with trustees of other Fidelity funds through ad hoc joint committees to discuss certain matters relevant to the Fidelity funds.
At its July 2014 meeting, the Board, including the Independent Trustees, unanimously determined to renew the fund's Advisory Contracts. In reaching its determination, the Board considered all factors it believed relevant, including (i) the nature, extent, and quality of the services to be provided to the fund and its shareholders (including the investment performance of the fund); (ii) the competitiveness of the fund's management fee and total expense ratio relative to peer funds; (iii) the total costs of the services to be provided by and the profits to be realized by Fidelity from its relationship with the fund; (iv) the extent to which economies of scale exist and would be realized as the fund grows; and (v) whether fee levels reflect these economies of scale, if any, for the benefit of fund shareholders. In connection with separate internal corporate reorganizations involving Fidelity Management & Research (U.K.) Inc. (FMR U.K.) and Fidelity Management & Research (Japan) Inc. (FMR Japan), the Board approved certain non-material amendments to the fund's sub-advisory agreements with FMR U.K. and FMR Japan to reflect that, after these reorganizations, FMR Investment Management (UK) Limited and Fidelity Management & Research (Japan) Limited will carry on the business of FMR U.K. and FMR Japan, respectively. The Board noted that no changes to the portfolio managers or to the foreign research or investment advisory services provided to the fund were expected in connection with either reorganization and that the same personnel and resources would continue to be available to the fund at the new entities.
Annual Report
Board Approval of Investment Advisory Contracts and
Management Fees - continued
In considering whether to renew the Advisory Contracts for the fund, the Board reached a determination, with the assistance of fund counsel and Independent Trustees' counsel and through the exercise of its business judgment, that the renewal of the Advisory Contracts was in the best interests of the fund and its shareholders and that the compensation payable under the Advisory Contracts was fair and reasonable. The Board's decision to renew the Advisory Contracts was not based on any single factor, but rather was based on a comprehensive consideration of all the information provided to the Board at its meetings throughout the year. The Board, in reaching its determination to renew the Advisory Contracts, was aware that shareholders of the fund have a broad range of investment choices available to them, including a wide choice among funds offered by Fidelity's competitors, and that the fund's shareholders, who have the opportunity to review and weigh the disclosure provided by the fund in its prospectus and other public disclosures, have chosen to invest in this fund, which is part of the Fidelity family of funds.
Nature, Extent, and Quality of Services Provided. The Board considered Fidelity's staffing as it relates to the fund, including the backgrounds of investment personnel of FMR and the sub-advisers (together, the Investment Advisers), and also considered the fund's investment objective, strategies, and related investment philosophy. The Independent Trustees also had discussions with senior management of Fidelity's investment operations and investment groups. The Board considered the structure of the portfolio manager compensation program and whether this structure provides appropriate incentives to act in the best interests of the fund. Additionally, the Board considered the portfolio managers' investments, if any, in the funds that they manage.
Resources Dedicated to Investment Management and Support Services. The Board and the Fund Oversight and Research Committees reviewed the general qualifications and capabilities of Fidelity's investment staff, including its size, education, experience, and resources, as well as Fidelity's approach to recruiting, training, managing, and compensating investment personnel. The Board noted that Fidelity has continued to increase the resources devoted to non-U.S. offices, including expansion of Fidelity's global investment organization. The Board also noted that Fidelity's analysts have extensive resources, tools and capabilities that allow them to conduct sophisticated quantitative and fundamental analysis, as well as credit analysis of issuers, counterparties and guarantors. Further, the Board believes that Fidelity's investment professionals have sufficient access to global information and data so as to provide competitive investment results over time, and that those professionals also have access to sophisticated tools that permit them to assess portfolio construction and risk and performance attribution characteristics continuously, as well as to transmit new information and research conclusions rapidly around the world. Additionally, in its deliberations, the Board considered Fidelity's trading and risk management capabilities and resources and global compliance infrastructure, which are an integral part of the investment management process.
Annual Report
Shareholder and Administrative Services. The Board considered (i) the nature, extent, quality, and cost of advisory, administrative, and shareholder services performed by the Investment Advisers and their affiliates under the Advisory Contracts and under separate agreements covering transfer agency, pricing and bookkeeping, and securities lending services for the fund; (ii) the nature and extent of the supervision of third party service providers, principally custodians and subcustodians; and (iii) the resources devoted to, and the record of compliance with, the fund's compliance policies and procedures. The Board also reviewed the allocation of fund brokerage, including allocations to brokers affiliated with the Investment Advisers, the use of brokerage commissions to pay fund expenses, and the use of "soft" commission dollars to pay for research services.
The Board noted that the growth of fund assets over time across the complex allows Fidelity to reinvest in the development of services designed to enhance the value or convenience of the Fidelity funds as investment vehicles. These services include 24-hour access to account information and market information through telephone representatives and over the Internet, investor education materials and asset allocation tools, and the expanded availability of Fidelity Investor Centers.
In 2014, the Board formed an ad hoc Committee on Transfer Agency Fees to review the variety of transfer agency fee structures throughout the industry and Fidelity's competitive positioning with respect to industry participants.
Investment in a Large Fund Family. The Board considered the benefits to shareholders of investing in a Fidelity fund, including the benefits of investing in a fund that is part of a large family of funds offering a variety of investment disciplines and providing a large variety of mutual fund investor services. The Board noted that Fidelity had taken, or had made recommendations that resulted in the Fidelity funds taking, a number of actions over the previous year that benefited particular funds, including (i) continuing to dedicate additional resources to investment research and to the support of the senior management team that oversees asset management; (ii) persisting in efforts to enhance Fidelity's global research capabilities; (iii) launching new funds and making other enhancements to meet client needs for income-oriented solutions; (iv) reducing fund expenses for certain index funds; (v) continuing to launch dedicated lower cost underlying funds to meet portfolio construction needs related to expanding underlying fund options for Fidelity funds of funds, specifically for the Freedom Fund product lines; (vi) rationalizing product lines and gaining increased efficiencies through fund mergers; (vii) launching sector-based exchange-traded funds and establishing a new Fidelity adviser to manage sector-based funds and products; (viii) continuing to develop and implement technology to improve security and increase efficiency; (ix) modifying the eligibility criteria for certain share classes to increase their marketability to a portion of the defined contribution plan market; (x) waiving redemption fees for certain qualified fund-of-fund and wrap programs and certain retirement plan transactions; and (xi) launching new Institutional Class shares of certain money market funds to attract and retain assets and to fill a gap in the money market fund lineup.
Annual Report
Board Approval of Investment Advisory Contracts and
Management Fees - continued
Investment Performance. The Board considered whether the fund has operated in accordance with its investment objective, as well as its record of compliance with its investment restrictions and its performance history.
The Board took into account discussions with the Investment Advisers about fund investment performance that occur at Board meetings throughout the year. In this regard the Board noted that as part of regularly scheduled fund reviews and other reports to the Board on fund performance, the Board periodically considers annualized return information for the fund, for different time periods, measured against a securities market index ("benchmark index") and a peer group of funds with similar objectives ("peer group"). In its evaluation of fund investment performance, the Board gave particular attention to information indicating changes in performance of certain Fidelity funds for specific time periods and the Investment Advisers' explanations for any overperformance or underperformance.
In addition to reviewing absolute and relative fund performance, the Independent Trustees periodically consider the appropriateness of fund performance metrics in evaluating the results achieved. In general, the Independent Trustees believe that fund performance should be evaluated based on net performance (after fees and expenses) of both the highest performing and lowest performing classes, where applicable, compared to appropriate benchmark indices, over appropriate time periods which may include full market cycles, and compared to peer groups, as applicable, over the same periods, taking into account relevant factors including the following: general market conditions; issuer-specific information; tactical opportunities for investment; and fund cash flows and other factors.
The Independent Trustees recognize that shareholders evaluate performance on a net basis over their own holding periods, for which one-, three-, and five-year periods are often used as a proxy. For this reason, the performance information reviewed by the Board also included net cumulative calendar year total return information for the fund and an appropriate benchmark index and peer group for the most recent one-, three-, and five-year periods, as shown below. Returns are shown compared to the 25th percentile (top of box, 75% beaten) and 75th percentile (bottom of box, 25% beaten) of the peer universe.
Annual Report
Fidelity Blue Chip Value Fund
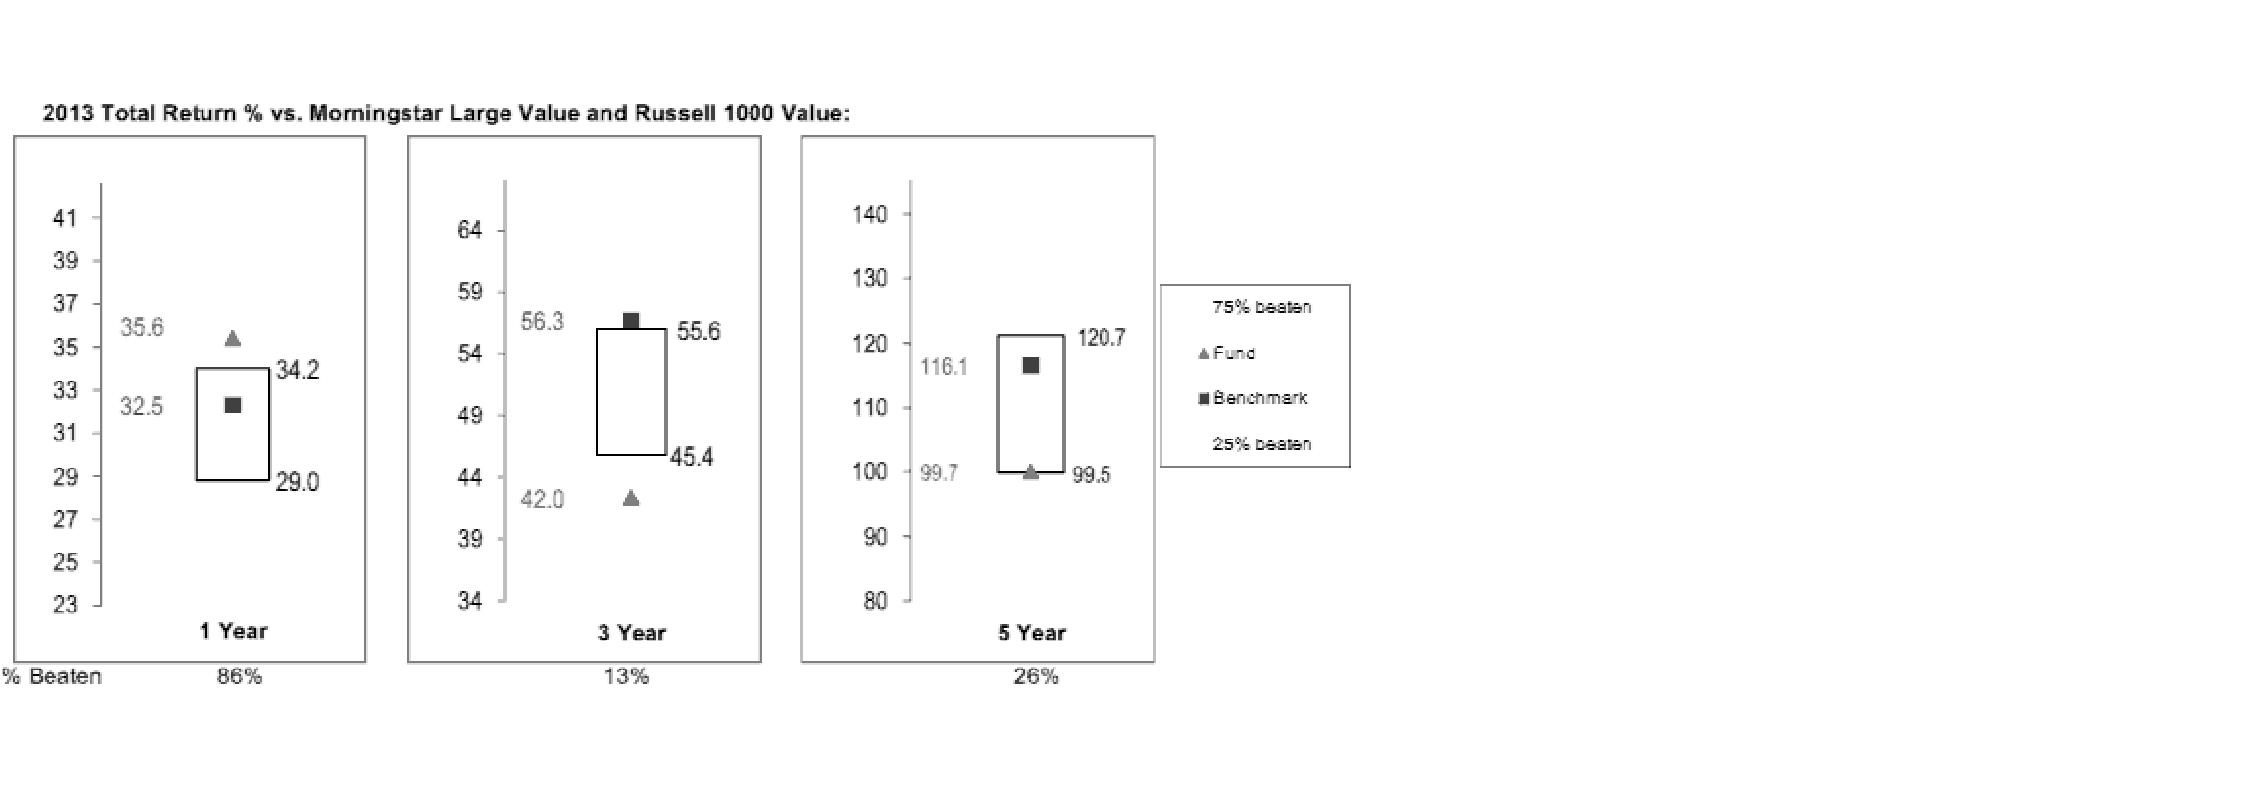
The Board also considered that the fund's management fee is subject to upward or downward adjustment depending upon whether, and to what extent, the fund's investment performance for the performance period exceeds, or is exceeded by, a securities index, thus leading to a performance adjustment for the same period. The Board noted that the performance adjustment provides FMR with a strong economic incentive to seek to achieve superior performance for the fund's shareholders and helps to more closely align the interests of FMR and the fund's shareholders.
Based on its review, the Board concluded that the nature, extent, and quality of services provided to the fund under the Advisory Contracts should benefit the fund's shareholders.
Competitiveness of Management Fee and Total Expense Ratio. The Board considered the fund's management fee and total expense ratio compared to "mapped groups" of competitive funds and classes. Fidelity creates "mapped groups" by combining similar Lipper investment objective categories that have comparable investment mandates. Combining Lipper investment objective categories aids the Board's management fee and total expense ratio comparisons by broadening the competitive group used for comparison and by reducing the number of universes to which various Fidelity funds are compared.
Management Fee. The Board considered two proprietary management fee comparisons for the 12-month periods shown in the chart below. The group of Lipper funds used by the Board for management fee comparisons is referred to below as the "Total Mapped Group." The Total Mapped Group comparison focuses on a fund's standing in terms of gross management fees before expense reimbursements or caps, and without giving effect to the fund's performance adjustment, relative to the total universe of funds with comparable investment mandates, regardless of whether their management fee structures also are comparable. Funds with comparable investment mandates offer exposure to similar types of securities. Funds with comparable management fee structures have similar management fee contractual arrangements (e.g., flat rate charged for advisory services, all-inclusive fee rate, etc.). "TMG %" represents the percentage of funds in the Total Mapped Group that had management fees that were lower than the fund's. For example, a hypothetical TMG % of 20% would mean that 80% of the funds in the Total Mapped Group had higher, and 20% had lower, management fees than the fund. The fund's actual TMG %s are in the chart below. The "Asset-Size Peer Group" (ASPG) comparison focuses on a fund's standing relative to a subset of non-Fidelity funds within the Total Mapped Group that are similar in size and management fee structure. For example, if a fund is in the first quartile of the ASPG, the fund's management fee ranks in the least expensive or lowest 25% of funds in the ASPG. The ASPG represents at least 15% of the funds in the Total Mapped Group with comparable asset size and management fee structures, subject to a minimum of 50 funds (or all funds in the Total Mapped Group if fewer than 50). Additional information, such as the ASPG quartile in which the fund's management fee rate ranked and the impact of the fund's performance adjustment, is also included in the chart and considered by the Board.
Annual Report
Board Approval of Investment Advisory Contracts and
Management Fees - continued
Fidelity Blue Chip Value Fund
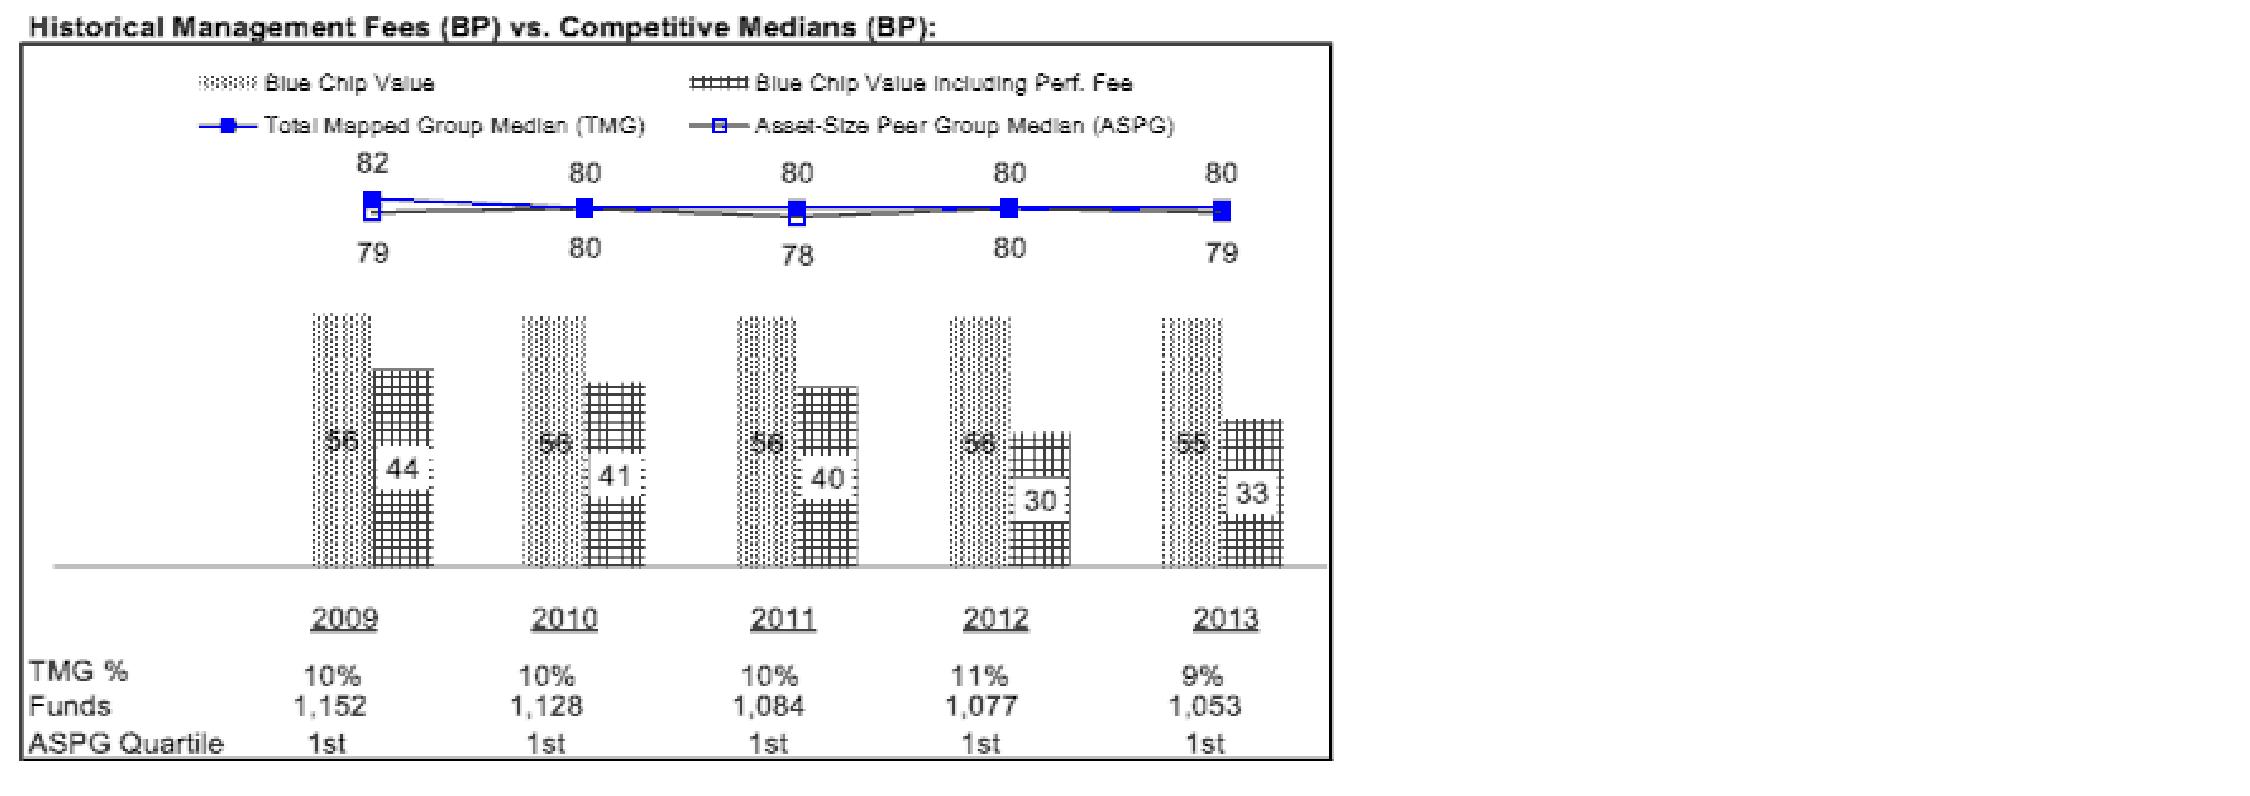
The Board noted that the fund's management fee rate ranked below the median of its Total Mapped Group and below the median of its ASPG for 2013. The Board also noted the effect of the fund's negative performance adjustment on the fund's management fee ranking.
Annual Report
The Board also noted that, in August 2013, the ad hoc Committee on Management Fees was formed to conduct an in-depth review of the management fee rates of Fidelity's active equity mutual funds. The Committee focused on the following areas: (i) standard fee structures; (ii) research consumption and trading evolution; (iii) management fee competitiveness/profitability by category; and (iv) factors that drive institutional pricing.
Based on its review, the Board concluded that the fund's management fee is fair and reasonable in light of the services that the fund receives and the other factors considered.
Total Expense Ratio. In its review of the fund's total expense ratio, the Board considered the fund's management fee as well as other fund expenses, such as transfer agent fees, pricing and bookkeeping fees, and custodial, legal, and audit fees. The Board also noted the effects of any waivers and reimbursements on fees and expenses, as well as the impact of the fund's performance adjustment. As part of its review, the Board also considered the current and historical total expense ratios of the fund compared to competitive fund median expenses. The fund is compared to those funds and classes in the Total Mapped Group (used by the Board for management fee comparisons) that have a similar sales load structure.
The Board noted that the fund's total expense ratio ranked below its competitive median for 2013.
Fees Charged to Other Fidelity Clients. The Board also considered Fidelity fee structures and other information with respect to clients of Fidelity, such as other funds advised or subadvised by Fidelity, pension plan clients, and other institutional clients. The Board noted the findings of the 2013 ad hoc joint committee (created with the board of other Fidelity funds), which reviewed and compared Fidelity's institutional investment advisory business with its business of providing services to the Fidelity funds, including the differences in services provided, fees charged, and costs incurred, as well as competition in their respective marketplaces.
Based on its review of total expense ratios and fees charged to other Fidelity clients, the Board concluded that the fund's total expense ratio was reasonable in light of the services that the fund and its shareholders receive and the other factors considered.
Costs of the Services and Profitability. The Board considered the revenues earned and the expenses incurred by Fidelity in conducting the business of developing, marketing, distributing, managing, administering and servicing the fund and servicing the fund's shareholders. The Board also considered the level of Fidelity's profits in respect of all the Fidelity funds.
Annual Report
Board Approval of Investment Advisory Contracts and
Management Fees - continued
On an annual basis, Fidelity presents to the Board Fidelity's profitability for the fund. Fidelity calculates the profitability for each fund, as well as aggregate profitability for groups of Fidelity funds and all Fidelity funds, using a series of detailed revenue and cost allocation methodologies which originate with the books and records of Fidelity on which Fidelity's audited financial statements are based. The Audit Committee of the Board reviews any significant changes from the prior year's methodologies.
PricewaterhouseCoopers LLP (PwC), independent registered public accounting firm and auditor to Fidelity and certain Fidelity funds, has been engaged annually by the Board as part of the Board's assessment of Fidelity's profitability analysis. PwC's engagement includes the review and assessment of the methodologies used by Fidelity in determining the revenues and expenses attributable to Fidelity's mutual fund business, and completion of agreed-upon procedures in respect of the mathematical accuracy of fund profitability and its conformity to established allocation methodologies. After considering PwC's reports issued under the engagement and information provided by Fidelity, the Board concluded that while other allocation methods may also be reasonable, Fidelity's profitability methodologies are reasonable in all material respects.
The Board also reviewed Fidelity's non-fund businesses and fall-out benefits related to the mutual fund business as well as cases where Fidelity's affiliates may benefit from or be related to the fund's business.
The Board considered the costs of the services provided by and the profits realized by Fidelity in connection with the operation of the fund and was satisfied that the profitability was not excessive in the circumstances.
Economies of Scale. The Board considered whether there have been economies of scale in respect of the management of the Fidelity funds, whether the Fidelity funds (including the fund) have appropriately benefited from any such economies of scale, and whether there is potential for realization of any further economies of scale. The Board considered the extent to which the fund will benefit from economies of scale through increased services to the fund, through waivers or reimbursements, or through fee or expense ratio reductions. The Board also noted that in 2013, it and the boards of other Fidelity funds created an ad hoc committee (the Economies of Scale Committee) to analyze whether Fidelity attains economies of scale in respect of the management and servicing of the Fidelity funds, whether the Fidelity funds have appropriately benefited from such economies of scale, and whether there is potential for realization of any further economies of scale.
The Board recognized that the fund's management contract incorporates a "group fee" structure, which provides for lower group fee rates as total group assets increase, and for higher group fee rates as total group assets decrease (with "group assets" defined to include fund assets under FMR's management plus sector fund assets previously under FMR's management and currently managed by Fidelity SelectCo, LLC). FMR calculates the group fee rates based on a tiered asset "breakpoint" schedule that varies based on asset class. The Board considered that the group fee is designed to deliver the benefits of economies of scale to fund shareholders when total Fidelity fund assets increase, even if assets of any particular fund are unchanged or have declined, because some portion of Fidelity's costs are attributable to services provided to all Fidelity funds, and all funds benefit if those costs can be allocated among more assets. The Board concluded that, given the group fee structure, fund shareholders will benefit from lower management fees as group assets increase at the fund complex level, regardless of whether Fidelity achieves any such economies of scale.
Annual Report
The Board concluded, taking into account the analysis of the Economies of Scale Committee, that economies of scale, if any, are being appropriately shared between fund shareholders and Fidelity.
Additional Information Requested by the Board. In order to develop fully the factual basis for consideration of the Fidelity funds' Advisory Contracts, the Board requested and received additional information on certain topics, including: (i) fund performance trends and Fidelity's long-term strategies for certain funds; (ii) Fidelity's strategic marketing and product lineup goals; (iii) the methodology with respect to competitive fund data and peer group classifications; (iv) the arrangements with, and performance of, certain sub-advisers on behalf of the Fidelity funds, as well as certain proposed participating affiliate arrangements; (v) the realization of fall-out benefits in certain Fidelity business units; (vi) Fidelity's group fee structures, including the rationale for the individual fee rates of certain categories of funds and the definition of group assets; (vii) trends regarding industry use of performance fee structures and the performance adjustment methodologies applicable to the Fidelity funds; (viii) additional competitive analysis regarding the total expenses for certain classes; (ix) fund profitability methodology, including Fidelity's cost allocation methodology, and the impact of certain factors on fund profitability results; and (x) the process by which Fidelity determines sub-advisory fees for funds it advises.
Based on its evaluation of all of the conclusions noted above, and after considering all factors it believed relevant, the Board ultimately concluded that the advisory fee structures are fair and reasonable, and that the fund's Advisory Contracts should be renewed.
Annual Report
Investment Adviser
Fidelity Management & Research Company
Boston, MA
Investment Sub-Advisers
FMR Co., Inc.
Fidelity Management & Research
(U.K.) Inc.
Fidelity Management & Research
(Japan) Inc.
Fidelity Management & Research
(Hong Kong) Limited
General Distributor
Fidelity Distributors Corporation
Smithfield, RI
Transfer and Service Agents
Fidelity Investments Institutional
Operations Company, Inc.
Boston, MA
Fidelity Service Company, Inc.
Boston, MA
Custodian
Brown Brothers Harriman & Co.
Boston, MA
The Fidelity Telephone Connection
Mutual Fund 24-Hour Service
Exchanges/Redemptions
and Account Assistance 1-800-544-6666
Product Information 1-800-544-6666
Retirement Accounts 1-800-544-4774
(8 a.m. - 9 p.m.)
TDD Service 1-800-544-0118
for the deaf and hearing impaired
(9 a.m. - 9 p.m. Eastern time)
Fidelity Automated Service
Telephone (FAST®)
1-800-544-5555
Automated line for quickest service
(Fidelity Investment logo)(registered trademark)
Corporate Headquarters
245 Summer St., Boston, MA 02210
www.fidelity.com
BCV-UANN-0914
1.789709.111
Fidelity®
Blue Chip Growth
Fund
Annual Report
July 31, 2014
(Fidelity Cover Art)
Contents
Performance | (Click Here) | How the fund has done over time. |
Management's Discussion of Fund Performance | (Click Here) | The Portfolio Manager's review of fund performance and strategy. |
Shareholder Expense Example | (Click Here) | An example of shareholder expenses. |
Investment Changes | (Click Here) | A summary of major shifts in the fund's investments over the past six months. |
Investments | (Click Here) | A complete list of the fund's investments with their market values. |
Financial Statements | (Click Here) | Statements of assets and liabilities, operations, and changes in net assets, as well as financial highlights. |
Notes | (Click Here) | Notes to the financial statements. |
Report of Independent Registered Public Accounting Firm | (Click Here) | |
Trustees and Officers | (Click Here) | |
Distributions | (Click Here) | |
Board Approval of Investment Advisory Contracts and Management Fees | (Click Here) | |
To view a fund's proxy voting guidelines and proxy voting record for the 12-month period ended June 30, visit http://www.fidelity.com/proxyvotingresults or visit the Securities and Exchange Commission's (SEC) web site at http://www.sec.gov. You may also call 1-800-544-8544 to request a free copy of the proxy voting guidelines.
Standard & Poor's, S&P and S&P 500 are registered service marks of The McGraw-Hill Companies, Inc. and have been licensed for use by Fidelity Distributors Corporation.
Other third-party marks appearing herein are the property of their respective owners.
All other marks appearing herein are registered or unregistered trademarks or service marks of FMR LLC or an affiliated company. © 2014 FMR LLC. All rights reserved.
Annual Report
This report and the financial statements contained herein are submitted for the general information of the shareholders of the fund. This report is not authorized for distribution to prospective investors in the fund unless preceded or accompanied by an effective prospectus.
A fund files its complete schedule of portfolio holdings with the SEC for the first and third quarters of each fiscal year on Form N-Q. Forms N-Q are available on the SEC's web site at http://www.sec.gov. A fund's Forms N-Q may be reviewed and copied at the SEC's Public Reference Room in Washington, DC. Information regarding the operation of the SEC's Public Reference Room may be obtained by calling 1-800-SEC-0330. For a complete list of a fund's portfolio holdings, view the most recent holdings listing, semiannual report, or annual report on Fidelity's web site at http://www.fidelity.com, http://www.advisor.fidelity.com, or http://www.401k.com, as applicable.
NOT FDIC INSURED • MAY LOSE VALUE • NO BANK GUARANTEE
Neither the fund nor Fidelity Distributors Corporation is a bank.
Annual Report
Average annual total return reflects the change in the value of an investment, assuming reinvestment of the class' distributions from dividend income and capital gains (the profits earned upon the sale of securities that have grown in value, if any) and assuming a constant rate of performance each year. The $10,000 table and the fund's returns do not reflect the deduction of taxes that a shareholder would pay on fund distributions or the redemption of fund shares. During periods of reimbursement by Fidelity, a fund's total return will be greater than it would be had the reimbursement not occurred. How a fund did yesterday is no guarantee of how it will do tomorrow.
Average Annual Total Returns
Periods ended July 31, 2014 | Past 1
year | Past 5
years | Past 10
years |
Fidelity® Blue Chip Growth Fund | 21.07% | 19.20% | 9.14% |
$10,000 Over 10 Years
Let's say hypothetically that $10,000 was invested in Fidelity® Blue Chip Growth Fund, a class of the fund, on July 31, 2004. The chart shows how the value of your investment would have changed, and also shows how the Russell 1000® Growth Index performed over the same period.
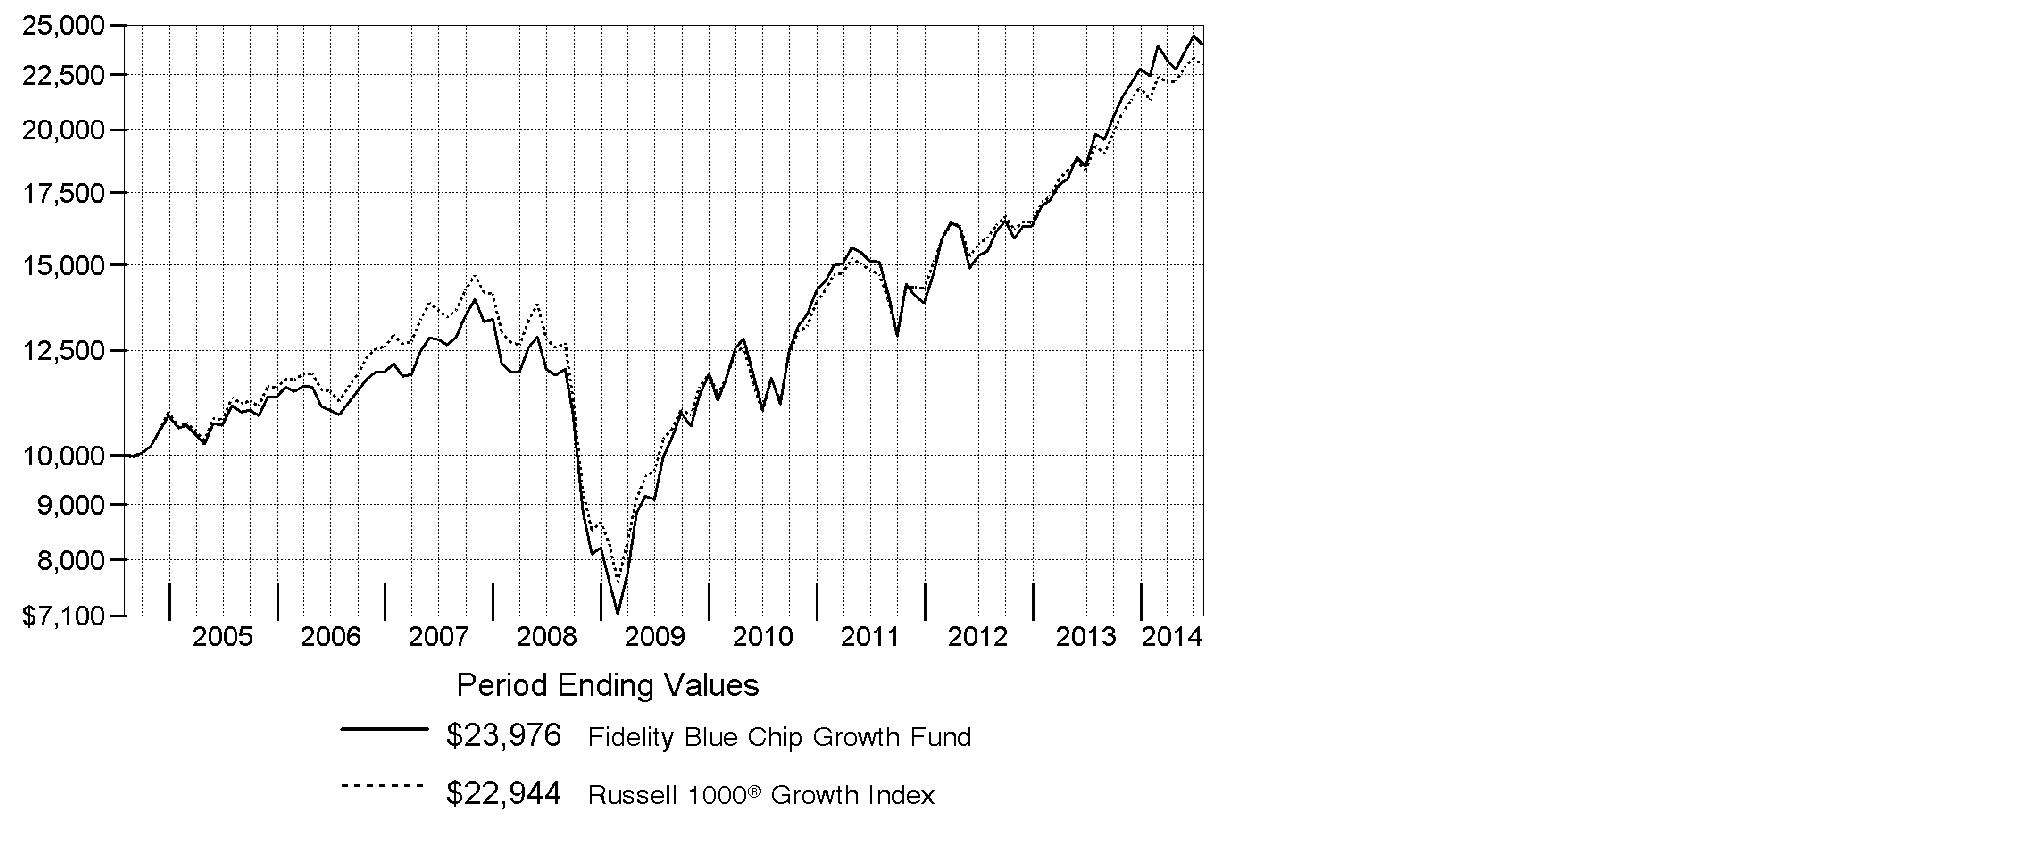
Annual Report
Market Recap: U.S. stocks overcame a slowing economy early in 2014 to post a strong gain for the 12-month period ending July 31, 2014, supported by corporate profits and continued low interest rates. The S&P 500® Index rose 16.94%, reaching an all-time high near period end. The technology-heavy Nasdaq Composite Index® gained 22.00%. The Russell 2000® Index returned 8.56%, reflecting the relatively lackluster performance of small-cap stocks. Information technology (+28%) was the top-performing sector within the S&P 500®, driven by strong semiconductor and computer hardware sales. Materials (+23%) gained amid higher prices for many commodity products. Health care (+21%) rose, driven by gains in pharmaceuticals, biotechnology & life sciences companies. Energy stocks (+19%) advanced in the latter part of the period amid healthy U.S. output and the threat of supply disruptions in Iraq. Conversely, most defensive sectors, including consumer staples, utilities and telecommunication services, lagged the broader market. Volatility remained tame throughout most of the period, with markets supported by declining unemployment, near-record profit margins for companies, muted cost inflation and fairly low corporate debt levels. Geopolitical tension remained a concern at period end, with conflict in Ukraine and strained relations between Russia and the West posing a potential threat to global growth.
Comments from Sonu Kalra, Portfolio Manager of Fidelity® Blue Chip Growth Fund: For the year, the fund's Retail Class shares advanced 21.07%, outpacing the 18.69% gain of the Russell 1000® Growth Index. Security selection in the software & services industry helped the most, including social networking firm Facebook, our largest position, on average, and the fund's largest relative contributor. Strong revenue from its mobile advertising business helped Facebook produce much better-than-expected first- and second-quarter 2014 earnings and sales results, lifting its stock. Notably, Facebook's increasing popularity among consumers, including its website and mobile application, boosted its share of advertising dollars. I continued to believe in the company's growth potential due to its massive reach and its ability to target ads to very specific consumers. Conversely, not owning enough of software and index giant Microsoft hurt results. Shares began to rally just before the start of the period after the firm reported sales greater than analysts' estimates. The stock was further driven by an improved macroeconomic environment and a stabilizing market for personal computers. The company also appointed a new CEO in February, a move that prompted us to add to our position in the stock, even though Microsoft remained an underweighting at period end.
The views expressed above reflect those of the portfolio manager(s) only through the end of the period as stated on the cover of this report and do not necessarily represent the views of Fidelity or any other person in the Fidelity organization. Any such views are subject to change at any time based upon market or other conditions and Fidelity disclaims any responsibility to update such views. These views may not be relied on as investment advice and, because investment decisions for a Fidelity fund are based on numerous factors, may not be relied on as an indication of trading intent on behalf of any Fidelity fund.
Annual Report
Shareholder Expense Example
As a shareholder of the Fund, you incur two types of costs: (1) transaction costs and (2) ongoing costs, including management fees and other Fund expenses. This Example is intended to help you understand your ongoing costs (in dollars) of investing in the Fund and to compare these costs with the ongoing costs of investing in other mutual funds.
The Example is based on an investment of $1,000 invested at the beginning of the period and held for the entire period (February 1, 2014 to July 31, 2014).
Actual Expenses
The first line of the accompanying table for each class of the Fund provides information about actual account values and actual expenses. You may use the information in this line, together with the amount you invested, to estimate the expenses that you paid over the period. Simply divide your account value by $1,000.00 (for example, an $8,600 account value divided by $1,000.00 = 8.6), then multiply the result by the number in the first line for a class of the Fund under the heading entitled "Expenses Paid During Period" to estimate the expenses you paid on your account during this period. A small balance maintenance fee of $12.00 that is charged once a year may apply for certain accounts with a value of less than $2,000. This fee is not included in the table below. If it was, the estimate of expenses you paid during the period would be higher, and your ending account value lower, by this amount. In addition, the Fund, as a shareholder in the underlying Fidelity Central Funds, will indirectly bear its pro-rata share of the fees and expenses incurred by the underlying Fidelity Central Funds. These fees and expenses are not included in the Fund's annualized expense ratio used to calculate the expense estimate in the table below.
Hypothetical Example for Comparison Purposes
The second line of the accompanying table for each class of the Fund provides information about hypothetical account values and hypothetical expenses based on a Class' actual expense ratio and an assumed rate of return of 5% per year before expenses, which is not the Class' actual return. The hypothetical account values and expenses may not be used to estimate the actual ending account balance or expenses you paid for the period. You may use this information to compare the ongoing costs of investing in the Fund and other funds. To do so, compare this 5% hypothetical example with the 5% hypothetical examples that appear in the shareholder reports of the other funds. A small balance maintenance fee of $12.00 that is charged once a year may apply for certain accounts with a value of less than $2,000. This fee is not included in the table below. If it was, the estimate of expenses you paid during the period would be higher, and your ending account value lower, by this amount. In addition, the Fund, as a shareholder in the underlying Fidelity Central Funds, will indirectly bear its pro-rata share of the fees and expenses incurred by the underlying Fidelity Central Funds. These fees and expenses are not included in the Fund's annualized expense ratio used to calculate the expense estimate in the table below.
Please note that the expenses shown in the table are meant to highlight your ongoing costs only and do not reflect any transaction costs. Therefore, the second line of the table is useful in comparing ongoing costs only, and will not help you determine the relative total costs of owning different funds.
Annual Report
Shareholder Expense Example - continued
| Annualized
Expense RatioB | Beginning
Account Value
February 1, 2014 | Ending
Account Value
July 31, 2014 | Expenses Paid
During Period*
February 1, 2014
to July 31, 2014 |
Blue Chip Growth | .80% | | | |
Actual | | $ 1,000.00 | $ 1,069.20 | $ 4.10 |
HypotheticalA | | $ 1,000.00 | $ 1,020.83 | $ 4.01 |
Class K | .68% | | | |
Actual | | $ 1,000.00 | $ 1,070.00 | $ 3.49 |
HypotheticalA | | $ 1,000.00 | $ 1,021.42 | $ 3.41 |
A 5% return per year before expenses
B Annualized expense ratio reflects expenses net of applicable fee waivers.
* Expenses are equal to each Class' annualized expense ratio, multiplied by the average account value over the period, multiplied by 181/365 (to reflect the one-half year period).
Annual Report
Investment Changes (Unaudited)
Top Ten Stocks as of July 31, 2014 |
| % of fund's
net assets | % of fund's net assets
6 months ago |
Apple, Inc. | 6.5 | 3.7 |
Google, Inc. Class A | 2.9 | 6.0 |
Gilead Sciences, Inc. | 2.7 | 3.1 |
Google, Inc. Class C | 2.7 | 0.0 |
Facebook, Inc. Class A | 2.4 | 2.8 |
Amazon.com, Inc. | 2.3 | 2.3 |
Home Depot, Inc. | 1.6 | 1.5 |
The Walt Disney Co. | 1.6 | 0.3 |
Keurig Green Mountain, Inc. | 1.5 | 1.3 |
Comcast Corp. Class A | 1.5 | 1.5 |
| 25.7 | |
Top Five Market Sectors as of July 31, 2014 |
| % of fund's
net assets | % of fund's net assets
6 months ago |
Information Technology | 33.5 | 31.1 |
Consumer Discretionary | 21.2 | 21.2 |
Health Care | 15.3 | 16.4 |
Industrials | 9.1 | 10.5 |
Consumer Staples | 8.9 | 10.3 |
Asset Allocation (% of fund's net assets) |
As of July 31, 2014* | As of January 31, 2014** |
| Stocks 99.3% | | | Stocks 99.8% | |
| Convertible
Securities 0.6% | | | Convertible
Securities 0.1% | |
| Short-Term
Investments and
Net Other Assets
(Liabilities) 0.1% | | | Short-Term
Investments and
Net Other Assets
(Liabilities) 0.1% | |
* Foreign investments | 10.8% | | ** Foreign investments | 9.8% | |

Annual Report
Investments July 31, 2014
Showing Percentage of Net Assets
Common Stocks - 99.3% |
| Shares | | Value (000s) |
CONSUMER DISCRETIONARY - 21.1% |
Auto Components - 0.4% |
Johnson Controls, Inc. | 549,600 | | $ 25,963 |
Magna International, Inc. Class A (sub. vtg.) | 319,725 | | 34,334 |
| | 60,297 |
Automobiles - 0.3% |
Mahindra & Mahindra Ltd. | 169,209 | | 3,331 |
Tesla Motors, Inc. (a)(e) | 202,856 | | 45,298 |
| | 48,629 |
Diversified Consumer Services - 0.5% |
H&R Block, Inc. | 1,229,500 | | 39,504 |
Kroton Educacional SA | 1,180,000 | | 31,425 |
ServiceMaster Global Holdings, Inc. | 490,500 | | 8,618 |
| | 79,547 |
Hotels, Restaurants & Leisure - 5.2% |
500.com Ltd. sponsored ADR Class A (e) | 342,236 | | 12,625 |
Buffalo Wild Wings, Inc. (a) | 77,538 | | 11,268 |
China Lodging Group Ltd. ADR (a) | 270,800 | | 6,756 |
Chipotle Mexican Grill, Inc. (a) | 228,417 | | 153,610 |
Domino's Pizza, Inc. | 116,300 | | 8,374 |
Dunkin' Brands Group, Inc. | 398,300 | | 17,071 |
Fiesta Restaurant Group, Inc. (a) | 253,700 | | 11,513 |
Hilton Worldwide Holdings, Inc. | 496,600 | | 12,023 |
Home Inns & Hotels Management, Inc. sponsored ADR (a) | 308,094 | | 10,993 |
Hyatt Hotels Corp. Class A (a) | 601,100 | | 35,363 |
Las Vegas Sands Corp. | 2,174,794 | | 160,609 |
Melco Crown Entertainment Ltd. sponsored ADR | 547,600 | | 18,180 |
MGM Mirage, Inc. (a) | 1,207,300 | | 32,404 |
Multimedia Games Holding Co., Inc. (a) | 263,585 | | 6,358 |
Panera Bread Co. Class A (a) | 344,256 | | 50,709 |
Starbucks Corp. | 2,555,922 | | 198,544 |
Whitbread PLC | 310,250 | | 22,539 |
Wynn Resorts Ltd. | 99,461 | | 21,205 |
Yum! Brands, Inc. | 1,023,649 | | 71,041 |
Zoe's Kitchen, Inc. (e) | 172,800 | | 5,013 |
| | 866,198 |
Household Durables - 0.4% |
D.R. Horton, Inc. | 1,166,200 | | 24,140 |
Whirlpool Corp. | 267,400 | | 38,142 |
| | 62,282 |
Common Stocks - continued |
| Shares | | Value (000s) |
CONSUMER DISCRETIONARY - continued |
Internet & Catalog Retail - 4.3% |
Amazon.com, Inc. (a) | 1,215,944 | | $ 380,578 |
Ctrip.com International Ltd. sponsored ADR (a) | 388,484 | | 24,875 |
Expedia, Inc. | 285,489 | | 22,674 |
Groupon, Inc. Class A (a)(e) | 1,564,200 | | 10,120 |
HomeAway, Inc. (a) | 376,500 | | 13,072 |
MakeMyTrip Ltd. (a) | 327,100 | | 9,901 |
Netflix, Inc. (a) | 66,623 | | 28,163 |
priceline.com, Inc. (a) | 156,700 | | 194,692 |
RetailMeNot, Inc. (e) | 223,500 | | 5,467 |
Vipshop Holdings Ltd. ADR (a) | 91,500 | | 18,807 |
| | 708,349 |
Leisure Products - 0.1% |
NJOY, Inc. (a)(f) | 1,178,168 | | 19,942 |
Media - 3.5% |
Comcast Corp. Class A | 4,620,836 | | 248,278 |
DISH Network Corp. Class A (a) | 221,600 | | 13,708 |
Lions Gate Entertainment Corp. | 285,400 | | 8,790 |
Naspers Ltd. Class N | 55,700 | | 6,912 |
The Walt Disney Co. | 3,018,200 | | 259,203 |
Time Warner Cable, Inc. | 118,545 | | 17,201 |
Time Warner, Inc. | 228,100 | | 18,937 |
| | 573,029 |
Multiline Retail - 1.1% |
Dollar General Corp. (a) | 165,700 | | 9,152 |
Macy's, Inc. | 1,396,785 | | 80,720 |
Target Corp. | 1,519,723 | | 90,560 |
| | 180,432 |
Specialty Retail - 3.7% |
Abercrombie & Fitch Co. Class A | 443,592 | | 17,451 |
AutoZone, Inc. (a) | 12,726 | | 6,580 |
Home Depot, Inc. | 3,296,500 | | 266,522 |
L Brands, Inc. | 754,082 | | 43,714 |
Lumber Liquidators Holdings, Inc. (a) | 195,600 | | 10,605 |
Murphy U.S.A., Inc. (a) | 792,770 | | 39,179 |
Restoration Hardware Holdings, Inc. (a) | 983,822 | | 80,467 |
Ross Stores, Inc. | 947,063 | | 60,991 |
TJX Companies, Inc. | 1,806,752 | | 96,282 |
| | 621,791 |
Common Stocks - continued |
| Shares | | Value (000s) |
CONSUMER DISCRETIONARY - continued |
Textiles, Apparel & Luxury Goods - 1.6% |
G-III Apparel Group Ltd. (a) | 65,000 | | $ 5,049 |
Kate Spade & Co. (a) | 1,493,804 | | 56,511 |
lululemon athletica, Inc. (a) | 369,881 | | 14,229 |
Michael Kors Holdings Ltd. (a) | 667,372 | | 54,377 |
NIKE, Inc. Class B | 556,575 | | 42,929 |
Pandora A/S | 240,500 | | 16,517 |
PVH Corp. | 424,176 | | 46,736 |
Ralph Lauren Corp. | 201,700 | | 31,437 |
Under Armour, Inc. Class A (sub. vtg.) (a) | 28,200 | | 1,882 |
| | 269,667 |
TOTAL CONSUMER DISCRETIONARY | | 3,490,163 |
CONSUMER STAPLES - 8.9% |
Beverages - 2.7% |
Anheuser-Busch InBev SA NV ADR | 444,891 | | 48,039 |
Monster Beverage Corp. (a) | 1,046,435 | | 66,930 |
PepsiCo, Inc. | 1,881,054 | | 165,721 |
The Coca-Cola Co. | 4,173,852 | | 163,991 |
| | 444,681 |
Food & Staples Retailing - 2.4% |
Costco Wholesale Corp. | 882,500 | | 103,729 |
CVS Caremark Corp. | 1,902,400 | | 145,267 |
Kroger Co. | 1,959,787 | | 95,990 |
Sprouts Farmers Market LLC (e) | 952,877 | | 29,072 |
Whole Foods Market, Inc. | 747,110 | | 28,555 |
| | 402,613 |
Food Products - 2.4% |
Associated British Foods PLC | 392,700 | | 18,418 |
Bunge Ltd. | 359,267 | | 28,325 |
Dean Foods Co. | 290,300 | | 4,447 |
Keurig Green Mountain, Inc. | 2,130,788 | | 254,160 |
Mead Johnson Nutrition Co. Class A | 885,994 | | 81,015 |
WhiteWave Foods Co. (a) | 470,269 | | 14,009 |
| | 400,374 |
Household Products - 0.6% |
Procter & Gamble Co. | 1,093,004 | | 84,511 |
Svenska Cellulosa AB (SCA) (B Shares) | 537,600 | | 13,288 |
| | 97,799 |
Common Stocks - continued |
| Shares | | Value (000s) |
CONSUMER STAPLES - continued |
Personal Products - 0.2% |
Coty, Inc. Class A | 521,400 | | $ 8,921 |
Herbalife Ltd. | 586,158 | | 30,715 |
Natura Cosmeticos SA | 89,700 | | 1,397 |
| | 41,033 |
Tobacco - 0.6% |
Lorillard, Inc. | 1,584,827 | | 95,850 |
TOTAL CONSUMER STAPLES | | 1,482,350 |
ENERGY - 5.0% |
Energy Equipment & Services - 1.0% |
Halliburton Co. | 2,035,876 | | 140,455 |
National Oilwell Varco, Inc. | 141,900 | | 11,500 |
Schlumberger Ltd. | 103,100 | | 11,175 |
Seventy Seven Energy, Inc. (a) | 17,719 | | 397 |
Transocean Partners LLC (a) | 113,800 | | 2,765 |
| | 166,292 |
Oil, Gas & Consumable Fuels - 4.0% |
Anadarko Petroleum Corp. | 908,400 | | 97,063 |
BG Group PLC | 317,500 | | 6,261 |
Cabot Oil & Gas Corp. | 297,078 | | 9,789 |
Canadian Natural Resources Ltd. | 297,800 | | 12,982 |
Carrizo Oil & Gas, Inc. (a) | 234,600 | | 14,407 |
Cheniere Energy, Inc. (a) | 220,880 | | 15,629 |
Chevron Corp. | 25,400 | | 3,283 |
Cimarex Energy Co. | 396,607 | | 55,136 |
Continental Resources, Inc. (a) | 434,000 | | 63,703 |
EOG Resources, Inc. | 832,524 | | 91,111 |
Golar LNG Ltd. | 143,000 | | 8,810 |
Hess Corp. | 293,178 | | 29,019 |
Marathon Petroleum Corp. | 185,900 | | 15,519 |
Memorial Resource Development Corp. | 276,000 | | 6,342 |
Navigator Holdings Ltd. (a) | 113,800 | | 3,169 |
Newfield Exploration Co. (a) | 986,600 | | 39,760 |
Phillips 66 Co. | 282,833 | | 22,941 |
Pioneer Natural Resources Co. | 451,000 | | 99,878 |
PrairieSky Royalty Ltd. | 191,600 | | 6,924 |
Rice Energy, Inc. | 543,200 | | 14,286 |
Scorpio Tankers, Inc. | 682,500 | | 6,409 |
Targa Resources Corp. | 69,700 | | 8,887 |
Common Stocks - continued |
| Shares | | Value (000s) |
ENERGY - continued |
Oil, Gas & Consumable Fuels - continued |
Teekay Corp. | 54,300 | | $ 3,022 |
Valero Energy Corp. | 414,944 | | 21,079 |
| | 655,409 |
TOTAL ENERGY | | 821,701 |
FINANCIALS - 4.6% |
Banks - 2.4% |
Axis Bank Ltd. | 953,180 | | 6,305 |
Bank of America Corp. | 6,449,587 | | 98,356 |
Citigroup, Inc. | 2,178,590 | | 106,555 |
HDFC Bank Ltd. sponsored ADR | 409,100 | | 19,391 |
ICICI Bank Ltd. sponsored ADR | 476,229 | | 23,821 |
JPMorgan Chase & Co. | 2,401,777 | | 138,510 |
Punjab National Bank | 189,600 | | 3,034 |
Yes Bank Ltd. | 170,103 | | 1,500 |
| | 397,472 |
Capital Markets - 1.1% |
Ameriprise Financial, Inc. | 187,753 | | 22,455 |
BlackRock, Inc. Class A | 179,900 | | 54,821 |
Carlyle Group LP | 275,200 | | 9,186 |
Invesco Ltd. | 620,572 | | 23,352 |
Morgan Stanley | 1,475,351 | | 47,713 |
Och-Ziff Capital Management Group LLC Class A | 936,700 | | 12,748 |
State Street Corp. | 72,100 | | 5,079 |
The Blackstone Group LP | 425,600 | | 13,909 |
| | 189,263 |
Consumer Finance - 0.7% |
American Express Co. | 1,193,544 | | 105,032 |
Capital One Financial Corp. | 137,900 | | 10,969 |
Shriram Transport Finance Co. Ltd. | 339,455 | | 5,006 |
| | 121,007 |
Insurance - 0.1% |
MetLife, Inc. | 275,700 | | 14,502 |
Real Estate Management & Development - 0.2% |
Howard Hughes Corp. (a) | 53,100 | | 7,722 |
Parsvnath Developers Ltd. (a)(d) | 21,771,340 | | 9,495 |
Realogy Holdings Corp. (a) | 465,467 | | 17,111 |
| | 34,328 |
Common Stocks - continued |
| Shares | | Value (000s) |
FINANCIALS - continued |
Thrifts & Mortgage Finance - 0.1% |
Housing Development Finance Corp. Ltd. | 697,722 | | $ 12,219 |
TOTAL FINANCIALS | | 768,791 |
HEALTH CARE - 15.3% |
Biotechnology - 8.4% |
Acceleron Pharma, Inc. | 42,800 | | 1,268 |
Agios Pharmaceuticals, Inc. | 161,640 | | 6,514 |
Alexion Pharmaceuticals, Inc. (a) | 628,996 | | 100,004 |
Alkermes PLC (a) | 711,400 | | 30,419 |
Alnylam Pharmaceuticals, Inc. (a) | 616,063 | | 33,298 |
Amgen, Inc. | 1,470,202 | | 187,289 |
Avalanche Biotechnologies, Inc. (a) | 22,200 | | 621 |
BioCryst Pharmaceuticals, Inc. (a) | 833,700 | | 10,438 |
Biogen Idec, Inc. (a) | 742,100 | | 248,151 |
BioMarin Pharmaceutical, Inc. (a) | 281,704 | | 17,415 |
Bluebird Bio, Inc. (a) | 124,700 | | 4,165 |
Celgene Corp. (a) | 28,000 | | 2,440 |
Dicerna Pharmaceuticals, Inc. | 161,260 | | 2,422 |
Exelixis, Inc. (a) | 2,632,000 | | 10,633 |
Gilead Sciences, Inc. (a) | 4,887,260 | | 447,429 |
Grifols SA | 130,700 | | 5,919 |
Intercept Pharmaceuticals, Inc. (a) | 85,300 | | 19,820 |
InterMune, Inc. (a) | 375,237 | | 16,462 |
Intrexon Corp. (e) | 234,059 | | 5,170 |
Ironwood Pharmaceuticals, Inc. Class A (a) | 907,481 | | 13,431 |
Isis Pharmaceuticals, Inc. (a) | 63,700 | | 1,974 |
Keryx Biopharmaceuticals, Inc. (a)(e) | 528,873 | | 7,960 |
KYTHERA Biopharmaceuticals, Inc. (a)(e) | 263,156 | | 8,837 |
Merrimack Pharmaceuticals, Inc. (a) | 1,594,658 | | 9,424 |
Neurocrine Biosciences, Inc. (a) | 442,100 | | 6,004 |
NPS Pharmaceuticals, Inc. (a) | 88,000 | | 2,459 |
Pharmacyclics, Inc. (a) | 170,900 | | 20,583 |
Puma Biotechnology, Inc. (a) | 51,700 | | 11,463 |
Regeneron Pharmaceuticals, Inc. (a) | 329,489 | | 104,191 |
Seattle Genetics, Inc. (a) | 158,900 | | 5,593 |
Synageva BioPharma Corp. (a) | 130,800 | | 8,948 |
Ultragenyx Pharmaceutical, Inc. (e) | 26,500 | | 1,158 |
uniQure B.V. | 305,687 | | 3,124 |
Vertex Pharmaceuticals, Inc. (a) | 421,660 | | 37,490 |
| | 1,392,516 |
Common Stocks - continued |
| Shares | | Value (000s) |
HEALTH CARE - continued |
Health Care Equipment & Supplies - 0.9% |
Accuray, Inc. (a)(e) | 935,165 | | $ 7,360 |
Boston Scientific Corp. (a) | 2,388,900 | | 30,530 |
Insulet Corp. (a) | 88,000 | | 3,110 |
Intuitive Surgical, Inc. (a) | 92,207 | | 42,189 |
Novadaq Technologies, Inc. (a) | 607,819 | | 9,324 |
The Cooper Companies, Inc. | 324,630 | | 52,226 |
Zeltiq Aesthetics, Inc. (a) | 203,500 | | 4,119 |
| | 148,858 |
Health Care Providers & Services - 0.7% |
Apollo Hospitals Enterprise Ltd. | 936,371 | | 15,608 |
Cardinal Health, Inc. | 313,331 | | 22,450 |
Express Scripts Holding Co. (a) | 48,000 | | 3,343 |
HCA Holdings, Inc. (a) | 762,500 | | 49,799 |
Healthequity, Inc. (a) | 41,900 | | 737 |
iKang Healthcare Group, Inc. sponsored ADR (e) | 270,505 | | 5,075 |
Qualicorp SA (a) | 1,151,000 | | 13,317 |
| | 110,329 |
Health Care Technology - 0.3% |
Allscripts Healthcare Solutions, Inc. (a) | 310,100 | | 4,937 |
athenahealth, Inc. (a) | 76,475 | | 9,513 |
Castlight Health, Inc. Class B (a)(e) | 133,859 | | 1,795 |
Cerner Corp. (a) | 751,218 | | 41,467 |
| | 57,712 |
Life Sciences Tools & Services - 0.9% |
Agilent Technologies, Inc. | 366,510 | | 20,558 |
Genfit (a) | 89,600 | | 3,370 |
Illumina, Inc. (a) | 688,535 | | 110,104 |
Lonza Group AG | 38,412 | | 4,269 |
Thermo Fisher Scientific, Inc. | 55,800 | | 6,780 |
| | 145,081 |
Pharmaceuticals - 4.1% |
AbbVie, Inc. | 2,397,806 | | 125,501 |
Achaogen, Inc. (a) | 331,200 | | 3,580 |
Actavis PLC (a) | 845,755 | | 181,211 |
Allergan, Inc. | 278,273 | | 46,154 |
GW Pharmaceuticals PLC ADR (a)(e) | 265,666 | | 22,475 |
Jazz Pharmaceuticals PLC (a) | 11,500 | | 1,607 |
Johnson & Johnson | 188,500 | | 18,867 |
Merck & Co., Inc. | 588,603 | | 33,397 |
Common Stocks - continued |
| Shares | | Value (000s) |
HEALTH CARE - continued |
Pharmaceuticals - continued |
Pacira Pharmaceuticals, Inc. (a) | 117,166 | | $ 10,779 |
Perrigo Co. PLC | 135,440 | | 20,377 |
Salix Pharmaceuticals Ltd. (a) | 235,837 | | 31,109 |
Shire PLC sponsored ADR | 160,659 | | 39,602 |
Teva Pharmaceutical Industries Ltd. sponsored ADR | 1,034,900 | | 55,367 |
Valeant Pharmaceuticals International (Canada) (a) | 824,300 | | 96,639 |
| | 686,665 |
TOTAL HEALTH CARE | | 2,541,161 |
INDUSTRIALS - 9.1% |
Aerospace & Defense - 1.8% |
Honeywell International, Inc. | 890,300 | | 81,756 |
Precision Castparts Corp. | 272,800 | | 62,417 |
The Boeing Co. | 983,626 | | 118,507 |
United Technologies Corp. | 277,900 | | 29,221 |
| | 291,901 |
Air Freight & Logistics - 0.7% |
C.H. Robinson Worldwide, Inc. | 80,900 | | 5,458 |
FedEx Corp. | 233,678 | | 34,323 |
Hub Group, Inc. Class A (a) | 168,200 | | 7,767 |
United Parcel Service, Inc. Class B | 551,800 | | 53,574 |
XPO Logistics, Inc. (a)(e) | 524,500 | | 16,202 |
| | 117,324 |
Airlines - 1.8% |
American Airlines Group, Inc. | 4,098,693 | | 159,234 |
Azul-Linhas Aereas Brasileiras warrants (f) | 165,571 | | 0 |
Delta Air Lines, Inc. | 1,778,500 | | 66,623 |
Southwest Airlines Co. | 421,502 | | 11,920 |
Spirit Airlines, Inc. (a) | 856,400 | | 56,026 |
United Continental Holdings, Inc. (a) | 167,700 | | 7,780 |
| | 301,583 |
Building Products - 0.1% |
A.O. Smith Corp. | 274,454 | | 12,817 |
Electrical Equipment - 0.7% |
Acuity Brands, Inc. | 145,800 | | 15,640 |
Eaton Corp. PLC | 684,100 | | 46,464 |
Generac Holdings, Inc. (a) | 187,701 | | 8,146 |
SolarCity Corp. (a)(e) | 410,032 | | 29,330 |
Common Stocks - continued |
| Shares | | Value (000s) |
INDUSTRIALS - continued |
Electrical Equipment - continued |
TCP International Holdings Ltd. | 470,900 | | $ 4,069 |
Vestas Wind Systems A/S (a) | 231,300 | | 10,464 |
| | 114,113 |
Industrial Conglomerates - 0.8% |
Danaher Corp. | 1,876,700 | | 138,651 |
Machinery - 1.4% |
Caterpillar, Inc. | 500,900 | | 50,466 |
Cummins, Inc. | 716,661 | | 99,895 |
Ingersoll-Rand PLC | 599,184 | | 35,226 |
ITT Corp. | 388,800 | | 17,873 |
Manitowoc Co., Inc. | 640,900 | | 17,022 |
Navistar International Corp. (a)(e) | 364,600 | | 12,823 |
| | 233,305 |
Professional Services - 0.2% |
Huron Consulting Group, Inc. (a) | 194,520 | | 11,757 |
Towers Watson & Co. | 205,587 | | 20,974 |
| | 32,731 |
Road & Rail - 1.4% |
Avis Budget Group, Inc. (a) | 260,463 | | 14,635 |
Canadian Pacific Railway Ltd. | 192,000 | | 36,509 |
Hertz Global Holdings, Inc. (a) | 1,182,296 | | 33,364 |
J.B. Hunt Transport Services, Inc. | 509,700 | | 39,379 |
Landstar System, Inc. | 76,700 | | 5,072 |
Union Pacific Corp. | 1,142,600 | | 112,329 |
| | 241,288 |
Trading Companies & Distributors - 0.2% |
United Rentals, Inc. (a) | 257,800 | | 27,301 |
TOTAL INDUSTRIALS | | 1,511,014 |
INFORMATION TECHNOLOGY - 33.0% |
Communications Equipment - 2.0% |
Arista Networks, Inc. (e) | 112,200 | | 7,419 |
Cisco Systems, Inc. | 195,100 | | 4,922 |
F5 Networks, Inc. (a) | 237,906 | | 26,786 |
Palo Alto Networks, Inc. (a) | 345,746 | | 27,957 |
QUALCOMM, Inc. | 3,153,414 | | 232,407 |
Riverbed Technology, Inc. (a) | 1,434,841 | | 25,684 |
| | 325,175 |
Common Stocks - continued |
| Shares | | Value (000s) |
INFORMATION TECHNOLOGY - continued |
Electronic Equipment & Components - 0.3% |
InvenSense, Inc. (a)(e) | 1,264,980 | | $ 29,107 |
Samsung SDI Co. Ltd. | 10,144 | | 1,562 |
TE Connectivity Ltd. | 360,812 | | 22,331 |
| | 53,000 |
Internet Software & Services - 11.2% |
Akamai Technologies, Inc. (a) | 563,430 | | 33,254 |
Baidu.com, Inc. sponsored ADR (a) | 313,600 | | 67,753 |
Cornerstone OnDemand, Inc. (a) | 264,000 | | 11,046 |
Dropbox, Inc. (a)(f) | 1,003,814 | | 19,174 |
Facebook, Inc. Class A (a) | 5,456,001 | | 396,378 |
Gogo, Inc. (a)(e) | 821,400 | | 13,315 |
Google, Inc.: | | | |
Class A (a) | 827,454 | | 479,551 |
Class C (a) | 776,454 | | 443,821 |
IAC/InterActiveCorp | 592,300 | | 39,803 |
INFO Edge India Ltd. | 405,018 | | 4,590 |
Just Dial Ltd. (a) | 669,562 | | 18,381 |
LinkedIn Corp. (a) | 58,500 | | 10,567 |
Naver Corp. | 54,864 | | 39,170 |
Rackspace Hosting, Inc. (a) | 1,746,801 | | 52,911 |
Tencent Holdings Ltd. | 3,704,500 | | 60,160 |
Twitter, Inc. | 1,214,700 | | 54,892 |
Wix.com Ltd. (a) | 172,600 | | 2,926 |
Xoom Corp. (a) | 418,275 | | 9,060 |
Xunlei Ltd. sponsored ADR (e) | 88,400 | | 1,062 |
Yahoo!, Inc. (a) | 2,666,576 | | 95,490 |
Zoopla Property Group PLC | 1,328,700 | | 5,653 |
| | 1,858,957 |
IT Services - 4.1% |
Cognizant Technology Solutions Corp. Class A (a) | 3,939,554 | | 193,235 |
MasterCard, Inc. Class A | 2,820,400 | | 209,133 |
VeriFone Systems, Inc. (a) | 991,400 | | 33,222 |
Visa, Inc. Class A | 1,127,999 | | 238,019 |
| | 673,609 |
Semiconductors & Semiconductor Equipment - 4.1% |
Broadcom Corp. Class A | 680,000 | | 26,017 |
Canadian Solar, Inc. (a)(e) | 484,500 | | 12,093 |
Cavium, Inc. (a) | 882,401 | | 41,164 |
Cree, Inc. (a) | 698,453 | | 32,988 |
Cypress Semiconductor Corp. (e) | 3,118,484 | | 31,528 |
Common Stocks - continued |
| Shares | | Value (000s) |
INFORMATION TECHNOLOGY - continued |
Semiconductors & Semiconductor Equipment - continued |
eMemory Technology, Inc. | 155,000 | | $ 1,405 |
First Solar, Inc. (a) | 1,142,300 | | 72,091 |
Freescale Semiconductor, Inc. (a) | 1,654,654 | | 33,126 |
GCL-Poly Energy Holdings Ltd. (a) | 11,669,000 | | 3,767 |
GT Advanced Technologies, Inc. (a)(e) | 320,400 | | 4,434 |
Integrated Device Technology, Inc. (a) | 796,400 | | 11,436 |
MediaTek, Inc. | 491,000 | | 7,580 |
Mellanox Technologies Ltd. (a) | 138,000 | | 5,748 |
Micron Technology, Inc. (a) | 3,097,500 | | 94,629 |
Monolithic Power Systems, Inc. | 201,194 | | 8,297 |
NVIDIA Corp. | 1,196,370 | | 20,936 |
NXP Semiconductors NV (a) | 3,689,907 | | 230,066 |
RF Micro Devices, Inc. (a) | 1,054,300 | | 11,766 |
Silicon Laboratories, Inc. (a) | 94,053 | | 3,831 |
SunEdison, Inc. (a) | 846,845 | | 16,937 |
SunPower Corp. (a)(e) | 145,100 | | 5,330 |
| | 675,169 |
Software - 4.2% |
Activision Blizzard, Inc. | 4,452,900 | | 99,656 |
Adobe Systems, Inc. (a) | 924,250 | | 63,875 |
CommVault Systems, Inc. (a) | 21,788 | | 1,046 |
Concur Technologies, Inc. (a) | 60,600 | | 5,633 |
Electronic Arts, Inc. (a) | 612,486 | | 20,580 |
Fortinet, Inc. (a) | 568,596 | | 13,959 |
Imperva, Inc. (a) | 129,076 | | 2,862 |
Intuit, Inc. | 122,800 | | 10,066 |
Microsoft Corp. | 5,376,644 | | 232,056 |
Red Hat, Inc. (a) | 212,400 | | 12,345 |
salesforce.com, Inc. (a) | 4,125,869 | | 223,828 |
Zynga, Inc. (a) | 2,267,483 | | 6,621 |
| | 692,527 |
Technology Hardware, Storage & Peripherals - 7.1% |
Apple, Inc. | 11,237,609 | | 1,073,976 |
BlackBerry Ltd. (a) | 4,993,900 | | 46,593 |
Cray, Inc. (a) | 60,000 | | 1,591 |
Hewlett-Packard Co. | 1,059,400 | | 37,725 |
Common Stocks - continued |
| Shares | | Value (000s) |
INFORMATION TECHNOLOGY - continued |
Technology Hardware, Storage & Peripherals - continued |
NCR Corp. (a) | 716,126 | | $ 22,164 |
Nimble Storage, Inc. | 119,706 | | 3,098 |
| | 1,185,147 |
TOTAL INFORMATION TECHNOLOGY | | 5,463,584 |
MATERIALS - 2.0% |
Chemicals - 1.9% |
Cabot Corp. | 319,799 | | 16,754 |
Celanese Corp. Class A | 251,250 | | 14,625 |
Eastman Chemical Co. | 751,300 | | 59,187 |
Huntsman Corp. | 675,161 | | 17,588 |
Intrepid Potash, Inc. (a)(e) | 515,965 | | 7,641 |
LyondellBasell Industries NV Class A | 167,425 | | 17,789 |
Monsanto Co. | 1,154,300 | | 130,540 |
Orion Engineered Carbons SA (a) | 195,700 | | 3,327 |
Potash Corp. of Saskatchewan, Inc. (e) | 433,661 | | 15,396 |
The Mosaic Co. | 315,219 | | 14,535 |
Westlake Chemical Corp. | 154,900 | | 13,537 |
| | 310,919 |
Construction Materials - 0.1% |
CaesarStone Sdot-Yam Ltd. | 221,500 | | 9,604 |
Metals & Mining - 0.0% |
Freeport-McMoRan Copper & Gold, Inc. | 226,200 | | 8,419 |
TOTAL MATERIALS | | 328,942 |
TELECOMMUNICATION SERVICES - 0.2% |
Diversified Telecommunication Services - 0.0% |
Jazztel PLC (a) | 573,300 | | 7,731 |
Wireless Telecommunication Services - 0.2% |
Bharti Infratel Ltd. (a) | 3,161,156 | | 13,351 |
RingCentral, Inc. | 140,250 | | 2,094 |
T-Mobile U.S., Inc. (a) | 305,909 | | 10,077 |
| | 25,522 |
TOTAL TELECOMMUNICATION SERVICES | | 33,253 |
Common Stocks - continued |
| Shares | | Value (000s) |
UTILITIES - 0.1% |
Independent Power and Renewable Electricity Producers - 0.1% |
Abengoa Yield PLC | 83,100 | | $ 3,007 |
NextEra Energy Partners LP | 229,100 | | 7,799 |
| | 10,806 |
Independent Power Producers & Energy Traders - 0.0% |
Dynegy, Inc. (a) | 390,232 | | 10,361 |
TOTAL UTILITIES | | 21,167 |
TOTAL COMMON STOCKS (Cost $11,209,369) |
16,462,126
|
Convertible Preferred Stocks - 0.6% |
| | | |
CONSUMER DISCRETIONARY - 0.1% |
Leisure Products - 0.1% |
NJOY, Inc.: | | | |
Series C (a)(f) | 607,766 | | 10,287 |
Series D (f) | 149,114 | | 2,524 |
| | 12,811 |
INDUSTRIALS - 0.0% |
Airlines - 0.0% |
Azul-Linhas Aereas Brasileiras Series B (f) | 165,571 | | 7,298 |
INFORMATION TECHNOLOGY - 0.5% |
Internet Software & Services - 0.5% |
New Relic, Inc. Series F (f) | 152,912 | | 4,127 |
Uber Technologies, Inc. 8.00% (f) | 1,289,237 | | 80,000 |
| | 84,127 |
Software - 0.0% |
Cloudera, Inc. Series F (f) | 186,078 | | 2,910 |
TOTAL INFORMATION TECHNOLOGY | | 87,037 |
TOTAL CONVERTIBLE PREFERRED STOCKS (Cost $101,593) |
107,146
|
Money Market Funds - 1.2% |
| Shares | | Value (000s) |
Fidelity Cash Central Fund, 0.11% (b) | 9,495,233 | | $ 9,495 |
Fidelity Securities Lending Cash Central Fund, 0.11% (b)(c) | 185,310,929 | | 185,311 |
TOTAL MONEY MARKET FUNDS (Cost $194,806) |
194,806
|
TOTAL INVESTMENT PORTFOLIO - 101.1% (Cost $11,505,768) | 16,764,078 |
NET OTHER ASSETS (LIABILITIES) - (1.1)% | | (182,107) |
NET ASSETS - 100% | $ 16,581,971 |
Legend |
(a) Non-income producing |
(b) Affiliated fund that is generally available only to investment companies and other accounts managed by Fidelity Investments. The rate quoted is the annualized seven-day yield of the fund at period end. A complete unaudited listing of the fund's holdings as of its most recent quarter end is available upon request. In addition, each Fidelity Central Fund's financial statements, which are not covered by the Fund's Report of Independent Registered Public Accounting Firm, are available on the SEC's website or upon request. |
(c) Investment made with cash collateral received from securities on loan. |
(d) Affiliated company |
(e) Security or a portion of the security is on loan at period end. |
(f) Restricted securities - Investment in securities not registered under the Securities Act of 1933 (excluding 144A issues). At the end of the period, the value of restricted securities (excluding 144A issues) amounted to $146,262,000 or 0.9% of net assets. |
Additional information on each restricted holding is as follows: |
Security | Acquisition Date | Acquisition Cost (000s) |
Azul-Linhas Aereas Brasileiras Series B | 12/24/13 | $ 7,023 |
Azul-Linhas Aereas Brasileiras warrants | 12/24/13 | $ 0 |
Cloudera, Inc. Series F | 2/5/14 | $ 2,709 |
Dropbox, Inc. | 5/2/12 | $ 9,084 |
New Relic, Inc. Series F | 4/17/14 | $ 4,424 |
NJOY, Inc. | 9/11/13 | $ 9,520 |
NJOY, Inc. Series C | 6/7/13 | $ 4,913 |
Security | Acquisition Date | Acquisition Cost (000s) |
NJOY, Inc. Series D | 2/14/14 | $ 2,524 |
Uber Technologies, Inc. 8.00% | 6/6/14 | $ 80,000 |
Affiliated Central Funds |
Information regarding fiscal year to date income earned by the Fund from investments in Fidelity Central Funds is as follows: |
Fund | Income earned
(Amounts in thousands) |
Fidelity Cash Central Fund | $ 24 |
Fidelity Securities Lending Cash Central Fund | 1,908 |
Total | $ 1,932 |
Other Affiliated Issuers |
An affiliated company is a company in which the Fund has ownership of at least 5% of the voting securities. Fiscal year to date transactions with companies which are or were affiliates are as follows: |
Affiliate
(Amounts in thousands) | Value,
beginning of
period | Purchases | Sales
Proceeds | Dividend
Income | Value,
end of
period |
Parsvnath Developers Ltd. | $ 10,232 | $ - | $ - | $ - | $ 9,495 |
Other Information |
The following is a summary of the inputs used, as of July 31, 2014, involving the Fund's assets and liabilities carried at fair value. The inputs or methodology used for valuing securities may not be an indication of the risk associated with investing in those securities. For more information on valuation inputs, and their aggregation into the levels used in the table below, please refer to the Investment Valuation section in the accompanying Notes to Financial Statements. |
Valuation Inputs at Reporting Date: |
Description
(Amounts in thousands) | Total | Level 1 | Level 2 | Level 3 |
Investments in Securities: | | | | |
Equities: | | | | |
Consumer Discretionary | $ 3,502,974 | $ 3,466,890 | $ 3,331 | $ 32,753 |
Consumer Staples | 1,482,350 | 1,482,350 | - | - |
Energy | 821,701 | 815,440 | 6,261 | - |
Financials | 768,791 | 731,232 | 37,559 | - |
Health Care | 2,541,161 | 2,525,553 | 15,608 | - |
Industrials | 1,518,312 | 1,511,014 | - | 7,298 |
Information Technology | 5,550,621 | 5,307,795 | 136,615 | 106,211 |
Materials | 328,942 | 328,942 | - | - |
Telecommunication Services | 33,253 | 19,902 | 13,351 | - |
Utilities | 21,167 | 21,167 | - | - |
Money Market Funds | 194,806 | 194,806 | - | - |
Total Investments in Securities: | $ 16,764,078 | $ 16,405,091 | $ 212,725 | $ 146,262 |
Distribution of investments by country or territory of incorporation, as a percentage of total net assets, is as follows (Unaudited): |
United States of America | 89.2% |
Ireland | 1.9% |
Canada | 1.9% |
Cayman Islands | 1.5% |
Netherlands | 1.5% |
Others (Individually Less Than 1%) | 4.0% |
| 100.0% |
See accompanying notes which are an integral part of the financial statements.
Annual Report
Statement of Assets and Liabilities
Amounts in thousands (except per-share amounts) | July 31, 2014 |
| | |
Assets | | |
Investment in securities, at value (including securities loaned of $175,711) - See accompanying schedule: Unaffiliated issuers (cost $11,280,111) | $ 16,559,777 | |
Fidelity Central Funds (cost $194,806) | 194,806 | |
Other affiliated issuers (cost $30,851) | 9,495 | |
Total Investments (cost $11,505,768) | | $ 16,764,078 |
Cash | | 443 |
Foreign currency held at value (cost $2,445) | | 2,445 |
Receivable for investments sold | | 113,939 |
Receivable for fund shares sold | | 19,313 |
Dividends receivable | | 6,394 |
Distributions receivable from Fidelity Central Funds | | 248 |
Receivable from investment adviser for expense reductions | | 7 |
Other receivables | | 820 |
Total assets | | 16,907,687 |
| | |
Liabilities | | |
Payable for investments purchased | $ 107,464 | |
Payable for fund shares redeemed | 20,068 | |
Accrued management fee | 8,550 | |
Other affiliated payables | 2,007 | |
Other payables and accrued expenses | 2,316 | |
Collateral on securities loaned, at value | 185,311 | |
Total liabilities | | 325,716 |
| | |
Net Assets | | $ 16,581,971 |
Net Assets consist of: | | |
Paid in capital | | $ 10,478,889 |
Undistributed net investment income | | 17,541 |
Accumulated undistributed net realized gain (loss) on investments and foreign currency transactions | | 828,668 |
Net unrealized appreciation (depreciation) on investments and assets and liabilities in foreign currencies | | 5,256,873 |
Net Assets | | $ 16,581,971 |
See accompanying notes which are an integral part of the financial statements.
Annual Report
Financial Statements - continued
Statement of Assets and Liabilities - continued
Amounts in thousands (except per-share amounts) | July 31, 2014 |
| | |
Blue Chip Growth:
Net Asset Value, offering price and redemption price per share ($11,969,523 ÷ 179,406 shares) | | $ 66.72 |
| | |
Class K:
Net Asset Value, offering price and redemption price per share ($4,612,448 ÷ 69,033 shares) | | $ 66.82 |
See accompanying notes which are an integral part of the financial statements.
Annual Report
Statement of Operations
Amounts in thousands | Year ended July 31, 2014 |
| | |
Investment Income | | |
Dividends | | $ 176,722 |
Income from Fidelity Central Funds | | 1,932 |
Total income | | 178,654 |
| | |
Expenses | | |
Management fee
Basic fee | $ 95,242 | |
Performance adjustment | 11,359 | |
Transfer agent fees | 22,396 | |
Accounting and security lending fees | 1,655 | |
Custodian fees and expenses | 403 | |
Independent trustees' compensation | 75 | |
Appreciation in deferred trustee compensation account | 1 | |
Registration fees | 157 | |
Audit | 97 | |
Legal | 65 | |
Interest | 6 | |
Miscellaneous | 163 | |
Total expenses before reductions | 131,619 | |
Expense reductions | (481) | 131,138 |
Net investment income (loss) | | 47,516 |
Realized and Unrealized Gain (Loss) Net realized gain (loss) on: | | |
Investment securities: | | |
Unaffiliated issuers | 1,380,300 | |
Redemption in-kind with affiliated entities | 3,310,457 | |
Foreign currency transactions | (452) | |
Total net realized gain (loss) | | 4,690,305 |
Change in net unrealized appreciation (depreciation) on: Investment securities | (1,368,324) | |
Assets and liabilities in foreign currencies | 47 | |
Total change in net unrealized appreciation (depreciation) | | (1,368,277) |
Net gain (loss) | | 3,322,028 |
Net increase (decrease) in net assets resulting from operations | | $ 3,369,544 |
See accompanying notes which are an integral part of the financial statements.
Annual Report
Financial Statements - continued
Statement of Changes in Net Assets
Amounts in thousands | Year ended
July 31,
2014 | Year ended
July 31,
2013 |
Increase (Decrease) in Net Assets | | |
Operations | | |
Net investment income (loss) | $ 47,516 | $ 139,090 |
Net realized gain (loss) | 4,690,305 | 1,392,019 |
Change in net unrealized appreciation (depreciation) | (1,368,277) | 2,900,667 |
Net increase (decrease) in net assets resulting
from operations | 3,369,544 | 4,431,776 |
Distributions to shareholders from net investment income | (80,757) | (85,342) |
Distributions to shareholders from net realized gain | (1,378,625) | (230,904) |
Total distributions | (1,459,382) | (316,246) |
Share transactions - net increase (decrease) | (5,511,393) | 1,247,958 |
Total increase (decrease) in net assets | (3,601,231) | 5,363,488 |
| | |
Net Assets | | |
Beginning of period | 20,183,202 | 14,819,714 |
End of period (including undistributed net investment income of $17,541 and undistributed net investment income of $56,036, respectively) | $ 16,581,971 | $ 20,183,202 |
See accompanying notes which are an integral part of the financial statements.
Annual Report
Financial Highlights - Blue Chip Growth
Years ended July 31, | 2014 | 2013 | 2012 | 2011 | 2010 |
Selected Per-Share Data | | | | | |
Net asset value, beginning of period | $ 59.65 | $ 47.38 | $ 48.17 | $ 37.63 | $ 31.97 |
Income from Investment Operations | | | | | |
Net investment income (loss) B | .15 | .39 | .10 | (.03) | .04 |
Net realized and unrealized gain (loss) | 11.63 | 12.79 | .75 | 10.61 | 5.80 |
Total from investment operations | 11.78 | 13.18 | .85 | 10.58 | 5.84 |
Distributions from net investment income | (.24) | (.23) | (.04) | .00 E, G | (.18) |
Distributions from net realized gain | (4.47) | (.68) | (1.60) | (.04) E | - |
Total distributions | (4.71) | (.91) | (1.64) | (.04) | (.18) |
Net asset value, end of period | $ 66.72 | $ 59.65 | $ 47.38 | $ 48.17 | $ 37.63 |
Total ReturnA | 21.07% | 28.25% | 2.27% | 28.12% | 18.29% |
Ratios to Average Net Assets C, F | | | | | |
Expenses before reductions | .80% | .76% | .90% | .94% | .94% |
Expenses net of fee waivers, if any | .80% | .76% | .90% | .94% | .94% |
Expenses net of all reductions | .80% | .74% | .89% | .92% | .93% |
Net investment income (loss) | .23% | .75% | .21% | (.06)% | .10% |
Supplemental Data | | | | | |
Net assets, end of period (in millions) | $ 11,970 | $ 12,927 | $ 10,595 | $ 12,024 | $ 10,295 |
Portfolio turnover rateD | 57% H | 75% | 95% | 132% | 135% |
A Total returns would have been lower if certain expenses had not been reduced during the applicable periods shown.
B Calculated based on average shares outstanding during the period.
C Fees and expenses of any underlying Fidelity Central Funds are not included in the Fund's expense ratio. The Fund indirectly bears its proportionate share of the expenses of any underlying Fidelity Central Funds.
D Amount does not include the portfolio activity of any underlying Fidelity Central Funds.
E The amounts shown reflect certain reclassifications related to book to tax differences that were made in the year shown.
F Expense ratios reflect operating expenses of the class. Expenses before reductions do not reflect amounts reimbursed by the investment adviser or reductions from brokerage service arrangements or reductions from other expense offset arrangements and do not represent the amount paid by the class during periods when reimbursements or reductions occur. Expenses net of fee waivers reflect expenses after reimbursement by the investment adviser but prior to reductions from brokerage service arrangements or other expense offset arrangements. Expenses net of all reductions represent the net expenses paid by the class.
G Amount represents less than $.01 per share.
H Portfolio turnover rate excludes securities received or delivered in-kind.
See accompanying notes which are an integral part of the financial statements.
Annual Report
Financial Highlights - Class K
Years ended July 31, | 2014 | 2013 | 2012 | 2011 | 2010 |
Selected Per-Share Data | | | | | |
Net asset value, beginning of period | $ 59.74 | $ 47.46 | $ 48.21 | $ 37.66 | $ 32.01 |
Income from Investment Operations | | | | | |
Net investment income (loss) B | .23 | .47 | .17 | .05 | .11 |
Net realized and unrealized gain (loss) | 11.64 | 12.79 | .75 | 10.62 | 5.79 |
Total from investment operations | 11.87 | 13.26 | .92 | 10.67 | 5.90 |
Distributions from net investment income | (.33) | (.30) | (.08) | (.05) E | (.25) |
Distributions from net realized gain | (4.47) | (.68) | (1.60) | (.07) E | - |
Total distributions | (4.79)I | (.98) | (1.67) H | (.12) | (.25) |
Net asset value, end of period | $ 66.82 | $ 59.74 | $ 47.46 | $ 48.21 | $ 37.66 |
Total ReturnA | 21.23% | 28.42% | 2.43% | 28.37% | 18.48% |
Ratios to Average Net Assets C, F | | | | | |
Expenses before reductions | .68% | .61% | .74% | .77% | .75% |
Expenses net of fee waivers, if any | .68% | .61% | .74% | .77% | .75% |
Expenses net of all reductions | .67% | .60% | .73% | .76% | .74% |
Net investment income (loss) | .36% | .89% | .37% | .11% | .30% |
Supplemental Data | | | | | |
Net assets, end of period (in millions) | $ 4,612 | $ 3,506 | $ 2,467 | $ 1,455 | $ 932 |
Portfolio turnover rateD | 57%G | 75% | 95% | 132% | 135% |
A Total returns would have been lower if certain expenses had not been reduced during the applicable periods shown.
B Calculated based on average shares outstanding during the period.
C Fees and expenses of any underlying Fidelity Central Funds are not included in the Fund's expense ratio. The Fund indirectly bears its proportionate share of the expenses of any underlying Fidelity Central Funds.
D Amount does not include the portfolio activity of any underlying Fidelity Central Funds.
E The amounts shown reflect certain reclassifications related to book to tax differences that were made in the year shown.
F Expense ratios reflect operating expenses of the class. Expenses before reductions do not reflect amounts reimbursed by the investment adviser or reductions from brokerage service arrangements or reductions from other expense offset arrangements and do not represent the amount paid by the class during periods when reimbursements or reductions occur. Expenses net of fee waivers reflect expenses after reimbursement by the investment adviser but prior to reductions from brokerage service arrangements or other expense offset arrangements. Expenses net of all reductions represent the net expenses paid by the class.
G Portfolio turnover rate excludes securities received or delivered in-kind.
H Total distributions of $1.67 per share is comprised of distributions from net investment income of $.076 and distributions from net realized gain of $1.598 per share.
I Total distributions of $4.79 per share is comprised of distributions from net investment income of $.325 and distributions from net realized gain of $4.466 per share.
See accompanying notes which are an integral part of the financial statements.
Annual Report
Notes to Financial Statements
For the period ended July 31, 2014
(Amounts in thousands except percentages)
1. Organization.
Fidelity Blue Chip Growth Fund (the Fund) is a fund of Fidelity Securities Fund (the Trust) and is authorized to issue an unlimited number of shares. The Trust is registered under the Investment Company Act of 1940, as amended (the 1940 Act), as an open-end management investment company organized as a Massachusetts business trust. The Fund offers Blue Chip Growth and Class K shares, each of which has equal rights as to assets and voting privileges. The Fund offered Class F shares during the period June 26, 2009 through November 19, 2013, and all outstanding shares were redeemed by November 19, 2013. Each class has exclusive voting rights with respect to matters that affect that class.
2. Investments in Fidelity Central Funds.
The Fund invests in Fidelity Central Funds, which are open-end investment companies generally available only to other investment companies and accounts managed by the investment adviser and its affiliates. The Fund's Schedule of Investments lists each of the Fidelity Central Funds held as of period end, if any, as an investment of the Fund, but does not include the underlying holdings of each Fidelity Central Fund. As an Investing Fund, the Fund indirectly bears its proportionate share of the expenses of the underlying Fidelity Central Funds.
The Money Market Central Funds seek preservation of capital and current income and are managed by Fidelity Investments Money Management, Inc. (FIMM), an affiliate of the investment adviser. Annualized expenses of the Money Market Central Funds as of their most recent shareholder report date are less than .01%.
A complete unaudited list of holdings for each Fidelity Central Fund is available upon request or at the Securities and Exchange Commission (the SEC) website at www.sec.gov. In addition, the financial statements of the Fidelity Central Funds are available on the SEC website or upon request.
3. Significant Accounting Policies.
The financial statements have been prepared in conformity with accounting principles generally accepted in the United States of America (GAAP), which require management to make certain estimates and assumptions at the date of the financial statements. Actual results could differ from those estimates. Subsequent events, if any, through the date that the financial statements were issued have been evaluated in the preparation of the financial statements. The following summarizes the significant accounting policies of the Fund:
Investment Valuation. Investments are valued as of 4:00 p.m. Eastern time on the last calendar day of the period. In accordance with valuation policies and procedures
Annual Report
3. Significant Accounting Policies - continued
Investment Valuation - continued
approved by the Board of Trustees (the Board), the Fund attempts to obtain prices from one or more third party pricing vendors or brokers to value its investments. When current market prices, quotations or currency exchange rates are not readily available or reliable, investments will be fair valued in good faith by the Fidelity Management & Research Company (FMR) Fair Value Committee (the Committee), in accordance with procedures adopted by the Board. Factors used in determining fair value vary by investment type and may include market or investment specific events. The frequency with which these procedures are used cannot be predicted and they may be utilized to a significant extent. The Committee oversees the Fund's valuation policies and procedures and is responsible for approving and reporting to the Board all fair value determinations.
The Fund categorizes the inputs to valuation techniques used to value its investments into a disclosure hierarchy consisting of three levels as shown below:
Level 1 - quoted prices in active markets for identical investments
Level 2 - other significant observable inputs (including quoted prices for similar investments, interest rates, prepayment speeds, etc.)
Level 3 - unobservable inputs (including the Fund's own assumptions based on the best information available)
Valuation techniques used to value the Fund's investments by major category are as follows:
Equity securities, including restricted securities, for which market quotations are readily available, are valued at the last reported sale price or official closing price as reported by a third party pricing vendor on the primary market or exchange on which they are traded and are categorized as Level 1 in the hierarchy. In the event there were no sales during the day or closing prices are not available, securities are valued at the last quoted bid price or may be valued using the last available price and are generally categorized as Level 2 in the hierarchy. For foreign equity securities, when market or security specific events arise, comparisons to the valuation of American Depositary Receipts (ADRs), futures contracts, Exchange-Traded Funds (ETFs) and certain indexes as well as quoted prices for similar securities may be used and would be categorized as Level 2 in the hierarchy. Utilizing these techniques may result in transfers between Level 1 and Level 2. For equity securities, including restricted securities, where observable inputs are limited, assumptions about market activity and risk are used and these securities may be categorized as Level 3 in the hierarchy.
Annual Report
Notes to Financial Statements - continued
(Amounts in thousands except percentages)
3. Significant Accounting Policies - continued
Investment Valuation - continued
Investments in open-end mutual funds, including the Fidelity Central Funds, are valued at their closing net asset value (NAV) each business day and are categorized as Level 1 in the hierarchy.
Changes in valuation techniques may result in transfers in or out of an assigned level within the disclosure hierarchy. The aggregate value of investments by input level, as of July 31, 2014, is included at the end of the Fund's Schedule of Investments.
Foreign Currency. The Fund may use foreign currency contracts to facilitate transactions in foreign-denominated securities. Gains and losses from these transactions may arise from changes in the value of the foreign currency or if the counterparties do not perform under the contracts' terms.
Foreign-denominated assets, including investment securities, and liabilities are translated into U.S. dollars at the exchange rates at period end. Purchases and sales of investment securities, income and dividends received and expenses denominated in foreign currencies are translated into U.S. dollars at the exchange rate in effect on the transaction date.
The effects of exchange rate fluctuations on investments are included with the net realized and unrealized gain (loss) on investment securities. Other foreign currency transactions resulting in realized and unrealized gain (loss) are disclosed separately.
Investment Transactions and Income. For financial reporting purposes, the Fund's investment holdings and NAV include trades executed through the end of the last business day of the period. The NAV per share for processing shareholder transactions is calculated as of the close of business of the New York Stock Exchange (NYSE), normally 4:00 p.m. Eastern time and includes trades executed through the end of the prior business day. Gains and losses on securities sold are determined on the basis of identified cost and may include proceeds received from litigation. Dividend income is recorded on the ex-dividend date, except for certain dividends from foreign securities where the ex-dividend date may have passed, which are recorded as soon as the Fund is informed of the ex-dividend date. Non-cash dividends included in dividend income, if any, are recorded at the fair market value of the securities received. Income and capital gain distributions from Fidelity Central Funds, if any, are recorded on the ex-dividend date. Distributions received on securities that represent a return of capital or capital gain are recorded as a reduction of cost of investments and/or as a realized gain. Subsequent to ex-dividend date the Fund determines the components of these distributions, based upon receipt of tax filings or other correspondence relating to the underlying investment. Interest income is accrued as earned and includes coupon interest and amortization of
Annual Report
3. Significant Accounting Policies - continued
Investment Transactions and Income - continued
premium and accretion of discount on debt securities as applicable. Investment income is recorded net of foreign taxes withheld where recovery of such taxes is uncertain.
Class Allocations and Expenses. Investment income, realized and unrealized capital gains and losses, common expenses of the Fund, and certain fund-level expense reductions, if any, are allocated daily on a pro-rata basis to each class based on the relative net assets of each class to the total net assets of the Fund. Each class differs with respect to transfer agent fees incurred. Certain expense reductions may also differ by class. For the reporting period, the allocated portion of income and expenses to each class as a percent of its average net assets may vary due to the timing of recording these transactions in relation to fluctuating net assets of the classes. Expenses directly attributable to a fund are charged to that fund. Expenses attributable to more than one fund are allocated among the respective funds on the basis of relative net assets or other appropriate methods. Expense estimates are accrued in the period to which they relate and adjustments are made when actual amounts are known.
Deferred Trustee Compensation. Under a Deferred Compensation Plan (the Plan), independent Trustees may elect to defer receipt of a portion of their annual compensation. Deferred amounts are invested in a cross-section of Fidelity funds, are marked-to-market and remain in the Fund until distributed in accordance with the Plan. The investment of deferred amounts and the offsetting payable to the Trustees are included in the accompanying Statement of Assets and Liabilities.
Income Tax Information and Distributions to Shareholders. Each year, the Fund intends to qualify as a regulated investment company under Subchapter M of the Internal Revenue Code, including distributing substantially all of its taxable income and realized gains. As a result, no provision for U.S. Federal income taxes is required. As of July 31, 2014, the Fund did not have any unrecognized tax benefits in the financial statements; nor is the Fund aware of any tax positions for which it is reasonably possible that the total amounts of unrecognized tax benefits will significantly change in the next twelve months. The Fund files a U.S. federal tax return, in addition to state and local tax returns as required. The Fund's federal income tax returns are subject to examination by the Internal Revenue Service (IRS) for a period of three fiscal years after they are filed. State and local tax returns may be subject to examination for an additional fiscal year depending on the jurisdiction. Foreign taxes are provided for based on the Fund's understanding of the tax rules and rates that exist in the foreign markets in which it invests. The Fund is subject to a tax imposed on capital gains by certain countries in which it invests. An estimated deferred tax liability for net unrealized appreciation on the applicable securities is included in Other payables and accrued expenses on the Statement of Assets & Liabilities.
Annual Report
Notes to Financial Statements - continued
(Amounts in thousands except percentages)
3. Significant Accounting Policies - continued
Income Tax Information and Distributions to Shareholders - continued
Distributions are declared and recorded on the ex-dividend date. Income dividends and capital gain distributions are declared separately for each class. Income and capital gain distributions are determined in accordance with income tax regulations, which may differ from GAAP. In addition, the Fund claimed a portion of the payment made to redeeming shareholders as a distribution for income tax purposes.
Capital accounts within the financial statements are adjusted for permanent book-tax differences. These adjustments have no impact on net assets or the results of operations. Capital accounts are not adjusted for temporary book-tax differences which will reverse in a subsequent period.
Book-tax differences are primarily due to foreign currency transactions, redemptions in kind, partnerships, deferred trustees compensation and losses deferred due to wash sales.
The federal tax cost of investment securities and unrealized appreciation (depreciation) as of period end were as follows:
Gross unrealized appreciation | $ 5,476,623 |
Gross unrealized depreciation | (245,385) |
Net unrealized appreciation (depreciation) on securities | $ 5,231,238 |
| |
Tax Cost | $ 11,532,840 |
The tax-based components of distributable earnings as of period end were as follows:
Undistributed ordinary income | $ 80,477 |
Undistributed long-term capital gain | $ 793,526 |
Net unrealized appreciation (depreciation) on securities and other investments | $ 5,231,281 |
The tax character of distributions paid was as follows:
| July 31, 2014 | July 31, 2013 |
Ordinary Income | $ 155,664 | $ 85,342 |
Long-term Capital Gains | 1,303,718 | 230,904 |
Total | $ 1,459,382 | $ 316,246 |
Restricted Securities. The Fund may invest in securities that are subject to legal or contractual restrictions on resale. These securities generally may be resold in transactions exempt from registration or to the public if the securities are registered. Disposal of these securities may involve time-consuming negotiations and expense, and prompt sale at an acceptable price may be difficult. Information regarding restricted securities is included at the end of the Fund's Schedule of Investments.
Annual Report
4. Purchases and Sales of Investments.
Purchases and sales of securities, other than short-term securities and in-kind transactions, aggregated $10,440,292 and $10,009,929, respectively.
5. Fees and Other Transactions with Affiliates.
Management Fee. Fidelity Management & Research Company (the investment adviser) and its affiliates provide the Fund with investment management related services for which the Fund pays a monthly management fee. The management fee is the sum of an individual fund fee rate that is based on an annual rate of .30% of the Fund's average net assets and an annualized group fee rate that averaged .25% during the period. The group fee rate is based upon the average net assets of all the mutual funds advised by the investment adviser, including any mutual funds previously advised by the investment adviser that are currently advised by Fidelity SelectCo, LLC, an affiliate of the investment adviser. The group fee rate decreases as assets under management increase and increases as assets under management decrease. In addition, the management fee is subject to a performance adjustment (up to a maximum of ± .20% of the Fund's average net assets over a 36 month performance period). The upward or downward adjustment to the management fee is based on the relative investment performance of Blue Chip Growth as compared to its benchmark index, the Russell 1000 Growth Index, over the same 36 month performance period. For the reporting period, the total annual management fee rate, including the performance adjustment, was .62% of the Fund's average net assets. The performance adjustment included in the management fee rate may be higher or lower than the maximum performance adjustment rate due to the difference between the average net assets for the reporting and performance periods.
Transfer Agent Fees. Fidelity Investments Institutional Operations Company, Inc., (FIIOC), an affiliate of the investment adviser is the transfer, dividend disbursing and shareholder servicing agent for each class of the Fund. FIIOC receives account fees and asset-based fees that vary according to the account size and type of account of the shareholders of Blue Chip Growth. FIIOC receives an asset-based fee of Class K's average net assets. FIIOC pays for typesetting, printing and mailing of shareholder reports, except proxy statements.
For the period, transfer agent fees for each class were as follows:
| Amount | % of
Average
Net Assets |
Blue Chip Growth | $ 20,474 | .17 |
Class K | 1,922 | .05 |
| $ 22,396 | |
Annual Report
Notes to Financial Statements - continued
(Amounts in thousands except percentages)
5. Fees and Other Transactions with Affiliates - continued
Accounting and Security Lending Fees. Fidelity Service Company, Inc. (FSC), an affiliate of the investment adviser, maintains the Fund's accounting records. The accounting fee is based on the level of average net assets for each month. Under a separate contract, FSC administers the security lending program. The security lending fee is based on the number and duration of lending transactions.
Brokerage Commissions. The Fund placed a portion of its portfolio transactions with brokerage firms which are affiliates of the investment adviser. Brokerage commissions are included in net realized gain (loss) and change in net unrealized appreciation (depreciation) in the Statement of Operations. The commissions paid to these affiliated firms were $93 for the period.
Interfund Lending Program. Pursuant to an Exemptive Order issued by the SEC, the Fund, along with other registered investment companies having management contracts with FMR or other affiliated entities of FMR, may participate in an interfund lending program. This program provides an alternative credit facility allowing the funds to borrow from, or lend money to, other participating affiliated funds. At period end, there were no interfund loans outstanding. The Fund's activity in this program during the period for which loans were outstanding was as follows:
Borrower or Lender | Average Loan
Balance | Weighted Average
Interest Rate | Interest Expense |
Borrower | $ 18,386 | .32% | $ 6 |
Redemptions In-Kind. During the period, 120,385 shares of the Fund held by affiliated entities were redeemed for investments with a value of $7,325,217. The net realized gain of $3,310,457 on investments delivered through in-kind redemptions is included in the accompanying Statement of Operations. The amount of in-kind redemptions is included in share transactions in the accompanying Statement of Changes in Net Assets as well as Note 10: Share Transactions. The Fund recognized no gain or loss for federal income tax purposes.
Other. During the period, the investment adviser reimbursed the Fund for certain losses in the amount of $390.
6. Committed Line of Credit.
The Fund participates with other funds managed by the investment adviser or an affiliate in a $4.25 billion credit facility (the "line of credit") to be utilized for temporary or emergency purposes to fund shareholder redemptions or for other short-term liquidity purposes. The Fund has agreed to pay commitment fees on its pro-rata portion of the line of credit, which amounted to $30 and is reflected in Miscellaneous expenses on the Statement of Operations. During the period, the Fund did not borrow on this line of credit.
Annual Report
7. Security Lending.
The Fund lends portfolio securities through a lending agent from time to time in order to earn additional income. For equity securities, a lending agent is used and may loan securities to certain qualified borrowers, including Fidelity Capital Markets (FCM), a broker-dealer affiliated with the Fund. On the settlement date of the loan, the Fund receives collateral (in the form of U.S. Treasury obligations, letters of credit and/or cash) against the loaned securities and maintains collateral in an amount not less than 100% of the market value of the loaned securities during the period of the loan. The market value of the loaned securities is determined at the close of business of the Fund and any additional required collateral is delivered to the Fund on the next business day. If the borrower defaults on its obligation to return the securities loaned because of insolvency or other reasons, the Fund may apply collateral received from the borrower against the obligation. The Fund may experience delays and costs in recovering the securities loaned. Any cash collateral received is invested in the Fidelity Securities Lending Cash Central Fund. The value of loaned securities and cash collateral at period end are disclosed on the Fund's Statement of Assets and Liabilities. The value of securities loaned to FCM at period end was $699. Security lending income represents the income earned on investing cash collateral, less rebates paid to borrowers and any lending agent fees associated with the loan, plus any premium payments received for lending certain types of securities. Security lending income is presented in the Statement of Operations as a component of income from Fidelity Central Funds. Total security lending income during the period amounted to $1,908, including $50 from securities loaned to FCM.
8. Expense Reductions.
Commissions paid to certain brokers with whom the investment adviser, or its affiliates, places trades on behalf of the Fund include an amount in addition to trade execution, which may be rebated back to the Fund to offset certain expenses. This amount totaled $290 for the period.
In addition, the investment adviser reimbursed a portion of the Fund's operating expenses during the period in the amount of $191.
9. Distributions to Shareholders.
Distributions to shareholders of each class were as follows:
Years ended July 31, | 2014 A | 2013 |
From net investment income | | |
Blue Chip Growth | $ 47,730 | $ 51,844 |
Class K | 19,791 | 16,348 |
Class F | 13,236 | 17,150 |
Total | $ 80,757 | $ 85,342 |
Annual Report
Notes to Financial Statements - continued
(Amounts in thousands except percentages)
9. Distributions to Shareholders - continued
Years ended July 31, | 2014 A | 2013 |
From net realized gain | | |
Blue Chip Growth | $ 908,543 | $ 155,106 |
Class K | 269,912 | 36,829 |
Class F | 200,170 | 38,969 |
Total | $ 1,378,625 | $ 230,904 |
A All Class F shares were redeemed on November 19, 2013.
10. Share Transactions.
Transactions for each class of shares were as follows:
| Shares | Dollars |
Years ended July 31, | 2014 A | 2013 | 2014 A | 2013 |
Blue Chip Growth | | | | |
Shares sold | 30,779 | 41,304 C | $ 1,939,078 | $ 2,121,491 C |
Reinvestment of distributions | 16,131 | 4,171 | 933,288 | 202,506 |
Shares redeemed | (84,222) B | (52,364) | (5,182,185) B | (2,708,546) |
Net increase (decrease) | (37,312) | (6,889) | $ (2,309,819) | $ (384,549) |
Class K | | | | |
Shares sold | 17,861 | 17,299 | $ 1,132,520 | $ 899,333 |
Reinvestment of distributions | 4,984 | 1,092 | 289,703 | 53,178 |
Shares redeemed | (12,491) | (11,703) | (788,832) | (608,221) |
Net increase (decrease) | 10,354 | 6,688 | $ 633,391 | $ 344,290 |
Class F | | | | |
Shares sold | 3,759 | 28,168 C | $ 226,491 | $ 1,424,726 C |
Reinvestment of distributions | 3,740 | 1,153 | 213,405 | 56,119 |
Shares redeemed | (70,205) B | (3,595) | (4,274,861) B | (192,628) |
Net increase (decrease) | (62,706) | 25,726 | $ (3,834,965) | $ 1,288,217 |
A All Class F shares were redeemed on November 19, 2013.
B Amount includes in-kind redemptions (see note 5: Redemptions In-Kind).
C Amount includes in-kind exchanges.
11. Other.
The Fund's organizational documents provide former and current trustees and officers with a limited indemnification against liabilities arising in connection with the performance of their duties to the Fund. In the normal course of business, the Fund may also enter into contracts that provide general indemnifications. The Fund's maximum exposure under these arrangements is unknown as this would be dependent on future claims that may be made against the Fund. The risk of material loss from such claims is considered remote.
Annual Report
To the Trustees of Fidelity Securities Fund and Shareholders of Fidelity Blue Chip Growth Fund:
We have audited the accompanying statement of assets and liabilities of Fidelity Blue Chip Growth Fund (the Fund), a fund of Fidelity Securities Fund, including the schedule of investments, as of July 31, 2014, and the related statement of operations for the year then ended, the statement of changes in net assets for each of the two years in the period then ended, and the financial highlights for each of the five years in the period then ended. These financial statements and financial highlights are the responsibility of the Fund's management. Our responsibility is to express an opinion on these financial statements and financial highlights based on our audits.
We conducted our audits in accordance with the standards of the Public Company Accounting Oversight Board (United States). Those standards require that we plan and perform the audit to obtain reasonable assurance about whether the financial statements and financial highlights are free of material misstatement. The Fund is not required to have, nor were we engaged to perform, an audit of its internal control over financial reporting. Our audits included consideration of internal control over financial reporting as a basis for designing audit procedures that are appropriate in the circumstances, but not for the purpose of expressing an opinion on the effectiveness of the Fund's internal control over financial reporting. Accordingly, we express no such opinion. An audit also includes examining, on a test basis, evidence supporting the amounts and disclosures in the financial statements, assessing the accounting principles used and significant estimates made by management, as well as evaluating the overall financial statement presentation. Our procedures included confirmation of securities owned as of July 31, 2014, by correspondence with the custodians and brokers; where replies were not received from brokers, we performed other auditing procedures. We believe that our audits provide a reasonable basis for our opinion.
In our opinion, the financial statements and financial highlights referred to above present fairly, in all material respects, the financial position of Fidelity Blue Chip Growth Fund as of July 31, 2014, the results of its operations for the year then ended, the changes in its net assets for each of the two years in the period then ended, and the financial highlights for each of the five years in the period then ended, in conformity with accounting principles generally accepted in the United States of America.
DELOITTE & TOUCHE LLP
Boston, Massachusetts
September 15, 2014
Annual Report
The Trustees, Member of the Advisory Board, and officers of the trust and fund, as applicable, are listed below. The Board of Trustees governs the fund and is responsible for protecting the interests of shareholders. The Trustees are experienced executives who meet periodically throughout the year to oversee the fund's activities, review contractual arrangements with companies that provide services to the fund, oversee management of the risks associated with such activities and contractual arrangements, and review the fund's performance. Except for James C. Curvey, each of the Trustees oversees 173 funds. Mr. Curvey oversees 397 funds.
The Trustees hold office without limit in time except that (a) any Trustee may resign; (b) any Trustee may be removed by written instrument, signed by at least two-thirds of the number of Trustees prior to such removal; (c) any Trustee who requests to be retired or who has become incapacitated by illness or injury may be retired by written instrument signed by a majority of the other Trustees; and (d) any Trustee may be removed at any special meeting of shareholders by a two-thirds vote of the outstanding voting securities of the trust. Each Trustee who is not an interested person (as defined in the 1940 Act) of the trust and the fund (Independent Trustee), shall retire not later than the last day of the calendar year in which his or her 75th birthday occurs. The Independent Trustees may waive this mandatory retirement age policy with respect to individual Trustees. The officers and Advisory Board Member hold office without limit in time, except that any officer and Advisory Board Member may resign or may be removed by a vote of a majority of the Trustees at any regular meeting or any special meeting of the Trustees. Except as indicated, each individual has held the office shown or other offices in the same company for the past five years.
Experience, Skills, Attributes, and Qualifications of the Fund's Trustees. The Governance and Nominating Committee has adopted a statement of policy that describes the experience, qualifications, attributes, and skills that are necessary and desirable for potential Independent Trustee candidates (Statement of Policy). The Board believes that each Trustee satisfied at the time he or she was initially elected or appointed a Trustee, and continues to satisfy, the standards contemplated by the Statement of Policy. The Governance and Nominating Committee also engages professional search firms to help identify potential Independent Trustee candidates who have the experience, qualifications, attributes, and skills consistent with the Statement of Policy. From time to time, additional criteria based on the composition and skills of the current Independent Trustees, as well as experience or skills that may be appropriate in light of future changes to board composition, business conditions, and regulatory or other developments, have also been considered by the professional search firms and the Governance and Nominating Committee. In addition, the Board takes into account the Trustees' commitment and participation in Board and committee meetings, as well as their leadership of standing and ad hoc committees throughout their tenure.
In determining that a particular Trustee was and continues to be qualified to serve as a Trustee, the Board has considered a variety of criteria, none of which, in isolation, was controlling. The Board believes that, collectively, the Trustees have balanced and diverse experience, qualifications, attributes, and skills, which allow the Board to operate effectively in governing the fund and protecting the interests of shareholders. Information about the specific experience, skills, attributes, and qualifications of each Trustee, which in each case led to the Board's conclusion that the Trustee should serve (or continue to serve) as a trustee of the fund, is provided below.
Annual Report
Trustees and Officers - continued
Board Structure and Oversight Function. James C. Curvey is an interested person (as defined in the 1940 Act) and currently serves as Chairman. The Trustees have determined that an interested Chairman is appropriate and benefits shareholders because an interested Chairman has a personal and professional stake in the quality and continuity of services provided to the fund. Independent Trustees exercise their informed business judgment to appoint an individual of their choosing to serve as Chairman, regardless of whether the Trustee happens to be independent or a member of management. The Independent Trustees have determined that they can act independently and effectively without having an Independent Trustee serve as Chairman and that a key structural component for assuring that they are in a position to do so is for the Independent Trustees to constitute a substantial majority for the Board. The Independent Trustees also regularly meet in executive session. Ned C. Lautenbach serves as Chairman of the Independent Trustees and as such (i) acts as a liaison between the Independent Trustees and management with respect to matters important to the Independent Trustees and (ii) with management prepares agendas for Board meetings.
Fidelity funds are overseen by different Boards of Trustees. The fund's Board oversees Fidelity's equity and high income funds and another Board oversees Fidelity's investment-grade bond, money market, and asset allocation funds. The asset allocation funds may invest in Fidelity funds overseen by the fund's Board. The use of separate Boards, each with its own committee structure, allows the Trustees of each group of Fidelity funds to focus on the unique issues of the funds they oversee, including common research, investment, and operational issues. On occasion, the separate Boards establish joint committees to address issues of overlapping consequences for the Fidelity funds overseen by each Board.
The Trustees operate using a system of committees to facilitate the timely and efficient consideration of all matters of importance to the Trustees, the fund, and fund shareholders and to facilitate compliance with legal and regulatory requirements and oversight of the fund's activities and associated risks. The Board, acting through its committees, has charged FMR and its affiliates with (i) identifying events or circumstances the occurrence of which could have demonstrably adverse effects on the fund's business and/or reputation; (ii) implementing processes and controls to lessen the possibility that such events or circumstances occur or to mitigate the effects of such events or circumstances if they do occur; and (iii) creating and maintaining a system designed to evaluate continuously business and market conditions in order to facilitate the identification and implementation processes described in (i) and (ii) above. Because the day-to-day operations and activities of the fund are carried out by or through FMR, its affiliates and other service providers, the fund's exposure to risks is mitigated but not eliminated by the processes overseen by the Trustees. While each of the Board's committees has responsibility for overseeing different aspects of the fund's activities, oversight is exercised primarily through the Operations, Audit, and Compliance Committees. In addition, the Independent Trustees have worked with FMR to enhance the Board's oversight of investment and financial risks, legal and regulatory risks, technology risks, and operational risks, including the development of additional risk reporting to the Board. For example, a working group comprised of Independent Trustees and FMR has worked and continues to work to review the Fidelity funds' valuation-related activities, reporting and risk management. Appropriate personnel, including but not limited to the fund's Chief Compliance Officer (CCO), FMR's internal auditor, the independent accountants, the fund's Treasurer and portfolio management personnel, make periodic reports to the Board's committees, as appropriate, including an annual review of FMR's risk management program for the Fidelity funds. The responsibilities of each standing committee, including their oversight responsibilities, are described further under "Standing Committees of the Fund's Trustees."
Annual Report
The fund's Statements of Additional Information (SAI) includes more information about the Trustees. To request a free copy, call Fidelity at 1-800-544-8544.
Interested Trustees*:
Correspondence intended for each Trustee who is an interested person may be sent to Fidelity Investments, 245 Summer Street, Boston, Massachusetts 02210.
Name, Year of Birth; Principal Occupations and Other Relevant Experience+ |
James C. Curvey (1935) |
Year of Election or Appointment: 2007 Trustee Chairman of the Board of Trustees |
| Mr. Curvey also serves as Trustee of other Fidelity funds. Mr. Curvey is a Director of Fidelity Research & Analysis Co. (2009-present), and Vice Chairman (2007-present) and Director of FMR LLC. In addition, Mr. Curvey serves as an Overseer for the Boston Symphony Orchestra and a member of the Trustees of Villanova University. Previously, Mr. Curvey served as a Director of Fidelity Investments Money Management, Inc. (2009-2014), a Director of FMR (2007-2014), a Director of FMR Co., Inc. (2007-2014) and was the Vice Chairman (2006-2007) and Director (2000-2007) of FMR Corp. |
Charles S. Morrison (1960) |
Year of Election or Appointment: 2014 Trustee |
| Mr. Morrison also serves as Trustee of other funds. He serves as President, Asset Management (2014-present) and is an employee of Fidelity Investments. Previously, Mr. Morrison served as Vice President of Fidelity's Fixed Income and Asset Allocation Funds (2012-2014), President, Fixed Income (2011-2014), Vice President of Fidelity's Money Market Funds (2005-2009), President, Money Market Group Leader of FMR (2009), and Senior Vice President, Money Market Group of FMR (2004-2009). Mr. Morrison also served as Vice President of Fidelity's Bond Funds (2002-2005), certain Balanced Funds (2002-2005), and certain Asset Allocation Funds (2002-2007), and as Senior Vice President (2002-2005) of Fidelity's Bond Division. |
* Trustees have been determined to be "Interested Trustees" by virtue of, among other things, their affiliation with the trust or various entities under common control with FMR.
+ The information above includes each Trustee's principal occupation during the last five years and other information relating to the experience, attributes, and skills relevant to each Trustee's qualifications to serve as a Trustee, which led to the conclusion that each Trustee should serve as a Trustee for the fund.
Annual Report
Independent Trustees:
Correspondence intended for each Independent Trustee (that is, the Trustees other than the Interested Trustees) may be sent to Fidelity Investments, P.O. Box 55235, Boston, Massachusetts 02205-5235.
Name, Year of Birth; Principal Occupations and Other Relevant Experience+ |
Dennis J. Dirks (1948) |
Year of Election or Appointment: 2005 Trustee |
| Mr. Dirks also serves as Trustee of other Fidelity funds. Prior to his retirement in May 2003, Mr. Dirks was Chief Operating Officer and a member of the Board of The Depository Trust & Clearing Corporation (DTCC). He also served as President, Chief Operating Officer, and Board member of The Depository Trust Company (DTC) and President and Board member of the National Securities Clearing Corporation (NSCC). In addition, Mr. Dirks served as Chief Executive Officer and Board member of the Government Securities Clearing Corporation, Chief Executive Officer and Board member of the Mortgage-Backed Securities Clearing Corporation, as a Trustee and a member of the Finance Committee of Manhattan College (2005-2008), and as a Trustee and a member of the Finance Committee of AHRC of Nassau County (2006-2008). Mr. Dirks is a member of the Independent Directors Council (IDC) Governing Council (2010-present) and Board of Directors for The Brookville Center for Children's Services, Inc. (2009-present). |
Alan J. Lacy (1953) |
Year of Election or Appointment: 2008 Trustee |
| Mr. Lacy also serves as Trustee of other Fidelity funds. Mr. Lacy serves as Senior Adviser (2007-present) of Oak Hill Capital Partners, L.P. (private equity). Mr. Lacy also served as Chief Executive Officer (2000-2005) and Vice Chairman (2005-2006) of Sears Holdings Corporation and Sears, Roebuck and Co. (retail). In addition, Mr. Lacy serves as a member of the Board of Directors of Dave & Buster's Entertainment, Inc. (restaurant and entertainment complexes, 2010-present), Earth Fare, Inc. (retail grocery, 2012-present), The Hillman Companies, Inc. (hardware wholesalers, 2010-present), and Bristol-Myers Squibb Company (global pharmaceuticals, 2008-present). Mr. Lacy is a member of the Board of Trustees of The National Parks Conservation Association (2006-present). Previously, Mr. Lacy served as Chairman of the Board of Trustees of the National Parks Conservation Association (2008-2011) and as a member of the Board of Directors for the Western Union Company (global money transfer, 2006-2011). |
Ned C. Lautenbach (1944) |
Year of Election or Appointment: 2000 Trustee Chairman of the Independent Trustees |
| Mr. Lautenbach also serves as Trustee of other Fidelity funds. Mr. Lautenbach currently serves as the Lead Director of the Eaton Corporation Board of Directors (diversified industrial, 1997-present). Mr. Lautenbach is Chairman of the Board of Directors of the Philharmonic Center for the Arts in Naples, Florida (2012-present) and a member of the Council on Foreign Relations (1994-present). Previously, Mr. Lautenbach was a Partner/Advisory Partner at Clayton, Dubilier & Rice, LLC (private equity investment, 1998-2010), as well as a Director of Sony Corporation (2006-2007). |
Joseph Mauriello (1944) |
Year of Election or Appointment: 2008 Trustee |
| Mr. Mauriello also serves as Trustee of other Fidelity funds. Prior to his retirement in January 2006, Mr. Mauriello served in numerous senior management positions including Deputy Chairman and Chief Operating Officer (2004-2005), and Vice Chairman of Financial Services (2002-2004) of KPMG LLP US (professional services, 1965-2005). Mr. Mauriello currently serves as a member of the Board of Directors of XL Group plc. (global insurance and re-insurance, 2006-present). Previously, Mr. Mauriello served as a Director of the Hamilton Funds of the Bank of New York (2006-2007) and of Arcadia Resources Inc. (health care services and products, 2007-2012). |
Robert W. Selander (1950) |
Year of Election or Appointment: 2011 Trustee |
| Mr. Selander also serves as Trustee of other Fidelity funds. Previously, Mr. Selander served as a Member of the Advisory Board of other Fidelity funds (2011), and Executive Vice Chairman (2010), Chief Executive Officer (2009-2010), and President and Chief Executive Officer (1997-2009) of Mastercard, Inc. |
Cornelia M. Small (1944) |
Year of Election or Appointment: 2005 Trustee |
| Ms. Small also serves as Trustee of other Fidelity funds. Ms. Small is a member of the Board of Directors (2009-present) and Chair of the Investment Committee (2010-present) of the Teagle Foundation. Ms. Small also serves on the Investment Committee of the Berkshire Taconic Community Foundation (2008-present). Previously, Ms. Small served as Chairperson (2002-2008) and a member of the Investment Committee and Chairperson (2008-2012) and a member of the Board of Trustees of Smith College. In addition, Ms. Small served as Chief Investment Officer, Director of Global Equity Investments, and a member of the Board of Directors of Scudder, Stevens & Clark and Scudder Kemper Investments. |
William S. Stavropoulos (1939) |
Year of Election or Appointment: 2002 Trustee Vice Chairman of the Independent Trustees |
| Mr. Stavropoulos also serves as Trustee of other Fidelity funds. Mr. Stavropoulos serves as President and Founder of the Michigan Baseball Foundation, the Great Lakes Loons (2007-present). Mr. Stavropoulos is Chairman Emeritus of the Board of Directors of The Dow Chemical Company, where he previously served in numerous senior management positions, including President, CEO (1995-2000; 2002-2004), Chairman of the Executive Committee (2000-2006), and as a member of the Board of Directors (1990-2006). Currently, Mr. Stavropoulos is Chairman of the Board of Directors of Univar Inc. (global distributor of commodity and specialty chemicals), a Director of Teradata Corporation (data warehousing and technology solutions), and Maersk Inc. (industrial conglomerate), and a member of the Advisory Board for Metalmark Capital LLC (private equity investment, 2005-present). Mr. Stavropoulos is an operating advisor to Clayton, Dubilier & Rice, LLC (private equity investment). In addition, Mr. Stavropoulos is a member of the University of Notre Dame Advisory Council for the College of Science, a Trustee of the Rollin L. Gerstacker Foundation, and a Director of the Naples Philharmonic Center for the Arts. Previously, Mr. Stavropoulos served as a Director of Chemical Financial Corporation (bank holding company, 1993-2012) and Tyco International, Ltd. (multinational manufacturing and services, 2007-2012). |
David M. Thomas (1949) |
Year of Election or Appointment: 2008 Trustee |
| Mr. Thomas also serves as Trustee of other Fidelity funds. Mr. Thomas serves as Non-Executive Chairman of the Board of Directors of Fortune Brands Home and Security (home and security products, 2011-present), and as a member of the Board of Directors of Interpublic Group of Companies, Inc. (marketing communication, 2004-present). Previously, Mr. Thomas served as Executive Chairman (2005-2006) and Chairman and Chief Executive Officer (2000-2005) of IMS Health, Inc. (pharmaceutical and healthcare information solutions), and a Director of Fortune Brands, Inc. (consumer products, 2000-2011). |
+ The information above includes each Trustee's principal occupation during the last five years and other information relating to the experience, attributes, and skills relevant to each Trustee's qualifications to serve as a Trustee, which led to the conclusion that each Trustee should serve as a Trustee for the fund.
Advisory Board Member and Officers:
Correspondence intended for each officer and Peter S. Lynch may be sent to Fidelity Investments, 245 Summer Street, Boston, Massachusetts 02210. Officers appear below in alphabetical order.
Name, Year of Birth; Principal Occupation |
Peter S. Lynch (1944) |
Year of Election or Appointment: 2003 Member of the Advisory Board |
| Mr. Lynch also serves as Member of the Advisory Board of other Fidelity funds. Mr. Lynch is Vice Chairman and a Director of FMR and FMR Co., Inc. In addition, Mr. Lynch serves as a Trustee of Boston College and as the Chairman of the Inner-City Scholarship Fund. Previously, Mr. Lynch served on the Special Olympics International Board of Directors (1997-2006). |
Elizabeth Paige Baumann (1968) |
Year of Election or Appointment: 2012 Anti-Money Laundering (AML) Officer |
| Ms. Baumann also serves as AML Officer of other funds. She is Chief AML Officer of FMR LLC (2012-present) and is an employee of Fidelity Investments. Previously, Ms. Baumann served as Vice President and Deputy Anti-Money Laundering Officer (2007-2012). |
William C. Coffey (1969) |
Year of Election or Appointment: 2009 Assistant Secretary |
| Mr. Coffey also serves as Assistant Secretary of other funds. He is Senior Vice President and Deputy General Counsel of FMR LLC (2010-present), and is an employee of Fidelity Investments. Previously, Mr. Coffey served as Vice President and Associate General Counsel of FMR LLC (2005-2009). |
Jonathan Davis (1968) |
Year of Election or Appointment: 2010 Assistant Treasurer |
| Mr. Davis also serves as Assistant Treasurer of other funds. Mr. Davis is an employee of Fidelity Investments. Previously, Mr. Davis served as Vice President and Associate General Counsel of FMR LLC (2003-2010). |
Adrien E. Deberghes (1967) |
Year of Election or Appointment: 2008 Deputy Treasurer |
| Mr. Deberghes also serves as an officer of other funds. He is an employee of Fidelity Investments (2008-present). Prior to joining Fidelity Investments, Mr. Deberghes was Senior Vice President of Mutual Fund Administration at State Street Corporation (2007-2008), Senior Director of Mutual Fund Administration at Investors Bank & Trust (2005-2007), and Director of Finance for Dunkin' Brands (2000-2005). |
Stephanie J. Dorsey (1969) |
Year of Election or Appointment: 2010 Assistant Treasurer |
| Ms. Dorsey also serves as an officer of other funds. She is an employee of Fidelity Investments (2008-present) and has served in other fund officer roles. Prior to joining Fidelity Investments, Ms. Dorsey served as Treasurer (2004-2008) of the JPMorgan Mutual Funds and Vice President (2004-2008) of JPMorgan Chase Bank. |
Howard J. Galligan III (1966) |
Year of Election or Appointment: 2014 Chief Financial Officer |
| Mr. Galligan also serves as Chief Financial Officer of other funds. Mr. Galligan serves as President of Fidelity Pricing and Cash Management Services (FPCMS) (2014-present) and as a Director of Strategic Advisers, Inc. (2008-present). Previously, Mr. Galligan served as Chief Administrative Officer of Asset Management (2011-2014) and Chief Operating Officer and Senior Vice President of Investment Support for Strategic Advisers, Inc. (2003-2011). |
Scott C. Goebel (1968) |
Year of Election or Appointment: 2008 Secretary and Chief Legal Officer (CLO) |
| Mr. Goebel serves as Secretary and CLO of other funds. Mr. Goebel also serves as Secretary of Fidelity SelectCo, LLC (2013-present), Fidelity Investments Money Management, Inc. (FIMM) (2010-present) and Fidelity Research and Analysis Company (FRAC) (2010-present); General Counsel, Secretary, and Senior Vice President of FMR (2008-present) and FMR Co., Inc. (2008-present); Chief Legal Officer of Fidelity Management & Research (Hong Kong) Limited (2008-present); and Assistant Secretary of Fidelity Management & Research (Japan) Inc. (2008-present) and Fidelity Management & Research (U.K.) Inc. (2008-present). Previously, Mr. Goebel served as Secretary and CLO of other Fidelity funds (2008-2013), Assistant Secretary of FIMM (2008-2010), FRAC (2008-2010), and certain funds (2007-2008); and as Vice President and Secretary of Fidelity Distributors Corporation (FDC) (2005-2007). Mr. Goebel has been employed by FMR LLC or an affiliate since 2001. |
Brian B. Hogan (1964) |
Year of Election or Appointment: 2009 Vice President |
| Mr. Hogan also serves as Trustee or Vice President of other funds. Mr. Hogan serves as President of FMR's Equity Division (2009-present). Previously, Mr. Hogan served as Senior Vice President, Equity Research of FMR (2006-2009) and as a portfolio manager. |
Chris Maher (1972) |
Year of Election or Appointment: 2013 Assistant Treasurer |
| Mr. Maher serves as Assistant Treasurer of other funds. Mr. Maher is Vice President of Valuation Oversight and is an employee of Fidelity Investments. Previously, Mr. Maher served as Vice President of Asset Management Compliance (2013), Vice President of FMR's Program Management Group (2010-2013), and Vice President of Valuation Oversight (2008-2010). |
Melissa M. Reilly (1971) |
Year of Election or Appointment: 2014 Vice President of certain Equity Funds |
| Ms. Reilly also serves as Vice President of other funds. Ms. Reilly is an employee of Fidelity Investments (2004-present). |
Kenneth B. Robins (1969) |
Year of Election or Appointment: 2008 President and Treasurer |
| Mr. Robins also serves as an officer of other funds. Mr. Robins serves as Executive Vice President of Fidelity Investments Money Management, Inc. (FIMM) (2013-present) and is an employee of Fidelity Investments (2004-present). Previously, Mr. Robins served in other fund officer roles. |
Stephen Sadoski (1971) |
Year of Election or Appointment: 2012 Deputy Treasurer |
| Mr. Sadoski also serves as Deputy Treasurer of other funds. He is an employee of Fidelity Investments (2012-present) and has served in another fund officer role. Prior to joining Fidelity Investments, Mr. Sadoski served as an assistant chief accountant in the Division of Investment Management of the Securities and Exchange Commission (SEC) (2009-2012) and as a senior manager at Deloitte & Touche LLP (1997-2009). |
Stacie M. Smith (1974) |
Year of Election or Appointment: 2013 Deputy Treasurer |
| Ms. Smith also serves as an officer of other funds. She is an employee of Fidelity Investments (2009-present) and has served in other fund officer roles. Prior to joining Fidelity Investments, Ms. Smith served as Senior Audit Manager of Ernst & Young LLP (1996-2009). |
Renee Stagnone (1975) |
Year of Election or Appointment: 2013 Deputy Treasurer |
| Ms. Stagnone also serves as Deputy Treasurer of other funds. Ms. Stagnone is an employee of Fidelity Investments. |
Linda J. Wondrack (1964) |
Year of Election or Appointment: 2014 Chief Compliance Officer |
| Ms. Wondrack also serves as Chief Compliance Officer of other funds. Ms. Wondrack is Executive Vice President and head of the Ethics Office and Asset Management Compliance for Fidelity Investments (2012-present). Ms. Wondrack also serves as Chief Compliance Officer of Fidelity SelectCo, LLC (2014-present); Chief Compliance Officer of Impresa Management LLC (2013-present); and Chief Compliance Officer of FMR Co., Inc., Fidelity Investments Money Management, Inc., Fidelity Management & Research (Japan) Inc., Fidelity Management & Research (U.K.) Inc., Fidelity Management & Research (Hong Kong), Fidelity Management & Research Company, Pyramis Global Advisors, LLC, and Strategic Advisers, Inc., Ballyrock Investment Advisors LLC, and Northern Neck Investors LLC (2012-present). Previously, Ms. Wondrack served as Senior Vice President and Chief Compliance Officer for Columbia Management Investment Advisers, LLC (2005-2012); Chief Compliance Officer for certain funds within the Columbia Family of Funds (2007-2012); and Senior Vice President of Compliance Risk Management at Bank of America (2005-2010). |
Joseph F. Zambello (1957) |
Year of Election or Appointment: 2011 Deputy Treasurer |
| Mr. Zambello also serves as Deputy Treasurer of other funds. Mr. Zambello is an employee of Fidelity Investments. Previously, Mr. Zambello served as Vice President of FMR's Program Management Group (2009-2011) and Vice President of the Transfer Agent Oversight Group (2005-2009). |
Annual Report
The Board of Trustees of Fidelity Blue Chip Growth Fund voted to pay on September 8, 2014, to shareholders of record at the opening of business on September 5, 2014, a distribution of $3.421 per share derived from capital gains realized from sales of portfolio securities; and a dividend of $0.059 per share from net investment income.
The fund hereby designates as a capital gain dividend with respect to the taxable year ended July 31, 2014, $1,099,559,018, or, if subsequently determined to be different, the net capital gain of such year.
The fund designates 100% of the dividends distributed during the fiscal year as qualifying for the dividends-received deduction for corporate shareholders.
The fund designates 100% of the dividends distributed during the fiscal year as amounts which can be taken into account as a dividend for the purposes of the maximum rate under section 1(h)(11) of the Internal Revenue Code.
The fund will notify shareholders in January 2015 of amounts for use in preparing 2014 income tax returns.
Annual Report
Board Approval of Investment Advisory Contracts and Management Fees
Fidelity Blue Chip Growth Fund
Each year, the Board of Trustees, including the Independent Trustees (together, the Board), votes on the renewal of the management contract with Fidelity Management & Research Company (FMR) and the sub-advisory agreements (together, the Advisory Contracts) for the fund. The Board, assisted by the advice of fund counsel and Independent Trustees' counsel, requests and considers a broad range of information relevant to the renewal of the Advisory Contracts throughout the year.
The Board meets regularly and, at each of its meetings, covers an extensive agenda of topics and materials and considers factors that are relevant to its annual consideration of the renewal of the fund's Advisory Contracts, including the services and support provided to the fund and its shareholders. The Board has established various standing committees (Committees), each composed of and chaired by Independent Trustees with varying backgrounds, to which the Board has assigned specific subject matter responsibilities in order to enhance effective decision-making by the Board. The Board, acting directly and through its Committees, requests and receives information concerning the annual consideration of the renewal of the fund's Advisory Contracts. The Board also meets as needed to consider matters specifically related to the Board's annual consideration of the renewal of the Advisory Contracts. Members of the Board may also meet with trustees of other Fidelity funds through ad hoc joint committees to discuss certain matters relevant to the Fidelity funds.
At its July 2014 meeting, the Board, including the Independent Trustees, unanimously determined to renew the fund's Advisory Contracts. In reaching its determination, the Board considered all factors it believed relevant, including (i) the nature, extent, and quality of the services to be provided to the fund and its shareholders (including the investment performance of the fund); (ii) the competitiveness of the fund's management fee and total expense ratio relative to peer funds; (iii) the total costs of the services to be provided by and the profits to be realized by Fidelity from its relationship with the fund; (iv) the extent to which economies of scale exist and would be realized as the fund grows; and (v) whether fee levels reflect these economies of scale, if any, for the benefit of fund shareholders. In connection with separate internal corporate reorganizations involving Fidelity Management & Research (U.K.) Inc. (FMR U.K.) and Fidelity Management & Research (Japan) Inc. (FMR Japan), the Board approved certain non-material amendments to the fund's sub-advisory agreements with FMR U.K. and FMR Japan to reflect that, after these reorganizations, FMR Investment Management (UK) Limited and Fidelity Management & Research (Japan) Limited will carry on the business of FMR U.K. and FMR Japan, respectively. The Board noted that no changes to the portfolio managers or to the foreign research or investment advisory services provided to the fund were expected in connection with either reorganization and that the same personnel and resources would continue to be available to the fund at the new entities.
Annual Report
In considering whether to renew the Advisory Contracts for the fund, the Board reached a determination, with the assistance of fund counsel and Independent Trustees' counsel and through the exercise of its business judgment, that the renewal of the Advisory Contracts was in the best interests of the fund and its shareholders and that the compensation payable under the Advisory Contracts was fair and reasonable. The Board's decision to renew the Advisory Contracts was not based on any single factor, but rather was based on a comprehensive consideration of all the information provided to the Board at its meetings throughout the year. The Board, in reaching its determination to renew the Advisory Contracts, was aware that shareholders of the fund have a broad range of investment choices available to them, including a wide choice among funds offered by Fidelity's competitors, and that the fund's shareholders, who have the opportunity to review and weigh the disclosure provided by the fund in its prospectus and other public disclosures, have chosen to invest in this fund, which is part of the Fidelity family of funds.
Nature, Extent, and Quality of Services Provided. The Board considered Fidelity's staffing as it relates to the fund, including the backgrounds of investment personnel of FMR and the sub-advisers (together, the Investment Advisers), and also considered the fund's investment objective, strategies, and related investment philosophy. The Independent Trustees also had discussions with senior management of Fidelity's investment operations and investment groups. The Board considered the structure of the portfolio manager compensation program and whether this structure provides appropriate incentives to act in the best interests of the fund. Additionally, the Board considered the portfolio managers' investments, if any, in the funds that they manage.
Resources Dedicated to Investment Management and Support Services. The Board and the Fund Oversight and Research Committees reviewed the general qualifications and capabilities of Fidelity's investment staff, including its size, education, experience, and resources, as well as Fidelity's approach to recruiting, training, managing, and compensating investment personnel. The Board noted that Fidelity has continued to increase the resources devoted to non-U.S. offices, including expansion of Fidelity's global investment organization. The Board also noted that Fidelity's analysts have extensive resources, tools and capabilities that allow them to conduct sophisticated quantitative and fundamental analysis, as well as credit analysis of issuers, counterparties and guarantors. Further, the Board believes that Fidelity's investment professionals have sufficient access to global information and data so as to provide competitive investment results over time, and that those professionals also have access to sophisticated tools that permit them to assess portfolio construction and risk and performance attribution characteristics continuously, as well as to transmit new information and research conclusions rapidly around the world. Additionally, in its deliberations, the Board considered Fidelity's trading and risk management capabilities and resources and global compliance infrastructure, which are an integral part of the investment management process.
Annual Report
Board Approval of Investment Advisory Contracts and
Management Fees - continued
Shareholder and Administrative Services. The Board considered (i) the nature, extent, quality, and cost of advisory, administrative, and shareholder services performed by the Investment Advisers and their affiliates under the Advisory Contracts and under separate agreements covering transfer agency, pricing and bookkeeping, and securities lending services for the fund; (ii) the nature and extent of the supervision of third party service providers, principally custodians and subcustodians; and (iii) the resources devoted to, and the record of compliance with, the fund's compliance policies and procedures. The Board also reviewed the allocation of fund brokerage, including allocations to brokers affiliated with the Investment Advisers, the use of brokerage commissions to pay fund expenses, and the use of "soft" commission dollars to pay for research services.
The Board noted that the growth of fund assets over time across the complex allows Fidelity to reinvest in the development of services designed to enhance the value or convenience of the Fidelity funds as investment vehicles. These services include 24-hour access to account information and market information through telephone representatives and over the Internet, investor education materials and asset allocation tools, and the expanded availability of Fidelity Investor Centers.
In 2014, the Board formed an ad hoc Committee on Transfer Agency Fees to review the variety of transfer agency fee structures throughout the industry and Fidelity's competitive positioning with respect to industry participants.
Investment in a Large Fund Family. The Board considered the benefits to shareholders of investing in a Fidelity fund, including the benefits of investing in a fund that is part of a large family of funds offering a variety of investment disciplines and providing a large variety of mutual fund investor services. The Board noted that Fidelity had taken, or had made recommendations that resulted in the Fidelity funds taking, a number of actions over the previous year that benefited particular funds, including (i) continuing to dedicate additional resources to investment research and to the support of the senior management team that oversees asset management; (ii) persisting in efforts to enhance Fidelity's global research capabilities; (iii) launching new funds and making other enhancements to meet client needs for income-oriented solutions; (iv) reducing fund expenses for certain index funds; (v) continuing to launch dedicated lower cost underlying funds to meet portfolio construction needs related to expanding underlying fund options for Fidelity funds of funds, specifically for the Freedom Fund product lines; (vi) rationalizing product lines and gaining increased efficiencies through fund mergers; (vii) launching sector-based exchange-traded funds and establishing a new Fidelity adviser to manage sector-based funds and products; (viii) continuing to develop and implement technology to improve security and increase efficiency; (ix) modifying the eligibility criteria for certain share classes to increase their marketability to a portion of the defined contribution plan market; (x) waiving redemption fees for certain qualified fund-of-fund and wrap programs and certain retirement plan transactions; and (xi) launching new Institutional Class shares of certain money market funds to attract and retain assets and to fill a gap in the money market fund lineup.
Annual Report
Investment Performance. The Board considered whether the fund has operated in accordance with its investment objective, as well as its record of compliance with its investment restrictions and its performance history.
The Board took into account discussions with the Investment Advisers about fund investment performance that occur at Board meetings throughout the year. In this regard the Board noted that as part of regularly scheduled fund reviews and other reports to the Board on fund performance, the Board periodically considers annualized return information for the fund, for different time periods, measured against a securities market index ("benchmark index") and a peer group of funds with similar objectives ("peer group"). In its evaluation of fund investment performance, the Board gave particular attention to information indicating changes in performance of certain Fidelity funds for specific time periods and the Investment Advisers' explanations for any overperformance or underperformance.
In addition to reviewing absolute and relative fund performance, the Independent Trustees periodically consider the appropriateness of fund performance metrics in evaluating the results achieved. In general, the Independent Trustees believe that fund performance should be evaluated based on net performance (after fees and expenses) of both the highest performing and lowest performing classes, where applicable, compared to appropriate benchmark indices, over appropriate time periods which may include full market cycles, and compared to peer groups, as applicable, over the same periods, taking into account relevant factors including the following: general market conditions; issuer-specific information; tactical opportunities for investment; and fund cash flows and other factors.
The Independent Trustees recognize that shareholders evaluate performance on a net basis over their own holding periods, for which one-, three-, and five-year periods are often used as a proxy. For this reason, the performance information reviewed by the Board also included net cumulative calendar year total return information for the fund and an appropriate benchmark index and peer group for the most recent one-, three-, and five-year periods, as shown below. Returns are shown compared to the 25th percentile (top of box, 75% beaten) and 75th percentile (bottom of box, 25% beaten) of the peer universe.
Annual Report
Board Approval of Investment Advisory Contracts and
Management Fees - continued
Fidelity Blue Chip Growth Fund

The Board also considered that the fund's management fee is subject to upward or downward adjustment depending upon whether, and to what extent, the fund's investment performance for the performance period exceeds, or is exceeded by, a securities index, thus leading to a performance adjustment for the same period. The Board noted that the performance adjustment provides FMR with a strong economic incentive to seek to achieve superior performance for the fund's shareholders and helps to more closely align the interests of FMR and the fund's shareholders.
Based on its review, the Board concluded that the nature, extent, and quality of services provided to the fund under the Advisory Contracts should benefit the fund's shareholders.
Competitiveness of Management Fee and Total Expense Ratio. The Board considered the fund's management fee and total expense ratio compared to "mapped groups" of competitive funds and classes. Fidelity creates "mapped groups" by combining similar Lipper investment objective categories that have comparable investment mandates. Combining Lipper investment objective categories aids the Board's management fee and total expense ratio comparisons by broadening the competitive group used for comparison and by reducing the number of universes to which various Fidelity funds are compared.
Management Fee. The Board considered two proprietary management fee comparisons for the 12-month periods shown in the chart below. The group of Lipper funds used by the Board for management fee comparisons is referred to below as the "Total Mapped Group." The Total Mapped Group comparison focuses on a fund's standing in terms of gross management fees before expense reimbursements or caps, and without giving effect to the fund's performance adjustment, relative to the total universe of funds with comparable investment mandates, regardless of whether their management fee structures also are comparable. Funds with comparable investment mandates offer exposure to similar types of securities. Funds with comparable management fee structures have similar management fee contractual arrangements (e.g., flat rate charged for advisory services, all-inclusive fee rate, etc.). "TMG %" represents the percentage of funds in the Total Mapped Group that had management fees that were lower than the fund's. For example, a hypothetical TMG % of 20% would mean that 80% of the funds in the Total Mapped Group had higher, and 20% had lower, management fees than the fund. The fund's actual TMG %s are in the chart below. The "Asset-Size Peer Group" (ASPG) comparison focuses on a fund's standing relative to a subset of non-Fidelity funds within the Total Mapped Group that are similar in size and management fee structure. For example, if a fund is in the first quartile of the ASPG, the fund's management fee ranks in the least expensive or lowest 25% of funds in the ASPG. The ASPG represents at least 15% of the funds in the Total Mapped Group with comparable asset size and management fee structures, subject to a minimum of 50 funds (or all funds in the Total Mapped Group if fewer than 50). Additional information, such as the ASPG quartile in which the fund's management fee rate ranked and the impact of the fund's performance adjustment, is also included in the chart and considered by the Board.
Annual Report
Fidelity Blue Chip Growth Fund
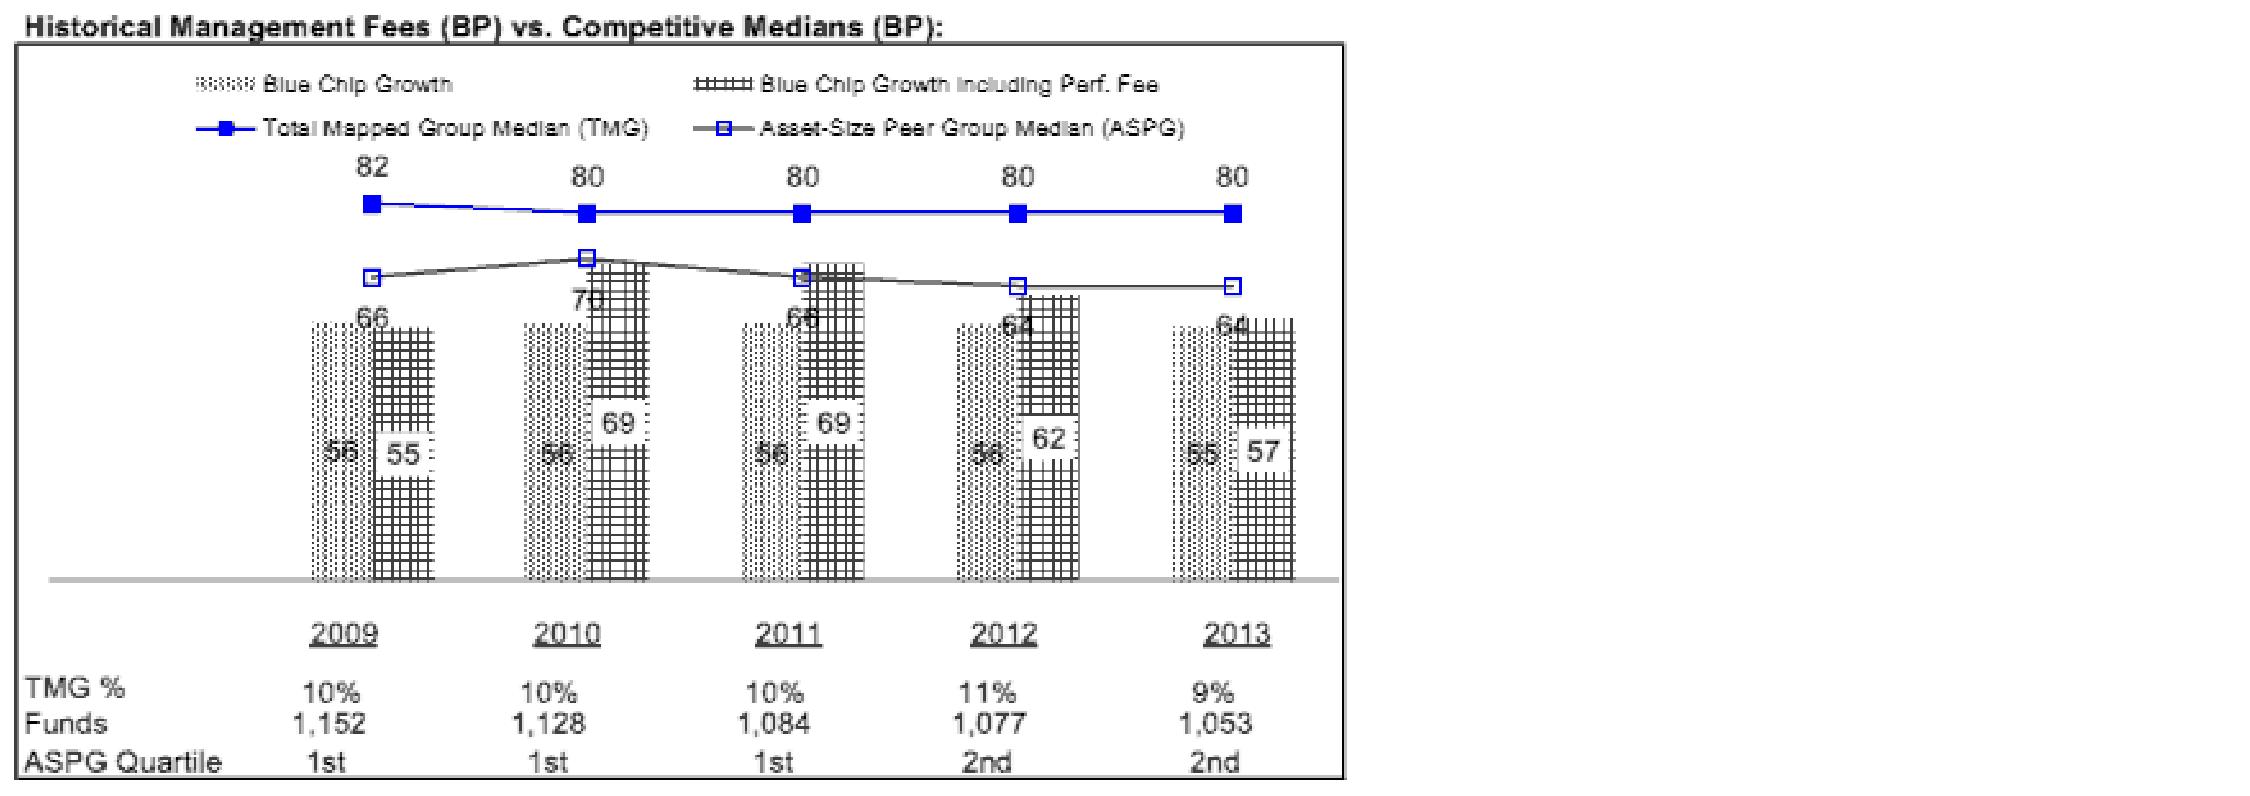
The Board noted that the fund's management fee rate ranked below the median of its Total Mapped Group and below the median of its ASPG for 2013. The Board also noted the effect of the fund's positive performance adjustment on the fund's management fee ranking.
Annual Report
Board Approval of Investment Advisory Contracts and
Management Fees - continued
Furthermore, the Board considered that shareholders approved a prospective change in the index used to calculate the fund's performance adjustment beginning June 1, 2006. The Board also considered that, because the performance adjustment is based on a rolling 36- month measurement period, during a transition period the fund's performance is compared to a blended index return that reflects the performance of the former index for the portion of the measurement period prior to June 1, 2006 and the performance of the current index for the remainder of the measurement period. The Board noted that the fund's performance adjustment for 2009 shown in the chart above reflects the effect of using the blended index return to calculate the fund's performance adjustment.
The Board also noted that, in August 2013, the ad hoc Committee on Management Fees was formed to conduct an in-depth review of the management fee rates of Fidelity's active equity mutual funds. The Committee focused on the following areas: (i) standard fee structures; (ii) research consumption and trading evolution; (iii) management fee competitiveness/profitability by category; and (iv) factors that drive institutional pricing.
Based on its review, the Board concluded that the fund's management fee is fair and reasonable in light of the services that the fund receives and the other factors considered.
Total Expense Ratio. In its review of each class's total expense ratio, the Board considered the fund's management fee as well as other fund or class expenses, as applicable, such as transfer agent fees, pricing and bookkeeping fees, and custodial, legal, and audit fees. The Board also noted the effects of any waivers and reimbursements on fees and expenses, as well as the impact of the fund's performance adjustment. As part of its review, the Board also considered the current and historical total expense ratios of each class of the fund compared to competitive fund median expenses. Each class of the fund is compared to those funds and classes in the Total Mapped Group (used by the Board for management fee comparisons) that have a similar sales load structure.
The Board noted that the total expense ratio of each class ranked below its competitive median for 2013.
Fees Charged to Other Fidelity Clients. The Board also considered Fidelity fee structures and other information with respect to clients of Fidelity, such as other funds advised or subadvised by Fidelity, pension plan clients, and other institutional clients. The Board noted the findings of the 2013 ad hoc joint committee (created with the board of other Fidelity funds), which reviewed and compared Fidelity's institutional investment advisory business with its business of providing services to the Fidelity funds, including the differences in services provided, fees charged, and costs incurred, as well as competition in their respective marketplaces.
Annual Report
Based on its review of total expense ratios and fees charged to other Fidelity clients, the Board concluded that the total expense ratio of each class of the fund was reasonable in light of the services that the fund and its shareholders receive and the other factors considered.
Costs of the Services and Profitability. The Board considered the revenues earned and the expenses incurred by Fidelity in conducting the business of developing, marketing, distributing, managing, administering and servicing the fund and servicing the fund's shareholders. The Board also considered the level of Fidelity's profits in respect of all the Fidelity funds.
On an annual basis, Fidelity presents to the Board Fidelity's profitability for the fund. Fidelity calculates the profitability for each fund, as well as aggregate profitability for groups of Fidelity funds and all Fidelity funds, using a series of detailed revenue and cost allocation methodologies which originate with the books and records of Fidelity on which Fidelity's audited financial statements are based. The Audit Committee of the Board reviews any significant changes from the prior year's methodologies.
PricewaterhouseCoopers LLP (PwC), independent registered public accounting firm and auditor to Fidelity and certain Fidelity funds, has been engaged annually by the Board as part of the Board's assessment of Fidelity's profitability analysis. PwC's engagement includes the review and assessment of the methodologies used by Fidelity in determining the revenues and expenses attributable to Fidelity's mutual fund business, and completion of agreed-upon procedures in respect of the mathematical accuracy of fund profitability and its conformity to established allocation methodologies. After considering PwC's reports issued under the engagement and information provided by Fidelity, the Board concluded that while other allocation methods may also be reasonable, Fidelity's profitability methodologies are reasonable in all material respects.
The Board also reviewed Fidelity's non-fund businesses and fall-out benefits related to the mutual fund business as well as cases where Fidelity's affiliates may benefit from or be related to the fund's business.
The Board considered the costs of the services provided by and the profits realized by Fidelity in connection with the operation of the fund and was satisfied that the profitability was not excessive in the circumstances.
Economies of Scale. The Board considered whether there have been economies of scale in respect of the management of the Fidelity funds, whether the Fidelity funds (including the fund) have appropriately benefited from any such economies of scale, and whether there is potential for realization of any further economies of scale. The Board considered the extent to which the fund will benefit from economies of scale through increased services to the fund, through waivers or reimbursements, or through fee or expense ratio reductions. The Board also noted that in 2013, it and the boards of other Fidelity funds created an ad hoc committee (the Economies of Scale Committee) to analyze whether Fidelity attains economies of scale in respect of the management and servicing of the Fidelity funds, whether the Fidelity funds have appropriately benefited from such economies of scale, and whether there is potential for realization of any further economies of scale.
Annual Report
Board Approval of Investment Advisory Contracts and
Management Fees - continued
The Board recognized that the fund's management contract incorporates a "group fee" structure, which provides for lower group fee rates as total group assets increase, and for higher group fee rates as total group assets decrease (with "group assets" defined to include fund assets under FMR's management plus sector fund assets previously under FMR's management and currently managed by Fidelity SelectCo, LLC). FMR calculates the group fee rates based on a tiered asset "breakpoint" schedule that varies based on asset class. The Board considered that the group fee is designed to deliver the benefits of economies of scale to fund shareholders when total Fidelity fund assets increase, even if assets of any particular fund are unchanged or have declined, because some portion of Fidelity's costs are attributable to services provided to all Fidelity funds, and all funds benefit if those costs can be allocated among more assets. The Board concluded that, given the group fee structure, fund shareholders will benefit from lower management fees as group assets increase at the fund complex level, regardless of whether Fidelity achieves any such economies of scale.
The Board concluded, taking into account the analysis of the Economies of Scale Committee, that economies of scale, if any, are being appropriately shared between fund shareholders and Fidelity.
Additional Information Requested by the Board. In order to develop fully the factual basis for consideration of the Fidelity funds' Advisory Contracts, the Board requested and received additional information on certain topics, including: (i) fund performance trends and Fidelity's long-term strategies for certain funds; (ii) Fidelity's strategic marketing and product lineup goals; (iii) the methodology with respect to competitive fund data and peer group classifications; (iv) the arrangements with, and performance of, certain sub-advisers on behalf of the Fidelity funds, as well as certain proposed participating affiliate arrangements; (v) the realization of fall-out benefits in certain Fidelity business units; (vi) Fidelity's group fee structures, including the rationale for the individual fee rates of certain categories of funds and the definition of group assets; (vii) trends regarding industry use of performance fee structures and the performance adjustment methodologies applicable to the Fidelity funds; (viii) additional competitive analysis regarding the total expenses for certain classes; (ix) fund profitability methodology, including Fidelity's cost allocation methodology, and the impact of certain factors on fund profitability results; and (x) the process by which Fidelity determines sub-advisory fees for funds it advises.
Annual Report
Based on its evaluation of all of the conclusions noted above, and after considering all factors it believed relevant, the Board ultimately concluded that the advisory fee structures are fair and reasonable, and that the fund's Advisory Contracts should be renewed.
Annual Report
Investment Adviser
Fidelity Management & Research Company
Boston, MA
Investment Sub-Advisers
FMR Co., Inc.
Fidelity Management & Research
(U.K.) Inc.
Fidelity Management & Research
(Hong Kong) Limited
Fidelity Management & Research
(Japan) Inc.
General Distributor
Fidelity Distributors Corporation
Smithfield, RI
Transfer and Service Agents
Fidelity Investments Institutional
Operations Company, Inc.
Boston, MA
Fidelity Service Company, Inc.
Boston, MA
Custodian
Citibank, N.A.
New York, NY
The Fidelity Telephone Connection
Mutual Fund 24-Hour Service
Exchanges/Redemptions
and Account Assistance 1-800-544-6666
Product Information 1-800-544-6666
Retirement Accounts 1-800-544-4774
(8 a.m. - 9 p.m.)
TDD Service 1-800-544-0118
for the deaf and hearing impaired
(9 a.m. - 9 p.m. Eastern time)
Fidelity Automated Service
Telephone (FAST®)
1-800-544-5555
Automated line for quickest service
(Fidelity Investment logo)(registered trademark)
Corporate Headquarters
245 Summer St., Boston, MA 02210
www.fidelity.com
BCF-UANN-0914
1.789244.111
Fidelity®
Dividend Growth
Fund
Annual Report
July 31, 2014
(Fidelity Cover Art)
Contents
Performance | (Click Here) | How the fund has done over time. |
Management's Discussion of Fund Performance | (Click Here) | The Portfolio Manager's review of fund performance and strategy. |
Shareholder Expense Example | (Click Here) | An example of shareholder expenses. |
Investment Changes | (Click Here) | A summary of major shifts in the fund's investments over the past six months. |
Investments | (Click Here) | A complete list of the fund's investments with their market values. |
Financial Statements | (Click Here) | Statements of assets and liabilities, operations, and changes in net assets, as well as financial highlights. |
Notes | (Click Here) | Notes to the financial statements. |
Report of Independent Registered Public Accounting Firm | (Click Here) | |
Trustees and Officers | (Click Here) | |
Distributions | (Click Here) | |
Board Approval of Investment Advisory Contracts and Management Fees | (Click Here) | |
To view a fund's proxy voting guidelines and proxy voting record for the 12-month period ended June 30, visit http://www.fidelity.com/proxyvotingresults or visit the Securities and Exchange Commission's (SEC) web site at http://www.sec.gov. You may also call 1-800-544-8544 to request a free copy of the proxy voting guidelines.
Standard & Poor's, S&P and S&P 500 are registered service marks of The McGraw-Hill Companies, Inc. and have been licensed for use by Fidelity Distributors Corporation.
Other third-party marks appearing herein are the property of their respective owners.
All other marks appearing herein are registered or unregistered trademarks or service marks of FMR LLC or an affiliated company. © 2014 FMR LLC. All rights reserved.
Annual Report
This report and the financial statements contained herein are submitted for the general information of the shareholders of the fund. This report is not authorized for distribution to prospective investors in the fund unless preceded or accompanied by an effective prospectus.
A fund files its complete schedule of portfolio holdings with the SEC for the first and third quarters of each fiscal year on Form N-Q. Forms N-Q are available on the SEC's web site at http://www.sec.gov. A fund's Forms N-Q may be reviewed and copied at the SEC's Public Reference Room in Washington, DC. Information regarding the operation of the SEC's Public Reference Room may be obtained by calling 1-800-SEC-0330. For a complete list of a fund's portfolio holdings, view the most recent holdings listing, semiannual report, or annual report on Fidelity's web site at http://www.fidelity.com, http://www.advisor.fidelity.com, or http://www.401k.com, as applicable.
NOT FDIC INSURED • MAY LOSE VALUE • NO BANK GUARANTEE
Neither the fund nor Fidelity Distributors Corporation is a bank.
Annual Report
Average annual total return reflects the change in the value of an investment, assuming reinvestment of the class' distributions from dividend income and capital gains (the profits earned upon the sale of securities that have grown in value, if any) and assuming a constant rate of performance each year. The $10,000 table and the fund's returns do not reflect the deduction of taxes that a shareholder would pay on fund distributions or the redemption of fund shares. During periods of reimbursement by Fidelity, a fund's total return will be greater than it would be had the reimbursement not occurred. How a fund did yesterday is no guarantee of how it will do tomorrow.
Average Annual Total Returns
Periods ended July 31, 2014 | Past 1
year | Past 5
years | Past 10
years |
Fidelity® Dividend Growth Fund | 17.30% | 16.52% | 7.44% |
$10,000 Over 10 Years
Let's say hypothetically that $10,000 was invested in Fidelity® Dividend Growth Fund, a class of the fund, on July 31, 2004. The chart shows how the value of your investment would have changed, and also shows how the S&P 500® Index performed over the same period.
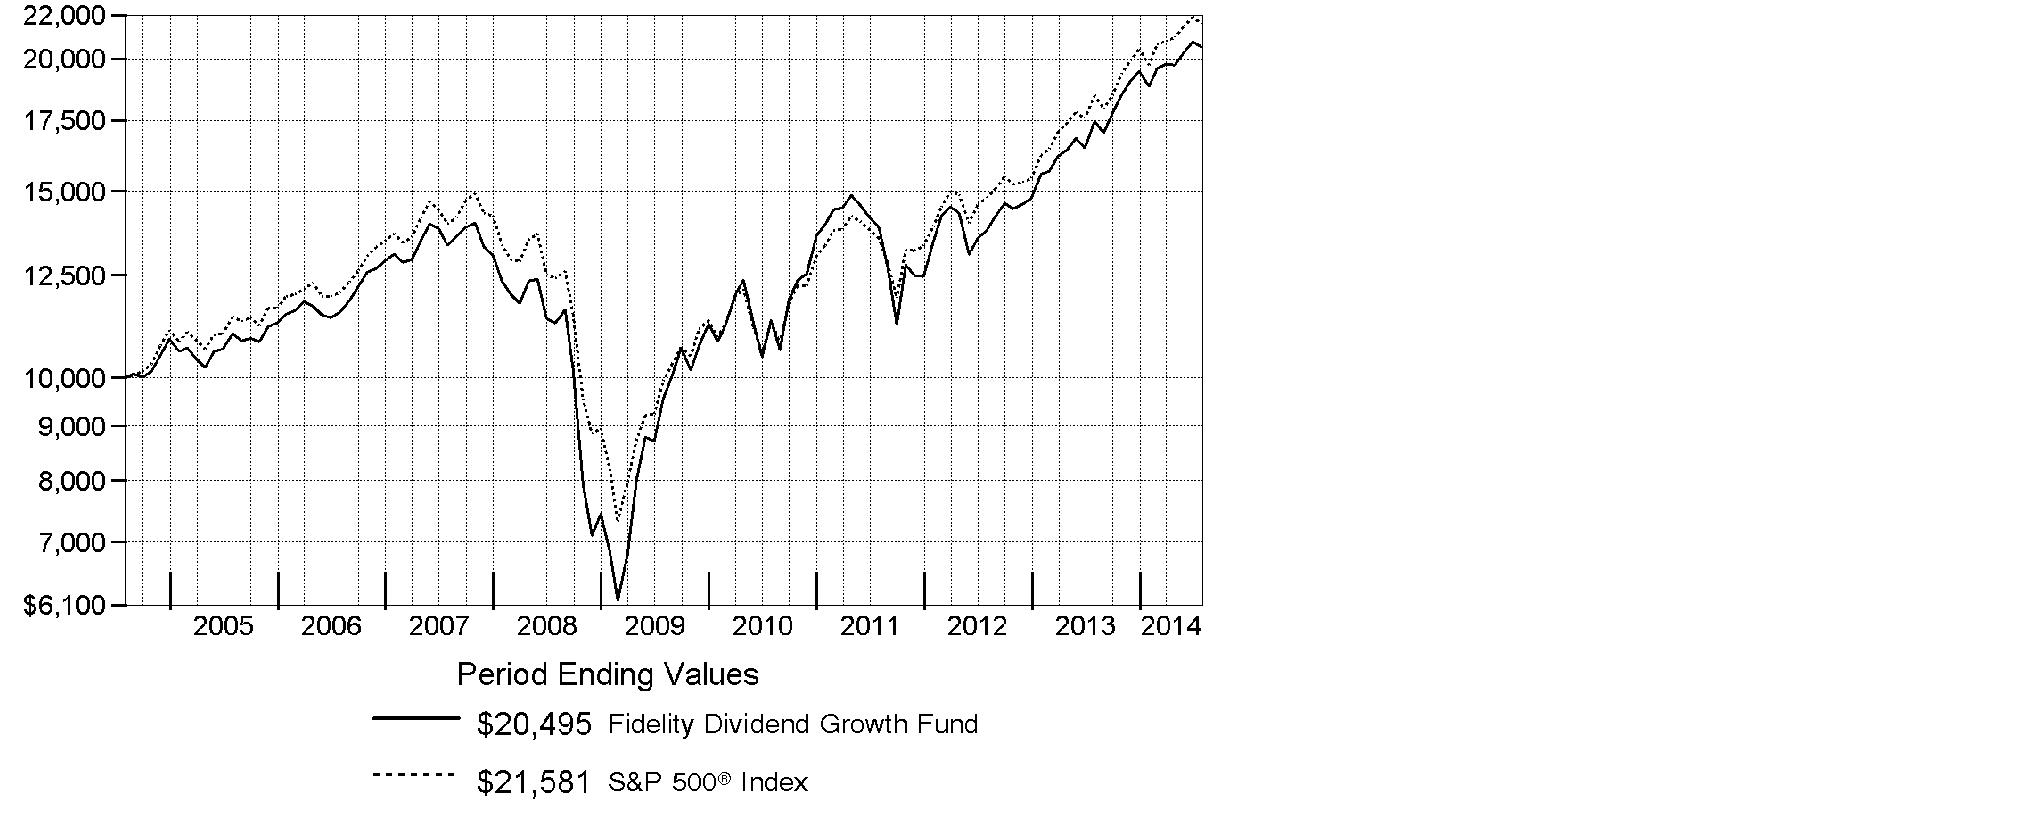
Annual Report
Market Recap: U.S. stocks overcame a slowing economy early in 2014 to post a strong gain for the 12-month period ending July 31, 2014, supported by corporate profits and continued low interest rates. The S&P 500® Index rose 16.94%, reaching an all-time high near period end. The technology-heavy Nasdaq Composite Index® gained 22.00%. The Russell 2000® Index returned 8.56%, reflecting the relatively lackluster performance of small-cap stocks. Information technology (+28%) was the top-performing sector within the S&P 500®, driven by strong semiconductor and computer hardware sales. Materials (+23%) gained amid higher prices for many commodity products. Health care (+21%) rose, driven by gains in pharmaceuticals, biotechnology & life sciences companies. Energy stocks (+19%) advanced in the latter part of the period amid healthy U.S. output and the threat of supply disruptions in Iraq. Conversely, most defensive sectors, including consumer staples, utilities and telecommunication services, lagged the broader market. Volatility remained tame throughout most of the period, with markets supported by declining unemployment, near-record profit margins for companies, muted cost inflation and fairly low corporate debt levels. Geopolitical tension remained a concern at period end, with conflict in Ukraine and strained relations between Russia and the West posing a potential threat to global growth.
Comments from Ramona Persaud, who became Portfolio Manager of Fidelity® Dividend Growth Fund on January 1, 2014: For the year, the fund's Retail Class shares returned 17.30%, outpacing the S&P 500®. Versus the index, capital goods conglomerate General Electric was the fund's top individual contributor, largely due to timely ownership. We captured a nice gain as shares climbed during the first half of the period, but I sold the stake on valuation concerns just as I came onto the fund, which happened to be right before the stock fell. Elsewhere, it helped the fund to avoid the struggling shares of enterprise technology provider IBM through April, after which I established a position and have been adding exposure as the stock's valuation has improved. We also had good picks in health care, including Covidien, as the fund benefited when the medical device maker's stock took off in June on news it would be acquired. Conversely, it hurt the most to avoid index name Intel because the chipmaker benefited from a cyclical improvement in the PC cycle. Comverse also detracted in tech, as the non-index telecommunications software developer struggled amid a turnaround under new management.
The views expressed above reflect those of the portfolio manager(s) only through the end of the period as stated on the cover of this report and do not necessarily represent the views of Fidelity or any other person in the Fidelity organization. Any such views are subject to change at any time based upon market or other conditions and Fidelity disclaims any responsibility to update such views. These views may not be relied on as investment advice and, because investment decisions for a Fidelity fund are based on numerous factors, may not be relied on as an indication of trading intent on behalf of any Fidelity fund.
Annual Report
Shareholder Expense Example
As a shareholder of the Fund, you incur two types of costs: (1) transaction costs, and (2) ongoing costs, including management fees and other Fund expenses. This Example is intended to help you understand your ongoing costs (in dollars) of investing in the Fund and to compare these costs with the ongoing costs of investing in other mutual funds.
The Example is based on an investment of $1,000 invested at the beginning of the period and held for the entire period (February 1, 2014 to July 31, 2014).
Actual Expenses
The first line of the accompanying table for each class of the Fund provides information about actual account values and actual expenses. You may use the information in this line, together with the amount you invested, to estimate the expenses that you paid over the period. Simply divide your account value by $1,000.00 (for example, an $8,600 account value divided by $1,000.00 = 8.6), then multiply the result by the number in the first line for a class of the Fund under the heading entitled "Expenses Paid During Period" to estimate the expenses you paid on your account during this period. A small balance maintenance fee of $12.00 that is charged once a year may apply for certain accounts with a value of less than $2,000. This fee is not included in the table below. If it was, the estimate of expenses you paid during the period would be higher, and your ending account value lower, by this amount. In addition, the Fund, as a shareholder in the underlying Fidelity Central Funds, will indirectly bear its pro-rata share of the fees and expenses incurred by the underlying Fidelity Central Funds. These fees and expenses are not included in the Fund's annualized expense ratio used to calculate the expense estimate in the table below.
Hypothetical Example for Comparison Purposes
The second line of the accompanying table for each class of the Fund provides information about hypothetical account values and hypothetical expenses based on a Class' actual expense ratio and an assumed rate of return of 5% per year before expenses, which is not the Class' actual return. The hypothetical account values and expenses may not be used to estimate the actual ending account balance or expenses you paid for the period. You may use this information to compare the ongoing costs of investing in the Fund and other funds. To do so, compare this 5% hypothetical example with the 5% hypothetical examples that appear in the shareholder reports of the other funds. A small balance maintenance fee of $12.00 that is charged once a year may apply for certain accounts with a value of less than $2,000. This fee is not included in the table below. If it was, the estimate of expenses you paid during the period would be higher, and your ending account value lower, by this amount. In addition, the Fund, as a shareholder in the underlying Fidelity Central Funds, will indirectly bear its pro-rata share of the fees and expenses incurred by the underlying Fidelity Central Funds. These fees and expenses are not included in the Fund's annualized expense ratio used to calculate the expense estimate in the table below.
Please note that the expenses shown in the table are meant to highlight your ongoing costs only and do not reflect any transaction costs. Therefore, the second line of the table is useful in comparing ongoing costs only, and will not help you determine the relative total costs of owning different funds.
Annual Report
Shareholder Expense Example - continued
| Annualized
Expense RatioB | Beginning
Account Value
February 1, 2014 | Ending
Account Value
July 31, 2014 | Expenses Paid
During Period*
February 1, 2014
to July 31, 2014 |
Dividend Growth | .55% | | | |
Actual | | $ 1,000.00 | $ 1,089.40 | $ 2.85 |
HypotheticalA | | $ 1,000.00 | $ 1,022.07 | $ 2.76 |
Class K | .42% | | | |
Actual | | $ 1,000.00 | $ 1,090.40 | $ 2.18 |
HypotheticalA | | $ 1,000.00 | $ 1,022.71 | $ 2.11 |
A 5% return per year before expenses
B Annualized expense ratio reflects expenses net of applicable fee waivers.
* Expenses are equal to each Class' annualized expense ratio, multiplied by the average account value over the period, multiplied by 181/365 (to reflect the one-half year period).
Annual Report
Investment Changes (Unaudited)
Top Ten Stocks as of July 31, 2014 |
| % of fund's
net assets | % of fund's net assets
6 months ago |
Apple, Inc. | 4.0 | 3.0 |
Exxon Mobil Corp. | 2.6 | 2.8 |
JPMorgan Chase & Co. | 2.5 | 2.1 |
Microsoft Corp. | 2.4 | 2.6 |
Johnson & Johnson | 2.3 | 2.0 |
Chevron Corp. | 2.2 | 2.1 |
Wells Fargo & Co. | 2.1 | 2.2 |
Verizon Communications, Inc. | 1.9 | 0.0 |
Oracle Corp. | 1.7 | 1.6 |
Amgen, Inc. | 1.6 | 1.7 |
| 23.3 | |
Top Five Market Sectors as of July 31, 2014 |
| % of fund's
net assets | % of fund's net assets
6 months ago |
Information Technology | 19.6 | 19.4 |
Financials | 15.9 | 14.7 |
Health Care | 14.0 | 11.8 |
Consumer Discretionary | 11.9 | 13.1 |
Consumer Staples | 10.7 | 11.7 |
Asset Allocation (% of fund's net assets) |
As of July 31, 2014* | As of January 31, 2014** |
| Stocks and
Equity Futures 97.0% | | | Stocks and
Equity Futures 97.4% | |
 | Convertible
Securities 0.5% | | | Convertible
Securities 0.2% | |
 | Other Investments 0.1% | | | Other Investments 0.1% | |
| Short-Term
Investments and
Net Other Assets (Liabilities) 2.4% | |  | Short-Term
Investments and
Net Other Assets (Liabilities) 2.3% | |
* Foreign investments | 14.0% | | ** Foreign investments | 17.0% | |

Annual Report
Investments July 31, 2014
Showing Percentage of Net Assets
Common Stocks - 96.5% |
| Shares | | Value (000s) |
CONSUMER DISCRETIONARY - 11.5% |
Auto Components - 0.8% |
Johnson Controls, Inc. | 1,415,436 | | $ 66,865 |
Diversified Consumer Services - 0.6% |
H&R Block, Inc. | 1,567,620 | | 50,368 |
Hotels, Restaurants & Leisure - 2.0% |
ARAMARK Holdings Corp. | 1,654,400 | | 44,603 |
Brinker International, Inc. | 909,961 | | 40,803 |
Darden Restaurants, Inc. (e) | 1,286,100 | | 60,125 |
Wyndham Worldwide Corp. | 348,191 | | 26,306 |
| | 171,837 |
Household Durables - 0.5% |
Taylor Wimpey PLC | 22,670,137 | | 42,599 |
Media - 4.1% |
Altice S.A. | 360,400 | | 20,682 |
Atresmedia Corporacion de Medios de Comunicacion SA (e) | 1,881,566 | | 27,689 |
CBS Corp. Class B | 840,642 | | 47,774 |
Comcast Corp. Class A | 1,868,696 | | 100,405 |
MDC Partners, Inc. Class A (sub. vtg.) | 1,085,908 | | 22,797 |
Time Warner Cable, Inc. | 349,200 | | 50,669 |
Time Warner, Inc. | 936,217 | | 77,725 |
| | 347,741 |
Multiline Retail - 0.4% |
Dillard's, Inc. Class A | 302,900 | | 36,112 |
Specialty Retail - 1.9% |
AutoZone, Inc. (a) | 134,100 | | 69,334 |
Foot Locker, Inc. | 943,079 | | 44,825 |
GameStop Corp. Class A | 1,039,900 | | 43,645 |
VT Holdings Co. Ltd. | 537,100 | | 2,880 |
| | 160,684 |
Textiles, Apparel & Luxury Goods - 1.2% |
NIKE, Inc. Class B | 644,364 | | 49,700 |
VF Corp. | 860,800 | | 52,741 |
| | 102,441 |
TOTAL CONSUMER DISCRETIONARY | | 978,647 |
CONSUMER STAPLES - 10.7% |
Beverages - 3.5% |
Dr. Pepper Snapple Group, Inc. | 1,278,208 | | 75,108 |
Common Stocks - continued |
| Shares | | Value (000s) |
CONSUMER STAPLES - continued |
Beverages - continued |
PepsiCo, Inc. | 1,237,600 | | $ 109,033 |
The Coca-Cola Co. | 2,826,138 | | 111,039 |
| | 295,180 |
Food & Staples Retailing - 2.5% |
Alimentation Couche-Tard, Inc. Class B (sub. vtg.) | 795,100 | | 21,760 |
Kroger Co. | 1,776,209 | | 86,999 |
Rami Levi Chain Stores Hashikma Marketing 2006 Ltd. | 489,201 | | 24,274 |
Tsuruha Holdings, Inc. | 125,500 | | 7,204 |
Walgreen Co. | 1,097,936 | | 75,505 |
| | 215,742 |
Food Products - 1.7% |
Archer Daniels Midland Co. | 1,082,060 | | 50,208 |
Bunge Ltd. | 478,580 | | 37,731 |
Greencore Group PLC | 7,964,077 | | 35,537 |
Hilton Food Group PLC | 641,474 | | 5,136 |
Kellogg Co. | 266,800 | | 15,963 |
| | 144,575 |
Tobacco - 3.0% |
British American Tobacco PLC (United Kingdom) | 1,445,503 | | 84,681 |
Japan Tobacco, Inc. | 1,924,300 | | 67,673 |
Lorillard, Inc. | 1,096,256 | | 66,302 |
Philip Morris International, Inc. | 458,000 | | 37,561 |
| | 256,217 |
TOTAL CONSUMER STAPLES | | 911,714 |
ENERGY - 10.2% |
Energy Equipment & Services - 0.7% |
Aspen Aerogels, Inc. (a) | 754,877 | | 6,115 |
National Oilwell Varco, Inc. | 625,842 | | 50,718 |
| | 56,833 |
Oil, Gas & Consumable Fuels - 9.5% |
Access Midstream Partners LP | 400,136 | | 24,096 |
Chevron Corp. | 1,466,600 | | 189,543 |
ConocoPhillips Co. | 1,118,647 | | 92,288 |
Emerald Oil, Inc. warrants 2/4/16 (a) | 171,198 | | 0 |
EQT Midstream Partners LP | 493,800 | | 42,733 |
Exxon Mobil Corp. | 2,271,797 | | 224,772 |
MPLX LP | 867,322 | | 49,221 |
Common Stocks - continued |
| Shares | | Value (000s) |
ENERGY - continued |
Oil, Gas & Consumable Fuels - continued |
Northern Oil & Gas, Inc. (a) | 1,886,790 | | $ 30,358 |
Phillips 66 Partners LP | 599,536 | | 38,340 |
PrairieSky Royalty Ltd. (e) | 895,600 | | 32,363 |
Suncor Energy, Inc. | 1,564,400 | | 64,235 |
TAG Oil Ltd. (a)(e)(f) | 3,116,900 | | 7,147 |
TAG Oil Ltd. (a)(e)(f)(g) | 146,900 | | 337 |
Woodside Petroleum Ltd. | 437,638 | | 17,179 |
| | 812,612 |
TOTAL ENERGY | | 869,445 |
FINANCIALS - 15.8% |
Banks - 9.6% |
Bank of America Corp. | 8,042,617 | | 122,650 |
Citigroup, Inc. | 2,324,961 | | 113,714 |
JPMorgan Chase & Co. | 3,665,835 | | 211,409 |
Nordea Bank AB | 4,045,990 | | 54,430 |
SunTrust Banks, Inc. | 1,132,300 | | 43,084 |
U.S. Bancorp | 2,328,269 | | 97,857 |
Wells Fargo & Co. | 3,541,093 | | 180,242 |
| | 823,386 |
Capital Markets - 1.8% |
Ameriprise Financial, Inc. | 355,600 | | 42,530 |
BlackRock, Inc. Class A | 121,080 | | 36,897 |
Carlyle Group LP | 438,707 | | 14,644 |
Monex Group, Inc. | 4,910,700 | | 15,776 |
The Blackstone Group LP | 1,344,784 | | 43,948 |
| | 153,795 |
Consumer Finance - 1.0% |
Capital One Financial Corp. | 1,053,567 | | 83,801 |
Diversified Financial Services - 0.8% |
McGraw Hill Financial, Inc. | 863,727 | | 69,288 |
Insurance - 2.5% |
Allied World Assurance Co. Holdings Ltd. | 1,782,724 | | 64,196 |
Aspen Insurance Holdings Ltd. | 989,358 | | 39,584 |
Reinsurance Group of America, Inc. | 377,014 | | 30,259 |
The Chubb Corp. | 195,700 | | 16,969 |
The Travelers Companies, Inc. | 649,168 | | 58,139 |
| | 209,147 |
Common Stocks - continued |
| Shares | | Value (000s) |
FINANCIALS - continued |
Thrifts & Mortgage Finance - 0.1% |
WSFS Financial Corp. | 110,701 | | $ 7,925 |
TOTAL FINANCIALS | | 1,347,342 |
HEALTH CARE - 14.0% |
Biotechnology - 2.6% |
Amgen, Inc. | 1,105,110 | | 140,780 |
Gilead Sciences, Inc. (a) | 906,241 | | 82,966 |
| | 223,746 |
Health Care Equipment & Supplies - 2.2% |
Covidien PLC | 1,116,900 | | 96,623 |
Medtronic, Inc. | 622,600 | | 38,439 |
The Cooper Companies, Inc. | 333,784 | | 53,699 |
| | 188,761 |
Health Care Providers & Services - 1.9% |
Cardinal Health, Inc. | 1,097,003 | | 78,600 |
McKesson Corp. | 429,258 | | 82,357 |
| | 160,957 |
Health Care Technology - 0.1% |
CompuGroup Medical AG | 424,300 | | 10,568 |
Life Sciences Tools & Services - 1.0% |
Agilent Technologies, Inc. | 855,400 | | 47,979 |
Lonza Group AG | 316,798 | | 35,209 |
| | 83,188 |
Pharmaceuticals - 6.2% |
AbbVie, Inc. | 1,975,651 | | 103,406 |
Astellas Pharma, Inc. | 3,404,000 | | 46,160 |
Horizon Pharma, Inc. warrants 9/25/17 (a) | 932,200 | | 3,829 |
Johnson & Johnson | 1,916,743 | | 191,847 |
Merck & Co., Inc. | 2,078,300 | | 117,923 |
Teva Pharmaceutical Industries Ltd. sponsored ADR | 1,230,700 | | 65,842 |
| | 529,007 |
TOTAL HEALTH CARE | | 1,196,227 |
Common Stocks - continued |
| Shares | | Value (000s) |
INDUSTRIALS - 8.4% |
Aerospace & Defense - 2.6% |
The Boeing Co. | 820,700 | | $ 98,878 |
United Technologies Corp. | 1,143,966 | | 120,288 |
| | 219,166 |
Air Freight & Logistics - 0.9% |
FedEx Corp. | 509,452 | | 74,828 |
Airlines - 0.5% |
Delta Air Lines, Inc. | 1,078,800 | | 40,412 |
Electrical Equipment - 0.2% |
Generac Holdings, Inc. (a) | 489,194 | | 21,231 |
Industrial Conglomerates - 1.9% |
Danaher Corp. | 1,166,392 | | 86,173 |
Roper Industries, Inc. | 523,044 | | 75,355 |
| | 161,528 |
Machinery - 0.5% |
Manitowoc Co., Inc. | 646,375 | | 17,168 |
Valmont Industries, Inc. | 194,500 | | 28,325 |
| | 45,493 |
Professional Services - 0.5% |
Dun & Bradstreet Corp. | 435,202 | | 47,885 |
Road & Rail - 1.3% |
CSX Corp. | 805,322 | | 24,095 |
Union Pacific Corp. | 885,930 | | 87,096 |
| | 111,191 |
TOTAL INDUSTRIALS | | 721,734 |
INFORMATION TECHNOLOGY - 19.6% |
Communications Equipment - 2.3% |
Cisco Systems, Inc. | 4,228,486 | | 106,685 |
QUALCOMM, Inc. | 1,185,883 | | 87,400 |
| | 194,085 |
Electronic Equipment & Components - 0.7% |
TE Connectivity Ltd. | 923,994 | | 57,186 |
Common Stocks - continued |
| Shares | | Value (000s) |
INFORMATION TECHNOLOGY - continued |
Internet Software & Services - 2.4% |
Google, Inc.: | | | |
Class A (a) | 178,612 | | $ 103,515 |
Class C (a) | 178,612 | | 102,095 |
| | 205,610 |
IT Services - 4.1% |
Amdocs Ltd. | 974,082 | | 44,165 |
ASAC II LP (j) | 2,514,134 | | 38,754 |
Computer Sciences Corp. | 552,061 | | 34,443 |
Fidelity National Information Services, Inc. | 1,335,150 | | 75,302 |
IBM Corp. | 358,500 | | 68,714 |
Total System Services, Inc. | 679,785 | | 21,753 |
Visa, Inc. Class A | 292,062 | | 61,628 |
Xerox Corp. | 706,734 | | 9,371 |
| | 354,130 |
Semiconductors & Semiconductor Equipment - 0.3% |
MediaTek, Inc. | 1,823,000 | | 28,145 |
Software - 4.9% |
Activision Blizzard, Inc. | 1,709,717 | | 38,263 |
Comverse, Inc. (a) | 934,877 | | 24,008 |
Electronic Arts, Inc. (a) | 371,503 | | 12,483 |
Microsoft Corp. | 4,715,816 | | 203,535 |
Oracle Corp. | 3,515,560 | | 141,993 |
| | 420,282 |
Technology Hardware, Storage & Peripherals - 4.9% |
Apple, Inc. | 3,561,918 | | 340,406 |
EMC Corp. | 2,644,900 | | 77,496 |
| | 417,902 |
TOTAL INFORMATION TECHNOLOGY | | 1,677,340 |
MATERIALS - 2.7% |
Chemicals - 2.3% |
Cabot Corp. | 487,048 | | 25,516 |
Eastman Chemical Co. | 196,899 | | 15,512 |
LyondellBasell Industries NV Class A | 698,138 | | 74,177 |
Potash Corp. of Saskatchewan, Inc. (e) | 1,506,400 | | 53,481 |
W.R. Grace & Co. (a) | 311,091 | | 28,309 |
Westlake Chem Partners LP (a) | 16,100 | | 489 |
| | 197,484 |
Common Stocks - continued |
| Shares | | Value (000s) |
MATERIALS - continued |
Containers & Packaging - 0.0% |
Nampak Ltd. | 42 | | $ 0* |
Metals & Mining - 0.4% |
Freeport-McMoRan Copper & Gold, Inc. | 867,100 | | 32,273 |
TOTAL MATERIALS | | 229,757 |
TELECOMMUNICATION SERVICES - 2.1% |
Diversified Telecommunication Services - 2.1% |
Verizon Communications, Inc. | 3,342,900 | | 168,549 |
Verizon Communications, Inc. CDI | 292,480 | | 14,931 |
| | 183,480 |
UTILITIES - 1.5% |
Electric Utilities - 1.0% |
Edison International | 689,800 | | 37,801 |
NRG Yield, Inc. Class A | 338,600 | | 17,692 |
Xcel Energy, Inc. | 983,752 | | 30,300 |
| | 85,793 |
Multi-Utilities - 0.5% |
CMS Energy Corp. | 1,383,445 | | 40,023 |
TOTAL UTILITIES | | 125,816 |
TOTAL COMMON STOCKS (Cost $6,680,512) |
8,241,502
|
Convertible Preferred Stocks - 0.4% |
| | | |
CONSUMER DISCRETIONARY - 0.4% |
Auto Components - 0.4% |
Mobileye NV 0.00% (j) (Cost $9,659) | 1,383,745 | |
31,134
|
Convertible Bonds - 0.1% |
| Principal Amount (d) (000s) | | Value (000s) |
ENERGY - 0.1% |
Oil, Gas & Consumable Fuels - 0.1% |
Amyris, Inc. 3% 2/27/17 (Cost $7,356) | | $ 7,356 | | $ 6,132 |
U.S. Treasury Obligations - 0.0% |
|
U.S. Treasury Bills, yield at date of purchase 0.03% 8/21/14 to 10/23/14 (i)
(Cost $2,310) | | 2,310 | |
2,310
|
Preferred Securities - 0.1% |
|
FINANCIALS - 0.1% |
Diversified Financial Services - 0.1% |
Baggot Securities Ltd. 10.24% (g)(h) (Cost $10,674) | EUR | 6,950 | |
10,489
|
Money Market Funds - 4.0% |
| Shares | | |
Fidelity Cash Central Fund, 0.11% (b) | 279,722,596 | | 279,723 |
Fidelity Securities Lending Cash Central Fund, 0.11% (b)(c) | 58,806,419 | | 58,806 |
TOTAL MONEY MARKET FUNDS (Cost $338,529) |
338,529
|
TOTAL INVESTMENT PORTFOLIO - 101.1% (Cost $7,049,040) | | 8,630,096 |
NET OTHER ASSETS (LIABILITIES) - (1.1)% | | (92,508) |
NET ASSETS - 100% | $ 8,537,588 |
Futures Contracts |
| Expiration Date | | Underlying Face Amount at Value (000s) | | Unrealized Appreciation/
(Depreciation) (000s) |
Purchased |
Equity Index Contracts |
476 CME E-mini S&P 500 Index Contracts (United States) | Sept. 2014 | | $ 45,810 | | $ 38 |
|
The face value of futures purchased as a percentage of net assets is 0.5% |
Currency Abbreviations |
EUR | - | European Monetary Unit |
Legend |
(a) Non-income producing |
(b) Affiliated fund that is generally available only to investment companies and other accounts managed by Fidelity Investments. The rate quoted is the annualized seven-day yield of the fund at period end. A complete unaudited listing of the fund's holdings as of its most recent quarter end is available upon request. In addition, each Fidelity Central Fund's financial statements, which are not covered by the Fund's Report of Independent Registered Public Accounting Firm, are available on the SEC's website or upon request. |
(c) Investment made with cash collateral received from securities on loan. |
(d) Amount is stated in United States dollars unless otherwise noted. |
(e) Security or a portion of the security is on loan at period end. |
(f) Affiliated company |
(g) Security exempt from registration under Rule 144A of the Securities Act of 1933. These securities may be resold in transactions exempt from registration, normally to qualified institutional buyers. At the end of the period, the value of these securities amounted to $10,826,000 or 0.1% of net assets. |
(h) Security is perpetual in nature with no stated maturity date. |
(i) Security or a portion of the security was pledged to cover margin requirements for futures contracts. At period end, the value of securities pledged amounted to $2,310,000. |
(j) Restricted securities - Investment in securities not registered under the Securities Act of 1933 (excluding 144A issues). At the end of the period, the value of restricted securities (excluding 144A issues) amounted to $69,888,000 or 0.8% of net assets. |
Additional information on each restricted holding is as follows: |
Security | Acquisition Date | Acquisition Cost (000s) |
ASAC II LP | 10/10/13 | $ 25,141 |
Mobileye NV 0.00% | 8/15/13 | $ 9,659 |
* Amount represents less than $1,000
See accompanying notes which are an integral part of the financial statements.
Annual Report
Investments - continued
Affiliated Central Funds |
Information regarding fiscal year to date income earned by the Fund from investments in Fidelity Central Funds is as follows: |
Fund | Income earned
(Amount in thousands) |
Fidelity Cash Central Fund | $ 172 |
Fidelity Securities Lending Cash Central Fund | 1,384 |
Total | $ 1,556 |
Other Affiliated Issuers |
An affiliated company is a company in which the Fund has ownership of at least 5% of the voting securities. Fiscal year to date transactions with companies which are or were affiliates are as follows: |
Affiliate
(Amount in thousands) | Value,
beginning of
period | Purchases | Sales
Proceeds | Dividend
Income | Value,
end of
period |
Double Eagle Petroleum Co. | $ 3,050 | $ - | $ 2,039 | $ - | $ - |
PICO Holdings, Inc. | 26,509 | - | 27,964 | - | - |
TAG Oil Ltd. | 13,370 | 1,311 | 1,897 | - | 7,147 |
TAG Oil Ltd. (144A) | 548 | - | - | - | 337 |
Total | $ 43,477 | $ 1,311 | $ 31,900 | $ - | $ 7,484 |
Other Information |
The following is a summary of the inputs used, as of July 31, 2014, involving the Fund's assets and liabilities carried at fair value. The inputs or methodology used for valuing securities may not be an indication of the risk associated with investing in those securities. For more information on valuation inputs, and their aggregation into the levels used in the table below, please refer to the Investment Valuation section in the accompanying Notes to Financial Statements. |
Valuation Inputs at Reporting Date: |
Description
(Amounts in thousands) | Total | Level 1 | Level 2 | Level 3 |
Investments in Securities: | | | | |
Equities: | | | | |
Consumer Discretionary | $ 1,009,781 | $ 975,767 | $ 2,880 | $ 31,134 |
Consumer Staples | 911,714 | 752,156 | 159,558 | - |
Energy | 869,445 | 846,151 | 23,294 | - |
Financials | 1,347,342 | 1,331,566 | 15,776 | - |
Health Care | 1,196,227 | 1,146,238 | 49,989 | - |
Valuation Inputs at Reporting Date: |
Description
(Amounts in thousands) | Total | Level 1 | Level 2 | Level 3 |
Investments in Securities: | | | | |
Equities: | | | | |
Industrials | $ 721,734 | $ 721,734 | $ - | $ - |
Information Technology | 1,677,340 | 1,610,441 | 28,145 | 38,754 |
Materials | 229,757 | 229,757 | - | - |
Telecommunication Services | 183,480 | 183,480 | - | - |
Utilities | 125,816 | 125,816 | - | - |
Corporate Bonds | 6,132 | - | 6,132 | - |
U.S. Government and Government Agency Obligations | 2,310 | - | 2,310 | - |
Preferred Securities | 10,489 | - | 10,489 | - |
Money Market Funds | 338,529 | 338,529 | - | - |
Total Investments in Securities: | $ 8,630,096 | $ 8,261,635 | $ 298,573 | $ 69,888 |
Derivative Instruments: | | | | |
Assets | | | | |
Futures Contracts | $ 38 | $ 38 | $ - | $ - |
Value of Derivative Instruments |
The following table is a summary of the Fund's value of derivative instruments by primary risk exposure as of July 31, 2014. For additional information on derivative instruments, please refer to the Derivative Instruments section in the accompanying Notes to Financial Statements. |
Primary Risk Exposure /
Derivative Type | Value
(000's) |
| Asset | Liability |
Equity Risk | | |
Futures Contracts (a) | $ 38 | $ - |
Total Value of Derivatives | $ 38 | $ - |
(a) Reflects gross cumulative appreciation (depreciation) on futures contracts as presented in the Schedule of Investments. Only the period end receivable or payable for daily variation margin and net unrealized appreciation (depreciation) are presented in the Statement of Assets and Liabilities. |
Other Information |
Distribution of investments by country or territory of incorporation, as a percentage of total net assets, is as follows (Unaudited): |
United States of America | 86.0% |
Canada | 2.3% |
Switzerland | 1.8% |
Japan | 1.7% |
Ireland | 1.6% |
United Kingdom | 1.6% |
Netherlands | 1.3% |
Israel | 1.1% |
Others (Individually Less Than 1%) | 2.6% |
| 100.0% |
See accompanying notes which are an integral part of the financial statements.
Annual Report
Statement of Assets and Liabilities
Amounts in thousands (except per-share amounts) | July 31, 2014 |
| | |
Assets | | |
Investment in securities, at value (including securities loaned of $55,005) - See accompanying schedule: Unaffiliated issuers (cost $6,693,094) | $ 8,284,083 | |
Fidelity Central Funds (cost $338,529) | 338,529 | |
Other affiliated issuers (cost $17,417) | 7,484 | |
Total Investments (cost $7,049,040) | | $ 8,630,096 |
Receivable for investments sold | | 74,611 |
Receivable for fund shares sold | | 3,801 |
Dividends receivable | | 9,011 |
Interest receivable | | 9 |
Distributions receivable from Fidelity Central Funds | | 60 |
Receivable from investment adviser for expense reductions | | 2 |
Other receivables | | 6,173 |
Total assets | | 8,723,763 |
| | |
Liabilities | | |
Payable for investments purchased | $ 116,549 | |
Payable for fund shares redeemed | 5,548 | |
Accrued management fee | 2,648 | |
Payable for daily variation margin for derivative instruments | 959 | |
Other affiliated payables | 1,119 | |
Other payables and accrued expenses | 546 | |
Collateral on securities loaned, at value | 58,806 | |
Total liabilities | | 186,175 |
| | |
Net Assets | | $ 8,537,588 |
Net Assets consist of: | | |
Paid in capital | | $ 5,821,891 |
Undistributed net investment income | | 74,179 |
Accumulated undistributed net realized gain (loss) on investments and foreign currency transactions | | 1,060,449 |
Net unrealized appreciation (depreciation) on investments and assets and liabilities in foreign currencies | | 1,581,069 |
Net Assets | | $ 8,537,588 |
See accompanying notes which are an integral part of the financial statements.
Annual Report
Financial Statements - continued
Statement of Assets and Liabilities - continued
Amounts in thousands (except per-share amounts) | July 31, 2014 |
| | |
Dividend Growth:
Net Asset Value, offering price and redemption price per share ($6,480,908 ÷ 173,885 shares) | | $ 37.27 |
| | |
Class K:
Net Asset Value, offering price and redemption price per share ($2,056,680 ÷ 55,185 shares) | | $ 37.27 |
See accompanying notes which are an integral part of the financial statements.
Annual Report
Statement of Operations
Amounts in thousands | Year ended July 31, 2014 |
| | |
Investment Income | | |
Dividends | | $ 177,941 |
Interest | | 1,253 |
Income from Fidelity Central Funds | | 1,556 |
Total income | | 180,750 |
| | |
Expenses | | |
Management fee
Basic fee | $ 46,667 | |
Performance adjustment | (15,569) | |
Transfer agent fees | 12,383 | |
Accounting and security lending fees | 1,234 | |
Custodian fees and expenses | 283 | |
Independent trustees' compensation | 36 | |
Registration fees | 81 | |
Audit | 83 | |
Legal | 37 | |
Interest | 1 | |
Miscellaneous | 70 | |
Total expenses before reductions | 45,306 | |
Expense reductions | (204) | 45,102 |
Net investment income (loss) | | 135,648 |
Realized and Unrealized Gain (Loss) Net realized gain (loss) on: | | |
Investment securities: | | |
Unaffiliated issuers | 1,411,248 | |
Other affiliated issuers | (22,107) | |
Foreign currency transactions | (955) | |
Futures contracts | 12,645 | |
Total net realized gain (loss) | | 1,400,831 |
Change in net unrealized appreciation (depreciation) on: Investment securities | (186,709) | |
Assets and liabilities in foreign currencies | (17) | |
Futures contracts | 38 | |
Total change in net unrealized appreciation (depreciation) | | (186,688) |
Net gain (loss) | | 1,214,143 |
Net increase (decrease) in net assets resulting from operations | | $ 1,349,791 |
See accompanying notes which are an integral part of the financial statements.
Annual Report
Financial Statements - continued
Statement of Changes in Net Assets
Amounts in thousands | Year ended
July 31,
2014 | Year ended
July 31,
2013 |
Increase (Decrease) in Net Assets | | |
Operations | | |
Net investment income (loss) | $ 135,648 | $ 98,270 |
Net realized gain (loss) | 1,400,831 | 698,723 |
Change in net unrealized appreciation (depreciation) | (186,688) | 1,016,174 |
Net increase (decrease) in net assets resulting
from operations | 1,349,791 | 1,813,167 |
Distributions to shareholders from net investment income | (90,956) | (73,780) |
Distributions to shareholders from net realized gain | (759,327) | (120,844) |
Total distributions | (850,283) | (194,624) |
Share transactions - net increase (decrease) | (233,820) | (472,835) |
Total increase (decrease) in net assets | 265,688 | 1,145,708 |
| | |
Net Assets | | |
Beginning of period | 8,271,900 | 7,126,192 |
End of period (including undistributed net investment income of $74,179 and undistributed net investment income of $41,183, respectively) | $ 8,537,588 | $ 8,271,900 |
See accompanying notes which are an integral part of the financial statements.
Annual Report
Financial Highlights - Dividend Growth
Years ended July 31, | 2014 | 2013 | 2012 | 2011 | 2010 |
Selected Per-Share Data | | | | | |
Net asset value, beginning of period | $ 35.33 | $ 28.61 | $ 28.96 | $ 23.84 | $ 20.25 |
Income from Investment Operations | | | | | |
Net investment income (loss) B | .56 | .40 | .20 | .12 | .13E |
Net realized and unrealized gain (loss) | 4.98 | 7.12 | (.41) | 5.23 | 3.63 |
Total from investment operations | 5.54 | 7.52 | (.21) | 5.35 | 3.76 |
Distributions from net investment income | (.37) | (.30) | (.12) | (.15) | (.12) |
Distributions from net realized gain | (3.23) | (.50) | (.02) | (.08) | (.05) |
Total distributions | (3.60) | (.80) | (.14) | (.23) | (.17) |
Net asset value, end of period | $ 37.27 | $ 35.33 | $ 28.61 | $ 28.96 | $ 23.84 |
Total ReturnA | 17.30% | 26.83% | (.67)% | 22.57% | 18.59% |
Ratios to Average Net Assets C, F | | | | | |
Expenses before reductions | .56% | .63% | .91% | .93% | .93% |
Expenses net of fee waivers, if any | .56% | .63% | .91% | .93% | .93% |
Expenses net of all reductions | .56% | .62% | .91% | .93% | .92% |
Net investment income (loss) | 1.58% | 1.26% | .75% | .44% | .56%E |
Supplemental Data | | | | | |
Net assets, end of period (in millions) | $ 6,481 | $ 6,633 | $ 5,905 | $ 9,309 | $ 7,730 |
Portfolio turnover rateD | 99% | 69% | 63% G | 67% | 85% |
A Total returns would have been lower if certain expenses had not been reduced during the applicable periods shown.
B Calculated based on average shares outstanding during the period.
C Fees and expenses of any underlying Fidelity Central Funds are not included in the Fund's expense ratio. The Fund indirectly bears its proportionate share of the expenses of any underlying Fidelity Central Funds.
D Amount does not include the portfolio activity of any underlying Fidelity Central Funds.
E Investment income per share reflects a large, non-recurring dividend which amounted to $.04 per share. Excluding this non-recurring dividend, the ratio of net investment income (loss) to average net assets would have been .40%.
F Expense ratios reflect operating expenses of the class. Expenses before reductions do not reflect amounts reimbursed by the investment adviser or reductions from brokerage service arrangements or reductions from other expense offset arrangements and do not represent the amount paid by the class during periods when reimbursements or reductions occur. Expenses net of fee waivers reflect expenses after reimbursement by the investment adviser but prior to reductions from brokerage service arrangements or other expense offset arrangements. Expenses net of all reductions represent the net expenses paid by the class.
G Portfolio turnover rate excludes securities received or delivered in-kind.
See accompanying notes which are an integral part of the financial statements.
Annual Report
Financial Highlights - Class K
Years ended July 31, | 2014 | 2013 | 2012 | 2011 | 2010 |
Selected Per-Share Data | | | | | |
Net asset value, beginning of period | $ 35.34 | $ 28.62 | $ 28.98 | $ 23.86 | $ 20.26 |
Income from Investment Operations | | | | | |
Net investment income (loss) B | .60 | .45 | .25 | .17 | .18E |
Net realized and unrealized gain (loss) | 4.97 | 7.12 | (.43) | 5.22 | 3.63 |
Total from investment operations | 5.57 | 7.57 | (.18) | 5.39 | 3.81 |
Distributions from net investment income | (.42) | (.35) | (.17) | (.20) | (.16) |
Distributions from net realized gain | (3.23) | (.50) | (.02) | (.08) | (.05) |
Total distributions | (3.64) J | (.85) | (.18)I | (.27)H | (.21) |
Net asset value, end of period | $ 37.27 | $ 35.34 | $ 28.62 | $ 28.98 | $ 23.86 |
Total ReturnA | 17.44% | 27.04% | (.52)% | 22.79% | 18.86% |
Ratios to Average Net Assets C, F | | | | | |
Expenses before reductions | .44% | .48% | .75% | .78% | .72% |
Expenses net of fee waivers, if any | .43% | .48% | .75% | .78% | .72% |
Expenses net of all reductions | .43% | .47% | .75% | .77% | .71% |
Net investment income (loss) | 1.70% | 1.41% | .91% | .60% | .76%E |
Supplemental Data | | | | | |
Net assets, end of period (in millions) | $ 2,057 | $ 1,639 | $ 1,221 | $ 634 | $ 355 |
Portfolio turnover rateD | 99% | 69% | 63% G | 67% | 85% |
A Total returns would have been lower if certain expenses had not been reduced during the applicable periods shown.
B Calculated based on average shares outstanding during the period.
C Fees and expenses of any underlying Fidelity Central Funds are not included in the Fund's expense ratio. The Fund indirectly bears its proportionate share of the expenses of any underlying Fidelity Central Funds.
D Amount does not include the portfolio activity of any underlying Fidelity Central Funds.
E Investment income per share reflects a large, non-recurring dividend which amounted to $.04 per share. Excluding this non-recurring dividend, the ratio of net investment income (loss) to average net assets would have been .60%.
F Expense ratios reflect operating expenses of the class. Expenses before reductions do not reflect amounts reimbursed by the investment adviser or reductions from brokerage service arrangements or reductions from other expense offset arrangements and do not represent the amount paid by the class during periods when reimbursements or reductions occur. Expenses net of fee waivers reflect expenses after reimbursement by the investment adviser but prior to reductions from brokerage service arrangements or other expense offset arrangements. Expenses net of all reductions represent the net expenses paid by the class.
G Portfolio turnover rate excludes securities received or delivered in-kind.
H Total distributions of $.27 per share is comprised of distributions from net investment income of $.197 and distributions from net realized gain of $.077 per share.
I Total distributions of $.18 per share is comprised of distributions from net investment income of $.169 and distributions from net realized gain of $.015 per share.
J Total distributions of $3.64 per share is comprised of distributions from net investment income of $.419 and distributions from net realized gain of $3.225 per share.
See accompanying notes which are an integral part of the financial statements.
Annual Report
Notes to Financial Statements
For the period ended July 31, 2014
(Amounts in thousands except percentages)
1. Organization.
Fidelity Dividend Growth Fund (the Fund) is a fund of Fidelity Securities Fund (the Trust) and is authorized to issue an unlimited number of shares. The Trust is registered under the Investment Company Act of 1940, as amended (the 1940 Act), as an open-end management investment company organized as a Massachusetts business trust. The Fund offers Dividend Growth, and Class K shares, each of which has equal rights as to assets and voting privileges. Each class has exclusive voting rights with respect to matters that affect that class.
2. Investments in Fidelity Central Funds.
The Fund invests in Fidelity Central Funds, which are open-end investment companies generally available only to other investment companies and accounts managed by the investment adviser and its affiliates. The Fund's Schedule of Investments lists each of the Fidelity Central Funds held as of period end, if any, as an investment of the Fund, but does not include the underlying holdings of each Fidelity Central Fund. As an Investing Fund, the Fund indirectly bears its proportionate share of the expenses of the underlying Fidelity Central Funds.
The Money Market Central Funds seek preservation of capital and current income and are managed by Fidelity Investments Money Management, Inc. (FIMM), an affiliate of the investment adviser. Annualized expenses of the Money Market Central Funds as of their most recent shareholder report date are less than .01%.
A complete unaudited list of holdings for each Fidelity Central Fund is available upon request or at the Securities and Exchange Commission (the SEC) website at www.sec.gov. In addition, the financial statements of the Fidelity Central Funds, which are not covered by the Fund's Report of Independent Registered Public Accounting Firm, are available on the SEC website or upon request.
3. Significant Accounting Policies.
The financial statements have been prepared in conformity with accounting principles generally accepted in the United States of America (GAAP), which require management to make certain estimates and assumptions at the date of the financial statements. Actual results could differ from those estimates. Subsequent events, if any, through the date that the financial statements were issued have been evaluated in the preparation of the financial statements. The following summarizes the significant accounting policies of the Fund:
Investment Valuation. Investments are valued as of 4:00 p.m. Eastern time on the last calendar day of the period. In accordance with valuation policies and procedures approved by the Board of Trustees (the Board), the Fund attempts to obtain prices from
Annual Report
3. Significant Accounting Policies - continued
Investment Valuation - continued
one or more third party pricing vendors or brokers to value its investments. When current market prices, quotations or currency exchange rates are not readily available or reliable, investments will be fair valued in good faith by the FMR Fair Value Committee (the Committee), in accordance with procedures adopted by the Board. Factors used in determining fair value vary by investment type and may include market or investment specific events, changes in interest rates and credit quality. The frequency with which these procedures are used cannot be predicted and they may be utilized to a significant extent. The Committee oversees the Fund's valuation policies and procedures and is responsible for approving and reporting to the Board all fair value determinations.
The Fund categorizes the inputs to valuation techniques used to value its investments into a disclosure hierarchy consisting of three levels as shown below:
Level 1 - quoted prices in active markets for identical investments
Level 2 - other significant observable inputs (including quoted prices for similar investments, interest rates, prepayment speeds, etc.)
Level 3 - unobservable inputs (including the Fund's own assumptions based on the best information available)
Valuation techniques used to value the Fund's investments by major category are as follows:
Equity securities, including restricted securities, for which market quotations are readily available, are valued at the last reported sale price or official closing price as reported by a third party pricing vendor on the primary market or exchange on which they are traded and are categorized as Level 1 in the hierarchy. In the event there were no sales during the day or closing prices are not available, securities are valued at the last quoted bid price or may be valued using the last available price and are generally categorized as Level 2 in the hierarchy. For foreign equity securities, when market or security specific events arise, comparisons to the valuation of American Depositary Receipts (ADRs), futures contracts, Exchange-Traded Funds (ETFs) and certain indexes as well as quoted prices for similar securities may be used and would be categorized as Level 2 in the hierarchy. Utilizing these techniques may result in transfers between Level 1 and Level 2. For equity securities, including restricted securities, where observable inputs are limited, assumptions about market activity and risk are used and these securities may be categorized as Level 3 in the hierarchy.
Debt securities, including restricted securities, are valued based on evaluated prices received from third party pricing vendors or from brokers who make markets in such securities. Corporate bonds and U.S. government and government agency obligations are
Annual Report
Notes to Financial Statements - continued
(Amounts in thousands except percentages)
3. Significant Accounting Policies - continued
Investment Valuation - continued
valued by pricing vendors who utilize matrix pricing which considers yield or price of bonds of comparable quality, coupon, maturity and type or by broker-supplied prices. When independent prices are unavailable or unreliable, debt securities may be valued utilizing pricing methodologies which consider similar factors that would be used by third party pricing vendors. Debt securities are generally categorized as Level 2 in the hierarchy but may be Level 3 depending on the circumstances.
Futures contracts are valued at the settlement price established each day by the board of trade or exchange on which they are traded and are categorized as Level 1 in the hierarchy. Investments in open-end mutual funds, including the Fidelity Central Funds, are valued at their closing net asset value (NAV) each business day and are categorized as Level 1 in the hierarchy.
Changes in valuation techniques may result in transfers in or out of an assigned level within the disclosure hierarchy. The aggregate value of investments by input level, as of July 31, 2014, is included at the end of the Fund's Schedule of Investments.
Foreign Currency. The Fund may use foreign currency contracts to facilitate transactions in foreign-denominated securities. Gains and losses from these transactions may arise from changes in the value of the foreign currency or if the counterparties do not perform under the contracts' terms.
Foreign-denominated assets, including investment securities, and liabilities are translated into U.S. dollars at the exchange rates at period end. Purchases and sales of investment securities, income and dividends received and expenses denominated in foreign currencies are translated into U.S. dollars at the exchange rate in effect on the transaction date.
The effects of exchange rate fluctuations on investments are included with the net realized and unrealized gain (loss) on investment securities. Other foreign currency transactions resulting in realized and unrealized gain (loss) are disclosed separately.
Investment Transactions and Income. For financial reporting purposes, the Fund's investment holdings and NAV include trades executed through the end of the last business day of the period. The NAV per share for processing shareholder transactions is calculated as of the close of business of the New York Stock Exchange (NYSE), normally 4:00 p.m. Eastern time and includes trades executed through the end of the prior business day. Gains and losses on securities sold are determined on the basis of identified cost and may include proceeds received from litigation. Dividend income is recorded on the ex-dividend date, except for certain dividends from foreign securities where the ex-dividend date may have passed, which are recorded as soon as the Fund is informed of
Annual Report
3. Significant Accounting Policies - continued
Investment Transactions and Income - continued
the ex-dividend date. Non-cash dividends included in dividend income, if any, are recorded at the fair market value of the securities received Income and capital gain distributions from Fidelity Central Funds, if any, are recorded on the ex-dividend date. Distributions received on securities that represent a return of capital or capital gain are recorded as a reduction of cost of investments and/or as a realized gain. Subsequent to ex-dividend date the Fund determines the components of these distributions, based upon receipt of tax filings or other correspondence relating to the underlying investment. Interest income is accrued as earned and includes coupon interest and amortization of premium and accretion of discount on debt securities as applicable. Investment income is recorded net of foreign taxes withheld where recovery of such taxes is uncertain.
Class Allocations and Expenses. Investment income, realized and unrealized capital gains and losses, common expenses of the Fund, and certain fund-level expense reductions, if any, are allocated daily on a pro-rata basis to each class based on the relative net assets of each class to the total net assets of the Fund. Each class differs with respect to transfer agent fees incurred. Certain expense reductions may also differ by class. For the reporting period, the allocated portion of income and expenses to each class as a percent of its average net assets may vary due to the timing of recording these transactions in relation to fluctuating net assets of the classes. Expenses directly attributable to a fund are charged to that fund. Expenses attributable to more than one fund are allocated among the respective funds on the basis of relative net assets or other appropriate methods. Expense estimates are accrued in the period to which they relate and adjustments are made when actual amounts are known.
Deferred Trustee Compensation. Under a Deferred Compensation Plan (the Plan), independent Trustees may elect to defer receipt of a portion of their annual compensation. Deferred amounts are invested in a cross-section of Fidelity funds, are marked-to-market and remain in the Fund until distributed in accordance with the Plan. The investment of deferred amounts and the offsetting payable to the Trustees are included in the accompanying Statement of Assets and Liabilities.
Income Tax Information and Distributions to Shareholders. Each year, the Fund intends to qualify as a regulated investment company under Subchapter M of the Internal Revenue Code, including distributing substantially all of its taxable income and realized gains. As a result, no provision for U.S. Federal income taxes is required. As of July 31, 2014, the Fund did not have any unrecognized tax benefits in the financial statements; nor is the Fund aware of any tax positions for which it is reasonably possible that the total amounts of unrecognized tax benefits will significantly change in the next twelve months. The Fund files a U.S. federal tax return, in addition to state and local tax returns as required. The Fund's federal income tax returns are subject to examination by
Annual Report
Notes to Financial Statements - continued
(Amounts in thousands except percentages)
3. Significant Accounting Policies - continued
Income Tax Information and Distributions to Shareholders - continued
the Internal Revenue Service (IRS) for a period of three fiscal years after they are filed. State and local tax returns may be subject to examination for an additional fiscal year depending on the jurisdiction. Foreign taxes are provided for based on the Fund's understanding of the tax rules and rates that exist in the foreign markets in which it invests.
Distributions are declared and recorded on the ex-dividend date. Income dividends and capital gain distributions are declared separately for each class. Income and capital gain distributions are determined in accordance with income tax regulations, which may differ from GAAP. In addition, the Fund claimed a portion of the payment made to redeeming shareholders as a distribution for income tax purposes.
Capital accounts within the financial statements are adjusted for permanent book-tax differences. These adjustments have no impact on net assets or the results of operations. Capital accounts are not adjusted for temporary book-tax differences which will reverse in a subsequent period.
Book-tax differences are primarily due to futures contracts, foreign currency transactions, passive foreign investment companies (PFIC), market discount, original issue discount, contingent interest, partnerships, deferred trustees compensation and losses deferred due to wash sales.
The federal tax cost of investment securities and unrealized appreciation (depreciation) as of period end were as follows:
Gross unrealized appreciation | $ 1,652,762 |
Gross unrealized depreciation | (74,187) |
Net unrealized appreciation (depreciation) on securities | $ 1,578,575 |
| |
Tax Cost | $ 7,051,521 |
The tax-based components of distributable earnings as of period end were as follows:
Undistributed ordinary income | $ 161,534 |
Undistributed long-term capital gain | $ 976,013 |
Net unrealized appreciation (depreciation) on securities and other investments | $ 1,578,589 |
Annual Report
3. Significant Accounting Policies - continued
Income Tax Information and Distributions to Shareholders - continued
The tax character of distributions paid was as follows:
| July 31, 2014 | July 31, 2013 |
Ordinary Income | $ 309,025 | $ 80,019 |
Long-term Capital Gains | 541,258 | 114,605 |
Total | $ 850,283 | $ 194,624 |
Restricted Securities. The Fund may invest in securities that are subject to legal or contractual restrictions on resale. These securities generally may be resold in transactions exempt from registration or to the public if the securities are registered. Disposal of these securities may involve time-consuming negotiations and expense, and prompt sale at an acceptable price may be difficult. Information regarding restricted securities is included at the end of the Fund's Schedule of Investments.
4. Derivative Instruments.
Risk Exposures and the Use of Derivative Instruments. The Fund's investment objective allows the Fund to enter into various types of derivative contracts, including futures contracts. Derivatives are investments whose value is primarily derived from underlying assets, indices or reference rates and may be transacted on an exchange or over-the-counter (OTC). Derivatives may involve a future commitment to buy or sell a specified asset based on specified terms, to exchange future cash flows at periodic intervals based on a notional principal amount, or for one party to make one or more payments upon the occurrence of specified events in exchange for periodic payments from the other party.
The Fund used derivatives to increase returns and to manage exposure to certain risks as defined below. The success of any strategy involving derivatives depends on analysis of numerous economic factors, and if the strategies for investment do not work as intended, the Fund may not achieve its objectives.
The Fund's use of derivatives increased or decreased its exposure to the following risk:
Equity Risk | Equity risk relates to the fluctuations in the value of financial instruments as a result of changes in market prices (other than those arising from interest rate risk or foreign exchange risk), whether caused by factors specific to an individual investment, its issuer, or all factors affecting all instruments traded in a market or market segment. |
Annual Report
Notes to Financial Statements - continued
(Amounts in thousands except percentages)
4. Derivative Instruments - continued
Risk Exposures and the Use of Derivative Instruments - continued
The Fund is also exposed to additional risks from investing in derivatives, such as liquidity risk and counterparty credit risk. Liquidity risk is the risk that the Fund will be unable to close out the derivative in the open market in a timely manner. Counterparty credit risk is the risk that the counterparty will not be able to fulfill its obligation to the Fund. Counterparty credit risk related to exchange-traded futures contracts may be mitigated by the protection provided by the exchange on which they trade.
Investing in derivatives may involve greater risks than investing in the underlying assets directly and, to varying degrees, may involve risk of loss in excess of any initial investment and collateral received and amounts recognized in the Statement of Assets and Liabilities. In addition, there may be the risk that the change in value of the derivative contract does not correspond to the change in value of the underlying instrument.
Futures Contracts. A futures contract is an agreement between two parties to buy or sell a specified underlying instrument for a fixed price at a specified future date. The Fund used futures contracts to manage its exposure to the stock market.
Upon entering into a futures contract, a fund is required to deposit either cash or securities (initial margin) with a clearing broker in an amount equal to a certain percentage of the face value of the contract. Futures contracts are marked-to-market daily and subsequent daily payments (variation margin) are made or received by a fund depending on the daily fluctuations in the value of the futures contracts and are recorded as unrealized appreciation or (depreciation). This receivable and/or payable, if any, is included in daily variation margin for derivative instruments in the Statement of Assets and Liabilities. Realized gain or (loss) is recorded upon the expiration or closing of a futures contract.
Any open futures contracts at period end are presented in the Schedule of Investments under the caption "Futures Contracts." The underlying face amount at value reflects each contract's exposure to the underlying instrument or index at period end and is representative of volume of activity during the period. Securities deposited to meet initial margin requirements are identified in the Schedule of Investments.
During the period the Fund recognized net realized gain (loss) of $12,645 and a change in net unrealized appreciation (depreciation) of $38 related to its investment in futures contracts. These amounts are included in the Statement of Operations.
5. Purchases and Sales of Investments.
Purchases and sales of securities, other than short-term securities, aggregated $8,175,346 and $9,295,276 respectively.
Annual Report
6. Fees and Other Transactions with Affiliates.
Management Fee. Fidelity Management & Research Company (the investment adviser) and its affiliates provide the Fund with investment management related services for which the Fund pays a monthly management fee. The management fee is the sum of an individual fund fee rate that is based on an annual rate of .30% of the Fund's average net assets and an annualized group fee rate that averaged .25% during the period. The group fee rate is based upon the average net assets of all the mutual funds advised by the investment adviser, including any mutual funds previously advised by the investment adviser that are currently advised by Fidelity SelectCo, LLC, an affiliate of the investment adviser. The group fee rate decreases as assets under management increase and increases as assets under management decrease. In addition, the management fee is subject to a performance adjustment (up to a maximum of ± .20% of the Fund's average net assets over a 36 month performance period). The upward or downward adjustment to the management fee is based on the relative investment performance of Dividend Growth as compared to its benchmark index, the S&P 500 Index, over the same 36 month performance period. For the reporting period, the total annual management fee rate, including the performance adjustment, was .37% of the Fund's average net assets. The performance adjustment included in the management fee rate may be higher or lower than the maximum performance adjustment rate due to the difference between the average net assets for the reporting and performance periods.
Transfer Agent Fees. Fidelity Investments Institutional Operations Company, Inc., (FIIOC), an affiliate of the investment adviser FMR, is the transfer, dividend disbursing and shareholder servicing agent for each class of the Fund. FIIOC receives account fees and asset-based fees that vary according to the account size and type of account of the shareholders of Dividend Growth. FIIOC receives an asset-based fee of Class K's average net assets. FIIOC pays for typesetting, printing and mailing of shareholder reports, except proxy statements.
For the period, transfer agent fees for each applicable class were as follows:
| Amount | % of
Average
Net Assets |
Dividend Growth | $ 11,554 | .17 |
Class K | 829 | .05 |
| $ 12,383 | |
Accounting and Security Lending Fees. Fidelity Service Company, Inc. (FSC), an affiliate of the investment adviser, maintains the Fund's accounting records. The accounting fee is based on the level of average net assets for each month. Under a separate contract, FSC administers the security lending program. The security lending fee is based on the number and duration of lending transactions.
Annual Report
Notes to Financial Statements - continued
(Amounts in thousands except percentages)
6. Fees and Other Transactions with Affiliates - continued
Brokerage Commissions. The Fund placed a portion of its portfolio transactions with brokerage firms which are affiliates of the investment adviser. Brokerage commissions are included in net realized gain (loss) and change in net unrealized appreciation (depreciation) in the Statement of Operations. The commissions paid to these affiliated firms were $180 for the period.
Interfund Lending Program. Pursuant to an Exemptive Order issued by the SEC, the Fund, along with other registered investment companies having management contracts with FMR or other affiliated entities of FMR, may participate in an interfund lending program. This program provides an alternative credit facility allowing the funds to borrow from, or lend money to, other participating affiliated funds. At period end, there were no interfund loans outstanding. The Fund's activity in this program during the period for which loans were outstanding was as follows:
Borrower or Lender | Average
Loan Balance | Weighted Average
Interest Rate | Interest Expense |
Borrower | $ 10,376 | .36% | $ 1 |
Other. During the period, the investment adviser reimbursed the Fund for certain losses in the amount of $1.
7. Committed Line of Credit.
The Fund participates with other funds managed by the investment adviser or an affiliate in a $4.25 billion credit facility (the "line of credit") to be utilized for temporary or emergency purposes to fund shareholder redemptions or for other short-term liquidity purposes. The Fund has agreed to pay commitment fees on its pro-rata portion of the line of credit, which amounted to $14 and is reflected in Miscellaneous expenses on the Statement of Operations. During the period, the Fund did not borrow on this line of credit.
8. Security Lending.
The Fund lends portfolio securities through a lending agent from time to time in order to earn additional income. For equity securities, a lending agent is used and may loan securities to certain qualified borrowers, including Fidelity Capital Markets (FCM), a broker-dealer affiliated with the Fund. On the settlement date of the loan, the Fund receives collateral (in the form of U.S. Treasury obligations, letters of credit and/or cash) against the loaned securities and maintains collateral in an amount not less than 100% of the market value of the loaned securities during the period of the loan. The market value of the loaned securities is determined at the close of business of the Fund and any additional required collateral is delivered to the Fund on the next business day. If the
Annual Report
8. Security Lending - continued
borrower defaults on its obligation to return the securities loaned because of insolvency or other reasons, the Fund may apply collateral received from the borrower against the obligation. The Fund may experience delays and costs in recovering the securities loaned. Any cash collateral received is invested in the Fidelity Securities Lending Cash Central Fund. The value of loaned securities and cash collateral at period end are disclosed on the Fund's Statement of Assets and Liabilities. At period end, there were no security loans outstanding with FCM. Security lending income represents the income earned on investing cash collateral, less rebates paid to borrowers and any lending agent fees associated with the loan, plus any premium payments received for lending certain types of securities. Security lending income is presented in the Statement of Operations as a component of income from Fidelity Central Funds. Total security lending income during the period amounted to $1,384, including $15 from securities loaned to FCM.
9. Expense Reductions.
Commissions paid to certain brokers with whom the investment adviser, or its affiliates, places trades on behalf of the Fund include an amount in addition to trade execution, which may be rebated back to the Fund to offset certain expenses. This amount totaled $150 for the period.
In addition, the investment adviser reimbursed a portion of the Fund's operating expenses during the period in the amount of $54.
10. Distributions to Shareholders.
Distributions to shareholders of each class were as follows:
Years ended July 31, | 2014 | 2013 |
From net investment income | | |
Dividend Growth | $ 70,700 | $ 58,843 |
Class K | 20,256 | 14,937 |
Total | $ 90,956 | $ 73,780 |
From net realized gain | | |
Dividend Growth | $ 606,886 | $ 99,450 |
Class K | 152,441 | 21,394 |
Total | $ 759,327 | $ 120,844 |
Annual Report
Notes to Financial Statements - continued
(Amounts in thousands except percentages)
11. Share Transactions.
Transactions for each class of shares were as follows:
| Shares | Dollars |
Years ended July 31, | 2014 | 2013 | 2014 | 2013 |
Dividend Growth | | | | |
Shares sold | 11,713 | 18,652 | $ 413,381 | $ 585,373 |
Reinvestment of distributions | 19,201 | 4,994 | 630,027 | 147,845 |
Shares redeemed | (44,744) | (42,352) | (1,586,974) | (1,323,760) |
Net increase (decrease) | (13,830) | (18,706) | $ (543,566) | $ (590,542) |
Class K | | | | |
Shares sold | 14,508 | 13,098 | $ 525,067 | $ 414,093 |
Reinvestment of distributions | 5,265 | 1,228 | 172,697 | 36,331 |
Shares redeemed | (10,980) | (10,587) | (388,018) | (332,717) |
Net increase (decrease) | 8,793 | 3,739 | $ 309,746 | $ 117,707 |
12. Other.
The Fund's organizational documents provide former and current trustees and officers with a limited indemnification against liabilities arising in connection with the performance of their duties to the Fund. In the normal course of business, the Fund may also enter into contracts that provide general indemnifications. The Fund's maximum exposure under these arrangements is unknown as this would be dependent on future claims that may be made against the Fund. The risk of material loss from such claims is considered remote.
Annual Report
To the Trustees of Fidelity Securities Fund and the Shareholders of Fidelity Dividend Growth Fund:
In our opinion, the accompanying statement of assets and liabilities, including the schedule of investments, and the related statements of operations and of changes in net assets and the financial highlights present fairly, in all material respects, the financial position of Fidelity Dividend Growth Fund (a fund of Fidelity Securities Fund) at July 31, 2014, the results of its operations for the year then ended, the changes in its net assets for each of the two years in the period then ended and the financial highlights for each of the five years in the period then ended, in conformity with accounting principles generally accepted in the United States of America. These financial statements and financial highlights (hereafter referred to as "financial statements") are the responsibility of the Fidelity Dividend Growth Fund's management. Our responsibility is to express an opinion on these financial statements based on our audits. We conducted our audits of these financial statements in accordance with the standards of the Public Company Accounting Oversight Board (United States). Those standards require that we plan and perform the audit to obtain reasonable assurance about whether the financial statements are free of material misstatement. An audit includes examining, on a test basis, evidence supporting the amounts and disclosures in the financial statements, assessing the accounting principles used and significant estimates made by management, and evaluating the overall financial statement presentation. We believe that our audits, which included confirmation of securities at July 31, 2014 by correspondence with the custodian and brokers, provide a reasonable basis for our opinion.
PricewaterhouseCoopers LLP
Boston, Massachusetts
September 16, 2014
Annual Report
The Trustees, Member of the Advisory Board, and officers of the trust and fund, as applicable, are listed below. The Board of Trustees governs the fund and is responsible for protecting the interests of shareholders. The Trustees are experienced executives who meet periodically throughout the year to oversee the fund's activities, review contractual arrangements with companies that provide services to the fund, oversee management of the risks associated with such activities and contractual arrangements, and review the fund's performance. Except for James C. Curvey, each of the Trustees oversees 173 funds. Mr. Curvey oversees 397 funds.
The Trustees hold office without limit in time except that (a) any Trustee may resign; (b) any Trustee may be removed by written instrument, signed by at least two-thirds of the number of Trustees prior to such removal; (c) any Trustee who requests to be retired or who has become incapacitated by illness or injury may be retired by written instrument signed by a majority of the other Trustees; and (d) any Trustee may be removed at any special meeting of shareholders by a two-thirds vote of the outstanding voting securities of the trust. Each Trustee who is not an interested person (as defined in the 1940 Act) of the trust and the fund (Independent Trustee), shall retire not later than the last day of the calendar year in which his or her 75th birthday occurs. The Independent Trustees may waive this mandatory retirement age policy with respect to individual Trustees. The officers and Advisory Board Member hold office without limit in time, except that any officer and Advisory Board Member may resign or may be removed by a vote of a majority of the Trustees at any regular meeting or any special meeting of the Trustees. Except as indicated, each individual has held the office shown or other offices in the same company for the past five years.
Experience, Skills, Attributes, and Qualifications of the Fund's Trustees. The Governance and Nominating Committee has adopted a statement of policy that describes the experience, qualifications, attributes, and skills that are necessary and desirable for potential Independent Trustee candidates (Statement of Policy). The Board believes that each Trustee satisfied at the time he or she was initially elected or appointed a Trustee, and continues to satisfy, the standards contemplated by the Statement of Policy. The Governance and Nominating Committee also engages professional search firms to help identify potential Independent Trustee candidates who have the experience, qualifications, attributes, and skills consistent with the Statement of Policy. From time to time, additional criteria based on the composition and skills of the current Independent Trustees, as well as experience or skills that may be appropriate in light of future changes to board composition, business conditions, and regulatory or other developments, have also been considered by the professional search firms and the Governance and Nominating Committee. In addition, the Board takes into account the Trustees' commitment and participation in Board and committee meetings, as well as their leadership of standing and ad hoc committees throughout their tenure.
In determining that a particular Trustee was and continues to be qualified to serve as a Trustee, the Board has considered a variety of criteria, none of which, in isolation, was controlling. The Board believes that, collectively, the Trustees have balanced and diverse experience, qualifications, attributes, and skills, which allow the Board to operate effectively in governing the fund and protecting the interests of shareholders. Information about the specific experience, skills, attributes, and qualifications of each Trustee, which in each case led to the Board's conclusion that the Trustee should serve (or continue to serve) as a trustee of the fund, is provided below.
Annual Report
Board Structure and Oversight Function. James C. Curvey is an interested person (as defined in the 1940 Act) and currently serves as Chairman. The Trustees have determined that an interested Chairman is appropriate and benefits shareholders because an interested Chairman has a personal and professional stake in the quality and continuity of services provided to the fund. Independent Trustees exercise their informed business judgment to appoint an individual of their choosing to serve as Chairman, regardless of whether the Trustee happens to be independent or a member of management. The Independent Trustees have determined that they can act independently and effectively without having an Independent Trustee serve as Chairman and that a key structural component for assuring that they are in a position to do so is for the Independent Trustees to constitute a substantial majority for the Board. The Independent Trustees also regularly meet in executive session. Ned C. Lautenbach serves as Chairman of the Independent Trustees and as such (i) acts as a liaison between the Independent Trustees and management with respect to matters important to the Independent Trustees and (ii) with management prepares agendas for Board meetings.
Fidelity funds are overseen by different Boards of Trustees. The fund's Board oversees Fidelity's equity and high income funds and another Board oversees Fidelity's investment-grade bond, money market, and asset allocation funds. The asset allocation funds may invest in Fidelity funds overseen by the fund's Board. The use of separate Boards, each with its own committee structure, allows the Trustees of each group of Fidelity funds to focus on the unique issues of the funds they oversee, including common research, investment, and operational issues. On occasion, the separate Boards establish joint committees to address issues of overlapping consequences for the Fidelity funds overseen by each Board.
The Trustees operate using a system of committees to facilitate the timely and efficient consideration of all matters of importance to the Trustees, the fund, and fund shareholders and to facilitate compliance with legal and regulatory requirements and oversight of the fund's activities and associated risks. The Board, acting through its committees, has charged FMR and its affiliates with (i) identifying events or circumstances the occurrence of which could have demonstrably adverse effects on the fund's business and/or reputation; (ii) implementing processes and controls to lessen the possibility that such events or circumstances occur or to mitigate the effects of such events or circumstances if they do occur; and (iii) creating and maintaining a system designed to evaluate continuously business and market conditions in order to facilitate the identification and implementation processes described in (i) and (ii) above. Because the day-to-day operations and activities of the fund are carried out by or through FMR, its affiliates and other service providers, the fund's exposure to risks is mitigated but not eliminated by the processes overseen by the Trustees. While each of the Board's committees has responsibility for overseeing different aspects of the fund's activities, oversight is exercised primarily through the Operations, Audit, and Compliance Committees. In addition, the Independent Trustees have worked with FMR to enhance the Board's oversight of investment and financial risks, legal and regulatory risks, technology risks, and operational risks, including the development of additional risk reporting to the Board. For example, a working group comprised of Independent Trustees and FMR has worked and continues to work to review the Fidelity funds' valuation-related activities, reporting and risk management. Appropriate personnel, including but not limited to the fund's Chief Compliance Officer (CCO), FMR's internal auditor, the independent accountants, the fund's Treasurer and portfolio management personnel, make periodic reports to the Board's committees, as appropriate, including an annual review of FMR's risk management program for the Fidelity funds. The responsibilities of each standing committee, including their oversight responsibilities, are described further under "Standing Committees of the Fund's Trustees."
Annual Report
Trustees and Officers - continued
The fund's Statement of Additional Information (SAI) includes more information about the Trustees. To request a free copy, call Fidelity at 1-800-544-8544.
Interested Trustees*:
Correspondence intended for each Trustee who is an interested person may be sent to Fidelity Investments, 245 Summer Street, Boston, Massachusetts 02210.
Name, Year of Birth; Principal Occupations and Other Relevant Experience+ |
James C. Curvey (1935) |
Year of Election or Appointment: 2007 Trustee Chairman of the Board of Trustees |
| Mr. Curvey also serves as Trustee of other Fidelity funds. Mr. Curvey is a Director of Fidelity Research & Analysis Co. (2009-present), and Vice Chairman (2007-present) and Director of FMR LLC. In addition, Mr. Curvey serves as an Overseer for the Boston Symphony Orchestra and a member of the Trustees of Villanova University. Previously, Mr. Curvey served as a Director of Fidelity Investments Money Management, Inc. (2009-2014), a Director of FMR (2007-2014), a Director of FMR Co., Inc. (2007-2014) and was the Vice Chairman (2006-2007) and Director (2000-2007) of FMR Corp. |
Charles S. Morrison (1960) |
Year of Election or Appointment: 2014 Trustee |
| Mr. Morrison also serves as Trustee of other funds. He serves as President, Asset Management (2014-present) and is an employee of Fidelity Investments. Previously, Mr. Morrison served as Vice President of Fidelity's Fixed Income and Asset Allocation Funds (2012-2014), President, Fixed Income (2011-2014), Vice President of Fidelity's Money Market Funds (2005-2009), President, Money Market Group Leader of FMR (2009), and Senior Vice President, Money Market Group of FMR (2004-2009). Mr. Morrison also served as Vice President of Fidelity's Bond Funds (2002-2005), certain Balanced Funds (2002-2005), and certain Asset Allocation Funds (2002-2007), and as Senior Vice President (2002-2005) of Fidelity's Bond Division. |
* Trustees have been determined to be "Interested Trustees" by virtue of, among other things, their affiliation with the trust or various entities under common control with FMR.
+ The information above includes each Trustee's principal occupation during the last five years and other information relating to the experience, attributes, and skills relevant to each Trustee's qualifications to serve as a Trustee, which led to the conclusion that each Trustee should serve as a Trustee for the fund.
Annual Report
Trustees and Officers - continued
Independent Trustees:
Correspondence intended for each Independent Trustee (that is, the Trustees other than the Interested Trustees) may be sent to Fidelity Investments, P.O. Box 55235, Boston, Massachusetts 02205-5235.
Name, Year of Birth; Principal Occupations and Other Relevant Experience+ |
Dennis J. Dirks (1948) |
Year of Election or Appointment: 2005 Trustee |
| Mr. Dirks also serves as Trustee of other Fidelity funds. Prior to his retirement in May 2003, Mr. Dirks was Chief Operating Officer and a member of the Board of The Depository Trust & Clearing Corporation (DTCC). He also served as President, Chief Operating Officer, and Board member of The Depository Trust Company (DTC) and President and Board member of the National Securities Clearing Corporation (NSCC). In addition, Mr. Dirks served as Chief Executive Officer and Board member of the Government Securities Clearing Corporation, Chief Executive Officer and Board member of the Mortgage-Backed Securities Clearing Corporation, as a Trustee and a member of the Finance Committee of Manhattan College (2005-2008), and as a Trustee and a member of the Finance Committee of AHRC of Nassau County (2006-2008). Mr. Dirks is a member of the Independent Directors Council (IDC) Governing Council (2010-present) and Board of Directors for The Brookville Center for Children's Services, Inc. (2009-present). |
Alan J. Lacy (1953) |
Year of Election or Appointment: 2008 Trustee |
| Mr. Lacy also serves as Trustee of other Fidelity funds. Mr. Lacy serves as Senior Adviser (2007-present) of Oak Hill Capital Partners, L.P. (private equity). Mr. Lacy also served as Chief Executive Officer (2000-2005) and Vice Chairman (2005-2006) of Sears Holdings Corporation and Sears, Roebuck and Co. (retail). In addition, Mr. Lacy serves as a member of the Board of Directors of Dave & Buster's Entertainment, Inc. (restaurant and entertainment complexes, 2010-present), Earth Fare, Inc. (retail grocery, 2012-present), The Hillman Companies, Inc. (hardware wholesalers, 2010-present), and Bristol-Myers Squibb Company (global pharmaceuticals, 2008-present). Mr. Lacy is a member of the Board of Trustees of The National Parks Conservation Association (2006-present). Previously, Mr. Lacy served as Chairman of the Board of Trustees of the National Parks Conservation Association (2008-2011) and as a member of the Board of Directors for the Western Union Company (global money transfer, 2006-2011). |
Ned C. Lautenbach (1944) |
Year of Election or Appointment: 2000 Trustee Chairman of the Independent Trustees |
| Mr. Lautenbach also serves as Trustee of other Fidelity funds. Mr. Lautenbach currently serves as the Lead Director of the Eaton Corporation Board of Directors (diversified industrial, 1997-present). Mr. Lautenbach is Chairman of the Board of Directors of the Philharmonic Center for the Arts in Naples, Florida (2012-present) and a member of the Council on Foreign Relations (1994-present). Previously, Mr. Lautenbach was a Partner/Advisory Partner at Clayton, Dubilier & Rice, LLC (private equity investment, 1998-2010), as well as a Director of Sony Corporation (2006-2007). |
Joseph Mauriello (1944) |
Year of Election or Appointment: 2008 Trustee |
| Mr. Mauriello also serves as Trustee of other Fidelity funds. Prior to his retirement in January 2006, Mr. Mauriello served in numerous senior management positions including Deputy Chairman and Chief Operating Officer (2004-2005), and Vice Chairman of Financial Services (2002-2004) of KPMG LLP US (professional services, 1965-2005). Mr. Mauriello currently serves as a member of the Board of Directors of XL Group plc. (global insurance and re-insurance, 2006-present). Previously, Mr. Mauriello served as a Director of the Hamilton Funds of the Bank of New York (2006-2007) and of Arcadia Resources Inc. (health care services and products, 2007-2012). |
Robert W. Selander (1950) |
Year of Election or Appointment: 2011 Trustee |
| Mr. Selander also serves as Trustee of other Fidelity funds. Previously, Mr. Selander served as a Member of the Advisory Board of other Fidelity funds (2011), and Executive Vice Chairman (2010), Chief Executive Officer (2009-2010), and President and Chief Executive Officer (1997-2009) of Mastercard, Inc. |
Cornelia M. Small (1944) |
Year of Election or Appointment: 2005 Trustee |
| Ms. Small also serves as Trustee of other Fidelity funds. Ms. Small is a member of the Board of Directors (2009-present) and Chair of the Investment Committee (2010-present) of the Teagle Foundation. Ms. Small also serves on the Investment Committee of the Berkshire Taconic Community Foundation (2008-present). Previously, Ms. Small served as Chairperson (2002-2008) and a member of the Investment Committee and Chairperson (2008-2012) and a member of the Board of Trustees of Smith College. In addition, Ms. Small served as Chief Investment Officer, Director of Global Equity Investments, and a member of the Board of Directors of Scudder, Stevens & Clark and Scudder Kemper Investments. |
William S. Stavropoulos (1939) |
Year of Election or Appointment: 2002 Trustee Vice Chairman of the Independent Trustees |
| Mr. Stavropoulos also serves as Trustee of other Fidelity funds. Mr. Stavropoulos serves as President and Founder of the Michigan Baseball Foundation, the Great Lakes Loons (2007-present). Mr. Stavropoulos is Chairman Emeritus of the Board of Directors of The Dow Chemical Company, where he previously served in numerous senior management positions, including President, CEO (1995-2000; 2002-2004), Chairman of the Executive Committee (2000-2006), and as a member of the Board of Directors (1990-2006). Currently, Mr. Stavropoulos is Chairman of the Board of Directors of Univar Inc. (global distributor of commodity and specialty chemicals), a Director of Teradata Corporation (data warehousing and technology solutions), and Maersk Inc. (industrial conglomerate), and a member of the Advisory Board for Metalmark Capital LLC (private equity investment, 2005-present). Mr. Stavropoulos is an operating advisor to Clayton, Dubilier & Rice, LLC (private equity investment). In addition, Mr. Stavropoulos is a member of the University of Notre Dame Advisory Council for the College of Science, a Trustee of the Rollin L. Gerstacker Foundation, and a Director of the Naples Philharmonic Center for the Arts. Previously, Mr. Stavropoulos served as a Director of Chemical Financial Corporation (bank holding company, 1993-2012) and Tyco International, Ltd. (multinational manufacturing and services, 2007-2012). |
David M. Thomas (1949) |
Year of Election or Appointment: 2008 Trustee |
| Mr. Thomas also serves as Trustee of other Fidelity funds. Mr. Thomas serves as Non-Executive Chairman of the Board of Directors of Fortune Brands Home and Security (home and security products, 2011-present), and as a member of the Board of Directors of Interpublic Group of Companies, Inc. (marketing communication, 2004-present). Previously, Mr. Thomas served as Executive Chairman (2005-2006) and Chairman and Chief Executive Officer (2000-2005) of IMS Health, Inc. (pharmaceutical and healthcare information solutions), and a Director of Fortune Brands, Inc. (consumer products, 2000-2011). |
+ The information above includes each Trustee's principal occupation during the last five years and other information relating to the experience, attributes, and skills relevant to each Trustee's qualifications to serve as a Trustee, which led to the conclusion that each Trustee should serve as a Trustee for the fund.
Advisory Board Member and Officers:
Correspondence intended for each officer and Peter S. Lynch may be sent to Fidelity Investments, 245 Summer Street, Boston, Massachusetts 02210. Officers appear below in alphabetical order.
Name, Year of Birth; Principal Occupation |
Peter S. Lynch (1944) |
Year of Election or Appointment: 2003 Member of the Advisory Board |
| Mr. Lynch also serves as Member of the Advisory Board of other Fidelity funds. Mr. Lynch is Vice Chairman and a Director of FMR and FMR Co., Inc. In addition, Mr. Lynch serves as a Trustee of Boston College and as the Chairman of the Inner-City Scholarship Fund. Previously, Mr. Lynch served on the Special Olympics International Board of Directors (1997-2006). |
Elizabeth Paige Baumann (1968) |
Year of Election or Appointment: 2012 Anti-Money Laundering (AML) Officer |
| Ms. Baumann also serves as AML Officer of other funds. She is Chief AML Officer of FMR LLC (2012-present) and is an employee of Fidelity Investments. Previously, Ms. Baumann served as Vice President and Deputy Anti-Money Laundering Officer (2007-2012). |
William C. Coffey (1969) |
Year of Election or Appointment: 2009 Assistant Secretary |
| Mr. Coffey also serves as Assistant Secretary of other funds. He is Senior Vice President and Deputy General Counsel of FMR LLC (2010-present), and is an employee of Fidelity Investments. Previously, Mr. Coffey served as Vice President and Associate General Counsel of FMR LLC (2005-2009). |
Jonathan Davis (1968) |
Year of Election or Appointment: 2010 Assistant Treasurer |
| Mr. Davis also serves as Assistant Treasurer of other funds. Mr. Davis is an employee of Fidelity Investments. Previously, Mr. Davis served as Vice President and Associate General Counsel of FMR LLC (2003-2010). |
Adrien E. Deberghes (1967) |
Year of Election or Appointment: 2008 Deputy Treasurer |
| Mr. Deberghes also serves as an officer of other funds. He is an employee of Fidelity Investments (2008-present). Prior to joining Fidelity Investments, Mr. Deberghes was Senior Vice President of Mutual Fund Administration at State Street Corporation (2007-2008), Senior Director of Mutual Fund Administration at Investors Bank & Trust (2005-2007), and Director of Finance for Dunkin' Brands (2000-2005). |
Stephanie J. Dorsey (1969) |
Year of Election or Appointment: 2010 Assistant Treasurer |
| Ms. Dorsey also serves as an officer of other funds. She is an employee of Fidelity Investments (2008-present) and has served in other fund officer roles. Prior to joining Fidelity Investments, Ms. Dorsey served as Treasurer (2004-2008) of the JPMorgan Mutual Funds and Vice President (2004-2008) of JPMorgan Chase Bank. |
Howard J. Galligan III (1966) |
Year of Election or Appointment: 2014 Chief Financial Officer |
| Mr. Galligan also serves as Chief Financial Officer of other funds. Mr. Galligan serves as President of Fidelity Pricing and Cash Management Services (FPCMS) (2014-present) and as a Director of Strategic Advisers, Inc. (2008-present). Previously, Mr. Galligan served as Chief Administrative Officer of Asset Management (2011-2014) and Chief Operating Officer and Senior Vice President of Investment Support for Strategic Advisers, Inc. (2003-2011). |
Scott C. Goebel (1968) |
Year of Election or Appointment: 2008 Secretary and Chief Legal Officer (CLO) |
| Mr. Goebel serves as Secretary and CLO of other funds. Mr. Goebel also serves as Secretary of Fidelity SelectCo, LLC (2013-present), Fidelity Investments Money Management, Inc. (FIMM) (2010-present) and Fidelity Research and Analysis Company (FRAC) (2010-present); General Counsel, Secretary, and Senior Vice President of FMR (2008-present) and FMR Co., Inc. (2008-present); Chief Legal Officer of Fidelity Management & Research (Hong Kong) Limited (2008-present); and Assistant Secretary of Fidelity Management & Research (Japan) Inc. (2008-present) and Fidelity Management & Research (U.K.) Inc. (2008-present). Previously, Mr. Goebel served as Secretary and CLO of other Fidelity funds (2008-2013), Assistant Secretary of FIMM (2008-2010), FRAC (2008-2010), and certain funds (2007-2008); and as Vice President and Secretary of Fidelity Distributors Corporation (FDC) (2005-2007). Mr. Goebel has been employed by FMR LLC or an affiliate since 2001. |
Brian B. Hogan (1964) |
Year of Election or Appointment: 2009 Vice President |
| Mr. Hogan also serves as Trustee or Vice President of other funds. Mr. Hogan serves as President of FMR's Equity Division (2009-present). Previously, Mr. Hogan served as Senior Vice President, Equity Research of FMR (2006-2009) and as a portfolio manager. |
Chris Maher (1972) |
Year of Election or Appointment: 2013 Assistant Treasurer |
| Mr. Maher serves as Assistant Treasurer of other funds. Mr. Maher is Vice President of Valuation Oversight and is an employee of Fidelity Investments. Previously, Mr. Maher served as Vice President of Asset Management Compliance (2013), Vice President of FMR's Program Management Group (2010-2013), and Vice President of Valuation Oversight (2008-2010). |
Melissa M. Reilly (1971) |
Year of Election or Appointment: 2014 Vice President of certain Equity Funds |
| Ms. Reilly also serves as Vice President of other funds. Ms. Reilly is an employee of Fidelity Investments (2004-present). |
Kenneth B. Robins (1969) |
Year of Election or Appointment: 2008 President and Treasurer |
| Mr. Robins also serves as an officer of other funds. Mr. Robins serves as Executive Vice President of Fidelity Investments Money Management, Inc. (FIMM) (2013-present) and is an employee of Fidelity Investments (2004-present). Previously, Mr. Robins served in other fund officer roles. |
Stephen Sadoski (1971) |
Year of Election or Appointment: 2012 Deputy Treasurer |
| Mr. Sadoski also serves as Deputy Treasurer of other funds. He is an employee of Fidelity Investments (2012-present) and has served in another fund officer role. Prior to joining Fidelity Investments, Mr. Sadoski served as an assistant chief accountant in the Division of Investment Management of the Securities and Exchange Commission (SEC) (2009-2012) and as a senior manager at Deloitte & Touche LLP (1997-2009). |
Stacie M. Smith (1974) |
Year of Election or Appointment: 2013 Deputy Treasurer |
| Ms. Smith also serves as an officer of other funds. She is an employee of Fidelity Investments (2009-present) and has served in other fund officer roles. Prior to joining Fidelity Investments, Ms. Smith served as Senior Audit Manager of Ernst & Young LLP (1996-2009). |
Renee Stagnone (1975) |
Year of Election or Appointment: 2013 Deputy Treasurer |
| Ms. Stagnone also serves as Deputy Treasurer of other funds. Ms. Stagnone is an employee of Fidelity Investments. |
Linda J. Wondrack (1964) |
Year of Election or Appointment: 2014 Chief Compliance Officer |
| Ms. Wondrack also serves as Chief Compliance Officer of other funds. Ms. Wondrack is Executive Vice President and head of the Ethics Office and Asset Management Compliance for Fidelity Investments (2012-present). Ms. Wondrack also serves as Chief Compliance Officer of Fidelity SelectCo, LLC (2014-present); Chief Compliance Officer of Impresa Management LLC (2013-present); and Chief Compliance Officer of FMR Co., Inc., Fidelity Investments Money Management, Inc., Fidelity Management & Research (Japan) Inc., Fidelity Management & Research (U.K.) Inc., Fidelity Management & Research (Hong Kong), Fidelity Management & Research Company, Pyramis Global Advisors, LLC, and Strategic Advisers, Inc., Ballyrock Investment Advisors LLC, and Northern Neck Investors LLC (2012-present). Previously, Ms. Wondrack served as Senior Vice President and Chief Compliance Officer for Columbia Management Investment Advisers, LLC (2005-2012); Chief Compliance Officer for certain funds within the Columbia Family of Funds (2007-2012); and Senior Vice President of Compliance Risk Management at Bank of America (2005-2010). |
Joseph F. Zambello (1957) |
Year of Election or Appointment: 2011 Deputy Treasurer |
| Mr. Zambello also serves as Deputy Treasurer of other funds. Mr. Zambello is an employee of Fidelity Investments. Previously, Mr. Zambello served as Vice President of FMR's Program Management Group (2009-2011) and Vice President of the Transfer Agent Oversight Group (2005-2009). |
Annual Report
The Board of Trustees of Fidelity Dividend Growth Fund voted to pay on record date, the following distributions per share derived from capital gains realized from sales of portfolio securities, and dividends derived from net investment income:
| Pay Date | Record Date | Dividends | Capital Gains |
Dividend Growth | 9/15/14 | 9/12/14 | $0.322 | $4.693 |
The fund hereby designates as a capital gain dividend with respect to the taxable year ended July 31, 2014 $1,098,980,760, or, if subsequently determined to be different, the net capital gain of such year.
Dividend Growth designates 24% and 43% of the dividends distributed in September and December, respectively during the fiscal year as qualifying for the dividends-received deduction for corporate shareholders.
Dividend Growth designates 32% and 54% of the dividends distributed in September and December, respectively during the fiscal year as amounts which may be taken into account as a dividend for the purposes of the maximum rate under section 1(h)(11) of the Internal Revenue Code.
The fund will notify shareholders in January 2015 of amounts for use in preparing 2014 income tax returns.
Annual Report
Board Approval of Investment Advisory Contracts and Management Fees
Fidelity Dividend Growth Fund
Each year, the Board of Trustees, including the Independent Trustees (together, the Board), votes on the renewal of the management contract with Fidelity Management & Research Company (FMR) and the sub-advisory agreements (together, the Advisory Contracts) for the fund. The Board, assisted by the advice of fund counsel and Independent Trustees' counsel, requests and considers a broad range of information relevant to the renewal of the Advisory Contracts throughout the year.
The Board meets regularly and, at each of its meetings, covers an extensive agenda of topics and materials and considers factors that are relevant to its annual consideration of the renewal of the fund's Advisory Contracts, including the services and support provided to the fund and its shareholders. The Board has established various standing committees (Committees), each composed of and chaired by Independent Trustees with varying backgrounds, to which the Board has assigned specific subject matter responsibilities in order to enhance effective decision-making by the Board. The Board, acting directly and through its Committees, requests and receives information concerning the annual consideration of the renewal of the fund's Advisory Contracts. The Board also meets as needed to consider matters specifically related to the Board's annual consideration of the renewal of the Advisory Contracts. Members of the Board may also meet with trustees of other Fidelity funds through ad hoc joint committees to discuss certain matters relevant to the Fidelity funds.
At its July 2014 meeting, the Board, including the Independent Trustees, unanimously determined to renew the fund's Advisory Contracts. In reaching its determination, the Board considered all factors it believed relevant, including (i) the nature, extent, and quality of the services to be provided to the fund and its shareholders (including the investment performance of the fund); (ii) the competitiveness of the fund's management fee and total expense ratio relative to peer funds; (iii) the total costs of the services to be provided by and the profits to be realized by Fidelity from its relationship with the fund; (iv) the extent to which economies of scale exist and would be realized as the fund grows; and (v) whether fee levels reflect these economies of scale, if any, for the benefit of fund shareholders. In connection with separate internal corporate reorganizations involving Fidelity Management & Research (U.K.) Inc. (FMR U.K.) and Fidelity Management & Research (Japan) Inc. (FMR Japan), the Board approved certain non-material amendments to the fund's sub-advisory agreements with FMR U.K. and FMR Japan to reflect that, after these reorganizations, FMR Investment Management (UK) Limited and Fidelity Management & Research (Japan) Limited will carry on the business of FMR U.K. and FMR Japan, respectively. The Board noted that no changes to the portfolio managers or to the foreign research or investment advisory services provided to the fund were expected in connection with either reorganization and that the same personnel and resources would continue to be available to the fund at the new entities.
Annual Report
Board Approval of Investment Advisory Contracts and
Management Fees - continued
In considering whether to renew the Advisory Contracts for the fund, the Board reached a determination, with the assistance of fund counsel and Independent Trustees' counsel and through the exercise of its business judgment, that the renewal of the Advisory Contracts was in the best interests of the fund and its shareholders and that the compensation payable under the Advisory Contracts was fair and reasonable. The Board's decision to renew the Advisory Contracts was not based on any single factor, but rather was based on a comprehensive consideration of all the information provided to the Board at its meetings throughout the year. The Board, in reaching its determination to renew the Advisory Contracts, was aware that shareholders of the fund have a broad range of investment choices available to them, including a wide choice among funds offered by Fidelity's competitors, and that the fund's shareholders, who have the opportunity to review and weigh the disclosure provided by the fund in its prospectus and other public disclosures, have chosen to invest in this fund, which is part of the Fidelity family of funds.
Nature, Extent, and Quality of Services Provided. The Board considered Fidelity's staffing as it relates to the fund, including the backgrounds of investment personnel of FMR and the sub-advisers (together, the Investment Advisers), and also considered the fund's investment objective, strategies, and related investment philosophy. The Independent Trustees also had discussions with senior management of Fidelity's investment operations and investment groups. The Board considered the structure of the portfolio manager compensation program and whether this structure provides appropriate incentives to act in the best interests of the fund. Additionally, the Board considered the portfolio managers' investments, if any, in the funds that they manage.
Resources Dedicated to Investment Management and Support Services. The Board and the Fund Oversight and Research Committees reviewed the general qualifications and capabilities of Fidelity's investment staff, including its size, education, experience, and resources, as well as Fidelity's approach to recruiting, training, managing, and compensating investment personnel. The Board noted that Fidelity has continued to increase the resources devoted to non-U.S. offices, including expansion of Fidelity's global investment organization. The Board also noted that Fidelity's analysts have extensive resources, tools and capabilities that allow them to conduct sophisticated quantitative and fundamental analysis, as well as credit analysis of issuers, counterparties and guarantors. Further, the Board believes that Fidelity's investment professionals have sufficient access to global information and data so as to provide competitive investment results over time, and that those professionals also have access to sophisticated tools that permit them to assess portfolio construction and risk and performance attribution characteristics continuously, as well as to transmit new information and research conclusions rapidly around the world. Additionally, in its deliberations, the Board considered Fidelity's trading and risk management capabilities and resources and global compliance infrastructure, which are an integral part of the investment management process.
Annual Report
Shareholder and Administrative Services. The Board considered (i) the nature, extent, quality, and cost of advisory, administrative, and shareholder services performed by the Investment Advisers and their affiliates under the Advisory Contracts and under separate agreements covering transfer agency, pricing and bookkeeping, and securities lending services for the fund; (ii) the nature and extent of the supervision of third party service providers, principally custodians and subcustodians; and (iii) the resources devoted to, and the record of compliance with, the fund's compliance policies and procedures. The Board also reviewed the allocation of fund brokerage, including allocations to brokers affiliated with the Investment Advisers, the use of brokerage commissions to pay fund expenses, and the use of "soft" commission dollars to pay for research services.
The Board noted that the growth of fund assets over time across the complex allows Fidelity to reinvest in the development of services designed to enhance the value or convenience of the Fidelity funds as investment vehicles. These services include 24-hour access to account information and market information through telephone representatives and over the Internet, investor education materials and asset allocation tools, and the expanded availability of Fidelity Investor Centers.
In 2014, the Board formed an ad hoc Committee on Transfer Agency Fees to review the variety of transfer agency fee structures throughout the industry and Fidelity's competitive positioning with respect to industry participants.
Investment in a Large Fund Family. The Board considered the benefits to shareholders of investing in a Fidelity fund, including the benefits of investing in a fund that is part of a large family of funds offering a variety of investment disciplines and providing a large variety of mutual fund investor services. The Board noted that Fidelity had taken, or had made recommendations that resulted in the Fidelity funds taking, a number of actions over the previous year that benefited particular funds, including (i) continuing to dedicate additional resources to investment research and to the support of the senior management team that oversees asset management; (ii) persisting in efforts to enhance Fidelity's global research capabilities; (iii) launching new funds and making other enhancements to meet client needs for income-oriented solutions; (iv) reducing fund expenses for certain index funds; (v) continuing to launch dedicated lower cost underlying funds to meet portfolio construction needs related to expanding underlying fund options for Fidelity funds of funds, specifically for the Freedom Fund product lines; (vi) rationalizing product lines and gaining increased efficiencies through fund mergers; (vii) launching sector-based exchange-traded funds and establishing a new Fidelity adviser to manage sector-based funds and products; (viii) continuing to develop and implement technology to improve security and increase efficiency; (ix) modifying the eligibility criteria for certain share classes to increase their marketability to a portion of the defined contribution plan market; (x) waiving redemption fees for certain qualified fund-of-fund and wrap programs and certain retirement plan transactions; and (xi) launching new Institutional Class shares of certain money market funds to attract and retain assets and to fill a gap in the money market fund lineup.
Annual Report
Board Approval of Investment Advisory Contracts and
Management Fees - continued
Investment Performance. The Board considered whether the fund has operated in accordance with its investment objective, as well as its record of compliance with its investment restrictions and its performance history. The Board noted that there was a portfolio management change for the fund in January 2014.
The Board took into account discussions with the Investment Advisers about fund investment performance that occur at Board meetings throughout the year. In this regard the Board noted that as part of regularly scheduled fund reviews and other reports to the Board on fund performance, the Board periodically considers annualized return information for the fund, for different time periods, measured against a securities market index ("benchmark index") and a peer group of funds with similar objectives ("peer group"). In its evaluation of fund investment performance, the Board gave particular attention to information indicating changes in performance of certain Fidelity funds for specific time periods and the Investment Advisers' explanations for any overperformance or underperformance.
In addition to reviewing absolute and relative fund performance, the Independent Trustees periodically consider the appropriateness of fund performance metrics in evaluating the results achieved. In general, the Independent Trustees believe that fund performance should be evaluated based on net performance (after fees and expenses) of both the highest performing and lowest performing classes, where applicable, compared to appropriate benchmark indices, over appropriate time periods which may include full market cycles, and compared to peer groups, as applicable, over the same periods, taking into account relevant factors including the following: general market conditions; issuer-specific information; tactical opportunities for investment; and fund cash flows and other factors.
The Independent Trustees recognize that shareholders evaluate performance on a net basis over their own holding periods, for which one-, three-, and five-year periods are often used as a proxy. For this reason, the performance information reviewed by the Board also included net cumulative calendar year total return information for the fund and an appropriate benchmark index and peer group for the most recent one-, three-, and five-year periods, as shown below. Returns are shown compared to the 25th percentile (top of box, 75% beaten) and 75th percentile (bottom of box, 25% beaten) of the peer universe.
Annual Report
Fidelity Dividend Growth Fund

The Board has discussed with FMR the fund's underperformance (based on the December 31, 2013 data presented herein) and has engaged with FMR to consider what steps might be taken to remediate the fund's underperformance. The Board noted that the fund's performance has improved for more recent periods.
The Board also considered that the fund's management fee is subject to upward or downward adjustment depending upon whether, and to what extent, the fund's investment performance for the performance period exceeds, or is exceeded by, a securities index, thus leading to a performance adjustment for the same period. The Board noted that the performance adjustment provides FMR with a strong economic incentive to seek to achieve superior performance for the fund's shareholders and helps to more closely align the interests of FMR and the fund's shareholders.
Based on its review, the Board concluded that the nature, extent, and quality of services provided to the fund under the Advisory Contracts should benefit the fund's shareholders.
Competitiveness of Management Fee and Total Expense Ratio. The Board considered the fund's management fee and total expense ratio compared to "mapped groups" of competitive funds and classes. Fidelity creates "mapped groups" by combining similar Lipper investment objective categories that have comparable investment mandates. Combining Lipper investment objective categories aids the Board's management fee and total expense ratio comparisons by broadening the competitive group used for comparison and by reducing the number of universes to which various Fidelity funds are compared.
Annual Report
Board Approval of Investment Advisory Contracts and
Management Fees - continued
Management Fee. The Board considered two proprietary management fee comparisons for the 12-month periods shown in the chart below. The group of Lipper funds used by the Board for management fee comparisons is referred to below as the "Total Mapped Group." The Total Mapped Group comparison focuses on a fund's standing in terms of gross management fees before expense reimbursements or caps, and without giving effect to the fund's performance adjustment, relative to the total universe of funds with comparable investment mandates, regardless of whether their management fee structures also are comparable. Funds with comparable investment mandates offer exposure to similar types of securities. Funds with comparable management fee structures have similar management fee contractual arrangements (e.g., flat rate charged for advisory services, all-inclusive fee rate, etc.). "TMG %" represents the percentage of funds in the Total Mapped Group that had management fees that were lower than the fund's. For example, a hypothetical TMG % of 20% would mean that 80% of the funds in the Total Mapped Group had higher, and 20% had lower, management fees than the fund. The fund's actual TMG %s are in the chart below. The "Asset-Size Peer Group" (ASPG) comparison focuses on a fund's standing relative to a subset of non-Fidelity funds within the Total Mapped Group that are similar in size and management fee structure. For example, if a fund is in the first quartile of the ASPG, the fund's management fee ranks in the least expensive or lowest 25% of funds in the ASPG. The ASPG represents at least 15% of the funds in the Total Mapped Group with comparable asset size and management fee structures, subject to a minimum of 50 funds (or all funds in the Total Mapped Group if fewer than 50). Additional information, such as the ASPG quartile in which the fund's management fee rate ranked and the impact of the fund's performance adjustment, is also included in the chart and considered by the Board.
Annual Report
Fidelity Dividend Growth Fund
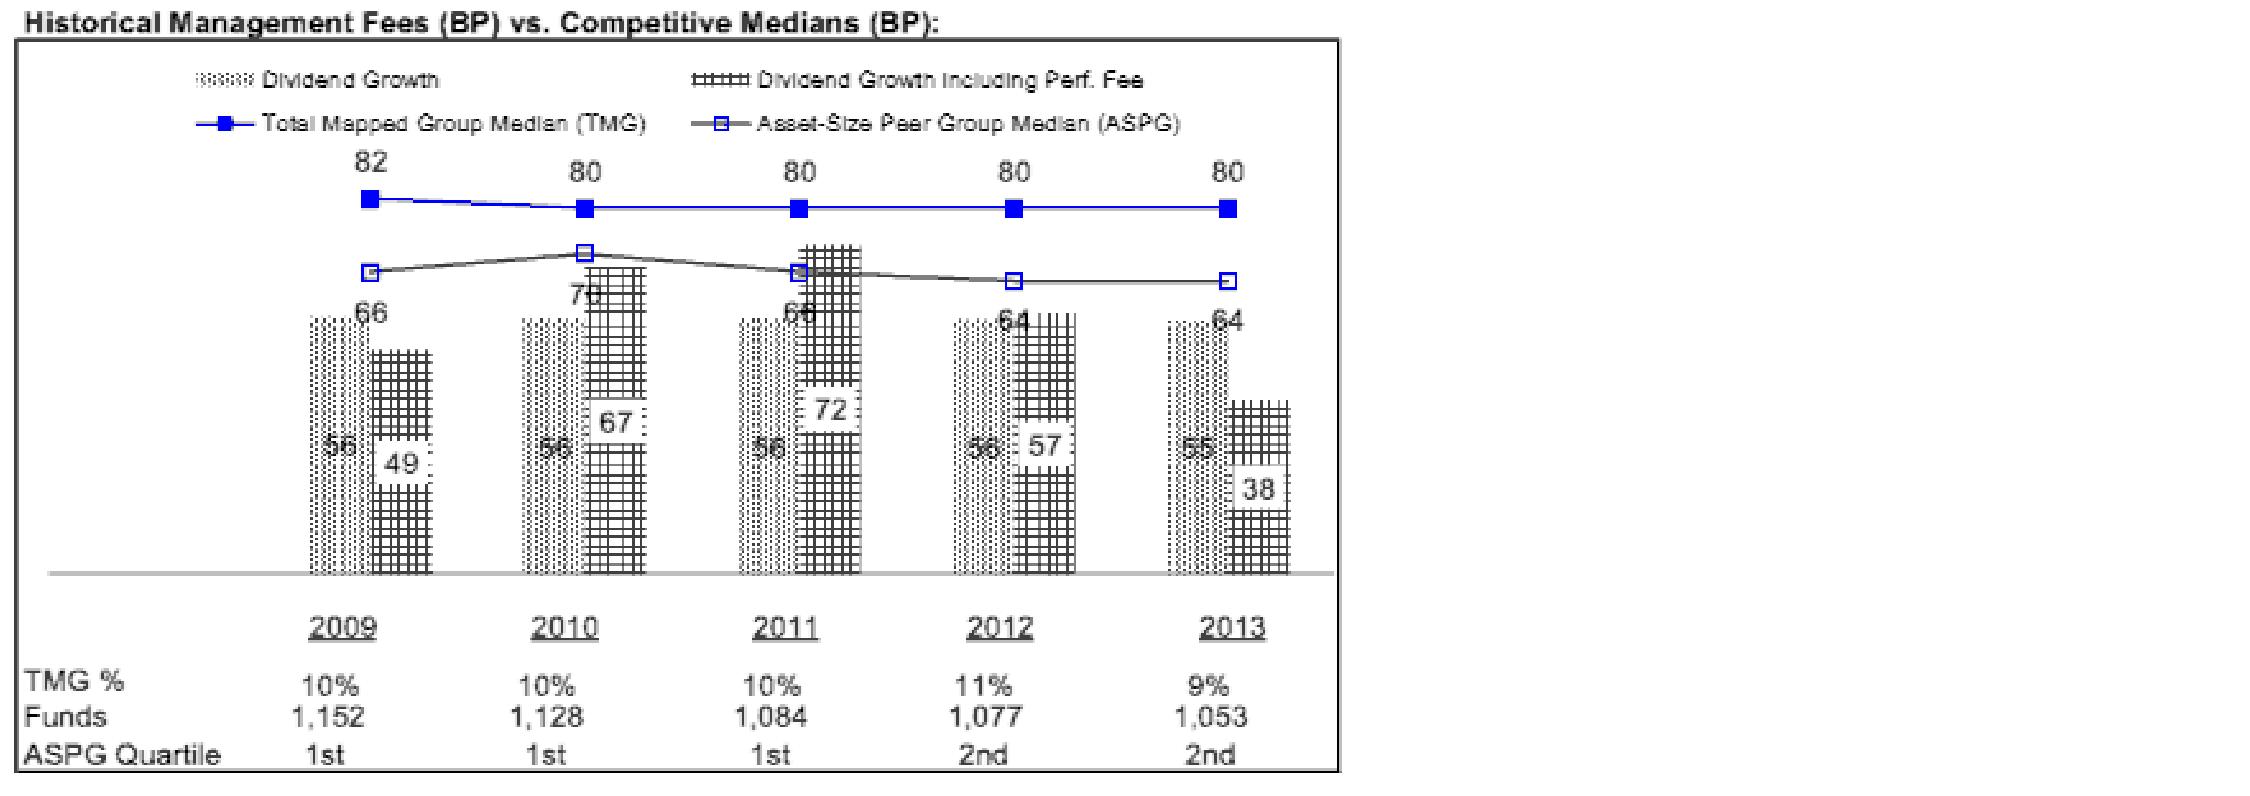
The Board noted that the fund's management fee rate ranked below the median of its Total Mapped Group and below the median of its ASPG for 2013. The Board also noted the effect of the fund's negative performance adjustment on the fund's management fee ranking.
The Board also noted that, in August 2013, the ad hoc Committee on Management Fees was formed to conduct an in-depth review of the management fee rates of Fidelity's active equity mutual funds. The Committee focused on the following areas: (i) standard fee structures; (ii) research consumption and trading evolution; (iii) management fee competitiveness/profitability by category; and (iv) factors that drive institutional pricing.
Based on its review, the Board concluded that the fund's management fee is fair and reasonable in light of the services that the fund receives and the other factors considered.
Total Expense Ratio. In its review of each class's total expense ratio, the Board considered the fund's management fee as well as other fund or class expenses, as applicable, such as transfer agent fees, pricing and bookkeeping fees, and custodial, legal, and audit fees. The Board also noted the effects of any waivers and reimbursements on fees and expenses, as well as the impact of the fund's performance adjustment. As part of its review, the Board also considered the current and historical total expense ratios of each class of the fund compared to competitive fund median expenses. Each class of the fund is compared to those funds and classes in the Total Mapped Group (used by the Board for management fee comparisons) that have a similar sales load structure.
Annual Report
Board Approval of Investment Advisory Contracts and
Management Fees - continued
The Board noted that the total expense ratio of each class ranked below its competitive median for 2013.
Fees Charged to Other Fidelity Clients. The Board also considered Fidelity fee structures and other information with respect to clients of Fidelity, such as other funds advised or subadvised by Fidelity, pension plan clients, and other institutional clients. The Board noted the findings of the 2013 ad hoc joint committee (created with the board of other Fidelity funds), which reviewed and compared Fidelity's institutional investment advisory business with its business of providing services to the Fidelity funds, including the differences in services provided, fees charged, and costs incurred, as well as competition in their respective marketplaces.
Based on its review of total expense ratios and fees charged to other Fidelity clients, the Board concluded that the total expense ratio of each class of the fund was reasonable in light of the services that the fund and its shareholders receive and the other factors considered.
Costs of the Services and Profitability. The Board considered the revenues earned and the expenses incurred by Fidelity in conducting the business of developing, marketing, distributing, managing, administering and servicing the fund and servicing the fund's shareholders. The Board also considered the level of Fidelity's profits in respect of all the Fidelity funds.
On an annual basis, Fidelity presents to the Board Fidelity's profitability for the fund. Fidelity calculates the profitability for each fund, as well as aggregate profitability for groups of Fidelity funds and all Fidelity funds, using a series of detailed revenue and cost allocation methodologies which originate with the books and records of Fidelity on which Fidelity's audited financial statements are based. The Audit Committee of the Board reviews any significant changes from the prior year's methodologies.
PricewaterhouseCoopers LLP (PwC), independent registered public accounting firm and auditor to Fidelity and certain Fidelity funds, has been engaged annually by the Board as part of the Board's assessment of Fidelity's profitability analysis. PwC's engagement includes the review and assessment of the methodologies used by Fidelity in determining the revenues and expenses attributable to Fidelity's mutual fund business, and completion of agreed-upon procedures in respect of the mathematical accuracy of fund profitability and its conformity to established allocation methodologies. After considering PwC's reports issued under the engagement and information provided by Fidelity, the Board concluded that while other allocation methods may also be reasonable, Fidelity's profitability methodologies are reasonable in all material respects.
The Board also reviewed Fidelity's non-fund businesses and fall-out benefits related to the mutual fund business as well as cases where Fidelity's affiliates may benefit from or be related to the fund's business.
Annual Report
The Board considered the costs of the services provided by and the profits realized by Fidelity in connection with the operation of the fund and was satisfied that the profitability was not excessive in the circumstances.
Economies of Scale. The Board considered whether there have been economies of scale in respect of the management of the Fidelity funds, whether the Fidelity funds (including the fund) have appropriately benefited from any such economies of scale, and whether there is potential for realization of any further economies of scale. The Board considered the extent to which the fund will benefit from economies of scale through increased services to the fund, through waivers or reimbursements, or through fee or expense ratio reductions. The Board also noted that in 2013, it and the boards of other Fidelity funds created an ad hoc committee (the Economies of Scale Committee) to analyze whether Fidelity attains economies of scale in respect of the management and servicing of the Fidelity funds, whether the Fidelity funds have appropriately benefited from such economies of scale, and whether there is potential for realization of any further economies of scale.
The Board recognized that the fund's management contract incorporates a "group fee" structure, which provides for lower group fee rates as total group assets increase, and for higher group fee rates as total group assets decrease (with "group assets" defined to include fund assets under FMR's management plus sector fund assets previously under FMR's management and currently managed by Fidelity SelectCo, LLC).
FMR calculates the group fee rates based on a tiered asset "breakpoint" schedule that varies based on asset class. The Board considered that the group fee is designed to deliver the benefits of economies of scale to fund shareholders when total Fidelity fund assets increase, even if assets of any particular fund are unchanged or have declined, because some portion of Fidelity's costs are attributable to services provided to all Fidelity funds, and all funds benefit if those costs can be allocated among more assets. The Board concluded that, given the group fee structure, fund shareholders will benefit from lower management fees as group assets increase at the fund complex level, regardless of whether Fidelity achieves any such economies of scale.
The Board concluded, taking into account the analysis of the Economies of Scale Committee, that economies of scale, if any, are being appropriately shared between fund shareholders and Fidelity.
Additional Information Requested by the Board. In order to develop fully the factual basis for consideration of the Fidelity funds' Advisory Contracts, the Board requested and received additional information on certain topics, including: (i) fund performance trends and Fidelity's long-term strategies for certain funds; (ii) Fidelity's strategic marketing and product lineup goals; (iii) the methodology with respect to competitive fund data and peer group classifications; (iv) the arrangements with, and performance of, certain sub-advisers on behalf of the Fidelity funds, as well as certain proposed participating affiliate arrangements; (v) the realization of fall-out benefits in certain Fidelity business units; (vi) Fidelity's group fee structures, including the rationale for the individual fee rates of certain categories of funds and the definition of group assets; (vii) trends regarding industry use of performance fee structures and the performance adjustment methodologies applicable to the Fidelity funds; (viii) additional competitive analysis regarding the total expenses for certain classes; (ix) fund profitability methodology, including Fidelity's cost allocation methodology, and the impact of certain factors on fund profitability results; and (x) the process by which Fidelity determines sub-advisory fees for funds it advises.
Annual Report
Board Approval of Investment Advisory Contracts and
Management Fees - continued
Based on its evaluation of all of the conclusions noted above, and after considering all factors it believed relevant, the Board ultimately concluded that the advisory fee structures are fair and reasonable, and that the fund's Advisory Contracts should be renewed.
Annual Report
Investment Adviser
Fidelity Management & Research Company
Boston, MA
Investment Sub-Advisers
FMR Co., Inc.
Fidelity Management & Research
(U.K.) Inc.
Fidelity Management & Research
(Hong Kong) Limited
Fidelity Management & Research
(Japan) Inc.
General Distributor
Fidelity Distributors Corporation
Smithfield, RI
Transfer and Service Agents
Fidelity Investments Institutional
Operations Company, Inc.
Boston, MA
Fidelity Service Company, Inc.
Boston, MA
Custodian
Citibank, N.A.,
New York, NY
The Fidelity Telephone Connection
Mutual Fund 24-Hour Service
Exchanges/Redemptions
and Account Assistance 1-800-544-6666
Product Information 1-800-544-6666
Retirement Accounts 1-800-544-4774 (8 a.m. - 9 p.m.)
TDD Service 1-800-544-0118 for the deaf and hearing impaired
(9 a.m. - 9 p.m. Eastern time)
Fidelity Automated Service
Telephone (FAST®)
1-800-544-5555
Automated line for quickest service
(Fidelity Investment logo)(registered trademark)
Corporate Headquarters
245 Summer St., Boston, MA 02210
www.fidelity.com
DGF-UANN-0914
1.789245.111
Fidelity®
Dividend Growth
Fund -
Class K
Annual Report
July 31, 2014
(Fidelity Cover Art)
Contents
Performance | (Click Here) | How the fund has done over time. |
Management's Discussion of Fund Performance | (Click Here) | The Portfolio Manager's review of fund performance and strategy. |
Shareholder Expense Example | (Click Here) | An example of shareholder expenses. |
Investment Changes | (Click Here) | A summary of major shifts in the fund's investments over the past six months. |
Investments | (Click Here) | A complete list of the fund's investments with their market values. |
Financial Statements | (Click Here) | Statements of assets and liabilities, operations, and changes in net assets, as well as financial highlights. |
Notes | (Click Here) | Notes to the financial statements. |
Report of Independent Registered Public Accounting Firm | (Click Here) | |
Trustees and Officers | (Click Here) | |
Distributions | (Click Here) | |
Board Approval of Investment Advisory Contracts and Management Fees | (Click Here) | |
To view a fund's proxy voting guidelines and proxy voting record for the 12-month period ended June 30, visit http://www.fidelity.com/proxyvotingresults or visit the Securities and Exchange Commission's (SEC) web site at http://www.sec.gov. You may also call 1-800-835-5092 to request a free copy of the proxy voting guidelines.
Standard & Poor's, S&P and S&P 500 are registered service marks of The McGraw-Hill Companies, Inc. and have been licensed for use by Fidelity Distributors Corporation.
Other third-party marks appearing herein are the property of their respective owners.
All other marks appearing herein are registered or unregistered trademarks or service marks of FMR LLC or an affiliated company. © 2014 FMR LLC. All rights reserved.
Annual Report
This report and the financial statements contained herein are submitted for the general information of the shareholders of the fund. This report is not authorized for distribution to prospective investors in the fund unless preceded or accompanied by an effective prospectus.
A fund files its complete schedule of portfolio holdings with the SEC for the first and third quarters of each fiscal year on Form N-Q. Forms N-Q are available on the SEC's web site at http://www.sec.gov. A fund's Forms N-Q may be reviewed and copied at the SEC's Public Reference Room in Washington, DC. Information regarding the operation of the SEC's Public Reference Room may be obtained by calling 1-800-SEC-0330. For a complete list of a fund's portfolio holdings, view the most recent holdings listing, semiannual report, or annual report on Fidelity's web site at http://www.fidelity.com, http://www.advisor.fidelity.com, or http://www.401k.com, as applicable.
NOT FDIC INSURED • MAY LOSE VALUE • NO BANK GUARANTEE
Neither the fund nor Fidelity Distributors Corporation is a bank.
Annual Report
Average annual total return reflects the change in the value of an investment, assuming reinvestment of the class' distributions from dividend income and capital gains (the profits earned upon the sale of securities that have grown in value, if any) and assuming a constant rate of performance each year. The $10,000 table and the fund's returns do not reflect the deduction of taxes that a shareholder would pay on fund distributions or the redemption of fund shares. During periods of reimbursement by Fidelity, a fund's total return will be greater than it would be had the reimbursement not occurred. How a fund did yesterday is no guarantee of how it will do tomorrow.
Average Annual Total Returns
Periods ended July 31, 2014 | Past 1
year | Past 5
years | Past 10
years |
Class K A | 17.44% | 16.72% | 7.56% |
A The initial offering of Class K shares took place on May 9, 2008. Returns prior to May 9, 2008 are those of Fidelity® Dividend Growth Fund, the original class of the fund.
$10,000 Over 10 Years
Let's say hypothetically that $10,000 was invested in Fidelity® Dividend Growth Fund - Class K on July 31, 2004. The chart shows how the value of your investment would have changed, and also shows how the S&P 500® Index performed over the same period. See footnote A above for additional information regarding the performance of Class K.
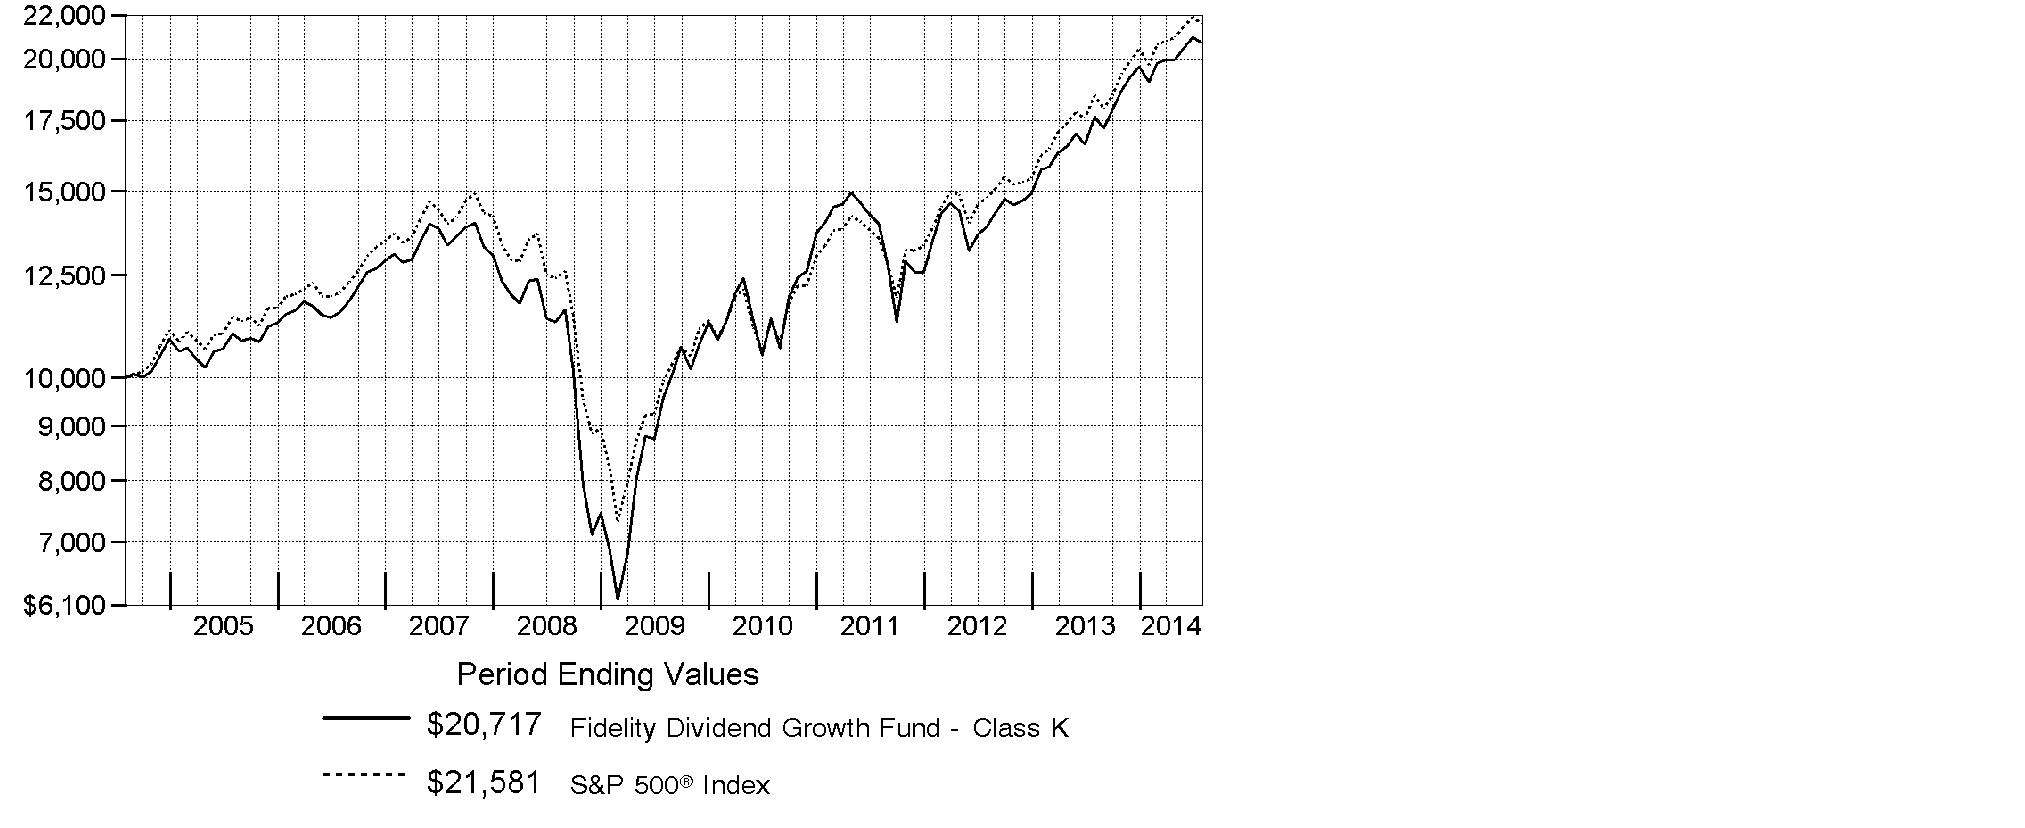
Annual Report
Market Recap: U.S. stocks overcame a slowing economy early in 2014 to post a strong gain for the 12-month period ending July 31, 2014, supported by corporate profits and continued low interest rates. The S&P 500® Index rose 16.94%, reaching an all-time high near period end. The technology-heavy Nasdaq Composite Index® gained 22.00%. The Russell 2000® Index returned 8.56%, reflecting the relatively lackluster performance of small-cap stocks. Information technology (+28%) was the top-performing sector within the S&P 500®, driven by strong semiconductor and computer hardware sales. Materials (+23%) gained amid higher prices for many commodity products. Health care (+21%) rose, driven by gains in pharmaceuticals, biotechnology & life sciences companies. Energy stocks (+19%) advanced in the latter part of the period amid healthy U.S. output and the threat of supply disruptions in Iraq. Conversely, most defensive sectors, including consumer staples, utilities and telecommunication services, lagged the broader market. Volatility remained tame throughout most of the period, with markets supported by declining unemployment, near-record profit margins for companies, muted cost inflation and fairly low corporate debt levels. Geopolitical tension remained a concern at period end, with conflict in Ukraine and strained relations between Russia and the West posing a potential threat to global growth.
Comments from Ramona Persaud, who became Portfolio Manager of Fidelity® Dividend Growth Fund on January 1, 2014: For the year, the fund's Class K shares returned 17.44%, outpacing the S&P 500®. Versus the index, capital goods conglomerate General Electric was the fund's top individual contributor, largely due to timely ownership. We captured a nice gain as shares climbed during the first half of the period, but I sold the stake on valuation concerns just as I came onto the fund, which happened to be right before the stock fell. Elsewhere, it helped the fund to avoid the struggling shares of enterprise technology provider IBM through April, after which I established a postion and have been adding exposure as the stock's valuation has improved. We also had good picks in health care, including Covidien, as the fund benefited when the medical device maker's stock took off in June on news it would be acquired. Conversely, it hurt the most to avoid index name Intel because the chipmaker benefited from a cyclical improvement in the PC cycle. Comverse also detracted in tech, as the non-index telecommunications software developer struggled amid a turnaround under new management.
The views expressed above reflect those of the portfolio manager(s) only through the end of the period as stated on the cover of this report and do not necessarily represent the views of Fidelity or any other person in the Fidelity organization. Any such views are subject to change at any time based upon market or other conditions and Fidelity disclaims any responsibility to update such views. These views may not be relied on as investment advice and, because investment decisions for a Fidelity fund are based on numerous factors, may not be relied on as an indication of trading intent on behalf of any Fidelity fund.
Annual Report
Shareholder Expense Example
As a shareholder of the Fund, you incur two types of costs: (1) transaction costs, and (2) ongoing costs, including management fees and other Fund expenses. This Example is intended to help you understand your ongoing costs (in dollars) of investing in the Fund and to compare these costs with the ongoing costs of investing in other mutual funds.
The Example is based on an investment of $1,000 invested at the beginning of the period and held for the entire period (February 1, 2014 to July 31, 2014).
Actual Expenses
The first line of the accompanying table for each class of the Fund provides information about actual account values and actual expenses. You may use the information in this line, together with the amount you invested, to estimate the expenses that you paid over the period. Simply divide your account value by $1,000.00 (for example, an $8,600 account value divided by $1,000.00 = 8.6), then multiply the result by the number in the first line for a class of the Fund under the heading entitled "Expenses Paid During Period" to estimate the expenses you paid on your account during this period. A small balance maintenance fee of $12.00 that is charged once a year may apply for certain accounts with a value of less than $2,000. This fee is not included in the table below. If it was, the estimate of expenses you paid during the period would be higher, and your ending account value lower, by this amount. In addition, the Fund, as a shareholder in the underlying Fidelity Central Funds, will indirectly bear its pro-rata share of the fees and expenses incurred by the underlying Fidelity Central Funds. These fees and expenses are not included in the Fund's annualized expense ratio used to calculate the expense estimate in the table below.
Hypothetical Example for Comparison Purposes
The second line of the accompanying table for each class of the Fund provides information about hypothetical account values and hypothetical expenses based on a Class' actual expense ratio and an assumed rate of return of 5% per year before expenses, which is not the Class' actual return. The hypothetical account values and expenses may not be used to estimate the actual ending account balance or expenses you paid for the period. You may use this information to compare the ongoing costs of investing in the Fund and other funds. To do so, compare this 5% hypothetical example with the 5% hypothetical examples that appear in the shareholder reports of the other funds. A small balance maintenance fee of $12.00 that is charged once a year may apply for certain accounts with a value of less than $2,000. This fee is not included in the table below. If it was, the estimate of expenses you paid during the period would be higher, and your ending account value lower, by this amount. In addition, the Fund, as a shareholder in the underlying Fidelity Central Funds, will indirectly bear its pro-rata share of the fees and expenses incurred by the underlying Fidelity Central Funds. These fees and expenses are not included in the Fund's annualized expense ratio used to calculate the expense estimate in the table below.
Please note that the expenses shown in the table are meant to highlight your ongoing costs only and do not reflect any transaction costs. Therefore, the second line of the table is useful in comparing ongoing costs only, and will not help you determine the relative total costs of owning different funds.
Annual Report
| Annualized
Expense RatioB | Beginning
Account Value
February 1, 2014 | Ending
Account Value
July 31, 2014 | Expenses Paid
During Period*
February 1, 2014
to July 31, 2014 |
Dividend Growth | .55% | | | |
Actual | | $ 1,000.00 | $ 1,089.40 | $ 2.85 |
HypotheticalA | | $ 1,000.00 | $ 1,022.07 | $ 2.76 |
Class K | .42% | | | |
Actual | | $ 1,000.00 | $ 1,090.40 | $ 2.18 |
HypotheticalA | | $ 1,000.00 | $ 1,022.71 | $ 2.11 |
A 5% return per year before expenses
B Annualized expense ratio reflects expenses net of applicable fee waivers.
* Expenses are equal to each Class' annualized expense ratio, multiplied by the average account value over the period, multiplied by 181/365 (to reflect the one-half year period).
Annual Report
Investment Changes (Unaudited)
Top Ten Stocks as of July 31, 2014 |
| % of fund's
net assets | % of fund's net assets
6 months ago |
Apple, Inc. | 4.0 | 3.0 |
Exxon Mobil Corp. | 2.6 | 2.8 |
JPMorgan Chase & Co. | 2.5 | 2.1 |
Microsoft Corp. | 2.4 | 2.6 |
Johnson & Johnson | 2.3 | 2.0 |
Chevron Corp. | 2.2 | 2.1 |
Wells Fargo & Co. | 2.1 | 2.2 |
Verizon Communications, Inc. | 1.9 | 0.0 |
Oracle Corp. | 1.7 | 1.6 |
Amgen, Inc. | 1.6 | 1.7 |
| 23.3 | |
Top Five Market Sectors as of July 31, 2014 |
| % of fund's
net assets | % of fund's net assets
6 months ago |
Information Technology | 19.6 | 19.4 |
Financials | 15.9 | 14.7 |
Health Care | 14.0 | 11.8 |
Consumer Discretionary | 11.9 | 13.1 |
Consumer Staples | 10.7 | 11.7 |
Asset Allocation (% of fund's net assets) |
As of July 31, 2014* | As of January 31, 2014** |
| Stocks and
Equity Futures 97.0% | | | Stocks and
Equity Futures 97.4% | |
| Convertible
Securities 0.5% | | | Convertible
Securities 0.2% | |
| Other Investments 0.1% | | | Other Investments 0.1% | |
| Short-Term
Investments and
Net Other Assets (Liabilities) 2.4% | | | Short-Term
Investments and
Net Other Assets (Liabilities) 2.3% | |
* Foreign investments | 14.0% | | ** Foreign investments | 17.0% | |

Annual Report
Investments July 31, 2014
Showing Percentage of Net Assets
Common Stocks - 96.5% |
| Shares | | Value (000s) |
CONSUMER DISCRETIONARY - 11.5% |
Auto Components - 0.8% |
Johnson Controls, Inc. | 1,415,436 | | $ 66,865 |
Diversified Consumer Services - 0.6% |
H&R Block, Inc. | 1,567,620 | | 50,368 |
Hotels, Restaurants & Leisure - 2.0% |
ARAMARK Holdings Corp. | 1,654,400 | | 44,603 |
Brinker International, Inc. | 909,961 | | 40,803 |
Darden Restaurants, Inc. (e) | 1,286,100 | | 60,125 |
Wyndham Worldwide Corp. | 348,191 | | 26,306 |
| | 171,837 |
Household Durables - 0.5% |
Taylor Wimpey PLC | 22,670,137 | | 42,599 |
Media - 4.1% |
Altice S.A. | 360,400 | | 20,682 |
Atresmedia Corporacion de Medios de Comunicacion SA (e) | 1,881,566 | | 27,689 |
CBS Corp. Class B | 840,642 | | 47,774 |
Comcast Corp. Class A | 1,868,696 | | 100,405 |
MDC Partners, Inc. Class A (sub. vtg.) | 1,085,908 | | 22,797 |
Time Warner Cable, Inc. | 349,200 | | 50,669 |
Time Warner, Inc. | 936,217 | | 77,725 |
| | 347,741 |
Multiline Retail - 0.4% |
Dillard's, Inc. Class A | 302,900 | | 36,112 |
Specialty Retail - 1.9% |
AutoZone, Inc. (a) | 134,100 | | 69,334 |
Foot Locker, Inc. | 943,079 | | 44,825 |
GameStop Corp. Class A | 1,039,900 | | 43,645 |
VT Holdings Co. Ltd. | 537,100 | | 2,880 |
| | 160,684 |
Textiles, Apparel & Luxury Goods - 1.2% |
NIKE, Inc. Class B | 644,364 | | 49,700 |
VF Corp. | 860,800 | | 52,741 |
| | 102,441 |
TOTAL CONSUMER DISCRETIONARY | | 978,647 |
CONSUMER STAPLES - 10.7% |
Beverages - 3.5% |
Dr. Pepper Snapple Group, Inc. | 1,278,208 | | 75,108 |
Common Stocks - continued |
| Shares | | Value (000s) |
CONSUMER STAPLES - continued |
Beverages - continued |
PepsiCo, Inc. | 1,237,600 | | $ 109,033 |
The Coca-Cola Co. | 2,826,138 | | 111,039 |
| | 295,180 |
Food & Staples Retailing - 2.5% |
Alimentation Couche-Tard, Inc. Class B (sub. vtg.) | 795,100 | | 21,760 |
Kroger Co. | 1,776,209 | | 86,999 |
Rami Levi Chain Stores Hashikma Marketing 2006 Ltd. | 489,201 | | 24,274 |
Tsuruha Holdings, Inc. | 125,500 | | 7,204 |
Walgreen Co. | 1,097,936 | | 75,505 |
| | 215,742 |
Food Products - 1.7% |
Archer Daniels Midland Co. | 1,082,060 | | 50,208 |
Bunge Ltd. | 478,580 | | 37,731 |
Greencore Group PLC | 7,964,077 | | 35,537 |
Hilton Food Group PLC | 641,474 | | 5,136 |
Kellogg Co. | 266,800 | | 15,963 |
| | 144,575 |
Tobacco - 3.0% |
British American Tobacco PLC (United Kingdom) | 1,445,503 | | 84,681 |
Japan Tobacco, Inc. | 1,924,300 | | 67,673 |
Lorillard, Inc. | 1,096,256 | | 66,302 |
Philip Morris International, Inc. | 458,000 | | 37,561 |
| | 256,217 |
TOTAL CONSUMER STAPLES | | 911,714 |
ENERGY - 10.2% |
Energy Equipment & Services - 0.7% |
Aspen Aerogels, Inc. (a) | 754,877 | | 6,115 |
National Oilwell Varco, Inc. | 625,842 | | 50,718 |
| | 56,833 |
Oil, Gas & Consumable Fuels - 9.5% |
Access Midstream Partners LP | 400,136 | | 24,096 |
Chevron Corp. | 1,466,600 | | 189,543 |
ConocoPhillips Co. | 1,118,647 | | 92,288 |
Emerald Oil, Inc. warrants 2/4/16 (a) | 171,198 | | 0 |
EQT Midstream Partners LP | 493,800 | | 42,733 |
Exxon Mobil Corp. | 2,271,797 | | 224,772 |
MPLX LP | 867,322 | | 49,221 |
Common Stocks - continued |
| Shares | | Value (000s) |
ENERGY - continued |
Oil, Gas & Consumable Fuels - continued |
Northern Oil & Gas, Inc. (a) | 1,886,790 | | $ 30,358 |
Phillips 66 Partners LP | 599,536 | | 38,340 |
PrairieSky Royalty Ltd. (e) | 895,600 | | 32,363 |
Suncor Energy, Inc. | 1,564,400 | | 64,235 |
TAG Oil Ltd. (a)(e)(f) | 3,116,900 | | 7,147 |
TAG Oil Ltd. (a)(e)(f)(g) | 146,900 | | 337 |
Woodside Petroleum Ltd. | 437,638 | | 17,179 |
| | 812,612 |
TOTAL ENERGY | | 869,445 |
FINANCIALS - 15.8% |
Banks - 9.6% |
Bank of America Corp. | 8,042,617 | | 122,650 |
Citigroup, Inc. | 2,324,961 | | 113,714 |
JPMorgan Chase & Co. | 3,665,835 | | 211,409 |
Nordea Bank AB | 4,045,990 | | 54,430 |
SunTrust Banks, Inc. | 1,132,300 | | 43,084 |
U.S. Bancorp | 2,328,269 | | 97,857 |
Wells Fargo & Co. | 3,541,093 | | 180,242 |
| | 823,386 |
Capital Markets - 1.8% |
Ameriprise Financial, Inc. | 355,600 | | 42,530 |
BlackRock, Inc. Class A | 121,080 | | 36,897 |
Carlyle Group LP | 438,707 | | 14,644 |
Monex Group, Inc. | 4,910,700 | | 15,776 |
The Blackstone Group LP | 1,344,784 | | 43,948 |
| | 153,795 |
Consumer Finance - 1.0% |
Capital One Financial Corp. | 1,053,567 | | 83,801 |
Diversified Financial Services - 0.8% |
McGraw Hill Financial, Inc. | 863,727 | | 69,288 |
Insurance - 2.5% |
Allied World Assurance Co. Holdings Ltd. | 1,782,724 | | 64,196 |
Aspen Insurance Holdings Ltd. | 989,358 | | 39,584 |
Reinsurance Group of America, Inc. | 377,014 | | 30,259 |
The Chubb Corp. | 195,700 | | 16,969 |
The Travelers Companies, Inc. | 649,168 | | 58,139 |
| | 209,147 |
Common Stocks - continued |
| Shares | | Value (000s) |
FINANCIALS - continued |
Thrifts & Mortgage Finance - 0.1% |
WSFS Financial Corp. | 110,701 | | $ 7,925 |
TOTAL FINANCIALS | | 1,347,342 |
HEALTH CARE - 14.0% |
Biotechnology - 2.6% |
Amgen, Inc. | 1,105,110 | | 140,780 |
Gilead Sciences, Inc. (a) | 906,241 | | 82,966 |
| | 223,746 |
Health Care Equipment & Supplies - 2.2% |
Covidien PLC | 1,116,900 | | 96,623 |
Medtronic, Inc. | 622,600 | | 38,439 |
The Cooper Companies, Inc. | 333,784 | | 53,699 |
| | 188,761 |
Health Care Providers & Services - 1.9% |
Cardinal Health, Inc. | 1,097,003 | | 78,600 |
McKesson Corp. | 429,258 | | 82,357 |
| | 160,957 |
Health Care Technology - 0.1% |
CompuGroup Medical AG | 424,300 | | 10,568 |
Life Sciences Tools & Services - 1.0% |
Agilent Technologies, Inc. | 855,400 | | 47,979 |
Lonza Group AG | 316,798 | | 35,209 |
| | 83,188 |
Pharmaceuticals - 6.2% |
AbbVie, Inc. | 1,975,651 | | 103,406 |
Astellas Pharma, Inc. | 3,404,000 | | 46,160 |
Horizon Pharma, Inc. warrants 9/25/17 (a) | 932,200 | | 3,829 |
Johnson & Johnson | 1,916,743 | | 191,847 |
Merck & Co., Inc. | 2,078,300 | | 117,923 |
Teva Pharmaceutical Industries Ltd. sponsored ADR | 1,230,700 | | 65,842 |
| | 529,007 |
TOTAL HEALTH CARE | | 1,196,227 |
Common Stocks - continued |
| Shares | | Value (000s) |
INDUSTRIALS - 8.4% |
Aerospace & Defense - 2.6% |
The Boeing Co. | 820,700 | | $ 98,878 |
United Technologies Corp. | 1,143,966 | | 120,288 |
| | 219,166 |
Air Freight & Logistics - 0.9% |
FedEx Corp. | 509,452 | | 74,828 |
Airlines - 0.5% |
Delta Air Lines, Inc. | 1,078,800 | | 40,412 |
Electrical Equipment - 0.2% |
Generac Holdings, Inc. (a) | 489,194 | | 21,231 |
Industrial Conglomerates - 1.9% |
Danaher Corp. | 1,166,392 | | 86,173 |
Roper Industries, Inc. | 523,044 | | 75,355 |
| | 161,528 |
Machinery - 0.5% |
Manitowoc Co., Inc. | 646,375 | | 17,168 |
Valmont Industries, Inc. | 194,500 | | 28,325 |
| | 45,493 |
Professional Services - 0.5% |
Dun & Bradstreet Corp. | 435,202 | | 47,885 |
Road & Rail - 1.3% |
CSX Corp. | 805,322 | | 24,095 |
Union Pacific Corp. | 885,930 | | 87,096 |
| | 111,191 |
TOTAL INDUSTRIALS | | 721,734 |
INFORMATION TECHNOLOGY - 19.6% |
Communications Equipment - 2.3% |
Cisco Systems, Inc. | 4,228,486 | | 106,685 |
QUALCOMM, Inc. | 1,185,883 | | 87,400 |
| | 194,085 |
Electronic Equipment & Components - 0.7% |
TE Connectivity Ltd. | 923,994 | | 57,186 |
Common Stocks - continued |
| Shares | | Value (000s) |
INFORMATION TECHNOLOGY - continued |
Internet Software & Services - 2.4% |
Google, Inc.: | | | |
Class A (a) | 178,612 | | $ 103,515 |
Class C (a) | 178,612 | | 102,095 |
| | 205,610 |
IT Services - 4.1% |
Amdocs Ltd. | 974,082 | | 44,165 |
ASAC II LP (j) | 2,514,134 | | 38,754 |
Computer Sciences Corp. | 552,061 | | 34,443 |
Fidelity National Information Services, Inc. | 1,335,150 | | 75,302 |
IBM Corp. | 358,500 | | 68,714 |
Total System Services, Inc. | 679,785 | | 21,753 |
Visa, Inc. Class A | 292,062 | | 61,628 |
Xerox Corp. | 706,734 | | 9,371 |
| | 354,130 |
Semiconductors & Semiconductor Equipment - 0.3% |
MediaTek, Inc. | 1,823,000 | | 28,145 |
Software - 4.9% |
Activision Blizzard, Inc. | 1,709,717 | | 38,263 |
Comverse, Inc. (a) | 934,877 | | 24,008 |
Electronic Arts, Inc. (a) | 371,503 | | 12,483 |
Microsoft Corp. | 4,715,816 | | 203,535 |
Oracle Corp. | 3,515,560 | | 141,993 |
| | 420,282 |
Technology Hardware, Storage & Peripherals - 4.9% |
Apple, Inc. | 3,561,918 | | 340,406 |
EMC Corp. | 2,644,900 | | 77,496 |
| | 417,902 |
TOTAL INFORMATION TECHNOLOGY | | 1,677,340 |
MATERIALS - 2.7% |
Chemicals - 2.3% |
Cabot Corp. | 487,048 | | 25,516 |
Eastman Chemical Co. | 196,899 | | 15,512 |
LyondellBasell Industries NV Class A | 698,138 | | 74,177 |
Potash Corp. of Saskatchewan, Inc. (e) | 1,506,400 | | 53,481 |
W.R. Grace & Co. (a) | 311,091 | | 28,309 |
Westlake Chem Partners LP (a) | 16,100 | | 489 |
| | 197,484 |
Common Stocks - continued |
| Shares | | Value (000s) |
MATERIALS - continued |
Containers & Packaging - 0.0% |
Nampak Ltd. | 42 | | $ 0* |
Metals & Mining - 0.4% |
Freeport-McMoRan Copper & Gold, Inc. | 867,100 | | 32,273 |
TOTAL MATERIALS | | 229,757 |
TELECOMMUNICATION SERVICES - 2.1% |
Diversified Telecommunication Services - 2.1% |
Verizon Communications, Inc. | 3,342,900 | | 168,549 |
Verizon Communications, Inc. CDI | 292,480 | | 14,931 |
| | 183,480 |
UTILITIES - 1.5% |
Electric Utilities - 1.0% |
Edison International | 689,800 | | 37,801 |
NRG Yield, Inc. Class A | 338,600 | | 17,692 |
Xcel Energy, Inc. | 983,752 | | 30,300 |
| | 85,793 |
Multi-Utilities - 0.5% |
CMS Energy Corp. | 1,383,445 | | 40,023 |
TOTAL UTILITIES | | 125,816 |
TOTAL COMMON STOCKS (Cost $6,680,512) |
8,241,502
|
Convertible Preferred Stocks - 0.4% |
| | | |
CONSUMER DISCRETIONARY - 0.4% |
Auto Components - 0.4% |
Mobileye NV 0.00% (j) (Cost $9,659) | 1,383,745 | |
31,134
|
Convertible Bonds - 0.1% |
| Principal Amount (d) (000s) | | Value (000s) |
ENERGY - 0.1% |
Oil, Gas & Consumable Fuels - 0.1% |
Amyris, Inc. 3% 2/27/17 (Cost $7,356) | | $ 7,356 | | $ 6,132 |
U.S. Treasury Obligations - 0.0% |
|
U.S. Treasury Bills, yield at date of purchase 0.03% 8/21/14 to 10/23/14 (i)
(Cost $2,310) | | 2,310 | |
2,310
|
Preferred Securities - 0.1% |
|
FINANCIALS - 0.1% |
Diversified Financial Services - 0.1% |
Baggot Securities Ltd. 10.24% (g)(h) (Cost $10,674) | EUR | 6,950 | |
10,489
|
Money Market Funds - 4.0% |
| Shares | | |
Fidelity Cash Central Fund, 0.11% (b) | 279,722,596 | | 279,723 |
Fidelity Securities Lending Cash Central Fund, 0.11% (b)(c) | 58,806,419 | | 58,806 |
TOTAL MONEY MARKET FUNDS (Cost $338,529) |
338,529
|
TOTAL INVESTMENT PORTFOLIO - 101.1% (Cost $7,049,040) | | 8,630,096 |
NET OTHER ASSETS (LIABILITIES) - (1.1)% | | (92,508) |
NET ASSETS - 100% | $ 8,537,588 |
Futures Contracts |
| Expiration Date | | Underlying Face Amount at Value (000s) | | Unrealized Appreciation/
(Depreciation) (000s) |
Purchased |
Equity Index Contracts |
476 CME E-mini S&P 500 Index Contracts (United States) | Sept. 2014 | | $ 45,810 | | $ 38 |
|
The face value of futures purchased as a percentage of net assets is 0.5% |
Currency Abbreviations |
EUR | - | European Monetary Unit |
Legend |
(a) Non-income producing |
(b) Affiliated fund that is generally available only to investment companies and other accounts managed by Fidelity Investments. The rate quoted is the annualized seven-day yield of the fund at period end. A complete unaudited listing of the fund's holdings as of its most recent quarter end is available upon request. In addition, each Fidelity Central Fund's financial statements, which are not covered by the Fund's Report of Independent Registered Public Accounting Firm, are available on the SEC's website or upon request. |
(c) Investment made with cash collateral received from securities on loan. |
(d) Amount is stated in United States dollars unless otherwise noted. |
(e) Security or a portion of the security is on loan at period end. |
(f) Affiliated company |
(g) Security exempt from registration under Rule 144A of the Securities Act of 1933. These securities may be resold in transactions exempt from registration, normally to qualified institutional buyers. At the end of the period, the value of these securities amounted to $10,826,000 or 0.1% of net assets. |
(h) Security is perpetual in nature with no stated maturity date. |
(i) Security or a portion of the security was pledged to cover margin requirements for futures contracts. At period end, the value of securities pledged amounted to $2,310,000. |
(j) Restricted securities - Investment in securities not registered under the Securities Act of 1933 (excluding 144A issues). At the end of the period, the value of restricted securities (excluding 144A issues) amounted to $69,888,000 or 0.8% of net assets. |
Additional information on each restricted holding is as follows: |
Security | Acquisition Date | Acquisition Cost (000s) |
ASAC II LP | 10/10/13 | $ 25,141 |
Mobileye NV 0.00% | 8/15/13 | $ 9,659 |
* Amount represents less than $1,000
See accompanying notes which are an integral part of the financial statements.
Annual Report
Affiliated Central Funds |
Information regarding fiscal year to date income earned by the Fund from investments in Fidelity Central Funds is as follows: |
Fund | Income earned
(Amount in thousands) |
Fidelity Cash Central Fund | $ 172 |
Fidelity Securities Lending Cash Central Fund | 1,384 |
Total | $ 1,556 |
Other Affiliated Issuers |
An affiliated company is a company in which the Fund has ownership of at least 5% of the voting securities. Fiscal year to date transactions with companies which are or were affiliates are as follows: |
Affiliate
(Amount in thousands) | Value,
beginning of
period | Purchases | Sales
Proceeds | Dividend
Income | Value,
end of
period |
Double Eagle Petroleum Co. | $ 3,050 | $ - | $ 2,039 | $ - | $ - |
PICO Holdings, Inc. | 26,509 | - | 27,964 | - | - |
TAG Oil Ltd. | 13,370 | 1,311 | 1,897 | - | 7,147 |
TAG Oil Ltd. (144A) | 548 | - | - | - | 337 |
Total | $ 43,477 | $ 1,311 | $ 31,900 | $ - | $ 7,484 |
Other Information |
The following is a summary of the inputs used, as of July 31, 2014, involving the Fund's assets and liabilities carried at fair value. The inputs or methodology used for valuing securities may not be an indication of the risk associated with investing in those securities. For more information on valuation inputs, and their aggregation into the levels used in the table below, please refer to the Investment Valuation section in the accompanying Notes to Financial Statements. |
Valuation Inputs at Reporting Date: |
Description
(Amounts in thousands) | Total | Level 1 | Level 2 | Level 3 |
Investments in Securities: | | | | |
Equities: | | | | |
Consumer Discretionary | $ 1,009,781 | $ 975,767 | $ 2,880 | $ 31,134 |
Consumer Staples | 911,714 | 752,156 | 159,558 | - |
Energy | 869,445 | 846,151 | 23,294 | - |
Financials | 1,347,342 | 1,331,566 | 15,776 | - |
Health Care | 1,196,227 | 1,146,238 | 49,989 | - |
Valuation Inputs at Reporting Date: |
Description
(Amounts in thousands) | Total | Level 1 | Level 2 | Level 3 |
Investments in Securities: | | | | |
Equities: | | | | |
Industrials | $ 721,734 | $ 721,734 | $ - | $ - |
Information Technology | 1,677,340 | 1,610,441 | 28,145 | 38,754 |
Materials | 229,757 | 229,757 | - | - |
Telecommunication Services | 183,480 | 183,480 | - | - |
Utilities | 125,816 | 125,816 | - | - |
Corporate Bonds | 6,132 | - | 6,132 | - |
U.S. Government and Government Agency Obligations | 2,310 | - | 2,310 | - |
Preferred Securities | 10,489 | - | 10,489 | - |
Money Market Funds | 338,529 | 338,529 | - | - |
Total Investments in Securities: | $ 8,630,096 | $ 8,261,635 | $ 298,573 | $ 69,888 |
Derivative Instruments: | | | | |
Assets | | | | |
Futures Contracts | $ 38 | $ 38 | $ - | $ - |
Value of Derivative Instruments |
The following table is a summary of the Fund's value of derivative instruments by primary risk exposure as of July 31, 2014. For additional information on derivative instruments, please refer to the Derivative Instruments section in the accompanying Notes to Financial Statements. |
Primary Risk Exposure /
Derivative Type | Value
(000's) |
| Asset | Liability |
Equity Risk | | |
Futures Contracts (a) | $ 38 | $ - |
Total Value of Derivatives | $ 38 | $ - |
(a) Reflects gross cumulative appreciation (depreciation) on futures contracts as presented in the Schedule of Investments. Only the period end receivable or payable for daily variation margin and net unrealized appreciation (depreciation) are presented in the Statement of Assets and Liabilities. |
Other Information |
Distribution of investments by country or territory of incorporation, as a percentage of total net assets, is as follows (Unaudited): |
United States of America | 86.0% |
Canada | 2.3% |
Switzerland | 1.8% |
Japan | 1.7% |
Ireland | 1.6% |
United Kingdom | 1.6% |
Netherlands | 1.3% |
Israel | 1.1% |
Others (Individually Less Than 1%) | 2.6% |
| 100.0% |
See accompanying notes which are an integral part of the financial statements.
Annual Report
Statement of Assets and Liabilities
Amounts in thousands (except per-share amounts) | July 31, 2014 |
| | |
Assets | | |
Investment in securities, at value (including securities loaned of $55,005) - See accompanying schedule: Unaffiliated issuers (cost $6,693,094) | $ 8,284,083 | |
Fidelity Central Funds (cost $338,529) | 338,529 | |
Other affiliated issuers (cost $17,417) | 7,484 | |
Total Investments (cost $7,049,040) | | $ 8,630,096 |
Receivable for investments sold | | 74,611 |
Receivable for fund shares sold | | 3,801 |
Dividends receivable | | 9,011 |
Interest receivable | | 9 |
Distributions receivable from Fidelity Central Funds | | 60 |
Receivable from investment adviser for expense reductions | | 2 |
Other receivables | | 6,173 |
Total assets | | 8,723,763 |
| | |
Liabilities | | |
Payable for investments purchased | $ 116,549 | |
Payable for fund shares redeemed | 5,548 | |
Accrued management fee | 2,648 | |
Payable for daily variation margin for derivative instruments | 959 | |
Other affiliated payables | 1,119 | |
Other payables and accrued expenses | 546 | |
Collateral on securities loaned, at value | 58,806 | |
Total liabilities | | 186,175 |
| | |
Net Assets | | $ 8,537,588 |
Net Assets consist of: | | |
Paid in capital | | $ 5,821,891 |
Undistributed net investment income | | 74,179 |
Accumulated undistributed net realized gain (loss) on investments and foreign currency transactions | | 1,060,449 |
Net unrealized appreciation (depreciation) on investments and assets and liabilities in foreign currencies | | 1,581,069 |
Net Assets | | $ 8,537,588 |
See accompanying notes which are an integral part of the financial statements.
Annual Report
Statement of Assets and Liabilities - continued
Amounts in thousands (except per-share amounts) | July 31, 2014 |
| | |
Dividend Growth:
Net Asset Value, offering price and redemption price per share ($6,480,908 ÷ 173,885 shares) | | $ 37.27 |
| | |
Class K:
Net Asset Value, offering price and redemption price per share ($2,056,680 ÷ 55,185 shares) | | $ 37.27 |
See accompanying notes which are an integral part of the financial statements.
Annual Report
Financial Statements - continued
Statement of Operations
Amounts in thousands | Year ended July 31, 2014 |
| | |
Investment Income | | |
Dividends | | $ 177,941 |
Interest | | 1,253 |
Income from Fidelity Central Funds | | 1,556 |
Total income | | 180,750 |
| | |
Expenses | | |
Management fee
Basic fee | $ 46,667 | |
Performance adjustment | (15,569) | |
Transfer agent fees | 12,383 | |
Accounting and security lending fees | 1,234 | |
Custodian fees and expenses | 283 | |
Independent trustees' compensation | 36 | |
Registration fees | 81 | |
Audit | 83 | |
Legal | 37 | |
Interest | 1 | |
Miscellaneous | 70 | |
Total expenses before reductions | 45,306 | |
Expense reductions | (204) | 45,102 |
Net investment income (loss) | | 135,648 |
Realized and Unrealized Gain (Loss) Net realized gain (loss) on: | | |
Investment securities: | | |
Unaffiliated issuers | 1,411,248 | |
Other affiliated issuers | (22,107) | |
Foreign currency transactions | (955) | |
Futures contracts | 12,645 | |
Total net realized gain (loss) | | 1,400,831 |
Change in net unrealized appreciation (depreciation) on: Investment securities | (186,709) | |
Assets and liabilities in foreign currencies | (17) | |
Futures contracts | 38 | |
Total change in net unrealized appreciation (depreciation) | | (186,688) |
Net gain (loss) | | 1,214,143 |
Net increase (decrease) in net assets resulting from operations | | $ 1,349,791 |
See accompanying notes which are an integral part of the financial statements.
Annual Report
Statement of Changes in Net Assets
Amounts in thousands | Year ended
July 31,
2014 | Year ended
July 31,
2013 |
Increase (Decrease) in Net Assets | | |
Operations | | |
Net investment income (loss) | $ 135,648 | $ 98,270 |
Net realized gain (loss) | 1,400,831 | 698,723 |
Change in net unrealized appreciation (depreciation) | (186,688) | 1,016,174 |
Net increase (decrease) in net assets resulting
from operations | 1,349,791 | 1,813,167 |
Distributions to shareholders from net investment income | (90,956) | (73,780) |
Distributions to shareholders from net realized gain | (759,327) | (120,844) |
Total distributions | (850,283) | (194,624) |
Share transactions - net increase (decrease) | (233,820) | (472,835) |
Total increase (decrease) in net assets | 265,688 | 1,145,708 |
| | |
Net Assets | | |
Beginning of period | 8,271,900 | 7,126,192 |
End of period (including undistributed net investment income of $74,179 and undistributed net investment income of $41,183, respectively) | $ 8,537,588 | $ 8,271,900 |
See accompanying notes which are an integral part of the financial statements.
Annual Report
Financial Highlights - Dividend Growth
Years ended July 31, | 2014 | 2013 | 2012 | 2011 | 2010 |
Selected Per-Share Data | | | | | |
Net asset value, beginning of period | $ 35.33 | $ 28.61 | $ 28.96 | $ 23.84 | $ 20.25 |
Income from Investment Operations | | | | | |
Net investment income (loss) B | .56 | .40 | .20 | .12 | .13E |
Net realized and unrealized gain (loss) | 4.98 | 7.12 | (.41) | 5.23 | 3.63 |
Total from investment operations | 5.54 | 7.52 | (.21) | 5.35 | 3.76 |
Distributions from net investment income | (.37) | (.30) | (.12) | (.15) | (.12) |
Distributions from net realized gain | (3.23) | (.50) | (.02) | (.08) | (.05) |
Total distributions | (3.60) | (.80) | (.14) | (.23) | (.17) |
Net asset value, end of period | $ 37.27 | $ 35.33 | $ 28.61 | $ 28.96 | $ 23.84 |
Total ReturnA | 17.30% | 26.83% | (.67)% | 22.57% | 18.59% |
Ratios to Average Net Assets C, F | | | | | |
Expenses before reductions | .56% | .63% | .91% | .93% | .93% |
Expenses net of fee waivers, if any | .56% | .63% | .91% | .93% | .93% |
Expenses net of all reductions | .56% | .62% | .91% | .93% | .92% |
Net investment income (loss) | 1.58% | 1.26% | .75% | .44% | .56%E |
Supplemental Data | | | | | |
Net assets, end of period (in millions) | $ 6,481 | $ 6,633 | $ 5,905 | $ 9,309 | $ 7,730 |
Portfolio turnover rateD | 99% | 69% | 63% G | 67% | 85% |
A Total returns would have been lower if certain expenses had not been reduced during the applicable periods shown.
B Calculated based on average shares outstanding during the period.
C Fees and expenses of any underlying Fidelity Central Funds are not included in the Fund's expense ratio. The Fund indirectly bears its proportionate share of the expenses of any underlying Fidelity Central Funds.
D Amount does not include the portfolio activity of any underlying Fidelity Central Funds.
E Investment income per share reflects a large, non-recurring dividend which amounted to $.04 per share. Excluding this non-recurring dividend, the ratio of net investment income (loss) to average net assets would have been .40%.
F Expense ratios reflect operating expenses of the class. Expenses before reductions do not reflect amounts reimbursed by the investment adviser or reductions from brokerage service arrangements or reductions from other expense offset arrangements and do not represent the amount paid by the class during periods when reimbursements or reductions occur. Expenses net of fee waivers reflect expenses after reimbursement by the investment adviser but prior to reductions from brokerage service arrangements or other expense offset arrangements. Expenses net of all reductions represent the net expenses paid by the class.
G Portfolio turnover rate excludes securities received or delivered in-kind.
See accompanying notes which are an integral part of the financial statements.
Annual Report
Financial Highlights - Class K
Years ended July 31, | 2014 | 2013 | 2012 | 2011 | 2010 |
Selected Per-Share Data | | | | | |
Net asset value, beginning of period | $ 35.34 | $ 28.62 | $ 28.98 | $ 23.86 | $ 20.26 |
Income from Investment Operations | | | | | |
Net investment income (loss) B | .60 | .45 | .25 | .17 | .18E |
Net realized and unrealized gain (loss) | 4.97 | 7.12 | (.43) | 5.22 | 3.63 |
Total from investment operations | 5.57 | 7.57 | (.18) | 5.39 | 3.81 |
Distributions from net investment income | (.42) | (.35) | (.17) | (.20) | (.16) |
Distributions from net realized gain | (3.23) | (.50) | (.02) | (.08) | (.05) |
Total distributions | (3.64) J | (.85) | (.18)I | (.27)H | (.21) |
Net asset value, end of period | $ 37.27 | $ 35.34 | $ 28.62 | $ 28.98 | $ 23.86 |
Total ReturnA | 17.44% | 27.04% | (.52)% | 22.79% | 18.86% |
Ratios to Average Net Assets C, F | | | | | |
Expenses before reductions | .44% | .48% | .75% | .78% | .72% |
Expenses net of fee waivers, if any | .43% | .48% | .75% | .78% | .72% |
Expenses net of all reductions | .43% | .47% | .75% | .77% | .71% |
Net investment income (loss) | 1.70% | 1.41% | .91% | .60% | .76%E |
Supplemental Data | | | | | |
Net assets, end of period (in millions) | $ 2,057 | $ 1,639 | $ 1,221 | $ 634 | $ 355 |
Portfolio turnover rateD | 99% | 69% | 63% G | 67% | 85% |
A Total returns would have been lower if certain expenses had not been reduced during the applicable periods shown.
B Calculated based on average shares outstanding during the period.
C Fees and expenses of any underlying Fidelity Central Funds are not included in the Fund's expense ratio. The Fund indirectly bears its proportionate share of the expenses of any underlying Fidelity Central Funds.
D Amount does not include the portfolio activity of any underlying Fidelity Central Funds.
E Investment income per share reflects a large, non-recurring dividend which amounted to $.04 per share. Excluding this non-recurring dividend, the ratio of net investment income (loss) to average net assets would have been .60%.
F Expense ratios reflect operating expenses of the class. Expenses before reductions do not reflect amounts reimbursed by the investment adviser or reductions from brokerage service arrangements or reductions from other expense offset arrangements and do not represent the amount paid by the class during periods when reimbursements or reductions occur. Expenses net of fee waivers reflect expenses after reimbursement by the investment adviser but prior to reductions from brokerage service arrangements or other expense offset arrangements. Expenses net of all reductions represent the net expenses paid by the class.
G Portfolio turnover rate excludes securities received or delivered in-kind.
H Total distributions of $.27 per share is comprised of distributions from net investment income of $.197 and distributions from net realized gain of $.077 per share.
I Total distributions of $.18 per share is comprised of distributions from net investment income of $.169 and distributions from net realized gain of $.015 per share.
J Total distributions of $3.64 per share is comprised of distributions from net investment income of $.419 and distributions from net realized gain of $3.225 per share.
See accompanying notes which are an integral part of the financial statements.
Annual Report
Notes to Financial Statements
For the period ended July 31, 2014
(Amounts in thousands except percentages)
1. Organization.
Fidelity Dividend Growth Fund (the Fund) is a fund of Fidelity Securities Fund (the Trust) and is authorized to issue an unlimited number of shares. The Trust is registered under the Investment Company Act of 1940, as amended (the 1940 Act), as an open-end management investment company organized as a Massachusetts business trust. The Fund offers Dividend Growth, and Class K shares, each of which has equal rights as to assets and voting privileges. Each class has exclusive voting rights with respect to matters that affect that class.
2. Investments in Fidelity Central Funds.
The Fund invests in Fidelity Central Funds, which are open-end investment companies generally available only to other investment companies and accounts managed by the investment adviser and its affiliates. The Fund's Schedule of Investments lists each of the Fidelity Central Funds held as of period end, if any, as an investment of the Fund, but does not include the underlying holdings of each Fidelity Central Fund. As an Investing Fund, the Fund indirectly bears its proportionate share of the expenses of the underlying Fidelity Central Funds.
The Money Market Central Funds seek preservation of capital and current income and are managed by Fidelity Investments Money Management, Inc. (FIMM), an affiliate of the investment adviser. Annualized expenses of the Money Market Central Funds as of their most recent shareholder report date are less than .01%.
A complete unaudited list of holdings for each Fidelity Central Fund is available upon request or at the Securities and Exchange Commission (the SEC) website at www.sec.gov. In addition, the financial statements of the Fidelity Central Funds, which are not covered by the Fund's Report of Independent Registered Public Accounting Firm, are available on the SEC website or upon request.
3. Significant Accounting Policies.
The financial statements have been prepared in conformity with accounting principles generally accepted in the United States of America (GAAP), which require management to make certain estimates and assumptions at the date of the financial statements. Actual results could differ from those estimates. Subsequent events, if any, through the date that the financial statements were issued have been evaluated in the preparation of the financial statements. The following summarizes the significant accounting policies of the Fund:
Investment Valuation. Investments are valued as of 4:00 p.m. Eastern time on the last calendar day of the period. In accordance with valuation policies and procedures approved by the Board of Trustees (the Board), the Fund attempts to obtain prices from
Annual Report
3. Significant Accounting Policies - continued
Investment Valuation - continued
one or more third party pricing vendors or brokers to value its investments. When current market prices, quotations or currency exchange rates are not readily available or reliable, investments will be fair valued in good faith by the FMR Fair Value Committee (the Committee), in accordance with procedures adopted by the Board. Factors used in determining fair value vary by investment type and may include market or investment specific events, changes in interest rates and credit quality. The frequency with which these procedures are used cannot be predicted and they may be utilized to a significant extent. The Committee oversees the Fund's valuation policies and procedures and is responsible for approving and reporting to the Board all fair value determinations.
The Fund categorizes the inputs to valuation techniques used to value its investments into a disclosure hierarchy consisting of three levels as shown below:
Level 1 - quoted prices in active markets for identical investments
Level 2 - other significant observable inputs (including quoted prices for similar investments, interest rates, prepayment speeds, etc.)
Level 3 - unobservable inputs (including the Fund's own assumptions based on the best information available)
Valuation techniques used to value the Fund's investments by major category are as follows:
Equity securities, including restricted securities, for which market quotations are readily available, are valued at the last reported sale price or official closing price as reported by a third party pricing vendor on the primary market or exchange on which they are traded and are categorized as Level 1 in the hierarchy. In the event there were no sales during the day or closing prices are not available, securities are valued at the last quoted bid price or may be valued using the last available price and are generally categorized as Level 2 in the hierarchy. For foreign equity securities, when market or security specific events arise, comparisons to the valuation of American Depositary Receipts (ADRs), futures contracts, Exchange-Traded Funds (ETFs) and certain indexes as well as quoted prices for similar securities may be used and would be categorized as Level 2 in the hierarchy. Utilizing these techniques may result in transfers between Level 1 and Level 2. For equity securities, including restricted securities, where observable inputs are limited, assumptions about market activity and risk are used and these securities may be categorized as Level 3 in the hierarchy.
Debt securities, including restricted securities, are valued based on evaluated prices received from third party pricing vendors or from brokers who make markets in such securities. Corporate bonds and U.S. government and government agency obligations are
Annual Report
Notes to Financial Statements - continued
(Amounts in thousands except percentages)
3. Significant Accounting Policies - continued
Investment Valuation - continued
valued by pricing vendors who utilize matrix pricing which considers yield or price of bonds of comparable quality, coupon, maturity and type or by broker-supplied prices. When independent prices are unavailable or unreliable, debt securities may be valued utilizing pricing methodologies which consider similar factors that would be used by third party pricing vendors. Debt securities are generally categorized as Level 2 in the hierarchy but may be Level 3 depending on the circumstances.
Futures contracts are valued at the settlement price established each day by the board of trade or exchange on which they are traded and are categorized as Level 1 in the hierarchy. Investments in open-end mutual funds, including the Fidelity Central Funds, are valued at their closing net asset value (NAV) each business day and are categorized as Level 1 in the hierarchy.
Changes in valuation techniques may result in transfers in or out of an assigned level within the disclosure hierarchy. The aggregate value of investments by input level, as of July 31, 2014, is included at the end of the Fund's Schedule of Investments.
Foreign Currency. The Fund may use foreign currency contracts to facilitate transactions in foreign-denominated securities. Gains and losses from these transactions may arise from changes in the value of the foreign currency or if the counterparties do not perform under the contracts' terms.
Foreign-denominated assets, including investment securities, and liabilities are translated into U.S. dollars at the exchange rates at period end. Purchases and sales of investment securities, income and dividends received and expenses denominated in foreign currencies are translated into U.S. dollars at the exchange rate in effect on the transaction date.
The effects of exchange rate fluctuations on investments are included with the net realized and unrealized gain (loss) on investment securities. Other foreign currency transactions resulting in realized and unrealized gain (loss) are disclosed separately.
Investment Transactions and Income. For financial reporting purposes, the Fund's investment holdings and NAV include trades executed through the end of the last business day of the period. The NAV per share for processing shareholder transactions is calculated as of the close of business of the New York Stock Exchange (NYSE), normally 4:00 p.m. Eastern time and includes trades executed through the end of the prior business day. Gains and losses on securities sold are determined on the basis of identified cost and may include proceeds received from litigation. Dividend income is recorded on the ex-dividend date, except for certain dividends from foreign securities where the ex-dividend date may have passed, which are recorded as soon as the Fund is informed of
Annual Report
3. Significant Accounting Policies - continued
Investment Transactions and Income - continued
the ex-dividend date. Non-cash dividends included in dividend income, if any, are recorded at the fair market value of the securities received Income and capital gain distributions from Fidelity Central Funds, if any, are recorded on the ex-dividend date. Distributions received on securities that represent a return of capital or capital gain are recorded as a reduction of cost of investments and/or as a realized gain. Subsequent to ex-dividend date the Fund determines the components of these distributions, based upon receipt of tax filings or other correspondence relating to the underlying investment. Interest income is accrued as earned and includes coupon interest and amortization of premium and accretion of discount on debt securities as applicable. Investment income is recorded net of foreign taxes withheld where recovery of such taxes is uncertain.
Class Allocations and Expenses. Investment income, realized and unrealized capital gains and losses, common expenses of the Fund, and certain fund-level expense reductions, if any, are allocated daily on a pro-rata basis to each class based on the relative net assets of each class to the total net assets of the Fund. Each class differs with respect to transfer agent fees incurred. Certain expense reductions may also differ by class. For the reporting period, the allocated portion of income and expenses to each class as a percent of its average net assets may vary due to the timing of recording these transactions in relation to fluctuating net assets of the classes. Expenses directly attributable to a fund are charged to that fund. Expenses attributable to more than one fund are allocated among the respective funds on the basis of relative net assets or other appropriate methods. Expense estimates are accrued in the period to which they relate and adjustments are made when actual amounts are known.
Deferred Trustee Compensation. Under a Deferred Compensation Plan (the Plan), independent Trustees may elect to defer receipt of a portion of their annual compensation. Deferred amounts are invested in a cross-section of Fidelity funds, are marked-to-market and remain in the Fund until distributed in accordance with the Plan. The investment of deferred amounts and the offsetting payable to the Trustees are included in the accompanying Statement of Assets and Liabilities.
Income Tax Information and Distributions to Shareholders. Each year, the Fund intends to qualify as a regulated investment company under Subchapter M of the Internal Revenue Code, including distributing substantially all of its taxable income and realized gains. As a result, no provision for U.S. Federal income taxes is required. As of July 31, 2014, the Fund did not have any unrecognized tax benefits in the financial statements; nor is the Fund aware of any tax positions for which it is reasonably possible that the total amounts of unrecognized tax benefits will significantly change in the next twelve months. The Fund files a U.S. federal tax return, in addition to state and local tax returns as required. The Fund's federal income tax returns are subject to examination by
Annual Report
Notes to Financial Statements - continued
(Amounts in thousands except percentages)
3. Significant Accounting Policies - continued
Income Tax Information and Distributions to Shareholders - continued
the Internal Revenue Service (IRS) for a period of three fiscal years after they are filed. State and local tax returns may be subject to examination for an additional fiscal year depending on the jurisdiction. Foreign taxes are provided for based on the Fund's understanding of the tax rules and rates that exist in the foreign markets in which it invests.
Distributions are declared and recorded on the ex-dividend date. Income dividends and capital gain distributions are declared separately for each class. Income and capital gain distributions are determined in accordance with income tax regulations, which may differ from GAAP. In addition, the Fund claimed a portion of the payment made to redeeming shareholders as a distribution for income tax purposes.
Capital accounts within the financial statements are adjusted for permanent book-tax differences. These adjustments have no impact on net assets or the results of operations. Capital accounts are not adjusted for temporary book-tax differences which will reverse in a subsequent period.
Book-tax differences are primarily due to futures contracts, foreign currency transactions, passive foreign investment companies (PFIC), market discount, original issue discount, contingent interest, partnerships, deferred trustees compensation and losses deferred due to wash sales.
The federal tax cost of investment securities and unrealized appreciation (depreciation) as of period end were as follows:
Gross unrealized appreciation | $ 1,652,762 |
Gross unrealized depreciation | (74,187) |
Net unrealized appreciation (depreciation) on securities | $ 1,578,575 |
| |
Tax Cost | $ 7,051,521 |
The tax-based components of distributable earnings as of period end were as follows:
Undistributed ordinary income | $ 161,534 |
Undistributed long-term capital gain | $ 976,013 |
Net unrealized appreciation (depreciation) on securities and other investments | $ 1,578,589 |
Annual Report
3. Significant Accounting Policies - continued
Income Tax Information and Distributions to Shareholders - continued
The tax character of distributions paid was as follows:
| July 31, 2014 | July 31, 2013 |
Ordinary Income | $ 309,025 | $ 80,019 |
Long-term Capital Gains | 541,258 | 114,605 |
Total | $ 850,283 | $ 194,624 |
Restricted Securities. The Fund may invest in securities that are subject to legal or contractual restrictions on resale. These securities generally may be resold in transactions exempt from registration or to the public if the securities are registered. Disposal of these securities may involve time-consuming negotiations and expense, and prompt sale at an acceptable price may be difficult. Information regarding restricted securities is included at the end of the Fund's Schedule of Investments.
4. Derivative Instruments.
Risk Exposures and the Use of Derivative Instruments. The Fund's investment objective allows the Fund to enter into various types of derivative contracts, including futures contracts. Derivatives are investments whose value is primarily derived from underlying assets, indices or reference rates and may be transacted on an exchange or over-the-counter (OTC). Derivatives may involve a future commitment to buy or sell a specified asset based on specified terms, to exchange future cash flows at periodic intervals based on a notional principal amount, or for one party to make one or more payments upon the occurrence of specified events in exchange for periodic payments from the other party.
The Fund used derivatives to increase returns and to manage exposure to certain risks as defined below. The success of any strategy involving derivatives depends on analysis of numerous economic factors, and if the strategies for investment do not work as intended, the Fund may not achieve its objectives.
The Fund's use of derivatives increased or decreased its exposure to the following risk:
Equity Risk | Equity risk relates to the fluctuations in the value of financial instruments as a result of changes in market prices (other than those arising from interest rate risk or foreign exchange risk), whether caused by factors specific to an individual investment, its issuer, or all factors affecting all instruments traded in a market or market segment. |
Annual Report
Notes to Financial Statements - continued
(Amounts in thousands except percentages)
4. Derivative Instruments - continued
Risk Exposures and the Use of Derivative Instruments - continued
The Fund is also exposed to additional risks from investing in derivatives, such as liquidity risk and counterparty credit risk. Liquidity risk is the risk that the Fund will be unable to close out the derivative in the open market in a timely manner. Counterparty credit risk is the risk that the counterparty will not be able to fulfill its obligation to the Fund. Counterparty credit risk related to exchange-traded futures contracts may be mitigated by the protection provided by the exchange on which they trade.
Investing in derivatives may involve greater risks than investing in the underlying assets directly and, to varying degrees, may involve risk of loss in excess of any initial investment and collateral received and amounts recognized in the Statement of Assets and Liabilities. In addition, there may be the risk that the change in value of the derivative contract does not correspond to the change in value of the underlying instrument.
Futures Contracts. A futures contract is an agreement between two parties to buy or sell a specified underlying instrument for a fixed price at a specified future date. The Fund used futures contracts to manage its exposure to the stock market.
Upon entering into a futures contract, a fund is required to deposit either cash or securities (initial margin) with a clearing broker in an amount equal to a certain percentage of the face value of the contract. Futures contracts are marked-to-market daily and subsequent daily payments (variation margin) are made or received by a fund depending on the daily fluctuations in the value of the futures contracts and are recorded as unrealized appreciation or (depreciation). This receivable and/or payable, if any, is included in daily variation margin for derivative instruments in the Statement of Assets and Liabilities. Realized gain or (loss) is recorded upon the expiration or closing of a futures contract.
Any open futures contracts at period end are presented in the Schedule of Investments under the caption "Futures Contracts." The underlying face amount at value reflects each contract's exposure to the underlying instrument or index at period end and is representative of volume of activity during the period. Securities deposited to meet initial margin requirements are identified in the Schedule of Investments.
During the period the Fund recognized net realized gain (loss) of $12,645 and a change in net unrealized appreciation (depreciation) of $38 related to its investment in futures contracts. These amounts are included in the Statement of Operations.
5. Purchases and Sales of Investments.
Purchases and sales of securities, other than short-term securities, aggregated $8,175,346 and $9,295,276 respectively.
Annual Report
6. Fees and Other Transactions with Affiliates.
Management Fee. Fidelity Management & Research Company (the investment adviser) and its affiliates provide the Fund with investment management related services for which the Fund pays a monthly management fee. The management fee is the sum of an individual fund fee rate that is based on an annual rate of .30% of the Fund's average net assets and an annualized group fee rate that averaged .25% during the period. The group fee rate is based upon the average net assets of all the mutual funds advised by the investment adviser, including any mutual funds previously advised by the investment adviser that are currently advised by Fidelity SelectCo, LLC, an affiliate of the investment adviser. The group fee rate decreases as assets under management increase and increases as assets under management decrease. In addition, the management fee is subject to a performance adjustment (up to a maximum of ± .20% of the Fund's average net assets over a 36 month performance period). The upward or downward adjustment to the management fee is based on the relative investment performance of Dividend Growth as compared to its benchmark index, the S&P 500 Index, over the same 36 month performance period. For the reporting period, the total annual management fee rate, including the performance adjustment, was .37% of the Fund's average net assets. The performance adjustment included in the management fee rate may be higher or lower than the maximum performance adjustment rate due to the difference between the average net assets for the reporting and performance periods.
Transfer Agent Fees. Fidelity Investments Institutional Operations Company, Inc., (FIIOC), an affiliate of the investment adviser FMR, is the transfer, dividend disbursing and shareholder servicing agent for each class of the Fund. FIIOC receives account fees and asset-based fees that vary according to the account size and type of account of the shareholders of Dividend Growth. FIIOC receives an asset-based fee of Class K's average net assets. FIIOC pays for typesetting, printing and mailing of shareholder reports, except proxy statements.
For the period, transfer agent fees for each applicable class were as follows:
| Amount | % of
Average
Net Assets |
Dividend Growth | $ 11,554 | .17 |
Class K | 829 | .05 |
| $ 12,383 | |
Accounting and Security Lending Fees. Fidelity Service Company, Inc. (FSC), an affiliate of the investment adviser, maintains the Fund's accounting records. The accounting fee is based on the level of average net assets for each month. Under a separate contract, FSC administers the security lending program. The security lending fee is based on the number and duration of lending transactions.
Annual Report
Notes to Financial Statements - continued
(Amounts in thousands except percentages)
6. Fees and Other Transactions with Affiliates - continued
Brokerage Commissions. The Fund placed a portion of its portfolio transactions with brokerage firms which are affiliates of the investment adviser. Brokerage commissions are included in net realized gain (loss) and change in net unrealized appreciation (depreciation) in the Statement of Operations. The commissions paid to these affiliated firms were $180 for the period.
Interfund Lending Program. Pursuant to an Exemptive Order issued by the SEC, the Fund, along with other registered investment companies having management contracts with FMR or other affiliated entities of FMR, may participate in an interfund lending program. This program provides an alternative credit facility allowing the funds to borrow from, or lend money to, other participating affiliated funds. At period end, there were no interfund loans outstanding. The Fund's activity in this program during the period for which loans were outstanding was as follows:
Borrower or Lender | Average
Loan Balance | Weighted Average
Interest Rate | Interest Expense |
Borrower | $ 10,376 | .36% | $ 1 |
Other. During the period, the investment adviser reimbursed the Fund for certain losses in the amount of $1.
7. Committed Line of Credit.
The Fund participates with other funds managed by the investment adviser or an affiliate in a $4.25 billion credit facility (the "line of credit") to be utilized for temporary or emergency purposes to fund shareholder redemptions or for other short-term liquidity purposes. The Fund has agreed to pay commitment fees on its pro-rata portion of the line of credit, which amounted to $14 and is reflected in Miscellaneous expenses on the Statement of Operations. During the period, the Fund did not borrow on this line of credit.
8. Security Lending.
The Fund lends portfolio securities through a lending agent from time to time in order to earn additional income. For equity securities, a lending agent is used and may loan securities to certain qualified borrowers, including Fidelity Capital Markets (FCM), a broker-dealer affiliated with the Fund. On the settlement date of the loan, the Fund receives collateral (in the form of U.S. Treasury obligations, letters of credit and/or cash) against the loaned securities and maintains collateral in an amount not less than 100% of the market value of the loaned securities during the period of the loan. The market value of the loaned securities is determined at the close of business of the Fund and any additional required collateral is delivered to the Fund on the next business day. If the
Annual Report
8. Security Lending - continued
borrower defaults on its obligation to return the securities loaned because of insolvency or other reasons, the Fund may apply collateral received from the borrower against the obligation. The Fund may experience delays and costs in recovering the securities loaned. Any cash collateral received is invested in the Fidelity Securities Lending Cash Central Fund. The value of loaned securities and cash collateral at period end are disclosed on the Fund's Statement of Assets and Liabilities. At period end, there were no security loans outstanding with FCM. Security lending income represents the income earned on investing cash collateral, less rebates paid to borrowers and any lending agent fees associated with the loan, plus any premium payments received for lending certain types of securities. Security lending income is presented in the Statement of Operations as a component of income from Fidelity Central Funds. Total security lending income during the period amounted to $1,384, including $15 from securities loaned to FCM.
9. Expense Reductions.
Commissions paid to certain brokers with whom the investment adviser, or its affiliates, places trades on behalf of the Fund include an amount in addition to trade execution, which may be rebated back to the Fund to offset certain expenses. This amount totaled $150 for the period.
In addition, the investment adviser reimbursed a portion of the Fund's operating expenses during the period in the amount of $54.
10. Distributions to Shareholders.
Distributions to shareholders of each class were as follows:
Years ended July 31, | 2014 | 2013 |
From net investment income | | |
Dividend Growth | $ 70,700 | $ 58,843 |
Class K | 20,256 | 14,937 |
Total | $ 90,956 | $ 73,780 |
From net realized gain | | |
Dividend Growth | $ 606,886 | $ 99,450 |
Class K | 152,441 | 21,394 |
Total | $ 759,327 | $ 120,844 |
Annual Report
Notes to Financial Statements - continued
(Amounts in thousands except percentages)
11. Share Transactions.
Transactions for each class of shares were as follows:
| Shares | Dollars |
Years ended July 31, | 2014 | 2013 | 2014 | 2013 |
Dividend Growth | | | | |
Shares sold | 11,713 | 18,652 | $ 413,381 | $ 585,373 |
Reinvestment of distributions | 19,201 | 4,994 | 630,027 | 147,845 |
Shares redeemed | (44,744) | (42,352) | (1,586,974) | (1,323,760) |
Net increase (decrease) | (13,830) | (18,706) | $ (543,566) | $ (590,542) |
Class K | | | | |
Shares sold | 14,508 | 13,098 | $ 525,067 | $ 414,093 |
Reinvestment of distributions | 5,265 | 1,228 | 172,697 | 36,331 |
Shares redeemed | (10,980) | (10,587) | (388,018) | (332,717) |
Net increase (decrease) | 8,793 | 3,739 | $ 309,746 | $ 117,707 |
12. Other.
The Fund's organizational documents provide former and current trustees and officers with a limited indemnification against liabilities arising in connection with the performance of their duties to the Fund. In the normal course of business, the Fund may also enter into contracts that provide general indemnifications. The Fund's maximum exposure under these arrangements is unknown as this would be dependent on future claims that may be made against the Fund. The risk of material loss from such claims is considered remote.
Annual Report
To the Trustees of Fidelity Securities Fund and the Shareholders of Fidelity Dividend Growth Fund:
In our opinion, the accompanying statement of assets and liabilities, including the schedule of investments, and the related statements of operations and of changes in net assets and the financial highlights present fairly, in all material respects, the financial position of Fidelity Dividend Growth Fund (a fund of Fidelity Securities Fund) at July 31, 2014, the results of its operations for the year then ended, the changes in its net assets for each of the two years in the period then ended and the financial highlights for each of the five years in the period then ended, in conformity with accounting principles generally accepted in the United States of America. These financial statements and financial highlights (hereafter referred to as "financial statements") are the responsibility of the Fidelity Dividend Growth Fund's management. Our responsibility is to express an opinion on these financial statements based on our audits. We conducted our audits of these financial statements in accordance with the standards of the Public Company Accounting Oversight Board (United States). Those standards require that we plan and perform the audit to obtain reasonable assurance about whether the financial statements are free of material misstatement. An audit includes examining, on a test basis, evidence supporting the amounts and disclosures in the financial statements, assessing the accounting principles used and significant estimates made by management, and evaluating the overall financial statement presentation. We believe that our audits, which included confirmation of securities at July 31, 2014 by correspondence with the custodian and brokers, provide a reasonable basis for our opinion.
PricewaterhouseCoopers LLP
Boston, Massachusetts
September 16, 2014
Annual Report
The Trustees, Member of the Advisory Board, and officers of the trust and fund, as applicable, are listed below. The Board of Trustees governs the fund and is responsible for protecting the interests of shareholders. The Trustees are experienced executives who meet periodically throughout the year to oversee the fund's activities, review contractual arrangements with companies that provide services to the fund, oversee management of the risks associated with such activities and contractual arrangements, and review the fund's performance. Except for James C. Curvey, each of the Trustees oversees 173 funds. Mr. Curvey oversees 397 funds.
The Trustees hold office without limit in time except that (a) any Trustee may resign; (b) any Trustee may be removed by written instrument, signed by at least two-thirds of the number of Trustees prior to such removal; (c) any Trustee who requests to be retired or who has become incapacitated by illness or injury may be retired by written instrument signed by a majority of the other Trustees; and (d) any Trustee may be removed at any special meeting of shareholders by a two-thirds vote of the outstanding voting securities of the trust. Each Trustee who is not an interested person (as defined in the 1940 Act) of the trust and the fund (Independent Trustee), shall retire not later than the last day of the calendar year in which his or her 75th birthday occurs. The Independent Trustees may waive this mandatory retirement age policy with respect to individual Trustees. The officers and Advisory Board Member hold office without limit in time, except that any officer and Advisory Board Member may resign or may be removed by a vote of a majority of the Trustees at any regular meeting or any special meeting of the Trustees. Except as indicated, each individual has held the office shown or other offices in the same company for the past five years.
Experience, Skills, Attributes, and Qualifications of the Fund's Trustees. The Governance and Nominating Committee has adopted a statement of policy that describes the experience, qualifications, attributes, and skills that are necessary and desirable for potential Independent Trustee candidates (Statement of Policy). The Board believes that each Trustee satisfied at the time he or she was initially elected or appointed a Trustee, and continues to satisfy, the standards contemplated by the Statement of Policy. The Governance and Nominating Committee also engages professional search firms to help identify potential Independent Trustee candidates who have the experience, qualifications, attributes, and skills consistent with the Statement of Policy. From time to time, additional criteria based on the composition and skills of the current Independent Trustees, as well as experience or skills that may be appropriate in light of future changes to board composition, business conditions, and regulatory or other developments, have also been considered by the professional search firms and the Governance and Nominating Committee. In addition, the Board takes into account the Trustees' commitment and participation in Board and committee meetings, as well as their leadership of standing and ad hoc committees throughout their tenure.
In determining that a particular Trustee was and continues to be qualified to serve as a Trustee, the Board has considered a variety of criteria, none of which, in isolation, was controlling. The Board believes that, collectively, the Trustees have balanced and diverse experience, qualifications, attributes, and skills, which allow the Board to operate effectively in governing the fund and protecting the interests of shareholders. Information about the specific experience, skills, attributes, and qualifications of each Trustee, which in each case led to the Board's conclusion that the Trustee should serve (or continue to serve) as a trustee of the fund, is provided below.
Annual Report
Board Structure and Oversight Function. James C. Curvey is an interested person (as defined in the 1940 Act) and currently serves as Chairman. The Trustees have determined that an interested Chairman is appropriate and benefits shareholders because an interested Chairman has a personal and professional stake in the quality and continuity of services provided to the fund. Independent Trustees exercise their informed business judgment to appoint an individual of their choosing to serve as Chairman, regardless of whether the Trustee happens to be independent or a member of management. The Independent Trustees have determined that they can act independently and effectively without having an Independent Trustee serve as Chairman and that a key structural component for assuring that they are in a position to do so is for the Independent Trustees to constitute a substantial majority for the Board. The Independent Trustees also regularly meet in executive session. Ned C. Lautenbach serves as Chairman of the Independent Trustees and as such (i) acts as a liaison between the Independent Trustees and management with respect to matters important to the Independent Trustees and (ii) with management prepares agendas for Board meetings.
Fidelity funds are overseen by different Boards of Trustees. The fund's Board oversees Fidelity's equity and high income funds and another Board oversees Fidelity's investment-grade bond, money market, and asset allocation funds. The asset allocation funds may invest in Fidelity funds overseen by the fund's Board. The use of separate Boards, each with its own committee structure, allows the Trustees of each group of Fidelity funds to focus on the unique issues of the funds they oversee, including common research, investment, and operational issues. On occasion, the separate Boards establish joint committees to address issues of overlapping consequences for the Fidelity funds overseen by each Board.
The Trustees operate using a system of committees to facilitate the timely and efficient consideration of all matters of importance to the Trustees, the fund, and fund shareholders and to facilitate compliance with legal and regulatory requirements and oversight of the fund's activities and associated risks. The Board, acting through its committees, has charged FMR and its affiliates with (i) identifying events or circumstances the occurrence of which could have demonstrably adverse effects on the fund's business and/or reputation; (ii) implementing processes and controls to lessen the possibility that such events or circumstances occur or to mitigate the effects of such events or circumstances if they do occur; and (iii) creating and maintaining a system designed to evaluate continuously business and market conditions in order to facilitate the identification and implementation processes described in (i) and (ii) above. Because the day-to-day operations and activities of the fund are carried out by or through FMR, its affiliates and other service providers, the fund's exposure to risks is mitigated but not eliminated by the processes overseen by the Trustees. While each of the Board's committees has responsibility for overseeing different aspects of the fund's activities, oversight is exercised primarily through the Operations, Audit, and Compliance Committees. In addition, the Independent Trustees have worked with FMR to enhance the Board's oversight of investment and financial risks, legal and regulatory risks, technology risks, and operational risks, including the development of additional risk reporting to the Board. For example, a working group comprised of Independent Trustees and FMR has worked and continues to work to review the Fidelity funds' valuation-related activities, reporting and risk management. Appropriate personnel, including but not limited to the fund's Chief Compliance Officer (CCO), FMR's internal auditor, the independent accountants, the fund's Treasurer and portfolio management personnel, make periodic reports to the Board's committees, as appropriate, including an annual review of FMR's risk management program for the Fidelity funds. The responsibilities of each standing committee, including their oversight responsibilities, are described further under "Standing Committees of the Fund's Trustees."
Annual Report
Trustees and Officers - continued
The fund's Statement of Additional Information (SAI) includes more information about the Trustees. To request a free copy, call Fidelity at 1-800-835-5092.
Interested Trustees*:
Correspondence intended for each Trustee who is an interested person may be sent to Fidelity Investments, 245 Summer Street, Boston, Massachusetts 02210.
Name, Year of Birth; Principal Occupations and Other Relevant Experience+ |
James C. Curvey (1935) |
Year of Election or Appointment: 2007 Trustee Chairman of the Board of Trustees |
| Mr. Curvey also serves as Trustee of other Fidelity funds. Mr. Curvey is a Director of Fidelity Research & Analysis Co. (2009-present), and Vice Chairman (2007-present) and Director of FMR LLC. In addition, Mr. Curvey serves as an Overseer for the Boston Symphony Orchestra and a member of the Trustees of Villanova University. Previously, Mr. Curvey served as a Director of Fidelity Investments Money Management, Inc. (2009-2014), a Director of FMR (2007-2014), a Director of FMR Co., Inc. (2007-2014) and was the Vice Chairman (2006-2007) and Director (2000-2007) of FMR Corp. |
Charles S. Morrison (1960) |
Year of Election or Appointment: 2014 Trustee |
| Mr. Morrison also serves as Trustee of other funds. He serves as President, Asset Management (2014-present) and is an employee of Fidelity Investments. Previously, Mr. Morrison served as Vice President of Fidelity's Fixed Income and Asset Allocation Funds (2012-2014), President, Fixed Income (2011-2014), Vice President of Fidelity's Money Market Funds (2005-2009), President, Money Market Group Leader of FMR (2009), and Senior Vice President, Money Market Group of FMR (2004-2009). Mr. Morrison also served as Vice President of Fidelity's Bond Funds (2002-2005), certain Balanced Funds (2002-2005), and certain Asset Allocation Funds (2002-2007), and as Senior Vice President (2002-2005) of Fidelity's Bond Division. |
* Trustees have been determined to be "Interested Trustees" by virtue of, among other things, their affiliation with the trust or various entities under common control with FMR.
+ The information above includes each Trustee's principal occupation during the last five years and other information relating to the experience, attributes, and skills relevant to each Trustee's qualifications to serve as a Trustee, which led to the conclusion that each Trustee should serve as a Trustee for the fund.
Annual Report
Trustees and Officers - continued
Independent Trustees:
Correspondence intended for each Independent Trustee (that is, the Trustees other than the Interested Trustees) may be sent to Fidelity Investments, P.O. Box 55235, Boston, Massachusetts 02205-5235.
Name, Year of Birth; Principal Occupations and Other Relevant Experience+ |
Dennis J. Dirks (1948) |
Year of Election or Appointment: 2005 Trustee |
| Mr. Dirks also serves as Trustee of other Fidelity funds. Prior to his retirement in May 2003, Mr. Dirks was Chief Operating Officer and a member of the Board of The Depository Trust & Clearing Corporation (DTCC). He also served as President, Chief Operating Officer, and Board member of The Depository Trust Company (DTC) and President and Board member of the National Securities Clearing Corporation (NSCC). In addition, Mr. Dirks served as Chief Executive Officer and Board member of the Government Securities Clearing Corporation, Chief Executive Officer and Board member of the Mortgage-Backed Securities Clearing Corporation, as a Trustee and a member of the Finance Committee of Manhattan College (2005-2008), and as a Trustee and a member of the Finance Committee of AHRC of Nassau County (2006-2008). Mr. Dirks is a member of the Independent Directors Council (IDC) Governing Council (2010-present) and Board of Directors for The Brookville Center for Children's Services, Inc. (2009-present). |
Alan J. Lacy (1953) |
Year of Election or Appointment: 2008 Trustee |
| Mr. Lacy also serves as Trustee of other Fidelity funds. Mr. Lacy serves as Senior Adviser (2007-present) of Oak Hill Capital Partners, L.P. (private equity). Mr. Lacy also served as Chief Executive Officer (2000-2005) and Vice Chairman (2005-2006) of Sears Holdings Corporation and Sears, Roebuck and Co. (retail). In addition, Mr. Lacy serves as a member of the Board of Directors of Dave & Buster's Entertainment, Inc. (restaurant and entertainment complexes, 2010-present), Earth Fare, Inc. (retail grocery, 2012-present), The Hillman Companies, Inc. (hardware wholesalers, 2010-present), and Bristol-Myers Squibb Company (global pharmaceuticals, 2008-present). Mr. Lacy is a member of the Board of Trustees of The National Parks Conservation Association (2006-present). Previously, Mr. Lacy served as Chairman of the Board of Trustees of the National Parks Conservation Association (2008-2011) and as a member of the Board of Directors for the Western Union Company (global money transfer, 2006-2011). |
Ned C. Lautenbach (1944) |
Year of Election or Appointment: 2000 Trustee Chairman of the Independent Trustees |
| Mr. Lautenbach also serves as Trustee of other Fidelity funds. Mr. Lautenbach currently serves as the Lead Director of the Eaton Corporation Board of Directors (diversified industrial, 1997-present). Mr. Lautenbach is Chairman of the Board of Directors of the Philharmonic Center for the Arts in Naples, Florida (2012-present) and a member of the Council on Foreign Relations (1994-present). Previously, Mr. Lautenbach was a Partner/Advisory Partner at Clayton, Dubilier & Rice, LLC (private equity investment, 1998-2010), as well as a Director of Sony Corporation (2006-2007). |
Joseph Mauriello (1944) |
Year of Election or Appointment: 2008 Trustee |
| Mr. Mauriello also serves as Trustee of other Fidelity funds. Prior to his retirement in January 2006, Mr. Mauriello served in numerous senior management positions including Deputy Chairman and Chief Operating Officer (2004-2005), and Vice Chairman of Financial Services (2002-2004) of KPMG LLP US (professional services, 1965-2005). Mr. Mauriello currently serves as a member of the Board of Directors of XL Group plc. (global insurance and re-insurance, 2006-present). Previously, Mr. Mauriello served as a Director of the Hamilton Funds of the Bank of New York (2006-2007) and of Arcadia Resources Inc. (health care services and products, 2007-2012). |
Robert W. Selander (1950) |
Year of Election or Appointment: 2011 Trustee |
| Mr. Selander also serves as Trustee of other Fidelity funds. Previously, Mr. Selander served as a Member of the Advisory Board of other Fidelity funds (2011), and Executive Vice Chairman (2010), Chief Executive Officer (2009-2010), and President and Chief Executive Officer (1997-2009) of Mastercard, Inc. |
Cornelia M. Small (1944) |
Year of Election or Appointment: 2005 Trustee |
| Ms. Small also serves as Trustee of other Fidelity funds. Ms. Small is a member of the Board of Directors (2009-present) and Chair of the Investment Committee (2010-present) of the Teagle Foundation. Ms. Small also serves on the Investment Committee of the Berkshire Taconic Community Foundation (2008-present). Previously, Ms. Small served as Chairperson (2002-2008) and a member of the Investment Committee and Chairperson (2008-2012) and a member of the Board of Trustees of Smith College. In addition, Ms. Small served as Chief Investment Officer, Director of Global Equity Investments, and a member of the Board of Directors of Scudder, Stevens & Clark and Scudder Kemper Investments. |
William S. Stavropoulos (1939) |
Year of Election or Appointment: 2002 Trustee Vice Chairman of the Independent Trustees |
| Mr. Stavropoulos also serves as Trustee of other Fidelity funds. Mr. Stavropoulos serves as President and Founder of the Michigan Baseball Foundation, the Great Lakes Loons (2007-present). Mr. Stavropoulos is Chairman Emeritus of the Board of Directors of The Dow Chemical Company, where he previously served in numerous senior management positions, including President, CEO (1995-2000; 2002-2004), Chairman of the Executive Committee (2000-2006), and as a member of the Board of Directors (1990-2006). Currently, Mr. Stavropoulos is Chairman of the Board of Directors of Univar Inc. (global distributor of commodity and specialty chemicals), a Director of Teradata Corporation (data warehousing and technology solutions), and Maersk Inc. (industrial conglomerate), and a member of the Advisory Board for Metalmark Capital LLC (private equity investment, 2005-present). Mr. Stavropoulos is an operating advisor to Clayton, Dubilier & Rice, LLC (private equity investment). In addition, Mr. Stavropoulos is a member of the University of Notre Dame Advisory Council for the College of Science, a Trustee of the Rollin L. Gerstacker Foundation, and a Director of the Naples Philharmonic Center for the Arts. Previously, Mr. Stavropoulos served as a Director of Chemical Financial Corporation (bank holding company, 1993-2012) and Tyco International, Ltd. (multinational manufacturing and services, 2007-2012). |
David M. Thomas (1949) |
Year of Election or Appointment: 2008 Trustee |
| Mr. Thomas also serves as Trustee of other Fidelity funds. Mr. Thomas serves as Non-Executive Chairman of the Board of Directors of Fortune Brands Home and Security (home and security products, 2011-present), and as a member of the Board of Directors of Interpublic Group of Companies, Inc. (marketing communication, 2004-present). Previously, Mr. Thomas served as Executive Chairman (2005-2006) and Chairman and Chief Executive Officer (2000-2005) of IMS Health, Inc. (pharmaceutical and healthcare information solutions), and a Director of Fortune Brands, Inc. (consumer products, 2000-2011). |
+ The information above includes each Trustee's principal occupation during the last five years and other information relating to the experience, attributes, and skills relevant to each Trustee's qualifications to serve as a Trustee, which led to the conclusion that each Trustee should serve as a Trustee for the fund.
Advisory Board Member and Officers:
Correspondence intended for each officer and Peter S. Lynch may be sent to Fidelity Investments, 245 Summer Street, Boston, Massachusetts 02210. Officers appear below in alphabetical order.
Name, Year of Birth; Principal Occupation |
Peter S. Lynch (1944) |
Year of Election or Appointment: 2003 Member of the Advisory Board |
| Mr. Lynch also serves as Member of the Advisory Board of other Fidelity funds. Mr. Lynch is Vice Chairman and a Director of FMR and FMR Co., Inc. In addition, Mr. Lynch serves as a Trustee of Boston College and as the Chairman of the Inner-City Scholarship Fund. Previously, Mr. Lynch served on the Special Olympics International Board of Directors (1997-2006). |
Elizabeth Paige Baumann (1968) |
Year of Election or Appointment: 2012 Anti-Money Laundering (AML) Officer |
| Ms. Baumann also serves as AML Officer of other funds. She is Chief AML Officer of FMR LLC (2012-present) and is an employee of Fidelity Investments. Previously, Ms. Baumann served as Vice President and Deputy Anti-Money Laundering Officer (2007-2012). |
William C. Coffey (1969) |
Year of Election or Appointment: 2009 Assistant Secretary |
| Mr. Coffey also serves as Assistant Secretary of other funds. He is Senior Vice President and Deputy General Counsel of FMR LLC (2010-present), and is an employee of Fidelity Investments. Previously, Mr. Coffey served as Vice President and Associate General Counsel of FMR LLC (2005-2009). |
Jonathan Davis (1968) |
Year of Election or Appointment: 2010 Assistant Treasurer |
| Mr. Davis also serves as Assistant Treasurer of other funds. Mr. Davis is an employee of Fidelity Investments. Previously, Mr. Davis served as Vice President and Associate General Counsel of FMR LLC (2003-2010). |
Adrien E. Deberghes (1967) |
Year of Election or Appointment: 2008 Deputy Treasurer |
| Mr. Deberghes also serves as an officer of other funds. He is an employee of Fidelity Investments (2008-present). Prior to joining Fidelity Investments, Mr. Deberghes was Senior Vice President of Mutual Fund Administration at State Street Corporation (2007-2008), Senior Director of Mutual Fund Administration at Investors Bank & Trust (2005-2007), and Director of Finance for Dunkin' Brands (2000-2005). |
Stephanie J. Dorsey (1969) |
Year of Election or Appointment: 2010 Assistant Treasurer |
| Ms. Dorsey also serves as an officer of other funds. She is an employee of Fidelity Investments (2008-present) and has served in other fund officer roles. Prior to joining Fidelity Investments, Ms. Dorsey served as Treasurer (2004-2008) of the JPMorgan Mutual Funds and Vice President (2004-2008) of JPMorgan Chase Bank. |
Howard J. Galligan III (1966) |
Year of Election or Appointment: 2014 Chief Financial Officer |
| Mr. Galligan also serves as Chief Financial Officer of other funds. Mr. Galligan serves as President of Fidelity Pricing and Cash Management Services (FPCMS) (2014-present) and as a Director of Strategic Advisers, Inc. (2008-present). Previously, Mr. Galligan served as Chief Administrative Officer of Asset Management (2011-2014) and Chief Operating Officer and Senior Vice President of Investment Support for Strategic Advisers, Inc. (2003-2011). |
Scott C. Goebel (1968) |
Year of Election or Appointment: 2008 Secretary and Chief Legal Officer (CLO) |
| Mr. Goebel serves as Secretary and CLO of other funds. Mr. Goebel also serves as Secretary of Fidelity SelectCo, LLC (2013-present), Fidelity Investments Money Management, Inc. (FIMM) (2010-present) and Fidelity Research and Analysis Company (FRAC) (2010-present); General Counsel, Secretary, and Senior Vice President of FMR (2008-present) and FMR Co., Inc. (2008-present); Chief Legal Officer of Fidelity Management & Research (Hong Kong) Limited (2008-present); and Assistant Secretary of Fidelity Management & Research (Japan) Inc. (2008-present) and Fidelity Management & Research (U.K.) Inc. (2008-present). Previously, Mr. Goebel served as Secretary and CLO of other Fidelity funds (2008-2013), Assistant Secretary of FIMM (2008-2010), FRAC (2008-2010), and certain funds (2007-2008); and as Vice President and Secretary of Fidelity Distributors Corporation (FDC) (2005-2007). Mr. Goebel has been employed by FMR LLC or an affiliate since 2001. |
Brian B. Hogan (1964) |
Year of Election or Appointment: 2009 Vice President |
| Mr. Hogan also serves as Trustee or Vice President of other funds. Mr. Hogan serves as President of FMR's Equity Division (2009-present). Previously, Mr. Hogan served as Senior Vice President, Equity Research of FMR (2006-2009) and as a portfolio manager. |
Chris Maher (1972) |
Year of Election or Appointment: 2013 Assistant Treasurer |
| Mr. Maher serves as Assistant Treasurer of other funds. Mr. Maher is Vice President of Valuation Oversight and is an employee of Fidelity Investments. Previously, Mr. Maher served as Vice President of Asset Management Compliance (2013), Vice President of FMR's Program Management Group (2010-2013), and Vice President of Valuation Oversight (2008-2010). |
Melissa M. Reilly (1971) |
Year of Election or Appointment: 2014 Vice President of certain Equity Funds |
| Ms. Reilly also serves as Vice President of other funds. Ms. Reilly is an employee of Fidelity Investments (2004-present). |
Kenneth B. Robins (1969) |
Year of Election or Appointment: 2008 President and Treasurer |
| Mr. Robins also serves as an officer of other funds. Mr. Robins serves as Executive Vice President of Fidelity Investments Money Management, Inc. (FIMM) (2013-present) and is an employee of Fidelity Investments (2004-present). Previously, Mr. Robins served in other fund officer roles. |
Stephen Sadoski (1971) |
Year of Election or Appointment: 2012 Deputy Treasurer |
| Mr. Sadoski also serves as Deputy Treasurer of other funds. He is an employee of Fidelity Investments (2012-present) and has served in another fund officer role. Prior to joining Fidelity Investments, Mr. Sadoski served as an assistant chief accountant in the Division of Investment Management of the Securities and Exchange Commission (SEC) (2009-2012) and as a senior manager at Deloitte & Touche LLP (1997-2009). |
Stacie M. Smith (1974) |
Year of Election or Appointment: 2013 Deputy Treasurer |
| Ms. Smith also serves as an officer of other funds. She is an employee of Fidelity Investments (2009-present) and has served in other fund officer roles. Prior to joining Fidelity Investments, Ms. Smith served as Senior Audit Manager of Ernst & Young LLP (1996-2009). |
Renee Stagnone (1975) |
Year of Election or Appointment: 2013 Deputy Treasurer |
| Ms. Stagnone also serves as Deputy Treasurer of other funds. Ms. Stagnone is an employee of Fidelity Investments. |
Linda J. Wondrack (1964) |
Year of Election or Appointment: 2014 Chief Compliance Officer |
| Ms. Wondrack also serves as Chief Compliance Officer of other funds. Ms. Wondrack is Executive Vice President and head of the Ethics Office and Asset Management Compliance for Fidelity Investments (2012-present). Ms. Wondrack also serves as Chief Compliance Officer of Fidelity SelectCo, LLC (2014-present); Chief Compliance Officer of Impresa Management LLC (2013-present); and Chief Compliance Officer of FMR Co., Inc., Fidelity Investments Money Management, Inc., Fidelity Management & Research (Japan) Inc., Fidelity Management & Research (U.K.) Inc., Fidelity Management & Research (Hong Kong), Fidelity Management & Research Company, Pyramis Global Advisors, LLC, and Strategic Advisers, Inc., Ballyrock Investment Advisors LLC, and Northern Neck Investors LLC (2012-present). Previously, Ms. Wondrack served as Senior Vice President and Chief Compliance Officer for Columbia Management Investment Advisers, LLC (2005-2012); Chief Compliance Officer for certain funds within the Columbia Family of Funds (2007-2012); and Senior Vice President of Compliance Risk Management at Bank of America (2005-2010). |
Joseph F. Zambello (1957) |
Year of Election or Appointment: 2011 Deputy Treasurer |
| Mr. Zambello also serves as Deputy Treasurer of other funds. Mr. Zambello is an employee of Fidelity Investments. Previously, Mr. Zambello served as Vice President of FMR's Program Management Group (2009-2011) and Vice President of the Transfer Agent Oversight Group (2005-2009). |
Annual Report
The Board of Trustees of Fidelity Dividend Growth Fund voted to pay on record date, the following distributions per share derived from capital gains realized from sales of portfolio securities, and dividends derived from net investment income:
| Pay Date | Record Date | Dividends | Capital Gains |
Class K | 9/15/14 | 9/12/14 | $0.351 | $4.693 |
The fund hereby designates as a capital gain dividend with respect to the taxable year ended July 31, 2014 $1,098,980,760, or, if subsequently determined to be different, the net capital gain of such year.
Class K designates 23% and 42% of the dividends distributed in September and December, respectively during the fiscal year as qualifying for the dividends-received deduction for corporate shareholders.
Class K designates 31% and 52% of the dividends distributed in September and December, respectively during the fiscal year as amounts which may be taken into account as a dividend for the purposes of the maximum rate under section 1(h)(11) of the Internal Revenue Code.
The fund will notify shareholders in January 2015 of amounts for use in preparing 2014 income tax returns.
Annual Report
Board Approval of Investment Advisory Contracts and Management Fees
Fidelity Dividend Growth Fund
Each year, the Board of Trustees, including the Independent Trustees (together, the Board), votes on the renewal of the management contract with Fidelity Management & Research Company (FMR) and the sub-advisory agreements (together, the Advisory Contracts) for the fund. The Board, assisted by the advice of fund counsel and Independent Trustees' counsel, requests and considers a broad range of information relevant to the renewal of the Advisory Contracts throughout the year.
The Board meets regularly and, at each of its meetings, covers an extensive agenda of topics and materials and considers factors that are relevant to its annual consideration of the renewal of the fund's Advisory Contracts, including the services and support provided to the fund and its shareholders. The Board has established various standing committees (Committees), each composed of and chaired by Independent Trustees with varying backgrounds, to which the Board has assigned specific subject matter responsibilities in order to enhance effective decision-making by the Board. The Board, acting directly and through its Committees, requests and receives information concerning the annual consideration of the renewal of the fund's Advisory Contracts. The Board also meets as needed to consider matters specifically related to the Board's annual consideration of the renewal of the Advisory Contracts. Members of the Board may also meet with trustees of other Fidelity funds through ad hoc joint committees to discuss certain matters relevant to the Fidelity funds.
At its July 2014 meeting, the Board, including the Independent Trustees, unanimously determined to renew the fund's Advisory Contracts. In reaching its determination, the Board considered all factors it believed relevant, including (i) the nature, extent, and quality of the services to be provided to the fund and its shareholders (including the investment performance of the fund); (ii) the competitiveness of the fund's management fee and total expense ratio relative to peer funds; (iii) the total costs of the services to be provided by and the profits to be realized by Fidelity from its relationship with the fund; (iv) the extent to which economies of scale exist and would be realized as the fund grows; and (v) whether fee levels reflect these economies of scale, if any, for the benefit of fund shareholders. In connection with separate internal corporate reorganizations involving Fidelity Management & Research (U.K.) Inc. (FMR U.K.) and Fidelity Management & Research (Japan) Inc. (FMR Japan), the Board approved certain non-material amendments to the fund's sub-advisory agreements with FMR U.K. and FMR Japan to reflect that, after these reorganizations, FMR Investment Management (UK) Limited and Fidelity Management & Research (Japan) Limited will carry on the business of FMR U.K. and FMR Japan, respectively. The Board noted that no changes to the portfolio managers or to the foreign research or investment advisory services provided to the fund were expected in connection with either reorganization and that the same personnel and resources would continue to be available to the fund at the new entities.
Annual Report
Board Approval of Investment Advisory Contracts and
Management Fees - continued
In considering whether to renew the Advisory Contracts for the fund, the Board reached a determination, with the assistance of fund counsel and Independent Trustees' counsel and through the exercise of its business judgment, that the renewal of the Advisory Contracts was in the best interests of the fund and its shareholders and that the compensation payable under the Advisory Contracts was fair and reasonable. The Board's decision to renew the Advisory Contracts was not based on any single factor, but rather was based on a comprehensive consideration of all the information provided to the Board at its meetings throughout the year. The Board, in reaching its determination to renew the Advisory Contracts, was aware that shareholders of the fund have a broad range of investment choices available to them, including a wide choice among funds offered by Fidelity's competitors, and that the fund's shareholders, who have the opportunity to review and weigh the disclosure provided by the fund in its prospectus and other public disclosures, have chosen to invest in this fund, which is part of the Fidelity family of funds.
Nature, Extent, and Quality of Services Provided. The Board considered Fidelity's staffing as it relates to the fund, including the backgrounds of investment personnel of FMR and the sub-advisers (together, the Investment Advisers), and also considered the fund's investment objective, strategies, and related investment philosophy. The Independent Trustees also had discussions with senior management of Fidelity's investment operations and investment groups. The Board considered the structure of the portfolio manager compensation program and whether this structure provides appropriate incentives to act in the best interests of the fund. Additionally, the Board considered the portfolio managers' investments, if any, in the funds that they manage.
Resources Dedicated to Investment Management and Support Services. The Board and the Fund Oversight and Research Committees reviewed the general qualifications and capabilities of Fidelity's investment staff, including its size, education, experience, and resources, as well as Fidelity's approach to recruiting, training, managing, and compensating investment personnel. The Board noted that Fidelity has continued to increase the resources devoted to non-U.S. offices, including expansion of Fidelity's global investment organization. The Board also noted that Fidelity's analysts have extensive resources, tools and capabilities that allow them to conduct sophisticated quantitative and fundamental analysis, as well as credit analysis of issuers, counterparties and guarantors. Further, the Board believes that Fidelity's investment professionals have sufficient access to global information and data so as to provide competitive investment results over time, and that those professionals also have access to sophisticated tools that permit them to assess portfolio construction and risk and performance attribution characteristics continuously, as well as to transmit new information and research conclusions rapidly around the world. Additionally, in its deliberations, the Board considered Fidelity's trading and risk management capabilities and resources and global compliance infrastructure, which are an integral part of the investment management process.
Annual Report
Shareholder and Administrative Services. The Board considered (i) the nature, extent, quality, and cost of advisory, administrative, and shareholder services performed by the Investment Advisers and their affiliates under the Advisory Contracts and under separate agreements covering transfer agency, pricing and bookkeeping, and securities lending services for the fund; (ii) the nature and extent of the supervision of third party service providers, principally custodians and subcustodians; and (iii) the resources devoted to, and the record of compliance with, the fund's compliance policies and procedures. The Board also reviewed the allocation of fund brokerage, including allocations to brokers affiliated with the Investment Advisers, the use of brokerage commissions to pay fund expenses, and the use of "soft" commission dollars to pay for research services.
The Board noted that the growth of fund assets over time across the complex allows Fidelity to reinvest in the development of services designed to enhance the value or convenience of the Fidelity funds as investment vehicles. These services include 24-hour access to account information and market information through telephone representatives and over the Internet, investor education materials and asset allocation tools, and the expanded availability of Fidelity Investor Centers.
In 2014, the Board formed an ad hoc Committee on Transfer Agency Fees to review the variety of transfer agency fee structures throughout the industry and Fidelity's competitive positioning with respect to industry participants.
Investment in a Large Fund Family. The Board considered the benefits to shareholders of investing in a Fidelity fund, including the benefits of investing in a fund that is part of a large family of funds offering a variety of investment disciplines and providing a large variety of mutual fund investor services. The Board noted that Fidelity had taken, or had made recommendations that resulted in the Fidelity funds taking, a number of actions over the previous year that benefited particular funds, including (i) continuing to dedicate additional resources to investment research and to the support of the senior management team that oversees asset management; (ii) persisting in efforts to enhance Fidelity's global research capabilities; (iii) launching new funds and making other enhancements to meet client needs for income-oriented solutions; (iv) reducing fund expenses for certain index funds; (v) continuing to launch dedicated lower cost underlying funds to meet portfolio construction needs related to expanding underlying fund options for Fidelity funds of funds, specifically for the Freedom Fund product lines; (vi) rationalizing product lines and gaining increased efficiencies through fund mergers; (vii) launching sector-based exchange-traded funds and establishing a new Fidelity adviser to manage sector-based funds and products; (viii) continuing to develop and implement technology to improve security and increase efficiency; (ix) modifying the eligibility criteria for certain share classes to increase their marketability to a portion of the defined contribution plan market; (x) waiving redemption fees for certain qualified fund-of-fund and wrap programs and certain retirement plan transactions; and (xi) launching new Institutional Class shares of certain money market funds to attract and retain assets and to fill a gap in the money market fund lineup.
Annual Report
Board Approval of Investment Advisory Contracts and
Management Fees - continued
Investment Performance. The Board considered whether the fund has operated in accordance with its investment objective, as well as its record of compliance with its investment restrictions and its performance history. The Board noted that there was a portfolio management change for the fund in January 2014.
The Board took into account discussions with the Investment Advisers about fund investment performance that occur at Board meetings throughout the year. In this regard the Board noted that as part of regularly scheduled fund reviews and other reports to the Board on fund performance, the Board periodically considers annualized return information for the fund, for different time periods, measured against a securities market index ("benchmark index") and a peer group of funds with similar objectives ("peer group"). In its evaluation of fund investment performance, the Board gave particular attention to information indicating changes in performance of certain Fidelity funds for specific time periods and the Investment Advisers' explanations for any overperformance or underperformance.
In addition to reviewing absolute and relative fund performance, the Independent Trustees periodically consider the appropriateness of fund performance metrics in evaluating the results achieved. In general, the Independent Trustees believe that fund performance should be evaluated based on net performance (after fees and expenses) of both the highest performing and lowest performing classes, where applicable, compared to appropriate benchmark indices, over appropriate time periods which may include full market cycles, and compared to peer groups, as applicable, over the same periods, taking into account relevant factors including the following: general market conditions; issuer-specific information; tactical opportunities for investment; and fund cash flows and other factors.
The Independent Trustees recognize that shareholders evaluate performance on a net basis over their own holding periods, for which one-, three-, and five-year periods are often used as a proxy. For this reason, the performance information reviewed by the Board also included net cumulative calendar year total return information for the fund and an appropriate benchmark index and peer group for the most recent one-, three-, and five-year periods, as shown below. Returns are shown compared to the 25th percentile (top of box, 75% beaten) and 75th percentile (bottom of box, 25% beaten) of the peer universe.
Annual Report
Fidelity Dividend Growth Fund
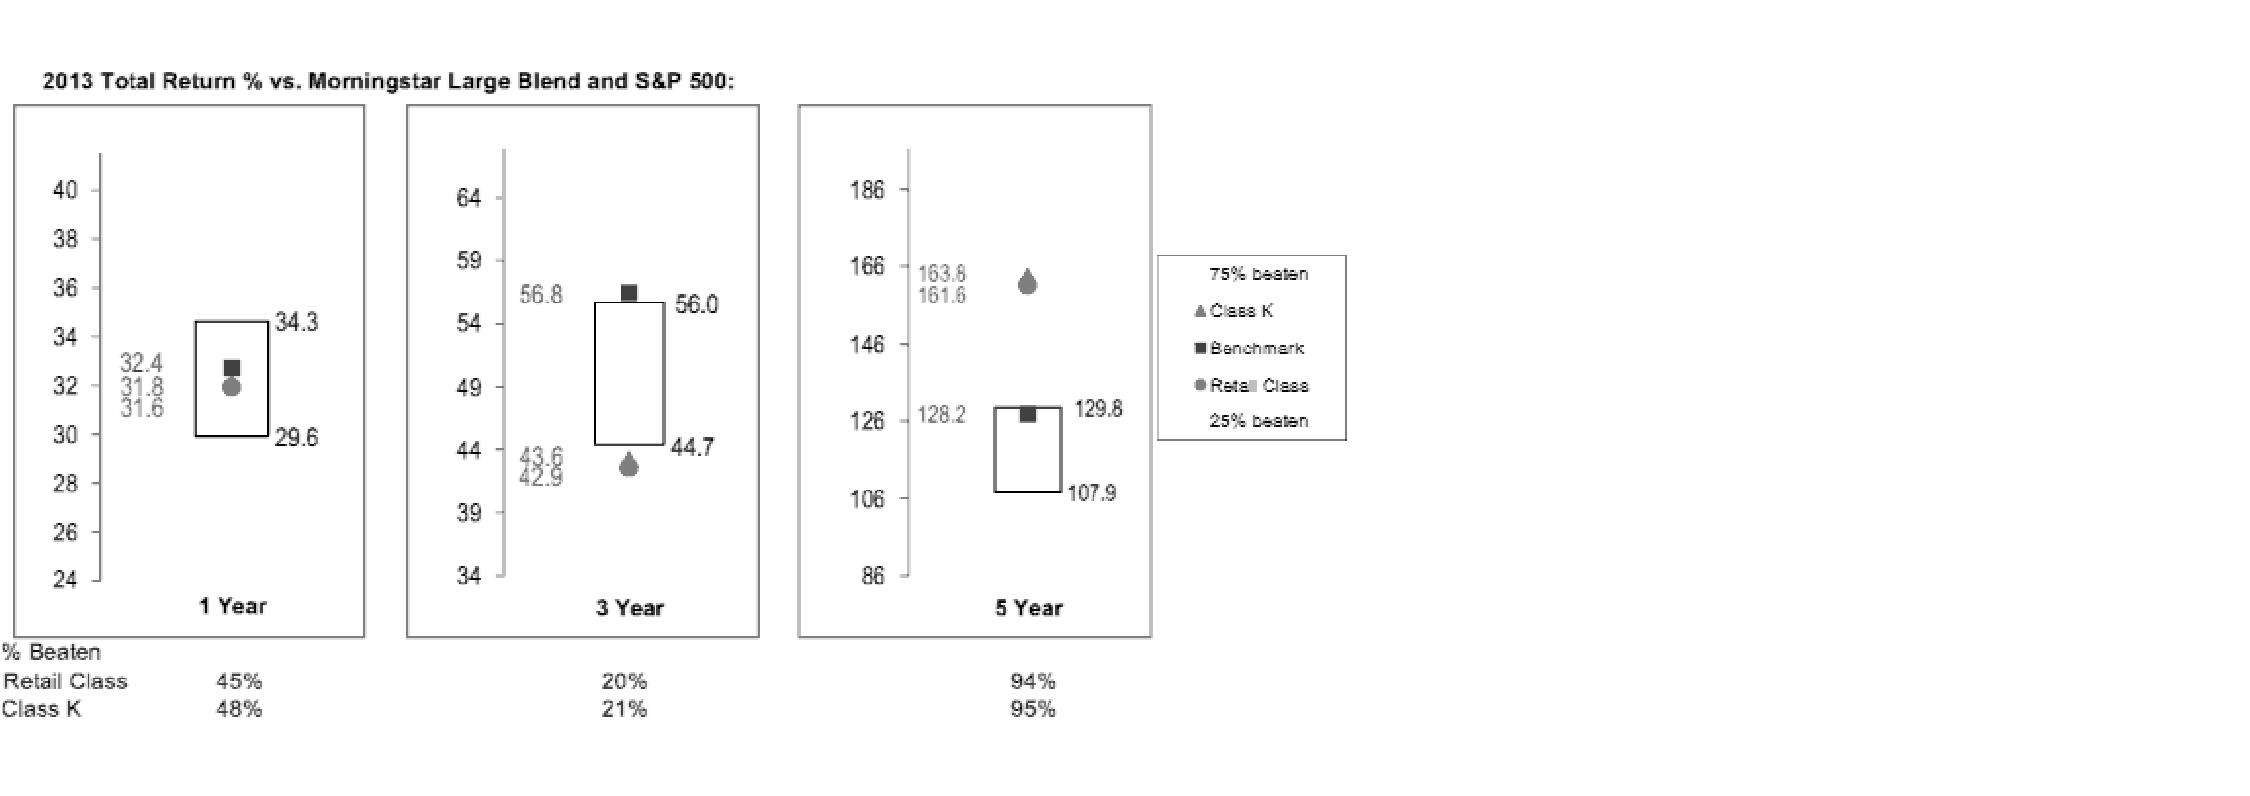
The Board has discussed with FMR the fund's underperformance (based on the December 31, 2013 data presented herein) and has engaged with FMR to consider what steps might be taken to remediate the fund's underperformance. The Board noted that the fund's performance has improved for more recent periods.
The Board also considered that the fund's management fee is subject to upward or downward adjustment depending upon whether, and to what extent, the fund's investment performance for the performance period exceeds, or is exceeded by, a securities index, thus leading to a performance adjustment for the same period. The Board noted that the performance adjustment provides FMR with a strong economic incentive to seek to achieve superior performance for the fund's shareholders and helps to more closely align the interests of FMR and the fund's shareholders.
Based on its review, the Board concluded that the nature, extent, and quality of services provided to the fund under the Advisory Contracts should benefit the fund's shareholders.
Competitiveness of Management Fee and Total Expense Ratio. The Board considered the fund's management fee and total expense ratio compared to "mapped groups" of competitive funds and classes. Fidelity creates "mapped groups" by combining similar Lipper investment objective categories that have comparable investment mandates. Combining Lipper investment objective categories aids the Board's management fee and total expense ratio comparisons by broadening the competitive group used for comparison and by reducing the number of universes to which various Fidelity funds are compared.
Annual Report
Board Approval of Investment Advisory Contracts and
Management Fees - continued
Management Fee. The Board considered two proprietary management fee comparisons for the 12-month periods shown in the chart below. The group of Lipper funds used by the Board for management fee comparisons is referred to below as the "Total Mapped Group." The Total Mapped Group comparison focuses on a fund's standing in terms of gross management fees before expense reimbursements or caps, and without giving effect to the fund's performance adjustment, relative to the total universe of funds with comparable investment mandates, regardless of whether their management fee structures also are comparable. Funds with comparable investment mandates offer exposure to similar types of securities. Funds with comparable management fee structures have similar management fee contractual arrangements (e.g., flat rate charged for advisory services, all-inclusive fee rate, etc.). "TMG %" represents the percentage of funds in the Total Mapped Group that had management fees that were lower than the fund's. For example, a hypothetical TMG % of 20% would mean that 80% of the funds in the Total Mapped Group had higher, and 20% had lower, management fees than the fund. The fund's actual TMG %s are in the chart below. The "Asset-Size Peer Group" (ASPG) comparison focuses on a fund's standing relative to a subset of non-Fidelity funds within the Total Mapped Group that are similar in size and management fee structure. For example, if a fund is in the first quartile of the ASPG, the fund's management fee ranks in the least expensive or lowest 25% of funds in the ASPG. The ASPG represents at least 15% of the funds in the Total Mapped Group with comparable asset size and management fee structures, subject to a minimum of 50 funds (or all funds in the Total Mapped Group if fewer than 50). Additional information, such as the ASPG quartile in which the fund's management fee rate ranked and the impact of the fund's performance adjustment, is also included in the chart and considered by the Board.
Annual Report
Fidelity Dividend Growth Fund

The Board noted that the fund's management fee rate ranked below the median of its Total Mapped Group and below the median of its ASPG for 2013. The Board also noted the effect of the fund's negative performance adjustment on the fund's management fee ranking.
The Board also noted that, in August 2013, the ad hoc Committee on Management Fees was formed to conduct an in-depth review of the management fee rates of Fidelity's active equity mutual funds. The Committee focused on the following areas: (i) standard fee structures; (ii) research consumption and trading evolution; (iii) management fee competitiveness/profitability by category; and (iv) factors that drive institutional pricing.
Based on its review, the Board concluded that the fund's management fee is fair and reasonable in light of the services that the fund receives and the other factors considered.
Total Expense Ratio. In its review of each class's total expense ratio, the Board considered the fund's management fee as well as other fund or class expenses, as applicable, such as transfer agent fees, pricing and bookkeeping fees, and custodial, legal, and audit fees. The Board also noted the effects of any waivers and reimbursements on fees and expenses, as well as the impact of the fund's performance adjustment. As part of its review, the Board also considered the current and historical total expense ratios of each class of the fund compared to competitive fund median expenses. Each class of the fund is compared to those funds and classes in the Total Mapped Group (used by the Board for management fee comparisons) that have a similar sales load structure.
Annual Report
Board Approval of Investment Advisory Contracts and
Management Fees - continued
The Board noted that the total expense ratio of each class ranked below its competitive median for 2013.
Fees Charged to Other Fidelity Clients. The Board also considered Fidelity fee structures and other information with respect to clients of Fidelity, such as other funds advised or subadvised by Fidelity, pension plan clients, and other institutional clients. The Board noted the findings of the 2013 ad hoc joint committee (created with the board of other Fidelity funds), which reviewed and compared Fidelity's institutional investment advisory business with its business of providing services to the Fidelity funds, including the differences in services provided, fees charged, and costs incurred, as well as competition in their respective marketplaces.
Based on its review of total expense ratios and fees charged to other Fidelity clients, the Board concluded that the total expense ratio of each class of the fund was reasonable in light of the services that the fund and its shareholders receive and the other factors considered.
Costs of the Services and Profitability. The Board considered the revenues earned and the expenses incurred by Fidelity in conducting the business of developing, marketing, distributing, managing, administering and servicing the fund and servicing the fund's shareholders. The Board also considered the level of Fidelity's profits in respect of all the Fidelity funds.
On an annual basis, Fidelity presents to the Board Fidelity's profitability for the fund. Fidelity calculates the profitability for each fund, as well as aggregate profitability for groups of Fidelity funds and all Fidelity funds, using a series of detailed revenue and cost allocation methodologies which originate with the books and records of Fidelity on which Fidelity's audited financial statements are based. The Audit Committee of the Board reviews any significant changes from the prior year's methodologies.
PricewaterhouseCoopers LLP (PwC), independent registered public accounting firm and auditor to Fidelity and certain Fidelity funds, has been engaged annually by the Board as part of the Board's assessment of Fidelity's profitability analysis. PwC's engagement includes the review and assessment of the methodologies used by Fidelity in determining the revenues and expenses attributable to Fidelity's mutual fund business, and completion of agreed-upon procedures in respect of the mathematical accuracy of fund profitability and its conformity to established allocation methodologies. After considering PwC's reports issued under the engagement and information provided by Fidelity, the Board concluded that while other allocation methods may also be reasonable, Fidelity's profitability methodologies are reasonable in all material respects.
The Board also reviewed Fidelity's non-fund businesses and fall-out benefits related to the mutual fund business as well as cases where Fidelity's affiliates may benefit from or be related to the fund's business.
Annual Report
The Board considered the costs of the services provided by and the profits realized by Fidelity in connection with the operation of the fund and was satisfied that the profitability was not excessive in the circumstances.
Economies of Scale. The Board considered whether there have been economies of scale in respect of the management of the Fidelity funds, whether the Fidelity funds (including the fund) have appropriately benefited from any such economies of scale, and whether there is potential for realization of any further economies of scale. The Board considered the extent to which the fund will benefit from economies of scale through increased services to the fund, through waivers or reimbursements, or through fee or expense ratio reductions. The Board also noted that in 2013, it and the boards of other Fidelity funds created an ad hoc committee (the Economies of Scale Committee) to analyze whether Fidelity attains economies of scale in respect of the management and servicing of the Fidelity funds, whether the Fidelity funds have appropriately benefited from such economies of scale, and whether there is potential for realization of any further economies of scale.
The Board recognized that the fund's management contract incorporates a "group fee" structure, which provides for lower group fee rates as total group assets increase, and for higher group fee rates as total group assets decrease (with "group assets" defined to include fund assets under FMR's management plus sector fund assets previously under FMR's management and currently managed by Fidelity SelectCo, LLC).
FMR calculates the group fee rates based on a tiered asset "breakpoint" schedule that varies based on asset class. The Board considered that the group fee is designed to deliver the benefits of economies of scale to fund shareholders when total Fidelity fund assets increase, even if assets of any particular fund are unchanged or have declined, because some portion of Fidelity's costs are attributable to services provided to all Fidelity funds, and all funds benefit if those costs can be allocated among more assets. The Board concluded that, given the group fee structure, fund shareholders will benefit from lower management fees as group assets increase at the fund complex level, regardless of whether Fidelity achieves any such economies of scale.
The Board concluded, taking into account the analysis of the Economies of Scale Committee, that economies of scale, if any, are being appropriately shared between fund shareholders and Fidelity.
Additional Information Requested by the Board. In order to develop fully the factual basis for consideration of the Fidelity funds' Advisory Contracts, the Board requested and received additional information on certain topics, including: (i) fund performance trends and Fidelity's long-term strategies for certain funds; (ii) Fidelity's strategic marketing and product lineup goals; (iii) the methodology with respect to competitive fund data and peer group classifications; (iv) the arrangements with, and performance of, certain sub-advisers on behalf of the Fidelity funds, as well as certain proposed participating affiliate arrangements; (v) the realization of fall-out benefits in certain Fidelity business units; (vi) Fidelity's group fee structures, including the rationale for the individual fee rates of certain categories of funds and the definition of group assets; (vii) trends regarding industry use of performance fee structures and the performance adjustment methodologies applicable to the Fidelity funds; (viii) additional competitive analysis regarding the total expenses for certain classes; (ix) fund profitability methodology, including Fidelity's cost allocation methodology, and the impact of certain factors on fund profitability results; and (x) the process by which Fidelity determines sub-advisory fees for funds it advises.
Annual Report
Board Approval of Investment Advisory Contracts and
Management Fees - continued
Based on its evaluation of all of the conclusions noted above, and after considering all factors it believed relevant, the Board ultimately concluded that the advisory fee structures are fair and reasonable, and that the fund's Advisory Contracts should be renewed.
Annual Report
Investment Adviser
Fidelity Management & Research Company
Boston, MA
Investment Sub-Advisers
FMR Co., Inc.
Fidelity Management & Research
(U.K.) Inc.
Fidelity Management & Research
(Hong Kong) Limited
Fidelity Management & Research
(Japan) Inc.
General Distributor
Fidelity Distributors Corporation
Smithfield, RI
Transfer and Service Agents
Fidelity Investments Institutional
Operations Company, Inc.
Boston, MA
Fidelity Service Company, Inc.
Boston, MA
Custodian
Citibank, N.A.,
New York, NY
(Fidelity Investment logo)(registered trademark)
Corporate Headquarters
245 Summer St., Boston, MA 02210
www.fidelity.com
DGF-K-UANN-0914
1.863064.105
Fidelity®
Growth & Income
Portfolio
Annual Report
July 31, 2014
(Fidelity Cover Art)
Contents
Performance | (Click Here) | How the fund has done over time. |
Management's Discussion of Fund Performance | (Click Here) | The Portfolio Manager's review of fund performance and strategy. |
Shareholder Expense Example | (Click Here) | An example of shareholder expenses. |
Investment Changes | (Click Here) | A summary of major shifts in the fund's investments over the past six months. |
Investments | (Click Here) | A complete list of the fund's investments with their market values. |
Financial Statements | (Click Here) | Statements of assets and liabilities, operations, and changes in net assets, as well as financial highlights. |
Notes | (Click Here) | Notes to the financial statements. |
Report of Independent Registered Public Accounting Firm | (Click Here) | |
Trustees and Officers | (Click Here) | |
Distributions | (Click Here) | |
Board Approval of Investment Advisory Contracts and Management Fees | (Click Here) | |
To view a fund's proxy voting guidelines and proxy voting record for the 12-month period ended June 30, visit http://www.fidelity.com/proxyvotingresults or visit the Securities and Exchange Commission's (SEC) web site at http://www.sec.gov. You may also call 1-800-544-8544 to request a free copy of the proxy voting guidelines.
Standard & Poor's, S&P and S&P 500 are registered service marks of The McGraw-Hill Companies, Inc. and have been licensed for use by Fidelity Distributors Corporation.
Other third-party marks appearing herein are the property of their respective owners.
All other marks appearing herein are registered or unregistered trademarks or service marks of FMR LLC or an affiliated company. © 2014 FMR LLC. All rights reserved.
Annual Report
This report and the financial statements contained herein are submitted for the general information of the shareholders of the fund. This report is not authorized for distribution to prospective investors in the fund unless preceded or accompanied by an effective prospectus.
A fund files its complete schedule of portfolio holdings with the SEC for the first and third quarters of each fiscal year on Form N-Q. Forms N-Q are available on the SEC's web site at http://www.sec.gov. A fund's Forms N-Q may be reviewed and copied at the SEC's Public Reference Room in Washington, DC. Information regarding the operation of the SEC's Public Reference Room may be obtained by calling 1-800-SEC-0330. For a complete list of a fund's portfolio holdings, view the most recent holdings listing, semiannual report, or annual report on Fidelity's web site at http://www.fidelity.com, http://www.advisor.fidelity.com, or http://www.401k.com, as applicable.
NOT FDIC INSURED • MAY LOSE VALUE • NO BANK GUARANTEE
Neither the fund nor Fidelity Distributors Corporation is a bank.
Annual Report
Average annual total return reflects the change in the value of an investment, assuming reinvestment of the class' distributions from dividend income and capital gains (the profits earned upon the sale of securities that have grown in value, if any) and assuming a constant rate of performance each year. The $10,000 table and the fund's returns do not reflect the deduction of taxes that a shareholder would pay on fund distributions or the redemption of fund shares. During periods of reimbursement by Fidelity, a fund's total return will be greater than it would be had the reimbursement not occurred. How a fund did yesterday is no guarantee of how it will do tomorrow.
Average Annual Total Returns
Periods ended July 31, 2014 | Past 1
year | Past 5
years | Past 10
years |
Fidelity® Growth & Income Portfolio | 15.16% | 16.81% | 3.96% |
$10,000 Over 10 Years
Let's say hypothetically that $10,000 was invested in Fidelity® Growth & Income Portfolio, a class of the fund, on July 31, 2004. The chart shows how the value of your investment would have changed, and also shows how the S&P 500® Index performed over the same period.
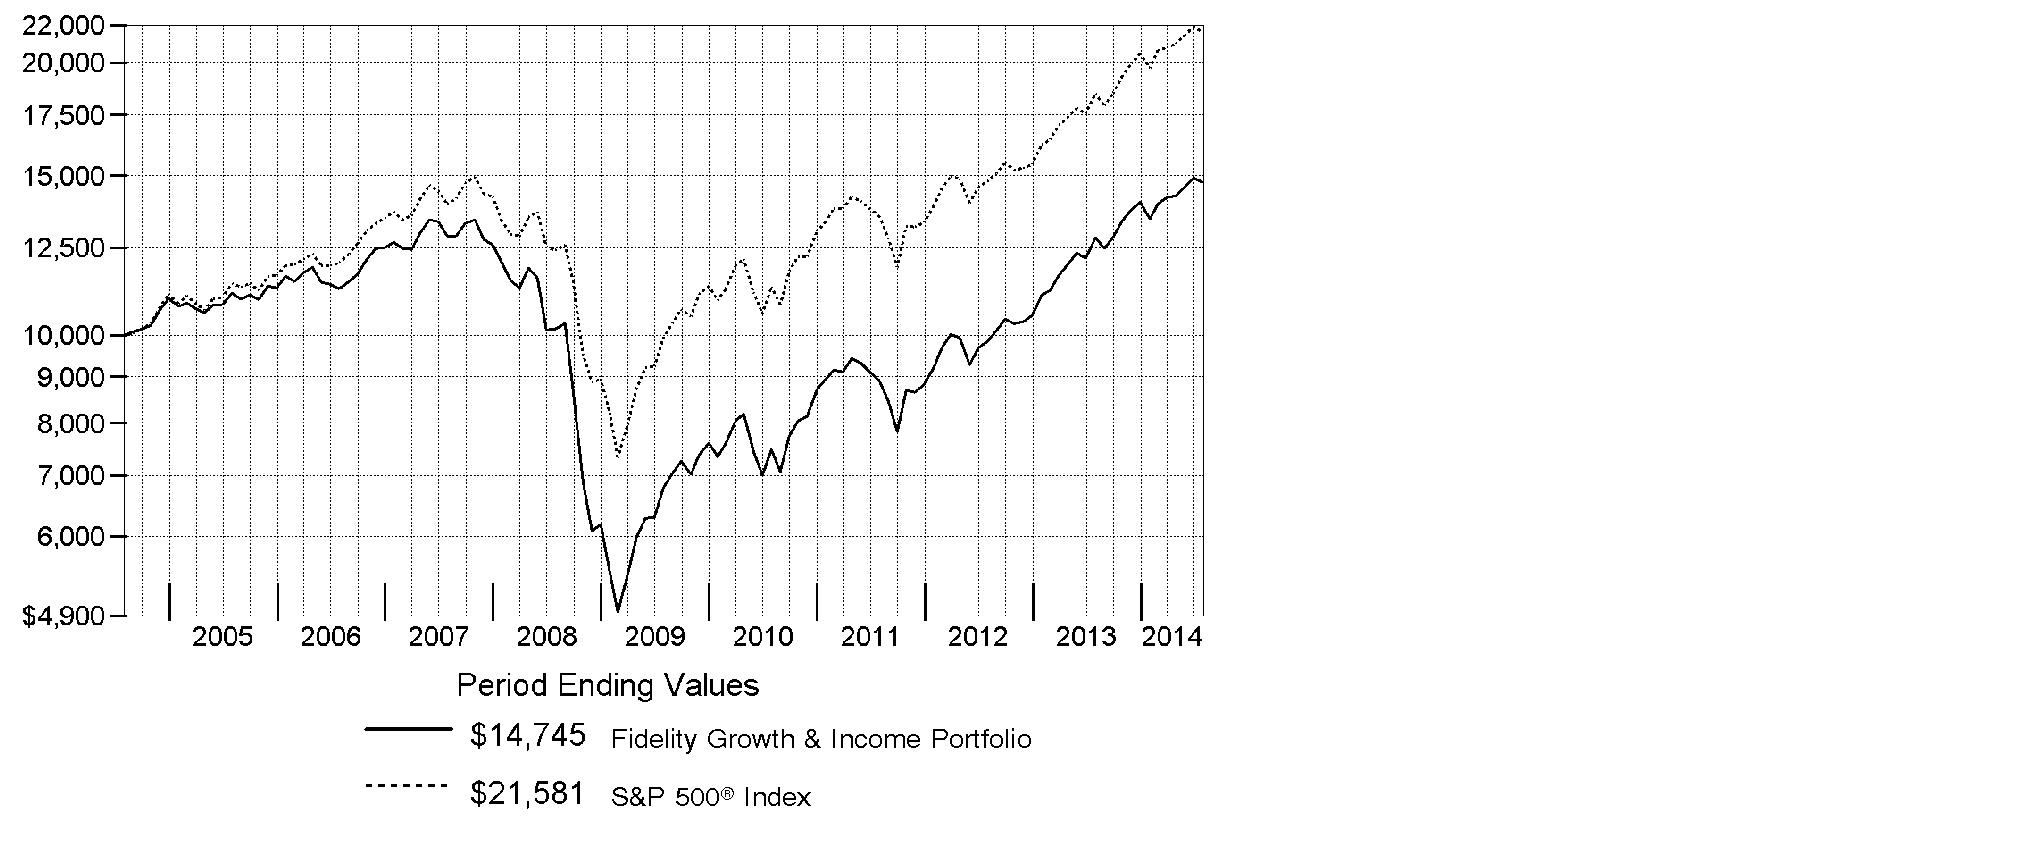
Annual Report
Market Recap: U.S. stocks overcame a slowing economy early in 2014 to post a strong gain for the 12-month period ending July 31, 2014, supported by corporate profits and continued low interest rates. The S&P 500® Index rose 16.94%, reaching an all-time high near period end. The technology-heavy Nasdaq Composite Index® gained 22.00%. The Russell 2000® Index returned 8.56%, reflecting the relatively lackluster performance of small-cap stocks. Information technology (+28%) was the top-performing sector within the S&P 500®, driven by strong semiconductor and computer hardware sales. Materials (+23%) gained amid higher prices for many commodity products. Health care (+21%) rose, driven by gains in pharmaceuticals, biotechnology & life sciences companies. Energy stocks (+19%) advanced in the latter part of the period amid healthy U.S. output and the threat of supply disruptions in Iraq. Conversely, most defensive sectors, including consumer staples, utilities and telecommunication services, lagged the broader market. Volatility remained tame throughout most of the period, with markets supported by declining unemployment, near-record profit margins for companies, muted cost inflation and fairly low corporate debt levels. Geopolitical tension remained a concern at period end, with conflict in Ukraine and strained relations between Russia and the West posing a potential threat to global growth.
Comments from Matthew Fruhan, Portfolio Manager of Fidelity® Growth & Income Fund: For the year, the fund's Retail Class shares returned 15.16%, underperforming the S&P 500®. Relative to the index, it hurt the most to overweight big-box retailer Target, which was among the fund's biggest holdings. The lingering effects of the firm's troubled expansion into Canada and a holiday-season credit breach continued to weigh on the stock, but this weak stretch allowed me to add to it at an attractive valuation. My picks in industrials and consumer discretionary also were weak. We had some financials stocks place among our biggest individual detractors, including investment banks Citigroup and JPMorgan Chase, both of which were among the fund's biggest holdings. Conversely, stock selection in consumer staples helped the most, especially drugstore chain Walgreen, while an overweight in tobacco stocks benefited the fund. Lorillard was a top relative contributor here. Picks in energy also added value, most notably an overweight in the outperforming shares of natural gas pipeline firm Williams Companies.
The views expressed above reflect those of the portfolio manager(s) only through the end of the period as stated on the cover of this report and do not necessarily represent the views of Fidelity or any other person in the Fidelity organization. Any such views are subject to change at any time based upon market or other conditions and Fidelity disclaims any responsibility to update such views. These views may not be relied on as investment advice and, because investment decisions for a Fidelity fund are based on numerous factors, may not be relied on as an indication of trading intent on behalf of any Fidelity fund.
Annual Report
Shareholder Expense Example
As a shareholder of the Fund, you incur two types of costs: (1) transaction costs and (2) ongoing costs, including management fees and other Fund expenses. This Example is intended to help you understand your ongoing costs (in dollars) of investing in the Fund and to compare these costs with the ongoing costs of investing in other mutual funds.
The Example is based on an investment of $1,000 invested at the beginning of the period and held for the entire period (February 1, 2014 to July 31, 2014).
Actual Expenses
The first line of the accompanying table for each class of the Fund provides information about actual account values and actual expenses. You may use the information in this line, together with the amount you invested, to estimate the expenses that you paid over the period. Simply divide your account value by $1,000.00 (for example, an $8,600 account value divided by $1,000.00 = 8.6), then multiply the result by the number in the first line for a class of the Fund under the heading entitled "Expenses Paid During Period" to estimate the expenses you paid on your account during this period. A small balance maintenance fee of $12.00 that is charged once a year may apply for certain accounts with a value of less than $2,000. This fee is not included in the table below. If it was, the estimate of expenses you paid during the period would be higher, and your ending account value lower, by this amount. In addition, the Fund, as a shareholder in the underlying Fidelity Central Funds, will indirectly bear its pro-rata share of the fees and expenses incurred by the underlying Fidelity Central Funds. These fees and expenses are not included in the Fund's annualized expense ratio used to calculate the expense estimate in the table below.
Hypothetical Example for Comparison Purposes
The second line of the accompanying table for each class of the Fund provides information about hypothetical account values and hypothetical expenses based on a Class' actual expense ratio and an assumed rate of return of 5% per year before expenses, which is not the Class' actual return. The hypothetical account values and expenses may not be used to estimate the actual ending account balance or expenses you paid for the period. You may use this information to compare the ongoing costs of investing in the Fund and other funds. To do so, compare this 5% hypothetical example with the 5% hypothetical examples that appear in the shareholder reports of the other funds. A small balance maintenance fee of $12.00 that is charged once a year may apply for certain accounts with a value of less than $2,000. This fee is not included in the table below. If it was, the estimate of expenses you paid during the period would be higher, and your ending account value lower, by this amount. In addition, the Fund, as a shareholder in the underlying Fidelity Central Funds, will indirectly bear its pro-rata share of the fees and expenses incurred by the underlying Fidelity Central Funds. These fees and expenses are not included in the Fund's annualized expense ratio used to calculate the expense estimate in the table below.
Please note that the expenses shown in the table are meant to highlight your ongoing costs only and do not reflect any transaction costs. Therefore, the second line of the table is useful in comparing ongoing costs only, and will not help you determine the relative total costs of owning different funds.
Annual Report
Shareholder Expense Example - continued
| Annualized
Expense Ratio B | Beginning
Account Value
February 1, 2014 | Ending
Account Value
July 31, 2014 | Expenses Paid
During Period*
February 1, 2014
to July 31, 2014 |
Growth and Income | .64% | | | |
Actual | | $ 1,000.00 | $ 1,098.10 | $ 3.33 |
Hypothetical A | | $ 1,000.00 | $ 1,021.62 | $ 3.21 |
Class K | .52% | | | |
Actual | | $ 1,000.00 | $ 1,098.80 | $ 2.71 |
Hypothetical A | | $ 1,000.00 | $ 1,022.22 | $ 2.61 |
A 5% return per year before expenses
B Annualized expense ratio reflects expenses net of applicable fee waivers.
* Expenses are equal to each Class' annualized expense ratio, multiplied by the average account value over the period, multiplied by 181/365 (to reflect the one-half year period).
Annual Report
Investment Changes (Unaudited)
Top Ten Stocks as of July 31, 2014 |
| % of fund's
net assets | % of fund's net assets
6 months ago |
JPMorgan Chase & Co. | 4.0 | 3.8 |
Apple, Inc. | 3.9 | 3.5 |
Microsoft Corp. | 3.2 | 3.0 |
General Electric Co. | 3.0 | 3.0 |
Chevron Corp. | 2.8 | 2.5 |
Citigroup, Inc. | 2.2 | 2.1 |
Verizon Communications, Inc. | 2.1 | 1.4 |
Target Corp. | 2.0 | 1.8 |
Comcast Corp. Class A | 2.0 | 1.9 |
Procter & Gamble Co. | 1.8 | 1.9 |
| 27.0 | |
Top Five Market Sectors as of July 31, 2014 |
| % of fund's
net assets | % of fund's net assets
6 months ago |
Information Technology | 19.9 | 19.6 |
Financials | 19.6 | 19.3 |
Consumer Staples | 11.9 | 12.3 |
Industrials | 11.5 | 11.2 |
Energy | 10.9 | 11.4 |
Asset Allocation (% of fund's net assets) |
As of July 31, 2014* | As of January 31, 2014** |
 | Stocks 98.8% | | | Stocks 98.9% | |
 | Convertible
Securities 1.0% | | | Convertible
Securities 1.1% | |
 | Other Investments 0.0% | |  | Other Investments 0.1% | |
| Short-Term
Investments and
Net Other Assets (Liabilities) 0.2% | |  | Short-Term
Investments and
Net Other Assets (Liabilities) (0.1)%† | |
* Foreign investments | 12.9% | | ** Foreign investments | 13.0% | |

† Short-Term Investments and Net Other Assets (Liabilities) are not included in the pie chart.
Annual Report
Investments July 31, 2014
Showing Percentage of Net Assets
Common Stocks - 98.8% |
| Shares | | Value (000s) |
CONSUMER DISCRETIONARY - 10.3% |
Automobiles - 0.1% |
General Motors Co. | 159,300 | | $ 5,388 |
Diversified Consumer Services - 0.4% |
H&R Block, Inc. | 816,207 | | 26,225 |
Hotels, Restaurants & Leisure - 1.7% |
Darden Restaurants, Inc. | 606,500 | | 28,354 |
Domino's Pizza, Inc. | 62,500 | | 4,500 |
McDonald's Corp. | 413,061 | | 39,059 |
Yum! Brands, Inc. | 814,244 | | 56,509 |
| | 128,422 |
Household Durables - 0.1% |
Tupperware Brands Corp. | 153,700 | | 11,186 |
Media - 3.9% |
Comcast Corp. Class A | 2,739,400 | | 147,188 |
Lamar Advertising Co. Class A | 125,900 | | 6,314 |
Scripps Networks Interactive, Inc. Class A | 97,689 | | 8,051 |
Sinclair Broadcast Group, Inc. Class A (e) | 902,261 | | 29,152 |
Time Warner, Inc. | 1,093,217 | | 90,759 |
Viacom, Inc. Class B (non-vtg.) | 117,000 | | 9,672 |
| | 291,136 |
Multiline Retail - 2.0% |
Target Corp. | 2,582,025 | | 153,863 |
Specialty Retail - 2.0% |
DSW, Inc. Class A | 457,900 | | 12,176 |
Lewis Group Ltd. | 461,269 | | 2,732 |
Lowe's Companies, Inc. | 2,134,479 | | 102,135 |
Sally Beauty Holdings, Inc. (a) | 365,600 | | 9,487 |
Staples, Inc. | 609,840 | | 7,068 |
TJX Companies, Inc. | 252,000 | | 13,429 |
| | 147,027 |
Textiles, Apparel & Luxury Goods - 0.1% |
adidas AG | 88,800 | | 7,064 |
TOTAL CONSUMER DISCRETIONARY | | 770,311 |
CONSUMER STAPLES - 11.9% |
Beverages - 3.5% |
Diageo PLC | 786,029 | | 23,606 |
Molson Coors Brewing Co. Class B | 294,212 | | 19,868 |
PepsiCo, Inc. | 712,014 | | 62,728 |
Common Stocks - continued |
| Shares | | Value (000s) |
CONSUMER STAPLES - continued |
Beverages - continued |
Pernod Ricard SA | 63,200 | | $ 7,083 |
SABMiller PLC | 555,948 | | 30,392 |
The Coca-Cola Co. | 2,964,403 | | 116,471 |
| | 260,148 |
Food & Staples Retailing - 1.5% |
CVS Caremark Corp. | 592,104 | | 45,213 |
Kroger Co. | 476,771 | | 23,352 |
Walgreen Co. | 693,484 | | 47,691 |
| | 116,256 |
Food Products - 0.4% |
Kellogg Co. | 543,354 | | 32,509 |
Household Products - 1.9% |
Procter & Gamble Co. | 1,709,215 | | 132,157 |
Svenska Cellulosa AB (SCA) (B Shares) | 378,091 | | 9,345 |
| | 141,502 |
Tobacco - 4.6% |
British American Tobacco PLC sponsored ADR | 1,075,923 | | 126,313 |
Lorillard, Inc. | 1,651,897 | | 99,907 |
Philip Morris International, Inc. | 942,771 | | 77,317 |
Reynolds American, Inc. | 743,000 | | 41,497 |
| | 345,034 |
TOTAL CONSUMER STAPLES | | 895,449 |
ENERGY - 10.7% |
Energy Equipment & Services - 1.0% |
Ensco PLC Class A | 479,623 | | 24,293 |
National Oilwell Varco, Inc. | 48,200 | | 3,906 |
Oceaneering International, Inc. | 129,200 | | 8,774 |
Schlumberger Ltd. | 345,032 | | 37,398 |
| | 74,371 |
Oil, Gas & Consumable Fuels - 9.7% |
Access Midstream Partners LP | 193,533 | | 11,655 |
Apache Corp. | 577,268 | | 59,262 |
BG Group PLC | 3,318,464 | | 65,438 |
Canadian Natural Resources Ltd. | 820,700 | | 35,776 |
Chevron Corp. | 1,603,396 | | 207,223 |
EQT Midstream Partners LP | 76,600 | | 6,629 |
EV Energy Partners LP | 67,900 | | 2,489 |
Common Stocks - continued |
| Shares | | Value (000s) |
ENERGY - continued |
Oil, Gas & Consumable Fuels - continued |
Exxon Mobil Corp. | 190,011 | | $ 18,800 |
Golar LNG Ltd. | 185,400 | | 11,422 |
Imperial Oil Ltd. | 788,100 | | 40,440 |
Magellan Midstream Partners LP | 7,221 | | 579 |
Markwest Energy Partners LP | 873,982 | | 61,004 |
MPLX LP | 81,109 | | 4,603 |
Occidental Petroleum Corp. | 467,216 | | 45,652 |
Peabody Energy Corp. | 428,600 | | 6,502 |
PrairieSky Royalty Ltd. | 30,100 | | 1,088 |
Suncor Energy, Inc. | 1,817,150 | | 74,613 |
The Williams Companies, Inc. | 1,229,572 | | 69,631 |
Western Gas Partners LP | 100,800 | | 7,470 |
| | 730,276 |
TOTAL ENERGY | | 804,647 |
FINANCIALS - 19.6% |
Banks - 11.5% |
Bank of America Corp. | 8,004,656 | | 122,071 |
Citigroup, Inc. | 3,341,430 | | 163,429 |
JPMorgan Chase & Co. | 5,232,492 | | 301,750 |
M&T Bank Corp. | 95,560 | | 11,611 |
PNC Financial Services Group, Inc. | 590,154 | | 48,723 |
Standard Chartered PLC (United Kingdom) | 3,334,159 | | 69,350 |
SunTrust Banks, Inc. | 576,066 | | 21,919 |
U.S. Bancorp | 1,300,973 | | 54,680 |
Wells Fargo & Co. | 1,383,141 | | 70,402 |
| | 863,935 |
Capital Markets - 4.8% |
Apollo Investment Corp. | 426,403 | | 3,620 |
Ares Capital Corp. | 318,300 | | 5,319 |
Artisan Partners Asset Management, Inc. | 156,100 | | 8,133 |
BlackRock, Inc. Class A | 25,500 | | 7,771 |
Carlyle Group LP | 232,900 | | 7,774 |
Charles Schwab Corp. | 2,434,743 | | 67,564 |
Invesco Ltd. | 167,200 | | 6,292 |
KKR & Co. LP | 2,044,543 | | 46,861 |
Morgan Stanley | 1,617,397 | | 52,307 |
Northern Trust Corp. | 750,964 | | 50,232 |
Common Stocks - continued |
| Shares | | Value (000s) |
FINANCIALS - continued |
Capital Markets - continued |
State Street Corp. | 1,275,227 | | $ 89,827 |
The Blackstone Group LP | 447,700 | | 14,631 |
| | 360,331 |
Diversified Financial Services - 0.7% |
IntercontinentalExchange Group, Inc. | 164,217 | | 31,566 |
TPG Specialty Lending, Inc. (e) | 944,400 | | 18,293 |
| | 49,859 |
Insurance - 1.6% |
Arthur J. Gallagher & Co. | 252,600 | | 11,367 |
Brown & Brown, Inc. | 123,600 | | 3,804 |
Marsh & McLennan Companies, Inc. | 350,646 | | 17,802 |
MetLife, Inc. | 1,295,689 | | 68,153 |
MetLife, Inc. unit | 301,200 | | 9,111 |
Ping An Insurance (Group) Co. of China Ltd. (H Shares) | 64,000 | | 544 |
Principal Financial Group, Inc. | 201,200 | | 9,996 |
| | 120,777 |
Real Estate Investment Trusts - 0.8% |
American Homes 4 Rent (f) | 258,675 | | 4,713 |
CBL & Associates Properties, Inc. | 996,509 | | 18,635 |
First Potomac Realty Trust | 193,418 | | 2,551 |
Gaming & Leisure Properties | 101,300 | | 3,411 |
Sun Communities, Inc. | 586,614 | | 30,873 |
| | 60,183 |
Thrifts & Mortgage Finance - 0.2% |
Radian Group, Inc. | 1,140,368 | | 14,437 |
TOTAL FINANCIALS | | 1,469,522 |
HEALTH CARE - 9.3% |
Biotechnology - 1.3% |
Amgen, Inc. | 709,903 | | 90,435 |
Intercept Pharmaceuticals, Inc. (a) | 19,026 | | 4,421 |
| | 94,856 |
Health Care Equipment & Supplies - 1.1% |
Abbott Laboratories | 496,504 | | 20,913 |
Ansell Ltd. | 266,311 | | 4,675 |
ResMed, Inc. (e) | 265,167 | | 13,720 |
Steris Corp. | 31,135 | | 1,584 |
Common Stocks - continued |
| Shares | | Value (000s) |
HEALTH CARE - continued |
Health Care Equipment & Supplies - continued |
Stryker Corp. | 271,842 | | $ 21,685 |
Zimmer Holdings, Inc. | 179,510 | | 17,964 |
| | 80,541 |
Health Care Providers & Services - 1.7% |
Cardinal Health, Inc. | 282,300 | | 20,227 |
Fresenius Medical Care AG & Co. KGaA | 117,800 | | 8,166 |
McKesson Corp. | 317,887 | | 60,990 |
Patterson Companies, Inc. | 403,970 | | 15,759 |
Quest Diagnostics, Inc. | 420,384 | | 25,685 |
| | 130,827 |
Health Care Technology - 0.0% |
Quality Systems, Inc. | 49,491 | | 768 |
Pharmaceuticals - 5.2% |
AbbVie, Inc. | 688,401 | | 36,031 |
Astellas Pharma, Inc. | 1,082,900 | | 14,685 |
GlaxoSmithKline PLC sponsored ADR | 1,508,322 | | 72,958 |
Johnson & Johnson | 1,061,069 | | 106,202 |
Merck & Co., Inc. | 522,038 | | 29,620 |
Novartis AG sponsored ADR | 487,044 | | 42,344 |
Sanofi SA | 199,144 | | 20,908 |
Teva Pharmaceutical Industries Ltd. sponsored ADR | 1,060,120 | | 56,716 |
Zoetis, Inc. Class A | 294,300 | | 9,685 |
| | 389,149 |
TOTAL HEALTH CARE | | 696,141 |
INDUSTRIALS - 11.5% |
Aerospace & Defense - 2.0% |
Meggitt PLC | 2,408,100 | | 20,674 |
Rolls-Royce Group PLC | 889,900 | | 15,625 |
The Boeing Co. | 593,189 | | 71,467 |
United Technologies Corp. | 390,282 | | 41,038 |
| | 148,804 |
Air Freight & Logistics - 1.8% |
C.H. Robinson Worldwide, Inc. | 415,973 | | 28,062 |
PostNL NV (a) | 2,367,500 | | 11,853 |
United Parcel Service, Inc. Class B | 968,004 | | 93,984 |
| | 133,899 |
Common Stocks - continued |
| Shares | | Value (000s) |
INDUSTRIALS - continued |
Airlines - 0.1% |
Copa Holdings SA Class A | 21,600 | | $ 3,280 |
Commercial Services & Supplies - 0.6% |
ADT Corp. (e) | 804,210 | | 27,987 |
KAR Auction Services, Inc. | 520,300 | | 15,250 |
Ritchie Brothers Auctioneers, Inc. | 21,840 | | 529 |
| | 43,766 |
Electrical Equipment - 0.4% |
General Cable Corp. | 144,858 | | 3,220 |
Hubbell, Inc. Class B | 209,139 | | 24,457 |
| | 27,677 |
Industrial Conglomerates - 3.0% |
General Electric Co. | 9,043,780 | | 227,451 |
Machinery - 0.2% |
Deere & Co. | 135,800 | | 11,558 |
Stanley Black & Decker, Inc. | 33,000 | | 2,886 |
Valmont Industries, Inc. | 15,200 | | 2,214 |
| | 16,658 |
Professional Services - 0.4% |
Acacia Research Corp. | 514,902 | | 8,784 |
Bureau Veritas SA | 828,877 | | 21,366 |
Exova Group Ltd. PLC (a) | 774,000 | | 3,019 |
| | 33,169 |
Road & Rail - 2.3% |
CSX Corp. | 2,458,920 | | 73,571 |
J.B. Hunt Transport Services, Inc. | 584,445 | | 45,154 |
Kansas City Southern | 80,100 | | 8,736 |
Norfolk Southern Corp. | 350,899 | | 35,672 |
TransForce, Inc. | 490,400 | | 12,400 |
| | 175,533 |
Trading Companies & Distributors - 0.7% |
Beijer Ref AB Series B | 30,255 | | 640 |
Brenntag AG | 18,100 | | 2,914 |
W.W. Grainger, Inc. | 104,707 | | 24,622 |
Watsco, Inc. | 270,892 | | 24,264 |
| | 52,440 |
TOTAL INDUSTRIALS | | 862,677 |
Common Stocks - continued |
| Shares | | Value (000s) |
INFORMATION TECHNOLOGY - 19.9% |
Communications Equipment - 2.4% |
Cisco Systems, Inc. | 4,721,552 | | $ 119,125 |
QUALCOMM, Inc. | 862,846 | | 63,592 |
| | 182,717 |
Internet Software & Services - 3.0% |
Google, Inc.: | | | |
Class A (a) | 171,507 | | 99,397 |
Class C (a) | 152,207 | | 87,002 |
Yahoo!, Inc. (a) | 1,065,395 | | 38,152 |
| | 224,551 |
IT Services - 4.9% |
Amadeus IT Holding SA Class A | 34,000 | | 1,343 |
Cognizant Technology Solutions Corp. Class A (a) | 648,572 | | 31,812 |
Computer Sciences Corp. | 510,906 | | 31,875 |
Fidelity National Information Services, Inc. | 375,436 | | 21,175 |
IBM Corp. | 209,704 | | 40,194 |
MasterCard, Inc. Class A | 892,600 | | 66,186 |
Paychex, Inc. | 2,152,757 | | 88,285 |
Quindell PLC | 1,310,646 | | 4,536 |
The Western Union Co. | 984,180 | | 17,194 |
Visa, Inc. Class A | 334,371 | | 70,556 |
| | 373,156 |
Semiconductors & Semiconductor Equipment - 1.6% |
Applied Materials, Inc. | 2,195,949 | | 46,027 |
Broadcom Corp. Class A | 1,632,982 | | 62,478 |
Maxim Integrated Products, Inc. | 365,453 | | 10,711 |
| | 119,216 |
Software - 3.4% |
Microsoft Corp. | 5,576,199 | | 240,669 |
Oracle Corp. | 320,453 | | 12,943 |
| | 253,612 |
Technology Hardware, Storage & Peripherals - 4.6% |
Apple, Inc. | 3,071,194 | | 293,514 |
EMC Corp. | 1,015,891 | | 29,766 |
First Data Holdings, Inc. Class B (h) | 5,155,476 | | 20,622 |
| | 343,902 |
TOTAL INFORMATION TECHNOLOGY | | 1,497,154 |
Common Stocks - continued |
| Shares | | Value (000s) |
MATERIALS - 3.5% |
Chemicals - 3.0% |
Airgas, Inc. | 391,706 | | $ 41,881 |
E.I. du Pont de Nemours & Co. | 370,246 | | 23,811 |
FMC Corp. | 331,382 | | 21,613 |
Johnson Matthey PLC | 142,295 | | 7,109 |
Methanex Corp. | 123,800 | | 8,057 |
Monsanto Co. | 564,015 | | 63,784 |
Potash Corp. of Saskatchewan, Inc. | 178,900 | | 6,351 |
Royal DSM NV | 186,700 | | 12,920 |
Syngenta AG (Switzerland) | 88,908 | | 31,496 |
Tronox Ltd. Class A | 221,600 | | 5,881 |
Westlake Chem Partners LP (a) | 14,200 | | 431 |
| | 223,334 |
Metals & Mining - 0.5% |
Freeport-McMoRan Copper & Gold, Inc. | 1,037,600 | | 38,619 |
SunCoke Energy Partners LP | 104,383 | | 3,282 |
| | 41,901 |
TOTAL MATERIALS | | 265,235 |
TELECOMMUNICATION SERVICES - 2.1% |
Diversified Telecommunication Services - 2.1% |
Verizon Communications, Inc. | 3,093,474 | | 155,973 |
TOTAL COMMON STOCKS (Cost $5,970,352) |
7,417,109
|
Convertible Preferred Stocks - 0.8% |
| | | |
CONSUMER DISCRETIONARY - 0.0% |
Leisure Products - 0.0% |
NJOY, Inc. Series D (h) | 68,794 | | 1,164 |
HEALTH CARE - 0.8% |
Health Care Equipment & Supplies - 0.8% |
Alere, Inc. 3.00% | 185,143 | | 61,629 |
TOTAL CONVERTIBLE PREFERRED STOCKS (Cost $46,947) |
62,793
|
Convertible Bonds - 0.2% |
| Principal
Amount (000s) (d) | | Value (000s) |
ENERGY - 0.2% |
Oil, Gas & Consumable Fuels - 0.2% |
Amyris, Inc.: | | | | |
3% 2/27/17 | | $ 5,615 | | $ 4,681 |
5% 10/15/18 (h) | | 2,870 | | 2,302 |
Peabody Energy Corp. 4.75% 12/15/41 | | 7,660 | | 5,477 |
TOTAL CONVERTIBLE BONDS (Cost $14,440) |
12,460
|
Preferred Securities - 0.0% |
|
FINANCIALS - 0.0% |
Diversified Financial Services - 0.0% |
Baggot Securities Ltd. 10.24% (f)(g) (Cost $4,623) | EUR | 3,010 | |
4,543
|
Money Market Funds - 0.6% |
| Shares | | |
Fidelity Cash Central Fund, 0.11% (b) | 7,094,792 | | 7,095 |
Fidelity Securities Lending Cash Central Fund, 0.11% (b)(c) | 37,662,951 | | 37,663 |
TOTAL MONEY MARKET FUNDS (Cost $44,758) |
44,758
|
TOTAL INVESTMENT PORTFOLIO - 100.4% (Cost $6,081,120) | | 7,541,663 |
NET OTHER ASSETS (LIABILITIES) - (0.4)% | | (31,988) |
NET ASSETS - 100% | $ 7,509,675 |
Currency Abbreviations |
EUR | - | European Monetary Unit |
Legend |
(a) Non-income producing |
(b) Affiliated fund that is generally available only to investment companies and other accounts managed by Fidelity Investments. The rate quoted is the annualized seven-day yield of the fund at period end. A complete unaudited listing of the fund's holdings as of its most recent quarter end is available upon request. In addition, each Fidelity Central Fund's financial statements, which are not covered by the Fund's Report of Independent Registered Public Accounting Firm, are available on the SEC's website or upon request. |
(c) Investment made with cash collateral received from securities on loan. |
(d) Amount is stated in United States dollars unless otherwise noted. |
(e) Security or a portion of the security is on loan at period end. |
(f) Security exempt from registration under Rule 144A of the Securities Act of 1933. These securities may be resold in transactions exempt from registration, normally to qualified institutional buyers. At the end of the period, the value of these securities amounted to $9,256,000 or 0.1% of net assets. |
(g) Security is perpetual in nature with no stated maturity date. |
(h) Restricted securities - Investment in securities not registered under the Securities Act of 1933 (excluding 144A issues). At the end of the period, the value of restricted securities (excluding 144A issues) amounted to $24,088,000 or 0.3% of net assets. |
Additional information on each restricted holding is as follows: |
Security | Acquisition Date | Acquisition Cost (000s) |
Amyris, Inc. 5% 10/15/18 | 10/16/13 | $ 2,870 |
First Data Holdings, Inc. Class B | 6/26/14 | $ 20,622 |
NJOY, Inc.
Series D | 2/14/14 | $ 1,164 |
Affiliated Central Funds |
Information regarding fiscal year to date income earned by the Fund from investments in Fidelity Central Funds is as follows: |
Fund | Income earned
(Amounts in thousands) |
Fidelity Cash Central Fund | $ 5 |
Fidelity Securities Lending Cash Central Fund | 628 |
Total | $ 633 |
Other Information |
The following is a summary of the inputs used, as of July 31, 2014, involving the Fund's assets and liabilities carried at fair value. The inputs or methodology used for valuing securities may not be an indication of the risk associated with investing in those securities. For more information on valuation inputs, and their aggregation into the levels used in the table below, please refer to the Investment Valuation section in the accompanying Notes to Financial Statements. |
Valuation Inputs at Reporting Date: |
Description
(Amounts in thousands) | Total | Level 1 | Level 2 | Level 3 |
Investments in Securities: | | | | |
Equities: | | | | |
Consumer Discretionary | $ 771,475 | $ 770,311 | $ - | $ 1,164 |
Consumer Staples | 895,449 | 871,843 | 23,606 | - |
Energy | 804,647 | 739,209 | 65,438 | - |
Financials | 1,469,522 | 1,459,867 | 9,655 | - |
Health Care | 757,770 | 709,336 | 48,434 | - |
Industrials | 862,677 | 862,677 | - | - |
Information Technology | 1,497,154 | 1,476,532 | - | 20,622 |
Materials | 265,235 | 233,739 | 31,496 | - |
Telecommunication Services | 155,973 | 155,973 | - | - |
Corporate Bonds | 12,460 | - | 12,460 | - |
Preferred Securities | 4,543 | - | 4,543 | - |
Money Market Funds | 44,758 | 44,758 | - | - |
Total Investments in Securities: | $ 7,541,663 | $ 7,324,245 | $ 195,632 | $ 21,786 |
Distribution of investments by country or territory of incorporation, as a percentage of total net assets, is as follows (Unaudited): |
United States of America | 87.1% |
United Kingdom | 6.2% |
Canada | 2.3% |
Switzerland | 1.0% |
Others (Individually Less Than 1%) | 3.4% |
| 100.0% |
See accompanying notes which are an integral part of the financial statements.
Annual Report
Statement of Assets and Liabilities
Amounts in thousands (except per-share amounts) | July 31, 2014 |
| | |
Assets | | |
Investment in securities, at value (including securities loaned of $36,724) - See accompanying schedule: Unaffiliated issuers (cost $6,036,362) | $ 7,496,905 | |
Fidelity Central Funds (cost $44,758) | 44,758 | |
Total Investments (cost $6,081,120) | | $ 7,541,663 |
Cash | | 71 |
Receivable for investments sold | | 38,097 |
Receivable for fund shares sold | | 2,826 |
Dividends receivable | | 9,448 |
Interest receivable | | 124 |
Distributions receivable from Fidelity Central Funds | | 36 |
Receivable from investment adviser for expense reductions | | 4 |
Other receivables | | 765 |
Total assets | | 7,593,034 |
| | |
Liabilities | | |
Payable for investments purchased | $ 35,586 | |
Payable for fund shares redeemed | 5,294 | |
Accrued management fee | 2,889 | |
Other affiliated payables | 1,086 | |
Other payables and accrued expenses | 841 | |
Collateral on securities loaned, at value | 37,663 | |
Total liabilities | | 83,359 |
| | |
Net Assets | | $ 7,509,675 |
Net Assets consist of: | | |
Paid in capital | | $ 9,474,595 |
Undistributed net investment income | | 3,054 |
Accumulated undistributed net realized gain (loss) on investments and foreign currency transactions | | (3,428,515) |
Net unrealized appreciation (depreciation) on investments and assets and liabilities in foreign currencies | | 1,460,541 |
Net Assets | | $ 7,509,675 |
See accompanying notes which are an integral part of the financial statements.
Annual Report
Financial Statements - continued
Statement of Assets and Liabilities - continued
Amounts in thousands (except per-share amounts) | July 31, 2014 |
| | |
Growth and Income:
Net Asset Value, offering price and redemption price per share ($6,550,090 ÷ 225,700 shares) | | $ 29.02 |
| | |
Class K:
Net Asset Value, offering price and redemption price per share ($959,585 ÷ 33,084 shares) | | $ 29.00 |
See accompanying notes which are an integral part of the financial statements.
Annual Report
Statement of Operations
Amounts in thousands | Year ended July 31, 2014 |
| | |
Investment Income | | |
Dividends | | $ 183,254 |
Interest | | 821 |
Income from Fidelity Central Funds | | 633 |
Total income | | 184,708 |
| | |
Expenses | | |
Management fee | $ 33,261 | |
Transfer agent fees | 11,471 | |
Accounting and security lending fees | 1,186 | |
Custodian fees and expenses | 231 | |
Independent trustees' compensation | 33 | |
Appreciation in deferred trustee compensation account | 2 | |
Registration fees | 105 | |
Audit | 92 | |
Legal | 42 | |
Interest | 13 | |
Miscellaneous | 58 | |
Total expenses before reductions | 46,494 | |
Expense reductions | (155) | 46,339 |
Net investment income (loss) | | 138,369 |
Realized and Unrealized Gain (Loss) Net realized gain (loss) on: | | |
Investment securities: | | |
Unaffiliated issuers (net of foreign taxes of $9) | 838,348 | |
Redemption in-kind with affiliated entities | 25,387 | |
Foreign currency transactions | (55) | |
Total net realized gain (loss) | | 863,680 |
Change in net unrealized appreciation (depreciation) on: Investment securities | 38,915 | |
Assets and liabilities in foreign currencies | (3) | |
Total change in net unrealized appreciation (depreciation) | | 38,912 |
Net gain (loss) | | 902,592 |
Net increase (decrease) in net assets resulting from operations | | $ 1,040,961 |
See accompanying notes which are an integral part of the financial statements.
Annual Report
Financial Statements - continued
Statement of Changes in Net Assets
Amounts in thousands | Year ended
July 31,
2014 | Year ended
July 31,
2013 |
Increase (Decrease) in Net Assets | | |
Operations | | |
Net investment income (loss) | $ 138,369 | $ 127,482 |
Net realized gain (loss) | 863,680 | 486,610 |
Change in net unrealized appreciation (depreciation) | 38,912 | 1,017,939 |
Net increase (decrease) in net assets resulting from operations | 1,040,961 | 1,632,031 |
Distributions to shareholders from net investment income | (133,552) | (120,664) |
Distributions to shareholders from net realized gain | (1,626) | (7,383) |
Total distributions | (135,178) | (128,047) |
Share transactions - net increase (decrease) | (472,170) | (42,531) |
Total increase (decrease) in net assets | 433,613 | 1,461,453 |
| | |
Net Assets | | |
Beginning of period | 7,076,062 | 5,614,609 |
End of period (including undistrubuted net investment income of $3,054 and undistributed net investment income of $4,966, respectively) | $ 7,509,675 | $ 7,076,062 |
See accompanying notes which are an integral part of the financial statements.
Annual Report
Financial Highlights - Growth and Income
Years ended July 31, | 2014 | 2013 | 2012 | 2011 | 2010 |
Selected Per-Share Data | | | | | |
Net asset value, beginning of period | $ 25.66 | $ 20.13 | $ 18.58 | $ 15.75 | $ 14.38 |
Income from Investment Operations | | | | | |
Net investment income (loss) B | .51 | .46 | .36 | .20 | .10 |
Net realized and unrealized gain (loss) | 3.35 | 5.54 | 1.55 | 2.82 | 1.37 |
Total from investment operations | 3.86 | 6.00 | 1.91 | 3.02 | 1.47 |
Distributions from net investment income | (.50) | (.44) | (.35) | (.19) | (.10) |
Distributions from net realized gain | (.01) | (.03) | (.01) | - | (.01) |
Total distributions | (.50) G | (.47) | (.36) | (.19) | (.10) F |
Net asset value, end of period | $ 29.02 | $ 25.66 | $ 20.13 | $ 18.58 | $ 15.75 |
Total Return A | 15.16% | 30.15% | 10.45% | 19.16% | 10.25% |
Ratios to Average Net Assets C, E | | | | | |
Expenses before reductions | .65% | .68% | .71% | .72% | .75% |
Expenses net of fee waivers, if any | .65% | .68% | .71% | .72% | .75% |
Expenses net of all reductions | .65% | .67% | .71% | .71% | .74% |
Net investment income (loss) | 1.86% | 2.04% | 1.95% | 1.09% | .63% |
Supplemental Data | | | | | |
Net assets, end of period (in millions) | $ 6,550 | $ 6,060 | $ 4,863 | $ 5,052 | $ 5,417 |
Portfolio turnover rate D | 41% H | 49% | 62% | 129% | 98% |
A Total returns would have been lower if certain expenses had not been reduced during the applicable periods shown.
B Calculated based on average shares outstanding during the period.
C Fees and expenses of any underlying Fidelity Central Funds are not included in the Fund's expense ratio. The Fund indirectly bears its proportionate share of the expenses of any underlying Fidelity Central Funds.
D Amount does not include the portfolio activity of any underlying Fidelity Central Funds.
E Expense ratios reflect operating expenses of the class. Expenses before reductions do not reflect amounts reimbursed by the investment adviser or reductions from brokerage service arrangements or reductions from other expense offset arrangements and do not represent the amount paid by the class during periods when reimbursements or reductions occur. Expenses net of fee waivers reflect expenses after reimbursement by the investment adviser but prior to reductions from brokerage service arrangements or other expense offset arrangements. Expenses net of all reductions represent the net expenses paid by the class.
F Total distributions of $.10 per share is comprised of distributions from net investment income of $.095 and distributions from net realized gain of $.008 per share.
G Total distributions of $.50 per share is comprised of distributions from net investment income of $.495 and distributions from net realized gain of $.006 per share.
H Portfolio turnover rate excludes securities received or delivered in-kind.
See accompanying notes which are an integral part of the financial statements.
Annual Report
Financial Highlights - Class K
Years ended July 31, | 2014 | 2013 | 2012 | 2011 | 2010 |
Selected Per-Share Data | | | | | |
Net asset value, beginning of period | $ 25.64 | $ 20.12 | $ 18.57 | $ 15.74 | $ 14.38 |
Income from Investment Operations | | | | | |
Net investment income (loss) B | .54 | .50 | .40 | .23 | .13 |
Net realized and unrealized gain (loss) | 3.36 | 5.52 | 1.54 | 2.82 | 1.37 |
Total from investment operations | 3.90 | 6.02 | 1.94 | 3.05 | 1.50 |
Distributions from net investment income | (.53) | (.47) | (.38) | (.22) | (.13) |
Distributions from net realized gain | (.01) | (.03) | (.01) | - | (.01) |
Total distributions | (.54) | (.50) | (.39) | (.22) | (.14) F |
Net asset value, end of period | $ 29.00 | $ 25.64 | $ 20.12 | $ 18.57 | $ 15.74 |
Total Return A | 15.32% | 30.28% | 10.66% | 19.40% | 10.41% |
Ratios to Average Net Assets C, E | | | | | |
Expenses before reductions | .52% | .53% | .54% | .54% | .54% |
Expenses net of fee waivers, if any | .52% | .53% | .54% | .54% | .54% |
Expenses net of all reductions | .52% | .52% | .54% | .53% | .53% |
Net investment income (loss) | 1.99% | 2.19% | 2.13% | 1.27% | .84% |
Supplemental Data | | | | | |
Net assets, end of period (in millions) | $ 960 | $ 1,016 | $ 752 | $ 403 | $ 292 |
Portfolio turnover rate D | 41% G | 49% | 62% | 129% | 98% |
A Total returns would have been lower if certain expenses had not been reduced during the applicable periods shown.
B Calculated based on average shares outstanding during the period.
C Fees and expenses of any underlying Fidelity Central Funds are not included in the Fund's expense ratio. The Fund indirectly bears its proportionate share of the expenses of any underlying Fidelity Central Funds.
D Amount does not include the portfolio activity of any underlying Fidelity Central Funds.
E Expense ratios reflect operating expenses of the class. Expenses before reductions do not reflect amounts reimbursed by the investment adviser or reductions from brokerage service arrangements or reductions from other expense offset arrangements and do not represent the amount paid by the class during periods when reimbursements or reductions occur. Expenses net of fee waivers reflect expenses after reimbursement by the investment adviser but prior to reductions from brokerage service arrangements or other expense offset arrangements. Expenses net of all reductions represent the net expenses paid by the class.
F Total distributions of $.14 per share is comprised of distributions from net investment income of $.129 and distributions from net realized gain of $.008 per share.
G Portfolio turnover rate excludes securities received or delivered in-kind.
See accompanying notes which are an integral part of the financial statements.
Annual Report
Notes to Financial Statements
For the period ended July 31, 2014
(Amounts in thousands except percentages)
1. Organization.
Fidelity Growth & Income Portfolio (the Fund) is a fund of Fidelity Securities Fund (the Trust) and is authorized to issue an unlimited number of shares. The Trust is registered under the Investment Company Act of 1940, as amended (the 1940 Act), as an open-end management investment company organized as a Massachusetts business trust. The Fund offers Growth & Income and Class K shares, each of which has equal rights as to assets and voting privileges. Each class has exclusive voting rights with respect to matters that affect that class.
2. Investments in Fidelity Central Funds.
The Fund invests in Fidelity Central Funds, which are open-end investment companies generally available only to other investment companies and accounts managed by the investment adviser and its affiliates. The Fund's Schedule of Investments lists each of the Fidelity Central Funds held as of period end, if any, as an investment of the Fund, but does not include the underlying holdings of each Fidelity Central Fund. As an Investing Fund, the Fund indirectly bears its proportionate share of the expenses of the underlying Fidelity Central Funds.
The Money Market Central Funds seek preservation of capital and current income and are managed by Fidelity Investments Money Management, Inc. (FIMM), an affiliate of the investment adviser. Annualized expenses of the Money Market Central Funds as of their most recent shareholder report date are less than .01%.
A complete unaudited list of holdings for each Fidelity Central Fund is available upon request or at the Securities and Exchange Commission (the SEC) website at www.sec.gov. In addition, the financial statements of the Fidelity Central Funds, which are not covered by the Fund's Report of Independent Registered Public Accounting Firm, are available on the SEC website or upon request.
3. Significant Accounting Policies.
The financial statements have been prepared in conformity with accounting principles generally accepted in the United States of America (GAAP), which require management to make certain estimates and assumptions at the date of the financial statements. Actual results could differ from those estimates. Subsequent events, if any, through the date that the financial statements were issued have been evaluated in the preparation of the financial statements. The following summarizes the significant accounting policies of the Fund:
Investment Valuation. Investments are valued as of 4:00 p.m. Eastern time on the last calendar day of the period. In accordance with valuation policies and procedures approved by the Board of Trustees (the Board), the Fund attempts to obtain prices from
Annual Report
3. Significant Accounting Policies - continued
Investment Valuation - continued
one or more third party pricing vendors or brokers to value its investments. When current market prices, quotations or currency exchange rates are not readily available or reliable, investments will be fair valued in good faith by the Fidelity Management & Research Company (FMR) Fair Value Committee (the Committee), in accordance with procedures adopted by the Board. Factors used in determining fair value vary by investment type and may include market or investment specific events, changes in interest rates and credit quality. The frequency with which these procedures are used cannot be predicted and they may be utilized to a significant extent. The Committee oversees the Fund's valuation policies and procedures and is responsible for approving and reporting to the Board all fair value determinations.
The Fund categorizes the inputs to valuation techniques used to value its investments into a disclosure hierarchy consisting of three levels as shown below:
Level 1 - quoted prices in active markets for identical investments
Level 2 - other significant observable inputs (including quoted prices for similar investments, interest rates, prepayment speeds, etc.)
Level 3 - unobservable inputs (including the Fund's own assumptions based on the best information available)
Valuation techniques used to value the Fund's investments by major category are as follows:
Equity securities, including restricted securities, for which market quotations are readily available, are valued at the last reported sale price or official closing price as reported by a third party pricing vendor on the primary market or exchange on which they are traded and are categorized as Level 1 in the hierarchy. In the event there were no sales during the day or closing prices are not available, securities are valued at the last quoted bid price or may be valued using the last available price and are generally categorized as Level 2 in the hierarchy. For foreign equity securities, when market or security specific events arise, comparisons to the valuation of American Depositary Receipts (ADRs), futures contracts, Exchange-Traded Funds (ETFs) and certain indexes as well as quoted prices for similar securities may be used and would be categorized as Level 2 in the hierarchy. Utilizing these techniques may result in transfers between Level 1 and Level 2. For equity securities, including restricted securities, where observable inputs are limited, assumptions about market activity and risk are used and these securities may be categorized as Level 3 in the hierarchy.
Annual Report
Notes to Financial Statements - continued
(Amounts in thousands except percentages)
3. Significant Accounting Policies - continued
Investment Valuation - continued
Debt securities, including restricted securities, are valued based on evaluated prices received from third party pricing vendors or from brokers who make markets in such securities. Corporate bonds and preferred securities are valued by pricing vendors who utilize matrix pricing which considers yield or price of bonds of comparable quality, coupon, maturity and type or by broker-supplied prices. When independent prices are unavailable or unreliable, debt securities may be valued utilizing pricing methodologies which consider similar factors that would be used by third party pricing vendors. Debt securities are generally categorized as Level 2 in the hierarchy but may be Level 3 depending on the circumstances.
Investments in open-end mutual funds, including the Fidelity Central Funds, are valued at their closing net asset value (NAV) each business day and are categorized as Level 1 in the hierarchy.
Changes in valuation techniques may result in transfers in or out of an assigned level within the disclosure hierarchy. The aggregate value of investments by input level, as of July 31, 2014, is included at the end of the Fund's Schedule of Investments.
Foreign Currency. The Fund may use foreign currency contracts to facilitate transactions in foreign-denominated securities. Gains and losses from these transactions may arise from changes in the value of the foreign currency or if the counterparties do not perform under the contracts' terms.
Foreign-denominated assets, including investment securities, and liabilities are translated into U.S. dollars at the exchange rates at period end. Purchases and sales of investment securities, income and dividends received and expenses denominated in foreign currencies are translated into U.S. dollars at the exchange rate in effect on the transaction date.
The effects of exchange rate fluctuations on investments are included with the net realized and unrealized gain (loss) on investment securities. Other foreign currency transactions resulting in realized and unrealized gain (loss) are disclosed separately.
Investment Transactions and Income. For financial reporting purposes, the Fund's investment holdings and NAV include trades executed through the end of the last business day of the period. The NAV per share for processing shareholder transactions is calculated as of the close of business of the New York Stock Exchange (NYSE), normally 4:00 p.m. Eastern time and includes trades executed through the end of the prior business day. Gains and losses on securities sold are determined on the basis of identified cost and may include proceeds received from litigation. Dividend income is recorded on the ex-dividend date, except for certain dividends from foreign securities where the
Annual Report
3. Significant Accounting Policies - continued
Investment Transactions and Income - continued
ex-dividend date may have passed, which are recorded as soon as the Fund is informed of the ex-dividend date. Non-cash dividends included in dividend income, if any, are recorded at the fair market value of the securities received. Income and capital gain distributions from Fidelity Central Funds, if any, are recorded on the ex-dividend date. Distributions received on securities that represent a return of capital or capital gain are recorded as a reduction of cost of investments and/or as a realized gain. Subsequent to ex-dividend date the Fund determines the components of these distributions, based upon receipt of tax filings or other correspondence relating to the underlying investment. Interest income is accrued as earned and includes coupon interest and amortization of premium and accretion of discount on debt securities as applicable. Investment income is recorded net of foreign taxes withheld where recovery of such taxes is uncertain.
Class Allocations and Expenses. Investment income, realized and unrealized capital gains and losses, common expenses of the Fund, and certain fund-level expense reductions, if any, are allocated daily on a pro-rata basis to each class based on the relative net assets of each class to the total net assets of the Fund. Each class differs with respect to transfer agent fees incurred. Certain expense reductions may also differ by class. For the reporting period, the allocated portion of income and expenses to each class as a percent of its average net assets may vary due to the timing of recording these transactions in relation to fluctuating net assets of the classes. Expenses directly attributable to a fund are charged to that fund. Expenses attributable to more than one fund are allocated among the respective funds on the basis of relative net assets or other appropriate methods. Expense estimates are accrued in the period to which they relate and adjustments are made when actual amounts are known.
Deferred Trustee Compensation. Under a Deferred Compensation Plan (the Plan), independent Trustees may elect to defer receipt of a portion of their annual compensation. Deferred amounts are invested in a cross-section of Fidelity funds, are marked-to-market and remain in the Fund until distributed in accordance with the Plan. The investment of deferred amounts and the offsetting payable to the Trustees are included in the accompanying Statement of Assets and Liabilities.
Income Tax Information and Distributions to Shareholders. Each year, the Fund intends to qualify as a regulated investment company under Subchapter M of the Internal Revenue Code, including distributing substantially all of its taxable income and realized gains. As a result, no provision for U.S. Federal income taxes is required. As of July 31, 2014, the Fund did not have any unrecognized tax benefits in the financial statements; nor is the Fund aware of any tax positions for which it is reasonably possible that the total amounts of unrecognized tax benefits will significantly change in the next twelve months. The Fund files a U.S. federal tax return, in addition to state and local tax
Annual Report
Notes to Financial Statements - continued
(Amounts in thousands except percentages)
3. Significant Accounting Policies - continued
Income Tax Information and Distributions to Shareholders - continued
returns as required. The Fund's federal income tax returns are subject to examination by the Internal Revenue Service (IRS) for a period of three fiscal years after they are filed. State and local tax returns may be subject to examination for an additional fiscal year depending on the jurisdiction. Foreign taxes are provided for based on the Fund's understanding of the tax rules and rates that exist in the foreign markets in which it invests. The Fund is subject to a tax imposed on capital gains by certain countries in which it invests.
Distributions are declared and recorded on the ex-dividend date. Income dividends and capital gain distributions are declared separately for each class. Income and capital gain distributions are determined in accordance with income tax regulations, which may differ from GAAP.
Capital accounts within the financial statements are adjusted for permanent book-tax differences. These adjustments have no impact on net assets or the results of operations. Capital accounts are not adjusted for temporary book-tax differences which will reverse in a subsequent period.
Book-tax differences are primarily due to foreign currency transactions, certain foreign taxes, market discount, redemptions in kind, partnerships, deferred trustees compensation, equity-debt classification, capital loss carryforwards and losses deferred due to wash sales.
The federal tax cost of investment securities and unrealized appreciation (depreciation) as of period end were as follows:
Gross unrealized appreciation | $ 1,544,345 |
Gross unrealized depreciation | (92,703) |
Net unrealized appreciation (depreciation) on securities | $ 1,451,642 |
| |
Tax Cost | $ 6,090,021 |
The tax-based components of distributable earnings as of period end were as follows:
Undistributed ordinary income | $ 11,908 |
Capital loss carryforward | $ (3,419,588) |
Net unrealized appreciation (depreciation) on securities and other investments | $ 1,451,645 |
Capital loss carryforwards are only available to offset future capital gains of the Fund to the extent provided by regulations and may be limited. Under the Regulated Investment
Annual Report
3. Significant Accounting Policies - continued
Income Tax Information and Distributions to Shareholders - continued
Company Modernization Act of 2010 (the Act), the Fund is permitted to carry forward capital losses incurred in taxable years beginning after December 22, 2010 for an unlimited period and such capital losses are required to be used prior to any losses that expire. The capital loss carryforward information presented below, including any applicable limitation, is estimated as of fiscal period end and is subject to adjustment.
Fiscal year of expiration | |
2017 | $ (251,247) |
2018 | (3,168,341) |
Total capital loss carryforward | $ (3,419,588) |
The tax character of distributions paid was as follows:
| July 31, 2014 | July 31, 2013 |
Ordinary Income | $ 135,178 | $ 128,047 |
Restricted Securities. The Fund may invest in securities that are subject to legal or contractual restrictions on resale. These securities generally may be resold in transactions exempt from registration or to the public if the securities are registered. Disposal of these securities may involve time-consuming negotiations and expense, and prompt sale at an acceptable price may be difficult. Information regarding restricted securities is included at the end of the Fund's Schedule of Investments.
4. Purchases and Sales of Investments.
Purchases and sales of securities, other than short-term securities and in-kind securities, aggregated $3,025,941 and $3,423,754, respectively.
5. Fees and Other Transactions with Affiliates.
Management Fee. Fidelity Management & Research Company (the investment adviser) and its affiliates provide the Fund with investment management related services for which the Fund pays a monthly management fee. The management fee is the sum of an individual fund fee rate that is based on an annual rate of .20% of the Fund's average net assets and an annualized group fee rate that averaged .25% during the period. The group fee rate is based upon the average net assets of all the mutual funds advised by the investment adviser, including any mutual funds previously advised by the investment adviser that are currently advised by Fidelity SelectCo, LLC, an affiliate of the investment adviser. The group fee rate decreases as assets under management increase and increases as assets under management decrease. For the reporting period, the total annual management fee rate was .45% of the Fund's average net assets.
Annual Report
Notes to Financial Statements - continued
(Amounts in thousands except percentages)
5. Fees and Other Transactions with Affiliates - continued
Transfer Agent Fees. Fidelity Investments Institutional Operations Company, Inc., (FIIOC), an affiliate of the investment adviser, is the transfer, dividend disbursing and shareholder servicing agent for each class of the Fund. FIIOC receives account fees and asset-based fees that vary according to the account size and type of account of the shareholders of Growth & Income. FIIOC receives an asset-based fee of Class K's average net assets. FIIOC pays for typesetting, printing and mailing of shareholder reports, except proxy statements.
For the period, transfer agent fees for each class were as follows:
| Amount | % of
Average
Net Assets |
Growth and Income | $ 10,994 | .17 |
Class K | 477 | .05 |
| $ 11,471 | |
Accounting and Security Lending Fees. Fidelity Service Company, Inc. (FSC), an affiliate of the investment adviser, maintains the Fund's accounting records. The accounting fee is based on the level of average net assets for each month. Under a separate contract, FSC administers the security lending program. The security lending fee is based on the number and duration of lending transactions.
Brokerage Commissions. The Fund placed a portion of its portfolio transactions with brokerage firms which are affiliates of the investment adviser. Brokerage commissions are included in net realized gain (loss) and change in net unrealized appreciation (depreciation) in the Statement of Operations. The commissions paid to these affiliated firms were $48 for the period.
Interfund Lending Program. Pursuant to an Exemptive Order issued by the SEC, the Fund, along with other registered investment companies having management contracts with FMR or other affiliated entities of FMR, may participate in an interfund lending program. This program provides an alternative credit facility allowing the funds to borrow from, or lend money to, other participating affiliated funds. At period end, there were no interfund loans outstanding. The Fund's activity in this program during the period for which loans were outstanding was as follows:
Borrower or Lender | Average Loan
Balance | Weighted Average Interest Rate | Interest Expense |
Borrower | $ 17,263 | .31% | $ 13 |
Annual Report
5. Fees and Other Transactions with Affiliates - continued
Redemptions In-Kind. During the period, 2,627 shares of the Fund held by affiliated entities were redeemed in kind for cash and investments, including accrued interest, with a value of $77,347. The net realized gain of $25,387 on securities delivered through the in-kind redemption is included in the accompanying Statement of Operations. The amount of in-kind redemptions is included in share transactions in the accompanying Statement of Changes in Net Assets as well as Note 10: Share Transactions. The Fund recognized no gain or loss for federal income tax purposes.
6. Committed Line of Credit.
The Fund participates with other funds managed by the investment adviser or an affiliate in a $4.25 billion credit facility (the "line of credit") to be utilized for temporary or emergency purposes to fund shareholder redemptions or for other short-term liquidity purposes. The Fund has agreed to pay commitment fees on its pro-rata portion of the line of credit, which amounted to $13 and is reflected in Miscellaneous expenses on the Statement of Operations. During the period, the Fund did not borrow on this line of credit.
7. Security Lending.
The Fund lends portfolio securities through a lending agent from time to time in order to earn additional income. For equity securities, a lending agent is used and may loan securities to certain qualified borrowers, including Fidelity Capital Markets (FCM), a broker-dealer affiliated with the Fund. On the settlement date of the loan, the Fund receives collateral (in the form of U.S. Treasury obligations, letters of credit and/or cash) against the loaned securities and maintains collateral in an amount not less than 100% of the market value of the loaned securities during the period of the loan. The market value of the loaned securities is determined at the close of business of the Fund and any additional required collateral is delivered to the Fund on the next business day. If the borrower defaults on its obligation to return the securities loaned because of insolvency or other reasons, the Fund may apply collateral received from the borrower against the obligation. The Fund may experience delays and costs in recovering the securities loaned. Any cash collateral received is invested in the Fidelity Securities Lending Cash Central Fund. The value of loaned securities and cash collateral at period end are disclosed on the Fund's Statement of Assets and Liabilities. At period end, there were no security loans outstanding with FCM. Security lending income represents the income earned on investing cash collateral, less rebates paid to borrowers and any lending agent fees associated with the loan, plus any premium payments received for lending certain types of securities. Security lending income is presented in the Statement of Operations
Annual Report
Notes to Financial Statements - continued
(Amounts in thousands except percentages)
7. Security Lending - continued
as a component of income from Fidelity Central Funds. Total security lending income during the period amounted to $628, including $34 from securities loaned to FCM.
8. Expense Reductions.
Commissions paid to certain brokers with whom the investment adviser, or its affiliates, places trades on behalf of the Fund include an amount in addition to trade execution, which may be rebated back to the Fund to offset certain expenses. This amount totaled $79 for the period.
In addition, the investment adviser reimbursed a portion of the Fund's operating expenses during the period in the amount of $76.
9. Distributions to Shareholders.
Distributions to shareholders of each class were as follows:
Years ended July 31, | 2014 | 2013 |
From net investment income | | |
Growth and Income | $ 113,973 | $ 102,417 |
Class K | 19,579 | 18,247 |
Total | $ 133,552 | $ 120,664 |
From net realized gain | | |
Growth and Income | $ 1,391 | $ 6,339 |
Class K | 235 | 1,044 |
Total | $ 1,626 | $ 7,383 |
10. Share Transactions.
Transactions for each class of shares were as follows:
| Shares | Dollars |
Years ended July 31, | 2014 | 2013 | 2014 | 2013 |
Growth and Income | | | | |
Shares sold | 21,786 | 29,843 | $ 598,816 | $ 688,591 |
Reinvestment of distributions | 3,998 | 4,672 | 110,063 | 104,347 |
Shares redeemed | (36,289) A | (39,833) | (997,570) A | (885,644) |
Net increase (decrease) | (10,505) | (5,318) | $ (288,691) | $ (92,706) |
Class K | | | | |
Shares sold | 7,113 | 11,165 | $ 195,462 | $ 248,185 |
Reinvestment of distributions | 722 | 863 | 19,814 | 19,291 |
Shares redeemed | (14,384) | (9,761) | (398,755) | (217,301) |
Net increase (decrease) | (6,549) | 2,267 | $ (183,479) | $ 50,175 |
A Amount includes in-kind redemptions (see Note 5: Redemptions In-Kind).
Annual Report
11. Other.
The Fund's organizational documents provide former and current trustees and officers with a limited indemnification against liabilities arising in connection with the performance of their duties to the Fund. In the normal course of business, the Fund may also enter into contracts that provide general indemnifications. The Fund's maximum exposure under these arrangements is unknown as this would be dependent on future claims that may be made against the Fund. The risk of material loss from such claims is considered remote.
Annual Report
To the Trustees of Fidelity Securities Fund and the Shareholders of Fidelity Growth & Income Portfolio:
In our opinion, the accompanying statement of assets and liabilities, including the schedule of investments, and the related statements of operations and of changes in net assets and the financial highlights present fairly, in all material respects, the financial position of Fidelity Growth & Income Portfolio (a fund of Fidelity Securities Fund) at July 31, 2014, the results of its operations for the year then ended, the changes in its net assets for each of the two years in the period then ended and the financial highlights for each of the five years in the period then ended, in conformity with accounting principles generally accepted in the United States of America. These financial statements and financial highlights (hereafter referred to as "financial statements") are the responsibility of the Fidelity Growth & Income Portfolio's management. Our responsibility is to express an opinion on these financial statements based on our audits. We conducted our audits of these financial statements in accordance with the standards of the Public Company Accounting Oversight Board (United States). Those standards require that we plan and perform the audit to obtain reasonable assurance about whether the financial statements are free of material misstatement. An audit includes examining, on a test basis, evidence supporting the amounts and disclosures in the financial statements, assessing the accounting principles used and significant estimates made by management, and evaluating the overall financial statement presentation. We believe that our audits, which included confirmation of securities at July 31, 2014 by correspondence with the custodian and brokers, provide a reasonable basis for our opinion.
PricewaterhouseCoopers LLP
Boston, Massachusetts
September 11, 2014
Annual Report
The Trustees, Member of the Advisory Board, and officers of the trust and fund, as applicable, are listed below. The Board of Trustees governs the fund and is responsible for protecting the interests of shareholders. The Trustees are experienced executives who meet periodically throughout the year to oversee the fund's activities, review contractual arrangements with companies that provide services to the fund, oversee management of the risks associated with such activities and contractual arrangements, and review the fund's performance. Except for James C. Curvey, each of the Trustees oversees 173 funds. Mr. Curvey oversees 397 funds.
The Trustees hold office without limit in time except that (a) any Trustee may resign; (b) any Trustee may be removed by written instrument, signed by at least two-thirds of the number of Trustees prior to such removal; (c) any Trustee who requests to be retired or who has become incapacitated by illness or injury may be retired by written instrument signed by a majority of the other Trustees; and (d) any Trustee may be removed at any special meeting of shareholders by a two-thirds vote of the outstanding voting securities of the trust. Each Trustee who is not an interested person (as defined in the 1940 Act) of the trust and the fund (Independent Trustee), shall retire not later than the last day of the calendar year in which his or her 75th birthday occurs. The Independent Trustees may waive this mandatory retirement age policy with respect to individual Trustees. The officers and Advisory Board Member hold office without limit in time, except that any officer and Advisory Board Member may resign or may be removed by a vote of a majority of the Trustees at any regular meeting or any special meeting of the Trustees. Except as indicated, each individual has held the office shown or other offices in the same company for the past five years.
Experience, Skills, Attributes, and Qualifications of the Fund's Trustees. The Governance and Nominating Committee has adopted a statement of policy that describes the experience, qualifications, attributes, and skills that are necessary and desirable for potential Independent Trustee candidates (Statement of Policy). The Board believes that each Trustee satisfied at the time he or she was initially elected or appointed a Trustee, and continues to satisfy, the standards contemplated by the Statement of Policy. The Governance and Nominating Committee also engages professional search firms to help identify potential Independent Trustee candidates who have the experience, qualifications, attributes, and skills consistent with the Statement of Policy. From time to time, additional criteria based on the composition and skills of the current Independent Trustees, as well as experience or skills that may be appropriate in light of future changes to board composition, business conditions, and regulatory or other developments, have also been considered by the professional search firms and the Governance and Nominating Committee. In addition, the Board takes into account the Trustees' commitment and participation in Board and committee meetings, as well as their leadership of standing and ad hoc committees throughout their tenure.
In determining that a particular Trustee was and continues to be qualified to serve as a Trustee, the Board has considered a variety of criteria, none of which, in isolation, was controlling. The Board believes that, collectively, the Trustees have balanced and diverse experience, qualifications, attributes, and skills, which allow the Board to operate effectively in governing the fund and protecting the interests of shareholders. Information about the specific experience, skills, attributes, and qualifications of each Trustee, which in each case led to the Board's conclusion that the Trustee should serve (or continue to serve) as a trustee of the fund, is provided below.
Annual Report
Trustees and Officers - continued
Board Structure and Oversight Function. James C. Curvey is an interested person (as defined in the 1940 Act) and currently serves as Chairman. The Trustees have determined that an interested Chairman is appropriate and benefits shareholders because an interested Chairman has a personal and professional stake in the quality and continuity of services provided to the fund. Independent Trustees exercise their informed business judgment to appoint an individual of their choosing to serve as Chairman, regardless of whether the Trustee happens to be independent or a member of management. The Independent Trustees have determined that they can act independently and effectively without having an Independent Trustee serve as Chairman and that a key structural component for assuring that they are in a position to do so is for the Independent Trustees to constitute a substantial majority for the Board. The Independent Trustees also regularly meet in executive session. Ned C. Lautenbach serves as Chairman of the Independent Trustees and as such (i) acts as a liaison between the Independent Trustees and management with respect to matters important to the Independent Trustees and (ii) with management prepares agendas for Board meetings.
Fidelity funds are overseen by different Boards of Trustees. The fund's Board oversees Fidelity's equity and high income funds and another Board oversees Fidelity's investment-grade bond, money market, and asset allocation funds. The asset allocation funds may invest in Fidelity funds overseen by the fund's Board. The use of separate Boards, each with its own committee structure, allows the Trustees of each group of Fidelity funds to focus on the unique issues of the funds they oversee, including common research, investment, and operational issues. On occasion, the separate Boards establish joint committees to address issues of overlapping consequences for the Fidelity funds overseen by each Board.
The Trustees operate using a system of committees to facilitate the timely and efficient consideration of all matters of importance to the Trustees, the fund, and fund shareholders and to facilitate compliance with legal and regulatory requirements and oversight of the fund's activities and associated risks. The Board, acting through its committees, has charged FMR and its affiliates with (i) identifying events or circumstances the occurrence of which could have demonstrably adverse effects on the fund's business and/or reputation; (ii) implementing processes and controls to lessen the possibility that such events or circumstances occur or to mitigate the effects of such events or circumstances if they do occur; and (iii) creating and maintaining a system designed to evaluate continuously business and market conditions in order to facilitate the identification and implementation processes described in (i) and (ii) above. Because the day-to-day operations and activities of the fund are carried out by or through FMR, its affiliates and other service providers, the fund's exposure to risks is mitigated but not eliminated by the processes overseen by the Trustees. While each of the Board's committees has responsibility for overseeing different aspects of the fund's activities, oversight is exercised primarily through the Operations, Audit, and Compliance Committees. In addition, the Independent Trustees have worked with FMR to enhance the Board's oversight of investment and financial risks, legal and regulatory risks, technology risks, and operational risks, including the development of additional risk reporting to the Board. For example, a working group comprised of Independent Trustees and FMR has worked and continues to work to review the Fidelity funds' valuation-related activities, reporting and risk management. Appropriate personnel, including but not limited to the fund's Chief Compliance Officer (CCO), FMR's internal auditor, the independent accountants, the fund's Treasurer and portfolio management personnel, make periodic reports to the Board's committees, as appropriate, including an annual review of FMR's risk management program for the Fidelity funds. The responsibilities of each standing committee, including their oversight responsibilities, are described further under "Standing Committees of the Fund's Trustees."
Annual Report
The fund's Statement of Additional Information (SAI) includes more information about the Trustees. To request a free copy, call Fidelity at 1-800-544-8544.
Interested Trustees*:
Correspondence intended for each Trustee who is an interested person may be sent to Fidelity Investments, 245 Summer Street, Boston, Massachusetts 02210.
Name, Year of Birth; Principal Occupations and Other Relevant Experience+ |
James C. Curvey (1935) |
Year of Election or Appointment: 2007 Trustee Chairman of the Board of Trustees |
| Mr. Curvey also serves as Trustee of other Fidelity funds. Mr. Curvey is a Director of Fidelity Research & Analysis Co. (2009-present), and Vice Chairman (2007-present) and Director of FMR LLC. In addition, Mr. Curvey serves as an Overseer for the Boston Symphony Orchestra and a member of the Trustees of Villanova University. Previously, Mr. Curvey served as a Director of Fidelity Investments Money Management, Inc. (2009-2014), a Director of FMR (2007-2014), a Director of FMR Co., Inc. (2007-2014) and was the Vice Chairman (2006-2007) and Director (2000-2007) of FMR Corp. |
Charles S. Morrison (1960) |
Year of Election or Appointment: 2014 Trustee |
| Mr. Morrison also serves as Trustee of other funds. He serves as President, Asset Management (2014-present) and is an employee of Fidelity Investments. Previously, Mr. Morrison served as Vice President of Fidelity's Fixed Income and Asset Allocation Funds (2012-2014), President, Fixed Income (2011-2014), Vice President of Fidelity's Money Market Funds (2005-2009), President, Money Market Group Leader of FMR (2009), and Senior Vice President, Money Market Group of FMR (2004-2009). Mr. Morrison also served as Vice President of Fidelity's Bond Funds (2002-2005), certain Balanced Funds (2002-2005), and certain Asset Allocation Funds (2002-2007), and as Senior Vice President (2002-2005) of Fidelity's Bond Division. |
* Trustees have been determined to be "Interested Trustees" by virtue of, among other things, their affiliation with the trust or various entities under common control with FMR.
+ The information above includes each Trustee's principal occupation during the last five years and other information relating to the experience, attributes, and skills relevant to each Trustee's qualifications to serve as a Trustee, which led to the conclusion that each Trustee should serve as a Trustee for the fund.
Annual Report
Independent Trustees:
Correspondence intended for each Independent Trustee (that is, the Trustees other than the Interested Trustees) may be sent to Fidelity Investments, P.O. Box 55235, Boston, Massachusetts 02205-5235.
Name, Year of Birth; Principal Occupations and Other Relevant Experience+ |
Dennis J. Dirks (1948) |
Year of Election or Appointment: 2005 Trustee |
| Mr. Dirks also serves as Trustee of other Fidelity funds. Prior to his retirement in May 2003, Mr. Dirks was Chief Operating Officer and a member of the Board of The Depository Trust & Clearing Corporation (DTCC). He also served as President, Chief Operating Officer, and Board member of The Depository Trust Company (DTC) and President and Board member of the National Securities Clearing Corporation (NSCC). In addition, Mr. Dirks served as Chief Executive Officer and Board member of the Government Securities Clearing Corporation, Chief Executive Officer and Board member of the Mortgage-Backed Securities Clearing Corporation, as a Trustee and a member of the Finance Committee of Manhattan College (2005-2008), and as a Trustee and a member of the Finance Committee of AHRC of Nassau County (2006-2008). Mr. Dirks is a member of the Independent Directors Council (IDC) Governing Council (2010-present) and Board of Directors for The Brookville Center for Children's Services, Inc. (2009-present). |
Alan J. Lacy (1953) |
Year of Election or Appointment: 2008 Trustee |
| Mr. Lacy also serves as Trustee of other Fidelity funds. Mr. Lacy serves as Senior Adviser (2007-present) of Oak Hill Capital Partners, L.P. (private equity). Mr. Lacy also served as Chief Executive Officer (2000-2005) and Vice Chairman (2005-2006) of Sears Holdings Corporation and Sears, Roebuck and Co. (retail). In addition, Mr. Lacy serves as a member of the Board of Directors of Dave & Buster's Entertainment, Inc. (restaurant and entertainment complexes, 2010-present), Earth Fare, Inc. (retail grocery, 2012-present), The Hillman Companies, Inc. (hardware wholesalers, 2010-present), and Bristol-Myers Squibb Company (global pharmaceuticals, 2008-present). Mr. Lacy is a member of the Board of Trustees of The National Parks Conservation Association (2006-present). Previously, Mr. Lacy served as Chairman of the Board of Trustees of the National Parks Conservation Association (2008-2011) and as a member of the Board of Directors for the Western Union Company (global money transfer, 2006-2011). |
Ned C. Lautenbach (1944) |
Year of Election or Appointment: 2000 Trustee Chairman of the Independent Trustees |
| Mr. Lautenbach also serves as Trustee of other Fidelity funds. Mr. Lautenbach currently serves as the Lead Director of the Eaton Corporation Board of Directors (diversified industrial, 1997-present). Mr. Lautenbach is Chairman of the Board of Directors of the Philharmonic Center for the Arts in Naples, Florida (2012-present) and a member of the Council on Foreign Relations (1994-present). Previously, Mr. Lautenbach was a Partner/Advisory Partner at Clayton, Dubilier & Rice, LLC (private equity investment, 1998-2010), as well as a Director of Sony Corporation (2006-2007). |
Joseph Mauriello (1944) |
Year of Election or Appointment: 2008 Trustee |
| Mr. Mauriello also serves as Trustee of other Fidelity funds. Prior to his retirement in January 2006, Mr. Mauriello served in numerous senior management positions including Deputy Chairman and Chief Operating Officer (2004-2005), and Vice Chairman of Financial Services (2002-2004) of KPMG LLP US (professional services, 1965-2005). Mr. Mauriello currently serves as a member of the Board of Directors of XL Group plc. (global insurance and re-insurance, 2006-present). Previously, Mr. Mauriello served as a Director of the Hamilton Funds of the Bank of New York (2006-2007) and of Arcadia Resources Inc. (health care services and products, 2007-2012). |
Robert W. Selander (1950) |
Year of Election or Appointment: 2011 Trustee |
| Mr. Selander also serves as Trustee of other Fidelity funds. Previously, Mr. Selander served as a Member of the Advisory Board of other Fidelity funds (2011), and Executive Vice Chairman (2010), Chief Executive Officer (2009-2010), and President and Chief Executive Officer (1997-2009) of Mastercard, Inc. |
Cornelia M. Small (1944) |
Year of Election or Appointment: 2005 Trustee |
| Ms. Small also serves as Trustee of other Fidelity funds. Ms. Small is a member of the Board of Directors (2009-present) and Chair of the Investment Committee (2010-present) of the Teagle Foundation. Ms. Small also serves on the Investment Committee of the Berkshire Taconic Community Foundation (2008-present). Previously, Ms. Small served as Chairperson (2002-2008) and a member of the Investment Committee and Chairperson (2008-2012) and a member of the Board of Trustees of Smith College. In addition, Ms. Small served as Chief Investment Officer, Director of Global Equity Investments, and a member of the Board of Directors of Scudder, Stevens & Clark and Scudder Kemper Investments. |
William S. Stavropoulos (1939) |
Year of Election or Appointment: 2002 Trustee Vice Chairman of the Independent Trustees |
| Mr. Stavropoulos also serves as Trustee of other Fidelity funds. Mr. Stavropoulos serves as President and Founder of the Michigan Baseball Foundation, the Great Lakes Loons (2007-present). Mr. Stavropoulos is Chairman Emeritus of the Board of Directors of The Dow Chemical Company, where he previously served in numerous senior management positions, including President, CEO (1995-2000; 2002-2004), Chairman of the Executive Committee (2000-2006), and as a member of the Board of Directors (1990-2006). Currently, Mr. Stavropoulos is Chairman of the Board of Directors of Univar Inc. (global distributor of commodity and specialty chemicals), a Director of Teradata Corporation (data warehousing and technology solutions), and Maersk Inc. (industrial conglomerate), and a member of the Advisory Board for Metalmark Capital LLC (private equity investment, 2005-present). Mr. Stavropoulos is an operating advisor to Clayton, Dubilier & Rice, LLC (private equity investment). In addition, Mr. Stavropoulos is a member of the University of Notre Dame Advisory Council for the College of Science, a Trustee of the Rollin L. Gerstacker Foundation, and a Director of the Naples Philharmonic Center for the Arts. Previously, Mr. Stavropoulos served as a Director of Chemical Financial Corporation (bank holding company, 1993-2012) and Tyco International, Ltd. (multinational manufacturing and services, 2007-2012). |
David M. Thomas (1949) |
Year of Election or Appointment: 2008 Trustee |
| Mr. Thomas also serves as Trustee of other Fidelity funds. Mr. Thomas serves as Non-Executive Chairman of the Board of Directors of Fortune Brands Home and Security (home and security products, 2011-present), and as a member of the Board of Directors of Interpublic Group of Companies, Inc. (marketing communication, 2004-present). Previously, Mr. Thomas served as Executive Chairman (2005-2006) and Chairman and Chief Executive Officer (2000-2005) of IMS Health, Inc. (pharmaceutical and healthcare information solutions), and a Director of Fortune Brands, Inc. (consumer products, 2000-2011). |
+ The information above includes each Trustee's principal occupation during the last five years and other information relating to the experience, attributes, and skills relevant to each Trustee's qualifications to serve as a Trustee, which led to the conclusion that each Trustee should serve as a Trustee for the fund.
Advisory Board Member and Officers:
Correspondence intended for each officer and Peter S. Lynch may be sent to Fidelity Investments, 245 Summer Street, Boston, Massachusetts 02210. Officers appear below in alphabetical order.
Name, Year of Birth; Principal Occupation |
Peter S. Lynch (1944) |
Year of Election or Appointment: 2003 Member of the Advisory Board |
| Mr. Lynch also serves as Member of the Advisory Board of other Fidelity funds. Mr. Lynch is Vice Chairman and a Director of FMR and FMR Co., Inc. In addition, Mr. Lynch serves as a Trustee of Boston College and as the Chairman of the Inner-City Scholarship Fund. Previously, Mr. Lynch served on the Special Olympics International Board of Directors (1997-2006). |
Elizabeth Paige Baumann (1968) |
Year of Election or Appointment: 2012 Anti-Money Laundering (AML) Officer |
| Ms. Baumann also serves as AML Officer of other funds. She is Chief AML Officer of FMR LLC (2012-present) and is an employee of Fidelity Investments. Previously, Ms. Baumann served as Vice President and Deputy Anti-Money Laundering Officer (2007-2012). |
William C. Coffey (1969) |
Year of Election or Appointment: 2009 Assistant Secretary |
| Mr. Coffey also serves as Assistant Secretary of other funds. He is Senior Vice President and Deputy General Counsel of FMR LLC (2010-present), and is an employee of Fidelity Investments. Previously, Mr. Coffey served as Vice President and Associate General Counsel of FMR LLC (2005-2009). |
Jonathan Davis (1968) |
Year of Election or Appointment: 2010 Assistant Treasurer |
| Mr. Davis also serves as Assistant Treasurer of other funds. Mr. Davis is an employee of Fidelity Investments. Previously, Mr. Davis served as Vice President and Associate General Counsel of FMR LLC (2003-2010). |
Adrien E. Deberghes (1967) |
Year of Election or Appointment: 2008 Deputy Treasurer |
| Mr. Deberghes also serves as an officer of other funds. He is an employee of Fidelity Investments (2008-present). Prior to joining Fidelity Investments, Mr. Deberghes was Senior Vice President of Mutual Fund Administration at State Street Corporation (2007-2008), Senior Director of Mutual Fund Administration at Investors Bank & Trust (2005-2007), and Director of Finance for Dunkin' Brands (2000-2005). |
Stephanie J. Dorsey (1969) |
Year of Election or Appointment: 2010 Assistant Treasurer |
| Ms. Dorsey also serves as an officer of other funds. She is an employee of Fidelity Investments (2008-present) and has served in other fund officer roles. Prior to joining Fidelity Investments, Ms. Dorsey served as Treasurer (2004-2008) of the JPMorgan Mutual Funds and Vice President (2004-2008) of JPMorgan Chase Bank. |
Howard J. Galligan III (1966) |
Year of Election or Appointment: 2014 Chief Financial Officer |
| Mr. Galligan also serves as Chief Financial Officer of other funds. Mr. Galligan serves as President of Fidelity Pricing and Cash Management Services (FPCMS) (2014-present) and as a Director of Strategic Advisers, Inc. (2008-present). Previously, Mr. Galligan served as Chief Administrative Officer of Asset Management (2011-2014) and Chief Operating Officer and Senior Vice President of Investment Support for Strategic Advisers, Inc. (2003-2011). |
Scott C. Goebel (1968) |
Year of Election or Appointment: 2008 Secretary and Chief Legal Officer (CLO) |
| Mr. Goebel serves as Secretary and CLO of other funds. Mr. Goebel also serves as Secretary of Fidelity SelectCo, LLC (2013-present), Fidelity Investments Money Management, Inc. (FIMM) (2010-present) and Fidelity Research and Analysis Company (FRAC) (2010-present); General Counsel, Secretary, and Senior Vice President of FMR (2008-present) and FMR Co., Inc. (2008-present); Chief Legal Officer of Fidelity Management & Research (Hong Kong) Limited (2008-present); and Assistant Secretary of Fidelity Management & Research (Japan) Inc. (2008-present) and Fidelity Management & Research (U.K.) Inc. (2008-present). Previously, Mr. Goebel served as Secretary and CLO of other Fidelity funds (2008-2013), Assistant Secretary of FIMM (2008-2010), FRAC (2008-2010), and certain funds (2007-2008); and as Vice President and Secretary of Fidelity Distributors Corporation (FDC) (2005-2007). Mr. Goebel has been employed by FMR LLC or an affiliate since 2001. |
Brian B. Hogan (1964) |
Year of Election or Appointment: 2009 Vice President |
| Mr. Hogan also serves as Trustee or Vice President of other funds. Mr. Hogan serves as President of FMR's Equity Division (2009-present). Previously, Mr. Hogan served as Senior Vice President, Equity Research of FMR (2006-2009) and as a portfolio manager. |
Chris Maher (1972) |
Year of Election or Appointment: 2013 Assistant Treasurer |
| Mr. Maher serves as Assistant Treasurer of other funds. Mr. Maher is Vice President of Valuation Oversight and is an employee of Fidelity Investments. Previously, Mr. Maher served as Vice President of Asset Management Compliance (2013), Vice President of FMR's Program Management Group (2010-2013), and Vice President of Valuation Oversight (2008-2010). |
Melissa M. Reilly (1971) |
Year of Election or Appointment: 2014 Vice President of certain Equity Funds |
| Ms. Reilly also serves as Vice President of other funds. Ms. Reilly is an employee of Fidelity Investments (2004-present). |
Kenneth B. Robins (1969) |
Year of Election or Appointment: 2008 President and Treasurer |
| Mr. Robins also serves as an officer of other funds. Mr. Robins serves as Executive Vice President of Fidelity Investments Money Management, Inc. (FIMM) (2013-present) and is an employee of Fidelity Investments (2004-present). Previously, Mr. Robins served in other fund officer roles. |
Stephen Sadoski (1971) |
Year of Election or Appointment: 2012 Deputy Treasurer |
| Mr. Sadoski also serves as Deputy Treasurer of other funds. He is an employee of Fidelity Investments (2012-present) and has served in another fund officer role. Prior to joining Fidelity Investments, Mr. Sadoski served as an assistant chief accountant in the Division of Investment Management of the Securities and Exchange Commission (SEC) (2009-2012) and as a senior manager at Deloitte & Touche LLP (1997-2009). |
Stacie M. Smith (1974) |
Year of Election or Appointment: 2013 Deputy Treasurer |
| Ms. Smith also serves as an officer of other funds. She is an employee of Fidelity Investments (2009-present) and has served in other fund officer roles. Prior to joining Fidelity Investments, Ms. Smith served as Senior Audit Manager of Ernst & Young LLP (1996-2009). |
Renee Stagnone (1975) |
Year of Election or Appointment: 2013 Deputy Treasurer |
| Ms. Stagnone also serves as Deputy Treasurer of other funds. Ms. Stagnone is an employee of Fidelity Investments. |
Linda J. Wondrack (1964) |
Year of Election or Appointment: 2014 Chief Compliance Officer |
| Ms. Wondrack also serves as Chief Compliance Officer of other funds. Ms. Wondrack is Executive Vice President and head of the Ethics Office and Asset Management Compliance for Fidelity Investments (2012-present). Ms. Wondrack also serves as Chief Compliance Officer of Fidelity SelectCo, LLC (2014-present); Chief Compliance Officer of Impresa Management LLC (2013-present); and Chief Compliance Officer of FMR Co., Inc., Fidelity Investments Money Management, Inc., Fidelity Management & Research (Japan) Inc., Fidelity Management & Research (U.K.) Inc., Fidelity Management & Research (Hong Kong), Fidelity Management & Research Company, Pyramis Global Advisors, LLC, and Strategic Advisers, Inc., Ballyrock Investment Advisors LLC, and Northern Neck Investors LLC (2012-present). Previously, Ms. Wondrack served as Senior Vice President and Chief Compliance Officer for Columbia Management Investment Advisers, LLC (2005-2012); Chief Compliance Officer for certain funds within the Columbia Family of Funds (2007-2012); and Senior Vice President of Compliance Risk Management at Bank of America (2005-2010). |
Joseph F. Zambello (1957) |
Year of Election or Appointment: 2011 Deputy Treasurer |
| Mr. Zambello also serves as Deputy Treasurer of other funds. Mr. Zambello is an employee of Fidelity Investments. Previously, Mr. Zambello served as Vice President of FMR's Program Management Group (2009-2011) and Vice President of the Transfer Agent Oversight Group (2005-2009). |
Annual Report
Growth & Income designates 100% of the dividends distributed during the fiscal year as qualifying for the dividends-received deduction for corporate shareholders.
Growth & Income designates 100% of the dividends distributed during the fiscal year as amounts which may be taken into account as a dividend for the purposes of the maximum rate under section 1(h)(11) of the Internal Revenue Code.
The fund will notify shareholders in January 2015 of amounts for use in preparing 2014 income tax returns.
Annual Report
Board Approval of Investment Advisory Contracts and Management Fees
Fidelity Growth & Income Portfolio
Each year, the Board of Trustees, including the Independent Trustees (together, the Board), votes on the renewal of the management contract with Fidelity Management & Research Company (FMR) and the sub-advisory agreements (together, the Advisory Contracts) for the fund. The Board, assisted by the advice of fund counsel and Independent Trustees' counsel, requests and considers a broad range of information relevant to the renewal of the Advisory Contracts throughout the year.
The Board meets regularly and, at each of its meetings, covers an extensive agenda of topics and materials and considers factors that are relevant to its annual consideration of the renewal of the fund's Advisory Contracts, including the services and support provided to the fund and its shareholders. The Board has established various standing committees (Committees), each composed of and chaired by Independent Trustees with varying backgrounds, to which the Board has assigned specific subject matter responsibilities in order to enhance effective decision-making by the Board. The Board, acting directly and through its Committees, requests and receives information concerning the annual consideration of the renewal of the fund's Advisory Contracts. The Board also meets as needed to consider matters specifically related to the Board's annual consideration of the renewal of the Advisory Contracts. Members of the Board may also meet with trustees of other Fidelity funds through ad hoc joint committees to discuss certain matters relevant to the Fidelity funds.
At its July 2014 meeting, the Board, including the Independent Trustees, unanimously determined to renew the fund's Advisory Contracts. In reaching its determination, the Board considered all factors it believed relevant, including (i) the nature, extent, and quality of the services to be provided to the fund and its shareholders (including the investment performance of the fund); (ii) the competitiveness of the fund's management fee and total expense ratio relative to peer funds; (iii) the total costs of the services to be provided by and the profits to be realized by Fidelity from its relationship with the fund; (iv) the extent to which economies of scale exist and would be realized as the fund grows; and (v) whether fee levels reflect these economies of scale, if any, for the benefit of fund shareholders. In connection with separate internal corporate reorganizations involving Fidelity Management & Research (U.K.) Inc. (FMR U.K.) and Fidelity Management & Research (Japan) Inc. (FMR Japan), the Board approved certain non-material amendments to the fund's sub-advisory agreements with FMR U.K. and FMR Japan to reflect that, after these reorganizations, FMR Investment Management (UK) Limited and Fidelity Management & Research (Japan) Limited will carry on the business of FMR U.K. and FMR Japan, respectively. The Board noted that no changes to the portfolio managers or to the foreign research or investment advisory services provided to the fund were expected in connection with either reorganization and that the same personnel and resources would continue to be available to the fund at the new entities.
Annual Report
In considering whether to renew the Advisory Contracts for the fund, the Board reached a determination, with the assistance of fund counsel and Independent Trustees' counsel and through the exercise of its business judgment, that the renewal of the Advisory Contracts was in the best interests of the fund and its shareholders and that the compensation payable under the Advisory Contracts was fair and reasonable. The Board's decision to renew the Advisory Contracts was not based on any single factor, but rather was based on a comprehensive consideration of all the information provided to the Board at its meetings throughout the year. The Board, in reaching its determination to renew the Advisory Contracts, was aware that shareholders of the fund have a broad range of investment choices available to them, including a wide choice among funds offered by Fidelity's competitors, and that the fund's shareholders, who have the opportunity to review and weigh the disclosure provided by the fund in its prospectus and other public disclosures, have chosen to invest in this fund, which is part of the Fidelity family of funds.
Nature, Extent, and Quality of Services Provided. The Board considered Fidelity's staffing as it relates to the fund, including the backgrounds of investment personnel of FMR and the sub-advisers (together, the Investment Advisers), and also considered the fund's investment objective, strategies, and related investment philosophy. The Independent Trustees also had discussions with senior management of Fidelity's investment operations and investment groups. The Board considered the structure of the portfolio manager compensation program and whether this structure provides appropriate incentives to act in the best interests of the fund. Additionally, the Board considered the portfolio managers' investments, if any, in the funds that they manage.
Resources Dedicated to Investment Management and Support Services. The Board and the Fund Oversight and Research Committees reviewed the general qualifications and capabilities of Fidelity's investment staff, including its size, education, experience, and resources, as well as Fidelity's approach to recruiting, training, managing, and compensating investment personnel. The Board noted that Fidelity has continued to increase the resources devoted to non-U.S. offices, including expansion of Fidelity's global investment organization. The Board also noted that Fidelity's analysts have extensive resources, tools and capabilities that allow them to conduct sophisticated quantitative and fundamental analysis, as well as credit analysis of issuers, counterparties and guarantors. Further, the Board believes that Fidelity's investment professionals have sufficient access to global information and data so as to provide competitive investment results over time, and that those professionals also have access to sophisticated tools that permit them to assess portfolio construction and risk and performance attribution characteristics continuously, as well as to transmit new information and research conclusions rapidly around the world. Additionally, in its deliberations, the Board considered Fidelity's trading and risk management capabilities and resources and global compliance infrastructure, which are an integral part of the investment management process.
Annual Report
Board Approval of Investment Advisory Contracts and
Management Fees - continued
Shareholder and Administrative Services. The Board considered (i) the nature, extent, quality, and cost of advisory, administrative, and shareholder services performed by the Investment Advisers and their affiliates under the Advisory Contracts and under separate agreements covering transfer agency, pricing and bookkeeping, and securities lending services for the fund; (ii) the nature and extent of the supervision of third party service providers, principally custodians and subcustodians; and (iii) the resources devoted to, and the record of compliance with, the fund's compliance policies and procedures. The Board also reviewed the allocation of fund brokerage, including allocations to brokers affiliated with the Investment Advisers, the use of brokerage commissions to pay fund expenses, and the use of "soft" commission dollars to pay for research services.
The Board noted that the growth of fund assets over time across the complex allows Fidelity to reinvest in the development of services designed to enhance the value or convenience of the Fidelity funds as investment vehicles. These services include 24-hour access to account information and market information through telephone representatives and over the Internet, investor education materials and asset allocation tools, and the expanded availability of Fidelity Investor Centers.
In 2014, the Board formed an ad hoc Committee on Transfer Agency Fees to review the variety of transfer agency fee structures throughout the industry and Fidelity's competitive positioning with respect to industry participants.
Investment in a Large Fund Family. The Board considered the benefits to shareholders of investing in a Fidelity fund, including the benefits of investing in a fund that is part of a large family of funds offering a variety of investment disciplines and providing a large variety of mutual fund investor services. The Board noted that Fidelity had taken, or had made recommendations that resulted in the Fidelity funds taking, a number of actions over the previous year that benefited particular funds, including (i) continuing to dedicate additional resources to investment research and to the support of the senior management team that oversees asset management; (ii) persisting in efforts to enhance Fidelity's global research capabilities; (iii) launching new funds and making other enhancements to meet client needs for income-oriented solutions; (iv) reducing fund expenses for certain index funds; (v) continuing to launch dedicated lower cost underlying funds to meet portfolio construction needs related to expanding underlying fund options for Fidelity funds of funds, specifically for the Freedom Fund product lines; (vi) rationalizing product lines and gaining increased efficiencies through fund mergers; (vii) launching sector-based exchange-traded funds and establishing a new Fidelity adviser to manage sector-based funds and products; (viii) continuing to develop and implement technology to improve security and increase efficiency; (ix) modifying the eligibility criteria for certain share classes to increase their marketability to a portion of the defined contribution plan market; (x) waiving redemption fees for certain qualified fund-of-fund and wrap programs and certain retirement plan transactions; and (xi) launching new Institutional Class shares of certain money market funds to attract and retain assets and to fill a gap in the money market fund lineup.
Annual Report
Investment Performance. The Board considered whether the fund has operated in accordance with its investment objective, as well as its record of compliance with its investment restrictions and its performance history.
The Board took into account discussions with the Investment Advisers about fund investment performance that occur at Board meetings throughout the year. In this regard the Board noted that as part of regularly scheduled fund reviews and other reports to the Board on fund performance, the Board periodically considers annualized return information for the fund, for different time periods, measured against a securities market index ("benchmark index") and a peer group of funds with similar objectives ("peer group"). In its evaluation of fund investment performance, the Board gave particular attention to information indicating changes in performance of certain Fidelity funds for specific time periods and the Investment Advisers' explanations for any overperformance or underperformance.
In addition to reviewing absolute and relative fund performance, the Independent Trustees periodically consider the appropriateness of fund performance metrics in evaluating the results achieved. In general, the Independent Trustees believe that fund performance should be evaluated based on net performance (after fees and expenses) of both the highest performing and lowest performing classes, where applicable, compared to appropriate benchmark indices, over appropriate time periods which may include full market cycles, and compared to peer groups, as applicable, over the same periods, taking into account relevant factors including the following: general market conditions; issuer-specific information; tactical opportunities for investment; and fund cash flows and other factors.
The Independent Trustees recognize that shareholders evaluate performance on a net basis over their own holding periods, for which one-, three-, and five-year periods are often used as a proxy. For this reason, the performance information reviewed by the Board also included net cumulative calendar year total return information for the fund and an appropriate benchmark index and peer group for the most recent one-, three-, and five-year periods, as shown below. Returns are shown compared to the 25th percentile (top of box, 75% beaten) and 75th percentile (bottom of box, 25% beaten) of the peer universe.
Annual Report
Board Approval of Investment Advisory Contracts and
Management Fees - continued
Fidelity Growth & Income Portfolio
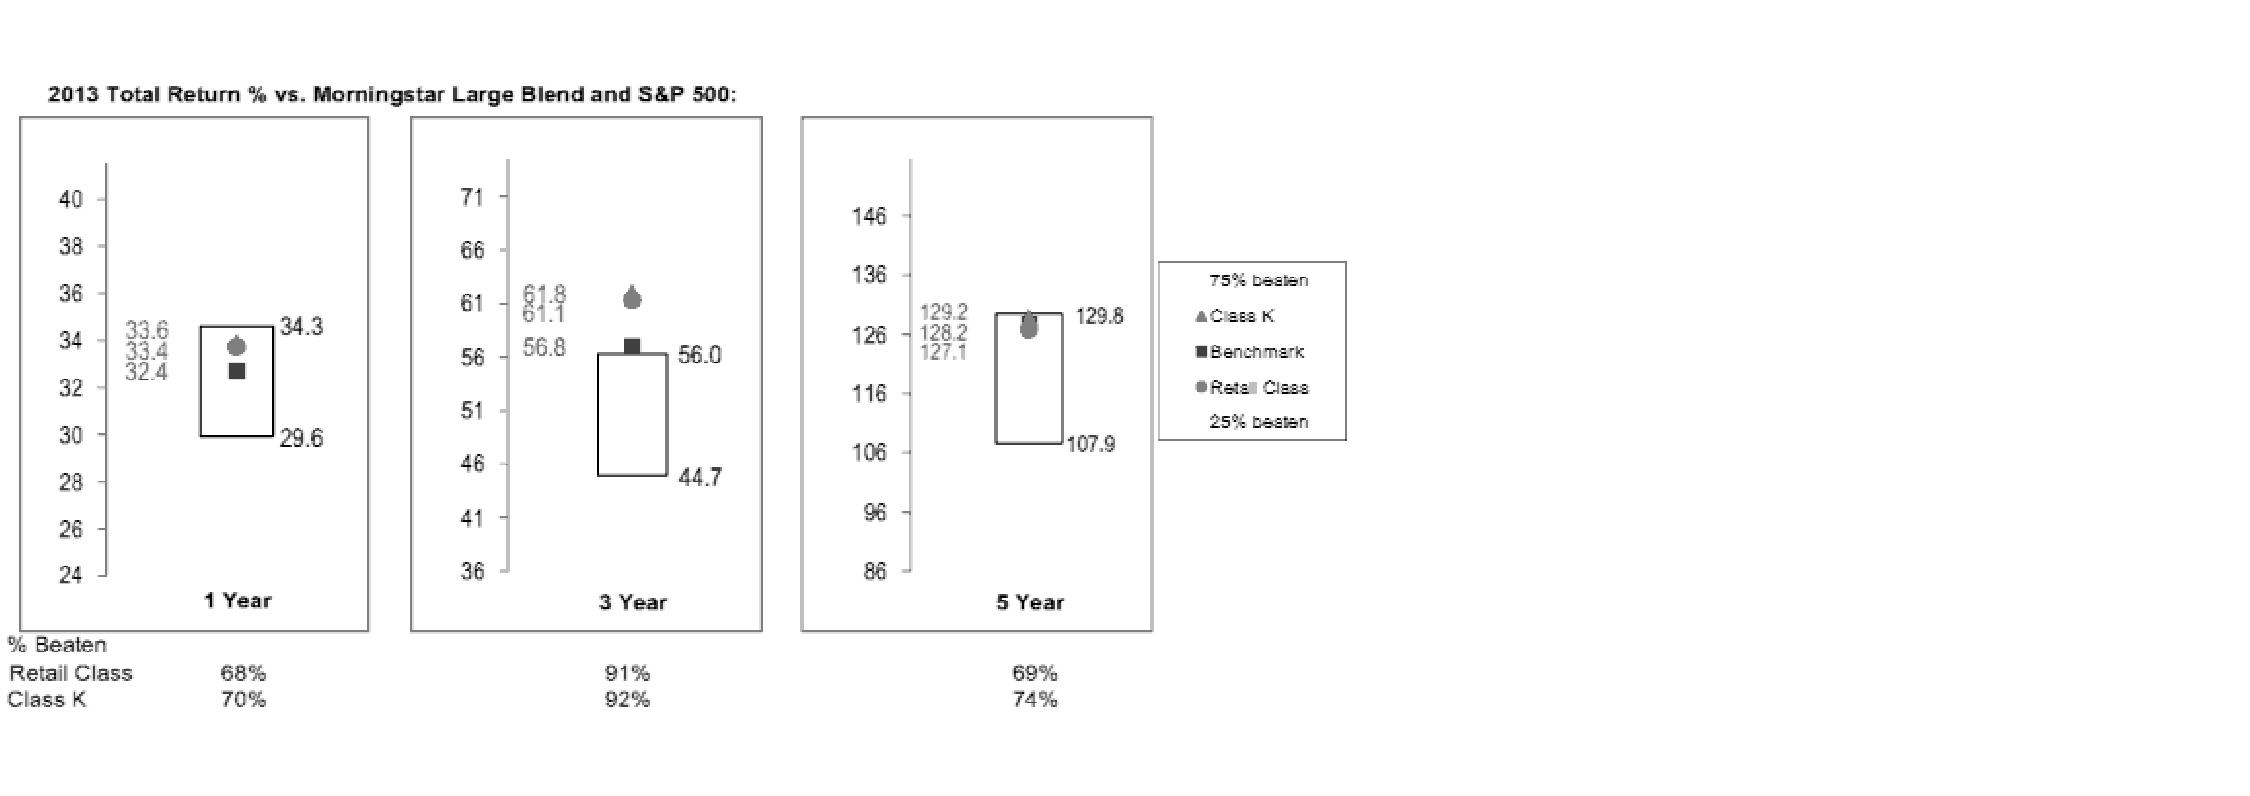
Based on its review, the Board concluded that the nature, extent, and quality of services provided to the fund under the Advisory Contracts should benefit the fund's shareholders.
Competitiveness of Management Fee and Total Expense Ratio. The Board considered the fund's management fee and total expense ratio compared to "mapped groups" of competitive funds and classes. Fidelity creates "mapped groups" by combining similar Lipper investment objective categories that have comparable investment mandates. Combining Lipper investment objective categories aids the Board's management fee and total expense ratio comparisons by broadening the competitive group used for comparison and by reducing the number of universes to which various Fidelity funds are compared.
Management Fee. The Board considered two proprietary management fee comparisons for the 12-month periods shown in the chart below. The group of Lipper funds used by the Board for management fee comparisons is referred to below as the "Total Mapped Group." The Total Mapped Group comparison focuses on a fund's standing in terms of gross management fees before expense reimbursements or caps relative to the total universe of funds with comparable investment mandates, regardless of whether their management fee structures also are comparable. Funds with comparable investment mandates offer exposure to similar types of securities. Funds with comparable management fee structures have similar management fee contractual arrangements (e.g., flat rate charged for advisory services, all-inclusive fee rate, etc.). "TMG %" represents the percentage of funds in the Total Mapped Group that had management fees that were lower than the fund's. For example, a hypothetical TMG % of 20% would mean that 80% of the funds in the Total Mapped Group had higher, and 20% had lower, management fees than the fund. The fund's actual TMG %s are in the chart below. The "Asset-Size Peer Group" (ASPG) comparison focuses on a fund's standing relative to a subset of non-Fidelity funds within the Total Mapped Group that are similar in size and management fee structure. For example, if a fund is in the first quartile of the ASPG, the fund's management fee ranks in the least expensive or lowest 25% of funds in the ASPG. The ASPG represents at least 15% of the funds in the Total Mapped Group with comparable asset size and management fee structures, subject to a minimum of 50 funds (or all funds in the Total Mapped Group if fewer than 50). Additional information, such as the ASPG quartile in which the fund's management fee rate ranked, is also included in the chart and considered by the Board.
Annual Report
Fidelity Growth & Income Portfolio

The Board noted that the fund's management fee rate ranked below the median of its Total Mapped Group and below the median of its ASPG for 2013.
The Board also noted that, in August 2013, the ad hoc Committee on Management Fees was formed to conduct an in-depth review of the management fee rates of Fidelity's active equity mutual funds. The Committee focused on the following areas: (i) standard fee structures; (ii) research consumption and trading evolution; (iii) management fee competitiveness/profitability by category; and (iv) factors that drive institutional pricing.
Based on its review, the Board concluded that the fund's management fee is fair and reasonable in light of the services that the fund receives and the other factors considered.
Annual Report
Board Approval of Investment Advisory Contracts and
Management Fees - continued
Total Expense Ratio. In its review of each class's total expense ratio, the Board considered the fund's management fee as well as other fund or class expenses, as applicable, such as transfer agent fees, pricing and bookkeeping fees, and custodial, legal, and audit fees. The Board also noted the effects of any waivers and reimbursements on fees and expenses. As part of its review, the Board also considered the current and historical total expense ratios of each class of the fund compared to competitive fund median expenses. Each class of the fund is compared to those funds and classes in the Total Mapped Group (used by the Board for management fee comparisons) that have a similar sales load structure.
The Board noted that the total expense ratio of each class ranked below its competitive median for 2013.
Fees Charged to Other Fidelity Clients. The Board also considered Fidelity fee structures and other information with respect to clients of Fidelity, such as other funds advised or subadvised by Fidelity, pension plan clients, and other institutional clients. The Board noted the findings of the 2013 ad hoc joint committee (created with the board of other Fidelity funds), which reviewed and compared Fidelity's institutional investment advisory business with its business of providing services to the Fidelity funds, including the differences in services provided, fees charged, and costs incurred, as well as competition in their respective marketplaces.
Based on its review of total expense ratios and fees charged to other Fidelity clients, the Board concluded that the total expense ratio of each class of the fund was reasonable in light of the services that the fund and its shareholders receive and the other factors considered.
Costs of the Services and Profitability. The Board considered the revenues earned and the expenses incurred by Fidelity in conducting the business of developing, marketing, distributing, managing, administering and servicing the fund and servicing the fund's shareholders. The Board also considered the level of Fidelity's profits in respect of all the Fidelity funds.
On an annual basis, Fidelity presents to the Board Fidelity's profitability for the fund. Fidelity calculates the profitability for each fund, as well as aggregate profitability for groups of Fidelity funds and all Fidelity funds, using a series of detailed revenue and cost allocation methodologies which originate with the books and records of Fidelity on which Fidelity's audited financial statements are based. The Audit Committee of the Board reviews any significant changes from the prior year's methodologies.
PricewaterhouseCoopers LLP (PwC), independent registered public accounting firm and auditor to Fidelity and certain Fidelity funds, has been engaged annually by the Board as part of the Board's assessment of Fidelity's profitability analysis. PwC's engagement includes the review and assessment of the methodologies used by Fidelity in determining the revenues and expenses attributable to Fidelity's mutual fund business, and completion of agreed-upon procedures in respect of the mathematical accuracy of fund profitability and its conformity to established allocation methodologies. After considering PwC's reports issued under the engagement and information provided by Fidelity, the Board concluded that while other allocation methods may also be reasonable, Fidelity's profitability methodologies are reasonable in all material respects.
Annual Report
The Board also reviewed Fidelity's non-fund businesses and fall-out benefits related to the mutual fund business as well as cases where Fidelity's affiliates may benefit from or be related to the fund's business.
The Board considered the costs of the services provided by and the profits realized by Fidelity in connection with the operation of the fund and was satisfied that the profitability was not excessive in the circumstances.
Economies of Scale. The Board considered whether there have been economies of scale in respect of the management of the Fidelity funds, whether the Fidelity funds (including the fund) have appropriately benefited from any such economies of scale, and whether there is potential for realization of any further economies of scale. The Board considered the extent to which the fund will benefit from economies of scale through increased services to the fund, through waivers or reimbursements, or through fee or expense ratio reductions. The Board also noted that in 2013, it and the boards of other Fidelity funds created an ad hoc committee (the Economies of Scale Committee) to analyze whether Fidelity attains economies of scale in respect of the management and servicing of the Fidelity funds, whether the Fidelity funds have appropriately benefited from such economies of scale, and whether there is potential for realization of any further economies of scale.
The Board recognized that the fund's management contract incorporates a "group fee" structure, which provides for lower group fee rates as total group assets increase, and for higher group fee rates as total group assets decrease (with "group assets" defined to include fund assets under FMR's management plus sector fund assets previously under FMR's management and currently managed by Fidelity SelectCo, LLC). FMR calculates the group fee rates based on a tiered asset "breakpoint" schedule that varies based on asset class. The Board considered that the group fee is designed to deliver the benefits of economies of scale to fund shareholders when total Fidelity fund assets increase, even if assets of any particular fund are unchanged or have declined, because some portion of Fidelity's costs are attributable to services provided to all Fidelity funds, and all funds benefit if those costs can be allocated among more assets. The Board concluded that, given the group fee structure, fund shareholders will benefit from lower management fees as group assets increase at the fund complex level, regardless of whether Fidelity achieves any such economies of scale.
Annual Report
Board Approval of Investment Advisory Contracts and
Management Fees - continued
The Board concluded, taking into account the analysis of the Economies of Scale Committee, that economies of scale, if any, are being appropriately shared between fund shareholders and Fidelity.
Additional Information Requested by the Board. In order to develop fully the factual basis for consideration of the Fidelity funds' Advisory Contracts, the Board requested and received additional information on certain topics, including: (i) fund performance trends and Fidelity's long-term strategies for certain funds; (ii) Fidelity's strategic marketing and product lineup goals; (iii) the methodology with respect to competitive fund data and peer group classifications; (iv) the arrangements with, and performance of, certain sub-advisers on behalf of the Fidelity funds, as well as certain proposed participating affiliate arrangements; (v) the realization of fall-out benefits in certain Fidelity business units; (vi) Fidelity's group fee structures, including the rationale for the individual fee rates of certain categories of funds and the definition of group assets; (vii) trends regarding industry use of performance fee structures and the performance adjustment methodologies applicable to the Fidelity funds; (viii) additional competitive analysis regarding the total expenses for certain classes; (ix) fund profitability methodology, including Fidelity's cost allocation methodology, and the impact of certain factors on fund profitability results; and (x) the process by which Fidelity determines sub-advisory fees for funds it advises.
Based on its evaluation of all of the conclusions noted above, and after considering all factors it believed relevant, the Board ultimately concluded that the advisory fee structures are fair and reasonable, and that the fund's Advisory Contracts should be renewed.
Annual Report
Investment Adviser
Fidelity Management & Research Company
Boston, MA
Investment Sub-Advisers
FMR Co., Inc.
Fidelity Management & Research
(U.K.) Inc.
Fidelity Management & Research
(Japan) Inc.
Fidelity Management & Research
(Hong Kong) Limited
General Distributor
Fidelity Distributors Corporation
Smithfield, RI
Transfer and Service Agents
Fidelity Investments Institutional
Operations Company, Inc.
Boston, MA
Fidelity Service Company, Inc.
Boston, MA
Custodian
Northern Trust Company
Chicago, IL
The Fidelity Telephone Connection
Mutual Fund 24-Hour Service
Exchanges/Redemptions
and Account Assistance 1-800-544-6666
Product Information 1-800-544-6666
Retirement Accounts 1-800-544-4774
(8 a.m. - 9 p.m.)
TDD Service 1-800-544-0118
for the deaf and hearing impaired
(9 a.m. - 9 p.m. Eastern time)
Fidelity Automated Service
Telephone (FAST ®)
1-800-544-8544
Automated line for quickest service
(Fidelity Investment logo)(registered trademark)
Corporate Headquarters
245 Summer St., Boston, MA 02210
www.fidelity.com
GAI-UANN-0914
1.874515.106
Fidelity®
Growth & Income
Portfolio -
Class K
Annual Report
July 31, 2014
(Fidelity Cover Art)
Contents
Performance | (Click Here) | How the fund has done over time. |
Management's Discussion of Fund Performance | (Click Here) | The Portfolio Manager's review of fund performance and strategy. |
Shareholder Expense Example | (Click Here) | An example of shareholder expenses. |
Investment Changes | (Click Here) | A summary of major shifts in the fund's investments over the past six months. |
Investments | (Click Here) | A complete list of the fund's investments with their market values. |
Financial Statements | (Click Here) | Statements of assets and liabilities, operations, and changes in net assets, as well as financial highlights. |
Notes | (Click Here) | Notes to the financial statements. |
Report of Independent Registered Public Accounting Firm | (Click Here) | |
Trustees and Officers | (Click Here) | |
Distributions | (Click Here) | |
Board Approval of Investment Advisory Contracts and Management Fees | (Click Here) | |
To view a fund's proxy voting guidelines and proxy voting record for the 12-month period ended June 30, visit http://www.fidelity.com/proxyvotingresults or visit the Securities and Exchange Commission's (SEC) web site at http://www.sec.gov. You may also call 1-800-835-5092 to request a free copy of the proxy voting guidelines.
Standard & Poor's, S&P and S&P 500 are registered service marks of The McGraw-Hill Companies, Inc. and have been licensed for use by Fidelity Distributors Corporation.
Other third-party marks appearing herein are the property of their respective owners.
All other marks appearing herein are registered or unregistered trademarks or service marks of FMR LLC or an affiliated company. © 2014 FMR LLC. All rights reserved.
Annual Report
This report and the financial statements contained herein are submitted for the general information of the shareholders of the fund. This report is not authorized for distribution to prospective investors in the fund unless preceded or accompanied by an effective prospectus.
A fund files its complete schedule of portfolio holdings with the SEC for the first and third quarters of each fiscal year on Form N-Q. Forms N-Q are available on the SEC's web site at http://www.sec.gov. A fund's Forms N-Q may be reviewed and copied at the SEC's Public Reference Room in Washington, DC. Information regarding the operation of the SEC's Public Reference Room may be obtained by calling 1-800-SEC-0330. For a complete list of a fund's portfolio holdings, view the most recent holdings listing, semiannual report, or annual report on Fidelity's web site at http://www.fidelity.com, http://www.advisor.fidelity.com, or http://www.401k.com, as applicable.
NOT FDIC INSURED • MAY LOSE VALUE • NO BANK GUARANTEE
Neither the fund nor Fidelity Distributors Corporation is a bank.
Annual Report
Average annual total return reflects the change in the value of an investment, assuming reinvestment of the class' distributions from dividend income and capital gains (the profits earned upon the sale of securities that have grown in value, if any) and assuming a constant rate of performance each year. The $10,000 table and the fund's returns do not reflect the deduction of taxes that a shareholder would pay on fund distributions or the redemption of fund shares. During periods of reimbursement by Fidelity, a fund's total return will be greater than it would be had the reimbursement not occurred. How a fund did yesterday is no guarantee of how it will do tomorrow.
Average Annual Total Returns
Periods ended July 31, 2014 | Past 1
year | Past 5
years | Past 10
years |
Class K A | 15.32% | 16.99% | 4.07% |
A The initial offering of Class K shares took place on May 9, 2008. Returns prior to May 9, 2008, are those of Fidelity® Growth & Income Portfolio, the original class of the fund.
$10,000 Over 10 Years
Let's say hypothetically that $10,000 was invested in Fidelity® Growth & Income Portfolio - Class K on July 31, 2004. The chart shows how the value of your investment would have changed, and also shows how the S&P 500® Index performed over the same period. The initial offering of Class K took place on May 9, 2008. See above for additional information regarding the performance of Class K.

Annual Report
Market Recap: U.S. stocks overcame a slowing economy early in 2014 to post a strong gain for the 12-month period ending July 31, 2014, supported by corporate profits and continued low interest rates. The S&P 500® Index rose 16.94%, reaching an all-time high near period end. The technology-heavy Nasdaq Composite Index® gained 22.00%. The Russell 2000® Index returned 8.56%, reflecting the relatively lackluster performance of small-cap stocks. Information technology (+28%) was the top-performing sector within the S&P 500®, driven by strong semiconductor and computer hardware sales. Materials (+23%) gained amid higher prices for many commodity products. Health care (+21%) rose, driven by gains in pharmaceuticals, biotechnology & life sciences companies. Energy stocks (+19%) advanced in the latter part of the period amid healthy U.S. output and the threat of supply disruptions in Iraq. Conversely, most defensive sectors, including consumer staples, utilities and telecommunication services, lagged the broader market. Volatility remained tame throughout most of the period, with markets supported by declining unemployment, near-record profit margins for companies, muted cost inflation and fairly low corporate debt levels. Geopolitical tension remained a concern at period end, with conflict in Ukraine and strained relations between Russia and the West posing a potential threat to global growth.
Comments from Matthew Fruhan, Portfolio Manager of Fidelity® Growth & Income Fund: For the year, the fund's Class K shares returned 15.32%, underperforming the S&P 500®. Relative to the index, it hurt the most to overweight big-box retailer Target, which was among the fund's biggest holdings. The lingering effects of the firm's troubled expansion into Canada and a holiday-season credit breach continued to weigh on the stock, but this weak stretch allowed me to add to it at an attractive valuation. My picks in industrials and consumer discretionary were weak. We had some financials stocks place among our biggest individual detractors, including investment banks Citigroup and JPMorgan Chase, both of which were among the fund's biggest holdings. Conversely, stock selection in consumer staples helped the most, especially drugstore chain Walgreen, while an overweight in tobacco stocks benefited the fund. Lorillard was a top relative contributor here. Picks in energy also added value, most notably an overweight in the outperforming shares of natural gas pipeline firm Williams Companies.
The views expressed above reflect those of the portfolio manager(s) only through the end of the period as stated on the cover of this report and do not necessarily represent the views of Fidelity or any other person in the Fidelity organization. Any such views are subject to change at any time based upon market or other conditions and Fidelity disclaims any responsibility to update such views. These views may not be relied on as investment advice and, because investment decisions for a Fidelity fund are based on numerous factors, may not be relied on as an indication of trading intent on behalf of any Fidelity fund.
Annual Report
Shareholder Expense Example
As a shareholder of the Fund, you incur two types of costs: (1) transaction costs and (2) ongoing costs, including management fees and other Fund expenses. This Example is intended to help you understand your ongoing costs (in dollars) of investing in the Fund and to compare these costs with the ongoing costs of investing in other mutual funds.
The Example is based on an investment of $1,000 invested at the beginning of the period and held for the entire period (February 1, 2014 to July 31, 2014).
Actual Expenses
The first line of the accompanying table for each class of the Fund provides information about actual account values and actual expenses. You may use the information in this line, together with the amount you invested, to estimate the expenses that you paid over the period. Simply divide your account value by $1,000.00 (for example, an $8,600 account value divided by $1,000.00 = 8.6), then multiply the result by the number in the first line for a class of the Fund under the heading entitled "Expenses Paid During Period" to estimate the expenses you paid on your account during this period. A small balance maintenance fee of $12.00 that is charged once a year may apply for certain accounts with a value of less than $2,000. This fee is not included in the table below. If it was, the estimate of expenses you paid during the period would be higher, and your ending account value lower, by this amount. In addition, the Fund, as a shareholder in the underlying Fidelity Central Funds, will indirectly bear its pro-rata share of the fees and expenses incurred by the underlying Fidelity Central Funds. These fees and expenses are not included in the Fund's annualized expense ratio used to calculate the expense estimate in the table below.
Hypothetical Example for Comparison Purposes
The second line of the accompanying table for each class of the Fund provides information about hypothetical account values and hypothetical expenses based on a Class' actual expense ratio and an assumed rate of return of 5% per year before expenses, which is not the Class' actual return. The hypothetical account values and expenses may not be used to estimate the actual ending account balance or expenses you paid for the period. You may use this information to compare the ongoing costs of investing in the Fund and other funds. To do so, compare this 5% hypothetical example with the 5% hypothetical examples that appear in the shareholder reports of the other funds. A small balance maintenance fee of $12.00 that is charged once a year may apply for certain accounts with a value of less than $2,000. This fee is not included in the table below. If it was, the estimate of expenses you paid during the period would be higher, and your ending account value lower, by this amount. In addition, the Fund, as a shareholder in the underlying Fidelity Central Funds, will indirectly bear its pro-rata share of the fees and expenses incurred by the underlying Fidelity Central Funds. These fees and expenses are not included in the Fund's annualized expense ratio used to calculate the expense estimate in the table below.
Please note that the expenses shown in the table are meant to highlight your ongoing costs only and do not reflect any transaction costs. Therefore, the second line of the table is useful in comparing ongoing costs only, and will not help you determine the relative total costs of owning different funds.
Annual Report
| Annualized
Expense Ratio B | Beginning
Account Value
February 1, 2014 | Ending
Account Value
July 31, 2014 | Expenses Paid
During Period*
February 1, 2014
to July 31, 2014 |
Growth and Income | .64% | | | |
Actual | | $ 1,000.00 | $ 1,098.10 | $ 3.33 |
Hypothetical A | | $ 1,000.00 | $ 1,021.62 | $ 3.21 |
Class K | .52% | | | |
Actual | | $ 1,000.00 | $ 1,098.80 | $ 2.71 |
Hypothetical A | | $ 1,000.00 | $ 1,022.22 | $ 2.61 |
A 5% return per year before expenses
B Annualized expense ratio reflects expenses net of applicable fee waivers.
* Expenses are equal to each Class' annualized expense ratio, multiplied by the average account value over the period, multiplied by 181/365 (to reflect the one-half year period).
Annual Report
Investment Changes (Unaudited)
Top Ten Stocks as of July 31, 2014 |
| % of fund's
net assets | % of fund's net assets
6 months ago |
JPMorgan Chase & Co. | 4.0 | 3.8 |
Apple, Inc. | 3.9 | 3.5 |
Microsoft Corp. | 3.2 | 3.0 |
General Electric Co. | 3.0 | 3.0 |
Chevron Corp. | 2.8 | 2.5 |
Citigroup, Inc. | 2.2 | 2.1 |
Verizon Communications, Inc. | 2.1 | 1.4 |
Target Corp. | 2.0 | 1.8 |
Comcast Corp. Class A | 2.0 | 1.9 |
Procter & Gamble Co. | 1.8 | 1.9 |
| 27.0 | |
Top Five Market Sectors as of July 31, 2014 |
| % of fund's
net assets | % of fund's net assets
6 months ago |
Information Technology | 19.9 | 19.6 |
Financials | 19.6 | 19.3 |
Consumer Staples | 11.9 | 12.3 |
Industrials | 11.5 | 11.2 |
Energy | 10.9 | 11.4 |
Asset Allocation (% of fund's net assets) |
As of July 31, 2014* | As of January 31, 2014** |
| Stocks 98.8% | | | Stocks 98.9% | |
| Convertible
Securities 1.0% | | | Convertible
Securities 1.1% | |
| Other Investments 0.0% | | | Other Investments 0.1% | |
| Short-Term
Investments and
Net Other Assets (Liabilities) 0.2% | | | Short-Term
Investments and
Net Other Assets (Liabilities) (0.1)%† | |
* Foreign investments | 12.9% | | ** Foreign investments | 13.0% | |

† Short-Term Investments and Net Other Assets (Liabilities) are not included in the pie chart.
Annual Report
Investments July 31, 2014
Showing Percentage of Net Assets
Common Stocks - 98.8% |
| Shares | | Value (000s) |
CONSUMER DISCRETIONARY - 10.3% |
Automobiles - 0.1% |
General Motors Co. | 159,300 | | $ 5,388 |
Diversified Consumer Services - 0.4% |
H&R Block, Inc. | 816,207 | | 26,225 |
Hotels, Restaurants & Leisure - 1.7% |
Darden Restaurants, Inc. | 606,500 | | 28,354 |
Domino's Pizza, Inc. | 62,500 | | 4,500 |
McDonald's Corp. | 413,061 | | 39,059 |
Yum! Brands, Inc. | 814,244 | | 56,509 |
| | 128,422 |
Household Durables - 0.1% |
Tupperware Brands Corp. | 153,700 | | 11,186 |
Media - 3.9% |
Comcast Corp. Class A | 2,739,400 | | 147,188 |
Lamar Advertising Co. Class A | 125,900 | | 6,314 |
Scripps Networks Interactive, Inc. Class A | 97,689 | | 8,051 |
Sinclair Broadcast Group, Inc. Class A (e) | 902,261 | | 29,152 |
Time Warner, Inc. | 1,093,217 | | 90,759 |
Viacom, Inc. Class B (non-vtg.) | 117,000 | | 9,672 |
| | 291,136 |
Multiline Retail - 2.0% |
Target Corp. | 2,582,025 | | 153,863 |
Specialty Retail - 2.0% |
DSW, Inc. Class A | 457,900 | | 12,176 |
Lewis Group Ltd. | 461,269 | | 2,732 |
Lowe's Companies, Inc. | 2,134,479 | | 102,135 |
Sally Beauty Holdings, Inc. (a) | 365,600 | | 9,487 |
Staples, Inc. | 609,840 | | 7,068 |
TJX Companies, Inc. | 252,000 | | 13,429 |
| | 147,027 |
Textiles, Apparel & Luxury Goods - 0.1% |
adidas AG | 88,800 | | 7,064 |
TOTAL CONSUMER DISCRETIONARY | | 770,311 |
CONSUMER STAPLES - 11.9% |
Beverages - 3.5% |
Diageo PLC | 786,029 | | 23,606 |
Molson Coors Brewing Co. Class B | 294,212 | | 19,868 |
PepsiCo, Inc. | 712,014 | | 62,728 |
Common Stocks - continued |
| Shares | | Value (000s) |
CONSUMER STAPLES - continued |
Beverages - continued |
Pernod Ricard SA | 63,200 | | $ 7,083 |
SABMiller PLC | 555,948 | | 30,392 |
The Coca-Cola Co. | 2,964,403 | | 116,471 |
| | 260,148 |
Food & Staples Retailing - 1.5% |
CVS Caremark Corp. | 592,104 | | 45,213 |
Kroger Co. | 476,771 | | 23,352 |
Walgreen Co. | 693,484 | | 47,691 |
| | 116,256 |
Food Products - 0.4% |
Kellogg Co. | 543,354 | | 32,509 |
Household Products - 1.9% |
Procter & Gamble Co. | 1,709,215 | | 132,157 |
Svenska Cellulosa AB (SCA) (B Shares) | 378,091 | | 9,345 |
| | 141,502 |
Tobacco - 4.6% |
British American Tobacco PLC sponsored ADR | 1,075,923 | | 126,313 |
Lorillard, Inc. | 1,651,897 | | 99,907 |
Philip Morris International, Inc. | 942,771 | | 77,317 |
Reynolds American, Inc. | 743,000 | | 41,497 |
| | 345,034 |
TOTAL CONSUMER STAPLES | | 895,449 |
ENERGY - 10.7% |
Energy Equipment & Services - 1.0% |
Ensco PLC Class A | 479,623 | | 24,293 |
National Oilwell Varco, Inc. | 48,200 | | 3,906 |
Oceaneering International, Inc. | 129,200 | | 8,774 |
Schlumberger Ltd. | 345,032 | | 37,398 |
| | 74,371 |
Oil, Gas & Consumable Fuels - 9.7% |
Access Midstream Partners LP | 193,533 | | 11,655 |
Apache Corp. | 577,268 | | 59,262 |
BG Group PLC | 3,318,464 | | 65,438 |
Canadian Natural Resources Ltd. | 820,700 | | 35,776 |
Chevron Corp. | 1,603,396 | | 207,223 |
EQT Midstream Partners LP | 76,600 | | 6,629 |
EV Energy Partners LP | 67,900 | | 2,489 |
Common Stocks - continued |
| Shares | | Value (000s) |
ENERGY - continued |
Oil, Gas & Consumable Fuels - continued |
Exxon Mobil Corp. | 190,011 | | $ 18,800 |
Golar LNG Ltd. | 185,400 | | 11,422 |
Imperial Oil Ltd. | 788,100 | | 40,440 |
Magellan Midstream Partners LP | 7,221 | | 579 |
Markwest Energy Partners LP | 873,982 | | 61,004 |
MPLX LP | 81,109 | | 4,603 |
Occidental Petroleum Corp. | 467,216 | | 45,652 |
Peabody Energy Corp. | 428,600 | | 6,502 |
PrairieSky Royalty Ltd. | 30,100 | | 1,088 |
Suncor Energy, Inc. | 1,817,150 | | 74,613 |
The Williams Companies, Inc. | 1,229,572 | | 69,631 |
Western Gas Partners LP | 100,800 | | 7,470 |
| | 730,276 |
TOTAL ENERGY | | 804,647 |
FINANCIALS - 19.6% |
Banks - 11.5% |
Bank of America Corp. | 8,004,656 | | 122,071 |
Citigroup, Inc. | 3,341,430 | | 163,429 |
JPMorgan Chase & Co. | 5,232,492 | | 301,750 |
M&T Bank Corp. | 95,560 | | 11,611 |
PNC Financial Services Group, Inc. | 590,154 | | 48,723 |
Standard Chartered PLC (United Kingdom) | 3,334,159 | | 69,350 |
SunTrust Banks, Inc. | 576,066 | | 21,919 |
U.S. Bancorp | 1,300,973 | | 54,680 |
Wells Fargo & Co. | 1,383,141 | | 70,402 |
| | 863,935 |
Capital Markets - 4.8% |
Apollo Investment Corp. | 426,403 | | 3,620 |
Ares Capital Corp. | 318,300 | | 5,319 |
Artisan Partners Asset Management, Inc. | 156,100 | | 8,133 |
BlackRock, Inc. Class A | 25,500 | | 7,771 |
Carlyle Group LP | 232,900 | | 7,774 |
Charles Schwab Corp. | 2,434,743 | | 67,564 |
Invesco Ltd. | 167,200 | | 6,292 |
KKR & Co. LP | 2,044,543 | | 46,861 |
Morgan Stanley | 1,617,397 | | 52,307 |
Northern Trust Corp. | 750,964 | | 50,232 |
Common Stocks - continued |
| Shares | | Value (000s) |
FINANCIALS - continued |
Capital Markets - continued |
State Street Corp. | 1,275,227 | | $ 89,827 |
The Blackstone Group LP | 447,700 | | 14,631 |
| | 360,331 |
Diversified Financial Services - 0.7% |
IntercontinentalExchange Group, Inc. | 164,217 | | 31,566 |
TPG Specialty Lending, Inc. (e) | 944,400 | | 18,293 |
| | 49,859 |
Insurance - 1.6% |
Arthur J. Gallagher & Co. | 252,600 | | 11,367 |
Brown & Brown, Inc. | 123,600 | | 3,804 |
Marsh & McLennan Companies, Inc. | 350,646 | | 17,802 |
MetLife, Inc. | 1,295,689 | | 68,153 |
MetLife, Inc. unit | 301,200 | | 9,111 |
Ping An Insurance (Group) Co. of China Ltd. (H Shares) | 64,000 | | 544 |
Principal Financial Group, Inc. | 201,200 | | 9,996 |
| | 120,777 |
Real Estate Investment Trusts - 0.8% |
American Homes 4 Rent (f) | 258,675 | | 4,713 |
CBL & Associates Properties, Inc. | 996,509 | | 18,635 |
First Potomac Realty Trust | 193,418 | | 2,551 |
Gaming & Leisure Properties | 101,300 | | 3,411 |
Sun Communities, Inc. | 586,614 | | 30,873 |
| | 60,183 |
Thrifts & Mortgage Finance - 0.2% |
Radian Group, Inc. | 1,140,368 | | 14,437 |
TOTAL FINANCIALS | | 1,469,522 |
HEALTH CARE - 9.3% |
Biotechnology - 1.3% |
Amgen, Inc. | 709,903 | | 90,435 |
Intercept Pharmaceuticals, Inc. (a) | 19,026 | | 4,421 |
| | 94,856 |
Health Care Equipment & Supplies - 1.1% |
Abbott Laboratories | 496,504 | | 20,913 |
Ansell Ltd. | 266,311 | | 4,675 |
ResMed, Inc. (e) | 265,167 | | 13,720 |
Steris Corp. | 31,135 | | 1,584 |
Common Stocks - continued |
| Shares | | Value (000s) |
HEALTH CARE - continued |
Health Care Equipment & Supplies - continued |
Stryker Corp. | 271,842 | | $ 21,685 |
Zimmer Holdings, Inc. | 179,510 | | 17,964 |
| | 80,541 |
Health Care Providers & Services - 1.7% |
Cardinal Health, Inc. | 282,300 | | 20,227 |
Fresenius Medical Care AG & Co. KGaA | 117,800 | | 8,166 |
McKesson Corp. | 317,887 | | 60,990 |
Patterson Companies, Inc. | 403,970 | | 15,759 |
Quest Diagnostics, Inc. | 420,384 | | 25,685 |
| | 130,827 |
Health Care Technology - 0.0% |
Quality Systems, Inc. | 49,491 | | 768 |
Pharmaceuticals - 5.2% |
AbbVie, Inc. | 688,401 | | 36,031 |
Astellas Pharma, Inc. | 1,082,900 | | 14,685 |
GlaxoSmithKline PLC sponsored ADR | 1,508,322 | | 72,958 |
Johnson & Johnson | 1,061,069 | | 106,202 |
Merck & Co., Inc. | 522,038 | | 29,620 |
Novartis AG sponsored ADR | 487,044 | | 42,344 |
Sanofi SA | 199,144 | | 20,908 |
Teva Pharmaceutical Industries Ltd. sponsored ADR | 1,060,120 | | 56,716 |
Zoetis, Inc. Class A | 294,300 | | 9,685 |
| | 389,149 |
TOTAL HEALTH CARE | | 696,141 |
INDUSTRIALS - 11.5% |
Aerospace & Defense - 2.0% |
Meggitt PLC | 2,408,100 | | 20,674 |
Rolls-Royce Group PLC | 889,900 | | 15,625 |
The Boeing Co. | 593,189 | | 71,467 |
United Technologies Corp. | 390,282 | | 41,038 |
| | 148,804 |
Air Freight & Logistics - 1.8% |
C.H. Robinson Worldwide, Inc. | 415,973 | | 28,062 |
PostNL NV (a) | 2,367,500 | | 11,853 |
United Parcel Service, Inc. Class B | 968,004 | | 93,984 |
| | 133,899 |
Common Stocks - continued |
| Shares | | Value (000s) |
INDUSTRIALS - continued |
Airlines - 0.1% |
Copa Holdings SA Class A | 21,600 | | $ 3,280 |
Commercial Services & Supplies - 0.6% |
ADT Corp. (e) | 804,210 | | 27,987 |
KAR Auction Services, Inc. | 520,300 | | 15,250 |
Ritchie Brothers Auctioneers, Inc. | 21,840 | | 529 |
| | 43,766 |
Electrical Equipment - 0.4% |
General Cable Corp. | 144,858 | | 3,220 |
Hubbell, Inc. Class B | 209,139 | | 24,457 |
| | 27,677 |
Industrial Conglomerates - 3.0% |
General Electric Co. | 9,043,780 | | 227,451 |
Machinery - 0.2% |
Deere & Co. | 135,800 | | 11,558 |
Stanley Black & Decker, Inc. | 33,000 | | 2,886 |
Valmont Industries, Inc. | 15,200 | | 2,214 |
| | 16,658 |
Professional Services - 0.4% |
Acacia Research Corp. | 514,902 | | 8,784 |
Bureau Veritas SA | 828,877 | | 21,366 |
Exova Group Ltd. PLC (a) | 774,000 | | 3,019 |
| | 33,169 |
Road & Rail - 2.3% |
CSX Corp. | 2,458,920 | | 73,571 |
J.B. Hunt Transport Services, Inc. | 584,445 | | 45,154 |
Kansas City Southern | 80,100 | | 8,736 |
Norfolk Southern Corp. | 350,899 | | 35,672 |
TransForce, Inc. | 490,400 | | 12,400 |
| | 175,533 |
Trading Companies & Distributors - 0.7% |
Beijer Ref AB Series B | 30,255 | | 640 |
Brenntag AG | 18,100 | | 2,914 |
W.W. Grainger, Inc. | 104,707 | | 24,622 |
Watsco, Inc. | 270,892 | | 24,264 |
| | 52,440 |
TOTAL INDUSTRIALS | | 862,677 |
Common Stocks - continued |
| Shares | | Value (000s) |
INFORMATION TECHNOLOGY - 19.9% |
Communications Equipment - 2.4% |
Cisco Systems, Inc. | 4,721,552 | | $ 119,125 |
QUALCOMM, Inc. | 862,846 | | 63,592 |
| | 182,717 |
Internet Software & Services - 3.0% |
Google, Inc.: | | | |
Class A (a) | 171,507 | | 99,397 |
Class C (a) | 152,207 | | 87,002 |
Yahoo!, Inc. (a) | 1,065,395 | | 38,152 |
| | 224,551 |
IT Services - 4.9% |
Amadeus IT Holding SA Class A | 34,000 | | 1,343 |
Cognizant Technology Solutions Corp. Class A (a) | 648,572 | | 31,812 |
Computer Sciences Corp. | 510,906 | | 31,875 |
Fidelity National Information Services, Inc. | 375,436 | | 21,175 |
IBM Corp. | 209,704 | | 40,194 |
MasterCard, Inc. Class A | 892,600 | | 66,186 |
Paychex, Inc. | 2,152,757 | | 88,285 |
Quindell PLC | 1,310,646 | | 4,536 |
The Western Union Co. | 984,180 | | 17,194 |
Visa, Inc. Class A | 334,371 | | 70,556 |
| | 373,156 |
Semiconductors & Semiconductor Equipment - 1.6% |
Applied Materials, Inc. | 2,195,949 | | 46,027 |
Broadcom Corp. Class A | 1,632,982 | | 62,478 |
Maxim Integrated Products, Inc. | 365,453 | | 10,711 |
| | 119,216 |
Software - 3.4% |
Microsoft Corp. | 5,576,199 | | 240,669 |
Oracle Corp. | 320,453 | | 12,943 |
| | 253,612 |
Technology Hardware, Storage & Peripherals - 4.6% |
Apple, Inc. | 3,071,194 | | 293,514 |
EMC Corp. | 1,015,891 | | 29,766 |
First Data Holdings, Inc. Class B (h) | 5,155,476 | | 20,622 |
| | 343,902 |
TOTAL INFORMATION TECHNOLOGY | | 1,497,154 |
Common Stocks - continued |
| Shares | | Value (000s) |
MATERIALS - 3.5% |
Chemicals - 3.0% |
Airgas, Inc. | 391,706 | | $ 41,881 |
E.I. du Pont de Nemours & Co. | 370,246 | | 23,811 |
FMC Corp. | 331,382 | | 21,613 |
Johnson Matthey PLC | 142,295 | | 7,109 |
Methanex Corp. | 123,800 | | 8,057 |
Monsanto Co. | 564,015 | | 63,784 |
Potash Corp. of Saskatchewan, Inc. | 178,900 | | 6,351 |
Royal DSM NV | 186,700 | | 12,920 |
Syngenta AG (Switzerland) | 88,908 | | 31,496 |
Tronox Ltd. Class A | 221,600 | | 5,881 |
Westlake Chem Partners LP (a) | 14,200 | | 431 |
| | 223,334 |
Metals & Mining - 0.5% |
Freeport-McMoRan Copper & Gold, Inc. | 1,037,600 | | 38,619 |
SunCoke Energy Partners LP | 104,383 | | 3,282 |
| | 41,901 |
TOTAL MATERIALS | | 265,235 |
TELECOMMUNICATION SERVICES - 2.1% |
Diversified Telecommunication Services - 2.1% |
Verizon Communications, Inc. | 3,093,474 | | 155,973 |
TOTAL COMMON STOCKS (Cost $5,970,352) |
7,417,109
|
Convertible Preferred Stocks - 0.8% |
| | | |
CONSUMER DISCRETIONARY - 0.0% |
Leisure Products - 0.0% |
NJOY, Inc. Series D (h) | 68,794 | | 1,164 |
HEALTH CARE - 0.8% |
Health Care Equipment & Supplies - 0.8% |
Alere, Inc. 3.00% | 185,143 | | 61,629 |
TOTAL CONVERTIBLE PREFERRED STOCKS (Cost $46,947) |
62,793
|
Convertible Bonds - 0.2% |
| Principal
Amount (000s) (d) | | Value (000s) |
ENERGY - 0.2% |
Oil, Gas & Consumable Fuels - 0.2% |
Amyris, Inc.: | | | | |
3% 2/27/17 | | $ 5,615 | | $ 4,681 |
5% 10/15/18 (h) | | 2,870 | | 2,302 |
Peabody Energy Corp. 4.75% 12/15/41 | | 7,660 | | 5,477 |
TOTAL CONVERTIBLE BONDS (Cost $14,440) |
12,460
|
Preferred Securities - 0.0% |
|
FINANCIALS - 0.0% |
Diversified Financial Services - 0.0% |
Baggot Securities Ltd. 10.24% (f)(g) (Cost $4,623) | EUR | 3,010 | |
4,543
|
Money Market Funds - 0.6% |
| Shares | | |
Fidelity Cash Central Fund, 0.11% (b) | 7,094,792 | | 7,095 |
Fidelity Securities Lending Cash Central Fund, 0.11% (b)(c) | 37,662,951 | | 37,663 |
TOTAL MONEY MARKET FUNDS (Cost $44,758) |
44,758
|
TOTAL INVESTMENT PORTFOLIO - 100.4% (Cost $6,081,120) | | 7,541,663 |
NET OTHER ASSETS (LIABILITIES) - (0.4)% | | (31,988) |
NET ASSETS - 100% | $ 7,509,675 |
Currency Abbreviations |
EUR | - | European Monetary Unit |
Legend |
(a) Non-income producing |
(b) Affiliated fund that is generally available only to investment companies and other accounts managed by Fidelity Investments. The rate quoted is the annualized seven-day yield of the fund at period end. A complete unaudited listing of the fund's holdings as of its most recent quarter end is available upon request. In addition, each Fidelity Central Fund's financial statements, which are not covered by the Fund's Report of Independent Registered Public Accounting Firm, are available on the SEC's website or upon request. |
(c) Investment made with cash collateral received from securities on loan. |
(d) Amount is stated in United States dollars unless otherwise noted. |
(e) Security or a portion of the security is on loan at period end. |
(f) Security exempt from registration under Rule 144A of the Securities Act of 1933. These securities may be resold in transactions exempt from registration, normally to qualified institutional buyers. At the end of the period, the value of these securities amounted to $9,256,000 or 0.1% of net assets. |
(g) Security is perpetual in nature with no stated maturity date. |
(h) Restricted securities - Investment in securities not registered under the Securities Act of 1933 (excluding 144A issues). At the end of the period, the value of restricted securities (excluding 144A issues) amounted to $24,088,000 or 0.3% of net assets. |
Additional information on each restricted holding is as follows: |
Security | Acquisition Date | Acquisition Cost (000s) |
Amyris, Inc. 5% 10/15/18 | 10/16/13 | $ 2,870 |
First Data Holdings, Inc. Class B | 6/26/14 | $ 20,622 |
NJOY, Inc.
Series D | 2/14/14 | $ 1,164 |
Affiliated Central Funds |
Information regarding fiscal year to date income earned by the Fund from investments in Fidelity Central Funds is as follows: |
Fund | Income earned
(Amounts in thousands) |
Fidelity Cash Central Fund | $ 5 |
Fidelity Securities Lending Cash Central Fund | 628 |
Total | $ 633 |
Other Information |
The following is a summary of the inputs used, as of July 31, 2014, involving the Fund's assets and liabilities carried at fair value. The inputs or methodology used for valuing securities may not be an indication of the risk associated with investing in those securities. For more information on valuation inputs, and their aggregation into the levels used in the table below, please refer to the Investment Valuation section in the accompanying Notes to Financial Statements. |
Valuation Inputs at Reporting Date: |
Description
(Amounts in thousands) | Total | Level 1 | Level 2 | Level 3 |
Investments in Securities: | | | | |
Equities: | | | | |
Consumer Discretionary | $ 771,475 | $ 770,311 | $ - | $ 1,164 |
Consumer Staples | 895,449 | 871,843 | 23,606 | - |
Energy | 804,647 | 739,209 | 65,438 | - |
Financials | 1,469,522 | 1,459,867 | 9,655 | - |
Health Care | 757,770 | 709,336 | 48,434 | - |
Industrials | 862,677 | 862,677 | - | - |
Information Technology | 1,497,154 | 1,476,532 | - | 20,622 |
Materials | 265,235 | 233,739 | 31,496 | - |
Telecommunication Services | 155,973 | 155,973 | - | - |
Corporate Bonds | 12,460 | - | 12,460 | - |
Preferred Securities | 4,543 | - | 4,543 | - |
Money Market Funds | 44,758 | 44,758 | - | - |
Total Investments in Securities: | $ 7,541,663 | $ 7,324,245 | $ 195,632 | $ 21,786 |
Distribution of investments by country or territory of incorporation, as a percentage of total net assets, is as follows (Unaudited): |
United States of America | 87.1% |
United Kingdom | 6.2% |
Canada | 2.3% |
Switzerland | 1.0% |
Others (Individually Less Than 1%) | 3.4% |
| 100.0% |
See accompanying notes which are an integral part of the financial statements.
Annual Report
Statement of Assets and Liabilities
Amounts in thousands (except per-share amounts) | July 31, 2014 |
| | |
Assets | | |
Investment in securities, at value (including securities loaned of $36,724) - See accompanying schedule: Unaffiliated issuers (cost $6,036,362) | $ 7,496,905 | |
Fidelity Central Funds (cost $44,758) | 44,758 | |
Total Investments (cost $6,081,120) | | $ 7,541,663 |
Cash | | 71 |
Receivable for investments sold | | 38,097 |
Receivable for fund shares sold | | 2,826 |
Dividends receivable | | 9,448 |
Interest receivable | | 124 |
Distributions receivable from Fidelity Central Funds | | 36 |
Receivable from investment adviser for expense reductions | | 4 |
Other receivables | | 765 |
Total assets | | 7,593,034 |
| | |
Liabilities | | |
Payable for investments purchased | $ 35,586 | |
Payable for fund shares redeemed | 5,294 | |
Accrued management fee | 2,889 | |
Other affiliated payables | 1,086 | |
Other payables and accrued expenses | 841 | |
Collateral on securities loaned, at value | 37,663 | |
Total liabilities | | 83,359 |
| | |
Net Assets | | $ 7,509,675 |
Net Assets consist of: | | |
Paid in capital | | $ 9,474,595 |
Undistributed net investment income | | 3,054 |
Accumulated undistributed net realized gain (loss) on investments and foreign currency transactions | | (3,428,515) |
Net unrealized appreciation (depreciation) on investments and assets and liabilities in foreign currencies | | 1,460,541 |
Net Assets | | $ 7,509,675 |
See accompanying notes which are an integral part of the financial statements.
Annual Report
Statement of Assets and Liabilities - continued
Amounts in thousands (except per-share amounts) | July 31, 2014 |
| | |
Growth and Income:
Net Asset Value, offering price and redemption price per share ($6,550,090 ÷ 225,700 shares) | | $ 29.02 |
| | |
Class K:
Net Asset Value, offering price and redemption price per share ($959,585 ÷ 33,084 shares) | | $ 29.00 |
See accompanying notes which are an integral part of the financial statements.
Annual Report
Financial Statements - continued
Statement of Operations
Amounts in thousands | Year ended July 31, 2014 |
| | |
Investment Income | | |
Dividends | | $ 183,254 |
Interest | | 821 |
Income from Fidelity Central Funds | | 633 |
Total income | | 184,708 |
| | |
Expenses | | |
Management fee | $ 33,261 | |
Transfer agent fees | 11,471 | |
Accounting and security lending fees | 1,186 | |
Custodian fees and expenses | 231 | |
Independent trustees' compensation | 33 | |
Appreciation in deferred trustee compensation account | 2 | |
Registration fees | 105 | |
Audit | 92 | |
Legal | 42 | |
Interest | 13 | |
Miscellaneous | 58 | |
Total expenses before reductions | 46,494 | |
Expense reductions | (155) | 46,339 |
Net investment income (loss) | | 138,369 |
Realized and Unrealized Gain (Loss) Net realized gain (loss) on: | | |
Investment securities: | | |
Unaffiliated issuers (net of foreign taxes of $9) | 838,348 | |
Redemption in-kind with affiliated entities | 25,387 | |
Foreign currency transactions | (55) | |
Total net realized gain (loss) | | 863,680 |
Change in net unrealized appreciation (depreciation) on: Investment securities | 38,915 | |
Assets and liabilities in foreign currencies | (3) | |
Total change in net unrealized appreciation (depreciation) | | 38,912 |
Net gain (loss) | | 902,592 |
Net increase (decrease) in net assets resulting from operations | | $ 1,040,961 |
See accompanying notes which are an integral part of the financial statements.
Annual Report
Statement of Changes in Net Assets
Amounts in thousands | Year ended
July 31,
2014 | Year ended
July 31,
2013 |
Increase (Decrease) in Net Assets | | |
Operations | | |
Net investment income (loss) | $ 138,369 | $ 127,482 |
Net realized gain (loss) | 863,680 | 486,610 |
Change in net unrealized appreciation (depreciation) | 38,912 | 1,017,939 |
Net increase (decrease) in net assets resulting from operations | 1,040,961 | 1,632,031 |
Distributions to shareholders from net investment income | (133,552) | (120,664) |
Distributions to shareholders from net realized gain | (1,626) | (7,383) |
Total distributions | (135,178) | (128,047) |
Share transactions - net increase (decrease) | (472,170) | (42,531) |
Total increase (decrease) in net assets | 433,613 | 1,461,453 |
| | |
Net Assets | | |
Beginning of period | 7,076,062 | 5,614,609 |
End of period (including undistrubuted net investment income of $3,054 and undistributed net investment income of $4,966, respectively) | $ 7,509,675 | $ 7,076,062 |
See accompanying notes which are an integral part of the financial statements.
Annual Report
Financial Highlights - Growth and Income
Years ended July 31, | 2014 | 2013 | 2012 | 2011 | 2010 |
Selected Per-Share Data | | | | | |
Net asset value, beginning of period | $ 25.66 | $ 20.13 | $ 18.58 | $ 15.75 | $ 14.38 |
Income from Investment Operations | | | | | |
Net investment income (loss) B | .51 | .46 | .36 | .20 | .10 |
Net realized and unrealized gain (loss) | 3.35 | 5.54 | 1.55 | 2.82 | 1.37 |
Total from investment operations | 3.86 | 6.00 | 1.91 | 3.02 | 1.47 |
Distributions from net investment income | (.50) | (.44) | (.35) | (.19) | (.10) |
Distributions from net realized gain | (.01) | (.03) | (.01) | - | (.01) |
Total distributions | (.50) G | (.47) | (.36) | (.19) | (.10) F |
Net asset value, end of period | $ 29.02 | $ 25.66 | $ 20.13 | $ 18.58 | $ 15.75 |
Total Return A | 15.16% | 30.15% | 10.45% | 19.16% | 10.25% |
Ratios to Average Net Assets C, E | | | | | |
Expenses before reductions | .65% | .68% | .71% | .72% | .75% |
Expenses net of fee waivers, if any | .65% | .68% | .71% | .72% | .75% |
Expenses net of all reductions | .65% | .67% | .71% | .71% | .74% |
Net investment income (loss) | 1.86% | 2.04% | 1.95% | 1.09% | .63% |
Supplemental Data | | | | | |
Net assets, end of period (in millions) | $ 6,550 | $ 6,060 | $ 4,863 | $ 5,052 | $ 5,417 |
Portfolio turnover rate D | 41% H | 49% | 62% | 129% | 98% |
A Total returns would have been lower if certain expenses had not been reduced during the applicable periods shown.
B Calculated based on average shares outstanding during the period.
C Fees and expenses of any underlying Fidelity Central Funds are not included in the Fund's expense ratio. The Fund indirectly bears its proportionate share of the expenses of any underlying Fidelity Central Funds.
D Amount does not include the portfolio activity of any underlying Fidelity Central Funds.
E Expense ratios reflect operating expenses of the class. Expenses before reductions do not reflect amounts reimbursed by the investment adviser or reductions from brokerage service arrangements or reductions from other expense offset arrangements and do not represent the amount paid by the class during periods when reimbursements or reductions occur. Expenses net of fee waivers reflect expenses after reimbursement by the investment adviser but prior to reductions from brokerage service arrangements or other expense offset arrangements. Expenses net of all reductions represent the net expenses paid by the class.
F Total distributions of $.10 per share is comprised of distributions from net investment income of $.095 and distributions from net realized gain of $.008 per share.
G Total distributions of $.50 per share is comprised of distributions from net investment income of $.495 and distributions from net realized gain of $.006 per share.
H Portfolio turnover rate excludes securities received or delivered in-kind.
See accompanying notes which are an integral part of the financial statements.
Annual Report
Financial Highlights - Class K
Years ended July 31, | 2014 | 2013 | 2012 | 2011 | 2010 |
Selected Per-Share Data | | | | | |
Net asset value, beginning of period | $ 25.64 | $ 20.12 | $ 18.57 | $ 15.74 | $ 14.38 |
Income from Investment Operations | | | | | |
Net investment income (loss) B | .54 | .50 | .40 | .23 | .13 |
Net realized and unrealized gain (loss) | 3.36 | 5.52 | 1.54 | 2.82 | 1.37 |
Total from investment operations | 3.90 | 6.02 | 1.94 | 3.05 | 1.50 |
Distributions from net investment income | (.53) | (.47) | (.38) | (.22) | (.13) |
Distributions from net realized gain | (.01) | (.03) | (.01) | - | (.01) |
Total distributions | (.54) | (.50) | (.39) | (.22) | (.14) F |
Net asset value, end of period | $ 29.00 | $ 25.64 | $ 20.12 | $ 18.57 | $ 15.74 |
Total Return A | 15.32% | 30.28% | 10.66% | 19.40% | 10.41% |
Ratios to Average Net Assets C, E | | | | | |
Expenses before reductions | .52% | .53% | .54% | .54% | .54% |
Expenses net of fee waivers, if any | .52% | .53% | .54% | .54% | .54% |
Expenses net of all reductions | .52% | .52% | .54% | .53% | .53% |
Net investment income (loss) | 1.99% | 2.19% | 2.13% | 1.27% | .84% |
Supplemental Data | | | | | |
Net assets, end of period (in millions) | $ 960 | $ 1,016 | $ 752 | $ 403 | $ 292 |
Portfolio turnover rate D | 41% G | 49% | 62% | 129% | 98% |
A Total returns would have been lower if certain expenses had not been reduced during the applicable periods shown.
B Calculated based on average shares outstanding during the period.
C Fees and expenses of any underlying Fidelity Central Funds are not included in the Fund's expense ratio. The Fund indirectly bears its proportionate share of the expenses of any underlying Fidelity Central Funds.
D Amount does not include the portfolio activity of any underlying Fidelity Central Funds.
E Expense ratios reflect operating expenses of the class. Expenses before reductions do not reflect amounts reimbursed by the investment adviser or reductions from brokerage service arrangements or reductions from other expense offset arrangements and do not represent the amount paid by the class during periods when reimbursements or reductions occur. Expenses net of fee waivers reflect expenses after reimbursement by the investment adviser but prior to reductions from brokerage service arrangements or other expense offset arrangements. Expenses net of all reductions represent the net expenses paid by the class.
F Total distributions of $.14 per share is comprised of distributions from net investment income of $.129 and distributions from net realized gain of $.008 per share.
G Portfolio turnover rate excludes securities received or delivered in-kind.
See accompanying notes which are an integral part of the financial statements.
Annual Report
Notes to Financial Statements
For the period ended July 31, 2014
(Amounts in thousands except percentages)
1. Organization.
Fidelity Growth & Income Portfolio (the Fund) is a fund of Fidelity Securities Fund (the Trust) and is authorized to issue an unlimited number of shares. The Trust is registered under the Investment Company Act of 1940, as amended (the 1940 Act), as an open-end management investment company organized as a Massachusetts business trust. The Fund offers Growth & Income and Class K shares, each of which has equal rights as to assets and voting privileges. Each class has exclusive voting rights with respect to matters that affect that class.
2. Investments in Fidelity Central Funds.
The Fund invests in Fidelity Central Funds, which are open-end investment companies generally available only to other investment companies and accounts managed by the investment adviser and its affiliates. The Fund's Schedule of Investments lists each of the Fidelity Central Funds held as of period end, if any, as an investment of the Fund, but does not include the underlying holdings of each Fidelity Central Fund. As an Investing Fund, the Fund indirectly bears its proportionate share of the expenses of the underlying Fidelity Central Funds.
The Money Market Central Funds seek preservation of capital and current income and are managed by Fidelity Investments Money Management, Inc. (FIMM), an affiliate of the investment adviser. Annualized expenses of the Money Market Central Funds as of their most recent shareholder report date are less than .01%.
A complete unaudited list of holdings for each Fidelity Central Fund is available upon request or at the Securities and Exchange Commission (the SEC) website at www.sec.gov. In addition, the financial statements of the Fidelity Central Funds, which are not covered by the Fund's Report of Independent Registered Public Accounting Firm, are available on the SEC website or upon request.
3. Significant Accounting Policies.
The financial statements have been prepared in conformity with accounting principles generally accepted in the United States of America (GAAP), which require management to make certain estimates and assumptions at the date of the financial statements. Actual results could differ from those estimates. Subsequent events, if any, through the date that the financial statements were issued have been evaluated in the preparation of the financial statements. The following summarizes the significant accounting policies of the Fund:
Investment Valuation. Investments are valued as of 4:00 p.m. Eastern time on the last calendar day of the period. In accordance with valuation policies and procedures approved by the Board of Trustees (the Board), the Fund attempts to obtain prices from
Annual Report
3. Significant Accounting Policies - continued
Investment Valuation - continued
one or more third party pricing vendors or brokers to value its investments. When current market prices, quotations or currency exchange rates are not readily available or reliable, investments will be fair valued in good faith by the Fidelity Management & Research Company (FMR) Fair Value Committee (the Committee), in accordance with procedures adopted by the Board. Factors used in determining fair value vary by investment type and may include market or investment specific events, changes in interest rates and credit quality. The frequency with which these procedures are used cannot be predicted and they may be utilized to a significant extent. The Committee oversees the Fund's valuation policies and procedures and is responsible for approving and reporting to the Board all fair value determinations.
The Fund categorizes the inputs to valuation techniques used to value its investments into a disclosure hierarchy consisting of three levels as shown below:
Level 1 - quoted prices in active markets for identical investments
Level 2 - other significant observable inputs (including quoted prices for similar investments, interest rates, prepayment speeds, etc.)
Level 3 - unobservable inputs (including the Fund's own assumptions based on the best information available)
Valuation techniques used to value the Fund's investments by major category are as follows:
Equity securities, including restricted securities, for which market quotations are readily available, are valued at the last reported sale price or official closing price as reported by a third party pricing vendor on the primary market or exchange on which they are traded and are categorized as Level 1 in the hierarchy. In the event there were no sales during the day or closing prices are not available, securities are valued at the last quoted bid price or may be valued using the last available price and are generally categorized as Level 2 in the hierarchy. For foreign equity securities, when market or security specific events arise, comparisons to the valuation of American Depositary Receipts (ADRs), futures contracts, Exchange-Traded Funds (ETFs) and certain indexes as well as quoted prices for similar securities may be used and would be categorized as Level 2 in the hierarchy. Utilizing these techniques may result in transfers between Level 1 and Level 2. For equity securities, including restricted securities, where observable inputs are limited, assumptions about market activity and risk are used and these securities may be categorized as Level 3 in the hierarchy.
Annual Report
Notes to Financial Statements - continued
(Amounts in thousands except percentages)
3. Significant Accounting Policies - continued
Investment Valuation - continued
Debt securities, including restricted securities, are valued based on evaluated prices received from third party pricing vendors or from brokers who make markets in such securities. Corporate bonds and preferred securities are valued by pricing vendors who utilize matrix pricing which considers yield or price of bonds of comparable quality, coupon, maturity and type or by broker-supplied prices. When independent prices are unavailable or unreliable, debt securities may be valued utilizing pricing methodologies which consider similar factors that would be used by third party pricing vendors. Debt securities are generally categorized as Level 2 in the hierarchy but may be Level 3 depending on the circumstances.
Investments in open-end mutual funds, including the Fidelity Central Funds, are valued at their closing net asset value (NAV) each business day and are categorized as Level 1 in the hierarchy.
Changes in valuation techniques may result in transfers in or out of an assigned level within the disclosure hierarchy. The aggregate value of investments by input level, as of July 31, 2014, is included at the end of the Fund's Schedule of Investments.
Foreign Currency. The Fund may use foreign currency contracts to facilitate transactions in foreign-denominated securities. Gains and losses from these transactions may arise from changes in the value of the foreign currency or if the counterparties do not perform under the contracts' terms.
Foreign-denominated assets, including investment securities, and liabilities are translated into U.S. dollars at the exchange rates at period end. Purchases and sales of investment securities, income and dividends received and expenses denominated in foreign currencies are translated into U.S. dollars at the exchange rate in effect on the transaction date.
The effects of exchange rate fluctuations on investments are included with the net realized and unrealized gain (loss) on investment securities. Other foreign currency transactions resulting in realized and unrealized gain (loss) are disclosed separately.
Investment Transactions and Income. For financial reporting purposes, the Fund's investment holdings and NAV include trades executed through the end of the last business day of the period. The NAV per share for processing shareholder transactions is calculated as of the close of business of the New York Stock Exchange (NYSE), normally 4:00 p.m. Eastern time and includes trades executed through the end of the prior business day. Gains and losses on securities sold are determined on the basis of identified cost and may include proceeds received from litigation. Dividend income is recorded on the ex-dividend date, except for certain dividends from foreign securities where the
Annual Report
3. Significant Accounting Policies - continued
Investment Transactions and Income - continued
ex-dividend date may have passed, which are recorded as soon as the Fund is informed of the ex-dividend date. Non-cash dividends included in dividend income, if any, are recorded at the fair market value of the securities received. Income and capital gain distributions from Fidelity Central Funds, if any, are recorded on the ex-dividend date. Distributions received on securities that represent a return of capital or capital gain are recorded as a reduction of cost of investments and/or as a realized gain. Subsequent to ex-dividend date the Fund determines the components of these distributions, based upon receipt of tax filings or other correspondence relating to the underlying investment. Interest income is accrued as earned and includes coupon interest and amortization of premium and accretion of discount on debt securities as applicable. Investment income is recorded net of foreign taxes withheld where recovery of such taxes is uncertain.
Class Allocations and Expenses. Investment income, realized and unrealized capital gains and losses, common expenses of the Fund, and certain fund-level expense reductions, if any, are allocated daily on a pro-rata basis to each class based on the relative net assets of each class to the total net assets of the Fund. Each class differs with respect to transfer agent fees incurred. Certain expense reductions may also differ by class. For the reporting period, the allocated portion of income and expenses to each class as a percent of its average net assets may vary due to the timing of recording these transactions in relation to fluctuating net assets of the classes. Expenses directly attributable to a fund are charged to that fund. Expenses attributable to more than one fund are allocated among the respective funds on the basis of relative net assets or other appropriate methods. Expense estimates are accrued in the period to which they relate and adjustments are made when actual amounts are known.
Deferred Trustee Compensation. Under a Deferred Compensation Plan (the Plan), independent Trustees may elect to defer receipt of a portion of their annual compensation. Deferred amounts are invested in a cross-section of Fidelity funds, are marked-to-market and remain in the Fund until distributed in accordance with the Plan. The investment of deferred amounts and the offsetting payable to the Trustees are included in the accompanying Statement of Assets and Liabilities.
Income Tax Information and Distributions to Shareholders. Each year, the Fund intends to qualify as a regulated investment company under Subchapter M of the Internal Revenue Code, including distributing substantially all of its taxable income and realized gains. As a result, no provision for U.S. Federal income taxes is required. As of July 31, 2014, the Fund did not have any unrecognized tax benefits in the financial statements; nor is the Fund aware of any tax positions for which it is reasonably possible that the total amounts of unrecognized tax benefits will significantly change in the next twelve months. The Fund files a U.S. federal tax return, in addition to state and local tax
Annual Report
Notes to Financial Statements - continued
(Amounts in thousands except percentages)
3. Significant Accounting Policies - continued
Income Tax Information and Distributions to Shareholders - continued
returns as required. The Fund's federal income tax returns are subject to examination by the Internal Revenue Service (IRS) for a period of three fiscal years after they are filed. State and local tax returns may be subject to examination for an additional fiscal year depending on the jurisdiction. Foreign taxes are provided for based on the Fund's understanding of the tax rules and rates that exist in the foreign markets in which it invests. The Fund is subject to a tax imposed on capital gains by certain countries in which it invests.
Distributions are declared and recorded on the ex-dividend date. Income dividends and capital gain distributions are declared separately for each class. Income and capital gain distributions are determined in accordance with income tax regulations, which may differ from GAAP.
Capital accounts within the financial statements are adjusted for permanent book-tax differences. These adjustments have no impact on net assets or the results of operations. Capital accounts are not adjusted for temporary book-tax differences which will reverse in a subsequent period.
Book-tax differences are primarily due to foreign currency transactions, certain foreign taxes, market discount, redemptions in kind, partnerships, deferred trustees compensation, equity-debt classification, capital loss carryforwards and losses deferred due to wash sales.
The federal tax cost of investment securities and unrealized appreciation (depreciation) as of period end were as follows:
Gross unrealized appreciation | $ 1,544,345 |
Gross unrealized depreciation | (92,703) |
Net unrealized appreciation (depreciation) on securities | $ 1,451,642 |
| |
Tax Cost | $ 6,090,021 |
The tax-based components of distributable earnings as of period end were as follows:
Undistributed ordinary income | $ 11,908 |
Capital loss carryforward | $ (3,419,588) |
Net unrealized appreciation (depreciation) on securities and other investments | $ 1,451,645 |
Capital loss carryforwards are only available to offset future capital gains of the Fund to the extent provided by regulations and may be limited. Under the Regulated Investment
Annual Report
3. Significant Accounting Policies - continued
Income Tax Information and Distributions to Shareholders - continued
Company Modernization Act of 2010 (the Act), the Fund is permitted to carry forward capital losses incurred in taxable years beginning after December 22, 2010 for an unlimited period and such capital losses are required to be used prior to any losses that expire. The capital loss carryforward information presented below, including any applicable limitation, is estimated as of fiscal period end and is subject to adjustment.
Fiscal year of expiration | |
2017 | $ (251,247) |
2018 | (3,168,341) |
Total capital loss carryforward | $ (3,419,588) |
The tax character of distributions paid was as follows:
| July 31, 2014 | July 31, 2013 |
Ordinary Income | $ 135,178 | $ 128,047 |
Restricted Securities. The Fund may invest in securities that are subject to legal or contractual restrictions on resale. These securities generally may be resold in transactions exempt from registration or to the public if the securities are registered. Disposal of these securities may involve time-consuming negotiations and expense, and prompt sale at an acceptable price may be difficult. Information regarding restricted securities is included at the end of the Fund's Schedule of Investments.
4. Purchases and Sales of Investments.
Purchases and sales of securities, other than short-term securities and in-kind securities, aggregated $3,025,941 and $3,423,754, respectively.
5. Fees and Other Transactions with Affiliates.
Management Fee. Fidelity Management & Research Company (the investment adviser) and its affiliates provide the Fund with investment management related services for which the Fund pays a monthly management fee. The management fee is the sum of an individual fund fee rate that is based on an annual rate of .20% of the Fund's average net assets and an annualized group fee rate that averaged .25% during the period. The group fee rate is based upon the average net assets of all the mutual funds advised by the investment adviser, including any mutual funds previously advised by the investment adviser that are currently advised by Fidelity SelectCo, LLC, an affiliate of the investment adviser. The group fee rate decreases as assets under management increase and increases as assets under management decrease. For the reporting period, the total annual management fee rate was .45% of the Fund's average net assets.
Annual Report
Notes to Financial Statements - continued
(Amounts in thousands except percentages)
5. Fees and Other Transactions with Affiliates - continued
Transfer Agent Fees. Fidelity Investments Institutional Operations Company, Inc., (FIIOC), an affiliate of the investment adviser, is the transfer, dividend disbursing and shareholder servicing agent for each class of the Fund. FIIOC receives account fees and asset-based fees that vary according to the account size and type of account of the shareholders of Growth & Income. FIIOC receives an asset-based fee of Class K's average net assets. FIIOC pays for typesetting, printing and mailing of shareholder reports, except proxy statements.
For the period, transfer agent fees for each class were as follows:
| Amount | % of
Average
Net Assets |
Growth and Income | $ 10,994 | .17 |
Class K | 477 | .05 |
| $ 11,471 | |
Accounting and Security Lending Fees. Fidelity Service Company, Inc. (FSC), an affiliate of the investment adviser, maintains the Fund's accounting records. The accounting fee is based on the level of average net assets for each month. Under a separate contract, FSC administers the security lending program. The security lending fee is based on the number and duration of lending transactions.
Brokerage Commissions. The Fund placed a portion of its portfolio transactions with brokerage firms which are affiliates of the investment adviser. Brokerage commissions are included in net realized gain (loss) and change in net unrealized appreciation (depreciation) in the Statement of Operations. The commissions paid to these affiliated firms were $48 for the period.
Interfund Lending Program. Pursuant to an Exemptive Order issued by the SEC, the Fund, along with other registered investment companies having management contracts with FMR or other affiliated entities of FMR, may participate in an interfund lending program. This program provides an alternative credit facility allowing the funds to borrow from, or lend money to, other participating affiliated funds. At period end, there were no interfund loans outstanding. The Fund's activity in this program during the period for which loans were outstanding was as follows:
Borrower or Lender | Average Loan
Balance | Weighted Average Interest Rate | Interest Expense |
Borrower | $ 17,263 | .31% | $ 13 |
Annual Report
5. Fees and Other Transactions with Affiliates - continued
Redemptions In-Kind. During the period, 2,627 shares of the Fund held by affiliated entities were redeemed in kind for cash and investments, including accrued interest, with a value of $77,347. The net realized gain of $25,387 on securities delivered through the in-kind redemption is included in the accompanying Statement of Operations. The amount of in-kind redemptions is included in share transactions in the accompanying Statement of Changes in Net Assets as well as Note 10: Share Transactions. The Fund recognized no gain or loss for federal income tax purposes.
6. Committed Line of Credit.
The Fund participates with other funds managed by the investment adviser or an affiliate in a $4.25 billion credit facility (the "line of credit") to be utilized for temporary or emergency purposes to fund shareholder redemptions or for other short-term liquidity purposes. The Fund has agreed to pay commitment fees on its pro-rata portion of the line of credit, which amounted to $13 and is reflected in Miscellaneous expenses on the Statement of Operations. During the period, the Fund did not borrow on this line of credit.
7. Security Lending.
The Fund lends portfolio securities through a lending agent from time to time in order to earn additional income. For equity securities, a lending agent is used and may loan securities to certain qualified borrowers, including Fidelity Capital Markets (FCM), a broker-dealer affiliated with the Fund. On the settlement date of the loan, the Fund receives collateral (in the form of U.S. Treasury obligations, letters of credit and/or cash) against the loaned securities and maintains collateral in an amount not less than 100% of the market value of the loaned securities during the period of the loan. The market value of the loaned securities is determined at the close of business of the Fund and any additional required collateral is delivered to the Fund on the next business day. If the borrower defaults on its obligation to return the securities loaned because of insolvency or other reasons, the Fund may apply collateral received from the borrower against the obligation. The Fund may experience delays and costs in recovering the securities loaned. Any cash collateral received is invested in the Fidelity Securities Lending Cash Central Fund. The value of loaned securities and cash collateral at period end are disclosed on the Fund's Statement of Assets and Liabilities. At period end, there were no security loans outstanding with FCM. Security lending income represents the income earned on investing cash collateral, less rebates paid to borrowers and any lending agent fees associated with the loan, plus any premium payments received for lending certain types of securities. Security lending income is presented in the Statement of Operations
Annual Report
Notes to Financial Statements - continued
(Amounts in thousands except percentages)
7. Security Lending - continued
as a component of income from Fidelity Central Funds. Total security lending income during the period amounted to $628, including $34 from securities loaned to FCM.
8. Expense Reductions.
Commissions paid to certain brokers with whom the investment adviser, or its affiliates, places trades on behalf of the Fund include an amount in addition to trade execution, which may be rebated back to the Fund to offset certain expenses. This amount totaled $79 for the period.
In addition, the investment adviser reimbursed a portion of the Fund's operating expenses during the period in the amount of $76.
9. Distributions to Shareholders.
Distributions to shareholders of each class were as follows:
Years ended July 31, | 2014 | 2013 |
From net investment income | | |
Growth and Income | $ 113,973 | $ 102,417 |
Class K | 19,579 | 18,247 |
Total | $ 133,552 | $ 120,664 |
From net realized gain | | |
Growth and Income | $ 1,391 | $ 6,339 |
Class K | 235 | 1,044 |
Total | $ 1,626 | $ 7,383 |
10. Share Transactions.
Transactions for each class of shares were as follows:
| Shares | Dollars |
Years ended July 31, | 2014 | 2013 | 2014 | 2013 |
Growth and Income | | | | |
Shares sold | 21,786 | 29,843 | $ 598,816 | $ 688,591 |
Reinvestment of distributions | 3,998 | 4,672 | 110,063 | 104,347 |
Shares redeemed | (36,289) A | (39,833) | (997,570) A | (885,644) |
Net increase (decrease) | (10,505) | (5,318) | $ (288,691) | $ (92,706) |
Class K | | | | |
Shares sold | 7,113 | 11,165 | $ 195,462 | $ 248,185 |
Reinvestment of distributions | 722 | 863 | 19,814 | 19,291 |
Shares redeemed | (14,384) | (9,761) | (398,755) | (217,301) |
Net increase (decrease) | (6,549) | 2,267 | $ (183,479) | $ 50,175 |
A Amount includes in-kind redemptions (see Note 5: Redemptions In-Kind).
Annual Report
11. Other.
The Fund's organizational documents provide former and current trustees and officers with a limited indemnification against liabilities arising in connection with the performance of their duties to the Fund. In the normal course of business, the Fund may also enter into contracts that provide general indemnifications. The Fund's maximum exposure under these arrangements is unknown as this would be dependent on future claims that may be made against the Fund. The risk of material loss from such claims is considered remote.
Annual Report
To the Trustees of Fidelity Securities Fund and the Shareholders of Fidelity Growth & Income Portfolio:
In our opinion, the accompanying statement of assets and liabilities, including the schedule of investments, and the related statements of operations and of changes in net assets and the financial highlights present fairly, in all material respects, the financial position of Fidelity Growth & Income Portfolio (a fund of Fidelity Securities Fund) at July 31, 2014, the results of its operations for the year then ended, the changes in its net assets for each of the two years in the period then ended and the financial highlights for each of the five years in the period then ended, in conformity with accounting principles generally accepted in the United States of America. These financial statements and financial highlights (hereafter referred to as "financial statements") are the responsibility of the Fidelity Growth & Income Portfolio's management. Our responsibility is to express an opinion on these financial statements based on our audits. We conducted our audits of these financial statements in accordance with the standards of the Public Company Accounting Oversight Board (United States). Those standards require that we plan and perform the audit to obtain reasonable assurance about whether the financial statements are free of material misstatement. An audit includes examining, on a test basis, evidence supporting the amounts and disclosures in the financial statements, assessing the accounting principles used and significant estimates made by management, and evaluating the overall financial statement presentation. We believe that our audits, which included confirmation of securities at July 31, 2014 by correspondence with the custodian and brokers, provide a reasonable basis for our opinion.
PricewaterhouseCoopers LLP
Boston, Massachusetts
September 11, 2014
Annual Report
The Trustees, Member of the Advisory Board, and officers of the trust and fund, as applicable, are listed below. The Board of Trustees governs the fund and is responsible for protecting the interests of shareholders. The Trustees are experienced executives who meet periodically throughout the year to oversee the fund's activities, review contractual arrangements with companies that provide services to the fund, oversee management of the risks associated with such activities and contractual arrangements, and review the fund's performance. Except for James C. Curvey, each of the Trustees oversees 173 funds. Mr. Curvey oversees 397 funds.
The Trustees hold office without limit in time except that (a) any Trustee may resign; (b) any Trustee may be removed by written instrument, signed by at least two-thirds of the number of Trustees prior to such removal; (c) any Trustee who requests to be retired or who has become incapacitated by illness or injury may be retired by written instrument signed by a majority of the other Trustees; and (d) any Trustee may be removed at any special meeting of shareholders by a two-thirds vote of the outstanding voting securities of the trust. Each Trustee who is not an interested person (as defined in the 1940 Act) of the trust and the fund (Independent Trustee), shall retire not later than the last day of the calendar year in which his or her 75th birthday occurs. The Independent Trustees may waive this mandatory retirement age policy with respect to individual Trustees. The officers and Advisory Board Member hold office without limit in time, except that any officer and Advisory Board Member may resign or may be removed by a vote of a majority of the Trustees at any regular meeting or any special meeting of the Trustees. Except as indicated, each individual has held the office shown or other offices in the same company for the past five years.
Experience, Skills, Attributes, and Qualifications of the Fund's Trustees. The Governance and Nominating Committee has adopted a statement of policy that describes the experience, qualifications, attributes, and skills that are necessary and desirable for potential Independent Trustee candidates (Statement of Policy). The Board believes that each Trustee satisfied at the time he or she was initially elected or appointed a Trustee, and continues to satisfy, the standards contemplated by the Statement of Policy. The Governance and Nominating Committee also engages professional search firms to help identify potential Independent Trustee candidates who have the experience, qualifications, attributes, and skills consistent with the Statement of Policy. From time to time, additional criteria based on the composition and skills of the current Independent Trustees, as well as experience or skills that may be appropriate in light of future changes to board composition, business conditions, and regulatory or other developments, have also been considered by the professional search firms and the Governance and Nominating Committee. In addition, the Board takes into account the Trustees' commitment and participation in Board and committee meetings, as well as their leadership of standing and ad hoc committees throughout their tenure.
In determining that a particular Trustee was and continues to be qualified to serve as a Trustee, the Board has considered a variety of criteria, none of which, in isolation, was controlling. The Board believes that, collectively, the Trustees have balanced and diverse experience, qualifications, attributes, and skills, which allow the Board to operate effectively in governing the fund and protecting the interests of shareholders. Information about the specific experience, skills, attributes, and qualifications of each Trustee, which in each case led to the Board's conclusion that the Trustee should serve (or continue to serve) as a trustee of the fund, is provided below.
Annual Report
Trustees and Officers - continued
Board Structure and Oversight Function. James C. Curvey is an interested person (as defined in the 1940 Act) and currently serves as Chairman. The Trustees have determined that an interested Chairman is appropriate and benefits shareholders because an interested Chairman has a personal and professional stake in the quality and continuity of services provided to the fund. Independent Trustees exercise their informed business judgment to appoint an individual of their choosing to serve as Chairman, regardless of whether the Trustee happens to be independent or a member of management. The Independent Trustees have determined that they can act independently and effectively without having an Independent Trustee serve as Chairman and that a key structural component for assuring that they are in a position to do so is for the Independent Trustees to constitute a substantial majority for the Board. The Independent Trustees also regularly meet in executive session. Ned C. Lautenbach serves as Chairman of the Independent Trustees and as such (i) acts as a liaison between the Independent Trustees and management with respect to matters important to the Independent Trustees and (ii) with management prepares agendas for Board meetings.
Fidelity funds are overseen by different Boards of Trustees. The fund's Board oversees Fidelity's equity and high income funds and another Board oversees Fidelity's investment-grade bond, money market, and asset allocation funds. The asset allocation funds may invest in Fidelity funds overseen by the fund's Board. The use of separate Boards, each with its own committee structure, allows the Trustees of each group of Fidelity funds to focus on the unique issues of the funds they oversee, including common research, investment, and operational issues. On occasion, the separate Boards establish joint committees to address issues of overlapping consequences for the Fidelity funds overseen by each Board.
The Trustees operate using a system of committees to facilitate the timely and efficient consideration of all matters of importance to the Trustees, the fund, and fund shareholders and to facilitate compliance with legal and regulatory requirements and oversight of the fund's activities and associated risks. The Board, acting through its committees, has charged FMR and its affiliates with (i) identifying events or circumstances the occurrence of which could have demonstrably adverse effects on the fund's business and/or reputation; (ii) implementing processes and controls to lessen the possibility that such events or circumstances occur or to mitigate the effects of such events or circumstances if they do occur; and (iii) creating and maintaining a system designed to evaluate continuously business and market conditions in order to facilitate the identification and implementation processes described in (i) and (ii) above. Because the day-to-day operations and activities of the fund are carried out by or through FMR, its affiliates and other service providers, the fund's exposure to risks is mitigated but not eliminated by the processes overseen by the Trustees. While each of the Board's committees has responsibility for overseeing different aspects of the fund's activities, oversight is exercised primarily through the Operations, Audit, and Compliance Committees. In addition, the Independent Trustees have worked with FMR to enhance the Board's oversight of investment and financial risks, legal and regulatory risks, technology risks, and operational risks, including the development of additional risk reporting to the Board. For example, a working group comprised of Independent Trustees and FMR has worked and continues to work to review the Fidelity funds' valuation-related activities, reporting and risk management. Appropriate personnel, including but not limited to the fund's Chief Compliance Officer (CCO), FMR's internal auditor, the independent accountants, the fund's Treasurer and portfolio management personnel, make periodic reports to the Board's committees, as appropriate, including an annual review of FMR's risk management program for the Fidelity funds. The responsibilities of each standing committee, including their oversight responsibilities, are described further under "Standing Committees of the Fund's Trustees."
Annual Report
The fund's Statement of Additional Information (SAI) includes more information about the Trustees. To request a free copy, call Fidelity at 1-800-835-5092.
Interested Trustees*:
Correspondence intended for each Trustee who is an interested person may be sent to Fidelity Investments, 245 Summer Street, Boston, Massachusetts 02210.
Name, Year of Birth; Principal Occupations and Other Relevant Experience+ |
James C. Curvey (1935) |
Year of Election or Appointment: 2007 Trustee Chairman of the Board of Trustees |
| Mr. Curvey also serves as Trustee of other Fidelity funds. Mr. Curvey is a Director of Fidelity Research & Analysis Co. (2009-present), and Vice Chairman (2007-present) and Director of FMR LLC. In addition, Mr. Curvey serves as an Overseer for the Boston Symphony Orchestra and a member of the Trustees of Villanova University. Previously, Mr. Curvey served as a Director of Fidelity Investments Money Management, Inc. (2009-2014), a Director of FMR (2007-2014), a Director of FMR Co., Inc. (2007-2014) and was the Vice Chairman (2006-2007) and Director (2000-2007) of FMR Corp. |
Charles S. Morrison (1960) |
Year of Election or Appointment: 2014 Trustee |
| Mr. Morrison also serves as Trustee of other funds. He serves as President, Asset Management (2014-present) and is an employee of Fidelity Investments. Previously, Mr. Morrison served as Vice President of Fidelity's Fixed Income and Asset Allocation Funds (2012-2014), President, Fixed Income (2011-2014), Vice President of Fidelity's Money Market Funds (2005-2009), President, Money Market Group Leader of FMR (2009), and Senior Vice President, Money Market Group of FMR (2004-2009). Mr. Morrison also served as Vice President of Fidelity's Bond Funds (2002-2005), certain Balanced Funds (2002-2005), and certain Asset Allocation Funds (2002-2007), and as Senior Vice President (2002-2005) of Fidelity's Bond Division. |
* Trustees have been determined to be "Interested Trustees" by virtue of, among other things, their affiliation with the trust or various entities under common control with FMR.
+ The information above includes each Trustee's principal occupation during the last five years and other information relating to the experience, attributes, and skills relevant to each Trustee's qualifications to serve as a Trustee, which led to the conclusion that each Trustee should serve as a Trustee for the fund.
Annual Report
Independent Trustees:
Correspondence intended for each Independent Trustee (that is, the Trustees other than the Interested Trustees) may be sent to Fidelity Investments, P.O. Box 55235, Boston, Massachusetts 02205-5235.
Name, Year of Birth; Principal Occupations and Other Relevant Experience+ |
Dennis J. Dirks (1948) |
Year of Election or Appointment: 2005 Trustee |
| Mr. Dirks also serves as Trustee of other Fidelity funds. Prior to his retirement in May 2003, Mr. Dirks was Chief Operating Officer and a member of the Board of The Depository Trust & Clearing Corporation (DTCC). He also served as President, Chief Operating Officer, and Board member of The Depository Trust Company (DTC) and President and Board member of the National Securities Clearing Corporation (NSCC). In addition, Mr. Dirks served as Chief Executive Officer and Board member of the Government Securities Clearing Corporation, Chief Executive Officer and Board member of the Mortgage-Backed Securities Clearing Corporation, as a Trustee and a member of the Finance Committee of Manhattan College (2005-2008), and as a Trustee and a member of the Finance Committee of AHRC of Nassau County (2006-2008). Mr. Dirks is a member of the Independent Directors Council (IDC) Governing Council (2010-present) and Board of Directors for The Brookville Center for Children's Services, Inc. (2009-present). |
Alan J. Lacy (1953) |
Year of Election or Appointment: 2008 Trustee |
| Mr. Lacy also serves as Trustee of other Fidelity funds. Mr. Lacy serves as Senior Adviser (2007-present) of Oak Hill Capital Partners, L.P. (private equity). Mr. Lacy also served as Chief Executive Officer (2000-2005) and Vice Chairman (2005-2006) of Sears Holdings Corporation and Sears, Roebuck and Co. (retail). In addition, Mr. Lacy serves as a member of the Board of Directors of Dave & Buster's Entertainment, Inc. (restaurant and entertainment complexes, 2010-present), Earth Fare, Inc. (retail grocery, 2012-present), The Hillman Companies, Inc. (hardware wholesalers, 2010-present), and Bristol-Myers Squibb Company (global pharmaceuticals, 2008-present). Mr. Lacy is a member of the Board of Trustees of The National Parks Conservation Association (2006-present). Previously, Mr. Lacy served as Chairman of the Board of Trustees of the National Parks Conservation Association (2008-2011) and as a member of the Board of Directors for the Western Union Company (global money transfer, 2006-2011). |
Ned C. Lautenbach (1944) |
Year of Election or Appointment: 2000 Trustee Chairman of the Independent Trustees |
| Mr. Lautenbach also serves as Trustee of other Fidelity funds. Mr. Lautenbach currently serves as the Lead Director of the Eaton Corporation Board of Directors (diversified industrial, 1997-present). Mr. Lautenbach is Chairman of the Board of Directors of the Philharmonic Center for the Arts in Naples, Florida (2012-present) and a member of the Council on Foreign Relations (1994-present). Previously, Mr. Lautenbach was a Partner/Advisory Partner at Clayton, Dubilier & Rice, LLC (private equity investment, 1998-2010), as well as a Director of Sony Corporation (2006-2007). |
Joseph Mauriello (1944) |
Year of Election or Appointment: 2008 Trustee |
| Mr. Mauriello also serves as Trustee of other Fidelity funds. Prior to his retirement in January 2006, Mr. Mauriello served in numerous senior management positions including Deputy Chairman and Chief Operating Officer (2004-2005), and Vice Chairman of Financial Services (2002-2004) of KPMG LLP US (professional services, 1965-2005). Mr. Mauriello currently serves as a member of the Board of Directors of XL Group plc. (global insurance and re-insurance, 2006-present). Previously, Mr. Mauriello served as a Director of the Hamilton Funds of the Bank of New York (2006-2007) and of Arcadia Resources Inc. (health care services and products, 2007-2012). |
Robert W. Selander (1950) |
Year of Election or Appointment: 2011 Trustee |
| Mr. Selander also serves as Trustee of other Fidelity funds. Previously, Mr. Selander served as a Member of the Advisory Board of other Fidelity funds (2011), and Executive Vice Chairman (2010), Chief Executive Officer (2009-2010), and President and Chief Executive Officer (1997-2009) of Mastercard, Inc. |
Cornelia M. Small (1944) |
Year of Election or Appointment: 2005 Trustee |
| Ms. Small also serves as Trustee of other Fidelity funds. Ms. Small is a member of the Board of Directors (2009-present) and Chair of the Investment Committee (2010-present) of the Teagle Foundation. Ms. Small also serves on the Investment Committee of the Berkshire Taconic Community Foundation (2008-present). Previously, Ms. Small served as Chairperson (2002-2008) and a member of the Investment Committee and Chairperson (2008-2012) and a member of the Board of Trustees of Smith College. In addition, Ms. Small served as Chief Investment Officer, Director of Global Equity Investments, and a member of the Board of Directors of Scudder, Stevens & Clark and Scudder Kemper Investments. |
William S. Stavropoulos (1939) |
Year of Election or Appointment: 2002 Trustee Vice Chairman of the Independent Trustees |
| Mr. Stavropoulos also serves as Trustee of other Fidelity funds. Mr. Stavropoulos serves as President and Founder of the Michigan Baseball Foundation, the Great Lakes Loons (2007-present). Mr. Stavropoulos is Chairman Emeritus of the Board of Directors of The Dow Chemical Company, where he previously served in numerous senior management positions, including President, CEO (1995-2000; 2002-2004), Chairman of the Executive Committee (2000-2006), and as a member of the Board of Directors (1990-2006). Currently, Mr. Stavropoulos is Chairman of the Board of Directors of Univar Inc. (global distributor of commodity and specialty chemicals), a Director of Teradata Corporation (data warehousing and technology solutions), and Maersk Inc. (industrial conglomerate), and a member of the Advisory Board for Metalmark Capital LLC (private equity investment, 2005-present). Mr. Stavropoulos is an operating advisor to Clayton, Dubilier & Rice, LLC (private equity investment). In addition, Mr. Stavropoulos is a member of the University of Notre Dame Advisory Council for the College of Science, a Trustee of the Rollin L. Gerstacker Foundation, and a Director of the Naples Philharmonic Center for the Arts. Previously, Mr. Stavropoulos served as a Director of Chemical Financial Corporation (bank holding company, 1993-2012) and Tyco International, Ltd. (multinational manufacturing and services, 2007-2012). |
David M. Thomas (1949) |
Year of Election or Appointment: 2008 Trustee |
| Mr. Thomas also serves as Trustee of other Fidelity funds. Mr. Thomas serves as Non-Executive Chairman of the Board of Directors of Fortune Brands Home and Security (home and security products, 2011-present), and as a member of the Board of Directors of Interpublic Group of Companies, Inc. (marketing communication, 2004-present). Previously, Mr. Thomas served as Executive Chairman (2005-2006) and Chairman and Chief Executive Officer (2000-2005) of IMS Health, Inc. (pharmaceutical and healthcare information solutions), and a Director of Fortune Brands, Inc. (consumer products, 2000-2011). |
+ The information above includes each Trustee's principal occupation during the last five years and other information relating to the experience, attributes, and skills relevant to each Trustee's qualifications to serve as a Trustee, which led to the conclusion that each Trustee should serve as a Trustee for the fund.
Advisory Board Member and Officers:
Correspondence intended for each officer and Peter S. Lynch may be sent to Fidelity Investments, 245 Summer Street, Boston, Massachusetts 02210. Officers appear below in alphabetical order.
Name, Year of Birth; Principal Occupation |
Peter S. Lynch (1944) |
Year of Election or Appointment: 2003 Member of the Advisory Board |
| Mr. Lynch also serves as Member of the Advisory Board of other Fidelity funds. Mr. Lynch is Vice Chairman and a Director of FMR and FMR Co., Inc. In addition, Mr. Lynch serves as a Trustee of Boston College and as the Chairman of the Inner-City Scholarship Fund. Previously, Mr. Lynch served on the Special Olympics International Board of Directors (1997-2006). |
Elizabeth Paige Baumann (1968) |
Year of Election or Appointment: 2012 Anti-Money Laundering (AML) Officer |
| Ms. Baumann also serves as AML Officer of other funds. She is Chief AML Officer of FMR LLC (2012-present) and is an employee of Fidelity Investments. Previously, Ms. Baumann served as Vice President and Deputy Anti-Money Laundering Officer (2007-2012). |
William C. Coffey (1969) |
Year of Election or Appointment: 2009 Assistant Secretary |
| Mr. Coffey also serves as Assistant Secretary of other funds. He is Senior Vice President and Deputy General Counsel of FMR LLC (2010-present), and is an employee of Fidelity Investments. Previously, Mr. Coffey served as Vice President and Associate General Counsel of FMR LLC (2005-2009). |
Jonathan Davis (1968) |
Year of Election or Appointment: 2010 Assistant Treasurer |
| Mr. Davis also serves as Assistant Treasurer of other funds. Mr. Davis is an employee of Fidelity Investments. Previously, Mr. Davis served as Vice President and Associate General Counsel of FMR LLC (2003-2010). |
Adrien E. Deberghes (1967) |
Year of Election or Appointment: 2008 Deputy Treasurer |
| Mr. Deberghes also serves as an officer of other funds. He is an employee of Fidelity Investments (2008-present). Prior to joining Fidelity Investments, Mr. Deberghes was Senior Vice President of Mutual Fund Administration at State Street Corporation (2007-2008), Senior Director of Mutual Fund Administration at Investors Bank & Trust (2005-2007), and Director of Finance for Dunkin' Brands (2000-2005). |
Stephanie J. Dorsey (1969) |
Year of Election or Appointment: 2010 Assistant Treasurer |
| Ms. Dorsey also serves as an officer of other funds. She is an employee of Fidelity Investments (2008-present) and has served in other fund officer roles. Prior to joining Fidelity Investments, Ms. Dorsey served as Treasurer (2004-2008) of the JPMorgan Mutual Funds and Vice President (2004-2008) of JPMorgan Chase Bank. |
Howard J. Galligan III (1966) |
Year of Election or Appointment: 2014 Chief Financial Officer |
| Mr. Galligan also serves as Chief Financial Officer of other funds. Mr. Galligan serves as President of Fidelity Pricing and Cash Management Services (FPCMS) (2014-present) and as a Director of Strategic Advisers, Inc. (2008-present). Previously, Mr. Galligan served as Chief Administrative Officer of Asset Management (2011-2014) and Chief Operating Officer and Senior Vice President of Investment Support for Strategic Advisers, Inc. (2003-2011). |
Scott C. Goebel (1968) |
Year of Election or Appointment: 2008 Secretary and Chief Legal Officer (CLO) |
| Mr. Goebel serves as Secretary and CLO of other funds. Mr. Goebel also serves as Secretary of Fidelity SelectCo, LLC (2013-present), Fidelity Investments Money Management, Inc. (FIMM) (2010-present) and Fidelity Research and Analysis Company (FRAC) (2010-present); General Counsel, Secretary, and Senior Vice President of FMR (2008-present) and FMR Co., Inc. (2008-present); Chief Legal Officer of Fidelity Management & Research (Hong Kong) Limited (2008-present); and Assistant Secretary of Fidelity Management & Research (Japan) Inc. (2008-present) and Fidelity Management & Research (U.K.) Inc. (2008-present). Previously, Mr. Goebel served as Secretary and CLO of other Fidelity funds (2008-2013), Assistant Secretary of FIMM (2008-2010), FRAC (2008-2010), and certain funds (2007-2008); and as Vice President and Secretary of Fidelity Distributors Corporation (FDC) (2005-2007). Mr. Goebel has been employed by FMR LLC or an affiliate since 2001. |
Brian B. Hogan (1964) |
Year of Election or Appointment: 2009 Vice President |
| Mr. Hogan also serves as Trustee or Vice President of other funds. Mr. Hogan serves as President of FMR's Equity Division (2009-present). Previously, Mr. Hogan served as Senior Vice President, Equity Research of FMR (2006-2009) and as a portfolio manager. |
Chris Maher (1972) |
Year of Election or Appointment: 2013 Assistant Treasurer |
| Mr. Maher serves as Assistant Treasurer of other funds. Mr. Maher is Vice President of Valuation Oversight and is an employee of Fidelity Investments. Previously, Mr. Maher served as Vice President of Asset Management Compliance (2013), Vice President of FMR's Program Management Group (2010-2013), and Vice President of Valuation Oversight (2008-2010). |
Melissa M. Reilly (1971) |
Year of Election or Appointment: 2014 Vice President of certain Equity Funds |
| Ms. Reilly also serves as Vice President of other funds. Ms. Reilly is an employee of Fidelity Investments (2004-present). |
Kenneth B. Robins (1969) |
Year of Election or Appointment: 2008 President and Treasurer |
| Mr. Robins also serves as an officer of other funds. Mr. Robins serves as Executive Vice President of Fidelity Investments Money Management, Inc. (FIMM) (2013-present) and is an employee of Fidelity Investments (2004-present). Previously, Mr. Robins served in other fund officer roles. |
Stephen Sadoski (1971) |
Year of Election or Appointment: 2012 Deputy Treasurer |
| Mr. Sadoski also serves as Deputy Treasurer of other funds. He is an employee of Fidelity Investments (2012-present) and has served in another fund officer role. Prior to joining Fidelity Investments, Mr. Sadoski served as an assistant chief accountant in the Division of Investment Management of the Securities and Exchange Commission (SEC) (2009-2012) and as a senior manager at Deloitte & Touche LLP (1997-2009). |
Stacie M. Smith (1974) |
Year of Election or Appointment: 2013 Deputy Treasurer |
| Ms. Smith also serves as an officer of other funds. She is an employee of Fidelity Investments (2009-present) and has served in other fund officer roles. Prior to joining Fidelity Investments, Ms. Smith served as Senior Audit Manager of Ernst & Young LLP (1996-2009). |
Renee Stagnone (1975) |
Year of Election or Appointment: 2013 Deputy Treasurer |
| Ms. Stagnone also serves as Deputy Treasurer of other funds. Ms. Stagnone is an employee of Fidelity Investments. |
Linda J. Wondrack (1964) |
Year of Election or Appointment: 2014 Chief Compliance Officer |
| Ms. Wondrack also serves as Chief Compliance Officer of other funds. Ms. Wondrack is Executive Vice President and head of the Ethics Office and Asset Management Compliance for Fidelity Investments (2012-present). Ms. Wondrack also serves as Chief Compliance Officer of Fidelity SelectCo, LLC (2014-present); Chief Compliance Officer of Impresa Management LLC (2013-present); and Chief Compliance Officer of FMR Co., Inc., Fidelity Investments Money Management, Inc., Fidelity Management & Research (Japan) Inc., Fidelity Management & Research (U.K.) Inc., Fidelity Management & Research (Hong Kong), Fidelity Management & Research Company, Pyramis Global Advisors, LLC, and Strategic Advisers, Inc., Ballyrock Investment Advisors LLC, and Northern Neck Investors LLC (2012-present). Previously, Ms. Wondrack served as Senior Vice President and Chief Compliance Officer for Columbia Management Investment Advisers, LLC (2005-2012); Chief Compliance Officer for certain funds within the Columbia Family of Funds (2007-2012); and Senior Vice President of Compliance Risk Management at Bank of America (2005-2010). |
Joseph F. Zambello (1957) |
Year of Election or Appointment: 2011 Deputy Treasurer |
| Mr. Zambello also serves as Deputy Treasurer of other funds. Mr. Zambello is an employee of Fidelity Investments. Previously, Mr. Zambello served as Vice President of FMR's Program Management Group (2009-2011) and Vice President of the Transfer Agent Oversight Group (2005-2009). |
Annual Report
Class K designates 100% of the dividends distributed during the fiscal year as qualifying for the dividends-received deduction for corporate shareholders.
Class K designates 100% of the dividends distributed during the fiscal year as amounts which may be taken into account as a dividend for the purposes of the maximum rate under section 1(h)(11) of the Internal Revenue Code.
The fund will notify shareholders in January 2015 of amounts for use in preparing 2014 income tax returns.
Annual Report
Board Approval of Investment Advisory Contracts and Management Fees
Fidelity Growth & Income Portfolio
Each year, the Board of Trustees, including the Independent Trustees (together, the Board), votes on the renewal of the management contract with Fidelity Management & Research Company (FMR) and the sub-advisory agreements (together, the Advisory Contracts) for the fund. The Board, assisted by the advice of fund counsel and Independent Trustees' counsel, requests and considers a broad range of information relevant to the renewal of the Advisory Contracts throughout the year.
The Board meets regularly and, at each of its meetings, covers an extensive agenda of topics and materials and considers factors that are relevant to its annual consideration of the renewal of the fund's Advisory Contracts, including the services and support provided to the fund and its shareholders. The Board has established various standing committees (Committees), each composed of and chaired by Independent Trustees with varying backgrounds, to which the Board has assigned specific subject matter responsibilities in order to enhance effective decision-making by the Board. The Board, acting directly and through its Committees, requests and receives information concerning the annual consideration of the renewal of the fund's Advisory Contracts. The Board also meets as needed to consider matters specifically related to the Board's annual consideration of the renewal of the Advisory Contracts. Members of the Board may also meet with trustees of other Fidelity funds through ad hoc joint committees to discuss certain matters relevant to the Fidelity funds.
At its July 2014 meeting, the Board, including the Independent Trustees, unanimously determined to renew the fund's Advisory Contracts. In reaching its determination, the Board considered all factors it believed relevant, including (i) the nature, extent, and quality of the services to be provided to the fund and its shareholders (including the investment performance of the fund); (ii) the competitiveness of the fund's management fee and total expense ratio relative to peer funds; (iii) the total costs of the services to be provided by and the profits to be realized by Fidelity from its relationship with the fund; (iv) the extent to which economies of scale exist and would be realized as the fund grows; and (v) whether fee levels reflect these economies of scale, if any, for the benefit of fund shareholders. In connection with separate internal corporate reorganizations involving Fidelity Management & Research (U.K.) Inc. (FMR U.K.) and Fidelity Management & Research (Japan) Inc. (FMR Japan), the Board approved certain non-material amendments to the fund's sub-advisory agreements with FMR U.K. and FMR Japan to reflect that, after these reorganizations, FMR Investment Management (UK) Limited and Fidelity Management & Research (Japan) Limited will carry on the business of FMR U.K. and FMR Japan, respectively. The Board noted that no changes to the portfolio managers or to the foreign research or investment advisory services provided to the fund were expected in connection with either reorganization and that the same personnel and resources would continue to be available to the fund at the new entities.
Annual Report
In considering whether to renew the Advisory Contracts for the fund, the Board reached a determination, with the assistance of fund counsel and Independent Trustees' counsel and through the exercise of its business judgment, that the renewal of the Advisory Contracts was in the best interests of the fund and its shareholders and that the compensation payable under the Advisory Contracts was fair and reasonable. The Board's decision to renew the Advisory Contracts was not based on any single factor, but rather was based on a comprehensive consideration of all the information provided to the Board at its meetings throughout the year. The Board, in reaching its determination to renew the Advisory Contracts, was aware that shareholders of the fund have a broad range of investment choices available to them, including a wide choice among funds offered by Fidelity's competitors, and that the fund's shareholders, who have the opportunity to review and weigh the disclosure provided by the fund in its prospectus and other public disclosures, have chosen to invest in this fund, which is part of the Fidelity family of funds.
Nature, Extent, and Quality of Services Provided. The Board considered Fidelity's staffing as it relates to the fund, including the backgrounds of investment personnel of FMR and the sub-advisers (together, the Investment Advisers), and also considered the fund's investment objective, strategies, and related investment philosophy. The Independent Trustees also had discussions with senior management of Fidelity's investment operations and investment groups. The Board considered the structure of the portfolio manager compensation program and whether this structure provides appropriate incentives to act in the best interests of the fund. Additionally, the Board considered the portfolio managers' investments, if any, in the funds that they manage.
Resources Dedicated to Investment Management and Support Services. The Board and the Fund Oversight and Research Committees reviewed the general qualifications and capabilities of Fidelity's investment staff, including its size, education, experience, and resources, as well as Fidelity's approach to recruiting, training, managing, and compensating investment personnel. The Board noted that Fidelity has continued to increase the resources devoted to non-U.S. offices, including expansion of Fidelity's global investment organization. The Board also noted that Fidelity's analysts have extensive resources, tools and capabilities that allow them to conduct sophisticated quantitative and fundamental analysis, as well as credit analysis of issuers, counterparties and guarantors. Further, the Board believes that Fidelity's investment professionals have sufficient access to global information and data so as to provide competitive investment results over time, and that those professionals also have access to sophisticated tools that permit them to assess portfolio construction and risk and performance attribution characteristics continuously, as well as to transmit new information and research conclusions rapidly around the world. Additionally, in its deliberations, the Board considered Fidelity's trading and risk management capabilities and resources and global compliance infrastructure, which are an integral part of the investment management process.
Annual Report
Board Approval of Investment Advisory Contracts and
Management Fees - continued
Shareholder and Administrative Services. The Board considered (i) the nature, extent, quality, and cost of advisory, administrative, and shareholder services performed by the Investment Advisers and their affiliates under the Advisory Contracts and under separate agreements covering transfer agency, pricing and bookkeeping, and securities lending services for the fund; (ii) the nature and extent of the supervision of third party service providers, principally custodians and subcustodians; and (iii) the resources devoted to, and the record of compliance with, the fund's compliance policies and procedures. The Board also reviewed the allocation of fund brokerage, including allocations to brokers affiliated with the Investment Advisers, the use of brokerage commissions to pay fund expenses, and the use of "soft" commission dollars to pay for research services.
The Board noted that the growth of fund assets over time across the complex allows Fidelity to reinvest in the development of services designed to enhance the value or convenience of the Fidelity funds as investment vehicles. These services include 24-hour access to account information and market information through telephone representatives and over the Internet, investor education materials and asset allocation tools, and the expanded availability of Fidelity Investor Centers.
In 2014, the Board formed an ad hoc Committee on Transfer Agency Fees to review the variety of transfer agency fee structures throughout the industry and Fidelity's competitive positioning with respect to industry participants.
Investment in a Large Fund Family. The Board considered the benefits to shareholders of investing in a Fidelity fund, including the benefits of investing in a fund that is part of a large family of funds offering a variety of investment disciplines and providing a large variety of mutual fund investor services. The Board noted that Fidelity had taken, or had made recommendations that resulted in the Fidelity funds taking, a number of actions over the previous year that benefited particular funds, including (i) continuing to dedicate additional resources to investment research and to the support of the senior management team that oversees asset management; (ii) persisting in efforts to enhance Fidelity's global research capabilities; (iii) launching new funds and making other enhancements to meet client needs for income-oriented solutions; (iv) reducing fund expenses for certain index funds; (v) continuing to launch dedicated lower cost underlying funds to meet portfolio construction needs related to expanding underlying fund options for Fidelity funds of funds, specifically for the Freedom Fund product lines; (vi) rationalizing product lines and gaining increased efficiencies through fund mergers; (vii) launching sector-based exchange-traded funds and establishing a new Fidelity adviser to manage sector-based funds and products; (viii) continuing to develop and implement technology to improve security and increase efficiency; (ix) modifying the eligibility criteria for certain share classes to increase their marketability to a portion of the defined contribution plan market; (x) waiving redemption fees for certain qualified fund-of-fund and wrap programs and certain retirement plan transactions; and (xi) launching new Institutional Class shares of certain money market funds to attract and retain assets and to fill a gap in the money market fund lineup.
Annual Report
Investment Performance. The Board considered whether the fund has operated in accordance with its investment objective, as well as its record of compliance with its investment restrictions and its performance history.
The Board took into account discussions with the Investment Advisers about fund investment performance that occur at Board meetings throughout the year. In this regard the Board noted that as part of regularly scheduled fund reviews and other reports to the Board on fund performance, the Board periodically considers annualized return information for the fund, for different time periods, measured against a securities market index ("benchmark index") and a peer group of funds with similar objectives ("peer group"). In its evaluation of fund investment performance, the Board gave particular attention to information indicating changes in performance of certain Fidelity funds for specific time periods and the Investment Advisers' explanations for any overperformance or underperformance.
In addition to reviewing absolute and relative fund performance, the Independent Trustees periodically consider the appropriateness of fund performance metrics in evaluating the results achieved. In general, the Independent Trustees believe that fund performance should be evaluated based on net performance (after fees and expenses) of both the highest performing and lowest performing classes, where applicable, compared to appropriate benchmark indices, over appropriate time periods which may include full market cycles, and compared to peer groups, as applicable, over the same periods, taking into account relevant factors including the following: general market conditions; issuer-specific information; tactical opportunities for investment; and fund cash flows and other factors.
The Independent Trustees recognize that shareholders evaluate performance on a net basis over their own holding periods, for which one-, three-, and five-year periods are often used as a proxy. For this reason, the performance information reviewed by the Board also included net cumulative calendar year total return information for the fund and an appropriate benchmark index and peer group for the most recent one-, three-, and five-year periods, as shown below. Returns are shown compared to the 25th percentile (top of box, 75% beaten) and 75th percentile (bottom of box, 25% beaten) of the peer universe.
Annual Report
Board Approval of Investment Advisory Contracts and
Management Fees - continued
Fidelity Growth & Income Portfolio

Based on its review, the Board concluded that the nature, extent, and quality of services provided to the fund under the Advisory Contracts should benefit the fund's shareholders.
Competitiveness of Management Fee and Total Expense Ratio. The Board considered the fund's management fee and total expense ratio compared to "mapped groups" of competitive funds and classes. Fidelity creates "mapped groups" by combining similar Lipper investment objective categories that have comparable investment mandates. Combining Lipper investment objective categories aids the Board's management fee and total expense ratio comparisons by broadening the competitive group used for comparison and by reducing the number of universes to which various Fidelity funds are compared.
Management Fee. The Board considered two proprietary management fee comparisons for the 12-month periods shown in the chart below. The group of Lipper funds used by the Board for management fee comparisons is referred to below as the "Total Mapped Group." The Total Mapped Group comparison focuses on a fund's standing in terms of gross management fees before expense reimbursements or caps relative to the total universe of funds with comparable investment mandates, regardless of whether their management fee structures also are comparable. Funds with comparable investment mandates offer exposure to similar types of securities. Funds with comparable management fee structures have similar management fee contractual arrangements (e.g., flat rate charged for advisory services, all-inclusive fee rate, etc.). "TMG %" represents the percentage of funds in the Total Mapped Group that had management fees that were lower than the fund's. For example, a hypothetical TMG % of 20% would mean that 80% of the funds in the Total Mapped Group had higher, and 20% had lower, management fees than the fund. The fund's actual TMG %s are in the chart below. The "Asset-Size Peer Group" (ASPG) comparison focuses on a fund's standing relative to a subset of non-Fidelity funds within the Total Mapped Group that are similar in size and management fee structure. For example, if a fund is in the first quartile of the ASPG, the fund's management fee ranks in the least expensive or lowest 25% of funds in the ASPG. The ASPG represents at least 15% of the funds in the Total Mapped Group with comparable asset size and management fee structures, subject to a minimum of 50 funds (or all funds in the Total Mapped Group if fewer than 50). Additional information, such as the ASPG quartile in which the fund's management fee rate ranked, is also included in the chart and considered by the Board.
Annual Report
Fidelity Growth & Income Portfolio
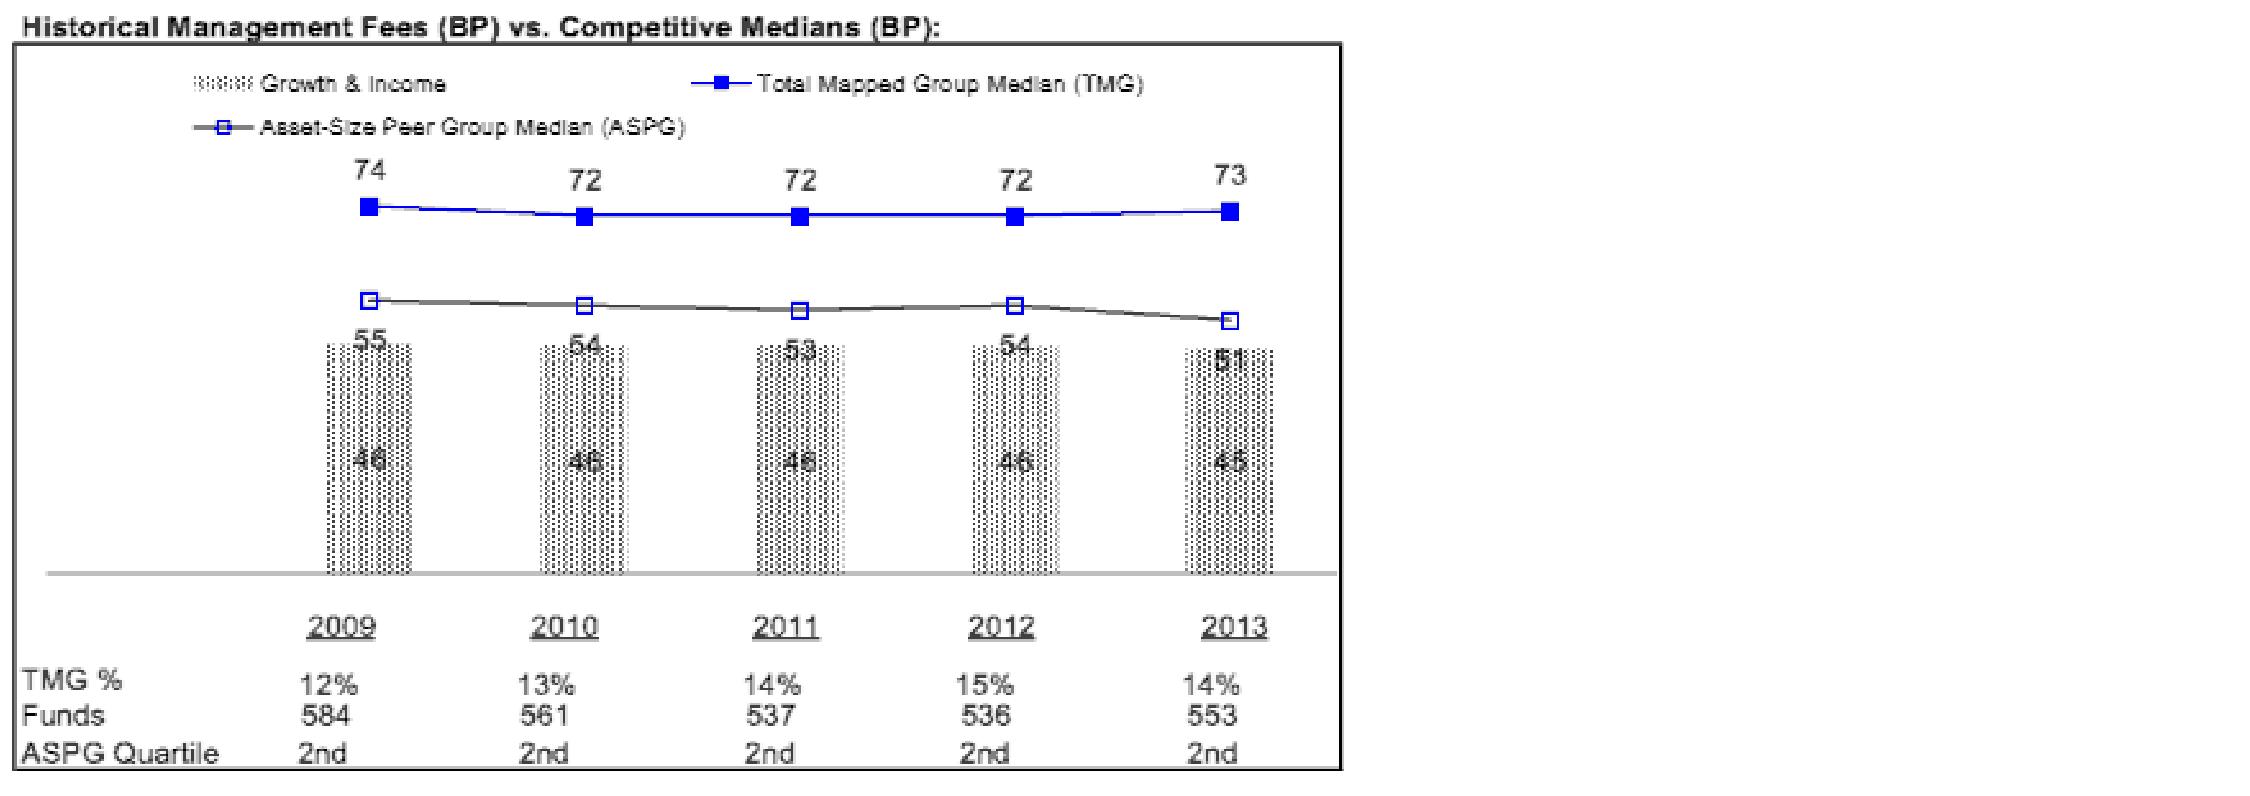
The Board noted that the fund's management fee rate ranked below the median of its Total Mapped Group and below the median of its ASPG for 2013.
The Board also noted that, in August 2013, the ad hoc Committee on Management Fees was formed to conduct an in-depth review of the management fee rates of Fidelity's active equity mutual funds. The Committee focused on the following areas: (i) standard fee structures; (ii) research consumption and trading evolution; (iii) management fee competitiveness/profitability by category; and (iv) factors that drive institutional pricing.
Based on its review, the Board concluded that the fund's management fee is fair and reasonable in light of the services that the fund receives and the other factors considered.
Annual Report
Board Approval of Investment Advisory Contracts and
Management Fees - continued
Total Expense Ratio. In its review of each class's total expense ratio, the Board considered the fund's management fee as well as other fund or class expenses, as applicable, such as transfer agent fees, pricing and bookkeeping fees, and custodial, legal, and audit fees. The Board also noted the effects of any waivers and reimbursements on fees and expenses. As part of its review, the Board also considered the current and historical total expense ratios of each class of the fund compared to competitive fund median expenses. Each class of the fund is compared to those funds and classes in the Total Mapped Group (used by the Board for management fee comparisons) that have a similar sales load structure.
The Board noted that the total expense ratio of each class ranked below its competitive median for 2013.
Fees Charged to Other Fidelity Clients. The Board also considered Fidelity fee structures and other information with respect to clients of Fidelity, such as other funds advised or subadvised by Fidelity, pension plan clients, and other institutional clients. The Board noted the findings of the 2013 ad hoc joint committee (created with the board of other Fidelity funds), which reviewed and compared Fidelity's institutional investment advisory business with its business of providing services to the Fidelity funds, including the differences in services provided, fees charged, and costs incurred, as well as competition in their respective marketplaces.
Based on its review of total expense ratios and fees charged to other Fidelity clients, the Board concluded that the total expense ratio of each class of the fund was reasonable in light of the services that the fund and its shareholders receive and the other factors considered.
Costs of the Services and Profitability. The Board considered the revenues earned and the expenses incurred by Fidelity in conducting the business of developing, marketing, distributing, managing, administering and servicing the fund and servicing the fund's shareholders. The Board also considered the level of Fidelity's profits in respect of all the Fidelity funds.
On an annual basis, Fidelity presents to the Board Fidelity's profitability for the fund. Fidelity calculates the profitability for each fund, as well as aggregate profitability for groups of Fidelity funds and all Fidelity funds, using a series of detailed revenue and cost allocation methodologies which originate with the books and records of Fidelity on which Fidelity's audited financial statements are based. The Audit Committee of the Board reviews any significant changes from the prior year's methodologies.
PricewaterhouseCoopers LLP (PwC), independent registered public accounting firm and auditor to Fidelity and certain Fidelity funds, has been engaged annually by the Board as part of the Board's assessment of Fidelity's profitability analysis. PwC's engagement includes the review and assessment of the methodologies used by Fidelity in determining the revenues and expenses attributable to Fidelity's mutual fund business, and completion of agreed-upon procedures in respect of the mathematical accuracy of fund profitability and its conformity to established allocation methodologies. After considering PwC's reports issued under the engagement and information provided by Fidelity, the Board concluded that while other allocation methods may also be reasonable, Fidelity's profitability methodologies are reasonable in all material respects.
Annual Report
The Board also reviewed Fidelity's non-fund businesses and fall-out benefits related to the mutual fund business as well as cases where Fidelity's affiliates may benefit from or be related to the fund's business.
The Board considered the costs of the services provided by and the profits realized by Fidelity in connection with the operation of the fund and was satisfied that the profitability was not excessive in the circumstances.
Economies of Scale. The Board considered whether there have been economies of scale in respect of the management of the Fidelity funds, whether the Fidelity funds (including the fund) have appropriately benefited from any such economies of scale, and whether there is potential for realization of any further economies of scale. The Board considered the extent to which the fund will benefit from economies of scale through increased services to the fund, through waivers or reimbursements, or through fee or expense ratio reductions. The Board also noted that in 2013, it and the boards of other Fidelity funds created an ad hoc committee (the Economies of Scale Committee) to analyze whether Fidelity attains economies of scale in respect of the management and servicing of the Fidelity funds, whether the Fidelity funds have appropriately benefited from such economies of scale, and whether there is potential for realization of any further economies of scale.
The Board recognized that the fund's management contract incorporates a "group fee" structure, which provides for lower group fee rates as total group assets increase, and for higher group fee rates as total group assets decrease (with "group assets" defined to include fund assets under FMR's management plus sector fund assets previously under FMR's management and currently managed by Fidelity SelectCo, LLC). FMR calculates the group fee rates based on a tiered asset "breakpoint" schedule that varies based on asset class. The Board considered that the group fee is designed to deliver the benefits of economies of scale to fund shareholders when total Fidelity fund assets increase, even if assets of any particular fund are unchanged or have declined, because some portion of Fidelity's costs are attributable to services provided to all Fidelity funds, and all funds benefit if those costs can be allocated among more assets. The Board concluded that, given the group fee structure, fund shareholders will benefit from lower management fees as group assets increase at the fund complex level, regardless of whether Fidelity achieves any such economies of scale.
Annual Report
Board Approval of Investment Advisory Contracts and
Management Fees - continued
The Board concluded, taking into account the analysis of the Economies of Scale Committee, that economies of scale, if any, are being appropriately shared between fund shareholders and Fidelity.
Additional Information Requested by the Board. In order to develop fully the factual basis for consideration of the Fidelity funds' Advisory Contracts, the Board requested and received additional information on certain topics, including: (i) fund performance trends and Fidelity's long-term strategies for certain funds; (ii) Fidelity's strategic marketing and product lineup goals; (iii) the methodology with respect to competitive fund data and peer group classifications; (iv) the arrangements with, and performance of, certain sub-advisers on behalf of the Fidelity funds, as well as certain proposed participating affiliate arrangements; (v) the realization of fall-out benefits in certain Fidelity business units; (vi) Fidelity's group fee structures, including the rationale for the individual fee rates of certain categories of funds and the definition of group assets; (vii) trends regarding industry use of performance fee structures and the performance adjustment methodologies applicable to the Fidelity funds; (viii) additional competitive analysis regarding the total expenses for certain classes; (ix) fund profitability methodology, including Fidelity's cost allocation methodology, and the impact of certain factors on fund profitability results; and (x) the process by which Fidelity determines sub-advisory fees for funds it advises.
Based on its evaluation of all of the conclusions noted above, and after considering all factors it believed relevant, the Board ultimately concluded that the advisory fee structures are fair and reasonable, and that the fund's Advisory Contracts should be renewed.
Annual Report
Investment Adviser
Fidelity Management & Research Company
Boston, MA
Investment Sub-Advisers
FMR Co., Inc.
Fidelity Management & Research
(U.K.) Inc.
Fidelity Management & Research
(Japan) Inc.
Fidelity Management & Research
(Hong Kong) Limited
General Distributor
Fidelity Distributors Corporation
Smithfield, RI
Transfer and Service Agents
Fidelity Investments Institutional
Operations Company, Inc.
Boston, MA
Fidelity Service Company, Inc.
Boston, MA
Custodian
Northern Trust Company
Chicago, IL
(Fidelity Investment logo)(registered trademark)
Corporate Headquarters
245 Summer St., Boston, MA 02210
www.fidelity.com
GAI-K-UANN-0914
1.863229.105
Fidelity®
Leveraged Company Stock
Fund
Annual Report
July 31, 2014
(Fidelity Cover Art)
Contents
Performance | (Click Here) | How the fund has done over time. |
Management's Discussion of Fund Performance | (Click Here) | The Portfolio Manager's review of fund performance and strategy. |
Shareholder Expense Example | (Click Here) | An example of shareholder expenses. |
Investment Changes | (Click Here) | A summary of major shifts in the fund's investments over the last six months. |
Investments | (Click Here) | A complete list of the fund's investments with their market values. |
Financial Statements | (Click Here) | Statements of assets and liabilities, operations, and changes in net assets, as well as financial highlights. |
Notes | (Click Here) | Notes to the financial statements. |
Report of Independent Registered Public Accounting Firm | (Click Here) | |
Trustees and Officers | (Click Here) | |
Distributions | (Click Here) | |
Board Approval of Investment Advisory Contracts and Management Fees | (Click Here) | |
To view a fund's proxy voting guidelines and proxy voting record for the 12-month period ended June 30, visit http://www.fidelity.com/proxyvotingresults or visit the Securities and Exchange Commission's (SEC) web site at http://www.sec.gov. You may also call 1-800-544-8544 to request a free copy of the proxy voting guidelines.
Standard & Poor's, S&P and S&P 500 are registered service marks of The McGraw-Hill Companies, Inc. and have been licensed for use by Fidelity Distributors Corporation.
Other third-party marks appearing herein are the property of their respective owners.
All other marks appearing herein are registered or unregistered trademarks or service marks of FMR LLC or an affiliated company. © 2014 FMR LLC. All rights reserved.
Annual Report
This report and the financial statements contained herein are submitted for the general information of the shareholders of the fund. This report is not authorized for distribution to prospective investors in the fund unless preceded or accompanied by an effective prospectus.
A fund files its complete schedule of portfolio holdings with the SEC for the first and third quarters of each fiscal year on Form N-Q. Forms N-Q are available on the SEC's web site at http://www.sec.gov. A fund's Forms N-Q may be reviewed and copied at the SEC's Public Reference Room in Washington, DC. Information regarding the operation of the SEC's Public Reference Room may be obtained by calling 1-800-SEC-0330. For a complete list of a fund's portfolio holdings, view the most recent holdings listing, semiannual report, or annual report on Fidelity's web site at http://www.fidelity.com, http://www.advisor.fidelity.com, or http://www.401k.com, as applicable.
NOT FDIC INSURED • MAY LOSE VALUE • NO BANK GUARANTEE
Neither the fund nor Fidelity Distributors Corporation is a bank.
Annual Report
Average annual total return reflects the change in the value of an investment, assuming reinvestment of the class' distributions from dividend income and capital gains (the profits earned upon the sale of securities that have grown in value, if any) and assuming a constant rate of performance each year. The $10,000 table and the fund's returns do not reflect the deduction of taxes that a shareholder would pay on fund distributions or the redemption of fund shares. During periods of reimbursement by Fidelity, a fund's total return will be greater than it would be had the reimbursement not occurred. How a fund did yesterday is no guarantee of how it will do tomorrow.
Average Annual Total Returns
Periods ended July 31, 2014 | Past 1
year | Past 5
years | Past 10
years |
Fidelity® Leveraged Company Stock Fund | 16.96% | 19.32% | 11.20% |
$10,000 Over 10 Years
Let's say hypothetically that $10,000 was invested in Fidelity® Leveraged Company Stock Fund, a class of the fund, on July 31, 2004. The chart shows how the value of your investment would have changed, and also shows how the S&P 500® Index performed over the same period.
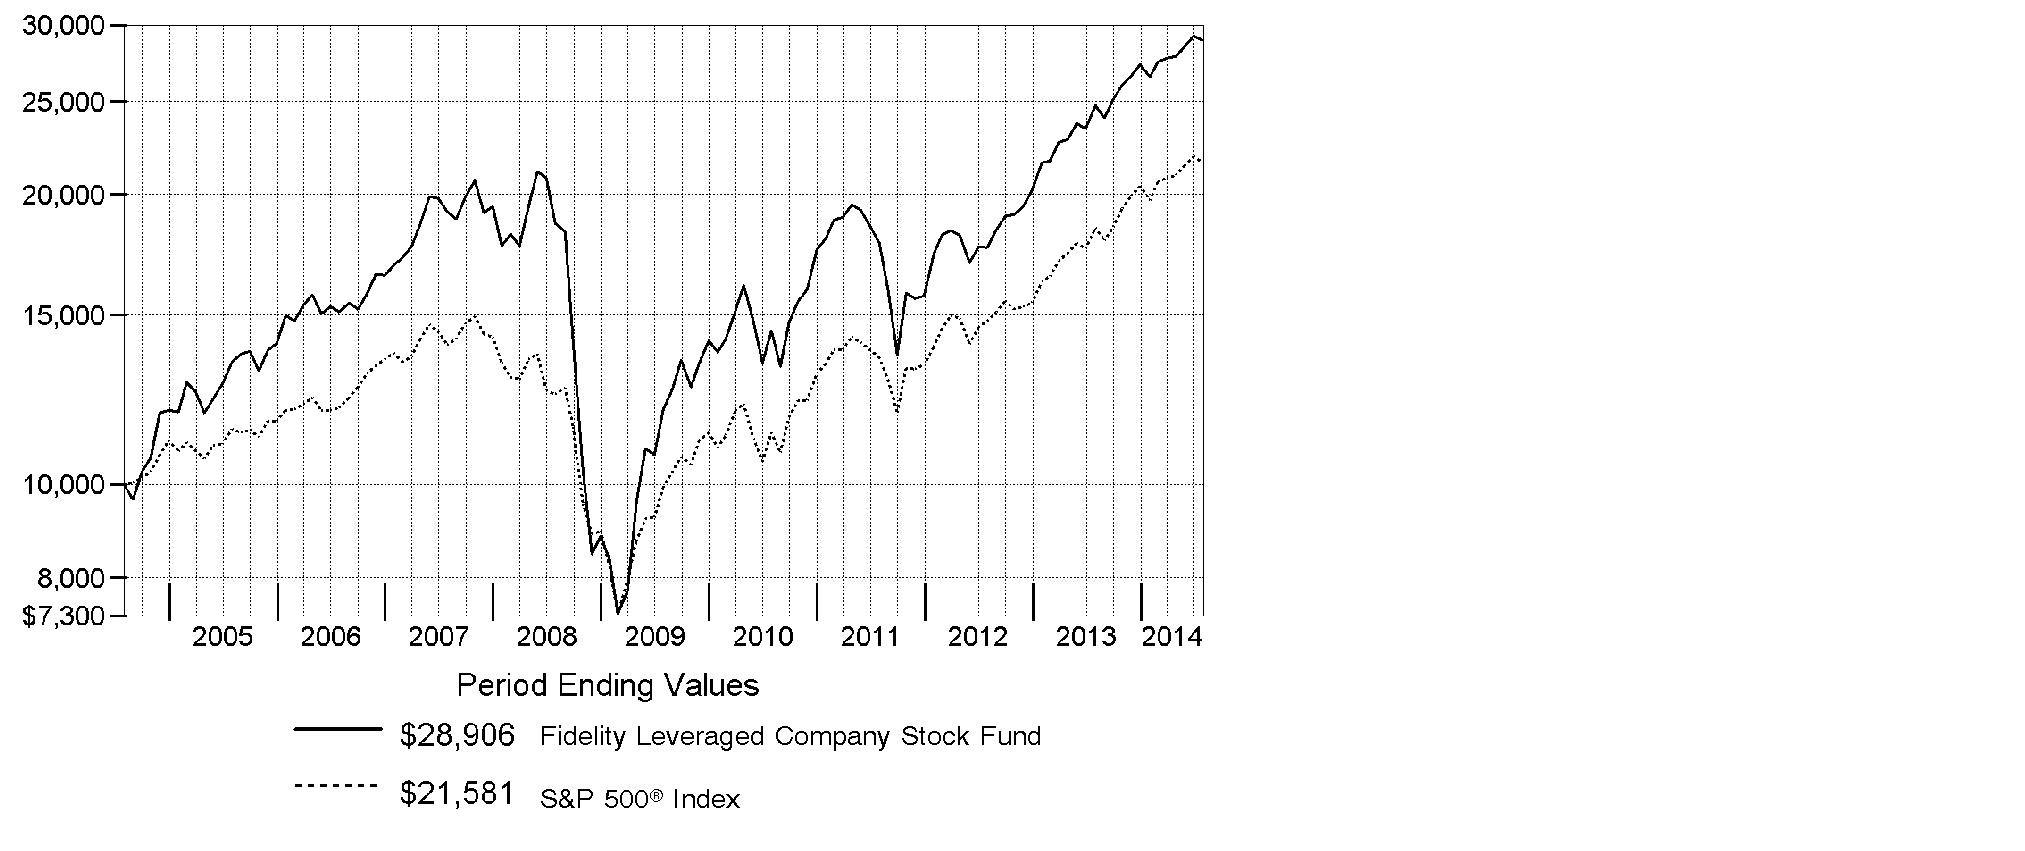
Annual Report
Market Recap: U.S. stocks overcame a slowing economy early in 2014 to post a strong gain for the 12-month period ending July 31, 2014, supported by corporate profits and continued low interest rates. The S&P 500® Index rose 16.94%, reaching an all-time high near period end. The technology-heavy Nasdaq Composite Index® gained 22.00%. The Russell 2000® Index returned 8.56%, reflecting the relatively lackluster performance of small-cap stocks. Information technology (+28%) was the top-performing sector within the S&P 500®, driven by strong semiconductor and computer hardware sales. Materials (+23%) gained amid higher prices for many commodity products. Health care (+21%) rose, driven by gains in pharmaceuticals, biotechnology & life sciences companies. Energy stocks (+19%) advanced in the latter part of the period amid healthy U.S. output and the threat of supply disruptions in Iraq. Conversely, most defensive sectors, including consumer staples, utilities and telecommunication services, lagged the broader market. Volatility remained tame throughout most of the period, with markets supported by declining unemployment, near-record profit margins for companies, muted cost inflation and fairly low corporate debt levels. Geopolitical tension remained a concern at period end, with conflict in Ukraine and strained relations between Russia and the West posing a potential threat to global growth.
Comments from Thomas Soviero, Portfolio Manager of Fidelity® Leveraged Company Stock Fund: For the year, the fund's Retail Class shares returned 16.96%, compared with 16.94% for the S&P 500® Index. I continued to concentrate the fund in what I considered to be my best ideas. I remained concerned about the health of economies abroad, so I maintained a relatively defensive posture, highlighting U.S.-centric investments and holding an average weighting of 6% in cash during the period. This cash stance was a drag on performance relative to the S&P 500®. Performance versus the benchmark was buoyed by stock selection in materials and transportation, especially investments in chemicals manufacturer LyondellBasell Industries, as well as Delta Air Lines and American Airlines Group. American was not in the index. Semiconductor manufacturer Micron Technology was another top contributor. On the down side, we were held back by positioning in information technology and consumer discretionary. General Motors was a main detractor, along with video game retailer GameStop and not owning consumer electronics giant and index component Apple.
The views expressed above reflect those of the portfolio manager(s) only through the end of the period as stated on the cover of this report and do not necessarily represent the views of Fidelity or any other person in the Fidelity organization. Any such views are subject to change at any time based upon market or other conditions and Fidelity disclaims any responsibility to update such views. These views may not be relied on as investment advice and, because investment decisions for a Fidelity fund are based on numerous factors, may not be relied on as an indication of trading intent on behalf of any Fidelity fund.
Annual Report
Shareholder Expense Example
As a shareholder of the Fund, you incur two types of costs: (1) transaction costs, including redemption fees and (2) ongoing costs, including management fees and other Fund expenses. This Example is intended to help you understand your ongoing costs (in dollars) of investing in the Fund and to compare these costs with the ongoing costs of investing in other mutual funds.
The Example is based on an investment of $1,000 invested at the beginning of the period and held for the entire period (February 1, 2014 to July 31, 2014).
Actual Expenses
The first line of the accompanying table for each class of the Fund provides information about actual account values and actual expenses. You may use the information in this line, together with the amount you invested, to estimate the expenses that you paid over the period. Simply divide your account value by $1,000.00 (for example, an $8,600 account value divided by $1,000.00 = 8.6), then multiply the result by the number in the first line for a class of the Fund under the heading entitled "Expenses Paid During Period" to estimate the expenses you paid on your account during this period. A small balance maintenance fee of $12.00 that is charged once a year may apply for certain accounts with a value of less than $2,000. This fee is not included in the table below. If it was, the estimate of expenses you paid during the period would be higher, and your ending account value lower, by this amount. In addition, the Fund, as a shareholder in the underlying Fidelity Central Funds, will indirectly bear its pro-rata share of the fees and expenses incurred by the underlying Fidelity Central Funds. These fees and expenses are not included in the Fund's annualized expense ratio used to calculate the expense estimate in the table below.
Hypothetical Example for Comparison Purposes
The second line of the accompanying table for each class of the Fund provides information about hypothetical account values and hypothetical expenses based on a Class' actual expense ratio and an assumed rate of return of 5% per year before expenses, which is not the Class' actual return. The hypothetical account values and expenses may not be used to estimate the actual ending account balance or expenses you paid for the period. You may use this information to compare the ongoing costs of investing in the Fund and other funds. To do so, compare this 5% hypothetical example with the 5% hypothetical examples that appear in the shareholder reports of the other funds. A small balance maintenance fee of $12.00 that is charged once a year may apply for certain accounts with a value of less than $2,000. This fee is not included in the table below. If it was, the estimate of expenses you paid during the period would be higher, and your ending account value lower, by this amount. In addition, the Fund, as a shareholder in the underlying Fidelity Central Funds, will indirectly bear its pro-rata share of the fees and expenses incurred by the underlying Fidelity Central Funds. These fees and expenses are not included in the Fund's annualized expense ratio used to calculate the expense estimate in the table below.
Please note that the expenses shown in the table are meant to highlight your ongoing costs only and do not reflect any transaction costs. Therefore, the second line of the table is useful in comparing ongoing costs only, and will not help you determine the relative total costs of owning different funds. In addition, if these transactional costs were included, your costs would have been higher.
Annual Report
Shareholder Expense Example - continued
| Annualized
Expense RatioB | Beginning
Account Value
February 1, 2014 | Ending
Account Value
July 31, 2014 | Expenses Paid
During Period*
February 1, 2014
to July 31, 2014 |
Leveraged Company Stock | .79% | | | |
Actual | | $ 1,000.00 | $ 1,092.00 | $ 4.10 |
HypotheticalA | | $ 1,000.00 | $ 1,020.88 | $ 3.96 |
Class K | .67% | | | |
Actual | | $ 1,000.00 | $ 1,092.30 | $ 3.48 |
HypotheticalA | | $ 1,000.00 | $ 1,021.47 | $ 3.36 |
A 5% return per year before expenses
B Annualized expense ratio reflects expenses net of applicable fee waivers.
* Expenses are equal to each Class' annualized expense ratio, multiplied by the average account value over the period, multiplied by 181/365 (to reflect the one-half year period).
Annual Report
Investment Changes (Unaudited)
Top Ten Stocks as of July 31, 2014 |
| % of fund's
net assets | % of fund's net assets
6 months ago |
LyondellBasell Industries NV Class A | 10.3 | 8.3 |
Service Corp. International | 3.8 | 3.6 |
Comcast Corp. Class A | 3.8 | 4.5 |
Ford Motor Co. | 2.6 | 2.7 |
General Motors Co. | 2.6 | 3.2 |
Delta Air Lines, Inc. | 2.5 | 2.2 |
Bank of America Corp. | 2.5 | 2.8 |
Boston Scientific Corp. | 2.2 | 2.6 |
GameStop Corp. Class A | 2.0 | 1.9 |
Rock-Tenn Co. Class A | 1.9 | 1.8 |
| 34.2 | |
Top Five Market Sectors as of July 31, 2014 |
| % of fund's
net assets | % of fund's net assets
6 months ago |
Consumer Discretionary | 24.5 | 25.3 |
Materials | 14.6 | 12.8 |
Financials | 11.7 | 12.0 |
Industrials | 11.5 | 11.1 |
Health Care | 10.9 | 11.1 |
Asset Allocation (% of fund's net assets) |
As of July 31, 2014* | As of January 31, 2014** |
| Stocks 98.0% | | | Stocks 95.9% | |
 | Bonds 0.4% | | | Bonds 0.6% | |
 | Convertible
Securities 0.0% | |  | Convertible
Securities 0.1% | |
| Short-Term
Investments and
Net Other Assets (Liabilities) 1.6% | | | Short-Term
Investments and
Net Other Assets (Liabilities) 3.4% | |
* Foreign investments | 17.7% | | ** Foreign investments | 15.2% | |

Annual Report
Investments July 31, 2014
Showing Percentage of Net Assets
Common Stocks - 97.8% |
| Shares | | Value (000s) |
CONSUMER DISCRETIONARY - 24.5% |
Auto Components - 2.5% |
Delphi Automotive PLC | 592,300 | | $ 39,566 |
Tenneco, Inc. (a) | 825,300 | | 52,572 |
TRW Automotive Holdings Corp. (a) | 396,200 | | 40,527 |
| | 132,665 |
Automobiles - 5.6% |
Ford Motor Co. | 8,332,333 | | 141,816 |
General Motors Co. | 4,081,587 | | 138,039 |
General Motors Co.: | | | |
warrants 7/10/16 (a) | 469,476 | | 11,526 |
warrants 7/10/19 (a) | 469,476 | | 7,934 |
Motors Liquidation Co. GUC Trust (a) | 123,112 | | 2,967 |
| | 302,282 |
Diversified Consumer Services - 3.8% |
Service Corp. International | 9,896,727 | | 207,831 |
Hotels, Restaurants & Leisure - 0.6% |
ARAMARK Holdings Corp. | 987,744 | | 26,630 |
Penn National Gaming, Inc. (a) | 360,340 | | 3,776 |
Station Holdco LLC unit (a)(g)(h) | 146,846 | | 56 |
| | 30,462 |
Household Durables - 2.0% |
Hovnanian Enterprises, Inc. Class A (a)(d) | 1,419,000 | | 5,676 |
Lennar Corp. Class A (d) | 677,100 | | 24,531 |
Newell Rubbermaid, Inc. | 2,341,747 | | 76,060 |
| | 106,267 |
Media - 7.1% |
AMC Networks, Inc. Class A (a) | 446,400 | | 26,726 |
Cinemark Holdings, Inc. | 2,601,645 | | 85,334 |
Comcast Corp. Class A | 3,767,334 | | 202,419 |
Gray Television, Inc. (a)(e) | 3,766,164 | | 45,872 |
Nexstar Broadcasting Group, Inc. Class A | 455,698 | | 21,231 |
| | 381,582 |
Specialty Retail - 2.9% |
Asbury Automotive Group, Inc. (a) | 385,122 | | 26,007 |
GameStop Corp. Class A (d) | 2,590,007 | | 108,703 |
Sally Beauty Holdings, Inc. (a) | 808,000 | | 20,968 |
| | 155,678 |
TOTAL CONSUMER DISCRETIONARY | | 1,316,767 |
Common Stocks - continued |
| Shares | | Value (000s) |
CONSUMER STAPLES - 1.7% |
Food Products - 1.4% |
ConAgra Foods, Inc. | 541,700 | | $ 16,321 |
Darling International, Inc. (a) | 3,065,983 | | 57,395 |
| | 73,716 |
Personal Products - 0.3% |
Revlon, Inc. (a) | 553,261 | | 16,874 |
TOTAL CONSUMER STAPLES | | 90,590 |
ENERGY - 10.4% |
Energy Equipment & Services - 2.9% |
Ensco PLC Class A | 110,000 | | 5,572 |
Halliburton Co. | 1,126,593 | | 77,724 |
Noble Corp. | 987,610 | | 30,981 |
Oil States International, Inc. (a) | 270,466 | | 16,577 |
Schlumberger Ltd. | 109,400 | | 11,858 |
Transocean Ltd. (United States) (d) | 381,900 | | 15,406 |
| | 158,118 |
Oil, Gas & Consumable Fuels - 7.5% |
Continental Resources, Inc. (a)(d) | 494,487 | | 72,581 |
Denbury Resources, Inc. | 1,522,200 | | 25,801 |
Hess Corp. | 835,910 | | 82,738 |
HollyFrontier Corp. | 1,549,563 | | 72,845 |
Kodiak Oil & Gas Corp. (a) | 2,019,747 | | 31,387 |
Peabody Energy Corp. | 822,825 | | 12,482 |
Range Resources Corp. | 247,200 | | 18,686 |
Valero Energy Corp. | 1,328,266 | | 67,476 |
Western Refining, Inc. | 451,814 | | 18,506 |
| | 402,502 |
TOTAL ENERGY | | 560,620 |
FINANCIALS - 11.5% |
Banks - 7.9% |
Bank of America Corp. | 8,641,999 | | 131,790 |
Barclays PLC sponsored ADR (d) | 2,441,721 | | 37,065 |
CIT Group, Inc. | 229,310 | | 11,261 |
Citigroup, Inc. | 1,458,047 | | 71,313 |
Huntington Bancshares, Inc. | 8,526,580 | | 83,731 |
Common Stocks - continued |
| Shares | | Value (000s) |
FINANCIALS - continued |
Banks - continued |
Regions Financial Corp. | 5,015,480 | | $ 50,857 |
SunTrust Banks, Inc. | 1,019,600 | | 38,796 |
| | 424,813 |
Consumer Finance - 1.1% |
American Express Co. | 679,548 | | 59,800 |
Insurance - 1.1% |
AFLAC, Inc. | 641,700 | | 38,335 |
Lincoln National Corp. | 435,700 | | 22,826 |
| | 61,161 |
Real Estate Investment Trusts - 1.0% |
Gaming & Leisure Properties | 430,875 | | 14,508 |
Host Hotels & Resorts, Inc. | 1,016,122 | | 22,090 |
Sabra Health Care REIT, Inc. | 547,507 | | 15,166 |
| | 51,764 |
Real Estate Management & Development - 0.3% |
Realogy Holdings Corp. (a) | 463,840 | | 17,051 |
Thrifts & Mortgage Finance - 0.1% |
MGIC Investment Corp. (a) | 441,300 | | 3,261 |
TOTAL FINANCIALS | | 617,850 |
HEALTH CARE - 10.9% |
Health Care Equipment & Supplies - 2.2% |
Boston Scientific Corp. (a) | 9,434,356 | | 120,571 |
Health Care Providers & Services - 5.8% |
Community Health Systems, Inc. (a) | 1,376,027 | | 65,636 |
DaVita HealthCare Partners, Inc. (a) | 532,952 | | 37,541 |
HCA Holdings, Inc. (a) | 1,216,779 | | 79,468 |
Tenet Healthcare Corp. (a) | 1,705,544 | | 90,002 |
Universal Health Services, Inc. Class B | 385,505 | | 41,095 |
| | 313,742 |
Pharmaceuticals - 2.9% |
Johnson & Johnson | 153,000 | | 15,314 |
Merck & Co., Inc. | 1,551,500 | | 88,032 |
Sanofi SA sponsored ADR | 992,534 | | 51,880 |
| | 155,226 |
TOTAL HEALTH CARE | | 589,539 |
Common Stocks - continued |
| Shares | | Value (000s) |
INDUSTRIALS - 11.5% |
Aerospace & Defense - 1.7% |
Honeywell International, Inc. | 478,776 | | $ 43,966 |
Huntington Ingalls Industries, Inc. | 258,160 | | 23,472 |
Textron, Inc. | 602,700 | | 21,920 |
| | 89,358 |
Airlines - 4.2% |
American Airlines Group, Inc. | 1,481,380 | | 57,552 |
Delta Air Lines, Inc. | 3,665,001 | | 137,291 |
Southwest Airlines Co. | 571,283 | | 16,156 |
United Continental Holdings, Inc. (a) | 370,700 | | 17,197 |
| | 228,196 |
Building Products - 0.7% |
Allegion PLC | 246,500 | | 12,677 |
Armstrong World Industries, Inc. (a) | 489,200 | | 23,814 |
| | 36,491 |
Commercial Services & Supplies - 1.3% |
Civeo Corp. | 540,932 | | 13,740 |
Deluxe Corp. | 742,413 | | 40,840 |
Tyco International Ltd. | 328,233 | | 14,163 |
| | 68,743 |
Electrical Equipment - 0.6% |
Emerson Electric Co. | 163,500 | | 10,407 |
Generac Holdings, Inc. (a)(d) | 490,557 | | 21,290 |
| | 31,697 |
Industrial Conglomerates - 0.5% |
General Electric Co. | 1,103,883 | | 27,763 |
Machinery - 1.6% |
Harsco Corp. | 1,103,224 | | 27,878 |
Ingersoll-Rand PLC | 739,500 | | 43,475 |
Pentair PLC | 78,757 | | 5,046 |
Timken Co. | 228,734 | | 10,133 |
| | 86,532 |
Marine - 0.5% |
Genco Shipping & Trading Ltd. (a) | 573,680 | | 12,334 |
Navios Maritime Holdings, Inc. | 2,162,794 | | 17,237 |
| | 29,571 |
Common Stocks - continued |
| Shares | | Value (000s) |
INDUSTRIALS - continued |
Road & Rail - 0.4% |
Hertz Global Holdings, Inc. (a) | 707,700 | | $ 19,971 |
TOTAL INDUSTRIALS | | 618,322 |
INFORMATION TECHNOLOGY - 8.4% |
Communications Equipment - 1.1% |
Cisco Systems, Inc. | 2,383,049 | | 60,124 |
Electronic Equipment & Components - 1.8% |
Avnet, Inc. | 594,313 | | 25,157 |
Belden, Inc. | 777,664 | | 52,803 |
Corning, Inc. | 726,800 | | 14,282 |
Viasystems Group, Inc. (a) | 540,460 | | 5,291 |
| | 97,533 |
Internet Software & Services - 0.2% |
VeriSign, Inc. (a) | 194,300 | | 10,502 |
Semiconductors & Semiconductor Equipment - 3.0% |
Advanced Micro Devices, Inc. (a)(d) | 1,704,692 | | 6,665 |
Freescale Semiconductor, Inc. (a) | 1,235,600 | | 24,737 |
Intersil Corp. Class A | 1,460,387 | | 18,737 |
Micron Technology, Inc. (a) | 2,293,545 | | 70,068 |
NXP Semiconductors NV (a) | 269,464 | | 16,801 |
ON Semiconductor Corp. (a) | 2,920,068 | | 24,996 |
| | 162,004 |
Software - 1.6% |
Citrix Systems, Inc. (a) | 230,899 | | 15,639 |
Microsoft Corp. | 1,619,168 | | 69,883 |
| | 85,522 |
Technology Hardware, Storage & Peripherals - 0.7% |
NCR Corp. (a) | 1,117,931 | | 34,600 |
TOTAL INFORMATION TECHNOLOGY | | 450,285 |
MATERIALS - 14.6% |
Chemicals - 11.5% |
H.B. Fuller Co. | 461,829 | | 20,621 |
LyondellBasell Industries NV Class A | 5,246,855 | | 557,481 |
OMNOVA Solutions, Inc. (a)(e) | 3,114,962 | | 25,138 |
Common Stocks - continued |
| Shares | | Value (000s) |
MATERIALS - continued |
Chemicals - continued |
Phosphate Holdings, Inc. (a) | 307,500 | | $ 212 |
W.R. Grace & Co. (a) | 179,956 | | 16,376 |
| | 619,828 |
Containers & Packaging - 2.2% |
Rock-Tenn Co. Class A | 1,058,264 | | 105,223 |
Sealed Air Corp. | 483,434 | | 15,528 |
| | 120,751 |
Metals & Mining - 0.1% |
Ormet Corp. (a)(e) | 1,405,000 | | 8 |
TimkenSteel Corp. (a) | 114,367 | | 4,976 |
| | 4,984 |
Paper & Forest Products - 0.8% |
Louisiana-Pacific Corp. (a) | 1,563,090 | | 21,164 |
Neenah Paper, Inc. | 418,300 | | 20,756 |
| | 41,920 |
TOTAL MATERIALS | | 787,483 |
TELECOMMUNICATION SERVICES - 1.1% |
Diversified Telecommunication Services - 1.1% |
Frontier Communications Corp. (d) | 5,528,256 | | 36,210 |
Intelsat SA (a) | 1,144,700 | | 21,223 |
| | 57,433 |
UTILITIES - 3.2% |
Electric Utilities - 0.2% |
FirstEnergy Corp. | 421,304 | | 13,149 |
Independent Power Producers & Energy Traders - 3.0% |
Calpine Corp. (a) | 2,616,200 | | 57,661 |
The AES Corp. | 7,025,407 | | 102,641 |
| | 160,302 |
TOTAL UTILITIES | | 173,451 |
TOTAL COMMON STOCKS (Cost $3,243,282) |
5,262,340
|
Nonconvertible Preferred Stocks - 0.2% |
| Shares | | Value (000s) |
FINANCIALS - 0.2% |
Diversified Financial Services - 0.2% |
GMAC Capital Trust I Series 2, 8.125% (Cost $10,975) | 439,013 | | $ 11,932 |
Nonconvertible Bonds - 0.4% |
| Principal Amount (000s) | | |
ENERGY - 0.4% |
Energy Equipment & Services - 0.4% |
Offshore Group Investment Ltd. 7.5% 11/1/19 | | $ 13,360 | | 13,761 |
SAExploration Holdings, Inc. 10% 7/15/19 (f) | | 6,930 | | 6,913 |
| | 20,674 |
TOTAL NONCONVERTIBLE BONDS (Cost $20,954) |
20,674
|
Money Market Funds - 6.9% |
| Shares | | |
Fidelity Cash Central Fund, 0.11% (b) | 92,278,222 | | 92,278 |
Fidelity Securities Lending Cash Central Fund, 0.11% (b)(c) | 278,226,265 | | 278,226 |
TOTAL MONEY MARKET FUNDS (Cost $370,504) |
370,504
|
TOTAL INVESTMENT PORTFOLIO - 105.3% (Cost $3,645,715) | | 5,665,450 |
NET OTHER ASSETS (LIABILITIES) - (5.3)% | | (285,886) |
NET ASSETS - 100% | $ 5,379,564 |
Legend |
(a) Non-income producing |
(b) Affiliated fund that is generally available only to investment companies and other accounts managed by Fidelity Investments. The rate quoted is the annualized seven-day yield of the fund at period end. A complete unaudited listing of the fund's holdings as of its most recent quarter end is available upon request. In addition, each Fidelity Central Fund's financial statements, which are not covered by the Fund's Report of Independent Registered Public Accounting Firm, are available on the SEC's website or upon request. |
(c) Investment made with cash collateral received from securities on loan. |
(d) Security or a portion of the security is on loan at period end. |
(e) Affiliated company |
(f) Security exempt from registration under Rule 144A of the Securities Act of 1933. These securities may be resold in transactions exempt from registration, normally to qualified institutional buyers. At the end of the period, the value of these securities amounted to $6,913,000 or 0.1% of net assets. |
(g) Investment is owned by an entity that is treated as a corporation for U.S. tax purposes and is owned by the Fund. |
(h) Restricted securities - Investment in securities not registered under the Securities Act of 1933 (excluding 144A issues). At the end of the period, the value of restricted securities (excluding 144A issues) amounted to $56,000 or 0.0% of net assets. |
Additional information on each restricted holding is as follows: |
Security | Acquisition Date | Acquisition Cost (000s) |
Station Holdco LLC unit | 10/28/08 - 12/1/08 | $ 5,990 |
Affiliated Central Funds |
Information regarding fiscal year to date income earned by the Fund from investments in Fidelity Central Funds is as follows: |
Fund | Income earned
(Amounts in thousands) |
Fidelity Cash Central Fund | $ 322 |
Fidelity Securities Lending Cash Central Fund | 631 |
Total | $ 953 |
Other Affiliated Issuers |
An affiliated company is a company in which the Fund has ownership of at least 5% of the voting securities. Fiscal year to date transactions with companies which are or were affiliates are as follows: |
Affiliate
(Amounts in thousands) | Value,
beginning of
period | Purchases | Sales
Proceeds | Dividend
Income | Value,
end of
period |
Gray Television, Inc. | $ 29,414 | $ - | $ - | $ - | $ 45,872 |
OMNOVA Solutions, Inc. | 25,107 | - | - | - | 25,138 |
Ormet Corp. | 13 | - | - | - | 8 |
Service Corp. International | 244,446 | - | 53,608 | 3,446 | - |
Total | $ 298,980 | $ - | $ 53,608 | $ 3,446 | $ 71,018 |
Other Information |
The following is a summary of the inputs used, as of July 31, 2014, involving the Fund's assets and liabilities carried at fair value. The inputs or methodology used for valuing securities may not be an indication of the risk associated with investing in those securities. For more information on valuation inputs, and their aggregation into the levels used in the table below, please refer to the Investment Valuation section in the accompanying Notes to Financial Statements. |
Valuation Inputs at Reporting Date: |
Description
(Amounts in thousands) | Total | Level 1 | Level 2 | Level 3 |
Investments in Securities: | | | | |
Equities: | | | | |
Consumer Discretionary | $ 1,316,767 | $ 1,316,711 | $ - | $ 56 |
Consumer Staples | 90,590 | 90,590 | - | - |
Energy | 560,620 | 560,620 | - | - |
Financials | 629,782 | 629,782 | - | - |
Health Care | 589,539 | 589,539 | - | - |
Industrials | 618,322 | 618,322 | - | - |
Information Technology | 450,285 | 450,285 | - | - |
Materials | 787,483 | 787,483 | - | - |
Telecommunication Services | 57,433 | 57,433 | - | - |
Utilities | 173,451 | 173,451 | - | - |
Corporate Bonds | 20,674 | - | 20,674 | - |
Money Market Funds | 370,504 | 370,504 | - | - |
Total Investments in Securities: | $ 5,665,450 | $ 5,644,720 | $ 20,674 | $ 56 |
Distribution of investments by country or territory of incorporation, as a percentage of total net assets, is as follows (Unaudited): |
United States of America | 82.3% |
Netherlands | 10.6% |
United Kingdom | 1.4% |
Ireland | 1.1% |
France | 1.0% |
Others (Individually Less Than 1%) | 3.6% |
| 100.0% |
See accompanying notes which are an integral part of the financial statements.
Annual Report
Statement of Assets and Liabilities
Amounts in thousands (except per-share amounts) | July 31, 2014 |
| | |
Assets | | |
Investment in securities, at value (including securities loaned of $264,346) - See accompanying schedule: Unaffiliated issuers (cost $3,201,013) | $ 5,223,928 | |
Fidelity Central Funds (cost $370,504) | 370,504 | |
Other affiliated issuers (cost $74,198) | 71,018 | |
Total Investments (cost $3,645,715) | | $ 5,665,450 |
Receivable for fund shares sold | | 3,579 |
Dividends receivable | | 2,419 |
Interest receivable | | 306 |
Distributions receivable from Fidelity Central Funds | | 57 |
Receivable from investment adviser for expense reductions | | 3 |
Other receivables | | 69 |
Total assets | | 5,671,883 |
| | |
Liabilities | | |
Payable for fund shares redeemed | $ 10,584 | |
Accrued management fee | 2,739 | |
Other affiliated payables | 708 | |
Other payables and accrued expenses | 62 | |
Collateral on securities loaned, at value | 278,226 | |
Total liabilities | | 292,319 |
| | |
Net Assets | | $ 5,379,564 |
Net Assets consist of: | | |
Paid in capital | | $ 3,393,104 |
Undistributed net investment income | | 22,869 |
Accumulated undistributed net realized gain (loss) on investments | | (56,144) |
Net unrealized appreciation (depreciation) on investments | | 2,019,735 |
Net Assets | | $ 5,379,564 |
See accompanying notes which are an integral part of the financial statements.
Annual Report
Financial Statements - continued
Statement of Assets and Liabilities - continued
Amounts in thousands (except per-share amounts) | July 31, 2014 |
| | |
Leveraged Company Stock:
Net Asset Value, offering price and redemption price per share ($4,206,652 ÷ 91,806 shares) | | $ 45.82 |
| | |
Class K:
Net Asset Value, offering price and redemption price per share ($1,172,912 ÷ 25,546 shares) | | $ 45.91 |
See accompanying notes which are an integral part of the financial statements.
Annual Report
Statement of Operations
Amounts in thousands | Year ended July 31, 2014 |
| | |
Investment Income | | |
Dividends (including $3,446 earned from other affiliated issuers) | | $ 79,397 |
Interest | | 4,756 |
Income from Fidelity Central Funds | | 953 |
Total income | | 85,106 |
| | |
Expenses | | |
Management fee | $ 32,097 | |
Transfer agent fees | 7,386 | |
Accounting and security lending fees | 1,146 | |
Custodian fees and expenses | 52 | |
Independent trustees' compensation | 22 | |
Registration fees | 84 | |
Audit | 65 | |
Legal | 25 | |
Miscellaneous | 46 | |
Total expenses before reductions | 40,923 | |
Expense reductions | (207) | 40,716 |
Net investment income (loss) | | 44,390 |
Realized and Unrealized Gain (Loss) Net realized gain (loss) on: | | |
Investment securities: | | |
Unaffiliated issuers | 153,359 | |
Other affiliated issuers | 31,618 | |
Total net realized gain (loss) | | 184,977 |
Change in net unrealized appreciation (depreciation) on investment securities | | 610,173 |
Net gain (loss) | | 795,150 |
Net increase (decrease) in net assets resulting from operations | | $ 839,540 |
See accompanying notes which are an integral part of the financial statements.
Annual Report
Financial Statements - continued
Statement of Changes in Net Assets
Amounts in thousands | Year ended
July 31,
2014 | Year ended
July 31,
2013 |
Increase (Decrease) in Net Assets | | |
Operations | | |
Net investment income (loss) | $ 44,390 | $ 57,007 |
Net realized gain (loss) | 184,977 | 336,239 |
Change in net unrealized appreciation (depreciation) | 610,173 | 1,098,022 |
Net increase (decrease) in net assets resulting
from operations | 839,540 | 1,491,268 |
Distributions to shareholders from net investment income | (37,155) | (15,789) |
Share transactions - net increase (decrease) | (702,631) | 194,361 |
Redemption fees | 366 | 538 |
Total increase (decrease) in net assets | 100,120 | 1,670,378 |
| | |
Net Assets | | |
Beginning of period | 5,279,444 | 3,609,066 |
End of period (including undistributed net investment income of $22,869 and undistributed net investment income of $22,624, respectively) | $ 5,379,564 | $ 5,279,444 |
See accompanying notes which are an integral part of the financial statements.
Annual Report
Financial Highlights - Leveraged Company Stock
Years ended July 31, | 2014 | 2013 | 2012 | 2011 | 2010 |
Selected Per-Share Data | | | | | |
Net asset value, beginning of period | $ 39.44 | $ 28.22 | $ 28.85 | $ 23.50 | $ 19.55 |
Income from Investment Operations | | | | | |
Net investment income (loss) B | .34 | .42F | .16 | -H | .07 |
Net realized and unrealized gain (loss) | 6.31 | 10.92 | (.50) | 5.46 | 3.99 |
Total from investment operations | 6.65 | 11.34 | (.34) | 5.46 | 4.06 |
Distributions from net investment income | (.27) | (.12) | (.29) | (.11) | (.11) |
Redemption fees added to paid in capital B, H | - | - | - | - | - |
Net asset value, end of period | $ 45.82 | $ 39.44 | $ 28.22 | $ 28.85 | $ 23.50 |
Total ReturnA | 16.96% | 40.31% | (1.05)% | 23.27% | 20.84% |
Ratios to Average Net Assets C, G | | | | | |
Expenses before reductions | .79% | .82% | .86% | .85% | .88% |
Expenses net of fee waivers, if any | .79% | .82% | .86% | .85% | .88% |
Expenses net of all reductions | .79% | .82% | .85% | .84% | .88% |
Net investment income (loss) | .81% | 1.25%F | .60% | -%E | .29% |
Supplemental Data | | | | | |
Net assets, end of period (in millions) | $ 4,207 | $ 4,227 | $ 3,009 | $ 3,931 | $ 3,983 |
Portfolio turnover rateD | 10% | 21% | 29% | 18% | 21% |
A Total returns would have been lower if certain expenses had not been reduced during the applicable periods shown.
B Calculated based on average shares outstanding during the period.
C Fees and expenses of any underlying Fidelity Central Funds are not included in the Fund's expense ratio. The Fund indirectly bears its proportionate share of the expenses of any underlying Fidelity Central Funds.
D Amount does not include the portfolio activity of any underlying Fidelity Central Funds.
E Amount represents less than .01%.
F Investment income per share reflects a large, non-recurring dividend which amounted to $.08 per share. Excluding this non-recurring dividend, the ratio of net investment income (loss) to average net assets would have been 1.03%.
G Expense ratios reflect operating expenses of the class. Expenses before reductions do not reflect amounts reimbursed by the investment adviser or reductions from brokerage service arrangements or reductions from other expense offset arrangements and do not represent the amount paid by the class during periods when reimbursements or reductions occur. Expenses net of fee waivers reflect expenses after reimbursement by the investment adviser but prior to reductions from brokerage service arrangements or other expense offset arrangements. Expenses net of all reductions represent the net expenses paid by the class.
H Amount represents less than $.01 per share.
See accompanying notes which are an integral part of the financial statements.
Annual Report
Financial Highlights - Class K
Years ended July 31, | 2014 | 2013 | 2012 | 2011 | 2010 |
Selected Per-Share Data | | | | | |
Net asset value, beginning of period | $ 39.52 | $ 28.26 | $ 28.86 | $ 23.52 | $ 19.56 |
Income from Investment Operations | | | | | |
Net investment income (loss) B | .40 | .47E | .20 | .04 | .11 |
Net realized and unrealized gain (loss) | 6.31 | 10.93 | (.49) | 5.45 | 4.00 |
Total from investment operations | 6.71 | 11.40 | (.29) | 5.49 | 4.11 |
Distributions from net investment income | (.32) | (.14) | (.31) | (.15) | (.15) |
Redemption fees added to paid in capital B, G | - | - | - | - | - |
Net asset value, end of period | $ 45.91 | $ 39.52 | $ 28.26 | $ 28.86 | $ 23.52 |
Total ReturnA | 17.10% | 40.47% | (.87)% | 23.45% | 21.09% |
Ratios to Average Net Assets C, F | | | | | |
Expenses before reductions | .67% | .69% | .69% | .69% | .70% |
Expenses net of fee waivers, if any | .67% | .69% | .69% | .69% | .70% |
Expenses net of all reductions | .67% | .68% | .69% | .69% | .69% |
Net investment income (loss) | .92% | 1.39%E | .76% | .16% | .47% |
Supplemental Data | | | | | |
Net assets, end of period (in millions) | $ 1,173 | $ 1,053 | $ 600 | $ 555 | $ 410 |
Portfolio turnover rateD | 10% | 21% | 29% | 18% | 21% |
A Total returns would have been lower if certain expenses had not been reduced during the applicable periods shown.
B Calculated based on average shares outstanding during the period.
C Fees and expenses of any underlying Fidelity Central Funds are not included in the Fund's expense ratio. The Fund indirectly bears its proportionate share of the expenses of any underlying Fidelity Central Funds.
D Amount does not include the portfolio activity of any underlying Fidelity Central Funds.
E Investment income per share reflects a large, non-recurring dividend which amounted to $.08 per share. Excluding this non-recurring dividend, the ratio of net investment income (loss) to average net assets would have been 1.17%.
F Expense ratios reflect operating expenses of the class. Expenses before reductions do not reflect amounts reimbursed by the investment adviser or reductions from brokerage service arrangements or reductions from other expense offset arrangements and do not represent the amount paid by the class during periods when reimbursements or reductions occur. Expenses net of fee waivers reflect expenses after reimbursement by the investment adviser but prior to reductions from brokerage service arrangements or other expense offset arrangements. Expenses net of all reductions represent the net expenses paid by the class.
G Amount represents less than $.01 per share.
See accompanying notes which are an integral part of the financial statements.
Annual Report
Notes to Financial Statements
For the period ended July 31, 2014
(Amounts in thousands except percentages)
1. Organization.
Fidelity Leveraged Company Stock Fund (the Fund) is a fund of Fidelity Securities Fund (the Trust) and is authorized to issue an unlimited number of shares. The Trust is registered under the Investment Company Act of 1940, as amended (the 1940 Act), as an open-end management investment company organized as a Massachusetts business trust. The Fund offers Leveraged Company Stock and Class K shares, each of which has equal rights as to assets and voting privileges. Each class has exclusive voting rights with respect to matters that affect that class.
2. Investments in Fidelity Central Funds.
The Fund may invests in Fidelity Central Funds, which are open-end investment companies generally available only to other investment companies and accounts managed by the investment adviser and its affiliates. The Fund's Schedule of Investments lists each of the Fidelity Central Funds held as of period end, if any, as an investment of the Fund, but does not include the underlying holdings of each Fidelity Central Fund. As an Investing Fund, the Fund indirectly bears its proportionate share of the expenses of the underlying Fidelity Central Funds.
The Money Market Central Funds seek preservation of capital and current income and are managed by Fidelity Investments Money Management, Inc. (FIMM), an affiliate of the investment adviser. Annualized expenses of the Money Market Central Funds as of their most recent shareholder report date are less than .01%.
A complete unaudited list of holdings for each Fidelity Central Fund is available upon request or at the Securities and Exchange Commission (the SEC) website at www.sec.gov. In addition, the financial statements of the Fidelity Central Funds, which are not covered by the Fund's Report of Independent Registered Public Accounting Firm, are available on the SEC website or upon request.
3. Significant Accounting Policies.
The financial statements have been prepared in conformity with accounting principles generally accepted in the United States of America (GAAP), which require management to make certain estimates and assumptions at the date of the financial statements. Actual results could differ from those estimates. Subsequent events, if any, through the date that the financial statements were issued have been evaluated in the preparation of the financial statements. The following summarizes the significant accounting policies of the Fund:
Investment Valuation. Investments are valued as of 4:00 p.m. Eastern time on the last calendar day of the period. In accordance with valuation policies and procedures approved by the Board of Trustees (the Board), the Fund attempts to obtain prices from
Annual Report
Notes to Financial Statements - continued
(Amounts in thousands except percentages)
3. Significant Accounting Policies - continued
Investment Valuation - continued
one or more third party pricing vendors or brokers to value its investments. When current market prices, quotations or currency exchange rates are not readily available or reliable, investments will be fair valued in good faith by the Fidelity Management & Research Company (FMR) Fair Value Committee (the Committee), in accordance with procedures adopted by the Board. Factors used in determining fair value vary by investment type and may include market or investment specific events, changes in interest rates and credit quality. The frequency with which these procedures are used cannot be predicted and they may be utilized to a significant extent. The Committee oversees the Fund's valuation policies and procedures and is responsible for approving and reporting to the Board all fair value determinations.
The Fund categorizes the inputs to valuation techniques used to value its investments into a disclosure hierarchy consisting of three levels as shown below:
Level 1 - quoted prices in active markets for identical investments
Level 2 - other significant observable inputs (including quoted prices for similar investments, interest rates, prepayment speeds, etc.)
Level 3 - unobservable inputs (including the Fund's own assumptions based on the best information available)
Valuation techniques used to value the Fund's investments by major category are as follows:
Equity securities, including restricted securities, for which market quotations are readily available, are valued at the last reported sale price or official closing price as reported by a third party pricing vendor on the primary market or exchange on which they are traded and are categorized as Level 1 in the hierarchy. In the event there were no sales during the day or closing prices are not available, securities are valued at the last quoted bid price or may be valued using the last available price and are generally categorized as Level 2 in the hierarchy. For foreign equity securities, when market or security specific events arise, comparisons to the valuation of American Depositary Receipts (ADRs), futures contracts, Exchange-Traded Funds (ETFs) and certain indexes as well as quoted prices for similar securities may be used and would be categorized as Level 2 in the hierarchy. Utilizing these techniques may result in transfers between Level 1 and Level 2. For equity securities, including restricted securities, where observable inputs are limited, assumptions about market activity and risk are used and these securities may be categorized as Level 3 in the hierarchy.
Debt securities, including restricted securities, are valued based on evaluated prices received from third party pricing vendors or from brokers who make markets in such
Annual Report
3. Significant Accounting Policies - continued
Investment Valuation - continued
securities. Corporate bonds are valued by pricing vendors who utilize matrix pricing which considers yield or price of bonds of comparable quality, coupon, maturity and type or by broker-supplied prices. When independent prices are unavailable or unreliable, debt securities may be valued utilizing pricing methodologies which consider similar factors that would be used by third party pricing vendors. Debt securities are generally categorized as Level 2 in the hierarchy but may be Level 3 depending on the circumstances.
Investments in open-end mutual funds, including the Fidelity Central Funds, are valued at their closing net asset value (NAV) each business day and are categorized as Level 1 in the hierarchy.
Changes in valuation techniques may result in transfers in or out of an assigned level within the disclosure hierarchy. The aggregate value of investments by input level, as of July 31, 2014, is included at the end of the Fund's Schedule of Investments.
Investment Transactions and Income. For financial reporting purposes, the Fund's investment holdings and NAV include trades executed through the end of the last business day of the period. The NAV per share for processing shareholder transactions is calculated as of the close of business of the New York Stock Exchange (NYSE), normally 4:00 p.m. Eastern time and includes trades executed through the end of the prior business day. Gains and losses on securities sold are determined on the basis of identified cost and may include proceeds received from litigation. Dividend income is recorded on the ex-dividend date, except for certain dividends from foreign securities where the ex-dividend date may have passed, which are recorded as soon as the Fund is informed of the ex-dividend date. Non-cash dividends included in dividend income, if any, are recorded at the fair market value of the securities received. Income and capital gain distributions from Fidelity Central Funds, if any, are recorded on the ex-dividend date. Distributions received on securities that represent a return of capital or capital gain are recorded as a reduction of cost of investments and/or as a realized gain. Subsequent to ex-dividend date the Fund determines the components of these distributions, based upon receipt of tax filings or other correspondence relating to the underlying investment. Interest income is accrued as earned and includes coupon interest and amortization of premium and accretion of discount on debt securities as applicable.
Class Allocations and Expenses. Investment income, realized and unrealized capital gains and losses, common expenses of the Fund, and certain fund-level expense reductions, if any, are allocated daily on a pro-rata basis to each class based on the relative net assets of each class to the total net assets of the Fund. Each class differs with respect to transfer agent fees incurred. Certain expense reductions may also differ by class. For the
Annual Report
Notes to Financial Statements - continued
(Amounts in thousands except percentages)
3. Significant Accounting Policies - continued
Class Allocations and Expenses - continued
reporting period, the allocated portion of income and expenses to each class as a percent of its average net assets may vary due to the timing of recording these transactions in relation to fluctuating net assets of the classes. Expenses directly attributable to a fund are charged to that fund. Expenses attributable to more than one fund are allocated among the respective funds on the basis of relative net assets or other appropriate methods. Expense estimates are accrued in the period to which they relate and adjustments are made when actual amounts are known.
Income Tax Information and Distributions to Shareholders. Each year, the Fund intends to qualify as a regulated investment company under Subchapter M of the Internal Revenue Code, including distributing substantially all of its taxable income and realized gains. As a result, no provision for U.S. Federal income taxes is required. As of July 31, 2014, the Fund did not have any unrecognized tax benefits in the financial statements; nor is the Fund aware of any tax positions for which it is reasonably possible that the total amounts of unrecognized tax benefits will significantly change in the next twelve months. The Fund files a U.S. federal tax return, in addition to state and local tax returns as required. The Fund's federal income tax returns are subject to examination by the Internal Revenue Service (IRS) for a period of three fiscal years after they are filed. State and local tax returns may be subject to examination for an additional fiscal year depending on the jurisdiction.
Distributions are declared and recorded on the ex-dividend date. Income dividends and capital gain distributions are declared separately for each class. Income and capital gain distributions are determined in accordance with income tax regulations, which may differ from GAAP. In addition, the fund claimed a portion of the payment made to redeeming shareholders as a distribution for income tax purposes.
Capital accounts within the financial statements are adjusted for permanent book-tax differences. These adjustments have no impact on net assets or the results of operations. Capital accounts are not adjusted for temporary book-tax differences which will reverse in a subsequent period.
Book-tax differences are primarily due to market discount, equity-debt classifications, capital loss carryforwards and losses deferred due to excise tax regulations.
The federal tax cost of investment securities and unrealized appreciation (depreciation) as of period end were as follows:
Gross unrealized appreciation | $ 2,189,452 |
Gross unrealized depreciation | (166,396) |
Net unrealized appreciation (depreciation) on securities | $ 2,023,056 |
| |
Tax Cost | $ 3,642,394 |
Annual Report
3. Significant Accounting Policies - continued
Income Tax Information and Distributions to Shareholders - continued
The tax-based components of distributable earnings as of period end were as follows:
Undistributed ordinary income | $ 19,743 |
Capital loss carryforward | $ (47,279) |
Net unrealized appreciation (depreciation) on securities and other investments | $ 2,023,056 |
Capital loss carryforwards are only available to offset future capital gains of the Fund to the extent provided by regulations and may be limited. Under the Regulated Investment Company Modernization Act of 2010 (the Act), the Fund is permitted to carry forward capital losses incurred in taxable years beginning after December 22, 2010 for an unlimited period and such capital losses are required to be used prior to any losses that expire. The capital loss carryforward information presented below, including any applicable limitation, is estimated as of fiscal period end and is subject to adjustment.
Fiscal year of expiration | |
2018 | $ (47,279) |
The Fund intends to elect to defer to its next fiscal year $8,865 of capital losses recognized during the period November 1, 2013 to July 31, 2014.
The tax character of distributions paid was as follows:
| July 31, 2014 | July 31, 2013 |
Ordinary Income | $ 37,155 | $ 15,789 |
Short-Term Trading (Redemption) Fees. Shares held by investors in the Fund less than 90 days may have been subject to a redemption fee equal to 1.50% of the NAV of shares redeemed. All redemption fees, which reduce the proceeds of the shareholder redemption, are retained by the Fund and accounted for as an addition to paid in capital.
Restricted Securities. The Fund may invest in securities that are subject to legal or contractual restrictions on resale. These securities generally may be resold in transactions exempt from registration or to the public if the securities are registered. Disposal of these securities may involve time-consuming negotiations and expense, and prompt sale at an acceptable price may be difficult. Information regarding restricted securities is included at the end of the Fund's Schedule of Investments.
Annual Report
Notes to Financial Statements - continued
(Amounts in thousands except percentages)
4. Purchases and Sales of Investments.
Purchases and sales of securities, other than short-term securities, aggregated $490,577 and $680,814, respectively.
5. Fees and Other Transactions with Affiliates.
Management Fee. Fidelity Management & Research Company (the investment adviser) and its affiliates provide the Fund with investment management related services for which the Fund pays a monthly management fee. The management fee is the sum of an individual fund fee rate that is based on an annual rate of .35% of the Fund's average net assets and an annualized group fee rate that averaged .25% during the period. The group fee rate is based upon the average net assets of all the mutual funds advised by the investment adviser, including any mutual funds previously advised by the investment adviser that are currently advised by Fidelity SelectCo, LLC, an affiliate of the investment adviser. The group fee rate decreases as assets under management increase and increases as assets under management decrease. For the reporting period, the total annual management fee rate was .60% of the Fund's average net assets.
Transfer Agent Fees. Fidelity Investments Institutional Operations Company, Inc., (FIIOC), an affiliate of the investment adviser, is the transfer, dividend disbursing and shareholder servicing agent for each class of the Fund. FIIOC receives account fees and asset-based fees that vary according to the account size and type of account of the shareholders of Leveraged Company Stock. FIIOC receives an asset-based fee of Class K's average net assets. FIIOC pays for typesetting, printing and mailing of shareholder reports, except proxy statements.
For the period, transfer agent fees for each class were as follows:
| Amount | % of
Average
Net Assets |
Leveraged Company Stock | $ 6,865 | .16 |
Class K | 521 | .05 |
| $ 7,386 | |
Accounting and Security Lending Fees. Fidelity Service Company, Inc. (FSC), an affiliate of the investment adviser, maintains the Fund's accounting records. The accounting fee is based on the level of average net assets for each month. Under a separate contract, FSC administers the security lending program. The security lending fee is based on the number and duration of lending transactions.
Annual Report
5. Fees and Other Transactions with Affiliates - continued
Brokerage Commissions. The Fund placed a portion of its portfolio transactions with brokerage firms which are affiliates of the investment adviser. Brokerage commissions are included in net realized gain (loss) and change in net unrealized appreciation (depreciation) in the Statement of Operations. The commissions paid to these affiliated firms were $17 for the period.
Other. During the period, the investment adviser reimbursed the Fund for certain losses in the amount of $3.
6. Committed Line of Credit.
The Fund participates with other funds managed by the investment adviser or an affiliate in a $4.25 billion credit facility (the "line of credit") to be utilized for temporary or emergency purposes to fund shareholder redemptions or for other short-term liquidity purposes. The Fund has agreed to pay commitment fees on its pro-rata portion of the line of credit, which amounted to $9 and is reflected in Miscellaneous expenses on the Statement of Operations. During the period, the Fund did not borrow on this line of credit.
7. Security Lending.
The Fund lends portfolio securities through a lending agent from time to time in order to earn additional income. For equity securities, a lending agent is used and may loan securities to certain qualified borrowers, including Fidelity Capital Markets (FCM), a broker-dealer affiliated with the Fund. On the settlement date of the loan, the Fund receives collateral (in the form of U.S. Treasury obligations, letters of credit and/or cash) against the loaned securities and maintains collateral in an amount not less than 100% of the market value of the loaned securities during the period of the loan. The market value of the loaned securities is determined at the close of business of the Fund and any additional required collateral is delivered to the Fund on the next business day. If the borrower defaults on its obligation to return the securities loaned because of insolvency or other reasons, the Fund may apply collateral received from the borrower against the obligation. The Fund may experience delays and costs in recovering the securities loaned. Any cash collateral received is invested in the Fidelity Securities Lending Cash Central Fund. The value of loaned securities and cash collateral at period end are disclosed on the Fund's Statement of Assets and Liabilities. At period end, there were no security loans outstanding with FCM. Security lending income represents the income earned on investing cash collateral, less rebates paid to borrowers and any lending agent fees associated with the loan, plus any premium payments received for lending certain
Annual Report
Notes to Financial Statements - continued
(Amounts in thousands except percentages)
7. Security Lending - continued
types of securities. Security lending income is presented in the Statement of Operations as a component of income from Fidelity Central Funds. Total security lending income during the period amounted to $631, including $7 from securities loaned to FCM.
8. Expense Reductions.
Commissions paid to certain brokers with whom the investment adviser, or its affiliates, places trades on behalf of the Fund include an amount in addition to trade execution, which may be rebated back to the Fund to offset certain expenses. This amount totaled $150 for the period.
In addition, the investment adviser reimbursed a portion of the Fund's operating expenses during the period in the amount of $57.
9. Distributions to Shareholders.
Distributions to shareholders of each class were as follows:
Years ended July 31, | 2014 | 2013 |
From net investment income | | |
Leveraged Company Stock | $ 28,583 | $ 12,562 |
Class K | 8,572 | 3,227 |
Total | $ 37,155 | $ 15,789 |
10. Share Transactions.
Transactions for each class of shares were as follows:
| Shares | Dollars |
Years ended July 31, | 2014 | 2013 | 2014 | 2013 |
Leveraged Company Stock | | | | |
Shares sold | 9,604 | 26,431 | $ 407,601 | $ 888,852 |
Reinvestment of distributions | 670 | 378 | 26,928 | 11,889 |
Shares redeemed | (25,643) | (26,251) | (1,089,706) | (883,700) |
Net increase (decrease) | (15,369) | 558 | $ (655,177) | $ 17,041 |
Annual Report
10. Share Transactions - continued
| Shares | Dollars |
Years ended July 31, | 2014 | 2013 | 2014 | 2013 |
Class K | | | | |
Shares sold | 5,696 | 11,840 | $ 243,726 | $ 395,282 |
Reinvestment of distributions | 213 | 102 | 8,572 | 3,227 |
Shares redeemed | (7,002) | (6,546) | (299,752) | (221,189) |
Net increase (decrease) | (1,093) | 5,396 | $ (47,454) | $ 177,320 |
11. Other.
The Fund's organizational documents provide former and current trustees and officers with a limited indemnification against liabilities arising in connection with the performance of their duties to the Fund. In the normal course of business, the Fund may also enter into contracts that provide general indemnifications. The Fund's maximum exposure under these arrangements is unknown as this would be dependent on future claims that may be made against the Fund. The risk of material loss from such claims is considered remote.
Annual Report
To the Trustees of Fidelity Securities Fund and the Shareholders of Fidelity Leveraged Company Stock Fund:
In our opinion, the accompanying statement of assets and liabilities, including the schedule of investments, and the related statements of operations and of changes in net assets and the financial highlights present fairly, in all material respects, the financial position of Fidelity Leveraged Company Stock Fund (a fund of Fidelity Securities Fund) at July 31, 2014, the results of its operations for the year then ended, the changes in its net assets for each of the two years in the period then ended and the financial highlights for each of the five years in the period then ended, in conformity with accounting principles generally accepted in the United States of America. These financial statements and financial highlights (hereafter referred to as "financial statements") are the responsibility of the Fidelity Leveraged Company Stock Fund's management. Our responsibility is to express an opinion on these financial statements based on our audits. We conducted our audits of these financial statements in accordance with the standards of the Public Company Accounting Oversight Board (United States). Those standards require that we plan and perform the audit to obtain reasonable assurance about whether the financial statements are free of material misstatement. An audit includes examining, on a test basis, evidence supporting the amounts and disclosures in the financial statements, assessing the accounting principles used and significant estimates made by management, and evaluating the overall financial statement presentation. We believe that our audits, which included confirmation of securities at July 31, 2014 by correspondence with the custodian, provide a reasonable basis for our opinion.
PricewaterhouseCoopers LLP
Boston, Massachusetts
September 16, 2014
Annual Report
The Trustees, Member of the Advisory Board, and officers of the trust and fund, as applicable, are listed below. The Board of Trustees governs the fund and is responsible for protecting the interests of shareholders. The Trustees are experienced executives who meet periodically throughout the year to oversee the fund's activities, review contractual arrangements with companies that provide services to the fund, oversee management of the risks associated with such activities and contractual arrangements, and review the fund's performance. Except for James C. Curvey, each of the Trustees oversees 173 funds. Mr. Curvey oversees 397 funds.
The Trustees hold office without limit in time except that (a) any Trustee may resign; (b) any Trustee may be removed by written instrument, signed by at least two-thirds of the number of Trustees prior to such removal; (c) any Trustee who requests to be retired or who has become incapacitated by illness or injury may be retired by written instrument signed by a majority of the other Trustees; and (d) any Trustee may be removed at any special meeting of shareholders by a two-thirds vote of the outstanding voting securities of the trust. Each Trustee who is not an interested person (as defined in the 1940 Act) of the trust and the fund (Independent Trustee), shall retire not later than the last day of the calendar year in which his or her 75th birthday occurs. The Independent Trustees may waive this mandatory retirement age policy with respect to individual Trustees. The officers and Advisory Board Member hold office without limit in time, except that any officer and Advisory Board Member may resign or may be removed by a vote of a majority of the Trustees at any regular meeting or any special meeting of the Trustees. Except as indicated, each individual has held the office shown or other offices in the same company for the past five years.
Experience, Skills, Attributes, and Qualifications of the Fund's Trustees. The Governance and Nominating Committee has adopted a statement of policy that describes the experience, qualifications, attributes, and skills that are necessary and desirable for potential Independent Trustee candidates (Statement of Policy). The Board believes that each Trustee satisfied at the time he or she was initially elected or appointed a Trustee, and continues to satisfy, the standards contemplated by the Statement of Policy. The Governance and Nominating Committee also engages professional search firms to help identify potential Independent Trustee candidates who have the experience, qualifications, attributes, and skills consistent with the Statement of Policy. From time to time, additional criteria based on the composition and skills of the current Independent Trustees, as well as experience or skills that may be appropriate in light of future changes to board composition, business conditions, and regulatory or other developments, have also been considered by the professional search firms and the Governance and Nominating Committee. In addition, the Board takes into account the Trustees' commitment and participation in Board and committee meetings, as well as their leadership of standing and ad hoc committees throughout their tenure.
In determining that a particular Trustee was and continues to be qualified to serve as a Trustee, the Board has considered a variety of criteria, none of which, in isolation, was controlling. The Board believes that, collectively, the Trustees have balanced and diverse experience, qualifications, attributes, and skills, which allow the Board to operate effectively in governing the fund and protecting the interests of shareholders. Information about the specific experience, skills, attributes, and qualifications of each Trustee, which in each case led to the Board's conclusion that the Trustee should serve (or continue to serve) as a trustee of the fund, is provided below.
Annual Report
Board Structure and Oversight Function. James C. Curvey is an interested person (as defined in the 1940 Act) and currently serves as Chairman. The Trustees have determined that an interested Chairman is appropriate and benefits shareholders because an interested Chairman has a personal and professional stake in the quality and continuity of services provided to the fund. Independent Trustees exercise their informed business judgment to appoint an individual of their choosing to serve as Chairman, regardless of whether the Trustee happens to be independent or a member of management. The Independent Trustees have determined that they can act independently and effectively without having an Independent Trustee serve as Chairman and that a key structural component for assuring that they are in a position to do so is for the Independent Trustees to constitute a substantial majority for the Board. The Independent Trustees also regularly meet in executive session. Ned C. Lautenbach serves as Chairman of the Independent Trustees and as such (i) acts as a liaison between the Independent Trustees and management with respect to matters important to the Independent Trustees and (ii) with management prepares agendas for Board meetings.
Fidelity funds are overseen by different Boards of Trustees. The fund's Board oversees Fidelity's equity and high income funds and another Board oversees Fidelity's investment-grade bond, money market, and asset allocation funds. The asset allocation funds may invest in Fidelity funds overseen by the fund's Board. The use of separate Boards, each with its own committee structure, allows the Trustees of each group of Fidelity funds to focus on the unique issues of the funds they oversee, including common research, investment, and operational issues. On occasion, the separate Boards establish joint committees to address issues of overlapping consequences for the Fidelity funds overseen by each Board.
The Trustees operate using a system of committees to facilitate the timely and efficient consideration of all matters of importance to the Trustees, the fund, and fund shareholders and to facilitate compliance with legal and regulatory requirements and oversight of the fund's activities and associated risks. The Board, acting through its committees, has charged FMR and its affiliates with (i) identifying events or circumstances the occurrence of which could have demonstrably adverse effects on the fund's business and/or reputation; (ii) implementing processes and controls to lessen the possibility that such events or circumstances occur or to mitigate the effects of such events or circumstances if they do occur; and (iii) creating and maintaining a system designed to evaluate continuously business and market conditions in order to facilitate the identification and implementation processes described in (i) and (ii) above. Because the day-to-day operations and activities of the fund are carried out by or through FMR, its affiliates and other service providers, the fund's exposure to risks is mitigated but not eliminated by the processes overseen by the Trustees. While each of the Board's committees has responsibility for overseeing different aspects of the fund's activities, oversight is exercised primarily through the Operations, Audit, and Compliance Committees. In addition, the Independent Trustees have worked with FMR to enhance the Board's oversight of investment and financial risks, legal and regulatory risks, technology risks, and operational risks, including the development of additional risk reporting to the Board. For example, a working group comprised of Independent Trustees and FMR has worked and continues to work to review the Fidelity funds' valuation-related activities, reporting and risk management. Appropriate personnel, including but not limited to the fund's Chief Compliance Officer (CCO), FMR's internal auditor, the independent accountants, the fund's Treasurer and portfolio management personnel, make periodic reports to the Board's committees, as appropriate, including an annual review of FMR's risk management program for the Fidelity funds. The responsibilities of each standing committee, including their oversight responsibilities, are described further under "Standing Committees of the Fund's Trustees."
Annual Report
Trustees and Officers - continued
The fund's Statement of Additional Information (SAI) includes more information about the Trustees. To request a free copy, call Fidelity at 1-800-544-8544.
Interested Trustees*:
Correspondence intended for each Trustee who is an interested person may be sent to Fidelity Investments, 245 Summer Street, Boston, Massachusetts 02210.
Name, Year of Birth; Principal Occupations and Other Relevant Experience+ |
James C. Curvey (1935) |
Year of Election or Appointment: 2007 Trustee Chairman of the Board of Trustees |
| Mr. Curvey also serves as Trustee of other Fidelity funds. Mr. Curvey is a Director of Fidelity Research & Analysis Co. (2009-present), and Vice Chairman (2007-present) and Director of FMR LLC. In addition, Mr. Curvey serves as an Overseer for the Boston Symphony Orchestra and a member of the Trustees of Villanova University. Previously, Mr. Curvey served as a Director of Fidelity Investments Money Management, Inc. (2009-2014), a Director of FMR (2007-2014), a Director of FMR Co., Inc. (2007-2014) and was the Vice Chairman (2006-2007) and Director (2000-2007) of FMR Corp. |
Charles S. Morrison (1960) |
Year of Election or Appointment: 2014 Trustee |
| Mr. Morrison also serves as Trustee of other funds. He serves as President, Asset Management (2014-present) and is an employee of Fidelity Investments. Previously, Mr. Morrison served as Vice President of Fidelity's Fixed Income and Asset Allocation Funds (2012-2014), President, Fixed Income (2011-2014), Vice President of Fidelity's Money Market Funds (2005-2009), President, Money Market Group Leader of FMR (2009), and Senior Vice President, Money Market Group of FMR (2004-2009). Mr. Morrison also served as Vice President of Fidelity's Bond Funds (2002-2005), certain Balanced Funds (2002-2005), and certain Asset Allocation Funds (2002-2007), and as Senior Vice President (2002-2005) of Fidelity's Bond Division. |
* Trustees have been determined to be "Interested Trustees" by virtue of, among other things, their affiliation with the trust or various entities under common control with FMR.
+ The information above includes each Trustee's principal occupation during the last five years and other information relating to the experience, attributes, and skills relevant to each Trustee's qualifications to serve as a Trustee, which led to the conclusion that each Trustee should serve as a Trustee for the fund.
Annual Report
Trustees and Officers - continued
Independent Trustees:
Correspondence intended for each Independent Trustee (that is, the Trustees other than the Interested Trustees) may be sent to Fidelity Investments, P.O. Box 55235, Boston, Massachusetts 02205-5235.
Name, Year of Birth; Principal Occupations and Other Relevant Experience+ |
Dennis J. Dirks (1948) |
Year of Election or Appointment: 2005 Trustee |
| Mr. Dirks also serves as Trustee of other Fidelity funds. Prior to his retirement in May 2003, Mr. Dirks was Chief Operating Officer and a member of the Board of The Depository Trust & Clearing Corporation (DTCC). He also served as President, Chief Operating Officer, and Board member of The Depository Trust Company (DTC) and President and Board member of the National Securities Clearing Corporation (NSCC). In addition, Mr. Dirks served as Chief Executive Officer and Board member of the Government Securities Clearing Corporation, Chief Executive Officer and Board member of the Mortgage-Backed Securities Clearing Corporation, as a Trustee and a member of the Finance Committee of Manhattan College (2005-2008), and as a Trustee and a member of the Finance Committee of AHRC of Nassau County (2006-2008). Mr. Dirks is a member of the Independent Directors Council (IDC) Governing Council (2010-present) and Board of Directors for The Brookville Center for Children's Services, Inc. (2009-present). |
Alan J. Lacy (1953) |
Year of Election or Appointment: 2008 Trustee |
| Mr. Lacy also serves as Trustee of other Fidelity funds. Mr. Lacy serves as Senior Adviser (2007-present) of Oak Hill Capital Partners, L.P. (private equity). Mr. Lacy also served as Chief Executive Officer (2000-2005) and Vice Chairman (2005-2006) of Sears Holdings Corporation and Sears, Roebuck and Co. (retail). In addition, Mr. Lacy serves as a member of the Board of Directors of Dave & Buster's Entertainment, Inc. (restaurant and entertainment complexes, 2010-present), Earth Fare, Inc. (retail grocery, 2012-present), The Hillman Companies, Inc. (hardware wholesalers, 2010-present), and Bristol-Myers Squibb Company (global pharmaceuticals, 2008-present). Mr. Lacy is a member of the Board of Trustees of The National Parks Conservation Association (2006-present). Previously, Mr. Lacy served as Chairman of the Board of Trustees of the National Parks Conservation Association (2008-2011) and as a member of the Board of Directors for the Western Union Company (global money transfer, 2006-2011). |
Ned C. Lautenbach (1944) |
Year of Election or Appointment: 2000 Trustee Chairman of the Independent Trustees |
| Mr. Lautenbach also serves as Trustee of other Fidelity funds. Mr. Lautenbach currently serves as the Lead Director of the Eaton Corporation Board of Directors (diversified industrial, 1997-present). Mr. Lautenbach is Chairman of the Board of Directors of the Philharmonic Center for the Arts in Naples, Florida (2012-present) and a member of the Council on Foreign Relations (1994-present). Previously, Mr. Lautenbach was a Partner/Advisory Partner at Clayton, Dubilier & Rice, LLC (private equity investment, 1998-2010), as well as a Director of Sony Corporation (2006-2007). |
Joseph Mauriello (1944) |
Year of Election or Appointment: 2008 Trustee |
| Mr. Mauriello also serves as Trustee of other Fidelity funds. Prior to his retirement in January 2006, Mr. Mauriello served in numerous senior management positions including Deputy Chairman and Chief Operating Officer (2004-2005), and Vice Chairman of Financial Services (2002-2004) of KPMG LLP US (professional services, 1965-2005). Mr. Mauriello currently serves as a member of the Board of Directors of XL Group plc. (global insurance and re-insurance, 2006-present). Previously, Mr. Mauriello served as a Director of the Hamilton Funds of the Bank of New York (2006-2007) and of Arcadia Resources Inc. (health care services and products, 2007-2012). |
Robert W. Selander (1950) |
Year of Election or Appointment: 2011 Trustee |
| Mr. Selander also serves as Trustee of other Fidelity funds. Previously, Mr. Selander served as a Member of the Advisory Board of other Fidelity funds (2011), and Executive Vice Chairman (2010), Chief Executive Officer (2009-2010), and President and Chief Executive Officer (1997-2009) of Mastercard, Inc. |
Cornelia M. Small (1944) |
Year of Election or Appointment: 2005 Trustee |
| Ms. Small also serves as Trustee of other Fidelity funds. Ms. Small is a member of the Board of Directors (2009-present) and Chair of the Investment Committee (2010-present) of the Teagle Foundation. Ms. Small also serves on the Investment Committee of the Berkshire Taconic Community Foundation (2008-present). Previously, Ms. Small served as Chairperson (2002-2008) and a member of the Investment Committee and Chairperson (2008-2012) and a member of the Board of Trustees of Smith College. In addition, Ms. Small served as Chief Investment Officer, Director of Global Equity Investments, and a member of the Board of Directors of Scudder, Stevens & Clark and Scudder Kemper Investments. |
William S. Stavropoulos (1939) |
Year of Election or Appointment: 2002 Trustee Vice Chairman of the Independent Trustees |
| Mr. Stavropoulos also serves as Trustee of other Fidelity funds. Mr. Stavropoulos serves as President and Founder of the Michigan Baseball Foundation, the Great Lakes Loons (2007-present). Mr. Stavropoulos is Chairman Emeritus of the Board of Directors of The Dow Chemical Company, where he previously served in numerous senior management positions, including President, CEO (1995-2000; 2002-2004), Chairman of the Executive Committee (2000-2006), and as a member of the Board of Directors (1990-2006). Currently, Mr. Stavropoulos is Chairman of the Board of Directors of Univar Inc. (global distributor of commodity and specialty chemicals), a Director of Teradata Corporation (data warehousing and technology solutions), and Maersk Inc. (industrial conglomerate), and a member of the Advisory Board for Metalmark Capital LLC (private equity investment, 2005-present). Mr. Stavropoulos is an operating advisor to Clayton, Dubilier & Rice, LLC (private equity investment). In addition, Mr. Stavropoulos is a member of the University of Notre Dame Advisory Council for the College of Science, a Trustee of the Rollin L. Gerstacker Foundation, and a Director of the Naples Philharmonic Center for the Arts. Previously, Mr. Stavropoulos served as a Director of Chemical Financial Corporation (bank holding company, 1993-2012) and Tyco International, Ltd. (multinational manufacturing and services, 2007-2012). |
David M. Thomas (1949) |
Year of Election or Appointment: 2008 Trustee |
| Mr. Thomas also serves as Trustee of other Fidelity funds. Mr. Thomas serves as Non-Executive Chairman of the Board of Directors of Fortune Brands Home and Security (home and security products, 2011-present), and as a member of the Board of Directors of Interpublic Group of Companies, Inc. (marketing communication, 2004-present). Previously, Mr. Thomas served as Executive Chairman (2005-2006) and Chairman and Chief Executive Officer (2000-2005) of IMS Health, Inc. (pharmaceutical and healthcare information solutions), and a Director of Fortune Brands, Inc. (consumer products, 2000-2011). |
+ The information above includes each Trustee's principal occupation during the last five years and other information relating to the experience, attributes, and skills relevant to each Trustee's qualifications to serve as a Trustee, which led to the conclusion that each Trustee should serve as a Trustee for the fund.
Advisory Board Member and Officers:
Correspondence intended for each officer and Peter S. Lynch may be sent to Fidelity Investments, 245 Summer Street, Boston, Massachusetts 02210. Officers appear below in alphabetical order.
Name, Year of Birth; Principal Occupation |
Peter S. Lynch (1944) |
Year of Election or Appointment: 2003 Member of the Advisory Board |
| Mr. Lynch also serves as Member of the Advisory Board of other Fidelity funds. Mr. Lynch is Vice Chairman and a Director of FMR and FMR Co., Inc. In addition, Mr. Lynch serves as a Trustee of Boston College and as the Chairman of the Inner-City Scholarship Fund. Previously, Mr. Lynch served on the Special Olympics International Board of Directors (1997-2006). |
Elizabeth Paige Baumann (1968) |
Year of Election or Appointment: 2012 Anti-Money Laundering (AML) Officer |
| Ms. Baumann also serves as AML Officer of other funds. She is Chief AML Officer of FMR LLC (2012-present) and is an employee of Fidelity Investments. Previously, Ms. Baumann served as Vice President and Deputy Anti-Money Laundering Officer (2007-2012). |
William C. Coffey (1969) |
Year of Election or Appointment: 2009 Assistant Secretary |
| Mr. Coffey also serves as Assistant Secretary of other funds. He is Senior Vice President and Deputy General Counsel of FMR LLC (2010-present), and is an employee of Fidelity Investments. Previously, Mr. Coffey served as Vice President and Associate General Counsel of FMR LLC (2005-2009). |
Jonathan Davis (1968) |
Year of Election or Appointment: 2010 Assistant Treasurer |
| Mr. Davis also serves as Assistant Treasurer of other funds. Mr. Davis is an employee of Fidelity Investments. Previously, Mr. Davis served as Vice President and Associate General Counsel of FMR LLC (2003-2010). |
Adrien E. Deberghes (1967) |
Year of Election or Appointment: 2008 Deputy Treasurer |
| Mr. Deberghes also serves as an officer of other funds. He is an employee of Fidelity Investments (2008-present). Prior to joining Fidelity Investments, Mr. Deberghes was Senior Vice President of Mutual Fund Administration at State Street Corporation (2007-2008), Senior Director of Mutual Fund Administration at Investors Bank & Trust (2005-2007), and Director of Finance for Dunkin' Brands (2000-2005). |
Stephanie J. Dorsey (1969) |
Year of Election or Appointment: 2010 Assistant Treasurer |
| Ms. Dorsey also serves as an officer of other funds. She is an employee of Fidelity Investments (2008-present) and has served in other fund officer roles. Prior to joining Fidelity Investments, Ms. Dorsey served as Treasurer (2004-2008) of the JPMorgan Mutual Funds and Vice President (2004-2008) of JPMorgan Chase Bank. |
Howard J. Galligan III (1966) |
Year of Election or Appointment: 2014 Chief Financial Officer |
| Mr. Galligan also serves as Chief Financial Officer of other funds. Mr. Galligan serves as President of Fidelity Pricing and Cash Management Services (FPCMS) (2014-present) and as a Director of Strategic Advisers, Inc. (2008-present). Previously, Mr. Galligan served as Chief Administrative Officer of Asset Management (2011-2014) and Chief Operating Officer and Senior Vice President of Investment Support for Strategic Advisers, Inc. (2003-2011). |
Scott C. Goebel (1968) |
Year of Election or Appointment: 2008 Secretary and Chief Legal Officer (CLO) |
| Mr. Goebel serves as Secretary and CLO of other funds. Mr. Goebel also serves as Secretary of Fidelity SelectCo, LLC (2013-present), Fidelity Investments Money Management, Inc. (FIMM) (2010-present) and Fidelity Research and Analysis Company (FRAC) (2010-present); General Counsel, Secretary, and Senior Vice President of FMR (2008-present) and FMR Co., Inc. (2008-present); Chief Legal Officer of Fidelity Management & Research (Hong Kong) Limited (2008-present); and Assistant Secretary of Fidelity Management & Research (Japan) Inc. (2008-present) and Fidelity Management & Research (U.K.) Inc. (2008-present). Previously, Mr. Goebel served as Secretary and CLO of other Fidelity funds (2008-2013), Assistant Secretary of FIMM (2008-2010), FRAC (2008-2010), and certain funds (2007-2008); and as Vice President and Secretary of Fidelity Distributors Corporation (FDC) (2005-2007). Mr. Goebel has been employed by FMR LLC or an affiliate since 2001. |
Brian B. Hogan (1964) |
Year of Election or Appointment: 2009 Vice President |
| Mr. Hogan also serves as Trustee or Vice President of other funds. Mr. Hogan serves as President of FMR's Equity Division (2009-present). Previously, Mr. Hogan served as Senior Vice President, Equity Research of FMR (2006-2009) and as a portfolio manager. |
Chris Maher (1972) |
Year of Election or Appointment: 2013 Assistant Treasurer |
| Mr. Maher serves as Assistant Treasurer of other funds. Mr. Maher is Vice President of Valuation Oversight and is an employee of Fidelity Investments. Previously, Mr. Maher served as Vice President of Asset Management Compliance (2013), Vice President of FMR's Program Management Group (2010-2013), and Vice President of Valuation Oversight (2008-2010). |
Melissa M. Reilly (1971) |
Year of Election or Appointment: 2014 Vice President of certain Equity Funds |
| Ms. Reilly also serves as Vice President of other funds. Ms. Reilly is an employee of Fidelity Investments (2004-present). |
Kenneth B. Robins (1969) |
Year of Election or Appointment: 2008 President and Treasurer |
| Mr. Robins also serves as an officer of other funds. Mr. Robins serves as Executive Vice President of Fidelity Investments Money Management, Inc. (FIMM) (2013-present) and is an employee of Fidelity Investments (2004-present). Previously, Mr. Robins served in other fund officer roles. |
Stephen Sadoski (1971) |
Year of Election or Appointment: 2012 Deputy Treasurer |
| Mr. Sadoski also serves as Deputy Treasurer of other funds. He is an employee of Fidelity Investments (2012-present) and has served in another fund officer role. Prior to joining Fidelity Investments, Mr. Sadoski served as an assistant chief accountant in the Division of Investment Management of the Securities and Exchange Commission (SEC) (2009-2012) and as a senior manager at Deloitte & Touche LLP (1997-2009). |
Stacie M. Smith (1974) |
Year of Election or Appointment: 2013 Deputy Treasurer |
| Ms. Smith also serves as an officer of other funds. She is an employee of Fidelity Investments (2009-present) and has served in other fund officer roles. Prior to joining Fidelity Investments, Ms. Smith served as Senior Audit Manager of Ernst & Young LLP (1996-2009). |
Renee Stagnone (1975) |
Year of Election or Appointment: 2013 Deputy Treasurer |
| Ms. Stagnone also serves as Deputy Treasurer of other funds. Ms. Stagnone is an employee of Fidelity Investments. |
Linda J. Wondrack (1964) |
Year of Election or Appointment: 2014 Chief Compliance Officer |
| Ms. Wondrack also serves as Chief Compliance Officer of other funds. Ms. Wondrack is Executive Vice President and head of the Ethics Office and Asset Management Compliance for Fidelity Investments (2012-present). Ms. Wondrack also serves as Chief Compliance Officer of Fidelity SelectCo, LLC (2014-present); Chief Compliance Officer of Impresa Management LLC (2013-present); and Chief Compliance Officer of FMR Co., Inc., Fidelity Investments Money Management, Inc., Fidelity Management & Research (Japan) Inc., Fidelity Management & Research (U.K.) Inc., Fidelity Management & Research (Hong Kong), Fidelity Management & Research Company, Pyramis Global Advisors, LLC, and Strategic Advisers, Inc., Ballyrock Investment Advisors LLC, and Northern Neck Investors LLC (2012-present). Previously, Ms. Wondrack served as Senior Vice President and Chief Compliance Officer for Columbia Management Investment Advisers, LLC (2005-2012); Chief Compliance Officer for certain funds within the Columbia Family of Funds (2007-2012); and Senior Vice President of Compliance Risk Management at Bank of America (2005-2010). |
Joseph F. Zambello (1957) |
Year of Election or Appointment: 2011 Deputy Treasurer |
| Mr. Zambello also serves as Deputy Treasurer of other funds. Mr. Zambello is an employee of Fidelity Investments. Previously, Mr. Zambello served as Vice President of FMR's Program Management Group (2009-2011) and Vice President of the Transfer Agent Oversight Group (2005-2009). |
Annual Report
Leveraged Company Stock designates 100% of the dividends distributed during the fiscal year as qualifying for the dividends-received deduction for corporate shareholders.
Leveraged Company Stock designates 100% of the dividends distributed during the fiscal year as amounts which may be taken into account as a dividend for the purposes of the maximum rate under section 1(h)(11) of the Internal Revenue Code.
The fund will notify shareholders in January 2015 of amounts for use in preparing 2014 income tax returns.
Annual Report
Board Approval of Investment Advisory Contracts and Management Fees
Fidelity Leveraged Company Stock Fund
Each year, the Board of Trustees, including the Independent Trustees (together, the Board), votes on the renewal of the management contract with Fidelity Management & Research Company (FMR) and the sub-advisory agreements (together, the Advisory Contracts) for the fund. The Board, assisted by the advice of fund counsel and Independent Trustees' counsel, requests and considers a broad range of information relevant to the renewal of the Advisory Contracts throughout the year.
The Board meets regularly and, at each of its meetings, covers an extensive agenda of topics and materials and considers factors that are relevant to its annual consideration of the renewal of the fund's Advisory Contracts, including the services and support provided to the fund and its shareholders. The Board has established various standing committees (Committees), each composed of and chaired by Independent Trustees with varying backgrounds, to which the Board has assigned specific subject matter responsibilities in order to enhance effective decision-making by the Board. The Board, acting directly and through its Committees, requests and receives information concerning the annual consideration of the renewal of the fund's Advisory Contracts. The Board also meets as needed to consider matters specifically related to the Board's annual consideration of the renewal of the Advisory Contracts. Members of the Board may also meet with trustees of other Fidelity funds through ad hoc joint committees to discuss certain matters relevant to the Fidelity funds.
At its July 2014 meeting, the Board, including the Independent Trustees, unanimously determined to renew the fund's Advisory Contracts. In reaching its determination, the Board considered all factors it believed relevant, including (i) the nature, extent, and quality of the services to be provided to the fund and its shareholders (including the investment performance of the fund); (ii) the competitiveness of the fund's management fee and total expense ratio relative to peer funds; (iii) the total costs of the services to be provided by and the profits to be realized by Fidelity from its relationship with the fund; (iv) the extent to which economies of scale exist and would be realized as the fund grows; and (v) whether fee levels reflect these economies of scale, if any, for the benefit of fund shareholders. In connection with separate internal corporate reorganizations involving Fidelity Management & Research (U.K.) Inc. (FMR U.K.) and Fidelity Management & Research (Japan) Inc. (FMR Japan), the Board approved certain non-material amendments to the fund's sub-advisory agreements with FMR U.K. and FMR Japan to reflect that, after these reorganizations, FMR Investment Management (UK) Limited and Fidelity Management & Research (Japan) Limited will carry on the business of FMR U.K. and FMR Japan, respectively. The Board noted that no changes to the portfolio managers or to the foreign research or investment advisory services provided to the fund were expected in connection with either reorganization and that the same personnel and resources would continue to be available to the fund at the new entities.
Annual Report
Board Approval of Investment Advisory Contracts and
Management Fees - continued
In considering whether to renew the Advisory Contracts for the fund, the Board reached a determination, with the assistance of fund counsel and Independent Trustees' counsel and through the exercise of its business judgment, that the renewal of the Advisory Contracts was in the best interests of the fund and its shareholders and that the compensation payable under the Advisory Contracts was fair and reasonable. The Board's decision to renew the Advisory Contracts was not based on any single factor, but rather was based on a comprehensive consideration of all the information provided to the Board at its meetings throughout the year. The Board, in reaching its determination to renew the Advisory Contracts, was aware that shareholders of the fund have a broad range of investment choices available to them, including a wide choice among funds offered by Fidelity's competitors, and that the fund's shareholders, who have the opportunity to review and weigh the disclosure provided by the fund in its prospectus and other public disclosures, have chosen to invest in this fund, which is part of the Fidelity family of funds.
Nature, Extent, and Quality of Services Provided. The Board considered Fidelity's staffing as it relates to the fund, including the backgrounds of investment personnel of FMR and the sub-advisers (together, the Investment Advisers), and also considered the fund's investment objective, strategies, and related investment philosophy. The Independent Trustees also had discussions with senior management of Fidelity's investment operations and investment groups. The Board considered the structure of the portfolio manager compensation program and whether this structure provides appropriate incentives to act in the best interests of the fund. Additionally, the Board considered the portfolio managers' investments, if any, in the funds that they manage.
Resources Dedicated to Investment Management and Support Services. The Boardand the Fund Oversight and Research Committees reviewed the general qualifications and capabilities of Fidelity's investment staff, including its size, education, experience, and resources, as well as Fidelity's approach to recruiting, training, managing, and compensating investment personnel. The Board noted that Fidelity has continued to increase the resources devoted to non-U.S. offices, including expansion of Fidelity's global investment organization. The Board also noted that Fidelity's analysts have extensive resources, tools and capabilities that allow them to conduct sophisticated quantitative and fundamental analysis, as well as credit analysis of issuers, counterparties and guarantors. Further, the Board believes that Fidelity's investment professionals have sufficient access to global information and data so as to provide competitive investment results over time, and that those professionals also have access to sophisticated tools that permit them to assess portfolio construction and risk and performance attribution characteristics continuously, as well as to transmit new information and research conclusions rapidly around the world. Additionally, in its deliberations, the Board considered Fidelity's trading and risk management capabilities and resources and global compliance infrastructure, which are an integral part of the investment management process.
Annual Report
Shareholder and Administrative Services. The Board considered (i) the nature, extent, quality, and cost of advisory, administrative, and shareholder services performed by the Investment Advisers and their affiliates under the Advisory Contracts and under separate agreements covering transfer agency, pricing and bookkeeping, and securities lending services for the fund; (ii) the nature and extent of the supervision of third party service providers, principally custodians and subcustodians; and (iii) the resources devoted to, and the record of compliance with, the fund's compliance policies and procedures. The Board also reviewed the allocation of fund brokerage, including allocations to brokers affiliated with the Investment Advisers, the use of brokerage commissions to pay fund expenses, and the use of "soft" commission dollars to pay for research services.
The Board noted that the growth of fund assets over time across the complex allows Fidelity to reinvest in the development of services designed to enhance the value or convenience of the Fidelity funds as investment vehicles. These services include 24-hour access to account information and market information through telephone representatives and over the Internet, investor education materials and asset allocation tools, and the expanded availability of Fidelity Investor Centers.
In 2014, the Board formed an ad hoc Committee on Transfer Agency Fees to review the variety of transfer agency fee structures throughout the industry and Fidelity's competitive positioning with respect to industry participants.
Investment in a Large Fund Family. The Board considered the benefits to shareholders of investing in a Fidelity fund, including the benefits of investing in a fund that is part of a large family of funds offering a variety of investment disciplines and providing a large variety of mutual fund investor services. The Board noted that Fidelity had taken, or had made recommendations that resulted in the Fidelity funds taking, a number of actions over the previous year that benefited particular funds, including (i) continuing to dedicate additional resources to investment research and to the support of the senior management team that oversees asset management; (ii) persisting in efforts to enhance Fidelity's global research capabilities; (iii) launching new funds and making other enhancements to meet client needs for income-oriented solutions; (iv) reducing fund expenses for certain index funds; (v) continuing to launch dedicated lower cost underlying funds to meet portfolio construction needs related to expanding underlying fund options for Fidelity funds of funds, specifically for the Freedom Fund product lines; (vi) rationalizing product lines and gaining increased efficiencies through fund mergers; (vii) launching sector-based exchange-traded funds and establishing a new Fidelity adviser to manage sector-based funds and products; (viii) continuing to develop and implement technology to improve security and increase efficiency; (ix) modifying the eligibility criteria for certain share classes to increase their marketability to a portion of the defined contribution plan market; (x) waiving redemption fees for certain qualified fund-of-fund and wrap programs and certain retirement plan transactions; and (xi) launching new Institutional Class shares of certain money market funds to attract and retain assets and to fill a gap in the money market fund lineup.
Annual Report
Board Approval of Investment Advisory Contracts and
Management Fees - continued
Investment Performance. The Board considered whether the fund has operated in accordance with its investment objective, as well as its record of compliance with its investment restrictions and its performance history.
The Board took into account discussions with the Investment Advisers about fund investment performance that occur at Board meetings throughout the year. In this regard the Board noted that as part of regularly scheduled fund reviews and other reports to the Board on fund performance, the Board periodically considers annualized return information for the fund, for different time periods, measured against a securities market index ("benchmark index") and a peer group of funds with similar objectives ("peer group"). In its evaluation of fund investment performance, the Board gave particular attention to information indicating changes in performance of certain Fidelity funds for specific time periods and the Investment Advisers' explanations for any overperformance or underperformance.
In addition to reviewing absolute and relative fund performance, the Independent Trustees periodically consider the appropriateness of fund performance metrics in evaluating the results achieved. In general, the Independent Trustees believe that fund performance should be evaluated based on net performance (after fees and expenses) of both the highest performing and lowest performing classes, where applicable, compared to appropriate benchmark indices, over appropriate time periods which may include full market cycles, and compared to peer groups, as applicable, over the same periods, taking into account relevant factors including the following: general market conditions; issuer-specific information; tactical opportunities for investment; and fund cash flows and other factors.
The Independent Trustees recognize that shareholders evaluate performance on a net basis over their own holding periods, for which one-, three-, and five-year periods are often used as a proxy. For this reason, the performance information reviewed by the Board also included net cumulative calendar year total return information for the fund and an appropriate benchmark index and peer group for the most recent one-, three-, and five-year periods, as shown below. Returns are shown compared to the 25th percentile (top of box, 75% beaten) and 75th percentile (bottom of box, 25% beaten) of the peer universe.
Annual Report
Fidelity Leveraged Company Stock Fund
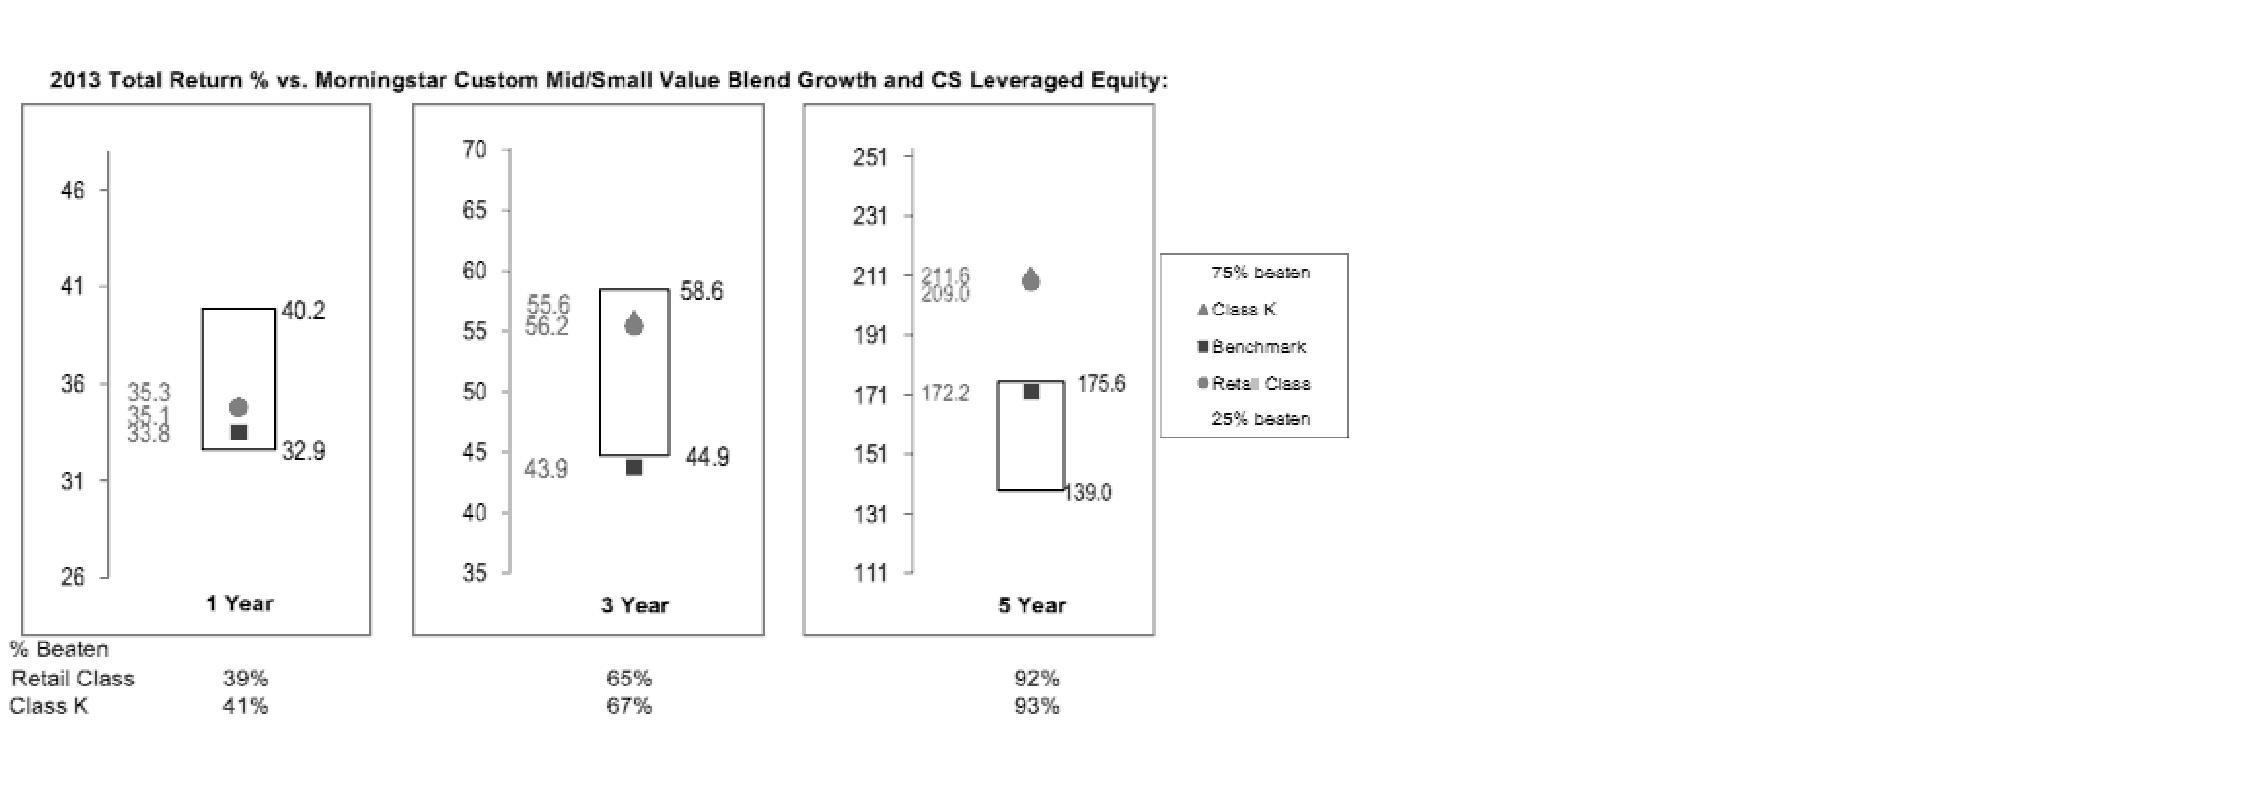
Based on its review, the Board concluded that the nature, extent, and quality of services provided to the fund under the Advisory Contracts should benefit the fund's shareholders.
Competitiveness of Management Fee and Total Expense Ratio. The Board considered the fund's management fee and total expense ratio compared to "mapped groups" of competitive funds and classes. Fidelity creates "mapped groups" by combining similar Lipper investment objective categories that have comparable investment mandates. Combining Lipper investment objective categories aids the Board's management fee and total expense ratio comparisons by broadening the competitive group used for comparison and by reducing the number of universes to which various Fidelity funds are compared.
Management Fee. The Board considered two proprietary management fee comparisons for the 12-month periods shown in the chart below. The group of Lipper funds used by the Board for management fee comparisons is referred to below as the "Total Mapped Group." The Total Mapped Group comparison focuses on a fund's standing in terms of gross management fees before expense reimbursements or caps relative to the total universe of funds with comparable investment mandates, regardless of whether their management fee structures also are comparable. Funds with comparable investment mandates offer exposure to similar types of securities. Funds with comparable management fee structures have similar management fee contractual arrangements (e.g., flat rate charged for advisory services, all-inclusive fee rate, etc.). "TMG %" represents the percentage of funds in the Total Mapped Group that had management fees that were lower than the fund's. For example, a hypothetical TMG % of 20% would mean that 80% of the funds in the Total Mapped Group had higher, and 20% had lower, management fees than the fund. The fund's actual TMG %s are in the chart below. The "Asset-Size Peer Group" (ASPG) comparison focuses on a fund's standing relative to a subset of non-Fidelity funds within the Total Mapped Group that are similar in size and management fee structure. For example, if a fund is in the first quartile of the ASPG, the fund's management fee ranks in the least expensive or lowest 25% of funds in the ASPG. The ASPG represents at least 15% of the funds in the Total Mapped Group with comparable asset size and management fee structures, subject to a minimum of 50 funds (or all funds in the Total Mapped Group if fewer than 50). Additional information, such as the ASPG quartile in which the fund's management fee rate ranked, is also included in the chart and considered by the Board.
Annual Report
Board Approval of Investment Advisory Contracts and
Management Fees - continued
Fidelity Leveraged Company Stock Fund

The Board noted that the fund's management fee rate ranked below the median of its Total Mapped Group and below the median of its ASPG for 2013.
The Board also noted that, in August 2013, the ad hoc Committee on Management Fees was formed to conduct an in-depth review of the management fee rates of Fidelity's active equity mutual funds. The Committee focused on the following areas: (i) standard fee structures; (ii) research consumption and trading evolution; (iii) management fee competitiveness/profitability by category; and (iv) factors that drive institutional pricing.
Based on its review, the Board concluded that the fund's management fee is fair and reasonable in light of the services that the fund receives and the other factors considered.
Annual Report
Total Expense Ratio. In its review of each class's total expense ratio, the Board considered the fund's management fee as well as other fund or class expenses, as applicable, such as transfer agent fees, pricing and bookkeeping fees, and custodial, legal, and audit fees. The Board also noted the effects of any waivers and reimbursements on fees and expenses. As part of its review, the Board also considered the current and historical total expense ratios of each class of the fund compared to competitive fund median expenses. Each class of the fund is compared to those funds and classes in the Total Mapped Group (used by the Board for management fee comparisons) that have a similar sales load structure.
The Board noted that the total expense ratio of each class ranked below its competitive median for 2013.
Fees Charged to Other Fidelity Clients. The Board also considered Fidelity fee structures and other information with respect to clients of Fidelity, such as other funds advised or subadvised by Fidelity, pension plan clients, and other institutional clients. The Board noted the findings of the 2013 ad hoc joint committee (created with the board of other Fidelity funds), which reviewed and compared Fidelity's institutional investment advisory business with its business of providing services to the Fidelity funds, including the differences in services provided, fees charged, and costs incurred, as well as competition in their respective marketplaces.
Based on its review of total expense ratios and fees charged to other Fidelity clients, the Board concluded that the total expense ratio of each class of the fund was reasonable in light of the services that the fund and its shareholders receive and the other factors considered.
Costs of the Services and Profitability. The Board considered the revenues earned and the expenses incurred by Fidelity in conducting the business of developing, marketing, distributing, managing, administering and servicing the fund and servicing the fund's shareholders. The Board also considered the level of Fidelity's profits in respect of all the Fidelity funds.
On an annual basis, Fidelity presents to the Board Fidelity's profitability for the fund. Fidelity calculates the profitability for each fund, as well as aggregate profitability for groups of Fidelity funds and all Fidelity funds, using a series of detailed revenue and cost allocation methodologies which originate with the books and records of Fidelity on which Fidelity's audited financial statements are based. The Audit Committee of the Board reviews any significant changes from the prior year's methodologies.
PricewaterhouseCoopers LLP (PwC), independent registered public accounting firm and auditor to Fidelity and certain Fidelity funds, has been engaged annually by the Board as part of the Board's assessment of Fidelity's profitability analysis. PwC's engagement includes the review and assessment of the methodologies used by Fidelity in determining the revenues and expenses attributable to Fidelity's mutual fund business, and completion of agreed-upon procedures in respect of the mathematical accuracy of fund profitability and its conformity to established allocation methodologies. After considering PwC's reports issued under the engagement and information provided by Fidelity, the Board concluded that while other allocation methods may also be reasonable, Fidelity's profitability methodologies are reasonable in all material respects.
Annual Report
Board Approval of Investment Advisory Contracts and
Management Fees - continued
The Board also reviewed Fidelity's non-fund businesses and fall-out benefits related to the mutual fund business as well as cases where Fidelity's affiliates may benefit from or be related to the fund's business.
The Board considered the costs of the services provided by and the profits realized by Fidelity in connection with the operation of the fund and was satisfied that the profitability was not excessive in the circumstances.
Economies of Scale. The Board considered whether there have been economies of scale in respect of the management of the Fidelity funds, whether the Fidelity funds (including the fund) have appropriately benefited from any such economies of scale, and whether there is potential for realization of any further economies of scale. The Board considered the extent to which the fund will benefit from economies of scale through increased services to the fund, through waivers or reimbursements, or through fee or expense ratio reductions. The Board also noted that in 2013, it and the boards of other Fidelity funds created an ad hoc committee (the Economies of Scale Committee) to analyze whether Fidelity attains economies of scale in respect of the management and servicing of the Fidelity funds, whether the Fidelity funds have appropriately benefited from such economies of scale, and whether there is potential for realization of any further economies of scale.
The Board recognized that the fund's management contract incorporates a "group fee" structure, which provides for lower group fee rates as total group assets increase, and for higher group fee rates as total group assets decrease (with "group assets" defined to include fund assets under FMR's management plus sector fund assets previously under FMR's management and currently managed by Fidelity SelectCo, LLC). FMR calculates the group fee rates based on a tiered asset "breakpoint" schedule that varies based on asset class. The Board considered that the group fee is designed to deliver the benefits of economies of scale to fund shareholders when total Fidelity fund assets increase, even if assets of any particular fund are unchanged or have declined, because some portion of Fidelity's costs are attributable to services provided to all Fidelity funds, and all funds benefit if those costs can be allocated among more assets. The Board concluded that, given the group fee structure, fund shareholders will benefit from lower management fees as group assets increase at the fund complex level, regardless of whether Fidelity achieves any such economies of scale.
Annual Report
The Board concluded, taking into account the analysis of the Economies of Scale Committee, that economies of scale, if any, are being appropriately shared between fund shareholders and Fidelity.
Additional Information Requested by the Board. In order to develop fully the factual basis for consideration of the Fidelity funds' Advisory Contracts, the Board requested and received additional information on certain topics, including: (i) fund performance trends and Fidelity's long-term strategies for certain funds; (ii) Fidelity's strategic marketing and product lineup goals; (iii) the methodology with respect to competitive fund data and peer group classifications; (iv) the arrangements with, and performance of, certain sub-advisers on behalf of the Fidelity funds, as well as certain proposed participating affiliate arrangements; (v) the realization of fall-out benefits in certain Fidelity business units; (vi) Fidelity's group fee structures, including the rationale for the individual fee rates of certain categories of funds and the definition of group assets; (vii) trends regarding industry use of performance fee structures and the performance adjustment methodologies applicable to the Fidelity funds; (viii) additional competitive analysis regarding the total expenses for certain classes; (ix) fund profitability methodology, including Fidelity's cost allocation methodology, and the impact of certain factors on fund profitability results; and (x) the process by which Fidelity determines sub-advisory fees for funds it advises.
Based on its evaluation of all of the conclusions noted above, and after considering all factors it believed relevant, the Board ultimately concluded that the advisory fee structures are fair and reasonable, and that the fund's Advisory Contracts should be renewed.
Annual Report
Investment Adviser
Fidelity Management & Research Company
Boston, MA
Investment Sub-Advisers
FMR Co., Inc.
Fidelity Management & Research
(U.K.) Inc.
Fidelity Management & Research
(Hong Kong) Limited
Fidelity Management & Research
(Japan) Inc.
General Distributor
Fidelity Distributors Corporation
Smithfield, RI
Transfer and Service Agents
Fidelity Investments Institutional
Operations Company, Inc.
Boston, MA
Fidelity Service Company, Inc.
Boston, MA
Custodian
JPMorgan Chase Bank
New York, NY
The Fidelity Telephone Connection
Mutual Fund 24-Hour Service
Exchanges/Redemptions
and Account Assistance 1-800-544-6666
Product Information 1-800-544-6666
Retirement Accounts 1-800-544-4774
(8 a.m. - 9 p.m.)
TDD Service 1-800-544-0118
for the deaf and hearing impaired
(9 a.m. - 9 p.m. Eastern time)
Fidelity Automated Service
Telephone (FAST®)
1-800-544-5555
Automated line for quickest service
(Fidelity Investment logo)(registered trademark)
Corporate Headquarters
245 Summer St., Boston, MA 02210
www.fidelity.com
LSF-UANN-0914
1.789248.111
Fidelity®
Leveraged Company Stock
Fund -
Class K
Annual Report
July 31, 2014
(Fidelity Cover Art)
Contents
Performance | (Click Here) | How the fund has done over time. |
Management's Discussion of Fund Performance | (Click Here) | The Portfolio Manager's review of fund performance and strategy. |
Shareholder Expense Example | (Click Here) | An example of shareholder expenses. |
Investment Changes | (Click Here) | A summary of major shifts in the fund's investments over the last six months. |
Investments | (Click Here) | A complete list of the fund's investments with their market values. |
Financial Statements | (Click Here) | Statements of assets and liabilities, operations, and changes in net assets, as well as financial highlights. |
Notes | (Click Here) | Notes to the financial statements. |
Report of Independent Registered Public Accounting Firm | (Click Here) | |
Trustees and Officers | (Click Here) | |
Distributions | (Click Here) | |
Board Approval of Investment Advisory Contracts and Management Fees | (Click Here) | |
To view a fund's proxy voting guidelines and proxy voting record for the 12-month period ended June 30, visit http://www.fidelity.com/proxyvotingresults or visit the Securities and Exchange Commission's (SEC) web site at http://www.sec.gov. You may also call 1-800-835-5092 to request a free copy of the proxy voting guidelines.
Standard & Poor's, S&P and S&P 500 are registered service marks of The McGraw-Hill Companies, Inc. and have been licensed for use by Fidelity Distributors Corporation.
Other third-party marks appearing herein are the property of their respective owners.
All other marks appearing herein are registered or unregistered trademarks or service marks of FMR LLC or an affiliated company. © 2014 FMR LLC. All rights reserved.
Annual Report
This report and the financial statements contained herein are submitted for the general information of the shareholders of the fund. This report is not authorized for distribution to prospective investors in the fund unless preceded or accompanied by an effective prospectus.
A fund files its complete schedule of portfolio holdings with the SEC for the first and third quarters of each fiscal year on Form N-Q. Forms N-Q are available on the SEC's web site at http://www.sec.gov. A fund's Forms N-Q may be reviewed and copied at the SEC's Public Reference Room in Washington, DC. Information regarding the operation of the SEC's Public Reference Room may be obtained by calling 1-800-SEC-0330. For a complete list of a fund's portfolio holdings, view the most recent holdings listing, semiannual report, or annual report on Fidelity's web site at http://www.fidelity.com, http://www.advisor.fidelity.com, or http://www.401k.com, as applicable.
NOT FDIC INSURED • MAY LOSE VALUE • NO BANK GUARANTEE
Neither the fund nor Fidelity Distributors Corporation is a bank.
Annual Report
Average annual total return reflects the change in the value of an investment, assuming reinvestment of the class' distributions from dividend income and capital gains (the profits earned upon the sale of securities that have grown in value, if any) and assuming a constant rate of performance each year. The $10,000 table and the fund's returns do not reflect the deduction of taxes that a shareholder would pay on fund distributions or the redemption of fund shares. During periods of reimbursement by Fidelity, a fund's total return will be greater than it would be had the reimbursement not occurred. How a fund did yesterday is no guarantee of how it will do tomorrow.
Average Annual Total Returns
Periods ended July 31, 2014 | Past 1
year | Past 5
years | Past 10
years |
Class K A | 17.10% | 19.51% | 11.31% |
A The initial offering of Class K shares took place on May 9, 2008. Returns prior to May 9, 2008 are those of Fidelity® Leveraged Company Stock Fund, the original class of the fund.
$10,000 Over 10 Years
Let's say hypothetically that $10,000 was invested in Fidelity® Leveraged Company Stock Fund - Class K on July 31, 2004. The chart shows how the value of your investment would have changed, and also shows how the S&P 500® Index performed over the same period. The initial offering of Class K took place on May 9, 2008. See footnote A above for additional information regarding the performance of Class K.
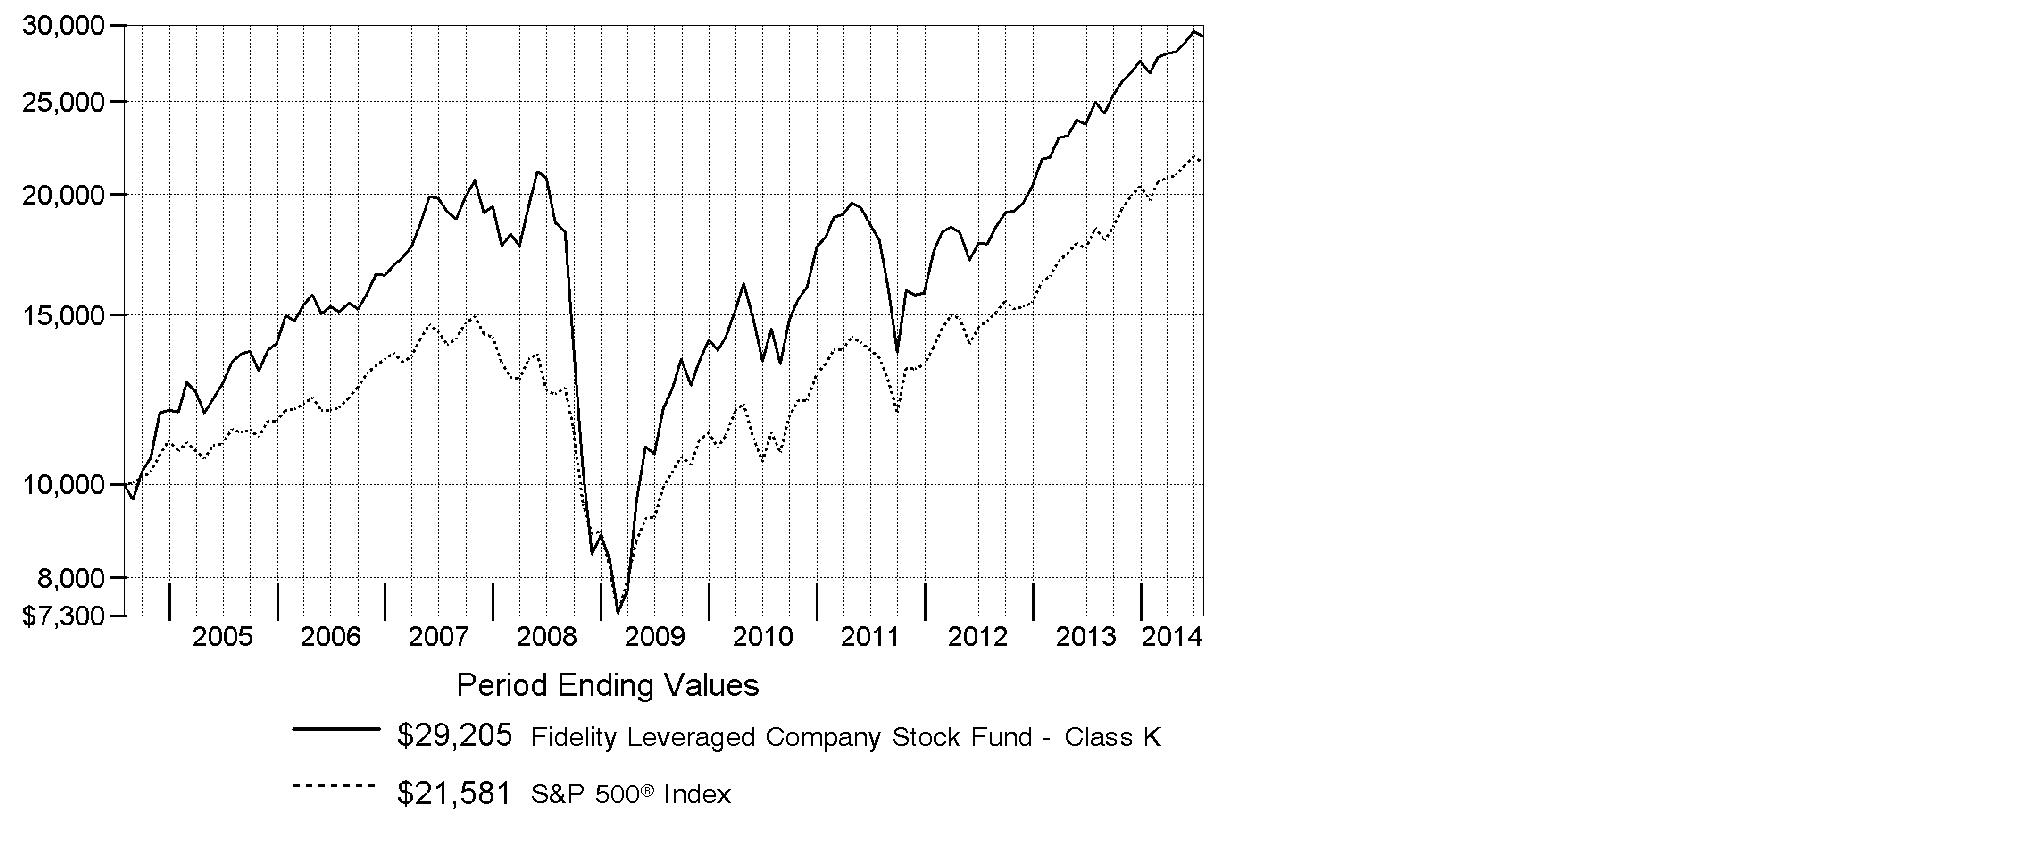
Annual Report
Market Recap: U.S. stocks overcame a slowing economy early in 2014 to post a strong gain for the 12-month period ending July 31, 2014, supported by corporate profits and continued low interest rates. The S&P 500® Index rose 16.94%, reaching an all-time high near period end. The technology-heavy Nasdaq Composite Index® gained 22.00%. The Russell 2000® Index returned 8.56%, reflecting the relatively lackluster performance of small-cap stocks. Information technology (+28%) was the top-performing sector within the S&P 500®, driven by strong semiconductor and computer hardware sales. Materials (+23%) gained amid higher prices for many commodity products. Health care (+21%) rose, driven by gains in pharmaceuticals, biotechnology & life sciences companies. Energy stocks (+19%) advanced in the latter part of the period amid healthy U.S. output and the threat of supply disruptions in Iraq. Conversely, most defensive sectors, including consumer staples, utilities and telecommunication services, lagged the broader market. Volatility remained tame throughout most of the period, with markets supported by declining unemployment, near-record profit margins for companies, muted cost inflation and fairly low corporate debt levels. Geopolitical tension remained a concern at period end, with conflict in Ukraine and strained relations between Russia and the West posing a potential threat to global growth.
Comments from Thomas Soviero, Portfolio Manager of Fidelity® Leveraged Company Stock Fund: For the year, the fund's Class K shares returned 17.10%, compared with 16.94% for the S&P 500® Index. I continued to concentrate the fund in what I considered to be my best ideas. I remained concerned about the health of economies abroad, so I maintained a relatively defensive posture, highlighting U.S.-centric investments and holding an average weighting of 6% in cash during the period. This cash stance was a drag on performance relative to the S&P 500®. Performance versus the benchmark was buoyed by stock selection in materials and transportation, especially investments in chemicals manufacturer LyondellBasell Industries, as well as Delta Air Lines and American Airlines Group. American was not in the index. Semiconductor manufacturer Micron Technology was another top contributor. On the down side, we were held back by positioning in information technology and consumer discretionary. General Motors was a main detractor, along with video game retailer GameStop and not owning consumer electronics giant and index component Apple.
The views expressed above reflect those of the portfolio manager(s) only through the end of the period as stated on the cover of this report and do not necessarily represent the views of Fidelity or any other person in the Fidelity organization. Any such views are subject to change at any time based upon market or other conditions and Fidelity disclaims any responsibility to update such views. These views may not be relied on as investment advice and, because investment decisions for a Fidelity fund are based on numerous factors, may not be relied on as an indication of trading intent on behalf of any Fidelity fund.
Annual Report
Shareholder Expense Example
As a shareholder of the Fund, you incur two types of costs: (1) transaction costs, including redemption fees and (2) ongoing costs, including management fees and other Fund expenses. This Example is intended to help you understand your ongoing costs (in dollars) of investing in the Fund and to compare these costs with the ongoing costs of investing in other mutual funds.
The Example is based on an investment of $1,000 invested at the beginning of the period and held for the entire period (February 1, 2014 to July 31, 2014).
Actual Expenses
The first line of the accompanying table for each class of the Fund provides information about actual account values and actual expenses. You may use the information in this line, together with the amount you invested, to estimate the expenses that you paid over the period. Simply divide your account value by $1,000.00 (for example, an $8,600 account value divided by $1,000.00 = 8.6), then multiply the result by the number in the first line for a class of the Fund under the heading entitled "Expenses Paid During Period" to estimate the expenses you paid on your account during this period. A small balance maintenance fee of $12.00 that is charged once a year may apply for certain accounts with a value of less than $2,000. This fee is not included in the table below. If it was, the estimate of expenses you paid during the period would be higher, and your ending account value lower, by this amount. In addition, the Fund, as a shareholder in the underlying Fidelity Central Funds, will indirectly bear its pro-rata share of the fees and expenses incurred by the underlying Fidelity Central Funds. These fees and expenses are not included in the Fund's annualized expense ratio used to calculate the expense estimate in the table below.
Hypothetical Example for Comparison Purposes
The second line of the accompanying table for each class of the Fund provides information about hypothetical account values and hypothetical expenses based on a Class' actual expense ratio and an assumed rate of return of 5% per year before expenses, which is not the Class' actual return. The hypothetical account values and expenses may not be used to estimate the actual ending account balance or expenses you paid for the period. You may use this information to compare the ongoing costs of investing in the Fund and other funds. To do so, compare this 5% hypothetical example with the 5% hypothetical examples that appear in the shareholder reports of the other funds. A small balance maintenance fee of $12.00 that is charged once a year may apply for certain accounts with a value of less than $2,000. This fee is not included in the table below. If it was, the estimate of expenses you paid during the period would be higher, and your ending account value lower, by this amount. In addition, the Fund, as a shareholder in the underlying Fidelity Central Funds, will indirectly bear its pro-rata share of the fees and expenses incurred by the underlying Fidelity Central Funds. These fees and expenses are not included in the Fund's annualized expense ratio used to calculate the expense estimate in the table below.
Please note that the expenses shown in the table are meant to highlight your ongoing costs only and do not reflect any transaction costs. Therefore, the second line of the table is useful in comparing ongoing costs only, and will not help you determine the relative total costs of owning different funds. In addition, if these transactional costs were included, your costs would have been higher.
Annual Report
| Annualized
Expense RatioB | Beginning
Account Value
February 1, 2014 | Ending
Account Value
July 31, 2014 | Expenses Paid
During Period*
February 1, 2014
to July 31, 2014 |
Leveraged Company Stock | .79% | | | |
Actual | | $ 1,000.00 | $ 1,092.00 | $ 4.10 |
HypotheticalA | | $ 1,000.00 | $ 1,020.88 | $ 3.96 |
Class K | .67% | | | |
Actual | | $ 1,000.00 | $ 1,092.30 | $ 3.48 |
HypotheticalA | | $ 1,000.00 | $ 1,021.47 | $ 3.36 |
A 5% return per year before expenses
B Annualized expense ratio reflects expenses net of applicable fee waivers.
* Expenses are equal to each Class' annualized expense ratio, multiplied by the average account value over the period, multiplied by 181/365 (to reflect the one-half year period).
Annual Report
Investment Changes (Unaudited)
Top Ten Stocks as of July 31, 2014 |
| % of fund's
net assets | % of fund's net assets
6 months ago |
LyondellBasell Industries NV Class A | 10.3 | 8.3 |
Service Corp. International | 3.8 | 3.6 |
Comcast Corp. Class A | 3.8 | 4.5 |
Ford Motor Co. | 2.6 | 2.7 |
General Motors Co. | 2.6 | 3.2 |
Delta Air Lines, Inc. | 2.5 | 2.2 |
Bank of America Corp. | 2.5 | 2.8 |
Boston Scientific Corp. | 2.2 | 2.6 |
GameStop Corp. Class A | 2.0 | 1.9 |
Rock-Tenn Co. Class A | 1.9 | 1.8 |
| 34.2 | |
Top Five Market Sectors as of July 31, 2014 |
| % of fund's
net assets | % of fund's net assets
6 months ago |
Consumer Discretionary | 24.5 | 25.3 |
Materials | 14.6 | 12.8 |
Financials | 11.7 | 12.0 |
Industrials | 11.5 | 11.1 |
Health Care | 10.9 | 11.1 |
Asset Allocation (% of fund's net assets) |
As of July 31, 2014* | As of January 31, 2014** |
| Stocks 98.0% | | | Stocks 95.9% | |
| Bonds 0.4% | | | Bonds 0.6% | |
| Convertible
Securities 0.0% | | | Convertible
Securities 0.1% | |
| Short-Term
Investments and
Net Other Assets (Liabilities) 1.6% | | | Short-Term
Investments and
Net Other Assets (Liabilities) 3.4% | |
* Foreign investments | 17.7% | | ** Foreign investments | 15.2% | |

Annual Report
Investments July 31, 2014
Showing Percentage of Net Assets
Common Stocks - 97.8% |
| Shares | | Value (000s) |
CONSUMER DISCRETIONARY - 24.5% |
Auto Components - 2.5% |
Delphi Automotive PLC | 592,300 | | $ 39,566 |
Tenneco, Inc. (a) | 825,300 | | 52,572 |
TRW Automotive Holdings Corp. (a) | 396,200 | | 40,527 |
| | 132,665 |
Automobiles - 5.6% |
Ford Motor Co. | 8,332,333 | | 141,816 |
General Motors Co. | 4,081,587 | | 138,039 |
General Motors Co.: | | | |
warrants 7/10/16 (a) | 469,476 | | 11,526 |
warrants 7/10/19 (a) | 469,476 | | 7,934 |
Motors Liquidation Co. GUC Trust (a) | 123,112 | | 2,967 |
| | 302,282 |
Diversified Consumer Services - 3.8% |
Service Corp. International | 9,896,727 | | 207,831 |
Hotels, Restaurants & Leisure - 0.6% |
ARAMARK Holdings Corp. | 987,744 | | 26,630 |
Penn National Gaming, Inc. (a) | 360,340 | | 3,776 |
Station Holdco LLC unit (a)(g)(h) | 146,846 | | 56 |
| | 30,462 |
Household Durables - 2.0% |
Hovnanian Enterprises, Inc. Class A (a)(d) | 1,419,000 | | 5,676 |
Lennar Corp. Class A (d) | 677,100 | | 24,531 |
Newell Rubbermaid, Inc. | 2,341,747 | | 76,060 |
| | 106,267 |
Media - 7.1% |
AMC Networks, Inc. Class A (a) | 446,400 | | 26,726 |
Cinemark Holdings, Inc. | 2,601,645 | | 85,334 |
Comcast Corp. Class A | 3,767,334 | | 202,419 |
Gray Television, Inc. (a)(e) | 3,766,164 | | 45,872 |
Nexstar Broadcasting Group, Inc. Class A | 455,698 | | 21,231 |
| | 381,582 |
Specialty Retail - 2.9% |
Asbury Automotive Group, Inc. (a) | 385,122 | | 26,007 |
GameStop Corp. Class A (d) | 2,590,007 | | 108,703 |
Sally Beauty Holdings, Inc. (a) | 808,000 | | 20,968 |
| | 155,678 |
TOTAL CONSUMER DISCRETIONARY | | 1,316,767 |
Common Stocks - continued |
| Shares | | Value (000s) |
CONSUMER STAPLES - 1.7% |
Food Products - 1.4% |
ConAgra Foods, Inc. | 541,700 | | $ 16,321 |
Darling International, Inc. (a) | 3,065,983 | | 57,395 |
| | 73,716 |
Personal Products - 0.3% |
Revlon, Inc. (a) | 553,261 | | 16,874 |
TOTAL CONSUMER STAPLES | | 90,590 |
ENERGY - 10.4% |
Energy Equipment & Services - 2.9% |
Ensco PLC Class A | 110,000 | | 5,572 |
Halliburton Co. | 1,126,593 | | 77,724 |
Noble Corp. | 987,610 | | 30,981 |
Oil States International, Inc. (a) | 270,466 | | 16,577 |
Schlumberger Ltd. | 109,400 | | 11,858 |
Transocean Ltd. (United States) (d) | 381,900 | | 15,406 |
| | 158,118 |
Oil, Gas & Consumable Fuels - 7.5% |
Continental Resources, Inc. (a)(d) | 494,487 | | 72,581 |
Denbury Resources, Inc. | 1,522,200 | | 25,801 |
Hess Corp. | 835,910 | | 82,738 |
HollyFrontier Corp. | 1,549,563 | | 72,845 |
Kodiak Oil & Gas Corp. (a) | 2,019,747 | | 31,387 |
Peabody Energy Corp. | 822,825 | | 12,482 |
Range Resources Corp. | 247,200 | | 18,686 |
Valero Energy Corp. | 1,328,266 | | 67,476 |
Western Refining, Inc. | 451,814 | | 18,506 |
| | 402,502 |
TOTAL ENERGY | | 560,620 |
FINANCIALS - 11.5% |
Banks - 7.9% |
Bank of America Corp. | 8,641,999 | | 131,790 |
Barclays PLC sponsored ADR (d) | 2,441,721 | | 37,065 |
CIT Group, Inc. | 229,310 | | 11,261 |
Citigroup, Inc. | 1,458,047 | | 71,313 |
Huntington Bancshares, Inc. | 8,526,580 | | 83,731 |
Common Stocks - continued |
| Shares | | Value (000s) |
FINANCIALS - continued |
Banks - continued |
Regions Financial Corp. | 5,015,480 | | $ 50,857 |
SunTrust Banks, Inc. | 1,019,600 | | 38,796 |
| | 424,813 |
Consumer Finance - 1.1% |
American Express Co. | 679,548 | | 59,800 |
Insurance - 1.1% |
AFLAC, Inc. | 641,700 | | 38,335 |
Lincoln National Corp. | 435,700 | | 22,826 |
| | 61,161 |
Real Estate Investment Trusts - 1.0% |
Gaming & Leisure Properties | 430,875 | | 14,508 |
Host Hotels & Resorts, Inc. | 1,016,122 | | 22,090 |
Sabra Health Care REIT, Inc. | 547,507 | | 15,166 |
| | 51,764 |
Real Estate Management & Development - 0.3% |
Realogy Holdings Corp. (a) | 463,840 | | 17,051 |
Thrifts & Mortgage Finance - 0.1% |
MGIC Investment Corp. (a) | 441,300 | | 3,261 |
TOTAL FINANCIALS | | 617,850 |
HEALTH CARE - 10.9% |
Health Care Equipment & Supplies - 2.2% |
Boston Scientific Corp. (a) | 9,434,356 | | 120,571 |
Health Care Providers & Services - 5.8% |
Community Health Systems, Inc. (a) | 1,376,027 | | 65,636 |
DaVita HealthCare Partners, Inc. (a) | 532,952 | | 37,541 |
HCA Holdings, Inc. (a) | 1,216,779 | | 79,468 |
Tenet Healthcare Corp. (a) | 1,705,544 | | 90,002 |
Universal Health Services, Inc. Class B | 385,505 | | 41,095 |
| | 313,742 |
Pharmaceuticals - 2.9% |
Johnson & Johnson | 153,000 | | 15,314 |
Merck & Co., Inc. | 1,551,500 | | 88,032 |
Sanofi SA sponsored ADR | 992,534 | | 51,880 |
| | 155,226 |
TOTAL HEALTH CARE | | 589,539 |
Common Stocks - continued |
| Shares | | Value (000s) |
INDUSTRIALS - 11.5% |
Aerospace & Defense - 1.7% |
Honeywell International, Inc. | 478,776 | | $ 43,966 |
Huntington Ingalls Industries, Inc. | 258,160 | | 23,472 |
Textron, Inc. | 602,700 | | 21,920 |
| | 89,358 |
Airlines - 4.2% |
American Airlines Group, Inc. | 1,481,380 | | 57,552 |
Delta Air Lines, Inc. | 3,665,001 | | 137,291 |
Southwest Airlines Co. | 571,283 | | 16,156 |
United Continental Holdings, Inc. (a) | 370,700 | | 17,197 |
| | 228,196 |
Building Products - 0.7% |
Allegion PLC | 246,500 | | 12,677 |
Armstrong World Industries, Inc. (a) | 489,200 | | 23,814 |
| | 36,491 |
Commercial Services & Supplies - 1.3% |
Civeo Corp. | 540,932 | | 13,740 |
Deluxe Corp. | 742,413 | | 40,840 |
Tyco International Ltd. | 328,233 | | 14,163 |
| | 68,743 |
Electrical Equipment - 0.6% |
Emerson Electric Co. | 163,500 | | 10,407 |
Generac Holdings, Inc. (a)(d) | 490,557 | | 21,290 |
| | 31,697 |
Industrial Conglomerates - 0.5% |
General Electric Co. | 1,103,883 | | 27,763 |
Machinery - 1.6% |
Harsco Corp. | 1,103,224 | | 27,878 |
Ingersoll-Rand PLC | 739,500 | | 43,475 |
Pentair PLC | 78,757 | | 5,046 |
Timken Co. | 228,734 | | 10,133 |
| | 86,532 |
Marine - 0.5% |
Genco Shipping & Trading Ltd. (a) | 573,680 | | 12,334 |
Navios Maritime Holdings, Inc. | 2,162,794 | | 17,237 |
| | 29,571 |
Common Stocks - continued |
| Shares | | Value (000s) |
INDUSTRIALS - continued |
Road & Rail - 0.4% |
Hertz Global Holdings, Inc. (a) | 707,700 | | $ 19,971 |
TOTAL INDUSTRIALS | | 618,322 |
INFORMATION TECHNOLOGY - 8.4% |
Communications Equipment - 1.1% |
Cisco Systems, Inc. | 2,383,049 | | 60,124 |
Electronic Equipment & Components - 1.8% |
Avnet, Inc. | 594,313 | | 25,157 |
Belden, Inc. | 777,664 | | 52,803 |
Corning, Inc. | 726,800 | | 14,282 |
Viasystems Group, Inc. (a) | 540,460 | | 5,291 |
| | 97,533 |
Internet Software & Services - 0.2% |
VeriSign, Inc. (a) | 194,300 | | 10,502 |
Semiconductors & Semiconductor Equipment - 3.0% |
Advanced Micro Devices, Inc. (a)(d) | 1,704,692 | | 6,665 |
Freescale Semiconductor, Inc. (a) | 1,235,600 | | 24,737 |
Intersil Corp. Class A | 1,460,387 | | 18,737 |
Micron Technology, Inc. (a) | 2,293,545 | | 70,068 |
NXP Semiconductors NV (a) | 269,464 | | 16,801 |
ON Semiconductor Corp. (a) | 2,920,068 | | 24,996 |
| | 162,004 |
Software - 1.6% |
Citrix Systems, Inc. (a) | 230,899 | | 15,639 |
Microsoft Corp. | 1,619,168 | | 69,883 |
| | 85,522 |
Technology Hardware, Storage & Peripherals - 0.7% |
NCR Corp. (a) | 1,117,931 | | 34,600 |
TOTAL INFORMATION TECHNOLOGY | | 450,285 |
MATERIALS - 14.6% |
Chemicals - 11.5% |
H.B. Fuller Co. | 461,829 | | 20,621 |
LyondellBasell Industries NV Class A | 5,246,855 | | 557,481 |
OMNOVA Solutions, Inc. (a)(e) | 3,114,962 | | 25,138 |
Common Stocks - continued |
| Shares | | Value (000s) |
MATERIALS - continued |
Chemicals - continued |
Phosphate Holdings, Inc. (a) | 307,500 | | $ 212 |
W.R. Grace & Co. (a) | 179,956 | | 16,376 |
| | 619,828 |
Containers & Packaging - 2.2% |
Rock-Tenn Co. Class A | 1,058,264 | | 105,223 |
Sealed Air Corp. | 483,434 | | 15,528 |
| | 120,751 |
Metals & Mining - 0.1% |
Ormet Corp. (a)(e) | 1,405,000 | | 8 |
TimkenSteel Corp. (a) | 114,367 | | 4,976 |
| | 4,984 |
Paper & Forest Products - 0.8% |
Louisiana-Pacific Corp. (a) | 1,563,090 | | 21,164 |
Neenah Paper, Inc. | 418,300 | | 20,756 |
| | 41,920 |
TOTAL MATERIALS | | 787,483 |
TELECOMMUNICATION SERVICES - 1.1% |
Diversified Telecommunication Services - 1.1% |
Frontier Communications Corp. (d) | 5,528,256 | | 36,210 |
Intelsat SA (a) | 1,144,700 | | 21,223 |
| | 57,433 |
UTILITIES - 3.2% |
Electric Utilities - 0.2% |
FirstEnergy Corp. | 421,304 | | 13,149 |
Independent Power Producers & Energy Traders - 3.0% |
Calpine Corp. (a) | 2,616,200 | | 57,661 |
The AES Corp. | 7,025,407 | | 102,641 |
| | 160,302 |
TOTAL UTILITIES | | 173,451 |
TOTAL COMMON STOCKS (Cost $3,243,282) |
5,262,340
|
Nonconvertible Preferred Stocks - 0.2% |
| Shares | | Value (000s) |
FINANCIALS - 0.2% |
Diversified Financial Services - 0.2% |
GMAC Capital Trust I Series 2, 8.125% (Cost $10,975) | 439,013 | | $ 11,932 |
Nonconvertible Bonds - 0.4% |
| Principal Amount (000s) | | |
ENERGY - 0.4% |
Energy Equipment & Services - 0.4% |
Offshore Group Investment Ltd. 7.5% 11/1/19 | | $ 13,360 | | 13,761 |
SAExploration Holdings, Inc. 10% 7/15/19 (f) | | 6,930 | | 6,913 |
| | 20,674 |
TOTAL NONCONVERTIBLE BONDS (Cost $20,954) |
20,674
|
Money Market Funds - 6.9% |
| Shares | | |
Fidelity Cash Central Fund, 0.11% (b) | 92,278,222 | | 92,278 |
Fidelity Securities Lending Cash Central Fund, 0.11% (b)(c) | 278,226,265 | | 278,226 |
TOTAL MONEY MARKET FUNDS (Cost $370,504) |
370,504
|
TOTAL INVESTMENT PORTFOLIO - 105.3% (Cost $3,645,715) | | 5,665,450 |
NET OTHER ASSETS (LIABILITIES) - (5.3)% | | (285,886) |
NET ASSETS - 100% | $ 5,379,564 |
Legend |
(a) Non-income producing |
(b) Affiliated fund that is generally available only to investment companies and other accounts managed by Fidelity Investments. The rate quoted is the annualized seven-day yield of the fund at period end. A complete unaudited listing of the fund's holdings as of its most recent quarter end is available upon request. In addition, each Fidelity Central Fund's financial statements, which are not covered by the Fund's Report of Independent Registered Public Accounting Firm, are available on the SEC's website or upon request. |
(c) Investment made with cash collateral received from securities on loan. |
(d) Security or a portion of the security is on loan at period end. |
(e) Affiliated company |
(f) Security exempt from registration under Rule 144A of the Securities Act of 1933. These securities may be resold in transactions exempt from registration, normally to qualified institutional buyers. At the end of the period, the value of these securities amounted to $6,913,000 or 0.1% of net assets. |
(g) Investment is owned by an entity that is treated as a corporation for U.S. tax purposes and is owned by the Fund. |
(h) Restricted securities - Investment in securities not registered under the Securities Act of 1933 (excluding 144A issues). At the end of the period, the value of restricted securities (excluding 144A issues) amounted to $56,000 or 0.0% of net assets. |
Additional information on each restricted holding is as follows: |
Security | Acquisition Date | Acquisition Cost (000s) |
Station Holdco LLC unit | 10/28/08 - 12/1/08 | $ 5,990 |
Affiliated Central Funds |
Information regarding fiscal year to date income earned by the Fund from investments in Fidelity Central Funds is as follows: |
Fund | Income earned
(Amounts in thousands) |
Fidelity Cash Central Fund | $ 322 |
Fidelity Securities Lending Cash Central Fund | 631 |
Total | $ 953 |
Other Affiliated Issuers |
An affiliated company is a company in which the Fund has ownership of at least 5% of the voting securities. Fiscal year to date transactions with companies which are or were affiliates are as follows: |
Affiliate
(Amounts in thousands) | Value,
beginning of
period | Purchases | Sales
Proceeds | Dividend
Income | Value,
end of
period |
Gray Television, Inc. | $ 29,414 | $ - | $ - | $ - | $ 45,872 |
OMNOVA Solutions, Inc. | 25,107 | - | - | - | 25,138 |
Ormet Corp. | 13 | - | - | - | 8 |
Service Corp. International | 244,446 | - | 53,608 | 3,446 | - |
Total | $ 298,980 | $ - | $ 53,608 | $ 3,446 | $ 71,018 |
Other Information |
The following is a summary of the inputs used, as of July 31, 2014, involving the Fund's assets and liabilities carried at fair value. The inputs or methodology used for valuing securities may not be an indication of the risk associated with investing in those securities. For more information on valuation inputs, and their aggregation into the levels used in the table below, please refer to the Investment Valuation section in the accompanying Notes to Financial Statements. |
Valuation Inputs at Reporting Date: |
Description
(Amounts in thousands) | Total | Level 1 | Level 2 | Level 3 |
Investments in Securities: | | | | |
Equities: | | | | |
Consumer Discretionary | $ 1,316,767 | $ 1,316,711 | $ - | $ 56 |
Consumer Staples | 90,590 | 90,590 | - | - |
Energy | 560,620 | 560,620 | - | - |
Financials | 629,782 | 629,782 | - | - |
Health Care | 589,539 | 589,539 | - | - |
Industrials | 618,322 | 618,322 | - | - |
Information Technology | 450,285 | 450,285 | - | - |
Materials | 787,483 | 787,483 | - | - |
Telecommunication Services | 57,433 | 57,433 | - | - |
Utilities | 173,451 | 173,451 | - | - |
Corporate Bonds | 20,674 | - | 20,674 | - |
Money Market Funds | 370,504 | 370,504 | - | - |
Total Investments in Securities: | $ 5,665,450 | $ 5,644,720 | $ 20,674 | $ 56 |
Distribution of investments by country or territory of incorporation, as a percentage of total net assets, is as follows (Unaudited): |
United States of America | 82.3% |
Netherlands | 10.6% |
United Kingdom | 1.4% |
Ireland | 1.1% |
France | 1.0% |
Others (Individually Less Than 1%) | 3.6% |
| 100.0% |
See accompanying notes which are an integral part of the financial statements.
Annual Report
Statement of Assets and Liabilities
Amounts in thousands (except per-share amounts) | July 31, 2014 |
| | |
Assets | | |
Investment in securities, at value (including securities loaned of $264,346) - See accompanying schedule: Unaffiliated issuers (cost $3,201,013) | $ 5,223,928 | |
Fidelity Central Funds (cost $370,504) | 370,504 | |
Other affiliated issuers (cost $74,198) | 71,018 | |
Total Investments (cost $3,645,715) | | $ 5,665,450 |
Receivable for fund shares sold | | 3,579 |
Dividends receivable | | 2,419 |
Interest receivable | | 306 |
Distributions receivable from Fidelity Central Funds | | 57 |
Receivable from investment adviser for expense reductions | | 3 |
Other receivables | | 69 |
Total assets | | 5,671,883 |
| | |
Liabilities | | |
Payable for fund shares redeemed | $ 10,584 | |
Accrued management fee | 2,739 | |
Other affiliated payables | 708 | |
Other payables and accrued expenses | 62 | |
Collateral on securities loaned, at value | 278,226 | |
Total liabilities | | 292,319 |
| | |
Net Assets | | $ 5,379,564 |
Net Assets consist of: | | |
Paid in capital | | $ 3,393,104 |
Undistributed net investment income | | 22,869 |
Accumulated undistributed net realized gain (loss) on investments | | (56,144) |
Net unrealized appreciation (depreciation) on investments | | 2,019,735 |
Net Assets | | $ 5,379,564 |
See accompanying notes which are an integral part of the financial statements.
Annual Report
Statement of Assets and Liabilities - continued
Amounts in thousands (except per-share amounts) | July 31, 2014 |
| | |
Leveraged Company Stock:
Net Asset Value, offering price and redemption price per share ($4,206,652 ÷ 91,806 shares) | | $ 45.82 |
| | |
Class K:
Net Asset Value, offering price and redemption price per share ($1,172,912 ÷ 25,546 shares) | | $ 45.91 |
See accompanying notes which are an integral part of the financial statements.
Annual Report
Financial Statements - continued
Statement of Operations
Amounts in thousands | Year ended July 31, 2014 |
| | |
Investment Income | | |
Dividends (including $3,446 earned from other affiliated issuers) | | $ 79,397 |
Interest | | 4,756 |
Income from Fidelity Central Funds | | 953 |
Total income | | 85,106 |
| | |
Expenses | | |
Management fee | $ 32,097 | |
Transfer agent fees | 7,386 | |
Accounting and security lending fees | 1,146 | |
Custodian fees and expenses | 52 | |
Independent trustees' compensation | 22 | |
Registration fees | 84 | |
Audit | 65 | |
Legal | 25 | |
Miscellaneous | 46 | |
Total expenses before reductions | 40,923 | |
Expense reductions | (207) | 40,716 |
Net investment income (loss) | | 44,390 |
Realized and Unrealized Gain (Loss) Net realized gain (loss) on: | | |
Investment securities: | | |
Unaffiliated issuers | 153,359 | |
Other affiliated issuers | 31,618 | |
Total net realized gain (loss) | | 184,977 |
Change in net unrealized appreciation (depreciation) on investment securities | | 610,173 |
Net gain (loss) | | 795,150 |
Net increase (decrease) in net assets resulting from operations | | $ 839,540 |
See accompanying notes which are an integral part of the financial statements.
Annual Report
Statement of Changes in Net Assets
Amounts in thousands | Year ended
July 31,
2014 | Year ended
July 31,
2013 |
Increase (Decrease) in Net Assets | | |
Operations | | |
Net investment income (loss) | $ 44,390 | $ 57,007 |
Net realized gain (loss) | 184,977 | 336,239 |
Change in net unrealized appreciation (depreciation) | 610,173 | 1,098,022 |
Net increase (decrease) in net assets resulting
from operations | 839,540 | 1,491,268 |
Distributions to shareholders from net investment income | (37,155) | (15,789) |
Share transactions - net increase (decrease) | (702,631) | 194,361 |
Redemption fees | 366 | 538 |
Total increase (decrease) in net assets | 100,120 | 1,670,378 |
| | |
Net Assets | | |
Beginning of period | 5,279,444 | 3,609,066 |
End of period (including undistributed net investment income of $22,869 and undistributed net investment income of $22,624, respectively) | $ 5,379,564 | $ 5,279,444 |
See accompanying notes which are an integral part of the financial statements.
Annual Report
Financial Highlights - Leveraged Company Stock
Years ended July 31, | 2014 | 2013 | 2012 | 2011 | 2010 |
Selected Per-Share Data | | | | | |
Net asset value, beginning of period | $ 39.44 | $ 28.22 | $ 28.85 | $ 23.50 | $ 19.55 |
Income from Investment Operations | | | | | |
Net investment income (loss) B | .34 | .42F | .16 | -H | .07 |
Net realized and unrealized gain (loss) | 6.31 | 10.92 | (.50) | 5.46 | 3.99 |
Total from investment operations | 6.65 | 11.34 | (.34) | 5.46 | 4.06 |
Distributions from net investment income | (.27) | (.12) | (.29) | (.11) | (.11) |
Redemption fees added to paid in capital B, H | - | - | - | - | - |
Net asset value, end of period | $ 45.82 | $ 39.44 | $ 28.22 | $ 28.85 | $ 23.50 |
Total ReturnA | 16.96% | 40.31% | (1.05)% | 23.27% | 20.84% |
Ratios to Average Net Assets C, G | | | | | |
Expenses before reductions | .79% | .82% | .86% | .85% | .88% |
Expenses net of fee waivers, if any | .79% | .82% | .86% | .85% | .88% |
Expenses net of all reductions | .79% | .82% | .85% | .84% | .88% |
Net investment income (loss) | .81% | 1.25%F | .60% | -%E | .29% |
Supplemental Data | | | | | |
Net assets, end of period (in millions) | $ 4,207 | $ 4,227 | $ 3,009 | $ 3,931 | $ 3,983 |
Portfolio turnover rateD | 10% | 21% | 29% | 18% | 21% |
A Total returns would have been lower if certain expenses had not been reduced during the applicable periods shown.
B Calculated based on average shares outstanding during the period.
C Fees and expenses of any underlying Fidelity Central Funds are not included in the Fund's expense ratio. The Fund indirectly bears its proportionate share of the expenses of any underlying Fidelity Central Funds.
D Amount does not include the portfolio activity of any underlying Fidelity Central Funds.
E Amount represents less than .01%.
F Investment income per share reflects a large, non-recurring dividend which amounted to $.08 per share. Excluding this non-recurring dividend, the ratio of net investment income (loss) to average net assets would have been 1.03%.
G Expense ratios reflect operating expenses of the class. Expenses before reductions do not reflect amounts reimbursed by the investment adviser or reductions from brokerage service arrangements or reductions from other expense offset arrangements and do not represent the amount paid by the class during periods when reimbursements or reductions occur. Expenses net of fee waivers reflect expenses after reimbursement by the investment adviser but prior to reductions from brokerage service arrangements or other expense offset arrangements. Expenses net of all reductions represent the net expenses paid by the class.
H Amount represents less than $.01 per share.
See accompanying notes which are an integral part of the financial statements.
Annual Report
Financial Highlights - Class K
Years ended July 31, | 2014 | 2013 | 2012 | 2011 | 2010 |
Selected Per-Share Data | | | | | |
Net asset value, beginning of period | $ 39.52 | $ 28.26 | $ 28.86 | $ 23.52 | $ 19.56 |
Income from Investment Operations | | | | | |
Net investment income (loss) B | .40 | .47E | .20 | .04 | .11 |
Net realized and unrealized gain (loss) | 6.31 | 10.93 | (.49) | 5.45 | 4.00 |
Total from investment operations | 6.71 | 11.40 | (.29) | 5.49 | 4.11 |
Distributions from net investment income | (.32) | (.14) | (.31) | (.15) | (.15) |
Redemption fees added to paid in capital B, G | - | - | - | - | - |
Net asset value, end of period | $ 45.91 | $ 39.52 | $ 28.26 | $ 28.86 | $ 23.52 |
Total ReturnA | 17.10% | 40.47% | (.87)% | 23.45% | 21.09% |
Ratios to Average Net Assets C, F | | | | | |
Expenses before reductions | .67% | .69% | .69% | .69% | .70% |
Expenses net of fee waivers, if any | .67% | .69% | .69% | .69% | .70% |
Expenses net of all reductions | .67% | .68% | .69% | .69% | .69% |
Net investment income (loss) | .92% | 1.39%E | .76% | .16% | .47% |
Supplemental Data | | | | | |
Net assets, end of period (in millions) | $ 1,173 | $ 1,053 | $ 600 | $ 555 | $ 410 |
Portfolio turnover rateD | 10% | 21% | 29% | 18% | 21% |
A Total returns would have been lower if certain expenses had not been reduced during the applicable periods shown.
B Calculated based on average shares outstanding during the period.
C Fees and expenses of any underlying Fidelity Central Funds are not included in the Fund's expense ratio. The Fund indirectly bears its proportionate share of the expenses of any underlying Fidelity Central Funds.
D Amount does not include the portfolio activity of any underlying Fidelity Central Funds.
E Investment income per share reflects a large, non-recurring dividend which amounted to $.08 per share. Excluding this non-recurring dividend, the ratio of net investment income (loss) to average net assets would have been 1.17%.
F Expense ratios reflect operating expenses of the class. Expenses before reductions do not reflect amounts reimbursed by the investment adviser or reductions from brokerage service arrangements or reductions from other expense offset arrangements and do not represent the amount paid by the class during periods when reimbursements or reductions occur. Expenses net of fee waivers reflect expenses after reimbursement by the investment adviser but prior to reductions from brokerage service arrangements or other expense offset arrangements. Expenses net of all reductions represent the net expenses paid by the class.
G Amount represents less than $.01 per share.
See accompanying notes which are an integral part of the financial statements.
Annual Report
Notes to Financial Statements
For the period ended July 31, 2014
(Amounts in thousands except percentages)
1. Organization.
Fidelity Leveraged Company Stock Fund (the Fund) is a fund of Fidelity Securities Fund (the Trust) and is authorized to issue an unlimited number of shares. The Trust is registered under the Investment Company Act of 1940, as amended (the 1940 Act), as an open-end management investment company organized as a Massachusetts business trust. The Fund offers Leveraged Company Stock and Class K shares, each of which has equal rights as to assets and voting privileges. Each class has exclusive voting rights with respect to matters that affect that class.
2. Investments in Fidelity Central Funds.
The Fund may invests in Fidelity Central Funds, which are open-end investment companies generally available only to other investment companies and accounts managed by the investment adviser and its affiliates. The Fund's Schedule of Investments lists each of the Fidelity Central Funds held as of period end, if any, as an investment of the Fund, but does not include the underlying holdings of each Fidelity Central Fund. As an Investing Fund, the Fund indirectly bears its proportionate share of the expenses of the underlying Fidelity Central Funds.
The Money Market Central Funds seek preservation of capital and current income and are managed by Fidelity Investments Money Management, Inc. (FIMM), an affiliate of the investment adviser. Annualized expenses of the Money Market Central Funds as of their most recent shareholder report date are less than .01%.
A complete unaudited list of holdings for each Fidelity Central Fund is available upon request or at the Securities and Exchange Commission (the SEC) website at www.sec.gov. In addition, the financial statements of the Fidelity Central Funds, which are not covered by the Fund's Report of Independent Registered Public Accounting Firm, are available on the SEC website or upon request.
3. Significant Accounting Policies.
The financial statements have been prepared in conformity with accounting principles generally accepted in the United States of America (GAAP), which require management to make certain estimates and assumptions at the date of the financial statements. Actual results could differ from those estimates. Subsequent events, if any, through the date that the financial statements were issued have been evaluated in the preparation of the financial statements. The following summarizes the significant accounting policies of the Fund:
Investment Valuation. Investments are valued as of 4:00 p.m. Eastern time on the last calendar day of the period. In accordance with valuation policies and procedures approved by the Board of Trustees (the Board), the Fund attempts to obtain prices from
Annual Report
3. Significant Accounting Policies - continued
Investment Valuation - continued
one or more third party pricing vendors or brokers to value its investments. When current market prices, quotations or currency exchange rates are not readily available or reliable, investments will be fair valued in good faith by the Fidelity Management & Research Company (FMR) Fair Value Committee (the Committee), in accordance with procedures adopted by the Board. Factors used in determining fair value vary by investment type and may include market or investment specific events, changes in interest rates and credit quality. The frequency with which these procedures are used cannot be predicted and they may be utilized to a significant extent. The Committee oversees the Fund's valuation policies and procedures and is responsible for approving and reporting to the Board all fair value determinations.
The Fund categorizes the inputs to valuation techniques used to value its investments into a disclosure hierarchy consisting of three levels as shown below:
Level 1 - quoted prices in active markets for identical investments
Level 2 - other significant observable inputs (including quoted prices for similar investments, interest rates, prepayment speeds, etc.)
Level 3 - unobservable inputs (including the Fund's own assumptions based on the best information available)
Valuation techniques used to value the Fund's investments by major category are as follows:
Equity securities, including restricted securities, for which market quotations are readily available, are valued at the last reported sale price or official closing price as reported by a third party pricing vendor on the primary market or exchange on which they are traded and are categorized as Level 1 in the hierarchy. In the event there were no sales during the day or closing prices are not available, securities are valued at the last quoted bid price or may be valued using the last available price and are generally categorized as Level 2 in the hierarchy. For foreign equity securities, when market or security specific events arise, comparisons to the valuation of American Depositary Receipts (ADRs), futures contracts, Exchange-Traded Funds (ETFs) and certain indexes as well as quoted prices for similar securities may be used and would be categorized as Level 2 in the hierarchy. Utilizing these techniques may result in transfers between Level 1 and Level 2. For equity securities, including restricted securities, where observable inputs are limited, assumptions about market activity and risk are used and these securities may be categorized as Level 3 in the hierarchy.
Debt securities, including restricted securities, are valued based on evaluated prices received from third party pricing vendors or from brokers who make markets in such
Annual Report
Notes to Financial Statements - continued
(Amounts in thousands except percentages)
3. Significant Accounting Policies - continued
Investment Valuation - continued
securities. Corporate bonds are valued by pricing vendors who utilize matrix pricing which considers yield or price of bonds of comparable quality, coupon, maturity and type or by broker-supplied prices. When independent prices are unavailable or unreliable, debt securities may be valued utilizing pricing methodologies which consider similar factors that would be used by third party pricing vendors. Debt securities are generally categorized as Level 2 in the hierarchy but may be Level 3 depending on the circumstances.
Investments in open-end mutual funds, including the Fidelity Central Funds, are valued at their closing net asset value (NAV) each business day and are categorized as Level 1 in the hierarchy.
Changes in valuation techniques may result in transfers in or out of an assigned level within the disclosure hierarchy. The aggregate value of investments by input level, as of July 31, 2014, is included at the end of the Fund's Schedule of Investments.
Investment Transactions and Income. For financial reporting purposes, the Fund's investment holdings and NAV include trades executed through the end of the last business day of the period. The NAV per share for processing shareholder transactions is calculated as of the close of business of the New York Stock Exchange (NYSE), normally 4:00 p.m. Eastern time and includes trades executed through the end of the prior business day. Gains and losses on securities sold are determined on the basis of identified cost and may include proceeds received from litigation. Dividend income is recorded on the ex-dividend date, except for certain dividends from foreign securities where the ex-dividend date may have passed, which are recorded as soon as the Fund is informed of the ex-dividend date. Non-cash dividends included in dividend income, if any, are recorded at the fair market value of the securities received. Income and capital gain distributions from Fidelity Central Funds, if any, are recorded on the ex-dividend date. Distributions received on securities that represent a return of capital or capital gain are recorded as a reduction of cost of investments and/or as a realized gain. Subsequent to ex-dividend date the Fund determines the components of these distributions, based upon receipt of tax filings or other correspondence relating to the underlying investment. Interest income is accrued as earned and includes coupon interest and amortization of premium and accretion of discount on debt securities as applicable.
Class Allocations and Expenses. Investment income, realized and unrealized capital gains and losses, common expenses of the Fund, and certain fund-level expense reductions, if any, are allocated daily on a pro-rata basis to each class based on the relative net assets of each class to the total net assets of the Fund. Each class differs with respect to transfer agent fees incurred. Certain expense reductions may also differ by class. For the
Annual Report
3. Significant Accounting Policies - continued
Class Allocations and Expenses - continued
reporting period, the allocated portion of income and expenses to each class as a percent of its average net assets may vary due to the timing of recording these transactions in relation to fluctuating net assets of the classes. Expenses directly attributable to a fund are charged to that fund. Expenses attributable to more than one fund are allocated among the respective funds on the basis of relative net assets or other appropriate methods. Expense estimates are accrued in the period to which they relate and adjustments are made when actual amounts are known.
Income Tax Information and Distributions to Shareholders. Each year, the Fund intends to qualify as a regulated investment company under Subchapter M of the Internal Revenue Code, including distributing substantially all of its taxable income and realized gains. As a result, no provision for U.S. Federal income taxes is required. As of July 31, 2014, the Fund did not have any unrecognized tax benefits in the financial statements; nor is the Fund aware of any tax positions for which it is reasonably possible that the total amounts of unrecognized tax benefits will significantly change in the next twelve months. The Fund files a U.S. federal tax return, in addition to state and local tax returns as required. The Fund's federal income tax returns are subject to examination by the Internal Revenue Service (IRS) for a period of three fiscal years after they are filed. State and local tax returns may be subject to examination for an additional fiscal year depending on the jurisdiction.
Distributions are declared and recorded on the ex-dividend date. Income dividends and capital gain distributions are declared separately for each class. Income and capital gain distributions are determined in accordance with income tax regulations, which may differ from GAAP. In addition, the fund claimed a portion of the payment made to redeeming shareholders as a distribution for income tax purposes.
Capital accounts within the financial statements are adjusted for permanent book-tax differences. These adjustments have no impact on net assets or the results of operations. Capital accounts are not adjusted for temporary book-tax differences which will reverse in a subsequent period.
Book-tax differences are primarily due to market discount, equity-debt classifications, capital loss carryforwards and losses deferred due to excise tax regulations.
The federal tax cost of investment securities and unrealized appreciation (depreciation) as of period end were as follows:
Gross unrealized appreciation | $ 2,189,452 |
Gross unrealized depreciation | (166,396) |
Net unrealized appreciation (depreciation) on securities | $ 2,023,056 |
| |
Tax Cost | $ 3,642,394 |
Annual Report
Notes to Financial Statements - continued
(Amounts in thousands except percentages)
3. Significant Accounting Policies - continued
Income Tax Information and Distributions to Shareholders - continued
The tax-based components of distributable earnings as of period end were as follows:
Undistributed ordinary income | $ 19,743 |
Capital loss carryforward | $ (47,279) |
Net unrealized appreciation (depreciation) on securities and other investments | $ 2,023,056 |
Capital loss carryforwards are only available to offset future capital gains of the Fund to the extent provided by regulations and may be limited. Under the Regulated Investment Company Modernization Act of 2010 (the Act), the Fund is permitted to carry forward capital losses incurred in taxable years beginning after December 22, 2010 for an unlimited period and such capital losses are required to be used prior to any losses that expire. The capital loss carryforward information presented below, including any applicable limitation, is estimated as of fiscal period end and is subject to adjustment.
Fiscal year of expiration | |
2018 | $ (47,279) |
The Fund intends to elect to defer to its next fiscal year $8,865 of capital losses recognized during the period November 1, 2013 to July 31, 2014.
The tax character of distributions paid was as follows:
| July 31, 2014 | July 31, 2013 |
Ordinary Income | $ 37,155 | $ 15,789 |
Short-Term Trading (Redemption) Fees. Shares held by investors in the Fund less than 90 days may have been subject to a redemption fee equal to 1.50% of the NAV of shares redeemed. All redemption fees, which reduce the proceeds of the shareholder redemption, are retained by the Fund and accounted for as an addition to paid in capital.
Restricted Securities. The Fund may invest in securities that are subject to legal or contractual restrictions on resale. These securities generally may be resold in transactions exempt from registration or to the public if the securities are registered. Disposal of these securities may involve time-consuming negotiations and expense, and prompt sale at an acceptable price may be difficult. Information regarding restricted securities is included at the end of the Fund's Schedule of Investments.
Annual Report
4. Purchases and Sales of Investments.
Purchases and sales of securities, other than short-term securities, aggregated $490,577 and $680,814, respectively.
5. Fees and Other Transactions with Affiliates.
Management Fee. Fidelity Management & Research Company (the investment adviser) and its affiliates provide the Fund with investment management related services for which the Fund pays a monthly management fee. The management fee is the sum of an individual fund fee rate that is based on an annual rate of .35% of the Fund's average net assets and an annualized group fee rate that averaged .25% during the period. The group fee rate is based upon the average net assets of all the mutual funds advised by the investment adviser, including any mutual funds previously advised by the investment adviser that are currently advised by Fidelity SelectCo, LLC, an affiliate of the investment adviser. The group fee rate decreases as assets under management increase and increases as assets under management decrease. For the reporting period, the total annual management fee rate was .60% of the Fund's average net assets.
Transfer Agent Fees. Fidelity Investments Institutional Operations Company, Inc., (FIIOC), an affiliate of the investment adviser, is the transfer, dividend disbursing and shareholder servicing agent for each class of the Fund. FIIOC receives account fees and asset-based fees that vary according to the account size and type of account of the shareholders of Leveraged Company Stock. FIIOC receives an asset-based fee of Class K's average net assets. FIIOC pays for typesetting, printing and mailing of shareholder reports, except proxy statements.
For the period, transfer agent fees for each class were as follows:
| Amount | % of
Average
Net Assets |
Leveraged Company Stock | $ 6,865 | .16 |
Class K | 521 | .05 |
| $ 7,386 | |
Accounting and Security Lending Fees. Fidelity Service Company, Inc. (FSC), an affiliate of the investment adviser, maintains the Fund's accounting records. The accounting fee is based on the level of average net assets for each month. Under a separate contract, FSC administers the security lending program. The security lending fee is based on the number and duration of lending transactions.
Annual Report
Notes to Financial Statements - continued
(Amounts in thousands except percentages)
5. Fees and Other Transactions with Affiliates - continued
Brokerage Commissions. The Fund placed a portion of its portfolio transactions with brokerage firms which are affiliates of the investment adviser. Brokerage commissions are included in net realized gain (loss) and change in net unrealized appreciation (depreciation) in the Statement of Operations. The commissions paid to these affiliated firms were $17 for the period.
Other. During the period, the investment adviser reimbursed the Fund for certain losses in the amount of $3.
6. Committed Line of Credit.
The Fund participates with other funds managed by the investment adviser or an affiliate in a $4.25 billion credit facility (the "line of credit") to be utilized for temporary or emergency purposes to fund shareholder redemptions or for other short-term liquidity purposes. The Fund has agreed to pay commitment fees on its pro-rata portion of the line of credit, which amounted to $9 and is reflected in Miscellaneous expenses on the Statement of Operations. During the period, the Fund did not borrow on this line of credit.
7. Security Lending.
The Fund lends portfolio securities through a lending agent from time to time in order to earn additional income. For equity securities, a lending agent is used and may loan securities to certain qualified borrowers, including Fidelity Capital Markets (FCM), a broker-dealer affiliated with the Fund. On the settlement date of the loan, the Fund receives collateral (in the form of U.S. Treasury obligations, letters of credit and/or cash) against the loaned securities and maintains collateral in an amount not less than 100% of the market value of the loaned securities during the period of the loan. The market value of the loaned securities is determined at the close of business of the Fund and any additional required collateral is delivered to the Fund on the next business day. If the borrower defaults on its obligation to return the securities loaned because of insolvency or other reasons, the Fund may apply collateral received from the borrower against the obligation. The Fund may experience delays and costs in recovering the securities loaned. Any cash collateral received is invested in the Fidelity Securities Lending Cash Central Fund. The value of loaned securities and cash collateral at period end are disclosed on the Fund's Statement of Assets and Liabilities. At period end, there were no security loans outstanding with FCM. Security lending income represents the income earned on investing cash collateral, less rebates paid to borrowers and any lending agent fees associated with the loan, plus any premium payments received for lending certain
Annual Report
7. Security Lending - continued
types of securities. Security lending income is presented in the Statement of Operations as a component of income from Fidelity Central Funds. Total security lending income during the period amounted to $631, including $7 from securities loaned to FCM.
8. Expense Reductions.
Commissions paid to certain brokers with whom the investment adviser, or its affiliates, places trades on behalf of the Fund include an amount in addition to trade execution, which may be rebated back to the Fund to offset certain expenses. This amount totaled $150 for the period.
In addition, the investment adviser reimbursed a portion of the Fund's operating expenses during the period in the amount of $57.
9. Distributions to Shareholders.
Distributions to shareholders of each class were as follows:
Years ended July 31, | 2014 | 2013 |
From net investment income | | |
Leveraged Company Stock | $ 28,583 | $ 12,562 |
Class K | 8,572 | 3,227 |
Total | $ 37,155 | $ 15,789 |
10. Share Transactions.
Transactions for each class of shares were as follows:
| Shares | Dollars |
Years ended July 31, | 2014 | 2013 | 2014 | 2013 |
Leveraged Company Stock | | | | |
Shares sold | 9,604 | 26,431 | $ 407,601 | $ 888,852 |
Reinvestment of distributions | 670 | 378 | 26,928 | 11,889 |
Shares redeemed | (25,643) | (26,251) | (1,089,706) | (883,700) |
Net increase (decrease) | (15,369) | 558 | $ (655,177) | $ 17,041 |
Annual Report
Notes to Financial Statements - continued
(Amounts in thousands except percentages)
10. Share Transactions - continued
| Shares | Dollars |
Years ended July 31, | 2014 | 2013 | 2014 | 2013 |
Class K | | | | |
Shares sold | 5,696 | 11,840 | $ 243,726 | $ 395,282 |
Reinvestment of distributions | 213 | 102 | 8,572 | 3,227 |
Shares redeemed | (7,002) | (6,546) | (299,752) | (221,189) |
Net increase (decrease) | (1,093) | 5,396 | $ (47,454) | $ 177,320 |
11. Other.
The Fund's organizational documents provide former and current trustees and officers with a limited indemnification against liabilities arising in connection with the performance of their duties to the Fund. In the normal course of business, the Fund may also enter into contracts that provide general indemnifications. The Fund's maximum exposure under these arrangements is unknown as this would be dependent on future claims that may be made against the Fund. The risk of material loss from such claims is considered remote.
Annual Report
To the Trustees of Fidelity Securities Fund and the Shareholders of Fidelity Leveraged Company Stock Fund:
In our opinion, the accompanying statement of assets and liabilities, including the schedule of investments, and the related statements of operations and of changes in net assets and the financial highlights present fairly, in all material respects, the financial position of Fidelity Leveraged Company Stock Fund (a fund of Fidelity Securities Fund) at July 31, 2014, the results of its operations for the year then ended, the changes in its net assets for each of the two years in the period then ended and the financial highlights for each of the five years in the period then ended, in conformity with accounting principles generally accepted in the United States of America. These financial statements and financial highlights (hereafter referred to as "financial statements") are the responsibility of the Fidelity Leveraged Company Stock Fund's management. Our responsibility is to express an opinion on these financial statements based on our audits. We conducted our audits of these financial statements in accordance with the standards of the Public Company Accounting Oversight Board (United States). Those standards require that we plan and perform the audit to obtain reasonable assurance about whether the financial statements are free of material misstatement. An audit includes examining, on a test basis, evidence supporting the amounts and disclosures in the financial statements, assessing the accounting principles used and significant estimates made by management, and evaluating the overall financial statement presentation. We believe that our audits, which included confirmation of securities at July 31, 2014 by correspondence with the custodian, provide a reasonable basis for our opinion.
PricewaterhouseCoopers LLP
Boston, Massachusetts
September 16, 2014
Annual Report
The Trustees Member of the Advisory Board, and officers of the trust and fund, as applicable, are listed below. The Board of Trustees governs the fund and is responsible for protecting the interests of shareholders. The Trustees are experienced executives who meet periodically throughout the year to oversee the fund's activities, review contractual arrangements with companies that provide services to the fund, oversee management of the risks associated with such activities and contractual arrangements, and review the fund's performance. Except for James C. Curvey, each of the Trustees oversees 173 funds. Mr. Curvey oversees 397 funds.
The Trustees hold office without limit in time except that (a) any Trustee may resign; (b) any Trustee may be removed by written instrument, signed by at least two-thirds of the number of Trustees prior to such removal; (c) any Trustee who requests to be retired or who has become incapacitated by illness or injury may be retired by written instrument signed by a majority of the other Trustees; and (d) any Trustee may be removed at any special meeting of shareholders by a two-thirds vote of the outstanding voting securities of the trust. Each Trustee who is not an interested person (as defined in the 1940 Act) of the trust and the fund (Independent Trustee), shall retire not later than the last day of the calendar year in which his or her 75th birthday occurs. The Independent Trustees may waive this mandatory retirement age policy with respect to individual Trustees. The officers and Advisory Board Member hold office without limit in time, except that any officer and Advisory Board Member may resign or may be removed by a vote of a majority of the Trustees at any regular meeting or any special meeting of the Trustees. Except as indicated, each individual has held the office shown or other offices in the same company for the past five years.
Experience, Skills, Attributes, and Qualifications of the Fund's Trustees. The Governance and Nominating Committee has adopted a statement of policy that describes the experience, qualifications, attributes, and skills that are necessary and desirable for potential Independent Trustee candidates (Statement of Policy). The Board believes that each Trustee satisfied at the time he or she was initially elected or appointed a Trustee, and continues to satisfy, the standards contemplated by the Statement of Policy. The Governance and Nominating Committee also engages professional search firms to help identify potential Independent Trustee candidates who have the experience, qualifications, attributes, and skills consistent with the Statement of Policy. From time to time, additional criteria based on the composition and skills of the current Independent Trustees, as well as experience or skills that may be appropriate in light of future changes to board composition, business conditions, and regulatory or other developments, have also been considered by the professional search firms and the Governance and Nominating Committee. In addition, the Board takes into account the Trustees' commitment and participation in Board and committee meetings, as well as their leadership of standing and ad hoc committees throughout their tenure.
In determining that a particular Trustee was and continues to be qualified to serve as a Trustee, the Board has considered a variety of criteria, none of which, in isolation, was controlling. The Board believes that, collectively, the Trustees have balanced and diverse experience, qualifications, attributes, and skills, which allow the Board to operate effectively in governing the fund and protecting the interests of shareholders. Information about the specific experience, skills, attributes, and qualifications of each Trustee, which in each case led to the Board's conclusion that the Trustee should serve (or continue to serve) as a trustee of the fund, is provided below.
Annual Report
Board Structure and Oversight Function. James C. Curvey is an interested person (as defined in the 1940 Act) and currently serves as Chairman. The Trustees have determined that an interested Chairman is appropriate and benefits shareholders because an interested Chairman has a personal and professional stake in the quality and continuity of services provided to the fund. Independent Trustees exercise their informed business judgment to appoint an individual of their choosing to serve as Chairman, regardless of whether the Trustee happens to be independent or a member of management. The Independent Trustees have determined that they can act independently and effectively without having an Independent Trustee serve as Chairman and that a key structural component for assuring that they are in a position to do so is for the Independent Trustees to constitute a substantial majority for the Board. The Independent Trustees also regularly meet in executive session. Ned C. Lautenbach serves as Chairman of the Independent Trustees and as such (i) acts as a liaison between the Independent Trustees and management with respect to matters important to the Independent Trustees and (ii) with management prepares agendas for Board meetings.
Fidelity funds are overseen by different Boards of Trustees. The fund's Board oversees Fidelity's equity and high income funds and another Board oversees Fidelity's investment-grade bond, money market, and asset allocation funds. The asset allocation funds may invest in Fidelity funds overseen by the fund's Board. The use of separate Boards, each with its own committee structure, allows the Trustees of each group of Fidelity funds to focus on the unique issues of the funds they oversee, including common research, investment, and operational issues. On occasion, the separate Boards establish joint committees to address issues of overlapping consequences for the Fidelity funds overseen by each Board.
The Trustees operate using a system of committees to facilitate the timely and efficient consideration of all matters of importance to the Trustees, the fund, and fund shareholders and to facilitate compliance with legal and regulatory requirements and oversight of the fund's activities and associated risks. The Board, acting through its committees, has charged FMR and its affiliates with (i) identifying events or circumstances the occurrence of which could have demonstrably adverse effects on the fund's business and/or reputation; (ii) implementing processes and controls to lessen the possibility that such events or circumstances occur or to mitigate the effects of such events or circumstances if they do occur; and (iii) creating and maintaining a system designed to evaluate continuously business and market conditions in order to facilitate the identification and implementation processes described in (i) and (ii) above. Because the day-to-day operations and activities of the fund are carried out by or through FMR, its affiliates and other service providers, the fund's exposure to risks is mitigated but not eliminated by the processes overseen by the Trustees. While each of the Board's committees has responsibility for overseeing different aspects of the fund's activities, oversight is exercised primarily through the Operations, Audit, and Compliance Committees. In addition, the Independent Trustees have worked with FMR to enhance the Board's oversight of investment and financial risks, legal and regulatory risks, technology risks, and operational risks, including the development of additional risk reporting to the Board. For example, a working group comprised of Independent Trustees and FMR has worked and continues to work to review the Fidelity funds' valuation-related activities, reporting and risk management. Appropriate personnel, including but not limited to the fund's Chief Compliance Officer (CCO), FMR's internal auditor, the independent accountants, the fund's Treasurer and portfolio management personnel, make periodic reports to the Board's committees, as appropriate, including an annual review of FMR's risk management program for the Fidelity funds. The responsibilities of each standing committee, including their oversight responsibilities, are described further under "Standing Committees of the Fund's Trustees."
Annual Report
Trustees and Officers - continued
The fund's Statement of Additional Information (SAI) includes more information about the Trustees. To request a free copy, call Fidelity at 1-800-835-5092.
Interested Trustees*:
Correspondence intended for each Trustee who is an interested person may be sent to Fidelity Investments, 245 Summer Street, Boston, Massachusetts 02210.
Name, Year of Birth; Principal Occupations and Other Relevant Experience+ |
James C. Curvey (1935) |
Year of Election or Appointment: 2007 Trustee Chairman of the Board of Trustees |
| Mr. Curvey also serves as Trustee of other Fidelity funds. Mr. Curvey is a Director of Fidelity Research & Analysis Co. (2009-present), and Vice Chairman (2007-present) and Director of FMR LLC. In addition, Mr. Curvey serves as an Overseer for the Boston Symphony Orchestra and a member of the Trustees of Villanova University. Previously, Mr. Curvey served as a Director of Fidelity Investments Money Management, Inc. (2009-2014), a Director of FMR (2007-2014), a Director of FMR Co., Inc. (2007-2014) and was the Vice Chairman (2006-2007) and Director (2000-2007) of FMR Corp. |
Charles S. Morrison (1960) |
Year of Election or Appointment: 2014 Trustee |
| Mr. Morrison also serves as Trustee of other funds. He serves as President, Asset Management (2014-present) and is an employee of Fidelity Investments. Previously, Mr. Morrison served as Vice President of Fidelity's Fixed Income and Asset Allocation Funds (2012-2014), President, Fixed Income (2011-2014), Vice President of Fidelity's Money Market Funds (2005-2009), President, Money Market Group Leader of FMR (2009), and Senior Vice President, Money Market Group of FMR (2004-2009). Mr. Morrison also served as Vice President of Fidelity's Bond Funds (2002-2005), certain Balanced Funds (2002-2005), and certain Asset Allocation Funds (2002-2007), and as Senior Vice President (2002-2005) of Fidelity's Bond Division. |
* Trustees have been determined to be "Interested Trustees" by virtue of, among other things, their affiliation with the trust or various entities under common control with FMR.
+ The information above includes each Trustee's principal occupation during the last five years and other information relating to the experience, attributes, and skills relevant to each Trustee's qualifications to serve as a Trustee, which led to the conclusion that each Trustee should serve as a Trustee for the fund.
Annual Report
Trustees and Officers - continued
Independent Trustees:
Correspondence intended for each Independent Trustee (that is, the Trustees other than the Interested Trustees) may be sent to Fidelity Investments, P.O. Box 55235, Boston, Massachusetts 02205-5235.
Name, Year of Birth; Principal Occupations and Other Relevant Experience+ |
Dennis J. Dirks (1948) |
Year of Election or Appointment: 2005 Trustee |
| Mr. Dirks also serves as Trustee of other Fidelity funds. Prior to his retirement in May 2003, Mr. Dirks was Chief Operating Officer and a member of the Board of The Depository Trust & Clearing Corporation (DTCC). He also served as President, Chief Operating Officer, and Board member of The Depository Trust Company (DTC) and President and Board member of the National Securities Clearing Corporation (NSCC). In addition, Mr. Dirks served as Chief Executive Officer and Board member of the Government Securities Clearing Corporation, Chief Executive Officer and Board member of the Mortgage-Backed Securities Clearing Corporation, as a Trustee and a member of the Finance Committee of Manhattan College (2005-2008), and as a Trustee and a member of the Finance Committee of AHRC of Nassau County (2006-2008). Mr. Dirks is a member of the Independent Directors Council (IDC) Governing Council (2010-present) and Board of Directors for The Brookville Center for Children's Services, Inc. (2009-present). |
Alan J. Lacy (1953) |
Year of Election or Appointment: 2008 Trustee |
| Mr. Lacy also serves as Trustee of other Fidelity funds. Mr. Lacy serves as Senior Adviser (2007-present) of Oak Hill Capital Partners, L.P. (private equity). Mr. Lacy also served as Chief Executive Officer (2000-2005) and Vice Chairman (2005-2006) of Sears Holdings Corporation and Sears, Roebuck and Co. (retail). In addition, Mr. Lacy serves as a member of the Board of Directors of Dave & Buster's Entertainment, Inc. (restaurant and entertainment complexes, 2010-present), Earth Fare, Inc. (retail grocery, 2012-present), The Hillman Companies, Inc. (hardware wholesalers, 2010-present), and Bristol-Myers Squibb Company (global pharmaceuticals, 2008-present). Mr. Lacy is a member of the Board of Trustees of The National Parks Conservation Association (2006-present). Previously, Mr. Lacy served as Chairman of the Board of Trustees of the National Parks Conservation Association (2008-2011) and as a member of the Board of Directors for the Western Union Company (global money transfer, 2006-2011). |
Ned C. Lautenbach (1944) |
Year of Election or Appointment: 2000 Trustee Chairman of the Independent Trustees |
| Mr. Lautenbach also serves as Trustee of other Fidelity funds. Mr. Lautenbach currently serves as the Lead Director of the Eaton Corporation Board of Directors (diversified industrial, 1997-present). Mr. Lautenbach is Chairman of the Board of Directors of the Philharmonic Center for the Arts in Naples, Florida (2012-present) and a member of the Council on Foreign Relations (1994-present). Previously, Mr. Lautenbach was a Partner/Advisory Partner at Clayton, Dubilier & Rice, LLC (private equity investment, 1998-2010), as well as a Director of Sony Corporation (2006-2007). |
Joseph Mauriello (1944) |
Year of Election or Appointment: 2008 Trustee |
| Mr. Mauriello also serves as Trustee of other Fidelity funds. Prior to his retirement in January 2006, Mr. Mauriello served in numerous senior management positions including Deputy Chairman and Chief Operating Officer (2004-2005), and Vice Chairman of Financial Services (2002-2004) of KPMG LLP US (professional services, 1965-2005). Mr. Mauriello currently serves as a member of the Board of Directors of XL Group plc. (global insurance and re-insurance, 2006-present). Previously, Mr. Mauriello served as a Director of the Hamilton Funds of the Bank of New York (2006-2007) and of Arcadia Resources Inc. (health care services and products, 2007-2012). |
Robert W. Selander (1950) |
Year of Election or Appointment: 2011 Trustee |
| Mr. Selander also serves as Trustee of other Fidelity funds. Previously, Mr. Selander served as a Member of the Advisory Board of other Fidelity funds (2011), and Executive Vice Chairman (2010), Chief Executive Officer (2009-2010), and President and Chief Executive Officer (1997-2009) of Mastercard, Inc. |
Cornelia M. Small (1944) |
Year of Election or Appointment: 2005 Trustee |
| Ms. Small also serves as Trustee of other Fidelity funds. Ms. Small is a member of the Board of Directors (2009-present) and Chair of the Investment Committee (2010-present) of the Teagle Foundation. Ms. Small also serves on the Investment Committee of the Berkshire Taconic Community Foundation (2008-present). Previously, Ms. Small served as Chairperson (2002-2008) and a member of the Investment Committee and Chairperson (2008-2012) and a member of the Board of Trustees of Smith College. In addition, Ms. Small served as Chief Investment Officer, Director of Global Equity Investments, and a member of the Board of Directors of Scudder, Stevens & Clark and Scudder Kemper Investments. |
William S. Stavropoulos (1939) |
Year of Election or Appointment: 2002 Trustee Vice Chairman of the Independent Trustees |
| Mr. Stavropoulos also serves as Trustee of other Fidelity funds. Mr. Stavropoulos serves as President and Founder of the Michigan Baseball Foundation, the Great Lakes Loons (2007-present). Mr. Stavropoulos is Chairman Emeritus of the Board of Directors of The Dow Chemical Company, where he previously served in numerous senior management positions, including President, CEO (1995-2000; 2002-2004), Chairman of the Executive Committee (2000-2006), and as a member of the Board of Directors (1990-2006). Currently, Mr. Stavropoulos is Chairman of the Board of Directors of Univar Inc. (global distributor of commodity and specialty chemicals), a Director of Teradata Corporation (data warehousing and technology solutions), and Maersk Inc. (industrial conglomerate), and a member of the Advisory Board for Metalmark Capital LLC (private equity investment, 2005-present). Mr. Stavropoulos is an operating advisor to Clayton, Dubilier & Rice, LLC (private equity investment). In addition, Mr. Stavropoulos is a member of the University of Notre Dame Advisory Council for the College of Science, a Trustee of the Rollin L. Gerstacker Foundation, and a Director of the Naples Philharmonic Center for the Arts. Previously, Mr. Stavropoulos served as a Director of Chemical Financial Corporation (bank holding company, 1993-2012) and Tyco International, Ltd. (multinational manufacturing and services, 2007-2012). |
David M. Thomas (1949) |
Year of Election or Appointment: 2008 Trustee |
| Mr. Thomas also serves as Trustee of other Fidelity funds. Mr. Thomas serves as Non-Executive Chairman of the Board of Directors of Fortune Brands Home and Security (home and security products, 2011-present), and as a member of the Board of Directors of Interpublic Group of Companies, Inc. (marketing communication, 2004-present). Previously, Mr. Thomas served as Executive Chairman (2005-2006) and Chairman and Chief Executive Officer (2000-2005) of IMS Health, Inc. (pharmaceutical and healthcare information solutions), and a Director of Fortune Brands, Inc. (consumer products, 2000-2011). |
+ The information above includes each Trustee's principal occupation during the last five years and other information relating to the experience, attributes, and skills relevant to each Trustee's qualifications to serve as a Trustee, which led to the conclusion that each Trustee should serve as a Trustee for the fund.
Advisory Board Member and Officers:
Correspondence intended for each officer and Peter S. Lynch may be sent to Fidelity Investments, 245 Summer Street, Boston, Massachusetts 02210. Officers appear below in alphabetical order.
Name, Year of Birth; Principal Occupation |
Peter S. Lynch (1944) |
Year of Election or Appointment: 2003 Member of the Advisory Board |
| Mr. Lynch also serves as Member of the Advisory Board of other Fidelity funds. Mr. Lynch is Vice Chairman and a Director of FMR and FMR Co., Inc. In addition, Mr. Lynch serves as a Trustee of Boston College and as the Chairman of the Inner-City Scholarship Fund. Previously, Mr. Lynch served on the Special Olympics International Board of Directors (1997-2006). |
Elizabeth Paige Baumann (1968) |
Year of Election or Appointment: 2012 Anti-Money Laundering (AML) Officer |
| Ms. Baumann also serves as AML Officer of other funds. She is Chief AML Officer of FMR LLC (2012-present) and is an employee of Fidelity Investments. Previously, Ms. Baumann served as Vice President and Deputy Anti-Money Laundering Officer (2007-2012). |
William C. Coffey (1969) |
Year of Election or Appointment: 2009 Assistant Secretary |
| Mr. Coffey also serves as Assistant Secretary of other funds. He is Senior Vice President and Deputy General Counsel of FMR LLC (2010-present), and is an employee of Fidelity Investments. Previously, Mr. Coffey served as Vice President and Associate General Counsel of FMR LLC (2005-2009). |
Jonathan Davis (1968) |
Year of Election or Appointment: 2010 Assistant Treasurer |
| Mr. Davis also serves as Assistant Treasurer of other funds. Mr. Davis is an employee of Fidelity Investments. Previously, Mr. Davis served as Vice President and Associate General Counsel of FMR LLC (2003-2010). |
Adrien E. Deberghes (1967) |
Year of Election or Appointment: 2008 Deputy Treasurer |
| Mr. Deberghes also serves as an officer of other funds. He is an employee of Fidelity Investments (2008-present). Prior to joining Fidelity Investments, Mr. Deberghes was Senior Vice President of Mutual Fund Administration at State Street Corporation (2007-2008), Senior Director of Mutual Fund Administration at Investors Bank & Trust (2005-2007), and Director of Finance for Dunkin' Brands (2000-2005). |
Stephanie J. Dorsey (1969) |
Year of Election or Appointment: 2010 Assistant Treasurer |
| Ms. Dorsey also serves as an officer of other funds. She is an employee of Fidelity Investments (2008-present) and has served in other fund officer roles. Prior to joining Fidelity Investments, Ms. Dorsey served as Treasurer (2004-2008) of the JPMorgan Mutual Funds and Vice President (2004-2008) of JPMorgan Chase Bank. |
Howard J. Galligan III (1966) |
Year of Election or Appointment: 2014 Chief Financial Officer |
| Mr. Galligan also serves as Chief Financial Officer of other funds. Mr. Galligan serves as President of Fidelity Pricing and Cash Management Services (FPCMS) (2014-present) and as a Director of Strategic Advisers, Inc. (2008-present). Previously, Mr. Galligan served as Chief Administrative Officer of Asset Management (2011-2014) and Chief Operating Officer and Senior Vice President of Investment Support for Strategic Advisers, Inc. (2003-2011). |
Scott C. Goebel (1968) |
Year of Election or Appointment: 2008 Secretary and Chief Legal Officer (CLO) |
| Mr. Goebel serves as Secretary and CLO of other funds. Mr. Goebel also serves as Secretary of Fidelity SelectCo, LLC (2013-present), Fidelity Investments Money Management, Inc. (FIMM) (2010-present) and Fidelity Research and Analysis Company (FRAC) (2010-present); General Counsel, Secretary, and Senior Vice President of FMR (2008-present) and FMR Co., Inc. (2008-present); Chief Legal Officer of Fidelity Management & Research (Hong Kong) Limited (2008-present); and Assistant Secretary of Fidelity Management & Research (Japan) Inc. (2008-present) and Fidelity Management & Research (U.K.) Inc. (2008-present). Previously, Mr. Goebel served as Secretary and CLO of other Fidelity funds (2008-2013), Assistant Secretary of FIMM (2008-2010), FRAC (2008-2010), and certain funds (2007-2008); and as Vice President and Secretary of Fidelity Distributors Corporation (FDC) (2005-2007). Mr. Goebel has been employed by FMR LLC or an affiliate since 2001. |
Brian B. Hogan (1964) |
Year of Election or Appointment: 2009 Vice President |
| Mr. Hogan also serves as Trustee or Vice President of other funds. Mr. Hogan serves as President of FMR's Equity Division (2009-present). Previously, Mr. Hogan served as Senior Vice President, Equity Research of FMR (2006-2009) and as a portfolio manager. |
Chris Maher (1972) |
Year of Election or Appointment: 2013 Assistant Treasurer |
| Mr. Maher serves as Assistant Treasurer of other funds. Mr. Maher is Vice President of Valuation Oversight and is an employee of Fidelity Investments. Previously, Mr. Maher served as Vice President of Asset Management Compliance (2013), Vice President of FMR's Program Management Group (2010-2013), and Vice President of Valuation Oversight (2008-2010). |
Melissa M. Reilly (1971) |
Year of Election or Appointment: 2014 Vice President of certain Equity Funds |
| Ms. Reilly also serves as Vice President of other funds. Ms. Reilly is an employee of Fidelity Investments (2004-present). |
Kenneth B. Robins (1969) |
Year of Election or Appointment: 2008 President and Treasurer |
| Mr. Robins also serves as an officer of other funds. Mr. Robins serves as Executive Vice President of Fidelity Investments Money Management, Inc. (FIMM) (2013-present) and is an employee of Fidelity Investments (2004-present). Previously, Mr. Robins served in other fund officer roles. |
Stephen Sadoski (1971) |
Year of Election or Appointment: 2012 Deputy Treasurer |
| Mr. Sadoski also serves as Deputy Treasurer of other funds. He is an employee of Fidelity Investments (2012-present) and has served in another fund officer role. Prior to joining Fidelity Investments, Mr. Sadoski served as an assistant chief accountant in the Division of Investment Management of the Securities and Exchange Commission (SEC) (2009-2012) and as a senior manager at Deloitte & Touche LLP (1997-2009). |
Stacie M. Smith (1974) |
Year of Election or Appointment: 2013 Deputy Treasurer |
| Ms. Smith also serves as an officer of other funds. She is an employee of Fidelity Investments (2009-present) and has served in other fund officer roles. Prior to joining Fidelity Investments, Ms. Smith served as Senior Audit Manager of Ernst & Young LLP (1996-2009). |
Renee Stagnone (1975) |
Year of Election or Appointment: 2013 Deputy Treasurer |
| Ms. Stagnone also serves as Deputy Treasurer of other funds. Ms. Stagnone is an employee of Fidelity Investments. |
Linda J. Wondrack (1964) |
Year of Election or Appointment: 2014 Chief Compliance Officer |
| Ms. Wondrack also serves as Chief Compliance Officer of other funds. Ms. Wondrack is Executive Vice President and head of the Ethics Office and Asset Management Compliance for Fidelity Investments (2012-present). Ms. Wondrack also serves as Chief Compliance Officer of Fidelity SelectCo, LLC (2014-present); Chief Compliance Officer of Impresa Management LLC (2013-present); and Chief Compliance Officer of FMR Co., Inc., Fidelity Investments Money Management, Inc., Fidelity Management & Research (Japan) Inc., Fidelity Management & Research (U.K.) Inc., Fidelity Management & Research (Hong Kong), Fidelity Management & Research Company, Pyramis Global Advisors, LLC, and Strategic Advisers, Inc., Ballyrock Investment Advisors LLC, and Northern Neck Investors LLC (2012-present). Previously, Ms. Wondrack served as Senior Vice President and Chief Compliance Officer for Columbia Management Investment Advisers, LLC (2005-2012); Chief Compliance Officer for certain funds within the Columbia Family of Funds (2007-2012); and Senior Vice President of Compliance Risk Management at Bank of America (2005-2010). |
Joseph F. Zambello (1957) |
Year of Election or Appointment: 2011 Deputy Treasurer |
| Mr. Zambello also serves as Deputy Treasurer of other funds. Mr. Zambello is an employee of Fidelity Investments. Previously, Mr. Zambello served as Vice President of FMR's Program Management Group (2009-2011) and Vice President of the Transfer Agent Oversight Group (2005-2009). |
Annual Report
Class K designates 100% of the dividends distributed during the fiscal year as qualifying for the dividends-received deduction for corporate shareholders.
Class K designates 100% of the dividends distributed during the fiscal year as amounts which may be taken into account as a dividend for the purposes of the maximum rate under section 1(h)(11) of the Internal Revenue Code.
The fund will notify shareholders in January 2015 of amounts for use in preparing 2014 income tax returns.
Annual Report
Board Approval of Investment Advisory Contracts and Management Fees
Fidelity Leveraged Company Stock Fund
Each year, the Board of Trustees, including the Independent Trustees (together, the Board), votes on the renewal of the management contract with Fidelity Management & Research Company (FMR) and the sub-advisory agreements (together, the Advisory Contracts) for the fund. The Board, assisted by the advice of fund counsel and Independent Trustees' counsel, requests and considers a broad range of information relevant to the renewal of the Advisory Contracts throughout the year.
The Board meets regularly and, at each of its meetings, covers an extensive agenda of topics and materials and considers factors that are relevant to its annual consideration of the renewal of the fund's Advisory Contracts, including the services and support provided to the fund and its shareholders. The Board has established various standing committees (Committees), each composed of and chaired by Independent Trustees with varying backgrounds, to which the Board has assigned specific subject matter responsibilities in order to enhance effective decision-making by the Board. The Board, acting directly and through its Committees, requests and receives information concerning the annual consideration of the renewal of the fund's Advisory Contracts. The Board also meets as needed to consider matters specifically related to the Board's annual consideration of the renewal of the Advisory Contracts. Members of the Board may also meet with trustees of other Fidelity funds through ad hoc joint committees to discuss certain matters relevant to the Fidelity funds.
At its July 2014 meeting, the Board, including the Independent Trustees, unanimously determined to renew the fund's Advisory Contracts. In reaching its determination, the Board considered all factors it believed relevant, including (i) the nature, extent, and quality of the services to be provided to the fund and its shareholders (including the investment performance of the fund); (ii) the competitiveness of the fund's management fee and total expense ratio relative to peer funds; (iii) the total costs of the services to be provided by and the profits to be realized by Fidelity from its relationship with the fund; (iv) the extent to which economies of scale exist and would be realized as the fund grows; and (v) whether fee levels reflect these economies of scale, if any, for the benefit of fund shareholders. In connection with separate internal corporate reorganizations involving Fidelity Management & Research (U.K.) Inc. (FMR U.K.) and Fidelity Management & Research (Japan) Inc. (FMR Japan), the Board approved certain non-material amendments to the fund's sub-advisory agreements with FMR U.K. and FMR Japan to reflect that, after these reorganizations, FMR Investment Management (UK) Limited and Fidelity Management & Research (Japan) Limited will carry on the business of FMR U.K. and FMR Japan, respectively. The Board noted that no changes to the portfolio managers or to the foreign research or investment advisory services provided to the fund were expected in connection with either reorganization and that the same personnel and resources would continue to be available to the fund at the new entities.
Annual Report
Board Approval of Investment Advisory Contracts and
Management Fees - continued
In considering whether to renew the Advisory Contracts for the fund, the Board reached a determination, with the assistance of fund counsel and Independent Trustees' counsel and through the exercise of its business judgment, that the renewal of the Advisory Contracts was in the best interests of the fund and its shareholders and that the compensation payable under the Advisory Contracts was fair and reasonable. The Board's decision to renew the Advisory Contracts was not based on any single factor, but rather was based on a comprehensive consideration of all the information provided to the Board at its meetings throughout the year. The Board, in reaching its determination to renew the Advisory Contracts, was aware that shareholders of the fund have a broad range of investment choices available to them, including a wide choice among funds offered by Fidelity's competitors, and that the fund's shareholders, who have the opportunity to review and weigh the disclosure provided by the fund in its prospectus and other public disclosures, have chosen to invest in this fund, which is part of the Fidelity family of funds.
Nature, Extent, and Quality of Services Provided. The Board considered Fidelity's staffing as it relates to the fund, including the backgrounds of investment personnel of FMR and the sub-advisers (together, the Investment Advisers), and also considered the fund's investment objective, strategies, and related investment philosophy. The Independent Trustees also had discussions with senior management of Fidelity's investment operations and investment groups. The Board considered the structure of the portfolio manager compensation program and whether this structure provides appropriate incentives to act in the best interests of the fund. Additionally, the Board considered the portfolio managers' investments, if any, in the funds that they manage.
Resources Dedicated to Investment Management and Support Services. The Boardand the Fund Oversight and Research Committees reviewed the general qualifications and capabilities of Fidelity's investment staff, including its size, education, experience, and resources, as well as Fidelity's approach to recruiting, training, managing, and compensating investment personnel. The Board noted that Fidelity has continued to increase the resources devoted to non-U.S. offices, including expansion of Fidelity's global investment organization. The Board also noted that Fidelity's analysts have extensive resources, tools and capabilities that allow them to conduct sophisticated quantitative and fundamental analysis, as well as credit analysis of issuers, counterparties and guarantors. Further, the Board believes that Fidelity's investment professionals have sufficient access to global information and data so as to provide competitive investment results over time, and that those professionals also have access to sophisticated tools that permit them to assess portfolio construction and risk and performance attribution characteristics continuously, as well as to transmit new information and research conclusions rapidly around the world. Additionally, in its deliberations, the Board considered Fidelity's trading and risk management capabilities and resources and global compliance infrastructure, which are an integral part of the investment management process.
Annual Report
Shareholder and Administrative Services. The Board considered (i) the nature, extent, quality, and cost of advisory, administrative, and shareholder services performed by the Investment Advisers and their affiliates under the Advisory Contracts and under separate agreements covering transfer agency, pricing and bookkeeping, and securities lending services for the fund; (ii) the nature and extent of the supervision of third party service providers, principally custodians and subcustodians; and (iii) the resources devoted to, and the record of compliance with, the fund's compliance policies and procedures. The Board also reviewed the allocation of fund brokerage, including allocations to brokers affiliated with the Investment Advisers, the use of brokerage commissions to pay fund expenses, and the use of "soft" commission dollars to pay for research services.
The Board noted that the growth of fund assets over time across the complex allows Fidelity to reinvest in the development of services designed to enhance the value or convenience of the Fidelity funds as investment vehicles. These services include 24-hour access to account information and market information through telephone representatives and over the Internet, investor education materials and asset allocation tools, and the expanded availability of Fidelity Investor Centers.
In 2014, the Board formed an ad hoc Committee on Transfer Agency Fees to review the variety of transfer agency fee structures throughout the industry and Fidelity's competitive positioning with respect to industry participants.
Investment in a Large Fund Family. The Board considered the benefits to shareholders of investing in a Fidelity fund, including the benefits of investing in a fund that is part of a large family of funds offering a variety of investment disciplines and providing a large variety of mutual fund investor services. The Board noted that Fidelity had taken, or had made recommendations that resulted in the Fidelity funds taking, a number of actions over the previous year that benefited particular funds, including (i) continuing to dedicate additional resources to investment research and to the support of the senior management team that oversees asset management; (ii) persisting in efforts to enhance Fidelity's global research capabilities; (iii) launching new funds and making other enhancements to meet client needs for income-oriented solutions; (iv) reducing fund expenses for certain index funds; (v) continuing to launch dedicated lower cost underlying funds to meet portfolio construction needs related to expanding underlying fund options for Fidelity funds of funds, specifically for the Freedom Fund product lines; (vi) rationalizing product lines and gaining increased efficiencies through fund mergers; (vii) launching sector-based exchange-traded funds and establishing a new Fidelity adviser to manage sector-based funds and products; (viii) continuing to develop and implement technology to improve security and increase efficiency; (ix) modifying the eligibility criteria for certain share classes to increase their marketability to a portion of the defined contribution plan market; (x) waiving redemption fees for certain qualified fund-of-fund and wrap programs and certain retirement plan transactions; and (xi) launching new Institutional Class shares of certain money market funds to attract and retain assets and to fill a gap in the money market fund lineup.
Annual Report
Board Approval of Investment Advisory Contracts and
Management Fees - continued
Investment Performance. The Board considered whether the fund has operated in accordance with its investment objective, as well as its record of compliance with its investment restrictions and its performance history.
The Board took into account discussions with the Investment Advisers about fund investment performance that occur at Board meetings throughout the year. In this regard the Board noted that as part of regularly scheduled fund reviews and other reports to the Board on fund performance, the Board periodically considers annualized return information for the fund, for different time periods, measured against a securities market index ("benchmark index") and a peer group of funds with similar objectives ("peer group"). In its evaluation of fund investment performance, the Board gave particular attention to information indicating changes in performance of certain Fidelity funds for specific time periods and the Investment Advisers' explanations for any overperformance or underperformance.
In addition to reviewing absolute and relative fund performance, the Independent Trustees periodically consider the appropriateness of fund performance metrics in evaluating the results achieved. In general, the Independent Trustees believe that fund performance should be evaluated based on net performance (after fees and expenses) of both the highest performing and lowest performing classes, where applicable, compared to appropriate benchmark indices, over appropriate time periods which may include full market cycles, and compared to peer groups, as applicable, over the same periods, taking into account relevant factors including the following: general market conditions; issuer-specific information; tactical opportunities for investment; and fund cash flows and other factors.
The Independent Trustees recognize that shareholders evaluate performance on a net basis over their own holding periods, for which one-, three-, and five-year periods are often used as a proxy. For this reason, the performance information reviewed by the Board also included net cumulative calendar year total return information for the fund and an appropriate benchmark index and peer group for the most recent one-, three-, and five-year periods, as shown below. Returns are shown compared to the 25th percentile (top of box, 75% beaten) and 75th percentile (bottom of box, 25% beaten) of the peer universe.
Annual Report
Fidelity Leveraged Company Stock Fund

Based on its review, the Board concluded that the nature, extent, and quality of services provided to the fund under the Advisory Contracts should benefit the fund's shareholders.
Competitiveness of Management Fee and Total Expense Ratio. The Board considered the fund's management fee and total expense ratio compared to "mapped groups" of competitive funds and classes. Fidelity creates "mapped groups" by combining similar Lipper investment objective categories that have comparable investment mandates. Combining Lipper investment objective categories aids the Board's management fee and total expense ratio comparisons by broadening the competitive group used for comparison and by reducing the number of universes to which various Fidelity funds are compared.
Management Fee. The Board considered two proprietary management fee comparisons for the 12-month periods shown in the chart below. The group of Lipper funds used by the Board for management fee comparisons is referred to below as the "Total Mapped Group." The Total Mapped Group comparison focuses on a fund's standing in terms of gross management fees before expense reimbursements or caps relative to the total universe of funds with comparable investment mandates, regardless of whether their management fee structures also are comparable. Funds with comparable investment mandates offer exposure to similar types of securities. Funds with comparable management fee structures have similar management fee contractual arrangements (e.g., flat rate charged for advisory services, all-inclusive fee rate, etc.). "TMG %" represents the percentage of funds in the Total Mapped Group that had management fees that were lower than the fund's. For example, a hypothetical TMG % of 20% would mean that 80% of the funds in the Total Mapped Group had higher, and 20% had lower, management fees than the fund. The fund's actual TMG %s are in the chart below. The "Asset-Size Peer Group" (ASPG) comparison focuses on a fund's standing relative to a subset of non-Fidelity funds within the Total Mapped Group that are similar in size and management fee structure. For example, if a fund is in the first quartile of the ASPG, the fund's management fee ranks in the least expensive or lowest 25% of funds in the ASPG. The ASPG represents at least 15% of the funds in the Total Mapped Group with comparable asset size and management fee structures, subject to a minimum of 50 funds (or all funds in the Total Mapped Group if fewer than 50). Additional information, such as the ASPG quartile in which the fund's management fee rate ranked, is also included in the chart and considered by the Board.
Annual Report
Board Approval of Investment Advisory Contracts and
Management Fees - continued
Fidelity Leveraged Company Stock Fund
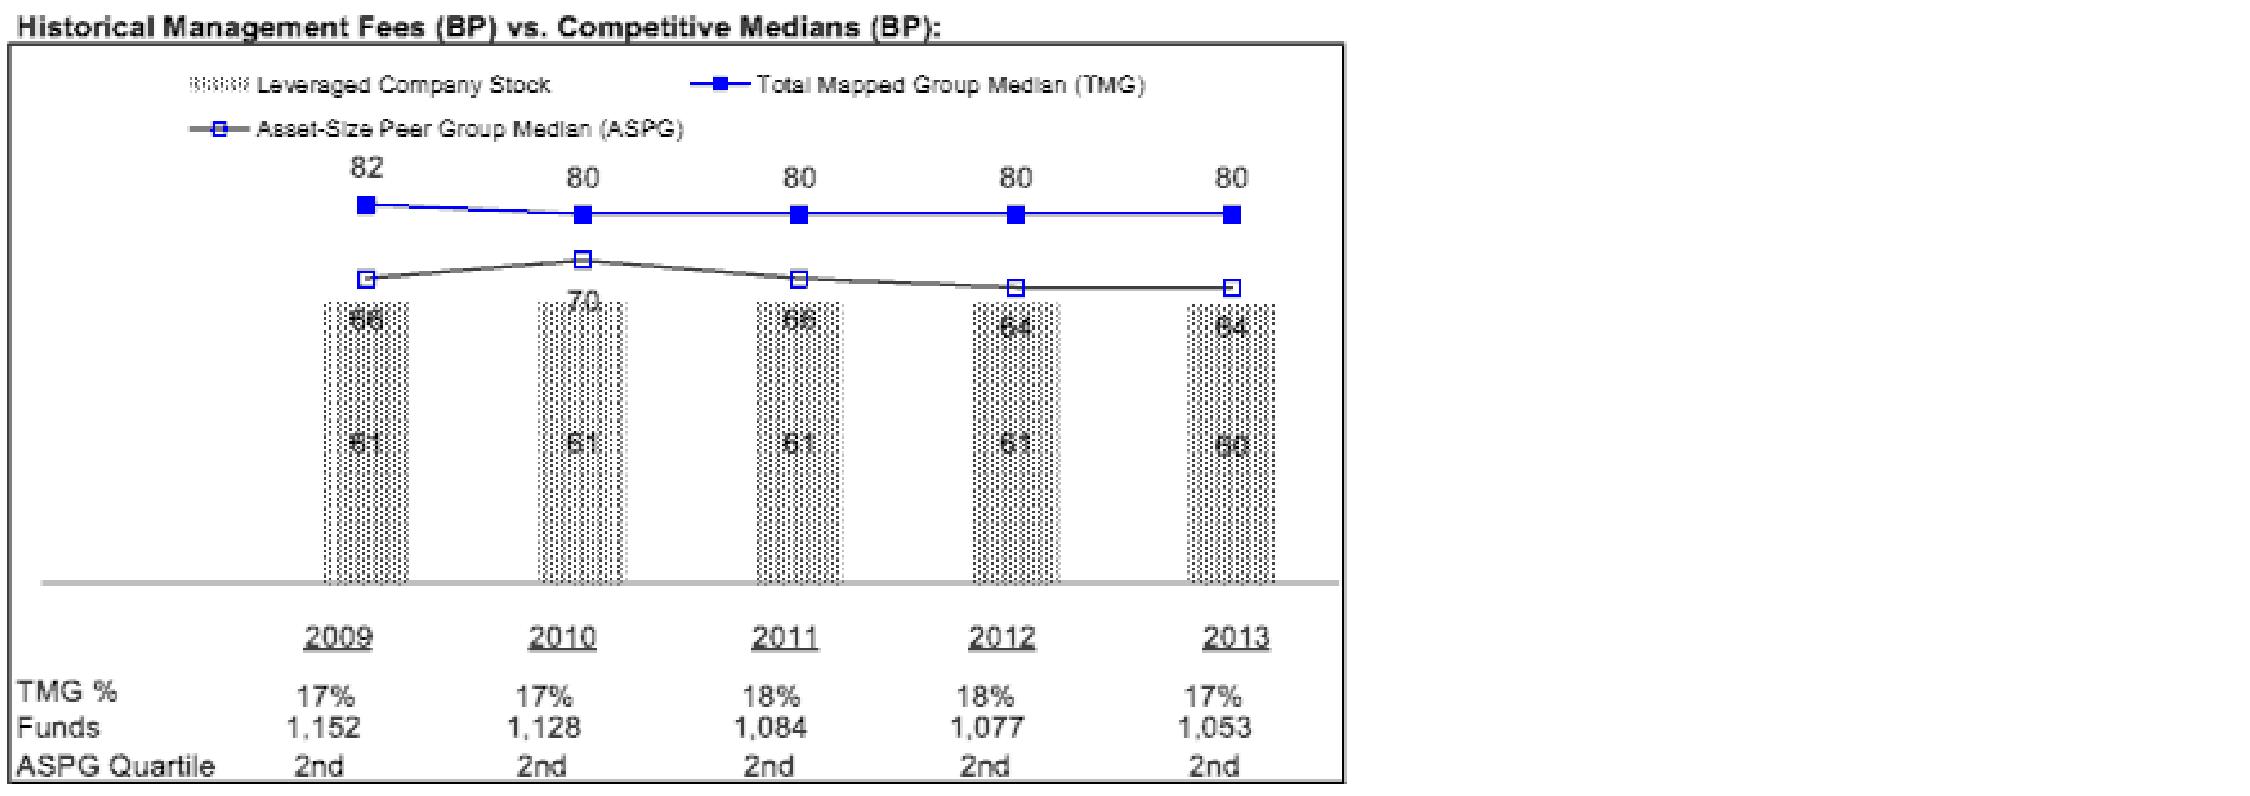
The Board noted that the fund's management fee rate ranked below the median of its Total Mapped Group and below the median of its ASPG for 2013.
The Board also noted that, in August 2013, the ad hoc Committee on Management Fees was formed to conduct an in-depth review of the management fee rates of Fidelity's active equity mutual funds. The Committee focused on the following areas: (i) standard fee structures; (ii) research consumption and trading evolution; (iii) management fee competitiveness/profitability by category; and (iv) factors that drive institutional pricing.
Based on its review, the Board concluded that the fund's management fee is fair and reasonable in light of the services that the fund receives and the other factors considered.
Annual Report
Total Expense Ratio. In its review of each class's total expense ratio, the Board considered the fund's management fee as well as other fund or class expenses, as applicable, such as transfer agent fees, pricing and bookkeeping fees, and custodial, legal, and audit fees. The Board also noted the effects of any waivers and reimbursements on fees and expenses. As part of its review, the Board also considered the current and historical total expense ratios of each class of the fund compared to competitive fund median expenses. Each class of the fund is compared to those funds and classes in the Total Mapped Group (used by the Board for management fee comparisons) that have a similar sales load structure.
The Board noted that the total expense ratio of each class ranked below its competitive median for 2013.
Fees Charged to Other Fidelity Clients. The Board also considered Fidelity fee structures and other information with respect to clients of Fidelity, such as other funds advised or subadvised by Fidelity, pension plan clients, and other institutional clients. The Board noted the findings of the 2013 ad hoc joint committee (created with the board of other Fidelity funds), which reviewed and compared Fidelity's institutional investment advisory business with its business of providing services to the Fidelity funds, including the differences in services provided, fees charged, and costs incurred, as well as competition in their respective marketplaces.
Based on its review of total expense ratios and fees charged to other Fidelity clients, the Board concluded that the total expense ratio of each class of the fund was reasonable in light of the services that the fund and its shareholders receive and the other factors considered.
Costs of the Services and Profitability. The Board considered the revenues earned and the expenses incurred by Fidelity in conducting the business of developing, marketing, distributing, managing, administering and servicing the fund and servicing the fund's shareholders. The Board also considered the level of Fidelity's profits in respect of all the Fidelity funds.
On an annual basis, Fidelity presents to the Board Fidelity's profitability for the fund. Fidelity calculates the profitability for each fund, as well as aggregate profitability for groups of Fidelity funds and all Fidelity funds, using a series of detailed revenue and cost allocation methodologies which originate with the books and records of Fidelity on which Fidelity's audited financial statements are based. The Audit Committee of the Board reviews any significant changes from the prior year's methodologies.
PricewaterhouseCoopers LLP (PwC), independent registered public accounting firm and auditor to Fidelity and certain Fidelity funds, has been engaged annually by the Board as part of the Board's assessment of Fidelity's profitability analysis. PwC's engagement includes the review and assessment of the methodologies used by Fidelity in determining the revenues and expenses attributable to Fidelity's mutual fund business, and completion of agreed-upon procedures in respect of the mathematical accuracy of fund profitability and its conformity to established allocation methodologies. After considering PwC's reports issued under the engagement and information provided by Fidelity, the Board concluded that while other allocation methods may also be reasonable, Fidelity's profitability methodologies are reasonable in all material respects.
Annual Report
Board Approval of Investment Advisory Contracts and
Management Fees - continued
The Board also reviewed Fidelity's non-fund businesses and fall-out benefits related to the mutual fund business as well as cases where Fidelity's affiliates may benefit from or be related to the fund's business.
The Board considered the costs of the services provided by and the profits realized by Fidelity in connection with the operation of the fund and was satisfied that the profitability was not excessive in the circumstances.
Economies of Scale. The Board considered whether there have been economies of scale in respect of the management of the Fidelity funds, whether the Fidelity funds (including the fund) have appropriately benefited from any such economies of scale, and whether there is potential for realization of any further economies of scale. The Board considered the extent to which the fund will benefit from economies of scale through increased services to the fund, through waivers or reimbursements, or through fee or expense ratio reductions. The Board also noted that in 2013, it and the boards of other Fidelity funds created an ad hoc committee (the Economies of Scale Committee) to analyze whether Fidelity attains economies of scale in respect of the management and servicing of the Fidelity funds, whether the Fidelity funds have appropriately benefited from such economies of scale, and whether there is potential for realization of any further economies of scale.
The Board recognized that the fund's management contract incorporates a "group fee" structure, which provides for lower group fee rates as total group assets increase, and for higher group fee rates as total group assets decrease (with "group assets" defined to include fund assets under FMR's management plus sector fund assets previously under FMR's management and currently managed by Fidelity SelectCo, LLC). FMR calculates the group fee rates based on a tiered asset "breakpoint" schedule that varies based on asset class. The Board considered that the group fee is designed to deliver the benefits of economies of scale to fund shareholders when total Fidelity fund assets increase, even if assets of any particular fund are unchanged or have declined, because some portion of Fidelity's costs are attributable to services provided to all Fidelity funds, and all funds benefit if those costs can be allocated among more assets. The Board concluded that, given the group fee structure, fund shareholders will benefit from lower management fees as group assets increase at the fund complex level, regardless of whether Fidelity achieves any such economies of scale.
Annual Report
The Board concluded, taking into account the analysis of the Economies of Scale Committee, that economies of scale, if any, are being appropriately shared between fund shareholders and Fidelity.
Additional Information Requested by the Board. In order to develop fully the factual basis for consideration of the Fidelity funds' Advisory Contracts, the Board requested and received additional information on certain topics, including: (i) fund performance trends and Fidelity's long-term strategies for certain funds; (ii) Fidelity's strategic marketing and product lineup goals; (iii) the methodology with respect to competitive fund data and peer group classifications; (iv) the arrangements with, and performance of, certain sub-advisers on behalf of the Fidelity funds, as well as certain proposed participating affiliate arrangements; (v) the realization of fall-out benefits in certain Fidelity business units; (vi) Fidelity's group fee structures, including the rationale for the individual fee rates of certain categories of funds and the definition of group assets; (vii) trends regarding industry use of performance fee structures and the performance adjustment methodologies applicable to the Fidelity funds; (viii) additional competitive analysis regarding the total expenses for certain classes; (ix) fund profitability methodology, including Fidelity's cost allocation methodology, and the impact of certain factors on fund profitability results; and (x) the process by which Fidelity determines sub-advisory fees for funds it advises.
Based on its evaluation of all of the conclusions noted above, and after considering all factors it believed relevant, the Board ultimately concluded that the advisory fee structures are fair and reasonable, and that the fund's Advisory Contracts should be renewed.
Annual Report
Investment Adviser
Fidelity Management & Research Company
Boston, MA
Investment Sub-Advisers
FMR Co., Inc.
Fidelity Management & Research
(U.K.) Inc.
Fidelity Management & Research
(Hong Kong) Limited
Fidelity Management & Research
(Japan) Inc.
General Distributor
Fidelity Distributors Corporation
Smithfield, RI
Transfer and Service Agents
Fidelity Investments Institutional
Operations Company, Inc.
Boston, MA
Fidelity Service Company, Inc.
Boston, MA
Custodian
JPMorgan Chase Bank
New York, NY
(Fidelity Investment logo)(registered trademark)
Corporate Headquarters
245 Summer St., Boston, MA 02210
www.fidelity.com
LSF-K-UANN-0914
1.863381.105
Fidelity®
OTC
Portfolio
Annual Report
July 31, 2014
(Fidelity Cover Art)
Contents
Performance | (Click Here) | How the fund has done over time. |
Management's Discussion of Fund Performance | (Click Here) | The Portfolio Manager's review of fund performance and strategy. |
Shareholder Expense Example | (Click Here) | An example of shareholder expenses. |
Investment Changes | (Click Here) | A summary of major shifts in the fund's investments over the past six months. |
Investments | (Click Here) | A complete list of the fund's investments with their market values. |
Financial Statements | (Click Here) | Statements of assets and liabilities, operations, and changes in net assets, as well as financial highlights. |
Notes | (Click Here) | Notes to the financial statements. |
Report of Independent Registered Public Accounting Firm | (Click Here) | |
Trustees and Officers | (Click Here) | |
Distributions | (Click Here) | |
Board Approval of Investment Advisory Contracts and Management Fees | (Click Here) | |
To view a fund's proxy voting guidelines and proxy voting record for the 12-month period ended June 30, visit http://www.fidelity.com/proxyvotingresults or visit the Securities and Exchange Commission's (SEC) web site at http://www.sec.gov. You may also call 1-800-544-8544 to request a free copy of the proxy voting guidelines.
Standard & Poor's, S&P and S&P 500 are registered service marks of The McGraw-Hill Companies, Inc. and have been licensed for use by Fidelity Distributors Corporation.
Other third-party marks appearing herein are the property of their respective owners.
All other marks appearing herein are registered or unregistered trademarks or service marks of FMR LLC or an affiliated company. © 2014 FMR LLC. All rights reserved.
Annual Report
This report and the financial statements contained herein are submitted for the general information of the shareholders of the fund. This report is not authorized for distribution to prospective investors in the fund unless preceded or accompanied by an effective prospectus.
A fund files its complete schedule of portfolio holdings with the SEC for the first and third quarters of each fiscal year on Form N-Q. Forms N-Q are available on the SEC's web site at http://www.sec.gov. A fund's Forms N-Q may be reviewed and copied at the SEC's Public Reference Room in Washington, DC. Information regarding the operation of the SEC's Public Reference Room may be obtained by calling 1-800-SEC-0330. For a complete list of a fund's portfolio holdings, view the most recent holdings listing, semiannual report, or annual report on Fidelity's web site at http://www.fidelity.com, http://www.advisor.fidelity.com, or http://www.401k.com, as applicable.
NOT FDIC INSURED • MAY LOSE VALUE • NO BANK GUARANTEE
Neither the fund nor Fidelity Distributors Corporation is a bank.
Annual Report
Average annual total return reflects the change in the value of an investment, assuming reinvestment of the class' distributions from dividend income and capital gains (the profits earned upon the sale of securities that have grown in value, if any) and assuming a constant rate of performance each year. The $10,000 table and the fund's returns do not reflect the deduction of taxes that a shareholder would pay on fund distributions or the redemption of fund shares. During periods of reimbursement by Fidelity, a fund's total return will be greater than it would be had the reimbursement not occurred. How a fund did yesterday is no guarantee of how it will do tomorrow.
Average Annual Total Returns
Periods ended July 31, 2014 | Past 1
year | Past 5
years | Past 10
years |
Fidelity® OTC Portfolio | 17.96% | 19.30% | 12.03% |
$10,000 Over 10 Years
Let's say hypothetically that $10,000 was invested in Fidelity® OTC Portfolio, a class of the fund, on July 31, 2004. The chart shows how the value of your investment would have changed, and also shows how the Nasdaq Composite Index® performed over the same period.
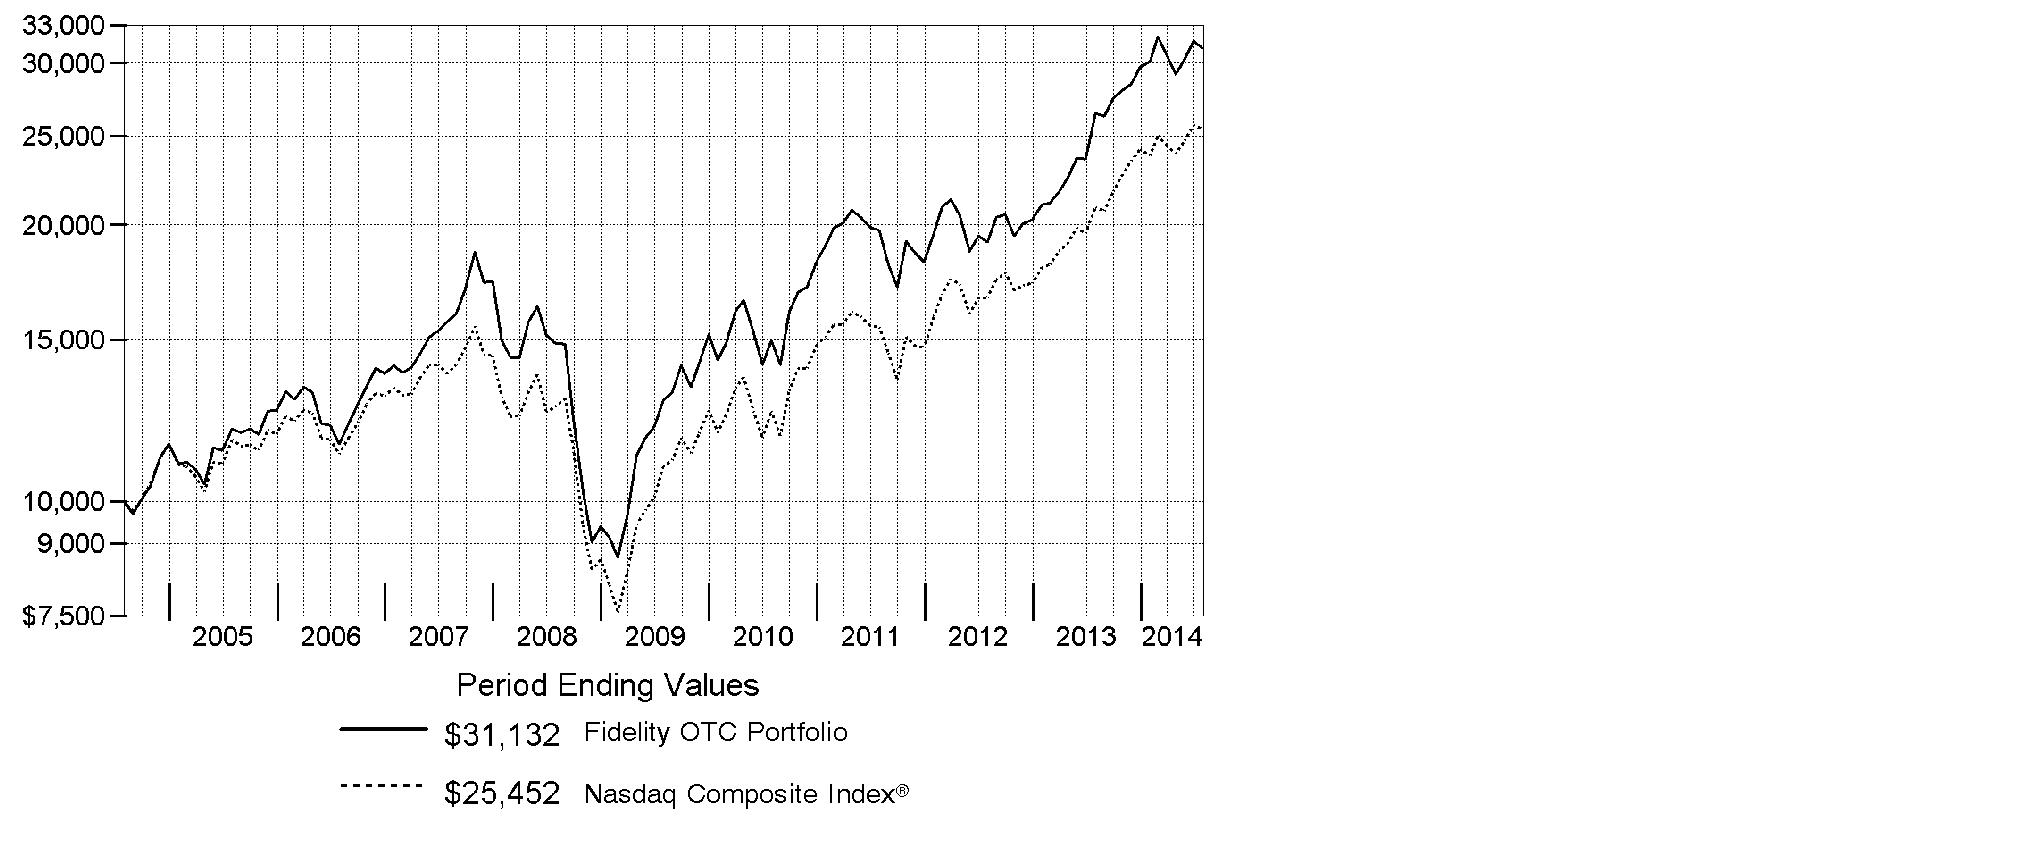
Annual Report
Market Recap: U.S. stocks overcame a slowing economy early in 2014 to post a strong gain for the 12-month period ending July 31, 2014, supported by corporate profits and continued low interest rates. The S&P 500® Index rose 16.94%, reaching an all-time high near period end. The technology-heavy Nasdaq Composite Index® gained 22.00%. The Russell 2000® Index returned 8.56%, reflecting the relatively lackluster performance of small-cap stocks. Information technology (+28%) was the top-performing sector within the S&P 500®, driven by strong semiconductor and computer hardware sales. Materials (+23%) gained amid higher prices for many commodity products. Health care (+21%) rose, driven by gains in pharmaceuticals, biotechnology & life sciences companies. Energy stocks (+19%) advanced in the latter part of the period amid healthy U.S. output and the threat of supply disruptions in Iraq. Conversely, most defensive sectors, including consumer staples, utilities and telecommunication services, lagged the broader market. Volatility remained tame throughout most of the period, with markets supported by declining unemployment, near-record profit margins for companies, muted cost inflation and fairly low corporate debt levels. Geopolitical tension remained a concern at period end, with conflict in Ukraine and strained relations between Russia and the West posing a potential threat to global growth.
Comments from Gavin Baker, Portfolio Manager of Fidelity® OTC Portfolio: For the year, the fund's Retail Class shares returned 17.96%, trailing the Nasdaq Composite Index. Notable detractors include Rackspace Hosting, Groupon, NII Holdings and Angie's List, which collectively cost the fund more than 540 basis points of relative performance. Mobile operator NII faced a number of challenges in rolling out its new wireless network in Latin America. Subscriber-based Angie's List faced increased competition from crowd-sourced and free alternatives, as well as marketplace-model implementation issues. NII Holdings and nearly our entire position in Angie's List were sold from the fund prior to period end. The fund maintained its stake in Rackspace and increased its stake in Groupon. On the positive side, social-media giant Facebook, the fund's top relative contributor, continued to benefit from having figured out how to profitably integrate advertising into its newsfeed. Keurig Green Mountain also helped the fund's relative performance. The company continued to grow its earnings, along with its relationship with Coca-Cola, and remains strategic and aggressive in seeking out new and mutually beneficial partnerships.
The views expressed above reflect those of the portfolio manager(s) only through the end of the period as stated on the cover of this report and do not necessarily represent the views of Fidelity or any other person in the Fidelity organization. Any such views are subject to change at any time based upon market or other conditions and Fidelity disclaims any responsibility to update such views. These views may not be relied on as investment advice and, because investment decisions for a Fidelity fund are based on numerous factors, may not be relied on as an indication of trading intent on behalf of any Fidelity fund.
Annual Report
Shareholder Expense Example
As a shareholder of the Fund, you incur two types of costs: (1) transaction costs, and (2) ongoing costs, including management fees and other Fund expenses. This Example is intended to help you understand your ongoing costs (in dollars) of investing in the Fund and to compare these costs with the ongoing costs of investing in other mutual funds.
The Example is based on an investment of $1,000 invested at the beginning of the period and held for the entire period (February 1, 2014 to July 31, 2014).
Actual Expenses
The first line of the accompanying table for each class of the Fund provides information about actual account values and actual expenses. You may use the information in this line, together with the amount you invested, to estimate the expenses that you paid over the period. Simply divide your account value by $1,000.00 (for example, an $8,600 account value divided by $1,000.00 = 8.6), then multiply the result by the number in the first line for a class of the Fund under the heading entitled "Expenses Paid During Period" to estimate the expenses you paid on your account during this period. A small balance maintenance fee of $12.00 that is charged once a year may apply for certain accounts with a value of less than $2,000. This fee is not included in the table below. If it was, the estimate of expenses you paid during the period would be higher, and your ending account value lower, by this amount. In addition, the Fund, as a shareholder in the underlying Fidelity Central Funds, will indirectly bear its pro-rata share of the fees and expenses incurred by the underlying Fidelity Central Funds. These fees and expenses are not included in the Fund's annualized expense ratio used to calculate the expense estimate in the table below.
Hypothetical Example for Comparison Purposes
The second line of the accompanying table for each class of the Fund provides information about hypothetical account values and hypothetical expenses based on a Class' actual expense ratio and an assumed rate of return of 5% per year before expenses, which is not the Class' actual return. The hypothetical account values and expenses may not be used to estimate the actual ending account balance or expenses you paid for the period. You may use this information to compare the ongoing costs of investing in the Fund and other funds. To do so, compare this 5% hypothetical example with the 5% hypothetical examples that appear in the shareholder reports of the other funds. A small balance maintenance fee of $12.00 that is charged once a year may apply for certain accounts with a value of less than $2,000. This fee is not included in the table below. If it was, the estimate of expenses you paid during the period would be higher, and your ending account value lower, by this amount. In addition, the Fund, as a shareholder in the underlying Fidelity Central Funds, will indirectly bear its pro-rata share of the fees and expenses incurred by the underlying Fidelity Central Funds. These fees and expenses are not included in the Fund's annualized expense ratio used to calculate the expense estimate in the table below.
Please note that the expenses shown in the table are meant to highlight your ongoing costs only and do not reflect any transaction costs. Therefore, the second line of the table is useful in comparing ongoing costs only, and will not help you determine the relative total costs of owning different funds.
Annual Report
Shareholder Expense Example - continued
| Annualized
Expense Ratio B | Beginning
Account Value
February 1, 2014 | Ending
Account Value
July 31, 2014 | Expenses Paid
During Period*
February 1, 2014
to July 31, 2014 |
OTC | .71% | | | |
Actual | | $ 1,000.00 | $ 1,034.60 | $ 3.58 |
Hypothetical A | | $ 1,000.00 | $ 1,021.27 | $ 3.56 |
Class K | .59% | | | |
Actual | | $ 1,000.00 | $ 1,035.20 | $ 2.98 |
Hypothetical A | | $ 1,000.00 | $ 1,021.87 | $ 2.96 |
A 5% return per year before expenses
B Annualized expense ratio reflects expenses net of applicable fee waivers.
* Expenses are equal to each Class' annualized expense ratio, multiplied by the average account value over the period, multiplied by 181/365 (to reflect the one-half year period).
Annual Report
Investment Changes (Unaudited)
Top Ten Stocks as of July 31, 2014 |
| % of fund's
net assets | % of fund's net assets
6 months ago |
Apple, Inc. | 10.5 | 6.9 |
Microsoft Corp. | 4.7 | 3.3 |
Google, Inc. Class A | 4.5 | 6.7 |
Amazon.com, Inc. | 4.5 | 4.3 |
Google, Inc. Class C | 4.3 | 0.0 |
Groupon, Inc. Class A | 3.7 | 1.9 |
Facebook, Inc. Class A | 3.1 | 5.2 |
Gilead Sciences, Inc. | 2.9 | 2.5 |
athenahealth, Inc. | 2.7 | 2.4 |
Rackspace Hosting, Inc. | 2.7 | 3.4 |
| 43.6 | |
Top Five Market Sectors as of July 31, 2014 |
| % of fund's
net assets | % of fund's net assets
6 months ago |
Information Technology | 52.1 | 47.9 |
Health Care | 20.1 | 22.0 |
Consumer Discretionary | 15.3 | 15.9 |
Consumer Staples | 4.6 | 6.5 |
Financials | 4.0 | 2.4 |
Asset Allocation (% of fund's net assets) |
As of July 31, 2014* | As of January 31, 2014** |
 | Stocks 98.9% | | | Stocks 99.3% | |
 | Convertible
Securities 0.9% | | | Convertible
Securities 0.3% | |
 | Short-Term
Investments and
Net Other Assets
(Liabilities) 0.2% | | | Short-Term
Investments and
Net Other Assets
(Liabilities) 0.4% | |
* Foreign investments | 5.6% | | ** Foreign investments | 6.1% | |

Annual Report
Investments July 31, 2014
Showing Percentage of Net Assets
Common Stocks - 98.9% |
| Shares | | Value (000s) |
CONSUMER DISCRETIONARY - 15.0% |
Automobiles - 0.6% |
Tesla Motors, Inc. (a)(d) | 281,299 | | $ 62,814 |
Hotels, Restaurants & Leisure - 1.4% |
Bloomin' Brands, Inc. (a) | 771,100 | | 15,106 |
Dunkin' Brands Group, Inc. | 22,800 | | 977 |
Intrawest Resorts Holdings, Inc. (d) | 764,235 | | 8,613 |
Panera Bread Co. Class A (a) | 502,000 | | 73,945 |
Starbucks Corp. | 357,710 | | 27,787 |
The Cheesecake Factory, Inc. | 518,500 | | 22,233 |
| | 148,661 |
Household Durables - 0.3% |
D.R. Horton, Inc. | 65,100 | | 1,348 |
Garmin Ltd. (d) | 333,822 | | 18,374 |
iRobot Corp. (a)(d) | 145,200 | | 4,700 |
Lennar Corp. Class A | 24,600 | | 891 |
Wayfair LLC Series B (f)(g) | 381,300 | | 10,000 |
| | 35,313 |
Internet & Catalog Retail - 8.4% |
Amazon.com, Inc. (a) | 1,552,098 | | 485,791 |
Groupon, Inc. Class A (a)(d)(e) | 60,287,370 | | 390,059 |
JD.com, Inc. sponsored ADR | 31,500 | | 900 |
RetailMeNot, Inc. | 45,200 | | 1,106 |
zulily, Inc. Class A (d) | 665,573 | | 23,042 |
| | 900,898 |
Media - 2.0% |
Comcast Corp. Class A | 3,506,300 | | 188,393 |
Liberty Global PLC Class A (a) | 291,500 | | 12,126 |
Lions Gate Entertainment Corp. (d) | 43,869 | | 1,351 |
The Walt Disney Co. | 27,200 | | 2,336 |
Twenty-First Century Fox, Inc. Class A | 478,500 | | 15,159 |
| | 219,365 |
Specialty Retail - 1.6% |
Francesca's Holdings Corp. (a) | 1,509 | | 19 |
Monro Muffler Brake, Inc. | 613 | | 31 |
Restoration Hardware Holdings, Inc. (a) | 65,700 | | 5,374 |
Ross Stores, Inc. | 595,200 | | 38,331 |
TJX Companies, Inc. | 41,700 | | 2,222 |
Tractor Supply Co. | 90,376 | | 5,619 |
Ulta Salon, Cosmetics & Fragrance, Inc. (a) | 1,327,715 | | 122,588 |
| | 174,184 |
Common Stocks - continued |
| Shares | | Value (000s) |
CONSUMER DISCRETIONARY - continued |
Textiles, Apparel & Luxury Goods - 0.7% |
lululemon athletica, Inc. (a)(d) | 227,746 | | $ 8,761 |
LVMH Moet Hennessy - Louis Vuitton SA ADR | 306,800 | | 10,480 |
NIKE, Inc. Class B | 400 | | 31 |
Ralph Lauren Corp. | 373,200 | | 58,167 |
| | 77,439 |
TOTAL CONSUMER DISCRETIONARY | | 1,618,674 |
CONSUMER STAPLES - 4.6% |
Beverages - 0.5% |
Monster Beverage Corp. (a) | 892,200 | | 57,065 |
Food & Staples Retailing - 2.5% |
Costco Wholesale Corp. | 2,101,050 | | 246,957 |
Sprouts Farmers Market LLC (d) | 727,500 | | 22,196 |
| | 269,153 |
Food Products - 1.6% |
Danone SA sponsored ADR | 3,721,723 | | 53,891 |
Keurig Green Mountain, Inc. | 752,317 | | 89,736 |
Mondelez International, Inc. | 854,000 | | 30,744 |
| | 174,371 |
TOTAL CONSUMER STAPLES | | 500,589 |
ENERGY - 0.3% |
Energy Equipment & Services - 0.2% |
Oceaneering International, Inc. | 337,900 | | 22,947 |
Oil, Gas & Consumable Fuels - 0.1% |
Noble Energy, Inc. | 16,900 | | 1,124 |
Rosetta Resources, Inc. (a) | 252,500 | | 12,895 |
| | 14,019 |
TOTAL ENERGY | | 36,966 |
FINANCIALS - 4.0% |
Banks - 2.0% |
Bank of America Corp. | 420,000 | | 6,405 |
Citigroup, Inc. | 464,300 | | 22,709 |
Commerce Bancshares, Inc. | 474,507 | | 21,381 |
Huntington Bancshares, Inc. | 4,400 | | 43 |
JPMorgan Chase & Co. | 1,959,100 | | 112,981 |
Common Stocks - continued |
| Shares | | Value (000s) |
FINANCIALS - continued |
Banks - continued |
PacWest Bancorp | 1,000 | | $ 42 |
Signature Bank (a) | 214,600 | | 24,548 |
UMB Financial Corp. | 308,962 | | 17,497 |
Wells Fargo & Co. | 185,900 | | 9,462 |
| | 215,068 |
Capital Markets - 0.7% |
Carlyle Group LP | 630,500 | | 21,046 |
Northern Trust Corp. | 893,400 | | 59,760 |
| | 80,806 |
Consumer Finance - 1.3% |
American Express Co. | 729,500 | | 64,196 |
Capital One Financial Corp. | 907,500 | | 72,183 |
| | 136,379 |
Thrifts & Mortgage Finance - 0.0% |
BofI Holding, Inc. (a) | 12,300 | | 917 |
TOTAL FINANCIALS | | 433,170 |
HEALTH CARE - 19.9% |
Biotechnology - 13.4% |
Acceleron Pharma, Inc. | 167,000 | | 4,947 |
Aegerion Pharmaceuticals, Inc. (a) | 9,600 | | 323 |
Alexion Pharmaceuticals, Inc. (a) | 685,789 | | 109,034 |
Alkermes PLC (a) | 865,236 | | 36,997 |
Alnylam Pharmaceuticals, Inc. (a) | 146,100 | | 7,897 |
Amgen, Inc. | 89,200 | | 11,363 |
Avalanche Biotechnologies, Inc. (a) | 171,949 | | 4,813 |
BioCryst Pharmaceuticals, Inc. (a) | 1,582,464 | | 19,812 |
Biogen Idec, Inc. (a) | 198,400 | | 66,343 |
BioMarin Pharmaceutical, Inc. (a) | 2,266,956 | | 140,143 |
Celldex Therapeutics, Inc. (a)(d) | 1,255,985 | | 16,441 |
Clovis Oncology, Inc. (a) | 432,455 | | 15,763 |
Dicerna Pharmaceuticals, Inc. (d) | 253,207 | | 3,803 |
Epizyme, Inc. (a) | 85 | | 3 |
Exelixis, Inc. (a)(d) | 371,858 | | 1,502 |
Foundation Medicine, Inc. (d)(e) | 1,593,212 | | 35,879 |
Genocea Biosciences, Inc. | 686,570 | | 11,953 |
Gilead Sciences, Inc. (a) | 3,355,799 | | 307,223 |
ImmunoGen, Inc. (a) | 70,009 | | 755 |
Infinity Pharmaceuticals, Inc. (a) | 869,731 | | 7,906 |
Common Stocks - continued |
| Shares | | Value (000s) |
HEALTH CARE - continued |
Biotechnology - continued |
Intercept Pharmaceuticals, Inc. (a) | 283,119 | | $ 65,786 |
InterMune, Inc. (a) | 1,500,000 | | 65,805 |
Intrexon Corp. (d) | 198,100 | | 4,376 |
Ironwood Pharmaceuticals, Inc. Class A (a) | 3,220,042 | | 47,657 |
Isis Pharmaceuticals, Inc. (a) | 46,249 | | 1,433 |
KYTHERA Biopharmaceuticals, Inc. (a)(d)(e) | 1,257,482 | | 42,226 |
Lion Biotechnologies, Inc. (a)(e) | 1,800,000 | | 12,870 |
Medivation, Inc. (a) | 856,145 | | 63,552 |
NPS Pharmaceuticals, Inc. (a) | 422,700 | | 11,810 |
Ophthotech Corp. (d) | 1,010,600 | | 39,474 |
Pharmacyclics, Inc. (a)(d) | 313,600 | | 37,770 |
Portola Pharmaceuticals, Inc. (a)(e) | 2,336,800 | | 58,747 |
PTC Therapeutics, Inc. (a)(e) | 2,099,379 | | 55,466 |
Puma Biotechnology, Inc. (a) | 23,500 | | 5,210 |
Regeneron Pharmaceuticals, Inc. (a) | 16,000 | | 5,060 |
Seattle Genetics, Inc. (a)(d) | 1,401,386 | | 49,329 |
Synageva BioPharma Corp. (a) | 478,174 | | 32,712 |
Targacept, Inc. (a) | 4,749 | | 13 |
Ultragenyx Pharmaceutical, Inc. (d) | 317,796 | | 13,888 |
uniQure B.V. | 192,200 | | 1,964 |
Versartis, Inc. (a)(d) | 517,200 | | 10,551 |
Vertex Pharmaceuticals, Inc. (a) | 171,100 | | 15,213 |
XOMA Corp. (a) | 1,521,913 | | 5,905 |
| | 1,449,717 |
Health Care Equipment & Supplies - 1.3% |
Accuray, Inc. (a)(d) | 2,427,800 | | 19,107 |
Endologix, Inc. (a) | 1,400 | | 20 |
HeartWare International, Inc. (a) | 240,200 | | 20,227 |
Insulet Corp. (a) | 454,417 | | 16,059 |
Intuitive Surgical, Inc. (a) | 38,250 | | 17,501 |
Novadaq Technologies, Inc. (a) | 2,521,733 | | 38,683 |
Quidel Corp. (a) | 1,088,274 | | 25,977 |
| | 137,574 |
Health Care Providers & Services - 0.8% |
Accretive Health, Inc. (a)(d)(e) | 9,842,302 | | 82,872 |
Health Care Technology - 3.2% |
athenahealth, Inc. (a)(d)(e) | 2,369,183 | | 294,726 |
Castlight Health, Inc. Class B (a)(d) | 65,400 | | 877 |
Common Stocks - continued |
| Shares | | Value (000s) |
HEALTH CARE - continued |
Health Care Technology - continued |
Medidata Solutions, Inc. (a) | 247,200 | | $ 11,084 |
Veeva Systems, Inc. Class A (d) | 1,545,600 | | 36,785 |
| | 343,472 |
Life Sciences Tools & Services - 0.5% |
Illumina, Inc. (a) | 324,200 | | 51,843 |
Pharmaceuticals - 0.7% |
Achaogen, Inc. (a) | 847,200 | | 9,158 |
Endocyte, Inc. (a)(d) | 90,808 | | 603 |
GW Pharmaceuticals PLC ADR (a)(d) | 193,527 | | 16,372 |
Intra-Cellular Therapies, Inc. | 263,900 | | 3,824 |
Pacira Pharmaceuticals, Inc. (a) | 10,200 | | 938 |
Questcor Pharmaceuticals, Inc. | 92 | | 8 |
Revance Therapeutics, Inc. | 971,700 | | 29,812 |
Theravance, Inc. (a)(d) | 657,279 | | 14,263 |
| | 74,978 |
TOTAL HEALTH CARE | | 2,140,456 |
INDUSTRIALS - 2.1% |
Airlines - 0.4% |
American Airlines Group, Inc. | 229,900 | | 8,932 |
JetBlue Airways Corp. (a) | 294,500 | | 3,157 |
United Continental Holdings, Inc. (a) | 640,800 | | 29,727 |
| | 41,816 |
Electrical Equipment - 0.3% |
SolarCity Corp. (a)(d) | 527,094 | | 37,703 |
Professional Services - 0.9% |
Paylocity Holding Corp. (a)(d) | 12,700 | | 249 |
Towers Watson & Co. | 10,700 | | 1,092 |
Verisk Analytics, Inc. (a) | 1,561,600 | | 93,758 |
| | 95,099 |
Road & Rail - 0.5% |
J.B. Hunt Transport Services, Inc. | 642,880 | | 49,669 |
TOTAL INDUSTRIALS | | 224,287 |
INFORMATION TECHNOLOGY - 51.7% |
Communications Equipment - 1.9% |
Aruba Networks, Inc. (a) | 4,363,279 | | 77,928 |
Common Stocks - continued |
| Shares | | Value (000s) |
INFORMATION TECHNOLOGY - continued |
Communications Equipment - continued |
Cisco Systems, Inc. | 46,900 | | $ 1,183 |
QUALCOMM, Inc. | 278,153 | | 20,500 |
Riverbed Technology, Inc. (a) | 3,112,173 | | 55,708 |
ViaSat, Inc. (a) | 840,700 | | 49,156 |
| | 204,475 |
Electronic Equipment & Components - 0.7% |
Control4 Corp. | 1,600 | | 27 |
Trimble Navigation Ltd. (a) | 2,576,700 | | 79,620 |
| | 79,647 |
Internet Software & Services - 17.7% |
Angie's List, Inc. (a)(d) | 94,091 | | 784 |
Baidu.com, Inc. sponsored ADR (a) | 198,900 | | 42,972 |
Benefitfocus, Inc. (d) | 193,400 | | 7,454 |
Constant Contact, Inc. (a) | 908,336 | | 28,276 |
Cornerstone OnDemand, Inc. (a) | 1,924,282 | | 80,512 |
Cvent, Inc. | 321,700 | | 8,786 |
Demandware, Inc. (a) | 22,500 | | 1,355 |
Dropbox, Inc. (a)(g) | 331,524 | | 6,333 |
E2open, Inc. (a)(d)(e) | 1,552,491 | | 25,119 |
Facebook, Inc. Class A (a) | 4,591,088 | | 333,543 |
Google, Inc.: | | | |
Class A (a) | 846,027 | | 490,315 |
Class C (a) | 812,377 | | 464,355 |
Marketo, Inc. (a)(d)(e) | 2,081,278 | | 56,923 |
Qihoo 360 Technology Co. Ltd. ADR (a) | 9,100 | | 829 |
Rackspace Hosting, Inc. (a)(e) | 9,689,146 | | 293,484 |
Textura Corp. (a) | 600 | | 15 |
TrueCar, Inc. (d) | 491,500 | | 6,670 |
Twitter, Inc. | 22,500 | | 1,017 |
Wix.com Ltd. (a)(d) | 364,405 | | 6,177 |
Yahoo!, Inc. (a) | 1,510,100 | | 54,077 |
Yelp, Inc. (a) | 730 | | 49 |
| | 1,909,045 |
IT Services - 0.1% |
Acxiom Corp. (a) | 44,300 | | 812 |
Cognizant Technology Solutions Corp. Class A (a) | 21,200 | | 1,040 |
ServiceSource International, Inc. (a)(d) | 1,076,936 | | 4,771 |
| | 6,623 |
Common Stocks - continued |
| Shares | | Value (000s) |
INFORMATION TECHNOLOGY - continued |
Semiconductors & Semiconductor Equipment - 3.2% |
Altera Corp. | 70,894 | | $ 2,320 |
Applied Micro Circuits Corp. (a) | 457,650 | | 3,821 |
Broadcom Corp. Class A | 343,800 | | 13,154 |
Cavium, Inc. (a) | 24,900 | | 1,162 |
Cirrus Logic, Inc. (a) | 461,900 | | 10,360 |
Cree, Inc. (a)(d) | 1,408,400 | | 66,519 |
Inphi Corp. (a) | 1,595 | | 24 |
Mellanox Technologies Ltd. (a)(d) | 294,954 | | 12,285 |
Micron Technology, Inc. (a) | 2,364,200 | | 72,226 |
NVE Corp. (a)(e) | 265,557 | | 17,620 |
NVIDIA Corp. | 7,988,461 | | 139,798 |
RF Micro Devices, Inc. (a) | 197,000 | | 2,199 |
| | 341,488 |
Software - 16.5% |
Activision Blizzard, Inc. | 12,189,452 | | 272,800 |
Adobe Systems, Inc. (a) | 82,200 | | 5,681 |
Check Point Software Technologies Ltd. (a) | 400 | | 27 |
CommVault Systems, Inc. (a)(e) | 3,319,184 | | 159,387 |
Concur Technologies, Inc. (a)(d) | 851,973 | | 79,199 |
Electronic Arts, Inc. (a) | 1,185,260 | | 39,825 |
FireEye, Inc. (d) | 24,690 | | 876 |
Fleetmatics Group PLC (a) | 1,341,522 | | 42,379 |
Gameloft Se (a)(e) | 7,764,787 | | 49,492 |
Imperva, Inc. (a) | 406,800 | | 9,019 |
Interactive Intelligence Group, Inc. (a) | 222,187 | | 10,081 |
King Digital Entertainment PLC (a)(d) | 99,806 | | 1,941 |
Microsoft Corp. | 11,728,139 | | 506,186 |
NetSuite, Inc. (a)(d) | 1,299,800 | | 109,586 |
Nintendo Co. Ltd. ADR | 45,600 | | 631 |
Red Hat, Inc. (a) | 199,100 | | 11,572 |
salesforce.com, Inc. (a) | 1,970,120 | | 106,879 |
ServiceNow, Inc. (a) | 156,386 | | 9,195 |
SolarWinds, Inc. (a) | 700 | | 29 |
Synchronoss Technologies, Inc. (a)(e) | 4,085,907 | | 165,112 |
Synopsys, Inc. (a) | 404,800 | | 15,289 |
Tableau Software, Inc. (a) | 400 | | 26 |
Ubisoft Entertainment SA (a)(e) | 10,112,456 | | 169,602 |
Xero Ltd. (g) | 661,157 | | 12,844 |
Common Stocks - continued |
| Shares | | Value (000s) |
INFORMATION TECHNOLOGY - continued |
Software - continued |
Zendesk, Inc. | 38,400 | | $ 668 |
Zynga, Inc. (a) | 260,800 | | 762 |
| | 1,779,088 |
Technology Hardware, Storage & Peripherals - 11.6% |
Apple, Inc. | 11,863,700 | | 1,133,810 |
Cray, Inc. (a)(d) | 874,165 | | 23,183 |
Electronics for Imaging, Inc. (a) | 1,202,400 | | 52,990 |
EMC Corp. | 1,000 | | 29 |
Nimble Storage, Inc. (d) | 955,980 | | 24,741 |
Seagate Technology LLC | 1,300 | | 76 |
Silicon Graphics International Corp. (a) | 1,774 | | 17 |
Stratasys Ltd. (a)(d) | 126,700 | | 12,738 |
| | 1,247,584 |
TOTAL INFORMATION TECHNOLOGY | | 5,567,950 |
MATERIALS - 1.0% |
Chemicals - 0.4% |
Monsanto Co. | 425,100 | | 48,075 |
Sociedad Quimica y Minera de Chile SA (PN-B) sponsored ADR | 900 | | 25 |
| | 48,100 |
Metals & Mining - 0.6% |
Anglo American PLC ADR | 4,430,000 | | 59,584 |
Randgold Resources Ltd. sponsored ADR | 333 | | 29 |
| | 59,613 |
TOTAL MATERIALS | | 107,713 |
TELECOMMUNICATION SERVICES - 0.3% |
Diversified Telecommunication Services - 0.3% |
Level 3 Communications, Inc. (a) | 741,047 | | 32,591 |
Wireless Telecommunication Services - 0.0% |
RingCentral, Inc. | 46,300 | | 691 |
TOTAL TELECOMMUNICATION SERVICES | | 33,282 |
TOTAL COMMON STOCKS (Cost $ 8,598,528) |
10,663,087
|
Convertible Preferred Stocks - 0.9% |
| Shares | | Value (000s) |
CONSUMER DISCRETIONARY - 0.3% |
Household Durables - 0.2% |
Roku, Inc. 8.00% (a)(g) | 16,562,507 | | $ 21,531 |
Internet & Catalog Retail - 0.1% |
One Kings Lane, Inc. Series E (g) | 648,635 | | 8,303 |
Media - 0.0% |
Turn, Inc. Series E (g) | 1,199,041 | | 7,866 |
TOTAL CONSUMER DISCRETIONARY | | 37,700 |
HEALTH CARE - 0.2% |
Biotechnology - 0.2% |
Avalanche Biotechnologies, Inc. Series B (g) | 700,821 | | 17,654 |
INFORMATION TECHNOLOGY - 0.4% |
Internet Software & Services - 0.4% |
Uber Technologies, Inc. 8.00% (g) | 564,041 | | 35,000 |
Software - 0.0% |
Cloudera, Inc. Series F (g) | 126,709 | | 1,982 |
Technology Hardware, Storage & Peripherals - 0.0% |
Pure Storage, Inc. Series E (g) | 184,982 | | 2,516 |
TOTAL INFORMATION TECHNOLOGY | | 39,498 |
TOTAL CONVERTIBLE PREFERRED STOCKS (Cost $78,404) |
94,852
|
Money Market Funds - 4.4% |
| | | |
Fidelity Securities Lending Cash Central Fund, 0.11% (b)(c)
(Cost $472,725) | 472,724,550 | |
472,725
|
TOTAL INVESTMENT PORTFOLIO - 104.2% (Cost $9,149,657) | | 11,230,664 |
NET OTHER ASSETS (LIABILITIES) - (4.2)% | | (454,840) |
NET ASSETS - 100% | $ 10,775,824 |
Legend |
(a) Non-income producing |
(b) Affiliated fund that is generally available only to investment companies and other accounts managed by Fidelity Investments. The rate quoted is the annualized seven-day yield of the fund at period end. A complete unaudited listing of the fund's holdings as of its most recent quarter end is available upon request. In addition, each Fidelity Central Fund's financial statements, which are not covered by the Fund's Report of Independent Registered Public Accounting Firm, are available on the SEC's website or upon request. |
(c) Investment made with cash collateral received from securities on loan. |
(d) Security or a portion of the security is on loan at period end. |
(e) Affiliated company |
(f) Investment is owned by an entity that is treated as a corporation for U.S. tax purposes and is owned by the Fund. |
(g) Restricted securities - Investment in securities not registered under the Securities Act of 1933 (excluding 144A issues). At the end of the period, the value of restricted securities (excluding 144A issues) amounted to $124,029,000 or 1.2% of net assets. |
Additional information on each restricted holding is as follows: |
Security | Acquisition Date | Acquisition Cost (000s) |
Avalanche Biotechnologies, Inc. Series B | 4/17/14 | $ 5,277 |
Cloudera, Inc. Series F | 2/5/14 | $ 1,845 |
Dropbox, Inc. | 5/2/12 | $ 3,000 |
One Kings Lane, Inc. Series E | 1/29/14 | $ 10,000 |
Pure Storage, Inc. Series E | 8/22/13 | $ 1,282 |
Roku, Inc. 8.00% | 5/7/13 | $ 15,000 |
Turn, Inc. Series E | 12/30/13 | $ 10,000 |
Uber Technologies, Inc. 8.00% | 6/6/14 | $ 35,000 |
Wayfair LLC Series B | 3/5/14 | $ 10,000 |
Xero Ltd. | 10/14/13 | $ 10,054 |
Affiliated Central Funds |
Information regarding fiscal year to date income earned by the Fund from investments in Fidelity Central Funds is as follows: |
Fund | Income earned
(Amounts in
thousands) |
Fidelity Cash Central Fund | $ 24 |
Fidelity Securities Lending Cash Central Fund | 5,974 |
Total | $ 5,998 |
Other Affiliated Issuers |
An affiliated company is a company in which the Fund has ownership of at least 5% of the voting securities. Fiscal year to date transactions with companies which are or were affiliates are as follows: |
Affiliate
(Amounts in thousands) | Value,
beginning of
period | Purchases | Sales
Proceeds | Dividend
Income | Value,
end of
period |
Accretive Health, Inc. | $ 98,226 | $ - | $ - | $ - | $ 82,872 |
Angie's List, Inc. | 89,531 | 34,870 | 77,790 | - | - |
athenahealth, Inc. | 189,279 | 204,352 | 186,170 | - | 294,726 |
CommVault Systems, Inc. | - | 211,806 | - | - | 159,387 |
Constant Contact, Inc. | 55,980 | 12,571 | 65,475 | - | - |
E2open, Inc. | 37,709 | 17,160 | 24,600 | - | 25,119 |
Foundation Medicine, Inc. | - | 56,830 | 6,410 | - | 35,879 |
Gameloft Se | 62,909 | - | - | - | 49,492 |
Groupon, Inc. Class A | 36,940 | 546,110 | 85,999 | - | 390,059 |
KYTHERA Biopharmaceuticals, Inc. | - | 60,995 | - | - | 42,226 |
Lion Biotechnologies, Inc. | - | 13,881 | - | - | 12,870 |
Marin Software, Inc. | 26,341 | 1,818 | 27,461 | - | - |
Marketo, Inc. | 4,728 | 85,086 | 22,981 | - | 56,923 |
Mellanox Technologies Ltd. | 43,318 | 101,079 | 114,381 | - | - |
NII Holdings, Inc. | 122,927 | - | 30,102 | - | - |
NVE Corp. | 13,166 | - | - | - | 17,620 |
Portola Pharmaceuticals, Inc. | - | 63,095 | 2,974 | - | 58,747 |
PTC Therapeutics, Inc. | - | 49,842 | 2,122 | - | 55,466 |
Questcor Pharmaceuticals, Inc. | 227,969 | 63,691 | 288,609 | 435 | - |
Rackspace Hosting, Inc. | 284,725 | 184,655 | 59,998 | - | 293,484 |
Radware Ltd. | 49,088 | - | 52,959 | - | - |
Riverbed Technology, Inc. | 135,456 | 120,525 | 247,957 | - | - |
ServiceSource International, Inc. | 46,693 | - | 22,018 | - | - |
Synchronoss Technologies, Inc. | 127,202 | 52,327 | 44,740 | - | 165,112 |
Trulia, Inc. | 56,736 | 129,260 | 237,323 | - | - |
Ubisoft Entertainment SA | 145,537 | 7,099 | - | - | 169,602 |
Ubisoft Entertainment SA warrants 10/10/13 | 1,651 | 1,669 | - | - | - |
Total | $ 1,856,111 | $ 2,018,721 | $ 1,600,069 | $ 435 | $ 1,909,584 |
Other Information |
The following is a summary of the inputs used, as of July 31, 2014, involving the Fund's assets and liabilities carried at fair value. The inputs or methodology used for valuing securities may not be an indication of the risk associated with investing in those securities. For more information on valuation inputs, and their aggregation into the levels used in the table below, please refer to the Investment Valuation section in the accompanying Notes to Financial Statements. |
Valuation Inputs at Reporting Date: |
Description
(Amounts in thousands) | Total | Level 1 | Level 2 | Level 3 |
Investments in Securities: | | | | |
Equities: | | | | |
Consumer Discretionary | $ 1,656,374 | $ 1,608,674 | $ - | $ 47,700 |
Consumer Staples | 500,589 | 500,589 | - | - |
Energy | 36,966 | 36,966 | - | - |
Financials | 433,170 | 433,170 | - | - |
Health Care | 2,158,110 | 2,140,456 | 17,654 | - |
Industrials | 224,287 | 224,287 | - | - |
Information Technology | 5,607,448 | 5,548,773 | 12,844 | 45,831 |
Materials | 107,713 | 107,713 | - | - |
Telecommunication Services | 33,282 | 33,282 | - | - |
Money Market Funds | 472,725 | 472,725 | - | - |
Total Investments in Securities: | $ 11,230,664 | $ 11,106,635 | $ 30,498 | $ 93,531 |
See accompanying notes which are an integral part of the financial statements.
Annual Report
Statement of Assets and Liabilities
Amounts in thousands (except per-share amounts) | July 31, 2014 |
| | |
Assets | | |
Investment in securities, at value (including securities loaned of $448,530) - See accompanying schedule: Unaffiliated issuers (cost $6,627,849) | $ 8,848,355 | |
Fidelity Central Funds (cost $472,725) | 472,725 | |
Other affiliated issuers (cost $2,049,083) | 1,909,584 | |
Total Investments (cost $9,149,657) | | $ 11,230,664 |
Receivable for investments sold | | 291,984 |
Receivable for fund shares sold | | 8,612 |
Dividends receivable | | 598 |
Distributions receivable from Fidelity Central Funds | | 681 |
Receivable from investment adviser for expense reductions | | 2 |
Other receivables | | 291 |
Total assets | | 11,532,832 |
| | |
Liabilities | | |
Payable to custodian bank | $ 6,192 | |
Payable for investments purchased | 256,854 | |
Payable for fund shares redeemed | 15,149 | |
Accrued management fee | 4,505 | |
Other affiliated payables | 1,335 | |
Other payables and accrued expenses | 248 | |
Collateral on securities loaned, at value | 472,725 | |
Total liabilities | | 757,008 |
| | |
Net Assets | | $ 10,775,824 |
Net Assets consist of: | | |
Paid in capital | | $ 7,855,570 |
Accumulated net investment loss | | (142) |
Accumulated undistributed net realized gain (loss) on investments and foreign currency transactions | | 839,418 |
Net unrealized appreciation (depreciation) on investments and assets and liabilities in foreign currencies | | 2,080,978 |
Net Assets | | $ 10,775,824 |
See accompanying notes which are an integral part of the financial statements.
Annual Report
Statement of Assets and Liabilities - continued
Amounts in thousands (except per-share amounts) | July 31, 2014 |
| | |
OTC:
Net Asset Value, offering price and redemption price per share ($7,869,812 ÷ 96,883 shares) | | $ 81.23 |
| | |
Class K:
Net Asset Value, offering price and redemption price per share ($2,906,012 ÷ 35,455 shares) | | $ 81.96 |
See accompanying notes which are an integral part of the financial statements.
Annual Report
Financial Statements - continued
Statement of Operations
Amounts in thousands | Year ended July 31, 2014 |
| | |
Investment Income | | |
Dividends (including $435 earned from other affiliated issuers) | | $ 64,604 |
Income from Fidelity Central Funds (including $5,974 from security lending) | | 5,998 |
Total income | | 70,602 |
| | |
Expenses | | |
Management fee
Basic fee | $ 61,873 | |
Performance adjustment | (2,441) | |
Transfer agent fees | 14,091 | |
Accounting and security lending fees | 1,401 | |
Custodian fees and expenses | 267 | |
Independent trustees' compensation | 42 | |
Appreciation in deferred trustee compensation account | 1 | |
Registration fees | 260 | |
Audit | 72 | |
Legal | 46 | |
Interest | 16 | |
Miscellaneous | 75 | |
Total expenses before reductions | 75,703 | |
Expense reductions | (510) | 75,193 |
Net investment income (loss) | | (4,591) |
Realized and Unrealized Gain (Loss) Net realized gain (loss) on: | | |
Investment securities: | | |
Unaffiliated issuers | 1,453,613 | |
Other affiliated issuers | (13,710) | |
Foreign currency transactions | 9 | |
Total net realized gain (loss) | | 1,439,912 |
Change in net unrealized appreciation (depreciation) on: Investment securities | | 164,549 |
Net gain (loss) | | 1,604,461 |
Net increase (decrease) in net assets resulting from operations | | $ 1,599,870 |
See accompanying notes which are an integral part of the financial statements.
Annual Report
Statement of Changes in Net Assets
Amounts in thousands | Year ended
July 31,
2014 | Year ended
July 31,
2013 |
Increase (Decrease) in Net Assets | | |
Operations | | |
Net investment income (loss) | $ (4,591) | $ 43,443 |
Net realized gain (loss) | 1,439,912 | 1,100,950 |
Change in net unrealized appreciation (depreciation) | 164,549 | 1,322,673 |
Net increase (decrease) in net assets resulting
from operations | 1,599,870 | 2,467,066 |
Distributions to shareholders from net investment income | (7,143) | (33,821) |
Distributions to shareholders from net realized gain | (1,239,587) | - |
Total distributions | (1,246,730) | (33,821) |
Share transactions - net increase (decrease) | 1,469,555 | (622,836) |
Total increase (decrease) in net assets | 1,822,695 | 1,810,409 |
| | |
Net Assets | | |
Beginning of period | 8,953,129 | 7,142,720 |
End of period (including accumulated net investment loss of $142 and undistributed net investment income of $6,993, respectively) | $ 10,775,824 | $ 8,953,129 |
See accompanying notes which are an integral part of the financial statements.
Annual Report
Financial Highlights - OTC
Years ended July 31, | 2014 | 2013 | 2012 | 2011 | 2010 |
Selected Per-Share Data | | | | | |
Net asset value, beginning of period | $ 78.98 | $ 57.53 | $ 59.28 | $ 45.00 | $ 38.73 |
Income from Investment Operations | | | | | |
Net investment income (loss) B | (.06) | .36 E | (.08) F | (.27) | (.23) |
Net realized and unrealized gain (loss) | 12.78 | 21.37 | (1.67) | 14.55 | 6.50 |
Total from investment operations | 12.72 | 21.73 | (1.75) | 14.28 | 6.27 |
Distributions from net investment income | (.05) | (.28) | - | - | - |
Distributions from net realized gain | (10.42) | - | - | - | - |
Total distributions | (10.47) | (.28) | - | - | - |
Net asset value, end of period | $ 81.23 | $ 78.98 | $ 57.53 | $ 59.28 | $ 45.00 |
Total ReturnA | 17.96% | 37.93% | (2.95)% | 31.73% | 16.19% |
Ratios to Average Net Assets C, G | | | | | |
Expenses before reductions | .77% | .76% | .91% | .94% | 1.06% |
Expenses net of fee waivers, if any | .77% | .76% | .91% | .94% | 1.06% |
Expenses net of all reductions | .76% | .74% | .90% | .92% | 1.04% |
Net investment income (loss) | (.08)% | .55% E | (.14)% F | (.49)% | (.51)% |
Supplemental Data | | | | | |
Net assets, end of period (in millions) | $ 7,870 | $ 6,693 | $ 5,499 | $ 6,374 | $ 5,080 |
Portfolio turnover rateD | 106% | 116% | 149% | 158% | 163% |
A Total returns would have been lower if certain expenses had not been reduced during the applicable periods shown.
B Calculated based on average shares outstanding during the period.
C Fees and expenses of any underlying Fidelity Central Funds are not included in the Fund's expense ratio. The Fund indirectly bears its proportionate share of the expenses of any underlying Fidelity Central Funds.
D Amount does not include the portfolio activity of any underlying Fidelity Central Funds.
E Investment income per share reflects a large, non-recurring dividend which amounted to $.10 per share. Excluding this non-recurring dividend, the ratio of net investment income (loss) to average net assets would have been .40%.
F Investment income per share reflects a large, non-recurring dividend which amounted to $.03 per share. Excluding this non-recurring dividend, the ratio of net investment income (loss) to average net assets would have been (.20)%.
G Expense ratios reflect operating expenses of the class. Expenses before reductions do not reflect amounts reimbursed by the investment adviser or reductions from brokerage service arrangements or reductions from other expense offset arrangements and do not represent the amount paid by the class during periods when reimbursements or reductions occur. Expenses net of fee waivers reflect expenses after reimbursement by the investment adviser but prior to reductions from brokerage service arrangements or other expense offset arrangements. Expenses net of all reductions represent the net expenses paid by the class.
See accompanying notes which are an integral part of the financial statements.
Annual Report
Financial Highlights - Class K
Years ended July 31, | 2014 | 2013 | 2012 | 2011 | 2010 |
Selected Per-Share Data | | | | | |
Net asset value, beginning of period | $ 79.60 | $ 57.94 | $ 59.61 | $ 45.19 | $ 38.83 |
Income from Investment Operations | | | | | |
Net investment income (loss) B | .04 | .45 F | - G, I | (.19) | (.16) |
Net realized and unrealized gain (loss) | 12.87 | 21.53 | (1.67) | 14.61 | 6.52 |
Total from investment operations | 12.91 | 21.98 | (1.67) | 14.42 | 6.36 |
Distributions from net investment income | (.10) | (.32) | - | - | - |
Distributions from net realized gain | (10.46) | - | - | - | - |
Total distributions | (10.55) J | (.32) | - | - | - |
Net asset value, end of period | $ 81.96 | $ 79.60 | $ 57.94 | $ 59.61 | $ 45.19 |
Total ReturnA | 18.10% | 38.11% | (2.80)% | 31.91% | 16.38% |
Ratios to Average Net Assets C, H | | | | | |
Expenses before reductions | .65% | .62% | .77% | .80% | .90% |
Expenses net of fee waivers, if any | .65% | .62% | .77% | .80% | .90% |
Expenses net of all reductions | .64% | .60% | .76% | .78% | .88% |
Net investment income (loss) | .05% | .69% F | -% E, G | (.35)% | (.35)% |
Supplemental Data | | | | | |
Net assets, end of period (in millions) | $ 2,906 | $ 2,260 | $ 1,644 | $ 1,363 | $ 936 |
Portfolio turnover rateD | 106% | 116% | 149% | 158% | 163% |
A Total returns would have been lower if certain expenses had not been reduced during the applicable periods shown.
B Calculated based on average shares outstanding during the period.
C Fees and expenses of any underlying Fidelity Central Funds are not included in the Fund's expense ratio. The Fund indirectly bears its proportionate share of the expenses of any underlying Fidelity Central Funds.
D Amount does not include the portfolio activity of any underlying Fidelity Central Funds.
E Amount represents less than .01%.
F Investment income per share reflects a large, non-recurring dividend which amounted to $.10 per share. Excluding this non-recurring dividend, the ratio of net investment income (loss) to average net assets would have been .53%.
G Investment income per share reflects a large, non-recurring dividend which amounted to $.03 per share. Excluding this non-recurring dividend, the ratio of net investment income (loss) to average net assets would have been (.06)%.
H Expense ratios reflect operating expenses of the class. Expenses before reductions do not reflect amounts reimbursed by the investment adviser or reductions from brokerage service arrangements or reductions from other expense offset arrangements and do not represent the amount paid by the class during periods when reimbursements or reductions occur. Expenses net of fee waivers reflect expenses after reimbursement by the investment adviser but prior to reductions from brokerage service arrangements or other expense offset arrangements. Expenses net of all reductions represent the net expenses paid by the class.
I Amount represents less than $.01 per share.
J Total distributions of $10.55 per share is comprised of distributions from net investment income of $.098 and distributions from net realized gain of $10.456 per share.
See accompanying notes which are an integral part of the financial statements.
Annual Report
Notes to Financial Statements
For the period ended July 31, 2014
(Amounts in thousands except percentages)
1. Organization.
Fidelity OTC Portfolio (the Fund) is a non-diversified fund of Fidelity Securities Fund (the Trust) and is authorized to issue an unlimited number of shares. The Trust is registered under the Investment Company Act of 1940, as amended (the 1940 Act), as an open-end management investment company organized as a Massachusetts business trust. The Fund offers OTC and Class K shares, each of which has equal rights as to assets and voting privileges. Each class has exclusive voting rights with respect to matters that affect that class.
2. Investments in Fidelity Central Funds.
The Fund invests in Fidelity Central Funds, which are open-end investment companies generally available only to other investment companies and accounts managed by the investment adviser and its affiliates. The Fund's Schedule of Investments lists each of the Fidelity Central Funds held as of period end, if any, as an investment of the Fund, but does not include the underlying holdings of each Fidelity Central Fund. As an Investing Fund, the Fund indirectly bears its proportionate share of the expenses of the underlying Fidelity Central Funds.
The Money Market Central Funds seek preservation of capital and current income and are managed by Fidelity Investments Money Management, Inc. (FIMM), an affiliate of the investment adviser. Annualized expenses of the Money Market Central Funds as of their most recent shareholder report date are less than .01%.
A complete unaudited list of holdings for each Fidelity Central Fund is available upon request or at the Securities and Exchange Commission (the SEC) website at www.sec.gov. In addition, the financial statements of the Fidelity Central Funds, which are not covered by the Fund's Report of Independent Registered Public Accounting Firm, are available on the SEC website or upon request.
3. Significant Accounting Policies.
The financial statements have been prepared in conformity with accounting principles generally accepted in the United States of America (GAAP), which require management to make certain estimates and assumptions at the date of the financial statements. Actual results could differ from those estimates. Subsequent events, if any, through the date that the financial statements were issued have been evaluated in the preparation of the financial statements. The following summarizes the significant accounting policies of the Fund:
Investment Valuation. Investments are valued as of 4:00 p.m. Eastern time on the last calendar day of the period. In accordance with valuation policies and procedures approved by the Board of Trustees (the Board), the Fund attempts to obtain prices from
Annual Report
3. Significant Accounting Policies - continued
Investment Valuation - continued
one or more third party pricing vendors or brokers to value its investments. When current market prices, quotations or currency exchange rates are not readily available or reliable, investments will be fair valued in good faith by the Fidelity Management & Research Company (FMR) Fair Value Committee (the Committee), in accordance with procedures adopted by the Board. Factors used in determining fair value vary by investment type and may include market or investment specific events. The frequency with which these procedures are used cannot be predicted and they may be utilized to a significant extent. The Committee oversees the Fund's valuation policies and procedures and is responsible for approving and reporting to the Board all fair value determinations.
The Fund categorizes the inputs to valuation techniques used to value its investments into a disclosure hierarchy consisting of three levels as shown below:
Level 1 - quoted prices in active markets for identical investments
Level 2 - other significant observable inputs (including quoted prices for similar investments, interest rates, prepayment speeds, etc.)
Level 3 - unobservable inputs (including the Fund's own assumptions based on the best information available)
Valuation techniques used to value the Fund's investments by major category are as follows:
Equity securities, including restricted securities, for which market quotations are readily available, are valued at the last reported sale price or official closing price as reported by a third party pricing vendor on the primary market or exchange on which they are traded and are categorized as Level 1 in the hierarchy. In the event there were no sales during the day or closing prices are not available, securities are valued at the last quoted bid price or may be valued using the last available price and are generally categorized as Level 2 in the hierarchy. For foreign equity securities, when market or security specific events arise, comparisons to the valuation of American Depositary Receipts (ADRs), futures contracts, Exchange-Traded Funds (ETFs) and certain indexes as well as quoted prices for similar securities may be used and would be categorized as Level 2 in the hierarchy. Utilizing these techniques may result in transfers between Level 1 and Level 2. For equity securities, including restricted securities, where observable inputs are limited, assumptions about market activity and risk are used and these securities may be categorized as Level 3 in the hierarchy.
Investments in open-end mutual funds, including the Fidelity Central Funds, are valued at their closing net asset value (NAV) each business day and are categorized as Level 1 in the hierarchy.
Annual Report
Notes to Financial Statements - continued
(Amounts in thousands except percentages)
3. Significant Accounting Policies - continued
Investment Valuation - continued
Changes in valuation techniques may result in transfers in or out of an assigned level within the disclosure hierarchy. The aggregate value of investments by input level, as of July 31, 2014, is included at the end of the Fund's Schedule of Investments.
Foreign Currency. The Fund may use foreign currency contracts to facilitate transactions in foreign-denominated securities. Gains and losses from these transactions may arise from changes in the value of the foreign currency or if the counterparties do not perform under the contracts' terms.
Foreign-denominated assets, including investment securities, and liabilities are translated into U.S. dollars at the exchange rates at period end. Purchases and sales of investment securities, income and dividends received and expenses denominated in foreign currencies are translated into U.S. dollars at the exchange rate in effect on the transaction date.
The effects of exchange rate fluctuations on investments are included with the net realized and unrealized gain (loss) on investment securities. Other foreign currency transactions resulting in realized and unrealized gain (loss) are disclosed separately.
Investment Transactions and Income. For financial reporting purposes, the Fund's investment holdings and NAV include trades executed through the end of the last business day of the period. The NAV per share for processing shareholder transactions is calculated as of the close of business of the New York Stock Exchange (NYSE), normally 4:00 p.m. Eastern time and includes trades executed through the end of the prior business day. Gains and losses on securities sold are determined on the basis of identified cost and may include proceeds received from litigation. Dividend income is recorded on the ex-dividend date, except for certain dividends from foreign securities where the ex-dividend date may have passed, which are recorded as soon as the Fund is informed of the ex-dividend date. Non-cash dividends included in dividend income, if any, are recorded at the fair market value of the securities received. Income and capital gain distributions from Fidelity Central Funds, if any, are recorded on the ex-dividend date. Distributions received on securities that represent a return of capital or capital gain are recorded as a reduction of cost of investments and/or as a realized gain. Subsequent to ex-dividend date the Fund determines the components of these distributions, based upon receipt of tax filings or other correspondence relating to the underlying investment. Interest income is accrued as earned and includes coupon interest and amortization of premium and accretion of discount on debt securities as applicable. Investment income is recorded net of foreign taxes withheld where recovery of such taxes is uncertain.
Class Allocations and Expenses. Investment income, realized and unrealized capital gains and losses, common expenses of the Fund, and certain fund-level expense
Annual Report
3. Significant Accounting Policies - continued
Class Allocations and Expenses - continued
reductions, if any, are allocated daily on a pro-rata basis to each class based on the relative net assets of each class to the total net assets of the Fund. Each class differs with respect to transfer agent fees incurred. Certain expense reductions may also differ by class. For the reporting period, the allocated portion of income and expenses to each class as a percent of its average net assets may vary due to the timing of recording these transactions in relation to fluctuating net assets of the classes. Expenses directly attributable to a fund are charged to that fund. Expenses attributable to more than one fund are allocated among the respective funds on the basis of relative net assets or other appropriate methods. Expense estimates are accrued in the period to which they relate and adjustments are made when actual amounts are known.
Deferred Trustee Compensation. Under a Deferred Compensation Plan (the Plan), independent Trustees may elect to defer receipt of a portion of their annual compensation. Deferred amounts are invested in a cross-section of Fidelity funds, are marked-to-market and remain in the Fund until distributed in accordance with the Plan. The investment of deferred amounts and the offsetting payable to the Trustees are included in the accompanying Statement of Assets and Liabilities.
Income Tax Information and Distributions to Shareholders. Each year, the Fund intends to qualify as a regulated investment company under Subchapter M of the Internal Revenue Code, including distributing substantially all of its taxable income and realized gains. As a result, no provision for U.S. Federal income taxes is required. As of July 31, 2014, the Fund did not have any unrecognized tax benefits in the financial statements; nor is the Fund aware of any tax positions for which it is reasonably possible that the total amounts of unrecognized tax benefits will significantly change in the next twelve months. The Fund files a U.S. federal tax return, in addition to state and local tax returns as required. The Fund's federal income tax returns are subject to examination by the Internal Revenue Service (IRS) for a period of three fiscal years after they are filed. State and local tax returns may be subject to examination for an additional fiscal year depending on the jurisdiction. Foreign taxes are provided for based on the Fund's understanding of the tax rules and rates that exist in the foreign markets in which it invests.
Distributions are declared and recorded on the ex-dividend date. Income dividends and capital gain distributions are declared separately for each class. Income and capital gain distributions are determined in accordance with income tax regulations, which may differ from GAAP. In addition, the Fund claimed a portion of the payment made to redeeming shareholders as a distribution for income tax purposes.
Annual Report
Notes to Financial Statements - continued
(Amounts in thousands except percentages)
3. Significant Accounting Policies - continued
Income Tax Information and Distributions to Shareholders - continued
Capital accounts within the financial statements are adjusted for permanent book-tax differences. These adjustments have no impact on net assets or the results of operations.
Capital accounts are not adjusted for temporary book-tax differences which will reverse in a subsequent period.
Book-tax differences are primarily due to foreign currency transactions, partnerships, deferred trustees compensation and losses deferred due to wash sales.
The federal tax cost of investment securities and unrealized appreciation (depreciation) as of period end were as follows:
Gross unrealized appreciation | $ 2,680,914 |
Gross unrealized depreciation | (653,054) |
Net unrealized appreciation (depreciation) on securities | $ 2,027,860 |
| |
Tax Cost | $ 9,202,804 |
The tax-based components of distributable earnings as of period end were as follows:
Undistributed ordinary income | $ 439,889 |
Undistributed long-term capital gain | $ 452,675 |
Net unrealized appreciation (depreciation) on securities and other investments | $ 2,027,832 |
The tax character of distributions paid was as follows:
| July 31, 2014 | July 31, 2013 |
Ordinary Income | $ 324,481 | $ 33,821 |
Long-term Capital Gains | 922,249 | - |
Total | $ 1,246,730 | $ 33,821 |
Restricted Securities. The Fund may invest in securities that are subject to legal or contractual restrictions on resale. These securities generally may be resold in transactions exempt from registration or to the public if the securities are registered. Disposal of these securities may involve time-consuming negotiations and expense, and prompt sale at an acceptable price may be difficult. Information regarding restricted securities is included at the end of the Fund's Schedule of Investments.
4. Purchases and Sales of Investments.
Purchases and sales of securities, other than short-term securities, aggregated $11,070,426 and $10,811,193, respectively.
Annual Report
5. Fees and Other Transactions with Affiliates.
Management Fee. Fidelity Management & Research Company (the investment adviser) and its affiliates provide the Fund with investment management related services for which the Fund pays a monthly management fee. The management fee is the sum of an individual fund fee rate that is based on an annual rate of .35% of the Fund's average net assets and an annualized group fee rate that averaged .25% during the period. The group fee rate is based upon the average net assets of all the mutual funds advised by the investment adviser, including any mutual funds previously advised by the investment adviser that are currently advised by Fidelity SelectCo, LLC, an affiliate of the investment adviser. The group fee rate decreases as assets under management increase and increases as assets under management decrease. In addition, the management fee is subject to a performance adjustment (up to a maximum of ± .20% of the Fund's average net assets over a 36 month performance period). The upward or downward adjustment to the management fee is based on the relative investment performance of OTC as compared to its benchmark index, the Nasdaq Composite Index, over the same 36 month performance period. For the reporting period, the total annual management fee rate, including the performance adjustment, was .58% of the Fund's average net assets. The performance adjustment included in the management fee rate may be higher or lower than the maximum performance adjustment rate due to the difference between the average net assets for the reporting and performance periods.
Transfer Agent Fees. Fidelity Investments Institutional Operations Company, Inc., (FIIOC), an affiliate of the investment adviser, is the transfer, dividend disbursing and shareholder servicing agent for each class of the Fund. FIIOC receives account fees and asset-based fees that vary according to the account size and type of account of the shareholders of OTC. FIIOC receives an asset-based fee of Class K's average net assets. FIIOC pays for typesetting, printing and mailing of shareholder reports, except proxy statements.
For the period, transfer agent fees for each class were as follows:
| Amount | % of
Average
Net Assets |
OTC | $ 12,856 | .17 |
Class K | 1,235 | .05 |
| $ 14,091 | |
Accounting and Security Lending Fees. Fidelity Service Company, Inc. (FSC), an affiliate of the investment adviser, maintains the Fund's accounting records. The accounting fee is based on the level of average net assets for each month. Under a separate contract, FSC administers the security lending program. The security lending fee is based on the number and duration of lending transactions.
Annual Report
Notes to Financial Statements - continued
(Amounts in thousands except percentages)
5. Fees and Other Transactions with Affiliates - continued
Brokerage Commissions. The Fund placed a portion of its portfolio transactions with brokerage firms which are affiliates of the investment adviser. Brokerage commissions are included in net realized gain (loss) and change in net unrealized appreciation (depreciation) in the Statement of Operations. The commissions paid to these affiliated firms were $309 for the period.
Interfund Lending Program. Pursuant to an Exemptive Order issued by the SEC, the Fund, along with other registered investment companies having management contracts with FMR or other affiliated entities of FMR, may participate in an interfund lending program. This program provides an alternative credit facility allowing the funds to borrow from, or lend money to, other participating affiliated funds. At period end, there were no interfund loans outstanding. The Fund's activity in this program during the period for which loans were outstanding was as follows:
Borrower or Lender | Average Loan
Balance | Weighted Average
Interest Rate | Interest Expense |
Borrower | $ 16,820 | .32% | $ 12 |
Other. During the period, the investment adviser reimbursed the Fund for certain losses in the amount of $8.
6. Committed Line of Credit.
The Fund participates with other funds managed by the investment adviser or an affiliate in a $4.25 billion credit facility (the "line of credit") to be utilized for temporary or emergency purposes to fund shareholder redemptions or for other short-term liquidity purposes. The Fund has agreed to pay commitment fees on its pro-rata portion of the line of credit, which amounted to $17 and is reflected in Miscellaneous expenses on the Statement of Operations. During the period, the Fund did not borrow on this line of credit.
7. Security Lending.
The Fund lends portfolio securities through a lending agent from time to time in order to earn additional income. For equity securities, a lending agent is used and may loan securities to certain qualified borrowers, including Fidelity Capital Markets (FCM), a broker-dealer affiliated with the Fund. On the settlement date of the loan, the Fund receives collateral (in the form of U.S. Treasury obligations, letters of credit and/or cash) against the loaned securities and maintains collateral in an amount not less than 100% of the market value of the loaned securities during the period of the loan. The market value of the loaned securities is determined at the close of business of the Fund and any additional required collateral is delivered to the Fund on the next business day. If the
Annual Report
7. Security Lending - continued
borrower defaults on its obligation to return the securities loaned because of insolvency or other reasons, the Fund may apply collateral received from the borrower against the obligation. The Fund may experience delays and costs in recovering the securities loaned. Any cash collateral received is invested in the Fidelity Securities Lending Cash Central Fund. The value of loaned securities and cash collateral at period end are disclosed on the Fund's Statement of Assets and Liabilities. The value of securities loaned to FCM at period end was $4,206. Security lending income represents the income earned on investing cash collateral, less rebates paid to borrowers and any lending agent fees associated with the loan, plus any premium payments received for lending certain types of securities. Security lending income is presented in the Statement of Operations as a component of income from Fidelity Central Funds, and includes $354 from securities loaned to FCM.
8. Bank Borrowings.
The Fund is permitted to have bank borrowings for temporary or emergency purposes to fund shareholder redemptions or for other short-term liquidity requirements. The Fund has established borrowing arrangements with certain banks. The interest rate on the borrowings is the bank's base rate, as revised from time to time. The average loan balance during the period for which loans were outstanding amounted to $27,027. The weighted average interest rate was .58%. The interest expense amounted to $4 under the bank borrowing program. At period end, there were no bank borrowings outstanding.
9. Expense Reductions.
Commissions paid to certain brokers with whom the investment adviser, or its affiliates, places trades on behalf of the Fund include an amount in addition to trade execution, which may be rebated back to the Fund to offset certain expenses. This amount totaled $443 for the period.
In addition, the investment adviser reimbursed a portion of the Fund's operating expenses during the period in the amount of $67.
10. Distributions to Shareholders.
Distributions to shareholders of each class were as follows:
Years ended July 31, | 2014 | 2013 |
From net investment income | | |
OTC | $ 4,344 | $ 24,686 |
Class K | 2,799 | 9,135 |
Total | $ 7,143 | $ 33,821 |
Annual Report
Notes to Financial Statements - continued
(Amounts in thousands except percentages)
10. Distributions to Shareholders - continued
Years ended July 31, | 2014 | 2013 |
From net realized gain | | |
OTC | $ 926,740 | $ - |
Class K | 312,847 | - |
Total | $ 1,239,587 | $ - |
11. Share Transactions.
Transactions for each class of shares were as follows:
| Shares | Dollars |
Years ended July 31, | 2014 | 2013 | 2014 | 2013 |
OTC | | | | |
Shares sold | 26,717 | 13,349 | $ 2,114,409 | $ 888,988 |
Reinvestment of distributions | 12,308 | 400 | 905,081 | 23,934 |
Shares redeemed | (26,885) | (24,580) | (2,095,020) | (1,536,509) |
Net increase (decrease) | 12,140 | (10,831) | $ 924,470 | $ (623,587) |
Class K | | | | |
Shares sold | 11,495 | 8,116 | $ 915,992 | $ 517,177 |
Reinvestment of distributions | 4,258 | 152 | 315,646 | 9,135 |
Shares redeemed | (8,692) | (8,251) | (686,553) | (525,561) |
Net increase (decrease) | 7,061 | 17 | $ 545,085 | $ 751 |
12. Other.
The Fund's organizational documents provide former and current trustees and officers with a limited indemnification against liabilities arising in connection with the performance of their duties to the Fund. In the normal course of business, the Fund may also enter into contracts that provide general indemnifications. The Fund's maximum exposure under these arrangements is unknown as this would be dependent on future claims that may be made against the Fund. The risk of material loss from such claims is considered remote.
Annual Report
To the Trustees of Fidelity Securities Fund and Shareholders of Fidelity OTC Portfolio:
We have audited the accompanying statement of assets and liabilities of Fidelity OTC Portfolio (the Fund), a fund of Fidelity Securities Fund, including the schedule of investments, as of July 31, 2014, and the related statement of operations for the year then ended, the statement of changes in net assets for each of the two years in the period then ended, and the financial highlights for each of the five years in the period then ended. These financial statements and financial highlights are the responsibility of the Fund's management. Our responsibility is to express an opinion on these financial statements and financial highlights based on our audits.
We conducted our audits in accordance with the standards of the Public Company Accounting Oversight Board (United States). Those standards require that we plan and perform the audit to obtain reasonable assurance about whether the financial statements and financial highlights are free of material misstatement. The Fund is not required to have, nor were we engaged to perform, an audit of its internal control over financial reporting. Our audits included consideration of internal control over financial reporting as a basis for designing audit procedures that are appropriate in the circumstances, but not for the purpose of expressing an opinion on the effectiveness of the Fund's internal control over financial reporting. Accordingly, we express no such opinion. An audit also includes examining, on a test basis, evidence supporting the amounts and disclosures in the financial statements, assessing the accounting principles used and significant estimates made by management, as well as evaluating the overall financial statement presentation. Our procedures included confirmation of securities owned as of July 31, 2014, by correspondence with the custodians and brokers; where replies were not received from brokers, we performed other auditing procedures. We believe that our audits provide a reasonable basis for our opinion.
In our opinion, the financial statements and financial highlights referred to above present fairly, in all material respects, the financial position of Fidelity OTC Portfolio as of July 31, 2014, the results of its operations for the year then ended, the changes in its net assets for each of the two years in the period then ended, and the financial highlights for each of the five years in the period then ended, in conformity with accounting principles generally accepted in the United States of America.
DELOITTE & TOUCHE LLP
Boston, Massachusetts
September 15, 2014
Annual Report
The Trustees, Member of the Advisory Board, and officers of the trust and fund, as applicable, are listed below. The Board of Trustees governs the fund and is responsible for protecting the interests of shareholders. The Trustees are experienced executives who meet periodically throughout the year to oversee the fund's activities, review contractual arrangements with companies that provide services to the fund, oversee management of the risks associated with such activities and contractual arrangements, and review the fund's performance. Except for James C. Curvey, each of the Trustees oversees 173 funds. Mr. Curvey oversees 397 funds.
The Trustees hold office without limit in time except that (a) any Trustee may resign; (b) any Trustee may be removed by written instrument, signed by at least two-thirds of the number of Trustees prior to such removal; (c) any Trustee who requests to be retired or who has become incapacitated by illness or injury may be retired by written instrument signed by a majority of the other Trustees; and (d) any Trustee may be removed at any special meeting of shareholders by a two-thirds vote of the outstanding voting securities of the trust. Each Trustee who is not an interested person (as defined in the 1940 Act) of the trust and the fund (Independent Trustee), shall retire not later than the last day of the calendar year in which his or her 75th birthday occurs. The Independent Trustees may waive this mandatory retirement age policy with respect to individual Trustees. The officers and Advisory Board Member hold office without limit in time, except that any officer and Advisory Board Member may resign or may be removed by a vote of a majority of the Trustees at any regular meeting or any special meeting of the Trustees. Except as indicated, each individual has held the office shown or other offices in the same company for the past five years.
Experience, Skills, Attributes, and Qualifications of the Fund's Trustees. The Governance and Nominating Committee has adopted a statement of policy that describes the experience, qualifications, attributes, and skills that are necessary and desirable for potential Independent Trustee candidates (Statement of Policy). The Board believes that each Trustee satisfied at the time he or she was initially elected or appointed a Trustee, and continues to satisfy, the standards contemplated by the Statement of Policy. The Governance and Nominating Committee also engages professional search firms to help identify potential Independent Trustee candidates who have the experience, qualifications, attributes, and skills consistent with the Statement of Policy. From time to time, additional criteria based on the composition and skills of the current Independent Trustees, as well as experience or skills that may be appropriate in light of future changes to board composition, business conditions, and regulatory or other developments, have also been considered by the professional search firms and the Governance and Nominating Committee. In addition, the Board takes into account the Trustees' commitment and participation in Board and committee meetings, as well as their leadership of standing and ad hoc committees throughout their tenure.
In determining that a particular Trustee was and continues to be qualified to serve as a Trustee, the Board has considered a variety of criteria, none of which, in isolation, was controlling. The Board believes that, collectively, the Trustees have balanced and diverse experience, qualifications, attributes, and skills, which allow the Board to operate effectively in governing the fund and protecting the interests of shareholders. Information about the specific experience, skills, attributes, and qualifications of each Trustee, which in each case led to the Board's conclusion that the Trustee should serve (or continue to serve) as a trustee of the fund, is provided below.
Annual Report
Trustees and Officers - continued
Board Structure and Oversight Function. James C. Curvey is an interested person (as defined in the 1940 Act) and currently serves as Chairman. The Trustees have determined that an interested Chairman is appropriate and benefits shareholders because an interested Chairman has a personal and professional stake in the quality and continuity of services provided to the fund. Independent Trustees exercise their informed business judgment to appoint an individual of their choosing to serve as Chairman, regardless of whether the Trustee happens to be independent or a member of management. The Independent Trustees have determined that they can act independently and effectively without having an Independent Trustee serve as Chairman and that a key structural component for assuring that they are in a position to do so is for the Independent Trustees to constitute a substantial majority for the Board. The Independent Trustees also regularly meet in executive session. Ned C. Lautenbach serves as Chairman of the Independent Trustees and as such (i) acts as a liaison between the Independent Trustees and management with respect to matters important to the Independent Trustees and (ii) with management prepares agendas for Board meetings.
Fidelity funds are overseen by different Boards of Trustees. The fund's Board oversees Fidelity's equity and high income funds and another Board oversees Fidelity's investment-grade bond, money market, and asset allocation funds. The asset allocation funds may invest in Fidelity funds overseen by the fund's Board. The use of separate Boards, each with its own committee structure, allows the Trustees of each group of Fidelity funds to focus on the unique issues of the funds they oversee, including common research, investment, and operational issues. On occasion, the separate Boards establish joint committees to address issues of overlapping consequences for the Fidelity funds overseen by each Board.
The Trustees operate using a system of committees to facilitate the timely and efficient consideration of all matters of importance to the Trustees, the fund, and fund shareholders and to facilitate compliance with legal and regulatory requirements and oversight of the fund's activities and associated risks. The Board, acting through its committees, has charged FMR and its affiliates with (i) identifying events or circumstances the occurrence of which could have demonstrably adverse effects on the fund's business and/or reputation; (ii) implementing processes and controls to lessen the possibility that such events or circumstances occur or to mitigate the effects of such events or circumstances if they do occur; and (iii) creating and maintaining a system designed to evaluate continuously business and market conditions in order to facilitate the identification and implementation processes described in (i) and (ii) above. Because the day-to-day operations and activities of the fund are carried out by or through FMR, its affiliates and other service providers, the fund's exposure to risks is mitigated but not eliminated by the processes overseen by the Trustees. While each of the Board's committees has responsibility for overseeing different aspects of the fund's activities, oversight is exercised primarily through the Operations, Audit, and Compliance Committees. In addition, the Independent Trustees have worked with FMR to enhance the Board's oversight of investment and financial risks, legal and regulatory risks, technology risks, and operational risks, including the development of additional risk reporting to the Board. For example, a working group comprised of Independent Trustees and FMR has worked and continues to work to review the Fidelity funds' valuation-related activities, reporting and risk management. Appropriate personnel, including but not limited to the fund's Chief Compliance Officer (CCO), FMR's internal auditor, the independent accountants, the fund's Treasurer and portfolio management personnel, make periodic reports to the Board's committees, as appropriate, including an annual review of FMR's risk management program for the Fidelity funds. The responsibilities of each standing committee, including their oversight responsibilities, are described further under "Standing Committees of the Fund's Trustees."
Annual Report
The fund's Statement of Additional Information (SAI) includes more information about the Trustees. To request a free copy, call Fidelity at 1-800-544-8544.
Interested Trustees*:
Correspondence intended for each Trustee who is an interested person may be sent to Fidelity Investments, 245 Summer Street, Boston, Massachusetts 02210.
Name, Year of Birth; Principal Occupations and Other Relevant Experience+ |
James C. Curvey (1935) |
Year of Election or Appointment: 2007 Trustee Chairman of the Board of Trustees |
| Mr. Curvey also serves as Trustee of other Fidelity funds. Mr. Curvey is a Director of Fidelity Research & Analysis Co. (2009-present), and Vice Chairman (2007-present) and Director of FMR LLC. In addition, Mr. Curvey serves as an Overseer for the Boston Symphony Orchestra and a member of the Trustees of Villanova University. Previously, Mr. Curvey served as a Director of Fidelity Investments Money Management, Inc. (2009-2014), a Director of FMR (2007-2014), a Director of FMR Co., Inc. (2007-2014) and was the Vice Chairman (2006-2007) and Director (2000-2007) of FMR Corp. |
Charles S. Morrison (1960) |
Year of Election or Appointment: 2014 Trustee |
| Mr. Morrison also serves as Trustee of other funds. He serves as President, Asset Management (2014-present) and is an employee of Fidelity Investments. Previously, Mr. Morrison served as Vice President of Fidelity's Fixed Income and Asset Allocation Funds (2012-2014), President, Fixed Income (2011-2014), Vice President of Fidelity's Money Market Funds (2005-2009), President, Money Market Group Leader of FMR (2009), and Senior Vice President, Money Market Group of FMR (2004-2009). Mr. Morrison also served as Vice President of Fidelity's Bond Funds (2002-2005), certain Balanced Funds (2002-2005), and certain Asset Allocation Funds (2002-2007), and as Senior Vice President (2002-2005) of Fidelity's Bond Division. |
* Trustees have been determined to be "Interested Trustees" by virtue of, among other things, their affiliation with the trust or various entities under common control with FMR.
+ The information above includes each Trustee's principal occupation during the last five years and other information relating to the experience, attributes, and skills relevant to each Trustee's qualifications to serve as a Trustee, which led to the conclusion that each Trustee should serve as a Trustee for the fund.
Annual Report
Independent Trustees:
Correspondence intended for each Independent Trustee (that is, the Trustees other than the Interested Trustees) may be sent to Fidelity Investments, P.O. Box 55235, Boston, Massachusetts 02205-5235.
Name, Year of Birth; Principal Occupations and Other Relevant Experience+ |
Dennis J. Dirks (1948) |
Year of Election or Appointment: 2005 Trustee |
| Mr. Dirks also serves as Trustee of other Fidelity funds. Prior to his retirement in May 2003, Mr. Dirks was Chief Operating Officer and a member of the Board of The Depository Trust & Clearing Corporation (DTCC). He also served as President, Chief Operating Officer, and Board member of The Depository Trust Company (DTC) and President and Board member of the National Securities Clearing Corporation (NSCC). In addition, Mr. Dirks served as Chief Executive Officer and Board member of the Government Securities Clearing Corporation, Chief Executive Officer and Board member of the Mortgage-Backed Securities Clearing Corporation, as a Trustee and a member of the Finance Committee of Manhattan College (2005-2008), and as a Trustee and a member of the Finance Committee of AHRC of Nassau County (2006-2008). Mr. Dirks is a member of the Independent Directors Council (IDC) Governing Council (2010-present) and Board of Directors for The Brookville Center for Children's Services, Inc. (2009-present). |
Alan J. Lacy (1953) |
Year of Election or Appointment: 2008 Trustee |
| Mr. Lacy also serves as Trustee of other Fidelity funds. Mr. Lacy serves as Senior Adviser (2007-present) of Oak Hill Capital Partners, L.P. (private equity). Mr. Lacy also served as Chief Executive Officer (2000-2005) and Vice Chairman (2005-2006) of Sears Holdings Corporation and Sears, Roebuck and Co. (retail). In addition, Mr. Lacy serves as a member of the Board of Directors of Dave & Buster's Entertainment, Inc. (restaurant and entertainment complexes, 2010-present), Earth Fare, Inc. (retail grocery, 2012-present), The Hillman Companies, Inc. (hardware wholesalers, 2010-present), and Bristol-Myers Squibb Company (global pharmaceuticals, 2008-present). Mr. Lacy is a member of the Board of Trustees of The National Parks Conservation Association (2006-present). Previously, Mr. Lacy served as Chairman of the Board of Trustees of the National Parks Conservation Association (2008-2011) and as a member of the Board of Directors for the Western Union Company (global money transfer, 2006-2011). |
Ned C. Lautenbach (1944) |
Year of Election or Appointment: 2000 Trustee Chairman of the Independent Trustees |
| Mr. Lautenbach also serves as Trustee of other Fidelity funds. Mr. Lautenbach currently serves as the Lead Director of the Eaton Corporation Board of Directors (diversified industrial, 1997-present). Mr. Lautenbach is Chairman of the Board of Directors of the Philharmonic Center for the Arts in Naples, Florida (2012-present) and a member of the Council on Foreign Relations (1994-present). Previously, Mr. Lautenbach was a Partner/Advisory Partner at Clayton, Dubilier & Rice, LLC (private equity investment, 1998-2010), as well as a Director of Sony Corporation (2006-2007). |
Joseph Mauriello (1944) |
Year of Election or Appointment: 2008 Trustee |
| Mr. Mauriello also serves as Trustee of other Fidelity funds. Prior to his retirement in January 2006, Mr. Mauriello served in numerous senior management positions including Deputy Chairman and Chief Operating Officer (2004-2005), and Vice Chairman of Financial Services (2002-2004) of KPMG LLP US (professional services, 1965-2005). Mr. Mauriello currently serves as a member of the Board of Directors of XL Group plc. (global insurance and re-insurance, 2006-present). Previously, Mr. Mauriello served as a Director of the Hamilton Funds of the Bank of New York (2006-2007) and of Arcadia Resources Inc. (health care services and products, 2007-2012). |
Robert W. Selander (1950) |
Year of Election or Appointment: 2011 Trustee |
| Mr. Selander also serves as Trustee of other Fidelity funds. Previously, Mr. Selander served as a Member of the Advisory Board of other Fidelity funds (2011), and Executive Vice Chairman (2010), Chief Executive Officer (2009-2010), and President and Chief Executive Officer (1997-2009) of Mastercard, Inc. |
Cornelia M. Small (1944) |
Year of Election or Appointment: 2005 Trustee |
| Ms. Small also serves as Trustee of other Fidelity funds. Ms. Small is a member of the Board of Directors (2009-present) and Chair of the Investment Committee (2010-present) of the Teagle Foundation. Ms. Small also serves on the Investment Committee of the Berkshire Taconic Community Foundation (2008-present). Previously, Ms. Small served as Chairperson (2002-2008) and a member of the Investment Committee and Chairperson (2008-2012) and a member of the Board of Trustees of Smith College. In addition, Ms. Small served as Chief Investment Officer, Director of Global Equity Investments, and a member of the Board of Directors of Scudder, Stevens & Clark and Scudder Kemper Investments. |
William S. Stavropoulos (1939) |
Year of Election or Appointment: 2002 Trustee Vice Chairman of the Independent Trustees |
| Mr. Stavropoulos also serves as Trustee of other Fidelity funds. Mr. Stavropoulos serves as President and Founder of the Michigan Baseball Foundation, the Great Lakes Loons (2007-present). Mr. Stavropoulos is Chairman Emeritus of the Board of Directors of The Dow Chemical Company, where he previously served in numerous senior management positions, including President, CEO (1995-2000; 2002-2004), Chairman of the Executive Committee (2000-2006), and as a member of the Board of Directors (1990-2006). Currently, Mr. Stavropoulos is Chairman of the Board of Directors of Univar Inc. (global distributor of commodity and specialty chemicals), a Director of Teradata Corporation (data warehousing and technology solutions), and Maersk Inc. (industrial conglomerate), and a member of the Advisory Board for Metalmark Capital LLC (private equity investment, 2005-present). Mr. Stavropoulos is an operating advisor to Clayton, Dubilier & Rice, LLC (private equity investment). In addition, Mr. Stavropoulos is a member of the University of Notre Dame Advisory Council for the College of Science, a Trustee of the Rollin L. Gerstacker Foundation, and a Director of the Naples Philharmonic Center for the Arts. Previously, Mr. Stavropoulos served as a Director of Chemical Financial Corporation (bank holding company, 1993-2012) and Tyco International, Ltd. (multinational manufacturing and services, 2007-2012). |
David M. Thomas (1949) |
Year of Election or Appointment: 2008 Trustee |
| Mr. Thomas also serves as Trustee of other Fidelity funds. Mr. Thomas serves as Non-Executive Chairman of the Board of Directors of Fortune Brands Home and Security (home and security products, 2011-present), and as a member of the Board of Directors of Interpublic Group of Companies, Inc. (marketing communication, 2004-present). Previously, Mr. Thomas served as Executive Chairman (2005-2006) and Chairman and Chief Executive Officer (2000-2005) of IMS Health, Inc. (pharmaceutical and healthcare information solutions), and a Director of Fortune Brands, Inc. (consumer products, 2000-2011). |
+ The information above includes each Trustee's principal occupation during the last five years and other information relating to the experience, attributes, and skills relevant to each Trustee's qualifications to serve as a Trustee, which led to the conclusion that each Trustee should serve as a Trustee for the fund.
Advisory Board Member and Officers:
Correspondence intended for each officer and Peter S. Lynch may be sent to Fidelity Investments, 245 Summer Street, Boston, Massachusetts 02210. Officers appear below in alphabetical order.
Name, Year of Birth; Principal Occupation |
Peter S. Lynch (1944) |
Year of Election or Appointment: 2003 Member of the Advisory Board |
| Mr. Lynch also serves as Member of the Advisory Board of other Fidelity funds. Mr. Lynch is Vice Chairman and a Director of FMR and FMR Co., Inc. In addition, Mr. Lynch serves as a Trustee of Boston College and as the Chairman of the Inner-City Scholarship Fund. Previously, Mr. Lynch served on the Special Olympics International Board of Directors (1997-2006). |
Elizabeth Paige Baumann (1968) |
Year of Election or Appointment: 2012 Anti-Money Laundering (AML) Officer |
| Ms. Baumann also serves as AML Officer of other funds. She is Chief AML Officer of FMR LLC (2012-present) and is an employee of Fidelity Investments. Previously, Ms. Baumann served as Vice President and Deputy Anti-Money Laundering Officer (2007-2012). |
William C. Coffey (1969) |
Year of Election or Appointment: 2009 Assistant Secretary |
| Mr. Coffey also serves as Assistant Secretary of other funds. He is Senior Vice President and Deputy General Counsel of FMR LLC (2010-present), and is an employee of Fidelity Investments. Previously, Mr. Coffey served as Vice President and Associate General Counsel of FMR LLC (2005-2009). |
Jonathan Davis (1968) |
Year of Election or Appointment: 2010 Assistant Treasurer |
| Mr. Davis also serves as Assistant Treasurer of other funds. Mr. Davis is an employee of Fidelity Investments. Previously, Mr. Davis served as Vice President and Associate General Counsel of FMR LLC (2003-2010). |
Adrien E. Deberghes (1967) |
Year of Election or Appointment: 2008 Deputy Treasurer |
| Mr. Deberghes also serves as an officer of other funds. He is an employee of Fidelity Investments (2008-present). Prior to joining Fidelity Investments, Mr. Deberghes was Senior Vice President of Mutual Fund Administration at State Street Corporation (2007-2008), Senior Director of Mutual Fund Administration at Investors Bank & Trust (2005-2007), and Director of Finance for Dunkin' Brands (2000-2005). |
Stephanie J. Dorsey (1969) |
Year of Election or Appointment: 2010 Assistant Treasurer |
| Ms. Dorsey also serves as an officer of other funds. She is an employee of Fidelity Investments (2008-present) and has served in other fund officer roles. Prior to joining Fidelity Investments, Ms. Dorsey served as Treasurer (2004-2008) of the JPMorgan Mutual Funds and Vice President (2004-2008) of JPMorgan Chase Bank. |
Howard J. Galligan III (1966) |
Year of Election or Appointment: 2014 Chief Financial Officer |
| Mr. Galligan also serves as Chief Financial Officer of other funds. Mr. Galligan serves as President of Fidelity Pricing and Cash Management Services (FPCMS) (2014-present) and as a Director of Strategic Advisers, Inc. (2008-present). Previously, Mr. Galligan served as Chief Administrative Officer of Asset Management (2011-2014) and Chief Operating Officer and Senior Vice President of Investment Support for Strategic Advisers, Inc. (2003-2011). |
Scott C. Goebel (1968) |
Year of Election or Appointment: 2008 Secretary and Chief Legal Officer (CLO) |
| Mr. Goebel serves as Secretary and CLO of other funds. Mr. Goebel also serves as Secretary of Fidelity SelectCo, LLC (2013-present), Fidelity Investments Money Management, Inc. (FIMM) (2010-present) and Fidelity Research and Analysis Company (FRAC) (2010-present); General Counsel, Secretary, and Senior Vice President of FMR (2008-present) and FMR Co., Inc. (2008-present); Chief Legal Officer of Fidelity Management & Research (Hong Kong) Limited (2008-present); and Assistant Secretary of Fidelity Management & Research (Japan) Inc. (2008-present) and Fidelity Management & Research (U.K.) Inc. (2008-present). Previously, Mr. Goebel served as Secretary and CLO of other Fidelity funds (2008-2013), Assistant Secretary of FIMM (2008-2010), FRAC (2008-2010), and certain funds (2007-2008); and as Vice President and Secretary of Fidelity Distributors Corporation (FDC) (2005-2007). Mr. Goebel has been employed by FMR LLC or an affiliate since 2001. |
Brian B. Hogan (1964) |
Year of Election or Appointment: 2009 Vice President |
| Mr. Hogan also serves as Trustee or Vice President of other funds. Mr. Hogan serves as President of FMR's Equity Division (2009-present). Previously, Mr. Hogan served as Senior Vice President, Equity Research of FMR (2006-2009) and as a portfolio manager. |
Chris Maher (1972) |
Year of Election or Appointment: 2013 Assistant Treasurer |
| Mr. Maher serves as Assistant Treasurer of other funds. Mr. Maher is Vice President of Valuation Oversight and is an employee of Fidelity Investments. Previously, Mr. Maher served as Vice President of Asset Management Compliance (2013), Vice President of FMR's Program Management Group (2010-2013), and Vice President of Valuation Oversight (2008-2010). |
Melissa M. Reilly (1971) |
Year of Election or Appointment: 2014 Vice President of certain Equity Funds |
| Ms. Reilly also serves as Vice President of other funds. Ms. Reilly is an employee of Fidelity Investments (2004-present). |
Kenneth B. Robins (1969) |
Year of Election or Appointment: 2008 President and Treasurer |
| Mr. Robins also serves as an officer of other funds. Mr. Robins serves as Executive Vice President of Fidelity Investments Money Management, Inc. (FIMM) (2013-present) and is an employee of Fidelity Investments (2004-present). Previously, Mr. Robins served in other fund officer roles. |
Stephen Sadoski (1971) |
Year of Election or Appointment: 2012 Deputy Treasurer |
| Mr. Sadoski also serves as Deputy Treasurer of other funds. He is an employee of Fidelity Investments (2012-present) and has served in another fund officer role. Prior to joining Fidelity Investments, Mr. Sadoski served as an assistant chief accountant in the Division of Investment Management of the Securities and Exchange Commission (SEC) (2009-2012) and as a senior manager at Deloitte & Touche LLP (1997-2009). |
Stacie M. Smith (1974) |
Year of Election or Appointment: 2013 Deputy Treasurer |
| Ms. Smith also serves as an officer of other funds. She is an employee of Fidelity Investments (2009-present) and has served in other fund officer roles. Prior to joining Fidelity Investments, Ms. Smith served as Senior Audit Manager of Ernst & Young LLP (1996-2009). |
Renee Stagnone (1975) |
Year of Election or Appointment: 2013 Deputy Treasurer |
| Ms. Stagnone also serves as Deputy Treasurer of other funds. Ms. Stagnone is an employee of Fidelity Investments. |
Linda J. Wondrack (1964) |
Year of Election or Appointment: 2014 Chief Compliance Officer |
| Ms. Wondrack also serves as Chief Compliance Officer of other funds. Ms. Wondrack is Executive Vice President and head of the Ethics Office and Asset Management Compliance for Fidelity Investments (2012-present). Ms. Wondrack also serves as Chief Compliance Officer of Fidelity SelectCo, LLC (2014-present); Chief Compliance Officer of Impresa Management LLC (2013-present); and Chief Compliance Officer of FMR Co., Inc., Fidelity Investments Money Management, Inc., Fidelity Management & Research (Japan) Inc., Fidelity Management & Research (U.K.) Inc., Fidelity Management & Research (Hong Kong), Fidelity Management & Research Company, Pyramis Global Advisors, LLC, and Strategic Advisers, Inc., Ballyrock Investment Advisors LLC, and Northern Neck Investors LLC (2012-present). Previously, Ms. Wondrack served as Senior Vice President and Chief Compliance Officer for Columbia Management Investment Advisers, LLC (2005-2012); Chief Compliance Officer for certain funds within the Columbia Family of Funds (2007-2012); and Senior Vice President of Compliance Risk Management at Bank of America (2005-2010). |
Joseph F. Zambello (1957) |
Year of Election or Appointment: 2011 Deputy Treasurer |
| Mr. Zambello also serves as Deputy Treasurer of other funds. Mr. Zambello is an employee of Fidelity Investments. Previously, Mr. Zambello served as Vice President of FMR's Program Management Group (2009-2011) and Vice President of the Transfer Agent Oversight Group (2005-2009). |
Annual Report
The Board of Trustees of Fidelity OTC Portfolio voted to pay to shareholders of record at the opening of business on record date, the following distributions per share derived from capital gains realized from sales of portfolio securities:
| Pay Date | Record Date | Capital Gains |
OTC Portfolio | 09/08/14 | 09/05/14 | $6.748 |
The fund hereby designates as a capital gain dividend with respect to the taxable year ended July 31, 2014, $735,186,538 or, if subsequently determined to be different, the net capital gain of such year.
OTC Portfolio designates 19% and 15% of the dividends distributed in September and December, respectively during the fiscal year as qualifying for the dividends-received deduction for corporate shareholders.
OTC Portfolio designates 20% and 15% of the dividends distributed in September and December, respectively during the fiscal year as amounts which can be taken into account as a dividend for the purposes of the maximum rate under section 1(h)(11) of the Internal Revenue Code.
The fund will notify shareholders in January 2015 of amounts for use in preparing 2014 income tax returns.
Annual Report
Board Approval of Investment Advisory Contracts and Management Fees
Fidelity OTC Portfolio
Each year, the Board of Trustees, including the Independent Trustees (together, the Board), votes on the renewal of the management contract with Fidelity Management & Research Company (FMR) and the sub-advisory agreements (together, the Advisory Contracts) for the fund. The Board, assisted by the advice of fund counsel and Independent Trustees' counsel, requests and considers a broad range of information relevant to the renewal of the Advisory Contracts throughout the year.
The Board meets regularly and, at each of its meetings, covers an extensive agenda of topics and materials and considers factors that are relevant to its annual consideration of the renewal of the fund's Advisory Contracts, including the services and support provided to the fund and its shareholders. The Board has established various standing committees (Committees), each composed of and chaired by Independent Trustees with varying backgrounds, to which the Board has assigned specific subject matter responsibilities in order to enhance effective decision-making by the Board. The Board, acting directly and through its Committees, requests and receives information concerning the annual consideration of the renewal of the fund's Advisory Contracts. The Board also meets as needed to consider matters specifically related to the Board's annual consideration of the renewal of the Advisory Contracts. Members of the Board may also meet with trustees of other Fidelity funds through ad hoc joint committees to discuss certain matters relevant to the Fidelity funds.
At its July 2014 meeting, the Board, including the Independent Trustees, unanimously determined to renew the fund's Advisory Contracts. In reaching its determination, the Board considered all factors it believed relevant, including (i) the nature, extent, and quality of the services to be provided to the fund and its shareholders (including the investment performance of the fund); (ii) the competitiveness of the fund's management fee and total expense ratio relative to peer funds; (iii) the total costs of the services to be provided by and the profits to be realized by Fidelity from its relationship with the fund; (iv) the extent to which economies of scale exist and would be realized as the fund grows; and (v) whether fee levels reflect these economies of scale, if any, for the benefit of fund shareholders. In connection with separate internal corporate reorganizations involving Fidelity Management & Research (U.K.) Inc. (FMR U.K.) and Fidelity Management & Research (Japan) Inc. (FMR Japan), the Board approved certain non-material amendments to the fund's sub-advisory agreements with FMR U.K. and FMR Japan to reflect that, after these reorganizations, FMR Investment Management (UK) Limited and Fidelity Management & Research (Japan) Limited will carry on the business of FMR U.K. and FMR Japan, respectively. The Board noted that no changes to the portfolio managers or to the foreign research or investment advisory services provided to the fund were expected in connection with either reorganization and that the same personnel and resources would continue to be available to the fund at the new entities.
Annual Report
In considering whether to renew the Advisory Contracts for the fund, the Board reached a determination, with the assistance of fund counsel and Independent Trustees' counsel and through the exercise of its business judgment, that the renewal of the Advisory Contracts was in the best interests of the fund and its shareholders and that the compensation payable under the Advisory Contracts was fair and reasonable. The Board's decision to renew the Advisory Contracts was not based on any single factor, but rather was based on a comprehensive consideration of all the information provided to the Board at its meetings throughout the year. The Board, in reaching its determination to renew the Advisory Contracts, was aware that shareholders of the fund have a broad range of investment choices available to them, including a wide choice among funds offered by Fidelity's competitors, and that the fund's shareholders, who have the opportunity to review and weigh the disclosure provided by the fund in its prospectus and other public disclosures, have chosen to invest in this fund, which is part of the Fidelity family of funds.
Nature, Extent, and Quality of Services Provided. The Board considered Fidelity's staffing as it relates to the fund, including the backgrounds of investment personnel of FMR and the sub-advisers (together, the Investment Advisers), and also considered the fund's investment objective, strategies, and related investment philosophy. The Independent Trustees also had discussions with senior management of Fidelity's investment operations and investment groups. The Board considered the structure of the portfolio manager compensation program and whether this structure provides appropriate incentives to act in the best interests of the fund. Additionally, the Board considered the portfolio managers' investments, if any, in the funds that they manage.
Resources Dedicated to Investment Management and Support Services. The Board and the Fund Oversight and Research Committees reviewed the general qualifications and capabilities of Fidelity's investment staff, including its size, education, experience, and resources, as well as Fidelity's approach to recruiting, training, managing, and compensating investment personnel. The Board noted that Fidelity has continued to increase the resources devoted to non-U.S. offices, including expansion of Fidelity's global investment organization. The Board also noted that Fidelity's analysts have extensive resources, tools and capabilities that allow them to conduct sophisticated quantitative and fundamental analysis, as well as credit analysis of issuers, counterparties and guarantors. Further, the Board believes that Fidelity's investment professionals have sufficient access to global information and data so as to provide competitive investment results over time, and that those professionals also have access to sophisticated tools that permit them to assess portfolio construction and risk and performance attribution characteristics continuously, as well as to transmit new information and research conclusions rapidly around the world. Additionally, in its deliberations, the Board considered Fidelity's trading and risk management capabilities and resources and global compliance infrastructure, which are an integral part of the investment management process.
Annual Report
Board Approval of Investment Advisory Contracts and
Management Fees - continued
Shareholder and Administrative Services. The Board considered (i) the nature, extent, quality, and cost of advisory, administrative, and shareholder services performed by the Investment Advisers and their affiliates under the Advisory Contracts and under separate agreements covering transfer agency, pricing and bookkeeping, and securities lending services for the fund; (ii) the nature and extent of the supervision of third party service providers, principally custodians and subcustodians; and (iii) the resources devoted to, and the record of compliance with, the fund's compliance policies and procedures. The Board also reviewed the allocation of fund brokerage, including allocations to brokers affiliated with the Investment Advisers, the use of brokerage commissions to pay fund expenses, and the use of "soft" commission dollars to pay for research services.
The Board noted that the growth of fund assets over time across the complex allows Fidelity to reinvest in the development of services designed to enhance the value or convenience of the Fidelity funds as investment vehicles. These services include 24-hour access to account information and market information through telephone representatives and over the Internet, investor education materials and asset allocation tools, and the expanded availability of Fidelity Investor Centers.
In 2014, the Board formed an ad hoc Committee on Transfer Agency Fees to review the variety of transfer agency fee structures throughout the industry and Fidelity's competitive positioning with respect to industry participants.
Investment in a Large Fund Family. The Board considered the benefits to shareholders of investing in a Fidelity fund, including the benefits of investing in a fund that is part of a large family of funds offering a variety of investment disciplines and providing a large variety of mutual fund investor services. The Board noted that Fidelity had taken, or had made recommendations that resulted in the Fidelity funds taking, a number of actions over the previous year that benefited particular funds, including (i) continuing to dedicate additional resources to investment research and to the support of the senior management team that oversees asset management; (ii) persisting in efforts to enhance Fidelity's global research capabilities; (iii) launching new funds and making other enhancements to meet client needs for income-oriented solutions; (iv) reducing fund expenses for certain index funds; (v) continuing to launch dedicated lower cost underlying funds to meet portfolio construction needs related to expanding underlying fund options for Fidelity funds of funds, specifically for the Freedom Fund product lines; (vi) rationalizing product lines and gaining increased efficiencies through fund mergers; (vii) launching sector-based exchange-traded funds and establishing a new Fidelity adviser to manage sector-based funds and products; (viii) continuing to develop and implement technology to improve security and increase efficiency; (ix) modifying the eligibility criteria for certain share classes to increase their marketability to a portion of the defined contribution plan market; (x) waiving redemption fees for certain qualified fund-of-fund and wrap programs and certain retirement plan transactions; and (xi) launching new Institutional Class shares of certain money market funds to attract and retain assets and to fill a gap in the money market fund lineup.
Annual Report
Investment Performance. The Board considered whether the fund has operated in accordance with its investment objective, as well as its record of compliance with its investment restrictions and its performance history.
The Board took into account discussions with the Investment Advisers about fund investment performance that occur at Board meetings throughout the year. In this regard the Board noted that as part of regularly scheduled fund reviews and other reports to the Board on fund performance, the Board periodically considers annualized return information for the fund, for different time periods, measured against a securities market index ("benchmark index") and a peer group of funds with similar objectives ("peer group"). In its evaluation of fund investment performance, the Board gave particular attention to information indicating changes in performance of certain Fidelity funds for specific time periods and the Investment Advisers' explanations for any overperformance or underperformance.
In addition to reviewing absolute and relative fund performance, the Independent Trustees periodically consider the appropriateness of fund performance metrics in evaluating the results achieved. In general, the Independent Trustees believe that fund performance should be evaluated based on net performance (after fees and expenses) of both the highest performing and lowest performing classes, where applicable, compared to appropriate benchmark indices, over appropriate time periods which may include full market cycles, and compared to peer groups, as applicable, over the same periods, taking into account relevant factors including the following: general market conditions; issuer-specific information; tactical opportunities for investment; and fund cash flows and other factors.
The Independent Trustees recognize that shareholders evaluate performance on a net basis over their own holding periods, for which one-, three-, and five-year periods are often used as a proxy. For this reason, the performance information reviewed by the Board also included net cumulative calendar year total return information for the fund and an appropriate benchmark index for the most recent one-, three-, and five-year periods, as shown below. A peer group comparison is not shown below.
Annual Report
Board Approval of Investment Advisory Contracts and
Management Fees - continued
Fidelity OTC Portfolio
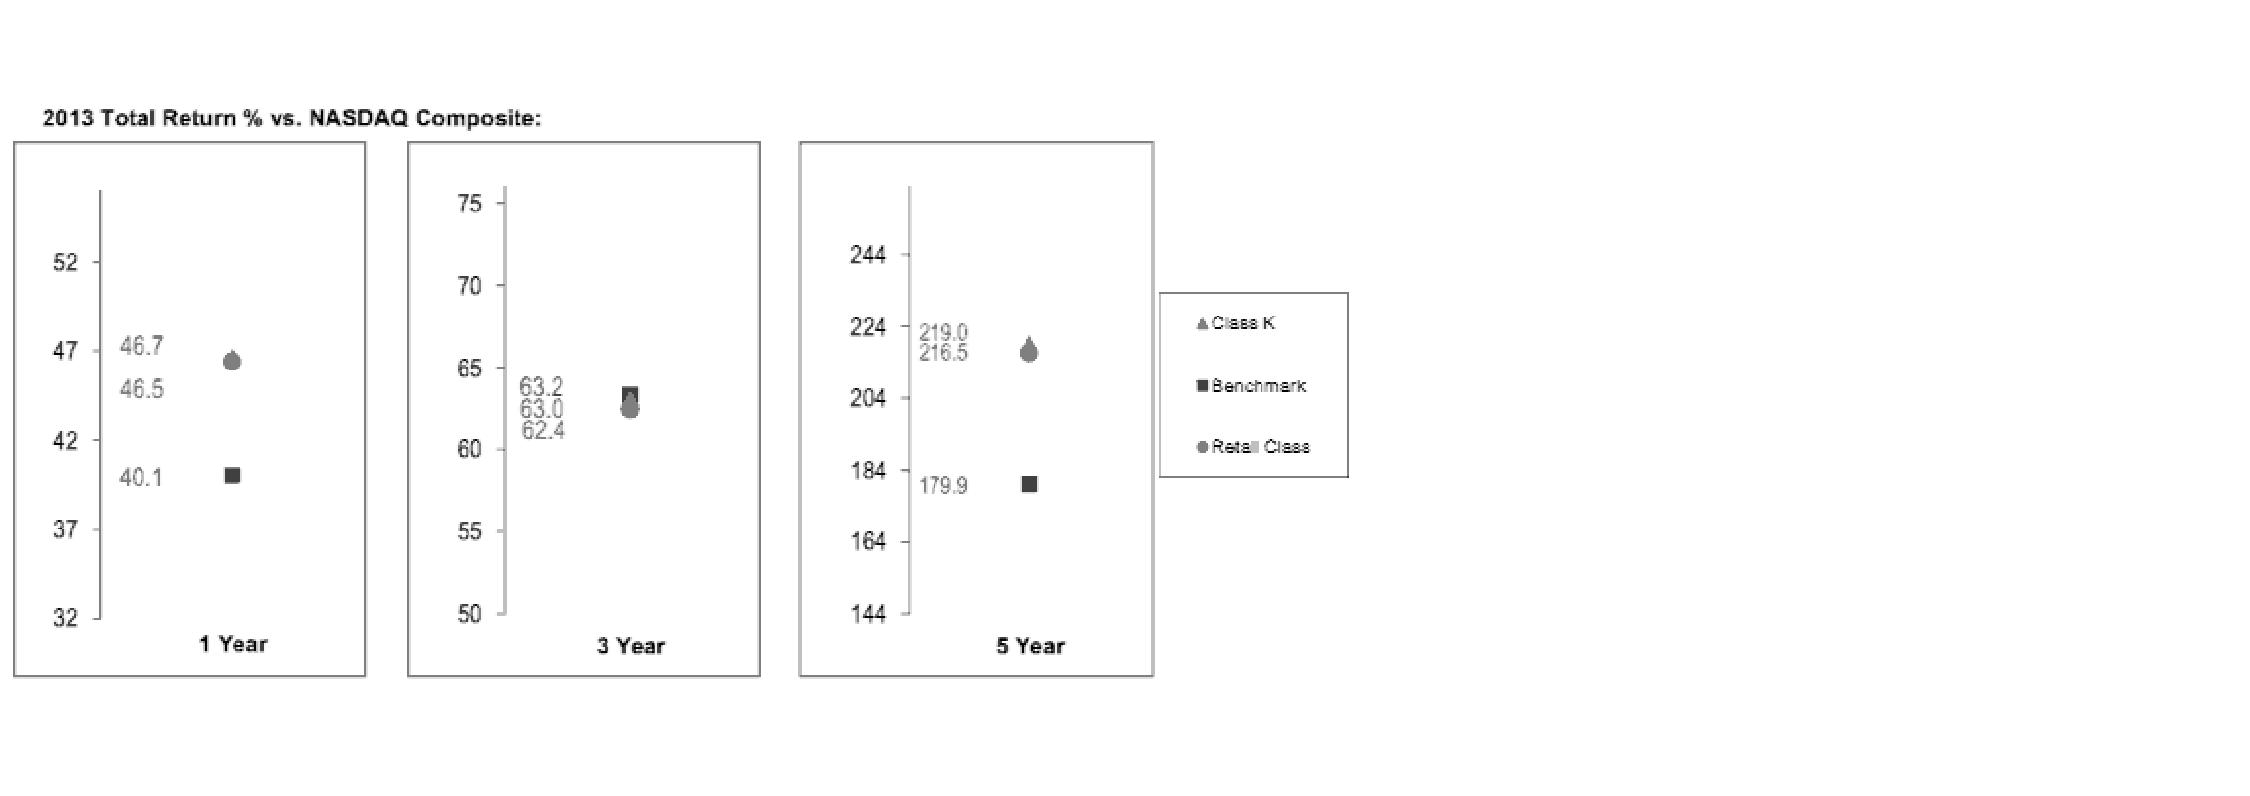
The Board also considered that the fund's management fee is subject to upward or downward adjustment depending upon whether, and to what extent, the fund's investment performance for the performance period exceeds, or is exceeded by, a securities index, thus leading to a performance adjustment for the same period. The Board noted that the performance adjustment provides FMR with a strong economic incentive to seek to achieve superior performance for the fund's shareholders and helps to more closely align the interests of FMR and the fund's shareholders.
Based on its review, the Board concluded that the nature, extent, and quality of services provided to the fund under the Advisory Contracts should benefit the fund's shareholders.
Competitiveness of Management Fee and Total Expense Ratio. The Board considered the fund's management fee and total expense ratio compared to "mapped groups" of competitive funds and classes. Fidelity creates "mapped groups" by combining similar Lipper investment objective categories that have comparable investment mandates. Combining Lipper investment objective categories aids the Board's management fee and total expense ratio comparisons by broadening the competitive group used for comparison and by reducing the number of universes to which various Fidelity funds are compared.
Management Fee. The Board considered two proprietary management fee comparisons for the 12-month periods shown in the chart below. The group of Lipper funds used by the Board for management fee comparisons is referred to below as the "Total Mapped Group." The Total Mapped Group comparison focuses on a fund's standing in terms of gross management fees before expense reimbursements or caps, and without giving effect to the fund's performance adjustment, relative to the total universe of funds with comparable investment mandates, regardless of whether their management fee structures also are comparable. Funds with comparable investment mandates offer exposure to similar types of securities. Funds with comparable management fee structures have similar management fee contractual arrangements (e.g., flat rate charged for advisory services, all-inclusive fee rate, etc.). "TMG %" represents the percentage of funds in the Total Mapped Group that had management fees that were lower than the fund's. For example, a hypothetical TMG % of 20% would mean that 80% of the funds in the Total Mapped Group had higher, and 20% had lower, management fees than the fund. The fund's actual TMG %s are in the chart below. The "Asset-Size Peer Group" (ASPG) comparison focuses on a fund's standing relative to a subset of non-Fidelity funds within the Total Mapped Group that are similar in size and management fee structure. For example, if a fund is in the first quartile of the ASPG, the fund's management fee ranks in the least expensive or lowest 25% of funds in the ASPG. The ASPG represents at least 15% of the funds in the Total Mapped Group with comparable asset size and management fee structures, subject to a minimum of 50 funds (or all funds in the Total Mapped Group if fewer than 50). Additional information, such as the ASPG quartile in which the fund's management fee rate ranked and the impact of the fund's performance adjustment, is also included in the chart and considered by the Board.
Annual Report
Fidelity OTC Portfolio

The Board noted that the fund's management fee rate ranked below the median of its Total Mapped Group and below the median of its ASPG for 2013.
Annual Report
Board Approval of Investment Advisory Contracts and
Management Fees - continued
The Board also noted that, in August 2013, the ad hoc Committee on Management Fees was formed to conduct an in-depth review of the management fee rates of Fidelity's active equity mutual funds. The Committee focused on the following areas: (i) standard fee structures; (ii) research consumption and trading evolution; (iii) management fee competitiveness/profitability by category; and (iv) factors that drive institutional pricing.
Based on its review, the Board concluded that the fund's management fee is fair and reasonable in light of the services that the fund receives and the other factors considered.
Total Expense Ratio. In its review of each class's total expense ratio, the Board considered the fund's management fee as well as other fund or class expenses, as applicable, such as transfer agent fees, pricing and bookkeeping fees, and custodial, legal, and audit fees. The Board also noted the effects of any waivers and reimbursements on fees and expenses, as well as the impact of the fund's performance adjustment. As part of its review, the Board also considered the current and historical total expense ratios of each class of the fund compared to competitive fund median expenses. Each class of the fund is compared to those funds and classes in the Total Mapped Group (used by the Board for management fee comparisons) that have a similar sales load structure.
The Board noted that the total expense ratio of each class ranked below its competitive median for 2013.
Fees Charged to Other Fidelity Clients. The Board also considered Fidelity fee structures and other information with respect to clients of Fidelity, such as other funds advised or subadvised by Fidelity, pension plan clients, and other institutional clients. The Board noted the findings of the 2013 ad hoc joint committee (created with the board of other Fidelity funds), which reviewed and compared Fidelity's institutional investment advisory business with its business of providing services to the Fidelity funds, including the differences in services provided, fees charged, and costs incurred, as well as competition in their respective marketplaces.
Based on its review of total expense ratios and fees charged to other Fidelity clients, the Board concluded that the total expense ratio of each class of the fund was reasonable in light of the services that the fund and its shareholders receive and the other factors considered.
Costs of the Services and Profitability. The Board considered the revenues earned and the expenses incurred by Fidelity in conducting the business of developing, marketing, distributing, managing, administering and servicing the fund and servicing the fund's shareholders. The Board also considered the level of Fidelity's profits in respect of all the Fidelity funds.
On an annual basis, Fidelity presents to the Board Fidelity's profitability for the fund. Fidelity calculates the profitability for each fund, as well as aggregate profitability for groups of Fidelity funds and all Fidelity funds, using a series of detailed revenue and cost allocation methodologies which originate with the books and records of Fidelity on which Fidelity's audited financial statements are based. The Audit Committee of the Board reviews any significant changes from the prior year's methodologies.
Annual Report
PricewaterhouseCoopers LLP (PwC), independent registered public accounting firm and auditor to Fidelity and certain Fidelity funds, has been engaged annually by the Board as part of the Board's assessment of Fidelity's profitability analysis. PwC's engagement includes the review and assessment of the methodologies used by Fidelity in determining the revenues and expenses attributable to Fidelity's mutual fund business, and completion of agreed-upon procedures in respect of the mathematical accuracy of fund profitability and its conformity to established allocation methodologies. After considering PwC's reports issued under the engagement and information provided by Fidelity, the Board concluded that while other allocation methods may also be reasonable, Fidelity's profitability methodologies are reasonable in all material respects.
The Board also reviewed Fidelity's non-fund businesses and fall-out benefits related to the mutual fund business as well as cases where Fidelity's affiliates may benefit from or be related to the fund's business.
The Board considered the costs of the services provided by and the profits realized by Fidelity in connection with the operation of the fund and was satisfied that the profitability was not excessive in the circumstances.
Economies of Scale. The Board considered whether there have been economies of scale in respect of the management of the Fidelity funds, whether the Fidelity funds (including the fund) have appropriately benefited from any such economies of scale, and whether there is potential for realization of any further economies of scale. The Board considered the extent to which the fund will benefit from economies of scale through increased services to the fund, through waivers or reimbursements, or through fee or expense ratio reductions. The Board also noted that in 2013, it and the boards of other Fidelity funds created an ad hoc committee (the Economies of Scale Committee) to analyze whether Fidelity attains economies of scale in respect of the management and servicing of the Fidelity funds, whether the Fidelity funds have appropriately benefited from such economies of scale, and whether there is potential for realization of any further economies of scale.
The Board recognized that the fund's management contract incorporates a "group fee" structure, which provides for lower group fee rates as total group assets increase, and for higher group fee rates as total group assets decrease (with "group assets" defined to include fund assets under FMR's management plus sector fund assets previously under FMR's management and currently managed by Fidelity SelectCo, LLC). FMR calculates the group fee rates based on a tiered asset "breakpoint" schedule that varies based on asset class. The Board considered that the group fee is designed to deliver the benefits of economies of scale to fund shareholders when total Fidelity fund assets increase, even if assets of any particular fund are unchanged or have declined, because some portion of Fidelity's costs are attributable to services provided to all Fidelity funds, and all funds benefit if those costs can be allocated among more assets. The Board concluded that, given the group fee structure, fund shareholders will benefit from lower management fees as group assets increase at the fund complex level, regardless of whether Fidelity achieves any such economies of scale.
Annual Report
Board Approval of Investment Advisory Contracts and
Management Fees - continued
The Board concluded, taking into account the analysis of the Economies of Scale Committee, that economies of scale, if any, are being appropriately shared between fund shareholders and Fidelity.
Additional Information Requested by the Board. In order to develop fully the factual basis for consideration of the Fidelity funds' Advisory Contracts, the Board requested and received additional information on certain topics, including: (i) fund performance trends and Fidelity's long-term strategies for certain funds; (ii) Fidelity's strategic marketing and product lineup goals; (iii) the methodology with respect to competitive fund data and peer group classifications; (iv) the arrangements with, and performance of, certain sub-advisers on behalf of the Fidelity funds, as well as certain proposed participating affiliate arrangements; (v) the realization of fall-out benefits in certain Fidelity business units; (vi) Fidelity's group fee structures, including the rationale for the individual fee rates of certain categories of funds and the definition of group assets; (vii) trends regarding industry use of performance fee structures and the performance adjustment methodologies applicable to the Fidelity funds; (viii) additional competitive analysis regarding the total expenses for certain classes; (ix) fund profitability methodology, including Fidelity's cost allocation methodology, and the impact of certain factors on fund profitability results; and (x) the process by which Fidelity determines sub-advisory fees for funds it advises.
Based on its evaluation of all of the conclusions noted above, and after considering all factors it believed relevant, the Board ultimately concluded that the advisory fee structures are fair and reasonable, and that the fund's Advisory Contracts should be renewed.
Annual Report
Investment Adviser
Fidelity Management & Research Company
Boston, MA
Investment Sub-Advisers
FMR Co., Inc.
Fidelity Management & Research
(U.K.) Inc.
Fidelity Management & Research
(Hong Kong) Limited
Fidelity Management & Research
(Japan) Inc.
General Distributor
Fidelity Distributors Corporation
Smithfield, RI
Transfer and Service Agents
Fidelity Investments Institutional
Operations Company, Inc.
Boston, MA
Fidelity Service Company, Inc.
Boston, MA
Custodian
The Northern Trust Company
Chicago, IL
The Fidelity Telephone Connection
Mutual Fund 24-Hour Service
Exchanges/Redemptions
and Account Assistance 1-800-544-6666
Product Information 1-800-544-6666
Retirement Accounts 1-800-544-4774
(8 a.m. - 9 p.m.)
TDD Service 1-800-544-0118
for the deaf and hearing impaired
(9 a.m. - 9 p.m. Eastern time)
Fidelity Automated Service
Telephone (FAST®)
1-800-544-5555
Automated line for quickest service
(Fidelity Investment logo)(registered trademark)
Corporate Headquarters
245 Summer St., Boston, MA 02210
www.fidelity.com
OTC-UANN-0914
1.789250.111
Fidelity®
OTC
Portfolio -
Class K
Annual Report
July 31, 2014
(Fidelity Cover Art)
Contents
Performance | (Click Here) | How the fund has done over time. |
Management's Discussion of Fund Performance | (Click Here) | The Portfolio Manager's review of fund performance and strategy. |
Shareholder Expense Example | (Click Here) | An example of shareholder expenses. |
Investment Changes | (Click Here) | A summary of major shifts in the fund's investments over the past six months. |
Investments | (Click Here) | A complete list of the fund's investments with their market values. |
Financial Statements | (Click Here) | Statements of assets and liabilities, operations, and changes in net assets, as well as financial highlights. |
Notes | (Click Here) | Notes to the financial statements. |
Report of Independent Registered Public Accounting Firm | (Click Here) | |
Trustees and Officers | (Click Here) | |
Distributions | (Click Here) | |
Board Approval of Investment Advisory Contracts and Management Fees | (Click Here) | |
To view a fund's proxy voting guidelines and proxy voting record for the 12-month period ended June 30, visit http://www.fidelity.com/proxyvotingresults or visit the Securities and Exchange Commission's (SEC) web site at http://www.sec.gov. You may also call 1-800-835-5092 to request a free copy of the proxy voting guidelines.
Standard & Poor's, S&P and S&P 500 are registered service marks of The McGraw-Hill Companies, Inc. and have been licensed for use by Fidelity Distributors Corporation.
Other third-party marks appearing herein are the property of their respective owners.
All other marks appearing herein are registered or unregistered trademarks or service marks of FMR LLC or an affiliated company. © 2014 FMR LLC. All rights reserved.
Annual Report
This report and the financial statements contained herein are submitted for the general information of the shareholders of the fund. This report is not authorized for distribution to prospective investors in the fund unless preceded or accompanied by an effective prospectus.
A fund files its complete schedule of portfolio holdings with the SEC for the first and third quarters of each fiscal year on Form N-Q. Forms N-Q are available on the SEC's web site at http://www.sec.gov. A fund's Forms N-Q may be reviewed and copied at the SEC's Public Reference Room in Washington, DC. Information regarding the operation of the SEC's Public Reference Room may be obtained by calling 1-800-SEC-0330. For a complete list of a fund's portfolio holdings, view the most recent holdings listing, semiannual report, or annual report on Fidelity's web site at http://www.fidelity.com, http://www.advisor.fidelity.com, or http://www.401k.com, as applicable.
NOT FDIC INSURED • MAY LOSE VALUE • NO BANK GUARANTEE
Neither the fund nor Fidelity Distributors Corporation is a bank.
Annual Report
Average annual total return reflects the change in the value of an investment, assuming reinvestment of the class' distributions from dividend income and capital gains (the profits earned upon the sale of securities that have grown in value, if any) and assuming a constant rate of performance each year. The $10,000 table and the fund's returns do not reflect the deduction of taxes that a shareholder would pay on fund distributions or the redemption of fund shares. During periods of reimbursement by Fidelity, a fund's total return will be greater than it would be had the reimbursement not occurred. How a fund did yesterday is no guarantee of how it will do tomorrow.
Average Annual Total Returns
Periods ended July 31, 2014 | Past 1
year | Past 5
years | Past 10
years |
Class KA | 18.10% | 19.47% | 12.13% |
A The initial offering of Class K shares took place on May 9, 2008. Returns prior to May 9, 2008, are those of Fidelity® OTC Portfolio, the original class of the fund.
$10,000 Over 10 Years
Let's say hypothetically that $10,000 was invested in Fidelity® OTC Portfolio - Class K on July 31, 2004. The chart shows how the value of your investment would have changed, and also shows how the Nasdaq Composite Index® performed over the same period. The initial offering of Class K took place on May 9, 2008. See above for additional information regarding the performance of Class K.
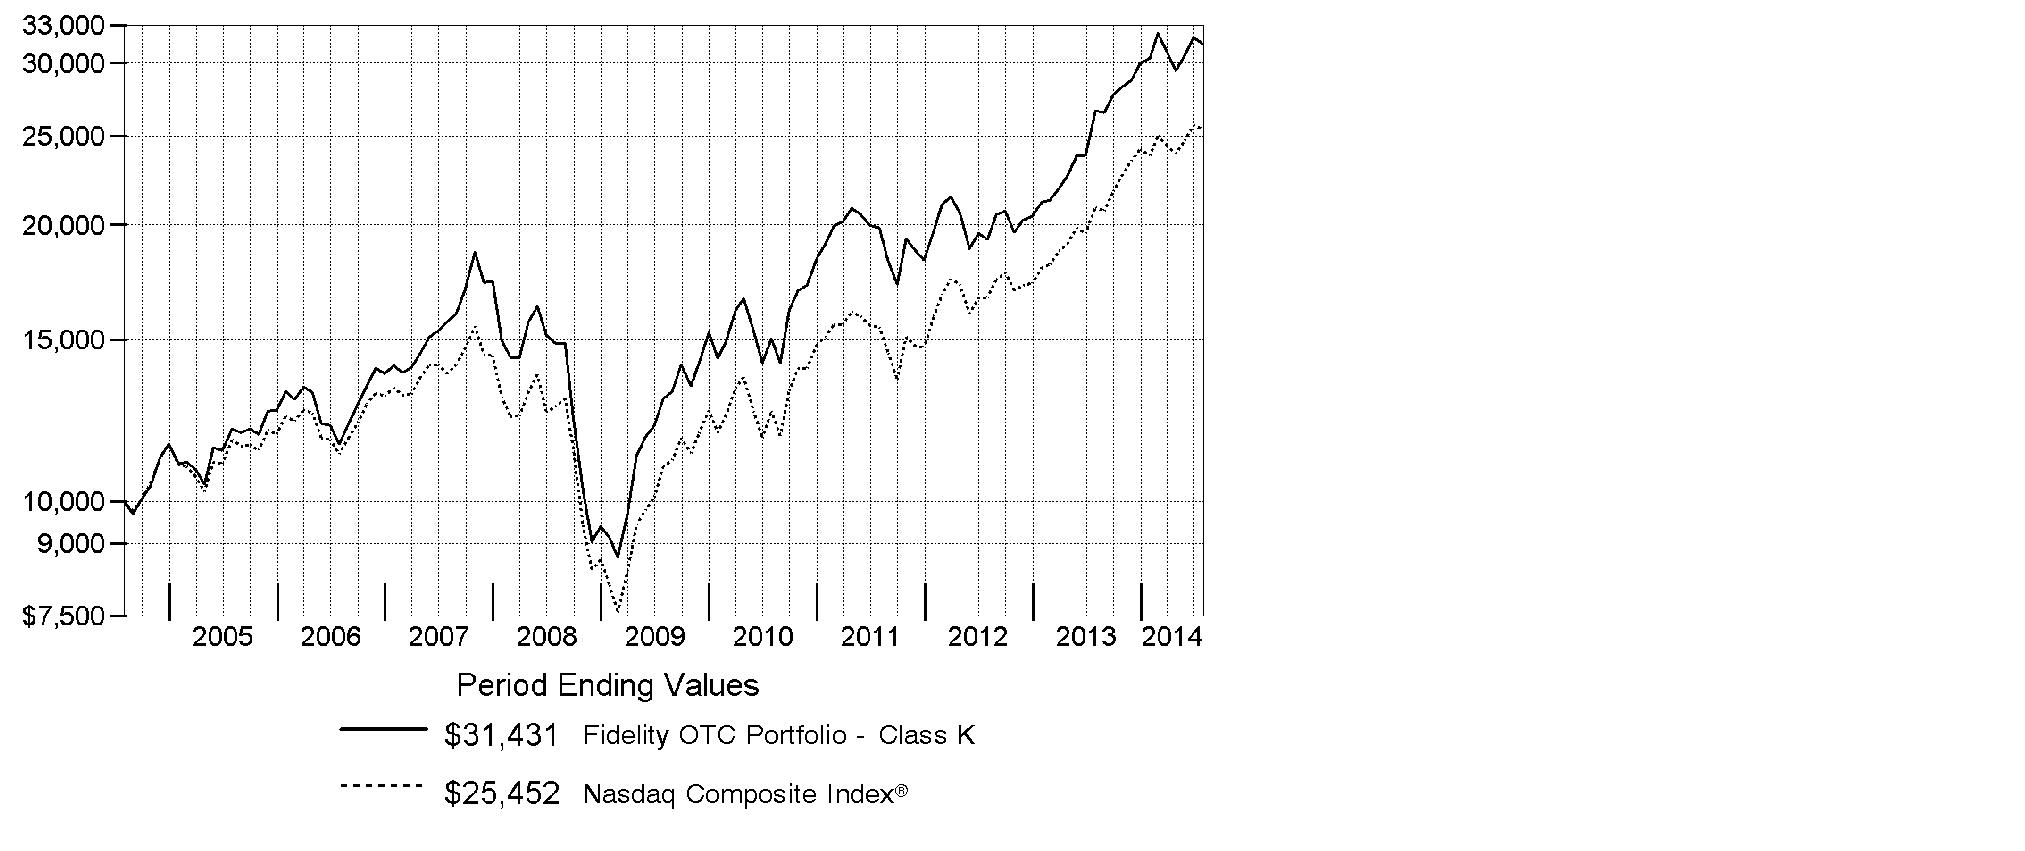
Annual Report
Market Recap: U.S. stocks overcame a slowing economy early in 2014 to post a strong gain for the 12-month period ending July 31, 2014, supported by corporate profits and continued low interest rates. The S&P 500® Index rose 16.94%, reaching an all-time high near period end. The technology-heavy Nasdaq Composite Index® gained 22.00%. The Russell 2000® Index returned 8.56%, reflecting the relatively lackluster performance of small-cap stocks. Information technology (+28%) was the top-performing sector within the S&P 500®, driven by strong semiconductor and computer hardware sales. Materials (+23%) gained amid higher prices for many commodity products. Health care (+21%) rose, driven by gains in pharmaceuticals, biotechnology & life sciences companies. Energy stocks (+19%) advanced in the latter part of the period amid healthy U.S. output and the threat of supply disruptions in Iraq. Conversely, most defensive sectors, including consumer staples, utilities and telecommunication services, lagged the broader market. Volatility remained tame throughout most of the period, with markets supported by declining unemployment, near-record profit margins for companies, muted cost inflation and fairly low corporate debt levels. Geopolitical tension remained a concern at period end, with conflict in Ukraine and strained relations between Russia and the West posing a potential threat to global growth.
Comments from Gavin Baker, Portfolio Manager of Fidelity® OTC Portfolio: For the year, the fund's Class K shares returned 18.10%, trailing the Nasdaq Composite Index. Notable detractors include Rackspace Hosting, Groupon, NII Holdings and Angie's List, which collectively cost the fund more than 540 basis points of relative performance. Mobile operator NII faced a number of challenges in rolling out its new wireless network in Latin America. Subscriber-based Angie's List faced increased competition from crowd-sourced and free alternatives, as well as marketplace-model implementation issues. NII Holdings and nearly our entire position in Angie's List were sold from the fund prior to period end. The fund maintained its stake in Rackspace and increased its stake in Groupon. On the positive side, social-media giant Facebook, the fund's top relative contributor, continued to benefit from having figured out how to profitably integrate advertising into its newsfeed. Keurig Green Mountain also helped the fund's relative performance. The company continued to grow its earnings, along with its relationship with Coca-Cola, and remains strategic and aggressive in seeking out new and mutually beneficial partnerships.
The views expressed above reflect those of the portfolio manager(s) only through the end of the period as stated on the cover of this report and do not necessarily represent the views of Fidelity or any other person in the Fidelity organization. Any such views are subject to change at any time based upon market or other conditions and Fidelity disclaims any responsibility to update such views. These views may not be relied on as investment advice and, because investment decisions for a Fidelity fund are based on numerous factors, may not be relied on as an indication of trading intent on behalf of any Fidelity fund.
Annual Report
Shareholder Expense Example
As a shareholder of the Fund, you incur two types of costs: (1) transaction costs, and (2) ongoing costs, including management fees and other Fund expenses. This Example is intended to help you understand your ongoing costs (in dollars) of investing in the Fund and to compare these costs with the ongoing costs of investing in other mutual funds.
The Example is based on an investment of $1,000 invested at the beginning of the period and held for the entire period (February 1, 2014 to July 31, 2014).
Actual Expenses
The first line of the accompanying table for each class of the Fund provides information about actual account values and actual expenses. You may use the information in this line, together with the amount you invested, to estimate the expenses that you paid over the period. Simply divide your account value by $1,000.00 (for example, an $8,600 account value divided by $1,000.00 = 8.6), then multiply the result by the number in the first line for a class of the Fund under the heading entitled "Expenses Paid During Period" to estimate the expenses you paid on your account during this period. A small balance maintenance fee of $12.00 that is charged once a year may apply for certain accounts with a value of less than $2,000. This fee is not included in the table below. If it was, the estimate of expenses you paid during the period would be higher, and your ending account value lower, by this amount. In addition, the Fund, as a shareholder in the underlying Fidelity Central Funds, will indirectly bear its pro-rata share of the fees and expenses incurred by the underlying Fidelity Central Funds. These fees and expenses are not included in the Fund's annualized expense ratio used to calculate the expense estimate in the table below.
Hypothetical Example for Comparison Purposes
The second line of the accompanying table for each class of the Fund provides information about hypothetical account values and hypothetical expenses based on a Class' actual expense ratio and an assumed rate of return of 5% per year before expenses, which is not the Class' actual return. The hypothetical account values and expenses may not be used to estimate the actual ending account balance or expenses you paid for the period. You may use this information to compare the ongoing costs of investing in the Fund and other funds. To do so, compare this 5% hypothetical example with the 5% hypothetical examples that appear in the shareholder reports of the other funds. A small balance maintenance fee of $12.00 that is charged once a year may apply for certain accounts with a value of less than $2,000. This fee is not included in the table below. If it was, the estimate of expenses you paid during the period would be higher, and your ending account value lower, by this amount. In addition, the Fund, as a shareholder in the underlying Fidelity Central Funds, will indirectly bear its pro-rata share of the fees and expenses incurred by the underlying Fidelity Central Funds. These fees and expenses are not included in the Fund's annualized expense ratio used to calculate the expense estimate in the table below.
Please note that the expenses shown in the table are meant to highlight your ongoing costs only and do not reflect any transaction costs. Therefore, the second line of the table is useful in comparing ongoing costs only, and will not help you determine the relative total costs of owning different funds.
Annual Report
| Annualized
Expense Ratio B | Beginning
Account Value
February 1, 2014 | Ending
Account Value
July 31, 2014 | Expenses Paid
During Period*
February 1, 2014
to July 31, 2014 |
OTC | .71% | | | |
Actual | | $ 1,000.00 | $ 1,034.60 | $ 3.58 |
Hypothetical A | | $ 1,000.00 | $ 1,021.27 | $ 3.56 |
Class K | .59% | | | |
Actual | | $ 1,000.00 | $ 1,035.20 | $ 2.98 |
Hypothetical A | | $ 1,000.00 | $ 1,021.87 | $ 2.96 |
A 5% return per year before expenses
B Annualized expense ratio reflects expenses net of applicable fee waivers.
* Expenses are equal to each Class' annualized expense ratio, multiplied by the average account value over the period, multiplied by 181/365 (to reflect the one-half year period).
Annual Report
Investment Changes (Unaudited)
Top Ten Stocks as of July 31, 2014 |
| % of fund's
net assets | % of fund's net assets
6 months ago |
Apple, Inc. | 10.5 | 6.9 |
Microsoft Corp. | 4.7 | 3.3 |
Google, Inc. Class A | 4.5 | 6.7 |
Amazon.com, Inc. | 4.5 | 4.3 |
Google, Inc. Class C | 4.3 | 0.0 |
Groupon, Inc. Class A | 3.7 | 1.9 |
Facebook, Inc. Class A | 3.1 | 5.2 |
Gilead Sciences, Inc. | 2.9 | 2.5 |
athenahealth, Inc. | 2.7 | 2.4 |
Rackspace Hosting, Inc. | 2.7 | 3.4 |
| 43.6 | |
Top Five Market Sectors as of July 31, 2014 |
| % of fund's
net assets | % of fund's net assets
6 months ago |
Information Technology | 52.1 | 47.9 |
Health Care | 20.1 | 22.0 |
Consumer Discretionary | 15.3 | 15.9 |
Consumer Staples | 4.6 | 6.5 |
Financials | 4.0 | 2.4 |
Asset Allocation (% of fund's net assets) |
As of July 31, 2014* | As of January 31, 2014** |
| Stocks 98.9% | | | Stocks 99.3% | |
| Convertible
Securities 0.9% | | | Convertible
Securities 0.3% | |
| Short-Term
Investments and
Net Other Assets
(Liabilities) 0.2% | | | Short-Term
Investments and
Net Other Assets
(Liabilities) 0.4% | |
* Foreign investments | 5.6% | | ** Foreign investments | 6.1% | |

Annual Report
Investments July 31, 2014
Showing Percentage of Net Assets
Common Stocks - 98.9% |
| Shares | | Value (000s) |
CONSUMER DISCRETIONARY - 15.0% |
Automobiles - 0.6% |
Tesla Motors, Inc. (a)(d) | 281,299 | | $ 62,814 |
Hotels, Restaurants & Leisure - 1.4% |
Bloomin' Brands, Inc. (a) | 771,100 | | 15,106 |
Dunkin' Brands Group, Inc. | 22,800 | | 977 |
Intrawest Resorts Holdings, Inc. (d) | 764,235 | | 8,613 |
Panera Bread Co. Class A (a) | 502,000 | | 73,945 |
Starbucks Corp. | 357,710 | | 27,787 |
The Cheesecake Factory, Inc. | 518,500 | | 22,233 |
| | 148,661 |
Household Durables - 0.3% |
D.R. Horton, Inc. | 65,100 | | 1,348 |
Garmin Ltd. (d) | 333,822 | | 18,374 |
iRobot Corp. (a)(d) | 145,200 | | 4,700 |
Lennar Corp. Class A | 24,600 | | 891 |
Wayfair LLC Series B (f)(g) | 381,300 | | 10,000 |
| | 35,313 |
Internet & Catalog Retail - 8.4% |
Amazon.com, Inc. (a) | 1,552,098 | | 485,791 |
Groupon, Inc. Class A (a)(d)(e) | 60,287,370 | | 390,059 |
JD.com, Inc. sponsored ADR | 31,500 | | 900 |
RetailMeNot, Inc. | 45,200 | | 1,106 |
zulily, Inc. Class A (d) | 665,573 | | 23,042 |
| | 900,898 |
Media - 2.0% |
Comcast Corp. Class A | 3,506,300 | | 188,393 |
Liberty Global PLC Class A (a) | 291,500 | | 12,126 |
Lions Gate Entertainment Corp. (d) | 43,869 | | 1,351 |
The Walt Disney Co. | 27,200 | | 2,336 |
Twenty-First Century Fox, Inc. Class A | 478,500 | | 15,159 |
| | 219,365 |
Specialty Retail - 1.6% |
Francesca's Holdings Corp. (a) | 1,509 | | 19 |
Monro Muffler Brake, Inc. | 613 | | 31 |
Restoration Hardware Holdings, Inc. (a) | 65,700 | | 5,374 |
Ross Stores, Inc. | 595,200 | | 38,331 |
TJX Companies, Inc. | 41,700 | | 2,222 |
Tractor Supply Co. | 90,376 | | 5,619 |
Ulta Salon, Cosmetics & Fragrance, Inc. (a) | 1,327,715 | | 122,588 |
| | 174,184 |
Common Stocks - continued |
| Shares | | Value (000s) |
CONSUMER DISCRETIONARY - continued |
Textiles, Apparel & Luxury Goods - 0.7% |
lululemon athletica, Inc. (a)(d) | 227,746 | | $ 8,761 |
LVMH Moet Hennessy - Louis Vuitton SA ADR | 306,800 | | 10,480 |
NIKE, Inc. Class B | 400 | | 31 |
Ralph Lauren Corp. | 373,200 | | 58,167 |
| | 77,439 |
TOTAL CONSUMER DISCRETIONARY | | 1,618,674 |
CONSUMER STAPLES - 4.6% |
Beverages - 0.5% |
Monster Beverage Corp. (a) | 892,200 | | 57,065 |
Food & Staples Retailing - 2.5% |
Costco Wholesale Corp. | 2,101,050 | | 246,957 |
Sprouts Farmers Market LLC (d) | 727,500 | | 22,196 |
| | 269,153 |
Food Products - 1.6% |
Danone SA sponsored ADR | 3,721,723 | | 53,891 |
Keurig Green Mountain, Inc. | 752,317 | | 89,736 |
Mondelez International, Inc. | 854,000 | | 30,744 |
| | 174,371 |
TOTAL CONSUMER STAPLES | | 500,589 |
ENERGY - 0.3% |
Energy Equipment & Services - 0.2% |
Oceaneering International, Inc. | 337,900 | | 22,947 |
Oil, Gas & Consumable Fuels - 0.1% |
Noble Energy, Inc. | 16,900 | | 1,124 |
Rosetta Resources, Inc. (a) | 252,500 | | 12,895 |
| | 14,019 |
TOTAL ENERGY | | 36,966 |
FINANCIALS - 4.0% |
Banks - 2.0% |
Bank of America Corp. | 420,000 | | 6,405 |
Citigroup, Inc. | 464,300 | | 22,709 |
Commerce Bancshares, Inc. | 474,507 | | 21,381 |
Huntington Bancshares, Inc. | 4,400 | | 43 |
JPMorgan Chase & Co. | 1,959,100 | | 112,981 |
Common Stocks - continued |
| Shares | | Value (000s) |
FINANCIALS - continued |
Banks - continued |
PacWest Bancorp | 1,000 | | $ 42 |
Signature Bank (a) | 214,600 | | 24,548 |
UMB Financial Corp. | 308,962 | | 17,497 |
Wells Fargo & Co. | 185,900 | | 9,462 |
| | 215,068 |
Capital Markets - 0.7% |
Carlyle Group LP | 630,500 | | 21,046 |
Northern Trust Corp. | 893,400 | | 59,760 |
| | 80,806 |
Consumer Finance - 1.3% |
American Express Co. | 729,500 | | 64,196 |
Capital One Financial Corp. | 907,500 | | 72,183 |
| | 136,379 |
Thrifts & Mortgage Finance - 0.0% |
BofI Holding, Inc. (a) | 12,300 | | 917 |
TOTAL FINANCIALS | | 433,170 |
HEALTH CARE - 19.9% |
Biotechnology - 13.4% |
Acceleron Pharma, Inc. | 167,000 | | 4,947 |
Aegerion Pharmaceuticals, Inc. (a) | 9,600 | | 323 |
Alexion Pharmaceuticals, Inc. (a) | 685,789 | | 109,034 |
Alkermes PLC (a) | 865,236 | | 36,997 |
Alnylam Pharmaceuticals, Inc. (a) | 146,100 | | 7,897 |
Amgen, Inc. | 89,200 | | 11,363 |
Avalanche Biotechnologies, Inc. (a) | 171,949 | | 4,813 |
BioCryst Pharmaceuticals, Inc. (a) | 1,582,464 | | 19,812 |
Biogen Idec, Inc. (a) | 198,400 | | 66,343 |
BioMarin Pharmaceutical, Inc. (a) | 2,266,956 | | 140,143 |
Celldex Therapeutics, Inc. (a)(d) | 1,255,985 | | 16,441 |
Clovis Oncology, Inc. (a) | 432,455 | | 15,763 |
Dicerna Pharmaceuticals, Inc. (d) | 253,207 | | 3,803 |
Epizyme, Inc. (a) | 85 | | 3 |
Exelixis, Inc. (a)(d) | 371,858 | | 1,502 |
Foundation Medicine, Inc. (d)(e) | 1,593,212 | | 35,879 |
Genocea Biosciences, Inc. | 686,570 | | 11,953 |
Gilead Sciences, Inc. (a) | 3,355,799 | | 307,223 |
ImmunoGen, Inc. (a) | 70,009 | | 755 |
Infinity Pharmaceuticals, Inc. (a) | 869,731 | | 7,906 |
Common Stocks - continued |
| Shares | | Value (000s) |
HEALTH CARE - continued |
Biotechnology - continued |
Intercept Pharmaceuticals, Inc. (a) | 283,119 | | $ 65,786 |
InterMune, Inc. (a) | 1,500,000 | | 65,805 |
Intrexon Corp. (d) | 198,100 | | 4,376 |
Ironwood Pharmaceuticals, Inc. Class A (a) | 3,220,042 | | 47,657 |
Isis Pharmaceuticals, Inc. (a) | 46,249 | | 1,433 |
KYTHERA Biopharmaceuticals, Inc. (a)(d)(e) | 1,257,482 | | 42,226 |
Lion Biotechnologies, Inc. (a)(e) | 1,800,000 | | 12,870 |
Medivation, Inc. (a) | 856,145 | | 63,552 |
NPS Pharmaceuticals, Inc. (a) | 422,700 | | 11,810 |
Ophthotech Corp. (d) | 1,010,600 | | 39,474 |
Pharmacyclics, Inc. (a)(d) | 313,600 | | 37,770 |
Portola Pharmaceuticals, Inc. (a)(e) | 2,336,800 | | 58,747 |
PTC Therapeutics, Inc. (a)(e) | 2,099,379 | | 55,466 |
Puma Biotechnology, Inc. (a) | 23,500 | | 5,210 |
Regeneron Pharmaceuticals, Inc. (a) | 16,000 | | 5,060 |
Seattle Genetics, Inc. (a)(d) | 1,401,386 | | 49,329 |
Synageva BioPharma Corp. (a) | 478,174 | | 32,712 |
Targacept, Inc. (a) | 4,749 | | 13 |
Ultragenyx Pharmaceutical, Inc. (d) | 317,796 | | 13,888 |
uniQure B.V. | 192,200 | | 1,964 |
Versartis, Inc. (a)(d) | 517,200 | | 10,551 |
Vertex Pharmaceuticals, Inc. (a) | 171,100 | | 15,213 |
XOMA Corp. (a) | 1,521,913 | | 5,905 |
| | 1,449,717 |
Health Care Equipment & Supplies - 1.3% |
Accuray, Inc. (a)(d) | 2,427,800 | | 19,107 |
Endologix, Inc. (a) | 1,400 | | 20 |
HeartWare International, Inc. (a) | 240,200 | | 20,227 |
Insulet Corp. (a) | 454,417 | | 16,059 |
Intuitive Surgical, Inc. (a) | 38,250 | | 17,501 |
Novadaq Technologies, Inc. (a) | 2,521,733 | | 38,683 |
Quidel Corp. (a) | 1,088,274 | | 25,977 |
| | 137,574 |
Health Care Providers & Services - 0.8% |
Accretive Health, Inc. (a)(d)(e) | 9,842,302 | | 82,872 |
Health Care Technology - 3.2% |
athenahealth, Inc. (a)(d)(e) | 2,369,183 | | 294,726 |
Castlight Health, Inc. Class B (a)(d) | 65,400 | | 877 |
Common Stocks - continued |
| Shares | | Value (000s) |
HEALTH CARE - continued |
Health Care Technology - continued |
Medidata Solutions, Inc. (a) | 247,200 | | $ 11,084 |
Veeva Systems, Inc. Class A (d) | 1,545,600 | | 36,785 |
| | 343,472 |
Life Sciences Tools & Services - 0.5% |
Illumina, Inc. (a) | 324,200 | | 51,843 |
Pharmaceuticals - 0.7% |
Achaogen, Inc. (a) | 847,200 | | 9,158 |
Endocyte, Inc. (a)(d) | 90,808 | | 603 |
GW Pharmaceuticals PLC ADR (a)(d) | 193,527 | | 16,372 |
Intra-Cellular Therapies, Inc. | 263,900 | | 3,824 |
Pacira Pharmaceuticals, Inc. (a) | 10,200 | | 938 |
Questcor Pharmaceuticals, Inc. | 92 | | 8 |
Revance Therapeutics, Inc. | 971,700 | | 29,812 |
Theravance, Inc. (a)(d) | 657,279 | | 14,263 |
| | 74,978 |
TOTAL HEALTH CARE | | 2,140,456 |
INDUSTRIALS - 2.1% |
Airlines - 0.4% |
American Airlines Group, Inc. | 229,900 | | 8,932 |
JetBlue Airways Corp. (a) | 294,500 | | 3,157 |
United Continental Holdings, Inc. (a) | 640,800 | | 29,727 |
| | 41,816 |
Electrical Equipment - 0.3% |
SolarCity Corp. (a)(d) | 527,094 | | 37,703 |
Professional Services - 0.9% |
Paylocity Holding Corp. (a)(d) | 12,700 | | 249 |
Towers Watson & Co. | 10,700 | | 1,092 |
Verisk Analytics, Inc. (a) | 1,561,600 | | 93,758 |
| | 95,099 |
Road & Rail - 0.5% |
J.B. Hunt Transport Services, Inc. | 642,880 | | 49,669 |
TOTAL INDUSTRIALS | | 224,287 |
INFORMATION TECHNOLOGY - 51.7% |
Communications Equipment - 1.9% |
Aruba Networks, Inc. (a) | 4,363,279 | | 77,928 |
Common Stocks - continued |
| Shares | | Value (000s) |
INFORMATION TECHNOLOGY - continued |
Communications Equipment - continued |
Cisco Systems, Inc. | 46,900 | | $ 1,183 |
QUALCOMM, Inc. | 278,153 | | 20,500 |
Riverbed Technology, Inc. (a) | 3,112,173 | | 55,708 |
ViaSat, Inc. (a) | 840,700 | | 49,156 |
| | 204,475 |
Electronic Equipment & Components - 0.7% |
Control4 Corp. | 1,600 | | 27 |
Trimble Navigation Ltd. (a) | 2,576,700 | | 79,620 |
| | 79,647 |
Internet Software & Services - 17.7% |
Angie's List, Inc. (a)(d) | 94,091 | | 784 |
Baidu.com, Inc. sponsored ADR (a) | 198,900 | | 42,972 |
Benefitfocus, Inc. (d) | 193,400 | | 7,454 |
Constant Contact, Inc. (a) | 908,336 | | 28,276 |
Cornerstone OnDemand, Inc. (a) | 1,924,282 | | 80,512 |
Cvent, Inc. | 321,700 | | 8,786 |
Demandware, Inc. (a) | 22,500 | | 1,355 |
Dropbox, Inc. (a)(g) | 331,524 | | 6,333 |
E2open, Inc. (a)(d)(e) | 1,552,491 | | 25,119 |
Facebook, Inc. Class A (a) | 4,591,088 | | 333,543 |
Google, Inc.: | | | |
Class A (a) | 846,027 | | 490,315 |
Class C (a) | 812,377 | | 464,355 |
Marketo, Inc. (a)(d)(e) | 2,081,278 | | 56,923 |
Qihoo 360 Technology Co. Ltd. ADR (a) | 9,100 | | 829 |
Rackspace Hosting, Inc. (a)(e) | 9,689,146 | | 293,484 |
Textura Corp. (a) | 600 | | 15 |
TrueCar, Inc. (d) | 491,500 | | 6,670 |
Twitter, Inc. | 22,500 | | 1,017 |
Wix.com Ltd. (a)(d) | 364,405 | | 6,177 |
Yahoo!, Inc. (a) | 1,510,100 | | 54,077 |
Yelp, Inc. (a) | 730 | | 49 |
| | 1,909,045 |
IT Services - 0.1% |
Acxiom Corp. (a) | 44,300 | | 812 |
Cognizant Technology Solutions Corp. Class A (a) | 21,200 | | 1,040 |
ServiceSource International, Inc. (a)(d) | 1,076,936 | | 4,771 |
| | 6,623 |
Common Stocks - continued |
| Shares | | Value (000s) |
INFORMATION TECHNOLOGY - continued |
Semiconductors & Semiconductor Equipment - 3.2% |
Altera Corp. | 70,894 | | $ 2,320 |
Applied Micro Circuits Corp. (a) | 457,650 | | 3,821 |
Broadcom Corp. Class A | 343,800 | | 13,154 |
Cavium, Inc. (a) | 24,900 | | 1,162 |
Cirrus Logic, Inc. (a) | 461,900 | | 10,360 |
Cree, Inc. (a)(d) | 1,408,400 | | 66,519 |
Inphi Corp. (a) | 1,595 | | 24 |
Mellanox Technologies Ltd. (a)(d) | 294,954 | | 12,285 |
Micron Technology, Inc. (a) | 2,364,200 | | 72,226 |
NVE Corp. (a)(e) | 265,557 | | 17,620 |
NVIDIA Corp. | 7,988,461 | | 139,798 |
RF Micro Devices, Inc. (a) | 197,000 | | 2,199 |
| | 341,488 |
Software - 16.5% |
Activision Blizzard, Inc. | 12,189,452 | | 272,800 |
Adobe Systems, Inc. (a) | 82,200 | | 5,681 |
Check Point Software Technologies Ltd. (a) | 400 | | 27 |
CommVault Systems, Inc. (a)(e) | 3,319,184 | | 159,387 |
Concur Technologies, Inc. (a)(d) | 851,973 | | 79,199 |
Electronic Arts, Inc. (a) | 1,185,260 | | 39,825 |
FireEye, Inc. (d) | 24,690 | | 876 |
Fleetmatics Group PLC (a) | 1,341,522 | | 42,379 |
Gameloft Se (a)(e) | 7,764,787 | | 49,492 |
Imperva, Inc. (a) | 406,800 | | 9,019 |
Interactive Intelligence Group, Inc. (a) | 222,187 | | 10,081 |
King Digital Entertainment PLC (a)(d) | 99,806 | | 1,941 |
Microsoft Corp. | 11,728,139 | | 506,186 |
NetSuite, Inc. (a)(d) | 1,299,800 | | 109,586 |
Nintendo Co. Ltd. ADR | 45,600 | | 631 |
Red Hat, Inc. (a) | 199,100 | | 11,572 |
salesforce.com, Inc. (a) | 1,970,120 | | 106,879 |
ServiceNow, Inc. (a) | 156,386 | | 9,195 |
SolarWinds, Inc. (a) | 700 | | 29 |
Synchronoss Technologies, Inc. (a)(e) | 4,085,907 | | 165,112 |
Synopsys, Inc. (a) | 404,800 | | 15,289 |
Tableau Software, Inc. (a) | 400 | | 26 |
Ubisoft Entertainment SA (a)(e) | 10,112,456 | | 169,602 |
Xero Ltd. (g) | 661,157 | | 12,844 |
Common Stocks - continued |
| Shares | | Value (000s) |
INFORMATION TECHNOLOGY - continued |
Software - continued |
Zendesk, Inc. | 38,400 | | $ 668 |
Zynga, Inc. (a) | 260,800 | | 762 |
| | 1,779,088 |
Technology Hardware, Storage & Peripherals - 11.6% |
Apple, Inc. | 11,863,700 | | 1,133,810 |
Cray, Inc. (a)(d) | 874,165 | | 23,183 |
Electronics for Imaging, Inc. (a) | 1,202,400 | | 52,990 |
EMC Corp. | 1,000 | | 29 |
Nimble Storage, Inc. (d) | 955,980 | | 24,741 |
Seagate Technology LLC | 1,300 | | 76 |
Silicon Graphics International Corp. (a) | 1,774 | | 17 |
Stratasys Ltd. (a)(d) | 126,700 | | 12,738 |
| | 1,247,584 |
TOTAL INFORMATION TECHNOLOGY | | 5,567,950 |
MATERIALS - 1.0% |
Chemicals - 0.4% |
Monsanto Co. | 425,100 | | 48,075 |
Sociedad Quimica y Minera de Chile SA (PN-B) sponsored ADR | 900 | | 25 |
| | 48,100 |
Metals & Mining - 0.6% |
Anglo American PLC ADR | 4,430,000 | | 59,584 |
Randgold Resources Ltd. sponsored ADR | 333 | | 29 |
| | 59,613 |
TOTAL MATERIALS | | 107,713 |
TELECOMMUNICATION SERVICES - 0.3% |
Diversified Telecommunication Services - 0.3% |
Level 3 Communications, Inc. (a) | 741,047 | | 32,591 |
Wireless Telecommunication Services - 0.0% |
RingCentral, Inc. | 46,300 | | 691 |
TOTAL TELECOMMUNICATION SERVICES | | 33,282 |
TOTAL COMMON STOCKS (Cost $ 8,598,528) |
10,663,087
|
Convertible Preferred Stocks - 0.9% |
| Shares | | Value (000s) |
CONSUMER DISCRETIONARY - 0.3% |
Household Durables - 0.2% |
Roku, Inc. 8.00% (a)(g) | 16,562,507 | | $ 21,531 |
Internet & Catalog Retail - 0.1% |
One Kings Lane, Inc. Series E (g) | 648,635 | | 8,303 |
Media - 0.0% |
Turn, Inc. Series E (g) | 1,199,041 | | 7,866 |
TOTAL CONSUMER DISCRETIONARY | | 37,700 |
HEALTH CARE - 0.2% |
Biotechnology - 0.2% |
Avalanche Biotechnologies, Inc. Series B (g) | 700,821 | | 17,654 |
INFORMATION TECHNOLOGY - 0.4% |
Internet Software & Services - 0.4% |
Uber Technologies, Inc. 8.00% (g) | 564,041 | | 35,000 |
Software - 0.0% |
Cloudera, Inc. Series F (g) | 126,709 | | 1,982 |
Technology Hardware, Storage & Peripherals - 0.0% |
Pure Storage, Inc. Series E (g) | 184,982 | | 2,516 |
TOTAL INFORMATION TECHNOLOGY | | 39,498 |
TOTAL CONVERTIBLE PREFERRED STOCKS (Cost $78,404) |
94,852
|
Money Market Funds - 4.4% |
| | | |
Fidelity Securities Lending Cash Central Fund, 0.11% (b)(c)
(Cost $472,725) | 472,724,550 | |
472,725
|
TOTAL INVESTMENT PORTFOLIO - 104.2% (Cost $9,149,657) | | 11,230,664 |
NET OTHER ASSETS (LIABILITIES) - (4.2)% | | (454,840) |
NET ASSETS - 100% | $ 10,775,824 |
Legend |
(a) Non-income producing |
(b) Affiliated fund that is generally available only to investment companies and other accounts managed by Fidelity Investments. The rate quoted is the annualized seven-day yield of the fund at period end. A complete unaudited listing of the fund's holdings as of its most recent quarter end is available upon request. In addition, each Fidelity Central Fund's financial statements, which are not covered by the Fund's Report of Independent Registered Public Accounting Firm, are available on the SEC's website or upon request. |
(c) Investment made with cash collateral received from securities on loan. |
(d) Security or a portion of the security is on loan at period end. |
(e) Affiliated company |
(f) Investment is owned by an entity that is treated as a corporation for U.S. tax purposes and is owned by the Fund. |
(g) Restricted securities - Investment in securities not registered under the Securities Act of 1933 (excluding 144A issues). At the end of the period, the value of restricted securities (excluding 144A issues) amounted to $124,029,000 or 1.2% of net assets. |
Additional information on each restricted holding is as follows: |
Security | Acquisition Date | Acquisition Cost (000s) |
Avalanche Biotechnologies, Inc. Series B | 4/17/14 | $ 5,277 |
Cloudera, Inc. Series F | 2/5/14 | $ 1,845 |
Dropbox, Inc. | 5/2/12 | $ 3,000 |
One Kings Lane, Inc. Series E | 1/29/14 | $ 10,000 |
Pure Storage, Inc. Series E | 8/22/13 | $ 1,282 |
Roku, Inc. 8.00% | 5/7/13 | $ 15,000 |
Turn, Inc. Series E | 12/30/13 | $ 10,000 |
Uber Technologies, Inc. 8.00% | 6/6/14 | $ 35,000 |
Wayfair LLC Series B | 3/5/14 | $ 10,000 |
Xero Ltd. | 10/14/13 | $ 10,054 |
Affiliated Central Funds |
Information regarding fiscal year to date income earned by the Fund from investments in Fidelity Central Funds is as follows: |
Fund | Income earned
(Amounts in
thousands) |
Fidelity Cash Central Fund | $ 24 |
Fidelity Securities Lending Cash Central Fund | 5,974 |
Total | $ 5,998 |
Other Affiliated Issuers |
An affiliated company is a company in which the Fund has ownership of at least 5% of the voting securities. Fiscal year to date transactions with companies which are or were affiliates are as follows: |
Affiliate
(Amounts in thousands) | Value,
beginning of
period | Purchases | Sales
Proceeds | Dividend
Income | Value,
end of
period |
Accretive Health, Inc. | $ 98,226 | $ - | $ - | $ - | $ 82,872 |
Angie's List, Inc. | 89,531 | 34,870 | 77,790 | - | - |
athenahealth, Inc. | 189,279 | 204,352 | 186,170 | - | 294,726 |
CommVault Systems, Inc. | - | 211,806 | - | - | 159,387 |
Constant Contact, Inc. | 55,980 | 12,571 | 65,475 | - | - |
E2open, Inc. | 37,709 | 17,160 | 24,600 | - | 25,119 |
Foundation Medicine, Inc. | - | 56,830 | 6,410 | - | 35,879 |
Gameloft Se | 62,909 | - | - | - | 49,492 |
Groupon, Inc. Class A | 36,940 | 546,110 | 85,999 | - | 390,059 |
KYTHERA Biopharmaceuticals, Inc. | - | 60,995 | - | - | 42,226 |
Lion Biotechnologies, Inc. | - | 13,881 | - | - | 12,870 |
Marin Software, Inc. | 26,341 | 1,818 | 27,461 | - | - |
Marketo, Inc. | 4,728 | 85,086 | 22,981 | - | 56,923 |
Mellanox Technologies Ltd. | 43,318 | 101,079 | 114,381 | - | - |
NII Holdings, Inc. | 122,927 | - | 30,102 | - | - |
NVE Corp. | 13,166 | - | - | - | 17,620 |
Portola Pharmaceuticals, Inc. | - | 63,095 | 2,974 | - | 58,747 |
PTC Therapeutics, Inc. | - | 49,842 | 2,122 | - | 55,466 |
Questcor Pharmaceuticals, Inc. | 227,969 | 63,691 | 288,609 | 435 | - |
Rackspace Hosting, Inc. | 284,725 | 184,655 | 59,998 | - | 293,484 |
Radware Ltd. | 49,088 | - | 52,959 | - | - |
Riverbed Technology, Inc. | 135,456 | 120,525 | 247,957 | - | - |
ServiceSource International, Inc. | 46,693 | - | 22,018 | - | - |
Synchronoss Technologies, Inc. | 127,202 | 52,327 | 44,740 | - | 165,112 |
Trulia, Inc. | 56,736 | 129,260 | 237,323 | - | - |
Ubisoft Entertainment SA | 145,537 | 7,099 | - | - | 169,602 |
Ubisoft Entertainment SA warrants 10/10/13 | 1,651 | 1,669 | - | - | - |
Total | $ 1,856,111 | $ 2,018,721 | $ 1,600,069 | $ 435 | $ 1,909,584 |
Other Information |
The following is a summary of the inputs used, as of July 31, 2014, involving the Fund's assets and liabilities carried at fair value. The inputs or methodology used for valuing securities may not be an indication of the risk associated with investing in those securities. For more information on valuation inputs, and their aggregation into the levels used in the table below, please refer to the Investment Valuation section in the accompanying Notes to Financial Statements. |
Valuation Inputs at Reporting Date: |
Description
(Amounts in thousands) | Total | Level 1 | Level 2 | Level 3 |
Investments in Securities: | | | | |
Equities: | | | | |
Consumer Discretionary | $ 1,656,374 | $ 1,608,674 | $ - | $ 47,700 |
Consumer Staples | 500,589 | 500,589 | - | - |
Energy | 36,966 | 36,966 | - | - |
Financials | 433,170 | 433,170 | - | - |
Health Care | 2,158,110 | 2,140,456 | 17,654 | - |
Industrials | 224,287 | 224,287 | - | - |
Information Technology | 5,607,448 | 5,548,773 | 12,844 | 45,831 |
Materials | 107,713 | 107,713 | - | - |
Telecommunication Services | 33,282 | 33,282 | - | - |
Money Market Funds | 472,725 | 472,725 | - | - |
Total Investments in Securities: | $ 11,230,664 | $ 11,106,635 | $ 30,498 | $ 93,531 |
See accompanying notes which are an integral part of the financial statements.
Annual Report
Statement of Assets and Liabilities
Amounts in thousands (except per-share amounts) | July 31, 2014 |
| | |
Assets | | |
Investment in securities, at value (including securities loaned of $448,530) - See accompanying schedule: Unaffiliated issuers (cost $6,627,849) | $ 8,848,355 | |
Fidelity Central Funds (cost $472,725) | 472,725 | |
Other affiliated issuers (cost $2,049,083) | 1,909,584 | |
Total Investments (cost $9,149,657) | | $ 11,230,664 |
Receivable for investments sold | | 291,984 |
Receivable for fund shares sold | | 8,612 |
Dividends receivable | | 598 |
Distributions receivable from Fidelity Central Funds | | 681 |
Receivable from investment adviser for expense reductions | | 2 |
Other receivables | | 291 |
Total assets | | 11,532,832 |
| | |
Liabilities | | |
Payable to custodian bank | $ 6,192 | |
Payable for investments purchased | 256,854 | |
Payable for fund shares redeemed | 15,149 | |
Accrued management fee | 4,505 | |
Other affiliated payables | 1,335 | |
Other payables and accrued expenses | 248 | |
Collateral on securities loaned, at value | 472,725 | |
Total liabilities | | 757,008 |
| | |
Net Assets | | $ 10,775,824 |
Net Assets consist of: | | |
Paid in capital | | $ 7,855,570 |
Accumulated net investment loss | | (142) |
Accumulated undistributed net realized gain (loss) on investments and foreign currency transactions | | 839,418 |
Net unrealized appreciation (depreciation) on investments and assets and liabilities in foreign currencies | | 2,080,978 |
Net Assets | | $ 10,775,824 |
See accompanying notes which are an integral part of the financial statements.
Annual Report
Financial Statements - continued
Statement of Assets and Liabilities - continued
Amounts in thousands (except per-share amounts) | July 31, 2014 |
| | |
OTC:
Net Asset Value, offering price and redemption price per share ($7,869,812 ÷ 96,883 shares) | | $ 81.23 |
| | |
Class K:
Net Asset Value, offering price and redemption price per share ($2,906,012 ÷ 35,455 shares) | | $ 81.96 |
See accompanying notes which are an integral part of the financial statements.
Annual Report
Statement of Operations
Amounts in thousands | Year ended July 31, 2014 |
| | |
Investment Income | | |
Dividends (including $435 earned from other affiliated issuers) | | $ 64,604 |
Income from Fidelity Central Funds (including $5,974 from security lending) | | 5,998 |
Total income | | 70,602 |
| | |
Expenses | | |
Management fee
Basic fee | $ 61,873 | |
Performance adjustment | (2,441) | |
Transfer agent fees | 14,091 | |
Accounting and security lending fees | 1,401 | |
Custodian fees and expenses | 267 | |
Independent trustees' compensation | 42 | |
Appreciation in deferred trustee compensation account | 1 | |
Registration fees | 260 | |
Audit | 72 | |
Legal | 46 | |
Interest | 16 | |
Miscellaneous | 75 | |
Total expenses before reductions | 75,703 | |
Expense reductions | (510) | 75,193 |
Net investment income (loss) | | (4,591) |
Realized and Unrealized Gain (Loss) Net realized gain (loss) on: | | |
Investment securities: | | |
Unaffiliated issuers | 1,453,613 | |
Other affiliated issuers | (13,710) | |
Foreign currency transactions | 9 | |
Total net realized gain (loss) | | 1,439,912 |
Change in net unrealized appreciation (depreciation) on: Investment securities | | 164,549 |
Net gain (loss) | | 1,604,461 |
Net increase (decrease) in net assets resulting from operations | | $ 1,599,870 |
See accompanying notes which are an integral part of the financial statements.
Annual Report
Financial Statements - continued
Statement of Changes in Net Assets
Amounts in thousands | Year ended
July 31,
2014 | Year ended
July 31,
2013 |
Increase (Decrease) in Net Assets | | |
Operations | | |
Net investment income (loss) | $ (4,591) | $ 43,443 |
Net realized gain (loss) | 1,439,912 | 1,100,950 |
Change in net unrealized appreciation (depreciation) | 164,549 | 1,322,673 |
Net increase (decrease) in net assets resulting
from operations | 1,599,870 | 2,467,066 |
Distributions to shareholders from net investment income | (7,143) | (33,821) |
Distributions to shareholders from net realized gain | (1,239,587) | - |
Total distributions | (1,246,730) | (33,821) |
Share transactions - net increase (decrease) | 1,469,555 | (622,836) |
Total increase (decrease) in net assets | 1,822,695 | 1,810,409 |
| | |
Net Assets | | |
Beginning of period | 8,953,129 | 7,142,720 |
End of period (including accumulated net investment loss of $142 and undistributed net investment income of $6,993, respectively) | $ 10,775,824 | $ 8,953,129 |
See accompanying notes which are an integral part of the financial statements.
Annual Report
Financial Highlights - OTC
Years ended July 31, | 2014 | 2013 | 2012 | 2011 | 2010 |
Selected Per-Share Data | | | | | |
Net asset value, beginning of period | $ 78.98 | $ 57.53 | $ 59.28 | $ 45.00 | $ 38.73 |
Income from Investment Operations | | | | | |
Net investment income (loss) B | (.06) | .36 E | (.08) F | (.27) | (.23) |
Net realized and unrealized gain (loss) | 12.78 | 21.37 | (1.67) | 14.55 | 6.50 |
Total from investment operations | 12.72 | 21.73 | (1.75) | 14.28 | 6.27 |
Distributions from net investment income | (.05) | (.28) | - | - | - |
Distributions from net realized gain | (10.42) | - | - | - | - |
Total distributions | (10.47) | (.28) | - | - | - |
Net asset value, end of period | $ 81.23 | $ 78.98 | $ 57.53 | $ 59.28 | $ 45.00 |
Total ReturnA | 17.96% | 37.93% | (2.95)% | 31.73% | 16.19% |
Ratios to Average Net Assets C, G | | | | | |
Expenses before reductions | .77% | .76% | .91% | .94% | 1.06% |
Expenses net of fee waivers, if any | .77% | .76% | .91% | .94% | 1.06% |
Expenses net of all reductions | .76% | .74% | .90% | .92% | 1.04% |
Net investment income (loss) | (.08)% | .55% E | (.14)% F | (.49)% | (.51)% |
Supplemental Data | | | | | |
Net assets, end of period (in millions) | $ 7,870 | $ 6,693 | $ 5,499 | $ 6,374 | $ 5,080 |
Portfolio turnover rateD | 106% | 116% | 149% | 158% | 163% |
A Total returns would have been lower if certain expenses had not been reduced during the applicable periods shown.
B Calculated based on average shares outstanding during the period.
C Fees and expenses of any underlying Fidelity Central Funds are not included in the Fund's expense ratio. The Fund indirectly bears its proportionate share of the expenses of any underlying Fidelity Central Funds.
D Amount does not include the portfolio activity of any underlying Fidelity Central Funds.
E Investment income per share reflects a large, non-recurring dividend which amounted to $.10 per share. Excluding this non-recurring dividend, the ratio of net investment income (loss) to average net assets would have been .40%.
F Investment income per share reflects a large, non-recurring dividend which amounted to $.03 per share. Excluding this non-recurring dividend, the ratio of net investment income (loss) to average net assets would have been (.20)%.
G Expense ratios reflect operating expenses of the class. Expenses before reductions do not reflect amounts reimbursed by the investment adviser or reductions from brokerage service arrangements or reductions from other expense offset arrangements and do not represent the amount paid by the class during periods when reimbursements or reductions occur. Expenses net of fee waivers reflect expenses after reimbursement by the investment adviser but prior to reductions from brokerage service arrangements or other expense offset arrangements. Expenses net of all reductions represent the net expenses paid by the class.
See accompanying notes which are an integral part of the financial statements.
Annual Report
Financial Highlights - Class K
Years ended July 31, | 2014 | 2013 | 2012 | 2011 | 2010 |
Selected Per-Share Data | | | | | |
Net asset value, beginning of period | $ 79.60 | $ 57.94 | $ 59.61 | $ 45.19 | $ 38.83 |
Income from Investment Operations | | | | | |
Net investment income (loss) B | .04 | .45 F | - G, I | (.19) | (.16) |
Net realized and unrealized gain (loss) | 12.87 | 21.53 | (1.67) | 14.61 | 6.52 |
Total from investment operations | 12.91 | 21.98 | (1.67) | 14.42 | 6.36 |
Distributions from net investment income | (.10) | (.32) | - | - | - |
Distributions from net realized gain | (10.46) | - | - | - | - |
Total distributions | (10.55) J | (.32) | - | - | - |
Net asset value, end of period | $ 81.96 | $ 79.60 | $ 57.94 | $ 59.61 | $ 45.19 |
Total ReturnA | 18.10% | 38.11% | (2.80)% | 31.91% | 16.38% |
Ratios to Average Net Assets C, H | | | | | |
Expenses before reductions | .65% | .62% | .77% | .80% | .90% |
Expenses net of fee waivers, if any | .65% | .62% | .77% | .80% | .90% |
Expenses net of all reductions | .64% | .60% | .76% | .78% | .88% |
Net investment income (loss) | .05% | .69% F | -% E, G | (.35)% | (.35)% |
Supplemental Data | | | | | |
Net assets, end of period (in millions) | $ 2,906 | $ 2,260 | $ 1,644 | $ 1,363 | $ 936 |
Portfolio turnover rateD | 106% | 116% | 149% | 158% | 163% |
A Total returns would have been lower if certain expenses had not been reduced during the applicable periods shown.
B Calculated based on average shares outstanding during the period.
C Fees and expenses of any underlying Fidelity Central Funds are not included in the Fund's expense ratio. The Fund indirectly bears its proportionate share of the expenses of any underlying Fidelity Central Funds.
D Amount does not include the portfolio activity of any underlying Fidelity Central Funds.
E Amount represents less than .01%.
F Investment income per share reflects a large, non-recurring dividend which amounted to $.10 per share. Excluding this non-recurring dividend, the ratio of net investment income (loss) to average net assets would have been .53%.
G Investment income per share reflects a large, non-recurring dividend which amounted to $.03 per share. Excluding this non-recurring dividend, the ratio of net investment income (loss) to average net assets would have been (.06)%.
H Expense ratios reflect operating expenses of the class. Expenses before reductions do not reflect amounts reimbursed by the investment adviser or reductions from brokerage service arrangements or reductions from other expense offset arrangements and do not represent the amount paid by the class during periods when reimbursements or reductions occur. Expenses net of fee waivers reflect expenses after reimbursement by the investment adviser but prior to reductions from brokerage service arrangements or other expense offset arrangements. Expenses net of all reductions represent the net expenses paid by the class.
I Amount represents less than $.01 per share.
J Total distributions of $10.55 per share is comprised of distributions from net investment income of $.098 and distributions from net realized gain of $10.456 per share.
See accompanying notes which are an integral part of the financial statements.
Annual Report
Notes to Financial Statements
For the period ended July 31, 2014
(Amounts in thousands except percentages)
1. Organization.
Fidelity OTC Portfolio (the Fund) is a non-diversified fund of Fidelity Securities Fund (the Trust) and is authorized to issue an unlimited number of shares. The Trust is registered under the Investment Company Act of 1940, as amended (the 1940 Act), as an open-end management investment company organized as a Massachusetts business trust. The Fund offers OTC and Class K shares, each of which has equal rights as to assets and voting privileges. Each class has exclusive voting rights with respect to matters that affect that class.
2. Investments in Fidelity Central Funds.
The Fund invests in Fidelity Central Funds, which are open-end investment companies generally available only to other investment companies and accounts managed by the investment adviser and its affiliates. The Fund's Schedule of Investments lists each of the Fidelity Central Funds held as of period end, if any, as an investment of the Fund, but does not include the underlying holdings of each Fidelity Central Fund. As an Investing Fund, the Fund indirectly bears its proportionate share of the expenses of the underlying Fidelity Central Funds.
The Money Market Central Funds seek preservation of capital and current income and are managed by Fidelity Investments Money Management, Inc. (FIMM), an affiliate of the investment adviser. Annualized expenses of the Money Market Central Funds as of their most recent shareholder report date are less than .01%.
A complete unaudited list of holdings for each Fidelity Central Fund is available upon request or at the Securities and Exchange Commission (the SEC) website at www.sec.gov. In addition, the financial statements of the Fidelity Central Funds, which are not covered by the Fund's Report of Independent Registered Public Accounting Firm, are available on the SEC website or upon request.
3. Significant Accounting Policies.
The financial statements have been prepared in conformity with accounting principles generally accepted in the United States of America (GAAP), which require management to make certain estimates and assumptions at the date of the financial statements. Actual results could differ from those estimates. Subsequent events, if any, through the date that the financial statements were issued have been evaluated in the preparation of the financial statements. The following summarizes the significant accounting policies of the Fund:
Investment Valuation. Investments are valued as of 4:00 p.m. Eastern time on the last calendar day of the period. In accordance with valuation policies and procedures approved by the Board of Trustees (the Board), the Fund attempts to obtain prices from
Annual Report
Notes to Financial Statements - continued
(Amounts in thousands except percentages)
3. Significant Accounting Policies - continued
Investment Valuation - continued
one or more third party pricing vendors or brokers to value its investments. When current market prices, quotations or currency exchange rates are not readily available or reliable, investments will be fair valued in good faith by the Fidelity Management & Research Company (FMR) Fair Value Committee (the Committee), in accordance with procedures adopted by the Board. Factors used in determining fair value vary by investment type and may include market or investment specific events. The frequency with which these procedures are used cannot be predicted and they may be utilized to a significant extent. The Committee oversees the Fund's valuation policies and procedures and is responsible for approving and reporting to the Board all fair value determinations.
The Fund categorizes the inputs to valuation techniques used to value its investments into a disclosure hierarchy consisting of three levels as shown below:
Level 1 - quoted prices in active markets for identical investments
Level 2 - other significant observable inputs (including quoted prices for similar investments, interest rates, prepayment speeds, etc.)
Level 3 - unobservable inputs (including the Fund's own assumptions based on the best information available)
Valuation techniques used to value the Fund's investments by major category are as follows:
Equity securities, including restricted securities, for which market quotations are readily available, are valued at the last reported sale price or official closing price as reported by a third party pricing vendor on the primary market or exchange on which they are traded and are categorized as Level 1 in the hierarchy. In the event there were no sales during the day or closing prices are not available, securities are valued at the last quoted bid price or may be valued using the last available price and are generally categorized as Level 2 in the hierarchy. For foreign equity securities, when market or security specific events arise, comparisons to the valuation of American Depositary Receipts (ADRs), futures contracts, Exchange-Traded Funds (ETFs) and certain indexes as well as quoted prices for similar securities may be used and would be categorized as Level 2 in the hierarchy. Utilizing these techniques may result in transfers between Level 1 and Level 2. For equity securities, including restricted securities, where observable inputs are limited, assumptions about market activity and risk are used and these securities may be categorized as Level 3 in the hierarchy.
Investments in open-end mutual funds, including the Fidelity Central Funds, are valued at their closing net asset value (NAV) each business day and are categorized as Level 1 in the hierarchy.
Annual Report
3. Significant Accounting Policies - continued
Investment Valuation - continued
Changes in valuation techniques may result in transfers in or out of an assigned level within the disclosure hierarchy. The aggregate value of investments by input level, as of July 31, 2014, is included at the end of the Fund's Schedule of Investments.
Foreign Currency. The Fund may use foreign currency contracts to facilitate transactions in foreign-denominated securities. Gains and losses from these transactions may arise from changes in the value of the foreign currency or if the counterparties do not perform under the contracts' terms.
Foreign-denominated assets, including investment securities, and liabilities are translated into U.S. dollars at the exchange rates at period end. Purchases and sales of investment securities, income and dividends received and expenses denominated in foreign currencies are translated into U.S. dollars at the exchange rate in effect on the transaction date.
The effects of exchange rate fluctuations on investments are included with the net realized and unrealized gain (loss) on investment securities. Other foreign currency transactions resulting in realized and unrealized gain (loss) are disclosed separately.
Investment Transactions and Income. For financial reporting purposes, the Fund's investment holdings and NAV include trades executed through the end of the last business day of the period. The NAV per share for processing shareholder transactions is calculated as of the close of business of the New York Stock Exchange (NYSE), normally 4:00 p.m. Eastern time and includes trades executed through the end of the prior business day. Gains and losses on securities sold are determined on the basis of identified cost and may include proceeds received from litigation. Dividend income is recorded on the ex-dividend date, except for certain dividends from foreign securities where the ex-dividend date may have passed, which are recorded as soon as the Fund is informed of the ex-dividend date. Non-cash dividends included in dividend income, if any, are recorded at the fair market value of the securities received. Income and capital gain distributions from Fidelity Central Funds, if any, are recorded on the ex-dividend date. Distributions received on securities that represent a return of capital or capital gain are recorded as a reduction of cost of investments and/or as a realized gain. Subsequent to ex-dividend date the Fund determines the components of these distributions, based upon receipt of tax filings or other correspondence relating to the underlying investment. Interest income is accrued as earned and includes coupon interest and amortization of premium and accretion of discount on debt securities as applicable. Investment income is recorded net of foreign taxes withheld where recovery of such taxes is uncertain.
Class Allocations and Expenses. Investment income, realized and unrealized capital gains and losses, common expenses of the Fund, and certain fund-level expense
Annual Report
Notes to Financial Statements - continued
(Amounts in thousands except percentages)
3. Significant Accounting Policies - continued
Class Allocations and Expenses - continued
reductions, if any, are allocated daily on a pro-rata basis to each class based on the relative net assets of each class to the total net assets of the Fund. Each class differs with respect to transfer agent fees incurred. Certain expense reductions may also differ by class. For the reporting period, the allocated portion of income and expenses to each class as a percent of its average net assets may vary due to the timing of recording these transactions in relation to fluctuating net assets of the classes. Expenses directly attributable to a fund are charged to that fund. Expenses attributable to more than one fund are allocated among the respective funds on the basis of relative net assets or other appropriate methods. Expense estimates are accrued in the period to which they relate and adjustments are made when actual amounts are known.
Deferred Trustee Compensation. Under a Deferred Compensation Plan (the Plan), independent Trustees may elect to defer receipt of a portion of their annual compensation. Deferred amounts are invested in a cross-section of Fidelity funds, are marked-to-market and remain in the Fund until distributed in accordance with the Plan. The investment of deferred amounts and the offsetting payable to the Trustees are included in the accompanying Statement of Assets and Liabilities.
Income Tax Information and Distributions to Shareholders. Each year, the Fund intends to qualify as a regulated investment company under Subchapter M of the Internal Revenue Code, including distributing substantially all of its taxable income and realized gains. As a result, no provision for U.S. Federal income taxes is required. As of July 31, 2014, the Fund did not have any unrecognized tax benefits in the financial statements; nor is the Fund aware of any tax positions for which it is reasonably possible that the total amounts of unrecognized tax benefits will significantly change in the next twelve months. The Fund files a U.S. federal tax return, in addition to state and local tax returns as required. The Fund's federal income tax returns are subject to examination by the Internal Revenue Service (IRS) for a period of three fiscal years after they are filed. State and local tax returns may be subject to examination for an additional fiscal year depending on the jurisdiction. Foreign taxes are provided for based on the Fund's understanding of the tax rules and rates that exist in the foreign markets in which it invests.
Distributions are declared and recorded on the ex-dividend date. Income dividends and capital gain distributions are declared separately for each class. Income and capital gain distributions are determined in accordance with income tax regulations, which may differ from GAAP. In addition, the Fund claimed a portion of the payment made to redeeming shareholders as a distribution for income tax purposes.
Annual Report
3. Significant Accounting Policies - continued
Income Tax Information and Distributions to Shareholders - continued
Capital accounts within the financial statements are adjusted for permanent book-tax differences. These adjustments have no impact on net assets or the results of operations.
Capital accounts are not adjusted for temporary book-tax differences which will reverse in a subsequent period.
Book-tax differences are primarily due to foreign currency transactions, partnerships, deferred trustees compensation and losses deferred due to wash sales.
The federal tax cost of investment securities and unrealized appreciation (depreciation) as of period end were as follows:
Gross unrealized appreciation | $ 2,680,914 |
Gross unrealized depreciation | (653,054) |
Net unrealized appreciation (depreciation) on securities | $ 2,027,860 |
| |
Tax Cost | $ 9,202,804 |
The tax-based components of distributable earnings as of period end were as follows:
Undistributed ordinary income | $ 439,889 |
Undistributed long-term capital gain | $ 452,675 |
Net unrealized appreciation (depreciation) on securities and other investments | $ 2,027,832 |
The tax character of distributions paid was as follows:
| July 31, 2014 | July 31, 2013 |
Ordinary Income | $ 324,481 | $ 33,821 |
Long-term Capital Gains | 922,249 | - |
Total | $ 1,246,730 | $ 33,821 |
Restricted Securities. The Fund may invest in securities that are subject to legal or contractual restrictions on resale. These securities generally may be resold in transactions exempt from registration or to the public if the securities are registered. Disposal of these securities may involve time-consuming negotiations and expense, and prompt sale at an acceptable price may be difficult. Information regarding restricted securities is included at the end of the Fund's Schedule of Investments.
4. Purchases and Sales of Investments.
Purchases and sales of securities, other than short-term securities, aggregated $11,070,426 and $10,811,193, respectively.
Annual Report
Notes to Financial Statements - continued
(Amounts in thousands except percentages)
5. Fees and Other Transactions with Affiliates.
Management Fee. Fidelity Management & Research Company (the investment adviser) and its affiliates provide the Fund with investment management related services for which the Fund pays a monthly management fee. The management fee is the sum of an individual fund fee rate that is based on an annual rate of .35% of the Fund's average net assets and an annualized group fee rate that averaged .25% during the period. The group fee rate is based upon the average net assets of all the mutual funds advised by the investment adviser, including any mutual funds previously advised by the investment adviser that are currently advised by Fidelity SelectCo, LLC, an affiliate of the investment adviser. The group fee rate decreases as assets under management increase and increases as assets under management decrease. In addition, the management fee is subject to a performance adjustment (up to a maximum of ± .20% of the Fund's average net assets over a 36 month performance period). The upward or downward adjustment to the management fee is based on the relative investment performance of OTC as compared to its benchmark index, the Nasdaq Composite Index, over the same 36 month performance period. For the reporting period, the total annual management fee rate, including the performance adjustment, was .58% of the Fund's average net assets. The performance adjustment included in the management fee rate may be higher or lower than the maximum performance adjustment rate due to the difference between the average net assets for the reporting and performance periods.
Transfer Agent Fees. Fidelity Investments Institutional Operations Company, Inc., (FIIOC), an affiliate of the investment adviser, is the transfer, dividend disbursing and shareholder servicing agent for each class of the Fund. FIIOC receives account fees and asset-based fees that vary according to the account size and type of account of the shareholders of OTC. FIIOC receives an asset-based fee of Class K's average net assets. FIIOC pays for typesetting, printing and mailing of shareholder reports, except proxy statements.
For the period, transfer agent fees for each class were as follows:
| Amount | % of
Average
Net Assets |
OTC | $ 12,856 | .17 |
Class K | 1,235 | .05 |
| $ 14,091 | |
Accounting and Security Lending Fees. Fidelity Service Company, Inc. (FSC), an affiliate of the investment adviser, maintains the Fund's accounting records. The accounting fee is based on the level of average net assets for each month. Under a separate contract, FSC administers the security lending program. The security lending fee is based on the number and duration of lending transactions.
Annual Report
5. Fees and Other Transactions with Affiliates - continued
Brokerage Commissions. The Fund placed a portion of its portfolio transactions with brokerage firms which are affiliates of the investment adviser. Brokerage commissions are included in net realized gain (loss) and change in net unrealized appreciation (depreciation) in the Statement of Operations. The commissions paid to these affiliated firms were $309 for the period.
Interfund Lending Program. Pursuant to an Exemptive Order issued by the SEC, the Fund, along with other registered investment companies having management contracts with FMR or other affiliated entities of FMR, may participate in an interfund lending program. This program provides an alternative credit facility allowing the funds to borrow from, or lend money to, other participating affiliated funds. At period end, there were no interfund loans outstanding. The Fund's activity in this program during the period for which loans were outstanding was as follows:
Borrower or Lender | Average Loan
Balance | Weighted Average
Interest Rate | Interest Expense |
Borrower | $ 16,820 | .32% | $ 12 |
Other. During the period, the investment adviser reimbursed the Fund for certain losses in the amount of $8.
6. Committed Line of Credit.
The Fund participates with other funds managed by the investment adviser or an affiliate in a $4.25 billion credit facility (the "line of credit") to be utilized for temporary or emergency purposes to fund shareholder redemptions or for other short-term liquidity purposes. The Fund has agreed to pay commitment fees on its pro-rata portion of the line of credit, which amounted to $17 and is reflected in Miscellaneous expenses on the Statement of Operations. During the period, the Fund did not borrow on this line of credit.
7. Security Lending.
The Fund lends portfolio securities through a lending agent from time to time in order to earn additional income. For equity securities, a lending agent is used and may loan securities to certain qualified borrowers, including Fidelity Capital Markets (FCM), a broker-dealer affiliated with the Fund. On the settlement date of the loan, the Fund receives collateral (in the form of U.S. Treasury obligations, letters of credit and/or cash) against the loaned securities and maintains collateral in an amount not less than 100% of the market value of the loaned securities during the period of the loan. The market value of the loaned securities is determined at the close of business of the Fund and any additional required collateral is delivered to the Fund on the next business day. If the
Annual Report
Notes to Financial Statements - continued
(Amounts in thousands except percentages)
7. Security Lending - continued
borrower defaults on its obligation to return the securities loaned because of insolvency or other reasons, the Fund may apply collateral received from the borrower against the obligation. The Fund may experience delays and costs in recovering the securities loaned. Any cash collateral received is invested in the Fidelity Securities Lending Cash Central Fund. The value of loaned securities and cash collateral at period end are disclosed on the Fund's Statement of Assets and Liabilities. The value of securities loaned to FCM at period end was $4,206. Security lending income represents the income earned on investing cash collateral, less rebates paid to borrowers and any lending agent fees associated with the loan, plus any premium payments received for lending certain types of securities. Security lending income is presented in the Statement of Operations as a component of income from Fidelity Central Funds, and includes $354 from securities loaned to FCM.
8. Bank Borrowings.
The Fund is permitted to have bank borrowings for temporary or emergency purposes to fund shareholder redemptions or for other short-term liquidity requirements. The Fund has established borrowing arrangements with certain banks. The interest rate on the borrowings is the bank's base rate, as revised from time to time. The average loan balance during the period for which loans were outstanding amounted to $27,027. The weighted average interest rate was .58%. The interest expense amounted to $4 under the bank borrowing program. At period end, there were no bank borrowings outstanding.
9. Expense Reductions.
Commissions paid to certain brokers with whom the investment adviser, or its affiliates, places trades on behalf of the Fund include an amount in addition to trade execution, which may be rebated back to the Fund to offset certain expenses. This amount totaled $443 for the period.
In addition, the investment adviser reimbursed a portion of the Fund's operating expenses during the period in the amount of $67.
10. Distributions to Shareholders.
Distributions to shareholders of each class were as follows:
Years ended July 31, | 2014 | 2013 |
From net investment income | | |
OTC | $ 4,344 | $ 24,686 |
Class K | 2,799 | 9,135 |
Total | $ 7,143 | $ 33,821 |
Annual Report
10. Distributions to Shareholders - continued
Years ended July 31, | 2014 | 2013 |
From net realized gain | | |
OTC | $ 926,740 | $ - |
Class K | 312,847 | - |
Total | $ 1,239,587 | $ - |
11. Share Transactions.
Transactions for each class of shares were as follows:
| Shares | Dollars |
Years ended July 31, | 2014 | 2013 | 2014 | 2013 |
OTC | | | | |
Shares sold | 26,717 | 13,349 | $ 2,114,409 | $ 888,988 |
Reinvestment of distributions | 12,308 | 400 | 905,081 | 23,934 |
Shares redeemed | (26,885) | (24,580) | (2,095,020) | (1,536,509) |
Net increase (decrease) | 12,140 | (10,831) | $ 924,470 | $ (623,587) |
Class K | | | | |
Shares sold | 11,495 | 8,116 | $ 915,992 | $ 517,177 |
Reinvestment of distributions | 4,258 | 152 | 315,646 | 9,135 |
Shares redeemed | (8,692) | (8,251) | (686,553) | (525,561) |
Net increase (decrease) | 7,061 | 17 | $ 545,085 | $ 751 |
12. Other.
The Fund's organizational documents provide former and current trustees and officers with a limited indemnification against liabilities arising in connection with the performance of their duties to the Fund. In the normal course of business, the Fund may also enter into contracts that provide general indemnifications. The Fund's maximum exposure under these arrangements is unknown as this would be dependent on future claims that may be made against the Fund. The risk of material loss from such claims is considered remote.
Annual Report
To the Trustees of Fidelity Securities Fund and Shareholders of Fidelity OTC Portfolio:
We have audited the accompanying statement of assets and liabilities of Fidelity OTC Portfolio (the Fund), a fund of Fidelity Securities Fund, including the schedule of investments, as of July 31, 2014, and the related statement of operations for the year then ended, the statement of changes in net assets for each of the two years in the period then ended, and the financial highlights for each of the five years in the period then ended. These financial statements and financial highlights are the responsibility of the Fund's management. Our responsibility is to express an opinion on these financial statements and financial highlights based on our audits.
We conducted our audits in accordance with the standards of the Public Company Accounting Oversight Board (United States). Those standards require that we plan and perform the audit to obtain reasonable assurance about whether the financial statements and financial highlights are free of material misstatement. The Fund is not required to have, nor were we engaged to perform, an audit of its internal control over financial reporting. Our audits included consideration of internal control over financial reporting as a basis for designing audit procedures that are appropriate in the circumstances, but not for the purpose of expressing an opinion on the effectiveness of the Fund's internal control over financial reporting. Accordingly, we express no such opinion. An audit also includes examining, on a test basis, evidence supporting the amounts and disclosures in the financial statements, assessing the accounting principles used and significant estimates made by management, as well as evaluating the overall financial statement presentation. Our procedures included confirmation of securities owned as of July 31, 2014, by correspondence with the custodians and brokers; where replies were not received from brokers, we performed other auditing procedures. We believe that our audits provide a reasonable basis for our opinion.
In our opinion, the financial statements and financial highlights referred to above present fairly, in all material respects, the financial position of Fidelity OTC Portfolio as of July 31, 2014, the results of its operations for the year then ended, the changes in its net assets for each of the two years in the period then ended, and the financial highlights for each of the five years in the period then ended, in conformity with accounting principles generally accepted in the United States of America.
DELOITTE & TOUCHE LLP
Boston, Massachusetts
September 15, 2014
Annual Report
The Trustees, Member of the Advisory Board, and officers of the trust and fund, as applicable, are listed below. The Board of Trustees governs the fund and is responsible for protecting the interests of shareholders. The Trustees are experienced executives who meet periodically throughout the year to oversee the fund's activities, review contractual arrangements with companies that provide services to the fund, oversee management of the risks associated with such activities and contractual arrangements, and review the fund's performance. Except for James C. Curvey, each of the Trustees oversees 173 funds. Mr. Curvey oversees 397 funds.
The Trustees hold office without limit in time except that (a) any Trustee may resign; (b) any Trustee may be removed by written instrument, signed by at least two-thirds of the number of Trustees prior to such removal; (c) any Trustee who requests to be retired or who has become incapacitated by illness or injury may be retired by written instrument signed by a majority of the other Trustees; and (d) any Trustee may be removed at any special meeting of shareholders by a two-thirds vote of the outstanding voting securities of the trust. Each Trustee who is not an interested person (as defined in the 1940 Act) of the trust and the fund (Independent Trustee), shall retire not later than the last day of the calendar year in which his or her 75th birthday occurs. The Independent Trustees may waive this mandatory retirement age policy with respect to individual Trustees. The officers and Advisory Board Member hold office without limit in time, except that any officer and Advisory Board Member may resign or may be removed by a vote of a majority of the Trustees at any regular meeting or any special meeting of the Trustees. Except as indicated, each individual has held the office shown or other offices in the same company for the past five years.
Experience, Skills, Attributes, and Qualifications of the Fund's Trustees. The Governance and Nominating Committee has adopted a statement of policy that describes the experience, qualifications, attributes, and skills that are necessary and desirable for potential Independent Trustee candidates (Statement of Policy). The Board believes that each Trustee satisfied at the time he or she was initially elected or appointed a Trustee, and continues to satisfy, the standards contemplated by the Statement of Policy. The Governance and Nominating Committee also engages professional search firms to help identify potential Independent Trustee candidates who have the experience, qualifications, attributes, and skills consistent with the Statement of Policy. From time to time, additional criteria based on the composition and skills of the current Independent Trustees, as well as experience or skills that may be appropriate in light of future changes to board composition, business conditions, and regulatory or other developments, have also been considered by the professional search firms and the Governance and Nominating Committee. In addition, the Board takes into account the Trustees' commitment and participation in Board and committee meetings, as well as their leadership of standing and ad hoc committees throughout their tenure.
In determining that a particular Trustee was and continues to be qualified to serve as a Trustee, the Board has considered a variety of criteria, none of which, in isolation, was controlling. The Board believes that, collectively, the Trustees have balanced and diverse experience, qualifications, attributes, and skills, which allow the Board to operate effectively in governing the fund and protecting the interests of shareholders. Information about the specific experience, skills, attributes, and qualifications of each Trustee, which in each case led to the Board's conclusion that the Trustee should serve (or continue to serve) as a trustee of the fund, is provided below.
Annual Report
Board Structure and Oversight Function. James C. Curvey is an interested person (as defined in the 1940 Act) and currently serves as Chairman. The Trustees have determined that an interested Chairman is appropriate and benefits shareholders because an interested Chairman has a personal and professional stake in the quality and continuity of services provided to the fund. Independent Trustees exercise their informed business judgment to appoint an individual of their choosing to serve as Chairman, regardless of whether the Trustee happens to be independent or a member of management. The Independent Trustees have determined that they can act independently and effectively without having an Independent Trustee serve as Chairman and that a key structural component for assuring that they are in a position to do so is for the Independent Trustees to constitute a substantial majority for the Board. The Independent Trustees also regularly meet in executive session. Ned C. Lautenbach serves as Chairman of the Independent Trustees and as such (i) acts as a liaison between the Independent Trustees and management with respect to matters important to the Independent Trustees and (ii) with management prepares agendas for Board meetings.
Fidelity funds are overseen by different Boards of Trustees. The fund's Board oversees Fidelity's equity and high income funds and another Board oversees Fidelity's investment-grade bond, money market, and asset allocation funds. The asset allocation funds may invest in Fidelity funds overseen by the fund's Board. The use of separate Boards, each with its own committee structure, allows the Trustees of each group of Fidelity funds to focus on the unique issues of the funds they oversee, including common research, investment, and operational issues. On occasion, the separate Boards establish joint committees to address issues of overlapping consequences for the Fidelity funds overseen by each Board.
The Trustees operate using a system of committees to facilitate the timely and efficient consideration of all matters of importance to the Trustees, the fund, and fund shareholders and to facilitate compliance with legal and regulatory requirements and oversight of the fund's activities and associated risks. The Board, acting through its committees, has charged FMR and its affiliates with (i) identifying events or circumstances the occurrence of which could have demonstrably adverse effects on the fund's business and/or reputation; (ii) implementing processes and controls to lessen the possibility that such events or circumstances occur or to mitigate the effects of such events or circumstances if they do occur; and (iii) creating and maintaining a system designed to evaluate continuously business and market conditions in order to facilitate the identification and implementation processes described in (i) and (ii) above. Because the day-to-day operations and activities of the fund are carried out by or through FMR, its affiliates and other service providers, the fund's exposure to risks is mitigated but not eliminated by the processes overseen by the Trustees. While each of the Board's committees has responsibility for overseeing different aspects of the fund's activities, oversight is exercised primarily through the Operations, Audit, and Compliance Committees. In addition, the Independent Trustees have worked with FMR to enhance the Board's oversight of investment and financial risks, legal and regulatory risks, technology risks, and operational risks, including the development of additional risk reporting to the Board. For example, a working group comprised of Independent Trustees and FMR has worked and continues to work to review the Fidelity funds' valuation-related activities, reporting and risk management. Appropriate personnel, including but not limited to the fund's Chief Compliance Officer (CCO), FMR's internal auditor, the independent accountants, the fund's Treasurer and portfolio management personnel, make periodic reports to the Board's committees, as appropriate, including an annual review of FMR's risk management program for the Fidelity funds. The responsibilities of each standing committee, including their oversight responsibilities, are described further under "Standing Committees of the Fund's Trustees."
Annual Report
Trustees and Officers - continued
The fund's Statement of Additional Information (SAI) includes more information about the Trustees. To request a free copy, call Fidelity at 1-800-835-5092.
Interested Trustees*:
Correspondence intended for each Trustee who is an interested person may be sent to Fidelity Investments, 245 Summer Street, Boston, Massachusetts 02210.
Name, Year of Birth; Principal Occupations and Other Relevant Experience+ |
James C. Curvey (1935) |
Year of Election or Appointment: 2007 Trustee Chairman of the Board of Trustees |
| Mr. Curvey also serves as Trustee of other Fidelity funds. Mr. Curvey is a Director of Fidelity Research & Analysis Co. (2009-present), and Vice Chairman (2007-present) and Director of FMR LLC. In addition, Mr. Curvey serves as an Overseer for the Boston Symphony Orchestra and a member of the Trustees of Villanova University. Previously, Mr. Curvey served as a Director of Fidelity Investments Money Management, Inc. (2009-2014), a Director of FMR (2007-2014), a Director of FMR Co., Inc. (2007-2014) and was the Vice Chairman (2006-2007) and Director (2000-2007) of FMR Corp. |
Charles S. Morrison (1960) |
Year of Election or Appointment: 2014 Trustee |
| Mr. Morrison also serves as Trustee of other funds. He serves as President, Asset Management (2014-present) and is an employee of Fidelity Investments. Previously, Mr. Morrison served as Vice President of Fidelity's Fixed Income and Asset Allocation Funds (2012-2014), President, Fixed Income (2011-2014), Vice President of Fidelity's Money Market Funds (2005-2009), President, Money Market Group Leader of FMR (2009), and Senior Vice President, Money Market Group of FMR (2004-2009). Mr. Morrison also served as Vice President of Fidelity's Bond Funds (2002-2005), certain Balanced Funds (2002-2005), and certain Asset Allocation Funds (2002-2007), and as Senior Vice President (2002-2005) of Fidelity's Bond Division. |
* Trustees have been determined to be "Interested Trustees" by virtue of, among other things, their affiliation with the trust or various entities under common control with FMR.
+ The information above includes each Trustee's principal occupation during the last five years and other information relating to the experience, attributes, and skills relevant to each Trustee's qualifications to serve as a Trustee, which led to the conclusion that each Trustee should serve as a Trustee for the fund.
Annual Report
Trustees and Officers - continued
Independent Trustees:
Correspondence intended for each Independent Trustee (that is, the Trustees other than the Interested Trustees) may be sent to Fidelity Investments, P.O. Box 55235, Boston, Massachusetts 02205-5235.
Name, Year of Birth; Principal Occupations and Other Relevant Experience+ |
Dennis J. Dirks (1948) |
Year of Election or Appointment: 2005 Trustee |
| Mr. Dirks also serves as Trustee of other Fidelity funds. Prior to his retirement in May 2003, Mr. Dirks was Chief Operating Officer and a member of the Board of The Depository Trust & Clearing Corporation (DTCC). He also served as President, Chief Operating Officer, and Board member of The Depository Trust Company (DTC) and President and Board member of the National Securities Clearing Corporation (NSCC). In addition, Mr. Dirks served as Chief Executive Officer and Board member of the Government Securities Clearing Corporation, Chief Executive Officer and Board member of the Mortgage-Backed Securities Clearing Corporation, as a Trustee and a member of the Finance Committee of Manhattan College (2005-2008), and as a Trustee and a member of the Finance Committee of AHRC of Nassau County (2006-2008). Mr. Dirks is a member of the Independent Directors Council (IDC) Governing Council (2010-present) and Board of Directors for The Brookville Center for Children's Services, Inc. (2009-present). |
Alan J. Lacy (1953) |
Year of Election or Appointment: 2008 Trustee |
| Mr. Lacy also serves as Trustee of other Fidelity funds. Mr. Lacy serves as Senior Adviser (2007-present) of Oak Hill Capital Partners, L.P. (private equity). Mr. Lacy also served as Chief Executive Officer (2000-2005) and Vice Chairman (2005-2006) of Sears Holdings Corporation and Sears, Roebuck and Co. (retail). In addition, Mr. Lacy serves as a member of the Board of Directors of Dave & Buster's Entertainment, Inc. (restaurant and entertainment complexes, 2010-present), Earth Fare, Inc. (retail grocery, 2012-present), The Hillman Companies, Inc. (hardware wholesalers, 2010-present), and Bristol-Myers Squibb Company (global pharmaceuticals, 2008-present). Mr. Lacy is a member of the Board of Trustees of The National Parks Conservation Association (2006-present). Previously, Mr. Lacy served as Chairman of the Board of Trustees of the National Parks Conservation Association (2008-2011) and as a member of the Board of Directors for the Western Union Company (global money transfer, 2006-2011). |
Ned C. Lautenbach (1944) |
Year of Election or Appointment: 2000 Trustee Chairman of the Independent Trustees |
| Mr. Lautenbach also serves as Trustee of other Fidelity funds. Mr. Lautenbach currently serves as the Lead Director of the Eaton Corporation Board of Directors (diversified industrial, 1997-present). Mr. Lautenbach is Chairman of the Board of Directors of the Philharmonic Center for the Arts in Naples, Florida (2012-present) and a member of the Council on Foreign Relations (1994-present). Previously, Mr. Lautenbach was a Partner/Advisory Partner at Clayton, Dubilier & Rice, LLC (private equity investment, 1998-2010), as well as a Director of Sony Corporation (2006-2007). |
Joseph Mauriello (1944) |
Year of Election or Appointment: 2008 Trustee |
| Mr. Mauriello also serves as Trustee of other Fidelity funds. Prior to his retirement in January 2006, Mr. Mauriello served in numerous senior management positions including Deputy Chairman and Chief Operating Officer (2004-2005), and Vice Chairman of Financial Services (2002-2004) of KPMG LLP US (professional services, 1965-2005). Mr. Mauriello currently serves as a member of the Board of Directors of XL Group plc. (global insurance and re-insurance, 2006-present). Previously, Mr. Mauriello served as a Director of the Hamilton Funds of the Bank of New York (2006-2007) and of Arcadia Resources Inc. (health care services and products, 2007-2012). |
Robert W. Selander (1950) |
Year of Election or Appointment: 2011 Trustee |
| Mr. Selander also serves as Trustee of other Fidelity funds. Previously, Mr. Selander served as a Member of the Advisory Board of other Fidelity funds (2011), and Executive Vice Chairman (2010), Chief Executive Officer (2009-2010), and President and Chief Executive Officer (1997-2009) of Mastercard, Inc. |
Cornelia M. Small (1944) |
Year of Election or Appointment: 2005 Trustee |
| Ms. Small also serves as Trustee of other Fidelity funds. Ms. Small is a member of the Board of Directors (2009-present) and Chair of the Investment Committee (2010-present) of the Teagle Foundation. Ms. Small also serves on the Investment Committee of the Berkshire Taconic Community Foundation (2008-present). Previously, Ms. Small served as Chairperson (2002-2008) and a member of the Investment Committee and Chairperson (2008-2012) and a member of the Board of Trustees of Smith College. In addition, Ms. Small served as Chief Investment Officer, Director of Global Equity Investments, and a member of the Board of Directors of Scudder, Stevens & Clark and Scudder Kemper Investments. |
William S. Stavropoulos (1939) |
Year of Election or Appointment: 2002 Trustee Vice Chairman of the Independent Trustees |
| Mr. Stavropoulos also serves as Trustee of other Fidelity funds. Mr. Stavropoulos serves as President and Founder of the Michigan Baseball Foundation, the Great Lakes Loons (2007-present). Mr. Stavropoulos is Chairman Emeritus of the Board of Directors of The Dow Chemical Company, where he previously served in numerous senior management positions, including President, CEO (1995-2000; 2002-2004), Chairman of the Executive Committee (2000-2006), and as a member of the Board of Directors (1990-2006). Currently, Mr. Stavropoulos is Chairman of the Board of Directors of Univar Inc. (global distributor of commodity and specialty chemicals), a Director of Teradata Corporation (data warehousing and technology solutions), and Maersk Inc. (industrial conglomerate), and a member of the Advisory Board for Metalmark Capital LLC (private equity investment, 2005-present). Mr. Stavropoulos is an operating advisor to Clayton, Dubilier & Rice, LLC (private equity investment). In addition, Mr. Stavropoulos is a member of the University of Notre Dame Advisory Council for the College of Science, a Trustee of the Rollin L. Gerstacker Foundation, and a Director of the Naples Philharmonic Center for the Arts. Previously, Mr. Stavropoulos served as a Director of Chemical Financial Corporation (bank holding company, 1993-2012) and Tyco International, Ltd. (multinational manufacturing and services, 2007-2012). |
David M. Thomas (1949) |
Year of Election or Appointment: 2008 Trustee |
| Mr. Thomas also serves as Trustee of other Fidelity funds. Mr. Thomas serves as Non-Executive Chairman of the Board of Directors of Fortune Brands Home and Security (home and security products, 2011-present), and as a member of the Board of Directors of Interpublic Group of Companies, Inc. (marketing communication, 2004-present). Previously, Mr. Thomas served as Executive Chairman (2005-2006) and Chairman and Chief Executive Officer (2000-2005) of IMS Health, Inc. (pharmaceutical and healthcare information solutions), and a Director of Fortune Brands, Inc. (consumer products, 2000-2011). |
+ The information above includes each Trustee's principal occupation during the last five years and other information relating to the experience, attributes, and skills relevant to each Trustee's qualifications to serve as a Trustee, which led to the conclusion that each Trustee should serve as a Trustee for the fund.
Advisory Board Member and Officers:
Correspondence intended for each officer and Peter S. Lynch may be sent to Fidelity Investments, 245 Summer Street, Boston, Massachusetts 02210. Officers appear below in alphabetical order.
Name, Year of Birth; Principal Occupation |
Peter S. Lynch (1944) |
Year of Election or Appointment: 2003 Member of the Advisory Board |
| Mr. Lynch also serves as Member of the Advisory Board of other Fidelity funds. Mr. Lynch is Vice Chairman and a Director of FMR and FMR Co., Inc. In addition, Mr. Lynch serves as a Trustee of Boston College and as the Chairman of the Inner-City Scholarship Fund. Previously, Mr. Lynch served on the Special Olympics International Board of Directors (1997-2006). |
Elizabeth Paige Baumann (1968) |
Year of Election or Appointment: 2012 Anti-Money Laundering (AML) Officer |
| Ms. Baumann also serves as AML Officer of other funds. She is Chief AML Officer of FMR LLC (2012-present) and is an employee of Fidelity Investments. Previously, Ms. Baumann served as Vice President and Deputy Anti-Money Laundering Officer (2007-2012). |
William C. Coffey (1969) |
Year of Election or Appointment: 2009 Assistant Secretary |
| Mr. Coffey also serves as Assistant Secretary of other funds. He is Senior Vice President and Deputy General Counsel of FMR LLC (2010-present), and is an employee of Fidelity Investments. Previously, Mr. Coffey served as Vice President and Associate General Counsel of FMR LLC (2005-2009). |
Jonathan Davis (1968) |
Year of Election or Appointment: 2010 Assistant Treasurer |
| Mr. Davis also serves as Assistant Treasurer of other funds. Mr. Davis is an employee of Fidelity Investments. Previously, Mr. Davis served as Vice President and Associate General Counsel of FMR LLC (2003-2010). |
Adrien E. Deberghes (1967) |
Year of Election or Appointment: 2008 Deputy Treasurer |
| Mr. Deberghes also serves as an officer of other funds. He is an employee of Fidelity Investments (2008-present). Prior to joining Fidelity Investments, Mr. Deberghes was Senior Vice President of Mutual Fund Administration at State Street Corporation (2007-2008), Senior Director of Mutual Fund Administration at Investors Bank & Trust (2005-2007), and Director of Finance for Dunkin' Brands (2000-2005). |
Stephanie J. Dorsey (1969) |
Year of Election or Appointment: 2010 Assistant Treasurer |
| Ms. Dorsey also serves as an officer of other funds. She is an employee of Fidelity Investments (2008-present) and has served in other fund officer roles. Prior to joining Fidelity Investments, Ms. Dorsey served as Treasurer (2004-2008) of the JPMorgan Mutual Funds and Vice President (2004-2008) of JPMorgan Chase Bank. |
Howard J. Galligan III (1966) |
Year of Election or Appointment: 2014 Chief Financial Officer |
| Mr. Galligan also serves as Chief Financial Officer of other funds. Mr. Galligan serves as President of Fidelity Pricing and Cash Management Services (FPCMS) (2014-present) and as a Director of Strategic Advisers, Inc. (2008-present). Previously, Mr. Galligan served as Chief Administrative Officer of Asset Management (2011-2014) and Chief Operating Officer and Senior Vice President of Investment Support for Strategic Advisers, Inc. (2003-2011). |
Scott C. Goebel (1968) |
Year of Election or Appointment: 2008 Secretary and Chief Legal Officer (CLO) |
| Mr. Goebel serves as Secretary and CLO of other funds. Mr. Goebel also serves as Secretary of Fidelity SelectCo, LLC (2013-present), Fidelity Investments Money Management, Inc. (FIMM) (2010-present) and Fidelity Research and Analysis Company (FRAC) (2010-present); General Counsel, Secretary, and Senior Vice President of FMR (2008-present) and FMR Co., Inc. (2008-present); Chief Legal Officer of Fidelity Management & Research (Hong Kong) Limited (2008-present); and Assistant Secretary of Fidelity Management & Research (Japan) Inc. (2008-present) and Fidelity Management & Research (U.K.) Inc. (2008-present). Previously, Mr. Goebel served as Secretary and CLO of other Fidelity funds (2008-2013), Assistant Secretary of FIMM (2008-2010), FRAC (2008-2010), and certain funds (2007-2008); and as Vice President and Secretary of Fidelity Distributors Corporation (FDC) (2005-2007). Mr. Goebel has been employed by FMR LLC or an affiliate since 2001. |
Brian B. Hogan (1964) |
Year of Election or Appointment: 2009 Vice President |
| Mr. Hogan also serves as Trustee or Vice President of other funds. Mr. Hogan serves as President of FMR's Equity Division (2009-present). Previously, Mr. Hogan served as Senior Vice President, Equity Research of FMR (2006-2009) and as a portfolio manager. |
Chris Maher (1972) |
Year of Election or Appointment: 2013 Assistant Treasurer |
| Mr. Maher serves as Assistant Treasurer of other funds. Mr. Maher is Vice President of Valuation Oversight and is an employee of Fidelity Investments. Previously, Mr. Maher served as Vice President of Asset Management Compliance (2013), Vice President of FMR's Program Management Group (2010-2013), and Vice President of Valuation Oversight (2008-2010). |
Melissa M. Reilly (1971) |
Year of Election or Appointment: 2014 Vice President of certain Equity Funds |
| Ms. Reilly also serves as Vice President of other funds. Ms. Reilly is an employee of Fidelity Investments (2004-present). |
Kenneth B. Robins (1969) |
Year of Election or Appointment: 2008 President and Treasurer |
| Mr. Robins also serves as an officer of other funds. Mr. Robins serves as Executive Vice President of Fidelity Investments Money Management, Inc. (FIMM) (2013-present) and is an employee of Fidelity Investments (2004-present). Previously, Mr. Robins served in other fund officer roles. |
Stephen Sadoski (1971) |
Year of Election or Appointment: 2012 Deputy Treasurer |
| Mr. Sadoski also serves as Deputy Treasurer of other funds. He is an employee of Fidelity Investments (2012-present) and has served in another fund officer role. Prior to joining Fidelity Investments, Mr. Sadoski served as an assistant chief accountant in the Division of Investment Management of the Securities and Exchange Commission (SEC) (2009-2012) and as a senior manager at Deloitte & Touche LLP (1997-2009). |
Stacie M. Smith (1974) |
Year of Election or Appointment: 2013 Deputy Treasurer |
| Ms. Smith also serves as an officer of other funds. She is an employee of Fidelity Investments (2009-present) and has served in other fund officer roles. Prior to joining Fidelity Investments, Ms. Smith served as Senior Audit Manager of Ernst & Young LLP (1996-2009). |
Renee Stagnone (1975) |
Year of Election or Appointment: 2013 Deputy Treasurer |
| Ms. Stagnone also serves as Deputy Treasurer of other funds. Ms. Stagnone is an employee of Fidelity Investments. |
Linda J. Wondrack (1964) |
Year of Election or Appointment: 2014 Chief Compliance Officer |
| Ms. Wondrack also serves as Chief Compliance Officer of other funds. Ms. Wondrack is Executive Vice President and head of the Ethics Office and Asset Management Compliance for Fidelity Investments (2012-present). Ms. Wondrack also serves as Chief Compliance Officer of Fidelity SelectCo, LLC (2014-present); Chief Compliance Officer of Impresa Management LLC (2013-present); and Chief Compliance Officer of FMR Co., Inc., Fidelity Investments Money Management, Inc., Fidelity Management & Research (Japan) Inc., Fidelity Management & Research (U.K.) Inc., Fidelity Management & Research (Hong Kong), Fidelity Management & Research Company, Pyramis Global Advisors, LLC, and Strategic Advisers, Inc., Ballyrock Investment Advisors LLC, and Northern Neck Investors LLC (2012-present). Previously, Ms. Wondrack served as Senior Vice President and Chief Compliance Officer for Columbia Management Investment Advisers, LLC (2005-2012); Chief Compliance Officer for certain funds within the Columbia Family of Funds (2007-2012); and Senior Vice President of Compliance Risk Management at Bank of America (2005-2010). |
Joseph F. Zambello (1957) |
Year of Election or Appointment: 2011 Deputy Treasurer |
| Mr. Zambello also serves as Deputy Treasurer of other funds. Mr. Zambello is an employee of Fidelity Investments. Previously, Mr. Zambello served as Vice President of FMR's Program Management Group (2009-2011) and Vice President of the Transfer Agent Oversight Group (2005-2009). |
Annual Report
The Board of Trustees of Fidelity OTC Portfolio voted to pay to shareholders of record at the opening of business on record date, the following distributions per share derived from capital gains realized from sales of portfolio securities:
| Pay Date | Record Date | Capital Gains |
Class K | 09/08/14 | 09/05/14 | $6.808 |
The fund hereby designates as a capital gain dividend with respect to the taxable year ended July 31, 2014, $735,186,538 or, if subsequently determined to be different, the net capital gain of such year.
Class K designates 18% and 15% of the dividends distributed in September and December, respectively during the fiscal year as qualifying for the dividends-received deduction for corporate shareholders.
Class K designates 20% and 15% of the dividends distributed in September and December, respectively during the fiscal year as amounts which can be taken into account as a dividend for the purposes of the maximum rate under section 1(h)(11) of the Internal Revenue Code.
The fund will notify shareholders in January 2015 of amounts for use in preparing 2014 income tax returns.
Annual Report
Board Approval of Investment Advisory Contracts and Management Fees
Fidelity OTC Portfolio
Each year, the Board of Trustees, including the Independent Trustees (together, the Board), votes on the renewal of the management contract with Fidelity Management & Research Company (FMR) and the sub-advisory agreements (together, the Advisory Contracts) for the fund. The Board, assisted by the advice of fund counsel and Independent Trustees' counsel, requests and considers a broad range of information relevant to the renewal of the Advisory Contracts throughout the year.
The Board meets regularly and, at each of its meetings, covers an extensive agenda of topics and materials and considers factors that are relevant to its annual consideration of the renewal of the fund's Advisory Contracts, including the services and support provided to the fund and its shareholders. The Board has established various standing committees (Committees), each composed of and chaired by Independent Trustees with varying backgrounds, to which the Board has assigned specific subject matter responsibilities in order to enhance effective decision-making by the Board. The Board, acting directly and through its Committees, requests and receives information concerning the annual consideration of the renewal of the fund's Advisory Contracts. The Board also meets as needed to consider matters specifically related to the Board's annual consideration of the renewal of the Advisory Contracts. Members of the Board may also meet with trustees of other Fidelity funds through ad hoc joint committees to discuss certain matters relevant to the Fidelity funds.
At its July 2014 meeting, the Board, including the Independent Trustees, unanimously determined to renew the fund's Advisory Contracts. In reaching its determination, the Board considered all factors it believed relevant, including (i) the nature, extent, and quality of the services to be provided to the fund and its shareholders (including the investment performance of the fund); (ii) the competitiveness of the fund's management fee and total expense ratio relative to peer funds; (iii) the total costs of the services to be provided by and the profits to be realized by Fidelity from its relationship with the fund; (iv) the extent to which economies of scale exist and would be realized as the fund grows; and (v) whether fee levels reflect these economies of scale, if any, for the benefit of fund shareholders. In connection with separate internal corporate reorganizations involving Fidelity Management & Research (U.K.) Inc. (FMR U.K.) and Fidelity Management & Research (Japan) Inc. (FMR Japan), the Board approved certain non-material amendments to the fund's sub-advisory agreements with FMR U.K. and FMR Japan to reflect that, after these reorganizations, FMR Investment Management (UK) Limited and Fidelity Management & Research (Japan) Limited will carry on the business of FMR U.K. and FMR Japan, respectively. The Board noted that no changes to the portfolio managers or to the foreign research or investment advisory services provided to the fund were expected in connection with either reorganization and that the same personnel and resources would continue to be available to the fund at the new entities.
Annual Report
Board Approval of Investment Advisory Contracts and
Management Fees - continued
In considering whether to renew the Advisory Contracts for the fund, the Board reached a determination, with the assistance of fund counsel and Independent Trustees' counsel and through the exercise of its business judgment, that the renewal of the Advisory Contracts was in the best interests of the fund and its shareholders and that the compensation payable under the Advisory Contracts was fair and reasonable. The Board's decision to renew the Advisory Contracts was not based on any single factor, but rather was based on a comprehensive consideration of all the information provided to the Board at its meetings throughout the year. The Board, in reaching its determination to renew the Advisory Contracts, was aware that shareholders of the fund have a broad range of investment choices available to them, including a wide choice among funds offered by Fidelity's competitors, and that the fund's shareholders, who have the opportunity to review and weigh the disclosure provided by the fund in its prospectus and other public disclosures, have chosen to invest in this fund, which is part of the Fidelity family of funds.
Nature, Extent, and Quality of Services Provided. The Board considered Fidelity's staffing as it relates to the fund, including the backgrounds of investment personnel of FMR and the sub-advisers (together, the Investment Advisers), and also considered the fund's investment objective, strategies, and related investment philosophy. The Independent Trustees also had discussions with senior management of Fidelity's investment operations and investment groups. The Board considered the structure of the portfolio manager compensation program and whether this structure provides appropriate incentives to act in the best interests of the fund. Additionally, the Board considered the portfolio managers' investments, if any, in the funds that they manage.
Resources Dedicated to Investment Management and Support Services. The Board and the Fund Oversight and Research Committees reviewed the general qualifications and capabilities of Fidelity's investment staff, including its size, education, experience, and resources, as well as Fidelity's approach to recruiting, training, managing, and compensating investment personnel. The Board noted that Fidelity has continued to increase the resources devoted to non-U.S. offices, including expansion of Fidelity's global investment organization. The Board also noted that Fidelity's analysts have extensive resources, tools and capabilities that allow them to conduct sophisticated quantitative and fundamental analysis, as well as credit analysis of issuers, counterparties and guarantors. Further, the Board believes that Fidelity's investment professionals have sufficient access to global information and data so as to provide competitive investment results over time, and that those professionals also have access to sophisticated tools that permit them to assess portfolio construction and risk and performance attribution characteristics continuously, as well as to transmit new information and research conclusions rapidly around the world. Additionally, in its deliberations, the Board considered Fidelity's trading and risk management capabilities and resources and global compliance infrastructure, which are an integral part of the investment management process.
Annual Report
Shareholder and Administrative Services. The Board considered (i) the nature, extent, quality, and cost of advisory, administrative, and shareholder services performed by the Investment Advisers and their affiliates under the Advisory Contracts and under separate agreements covering transfer agency, pricing and bookkeeping, and securities lending services for the fund; (ii) the nature and extent of the supervision of third party service providers, principally custodians and subcustodians; and (iii) the resources devoted to, and the record of compliance with, the fund's compliance policies and procedures. The Board also reviewed the allocation of fund brokerage, including allocations to brokers affiliated with the Investment Advisers, the use of brokerage commissions to pay fund expenses, and the use of "soft" commission dollars to pay for research services.
The Board noted that the growth of fund assets over time across the complex allows Fidelity to reinvest in the development of services designed to enhance the value or convenience of the Fidelity funds as investment vehicles. These services include 24-hour access to account information and market information through telephone representatives and over the Internet, investor education materials and asset allocation tools, and the expanded availability of Fidelity Investor Centers.
In 2014, the Board formed an ad hoc Committee on Transfer Agency Fees to review the variety of transfer agency fee structures throughout the industry and Fidelity's competitive positioning with respect to industry participants.
Investment in a Large Fund Family. The Board considered the benefits to shareholders of investing in a Fidelity fund, including the benefits of investing in a fund that is part of a large family of funds offering a variety of investment disciplines and providing a large variety of mutual fund investor services. The Board noted that Fidelity had taken, or had made recommendations that resulted in the Fidelity funds taking, a number of actions over the previous year that benefited particular funds, including (i) continuing to dedicate additional resources to investment research and to the support of the senior management team that oversees asset management; (ii) persisting in efforts to enhance Fidelity's global research capabilities; (iii) launching new funds and making other enhancements to meet client needs for income-oriented solutions; (iv) reducing fund expenses for certain index funds; (v) continuing to launch dedicated lower cost underlying funds to meet portfolio construction needs related to expanding underlying fund options for Fidelity funds of funds, specifically for the Freedom Fund product lines; (vi) rationalizing product lines and gaining increased efficiencies through fund mergers; (vii) launching sector-based exchange-traded funds and establishing a new Fidelity adviser to manage sector-based funds and products; (viii) continuing to develop and implement technology to improve security and increase efficiency; (ix) modifying the eligibility criteria for certain share classes to increase their marketability to a portion of the defined contribution plan market; (x) waiving redemption fees for certain qualified fund-of-fund and wrap programs and certain retirement plan transactions; and (xi) launching new Institutional Class shares of certain money market funds to attract and retain assets and to fill a gap in the money market fund lineup.
Annual Report
Board Approval of Investment Advisory Contracts and
Management Fees - continued
Investment Performance. The Board considered whether the fund has operated in accordance with its investment objective, as well as its record of compliance with its investment restrictions and its performance history.
The Board took into account discussions with the Investment Advisers about fund investment performance that occur at Board meetings throughout the year. In this regard the Board noted that as part of regularly scheduled fund reviews and other reports to the Board on fund performance, the Board periodically considers annualized return information for the fund, for different time periods, measured against a securities market index ("benchmark index") and a peer group of funds with similar objectives ("peer group"). In its evaluation of fund investment performance, the Board gave particular attention to information indicating changes in performance of certain Fidelity funds for specific time periods and the Investment Advisers' explanations for any overperformance or underperformance.
In addition to reviewing absolute and relative fund performance, the Independent Trustees periodically consider the appropriateness of fund performance metrics in evaluating the results achieved. In general, the Independent Trustees believe that fund performance should be evaluated based on net performance (after fees and expenses) of both the highest performing and lowest performing classes, where applicable, compared to appropriate benchmark indices, over appropriate time periods which may include full market cycles, and compared to peer groups, as applicable, over the same periods, taking into account relevant factors including the following: general market conditions; issuer-specific information; tactical opportunities for investment; and fund cash flows and other factors.
The Independent Trustees recognize that shareholders evaluate performance on a net basis over their own holding periods, for which one-, three-, and five-year periods are often used as a proxy. For this reason, the performance information reviewed by the Board also included net cumulative calendar year total return information for the fund and an appropriate benchmark index for the most recent one-, three-, and five-year periods, as shown below. A peer group comparison is not shown below.
Annual Report
Fidelity OTC Portfolio

The Board also considered that the fund's management fee is subject to upward or downward adjustment depending upon whether, and to what extent, the fund's investment performance for the performance period exceeds, or is exceeded by, a securities index, thus leading to a performance adjustment for the same period. The Board noted that the performance adjustment provides FMR with a strong economic incentive to seek to achieve superior performance for the fund's shareholders and helps to more closely align the interests of FMR and the fund's shareholders.
Based on its review, the Board concluded that the nature, extent, and quality of services provided to the fund under the Advisory Contracts should benefit the fund's shareholders.
Competitiveness of Management Fee and Total Expense Ratio. The Board considered the fund's management fee and total expense ratio compared to "mapped groups" of competitive funds and classes. Fidelity creates "mapped groups" by combining similar Lipper investment objective categories that have comparable investment mandates. Combining Lipper investment objective categories aids the Board's management fee and total expense ratio comparisons by broadening the competitive group used for comparison and by reducing the number of universes to which various Fidelity funds are compared.
Management Fee. The Board considered two proprietary management fee comparisons for the 12-month periods shown in the chart below. The group of Lipper funds used by the Board for management fee comparisons is referred to below as the "Total Mapped Group." The Total Mapped Group comparison focuses on a fund's standing in terms of gross management fees before expense reimbursements or caps, and without giving effect to the fund's performance adjustment, relative to the total universe of funds with comparable investment mandates, regardless of whether their management fee structures also are comparable. Funds with comparable investment mandates offer exposure to similar types of securities. Funds with comparable management fee structures have similar management fee contractual arrangements (e.g., flat rate charged for advisory services, all-inclusive fee rate, etc.). "TMG %" represents the percentage of funds in the Total Mapped Group that had management fees that were lower than the fund's. For example, a hypothetical TMG % of 20% would mean that 80% of the funds in the Total Mapped Group had higher, and 20% had lower, management fees than the fund. The fund's actual TMG %s are in the chart below. The "Asset-Size Peer Group" (ASPG) comparison focuses on a fund's standing relative to a subset of non-Fidelity funds within the Total Mapped Group that are similar in size and management fee structure. For example, if a fund is in the first quartile of the ASPG, the fund's management fee ranks in the least expensive or lowest 25% of funds in the ASPG. The ASPG represents at least 15% of the funds in the Total Mapped Group with comparable asset size and management fee structures, subject to a minimum of 50 funds (or all funds in the Total Mapped Group if fewer than 50). Additional information, such as the ASPG quartile in which the fund's management fee rate ranked and the impact of the fund's performance adjustment, is also included in the chart and considered by the Board.
Annual Report
Board Approval of Investment Advisory Contracts and
Management Fees - continued
Fidelity OTC Portfolio
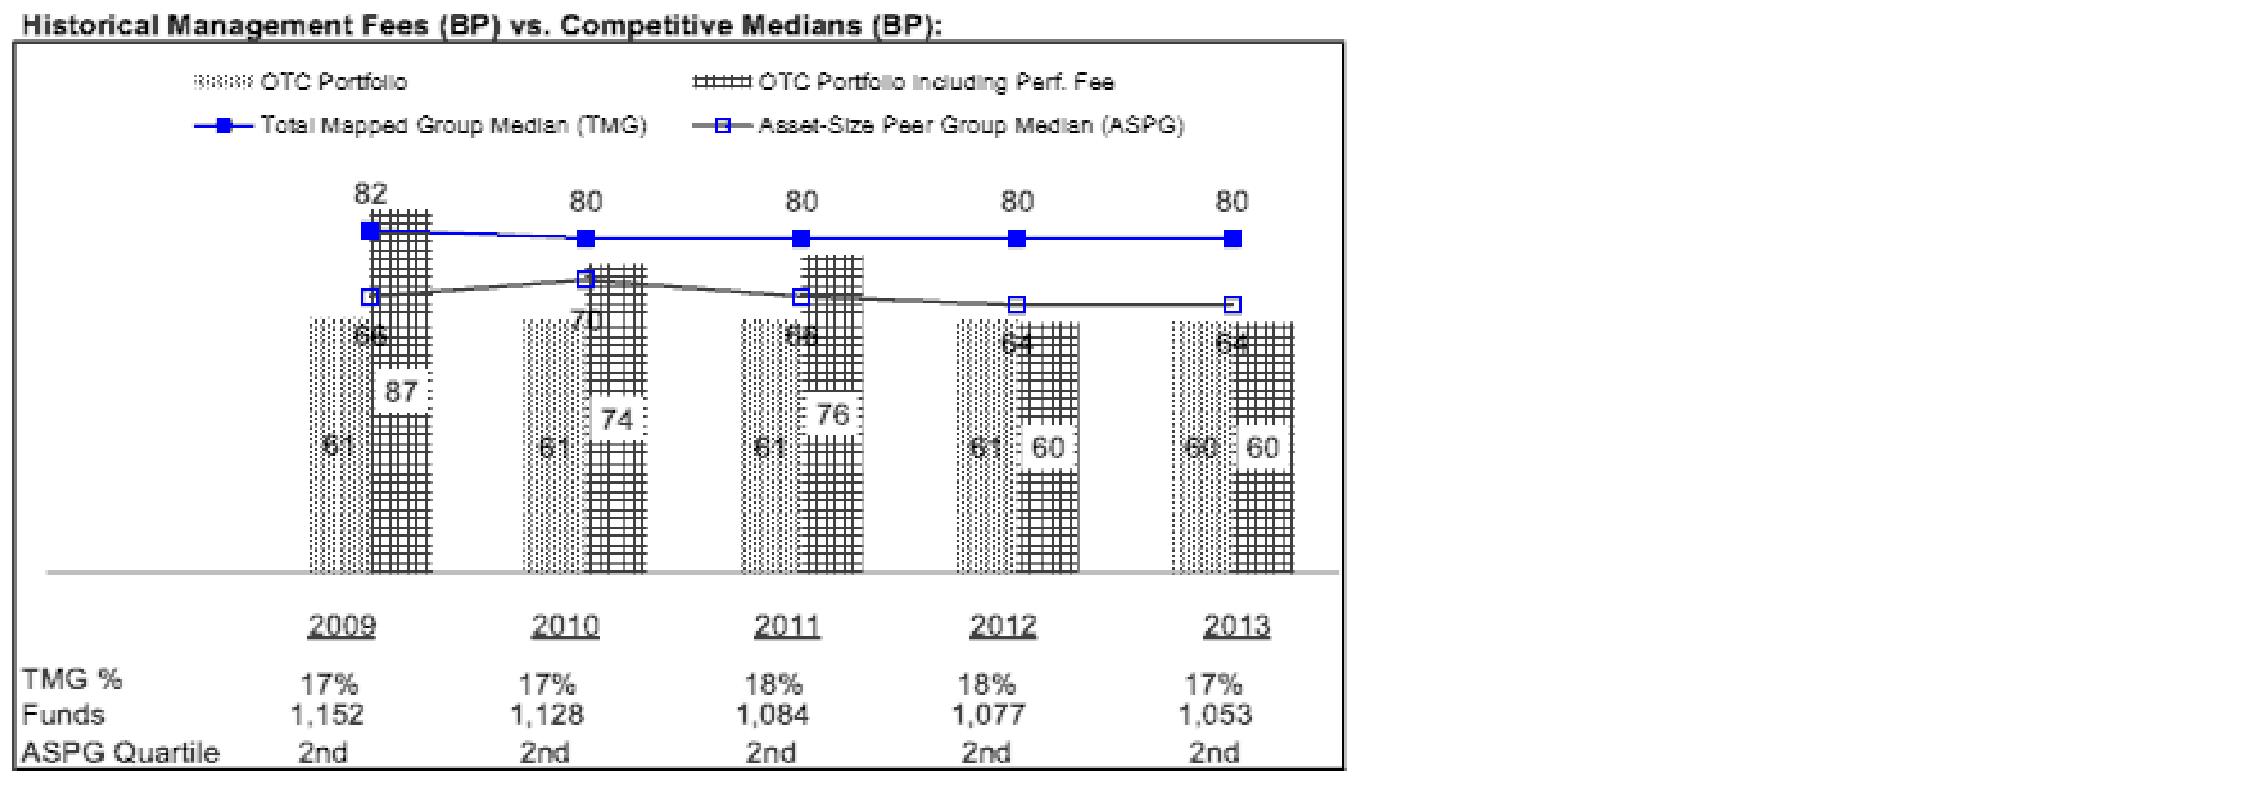
The Board noted that the fund's management fee rate ranked below the median of its Total Mapped Group and below the median of its ASPG for 2013.
Annual Report
The Board also noted that, in August 2013, the ad hoc Committee on Management Fees was formed to conduct an in-depth review of the management fee rates of Fidelity's active equity mutual funds. The Committee focused on the following areas: (i) standard fee structures; (ii) research consumption and trading evolution; (iii) management fee competitiveness/profitability by category; and (iv) factors that drive institutional pricing.
Based on its review, the Board concluded that the fund's management fee is fair and reasonable in light of the services that the fund receives and the other factors considered.
Total Expense Ratio. In its review of each class's total expense ratio, the Board considered the fund's management fee as well as other fund or class expenses, as applicable, such as transfer agent fees, pricing and bookkeeping fees, and custodial, legal, and audit fees. The Board also noted the effects of any waivers and reimbursements on fees and expenses, as well as the impact of the fund's performance adjustment. As part of its review, the Board also considered the current and historical total expense ratios of each class of the fund compared to competitive fund median expenses. Each class of the fund is compared to those funds and classes in the Total Mapped Group (used by the Board for management fee comparisons) that have a similar sales load structure.
The Board noted that the total expense ratio of each class ranked below its competitive median for 2013.
Fees Charged to Other Fidelity Clients. The Board also considered Fidelity fee structures and other information with respect to clients of Fidelity, such as other funds advised or subadvised by Fidelity, pension plan clients, and other institutional clients. The Board noted the findings of the 2013 ad hoc joint committee (created with the board of other Fidelity funds), which reviewed and compared Fidelity's institutional investment advisory business with its business of providing services to the Fidelity funds, including the differences in services provided, fees charged, and costs incurred, as well as competition in their respective marketplaces.
Based on its review of total expense ratios and fees charged to other Fidelity clients, the Board concluded that the total expense ratio of each class of the fund was reasonable in light of the services that the fund and its shareholders receive and the other factors considered.
Costs of the Services and Profitability. The Board considered the revenues earned and the expenses incurred by Fidelity in conducting the business of developing, marketing, distributing, managing, administering and servicing the fund and servicing the fund's shareholders. The Board also considered the level of Fidelity's profits in respect of all the Fidelity funds.
On an annual basis, Fidelity presents to the Board Fidelity's profitability for the fund. Fidelity calculates the profitability for each fund, as well as aggregate profitability for groups of Fidelity funds and all Fidelity funds, using a series of detailed revenue and cost allocation methodologies which originate with the books and records of Fidelity on which Fidelity's audited financial statements are based. The Audit Committee of the Board reviews any significant changes from the prior year's methodologies.
Annual Report
Board Approval of Investment Advisory Contracts and
Management Fees - continued
PricewaterhouseCoopers LLP (PwC), independent registered public accounting firm and auditor to Fidelity and certain Fidelity funds, has been engaged annually by the Board as part of the Board's assessment of Fidelity's profitability analysis. PwC's engagement includes the review and assessment of the methodologies used by Fidelity in determining the revenues and expenses attributable to Fidelity's mutual fund business, and completion of agreed-upon procedures in respect of the mathematical accuracy of fund profitability and its conformity to established allocation methodologies. After considering PwC's reports issued under the engagement and information provided by Fidelity, the Board concluded that while other allocation methods may also be reasonable, Fidelity's profitability methodologies are reasonable in all material respects.
The Board also reviewed Fidelity's non-fund businesses and fall-out benefits related to the mutual fund business as well as cases where Fidelity's affiliates may benefit from or be related to the fund's business.
The Board considered the costs of the services provided by and the profits realized by Fidelity in connection with the operation of the fund and was satisfied that the profitability was not excessive in the circumstances.
Economies of Scale. The Board considered whether there have been economies of scale in respect of the management of the Fidelity funds, whether the Fidelity funds (including the fund) have appropriately benefited from any such economies of scale, and whether there is potential for realization of any further economies of scale. The Board considered the extent to which the fund will benefit from economies of scale through increased services to the fund, through waivers or reimbursements, or through fee or expense ratio reductions. The Board also noted that in 2013, it and the boards of other Fidelity funds created an ad hoc committee (the Economies of Scale Committee) to analyze whether Fidelity attains economies of scale in respect of the management and servicing of the Fidelity funds, whether the Fidelity funds have appropriately benefited from such economies of scale, and whether there is potential for realization of any further economies of scale.
The Board recognized that the fund's management contract incorporates a "group fee" structure, which provides for lower group fee rates as total group assets increase, and for higher group fee rates as total group assets decrease (with "group assets" defined to include fund assets under FMR's management plus sector fund assets previously under FMR's management and currently managed by Fidelity SelectCo, LLC). FMR calculates the group fee rates based on a tiered asset "breakpoint" schedule that varies based on asset class. The Board considered that the group fee is designed to deliver the benefits of economies of scale to fund shareholders when total Fidelity fund assets increase, even if assets of any particular fund are unchanged or have declined, because some portion of Fidelity's costs are attributable to services provided to all Fidelity funds, and all funds benefit if those costs can be allocated among more assets. The Board concluded that, given the group fee structure, fund shareholders will benefit from lower management fees as group assets increase at the fund complex level, regardless of whether Fidelity achieves any such economies of scale.
Annual Report
The Board concluded, taking into account the analysis of the Economies of Scale Committee, that economies of scale, if any, are being appropriately shared between fund shareholders and Fidelity.
Additional Information Requested by the Board. In order to develop fully the factual basis for consideration of the Fidelity funds' Advisory Contracts, the Board requested and received additional information on certain topics, including: (i) fund performance trends and Fidelity's long-term strategies for certain funds; (ii) Fidelity's strategic marketing and product lineup goals; (iii) the methodology with respect to competitive fund data and peer group classifications; (iv) the arrangements with, and performance of, certain sub-advisers on behalf of the Fidelity funds, as well as certain proposed participating affiliate arrangements; (v) the realization of fall-out benefits in certain Fidelity business units; (vi) Fidelity's group fee structures, including the rationale for the individual fee rates of certain categories of funds and the definition of group assets; (vii) trends regarding industry use of performance fee structures and the performance adjustment methodologies applicable to the Fidelity funds; (viii) additional competitive analysis regarding the total expenses for certain classes; (ix) fund profitability methodology, including Fidelity's cost allocation methodology, and the impact of certain factors on fund profitability results; and (x) the process by which Fidelity determines sub-advisory fees for funds it advises.
Based on its evaluation of all of the conclusions noted above, and after considering all factors it believed relevant, the Board ultimately concluded that the advisory fee structures are fair and reasonable, and that the fund's Advisory Contracts should be renewed.
Annual Report
Investment Adviser
Fidelity Management & Research Company
Boston, MA
Investment Sub-Advisers
FMR Co., Inc.
Fidelity Management & Research
(U.K.) Inc.
Fidelity Management & Research
(Hong Kong) Limited
Fidelity Management & Research
(Japan) Inc.
General Distributor
Fidelity Distributors Corporation
Smithfield, RI
Transfer and Service Agents
Fidelity Investments Institutional
Operations Company, Inc.
Boston, MA
Fidelity Service Company, Inc.
Boston, MA
Custodian
The Northern Trust Company
Chicago, IL
(Fidelity Investment logo)(registered trademark)
Corporate Headquarters
245 Summer St., Boston, MA 02210
www.fidelity.com
OTC-K-UANN-0914
1.863303.105
Fidelity®
Series Real Estate Equity
Fund
Fidelity Series Real Estate Equity Fund
Class F
Annual Report
July 31, 2014
(Fidelity Cover Art)
Contents
Performance | (Click Here) | How the fund has done over time. |
Management's Discussion of Fund Performance | (Click Here) | The Portfolio Manager's review of fund performance and strategy. |
Shareholder Expense Example | (Click Here) | An example of shareholder expenses. |
Investment Changes | (Click Here) | A summary of major shifts in the fund's investments over the past six months. |
Investments | (Click Here) | A complete list of the fund's investments with their market values. |
Financial Statements | (Click Here) | Statements of assets and liabilities, operations, and changes in net assets, as well as financial highlights. |
Notes | (Click Here) | Notes to the financial statements. |
Report of Independent Registered Public Accounting Firm | (Click Here) | |
Trustees and Officers | (Click Here) | |
Distributions | (Click Here) | |
Board Approval of Investment Advisory Contracts and Management Fees | (Click Here) | |
To view a fund's proxy voting guidelines and proxy voting record for the 12-month period ended June 30, visit http://www.fidelity.com/proxyvotingresults or visit the Securities and Exchange Commission's (SEC) web site at http://www.sec.gov. You may also call 1-800-544-8544 for Fidelity® Series Real Estate Equity Fund or 1-800-835-5092 for Class F of the fund to request a free copy of the proxy voting guidelines.
Standard & Poor's, S&P and S&P 500 are registered service marks of The McGraw-Hill Companies, Inc. and have been licensed for use by Fidelity Distributors Corporation.
Other third-party marks appearing herein are the property of their respective owners.
All other marks appearing herein are registered or unregistered trademarks or service marks of FMR LLC or an affiliated company. © 2014 FMR LLC. All rights reserved.
Annual Report
This report and the financial statements contained herein are submitted for the general information of the shareholders of the fund. This report is not authorized for distribution to prospective investors in the fund unless preceded or accompanied by an effective prospectus.
A fund files its complete schedule of portfolio holdings with the SEC for the first and third quarters of each fiscal year on Form N-Q. Forms N-Q are available on the SEC's web site at http://www.sec.gov. A fund's Forms N-Q may be reviewed and copied at the SEC's Public Reference Room in Washington, DC. Information regarding the operation of the SEC's Public Reference Room may be obtained by calling 1-800-SEC-0330. For a complete list of a fund's portfolio holdings, view the most recent holdings listing, semiannual report, or annual report on Fidelity's web site at http://www.fidelity.com, http://www.advisor.fidelity.com, or http://www.401k.com, as applicable.
NOT FDIC INSURED • MAY LOSE VALUE • NO BANK GUARANTEE
Neither the fund nor Fidelity Distributors Corporation is a bank.
Annual Report
Average annual total return reflects the change in the value of an investment, assuming reinvestment of the class' distributions from dividend income and capital gains (the profits earned upon the sale of securities that have grown in value, if any) and assuming a constant rate of performance each year. The $10,000 table and the fund's returns do not reflect the deduction of taxes that a shareholder would pay on fund distributions or the redemption of fund shares. During periods of reimbursement by Fidelity, a fund's total return will be greater than it would be had the reimbursement not occurred. How a fund did yesterday is no guarantee of how it will do tomorrow.
Average Annual Total Returns
Periods ended July 31, 2014 | Past 1
year | Life of
fund A |
Fidelity® Series Real Estate Equity Fund | 12.72% | 16.33% |
Class F | 13.01% | 16.56% |
A From October 20, 2011.
$10,000 Over Life of Fund
Let's say hypothetically that $10,000 was invested in Fidelity® Series Real Estate Equity Fund, a class of the fund, on October 20, 2011, when the fund started. The chart shows how the value of your investment would have changed, and also shows how the S&P 500® Index performed over the same period.
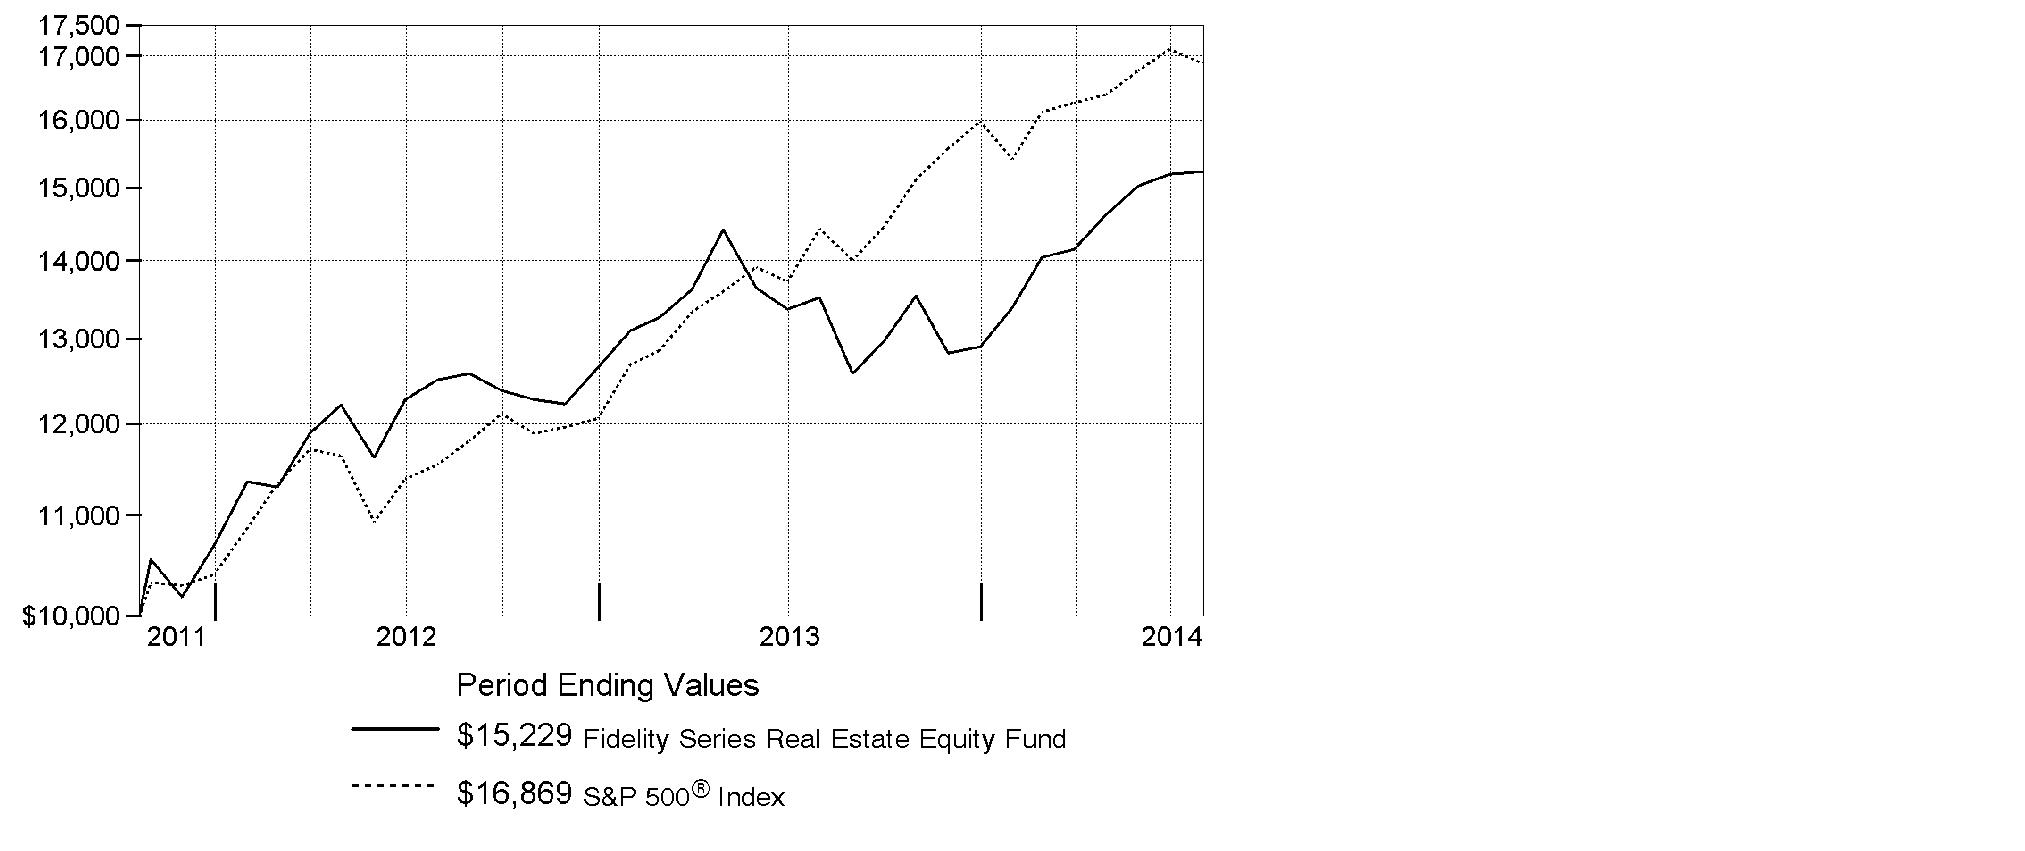
Annual Report
Market Recap: U.S. stocks overcame a slowing economy early in 2014 to post a strong gain for the 12-month period ending July 31, 2014, supported by corporate profits and continued low interest rates. The S&P 500® Index rose 16.94%, reaching an all-time high near period end. The technology-heavy Nasdaq Composite Index® gained 22.00%. The Russell 2000® Index returned 8.56%, reflecting the relatively lackluster performance of small-cap stocks. Information technology (+28%) was the top-performing sector within the S&P 500®, driven by strong semiconductor and computer hardware sales. Materials (+23%) gained amid higher prices for many commodity products. Health care (+21%) rose, driven by gains in pharmaceuticals, biotechnology & life sciences companies. Energy stocks (+19%) advanced in the latter part of the period amid healthy U.S. output and the threat of supply disruptions in Iraq. Conversely, most defensive sectors, including consumer staples, utilities and telecommunication services, lagged the broader market. Volatility remained tame throughout most of the period, with markets supported by declining unemployment, near-record profit margins for companies, muted cost inflation and fairly low corporate debt levels. Geopolitical tension remained a concern at period end, with conflict in Ukraine and strained relations between Russia and the West posing a potential threat to global growth.
Comments from Samuel Wald, Portfolio Manager of Fidelity® Series Real Estate Equity Fund: For the year, the fund's Series Real Estate Equity and Class F shares gained 12.72% and 13.01%, respectively, versus 12.61% for the benchmark Dow Jones U.S. Select Real Estate Securities IndexSM and 16.94% for the S&P 500® Index. The fund was hampered by subpar stock picking among residential and diversified real estate investment trusts (REITs), although security selection among industrial/office REITs and in the so-called real estate related category (primarily health care REITs) was very strong. The fund's biggest individual detractor was Vornado Realty Trust, in which the fund was significantly underweighted. Another notable detractor was mall operator Glimcher Realty Trust, which I ultimately sold in June. Equity One also weighed on results. On the positive side, Digital Realty Trust, which owns data centers, was the top contributor, benefiting from a recovery off a very low valuation and the easing of investor concerns surrounding oversupply in its industry. Another notable contributor was Essex Property Trust, an apartment REIT. I liked Essex partly for its solid management and exposure to West Coast apartments.
The views expressed above reflect those of the portfolio manager(s) only through the end of the period as stated on the cover of this report and do not necessarily represent the views of Fidelity or any other person in the Fidelity organization. Any such views are subject to change at any time based upon market or other conditions and Fidelity disclaims any responsibility to update such views. These views may not be relied on as investment advice and, because investment decisions for a Fidelity fund are based on numerous factors, may not be relied on as an indication of trading intent on behalf of any Fidelity fund.
Annual Report
Shareholder Expense Example
As a shareholder of the Fund, you incur two types of costs: (1) transaction costs, and (2) ongoing costs, including management fees and other Fund expenses. This Example is intended to help you understand your ongoing costs (in dollars) of investing in the Fund and to compare these costs with the ongoing costs of investing in other mutual funds.
The Example is based on an investment of $1,000 invested at the beginning of the period and held for the entire period (February 1, 2014 to July 31, 2014).
Actual Expenses
The first line of the accompanying table for each class of the Fund provides information about actual account values and actual expenses. You may use the information in this line, together with the amount you invested, to estimate the expenses that you paid over the period. Simply divide your account value by $1,000.00 (for example, an $8,600 account value divided by $1,000.00 = 8.6), then multiply the result by the number in the first line for a class of the Fund under the heading entitled "Expenses Paid During Period" to estimate the expenses you paid on your account during this period. In addition, the Fund, as a shareholder in the underlying Fidelity Central Funds, will indirectly bear its pro-rata share of the fees and expenses incurred by the underlying Fidelity Central Funds. These fees and expenses are not included in the Fund's annualized expense ratio used to calculate the expense estimate in the table below.
Hypothetical Example for Comparison Purposes
The second line of the accompanying table for each class of the Fund provides information about hypothetical account values and hypothetical expenses based on a Class' actual expense ratio and an assumed rate of return of 5% per year before expenses, which is not the Class' actual return. The hypothetical account values and expenses may not be used to estimate the actual ending account balance or expenses you paid for the period. You may use this information to compare the ongoing costs of investing in the Fund and other funds. To do so, compare this 5% hypothetical example with the 5% hypothetical examples that appear in the shareholder reports of the other funds. In addition, the Fund, as a shareholder in the underlying Fidelity Central Funds, will indirectly bear its pro-rata share of the fees and expenses incurred by the underlying Fidelity Central Funds. These fees and expenses are not included in the Fund's annualized expense ratio used to calculate the expense estimate in the table below.
Please note that the expenses shown in the table are meant to highlight your ongoing costs only and do not reflect any transaction costs. Therefore, the second line of the table is useful in comparing ongoing costs only, and will not help you determine the relative total costs of owning different funds.
Annual Report
| Annualized
Expense Ratio B | Beginning
Account Value
February 1, 2014 | Ending
Account Value
July 31, 2014 | Expenses Paid
During Period*
February 1, 2014
to July 31, 2014 |
Series Real Estate Equity | .76% | | | |
Actual | | $ 1,000.00 | $ 1,137.40 | $ 4.03 |
Hypothetical A | | $ 1,000.00 | $ 1,021.03 | $ 3.81 |
Class F | .59% | | | |
Actual | | $ 1,000.00 | $ 1,139.10 | $ 3.13 |
Hypothetical A | | $ 1,000.00 | $ 1,021.87 | $ 2.96 |
A 5% return per year before expenses
B Annualized expense ratio reflects expenses net of applicable fee waivers.
* Expenses are equal to each Class' annualized expense ratio, multiplied by the average account value over the period, multiplied by 181/365 (to reflect the one-half year period).
Annual Report
Investment Changes (Unaudited)
Top Ten Stocks as of July 31, 2014 |
| % of fund's
net assets | % of fund's net assets
6 months ago |
Simon Property Group, Inc. | 12.5 | 13.2 |
Boston Properties, Inc. | 5.8 | 5.6 |
Public Storage | 5.1 | 6.8 |
Essex Property Trust, Inc. | 4.8 | 4.8 |
HCP, Inc. | 4.2 | 2.7 |
SL Green Realty Corp. | 4.0 | 4.1 |
Federal Realty Investment Trust (SBI) | 3.7 | 1.6 |
Alexandria Real Estate Equities, Inc. | 3.7 | 3.8 |
Digital Realty Trust, Inc. | 3.7 | 0.0 |
Taubman Centers, Inc. | 3.4 | 1.4 |
| 50.9 | |
Top Five REIT Sectors as of July 31, 2014 |
| % of fund's
net assets | % of fund's net assets
6 months ago |
REITs - Office Buildings | 19.1 | 19.0 |
REITs - Apartments | 16.8 | 17.0 |
REITs - Malls | 15.9 | 15.0 |
REITs - Industrial Buildings | 12.6 | 16.1 |
REITs - Health Care Facilities | 10.3 | 11.2 |
Asset Allocation (% of fund's net assets) |
As of July 31, 2014 | As of January 31, 2014 |
| Stocks 98.9% | | | Stocks 98.7% | |
| Short-Term
Investments and
Net Other Assets (Liabilities) 1.1% | | | Short-Term
Investments and
Net Other Assets (Liabilities) 1.3% | |

Annual Report
Investments July 31, 2014
Showing Percentage of Net Assets
Common Stocks - 98.9% |
| Shares | | Value |
HOTELS, RESTAURANTS & LEISURE - 0.2% |
Hotels, Resorts & Cruise Lines - 0.2% |
Starwood Hotels & Resorts Worldwide, Inc. | 24,300 | | $ 1,867,212 |
REAL ESTATE INVESTMENT TRUSTS - 97.3% |
REITs - Apartments - 16.8% |
AvalonBay Communities, Inc. | 96,435 | | 14,280,095 |
Equity Residential (SBI) | 444,551 | | 28,740,222 |
Essex Property Trust, Inc. | 314,667 | | 59,651,423 |
Mid-America Apartment Communities, Inc. | 568,948 | | 39,780,844 |
Post Properties, Inc. | 638,951 | | 34,631,144 |
UDR, Inc. | 1,120,700 | | 32,589,956 |
TOTAL REITS - APARTMENTS | | 209,673,684 |
REITs - Health Care Facilities - 10.3% |
HCP, Inc. | 1,255,859 | | 52,155,824 |
Health Care REIT, Inc. | 247,549 | | 15,751,543 |
Senior Housing Properties Trust (SBI) | 1,036,200 | | 23,687,532 |
Ventas, Inc. | 586,737 | | 37,257,800 |
TOTAL REITS - HEALTH CARE FACILITIES | | 128,852,699 |
REITs - Hotels - 6.7% |
Ashford Hospitality Prime, Inc. | 490,521 | | 8,167,175 |
FelCor Lodging Trust, Inc. | 2,447,069 | | 25,620,812 |
Host Hotels & Resorts, Inc. | 942,400 | | 20,487,776 |
LaSalle Hotel Properties (SBI) | 829,379 | | 28,854,095 |
TOTAL REITS - HOTELS | | 83,129,858 |
REITs - Industrial Buildings - 12.6% |
DCT Industrial Trust, Inc. | 3,752,900 | | 29,385,207 |
Duke Realty LP | 208,200 | | 3,745,518 |
Extra Space Storage, Inc. | 352,300 | | 18,224,479 |
Prologis, Inc. | 854,706 | | 34,880,552 |
Public Storage | 372,787 | | 63,973,977 |
Terreno Realty Corp. | 331,700 | | 6,202,790 |
TOTAL REITS - INDUSTRIAL BUILDINGS | | 156,412,523 |
Common Stocks - continued |
| Shares | | Value |
REAL ESTATE INVESTMENT TRUSTS - CONTINUED |
REITs - Malls - 15.9% |
Simon Property Group, Inc. | 930,023 | | $ 156,420,569 |
Taubman Centers, Inc. | 571,422 | | 42,033,802 |
TOTAL REITS - MALLS | | 198,454,371 |
REITs - Management/Investment - 6.2% |
Digital Realty Trust, Inc. (d) | 703,600 | | 45,304,804 |
Equity Lifestyle Properties, Inc. | 483,748 | | 21,425,199 |
Weyerhaeuser Co. (d) | 314,960 | | 9,864,547 |
TOTAL REITS - MANAGEMENT/INVESTMENT | | 76,594,550 |
REITs - Mobile Home Parks - 0.7% |
Sun Communities, Inc. | 154,355 | | 8,123,704 |
REITs - Office Buildings - 19.1% |
Alexandria Real Estate Equities, Inc. | 580,908 | | 45,659,369 |
Boston Properties, Inc. | 605,749 | | 72,356,718 |
Cousins Properties, Inc. | 942,131 | | 11,663,582 |
CyrusOne, Inc. | 39,132 | | 972,430 |
Douglas Emmett, Inc. | 654,800 | | 18,655,252 |
Piedmont Office Realty Trust, Inc. Class A (d) | 1,950,420 | | 37,935,669 |
SL Green Realty Corp. | 466,532 | | 50,292,150 |
TOTAL REITS - OFFICE BUILDINGS | | 237,535,170 |
REITs - Shopping Centers - 8.8% |
Acadia Realty Trust (SBI) | 135,700 | | 3,830,811 |
Cedar Shopping Centers, Inc. | 1,446,790 | | 9,114,777 |
Excel Trust, Inc. | 402,092 | | 5,207,091 |
Federal Realty Investment Trust (SBI) | 377,652 | | 46,111,309 |
Kite Realty Group Trust | 1,877,000 | | 11,449,700 |
Ramco-Gershenson Properties Trust (SBI) | 97,700 | | 1,621,820 |
Vornado Realty Trust | 150,000 | | 15,903,000 |
Washington Prime Group, Inc. (a) | 875,111 | | 16,530,847 |
TOTAL REITS - SHOPPING CENTERS | | 109,769,355 |
Common Stocks - continued |
| Shares | | Value |
REAL ESTATE INVESTMENT TRUSTS - CONTINUED |
REITs - Single Tenant - 0.2% |
Select Income (REIT) | 102,500 | | $ 2,844,375 |
TOTAL REAL ESTATE INVESTMENT TRUSTS | | 1,211,390,289 |
REAL ESTATE MANAGEMENT & DEVELOPMENT - 1.4% |
Real Estate Operating Companies - 1.4% |
Forest City Enterprises, Inc. Class A (a) | 904,742 | | 17,343,904 |
TOTAL COMMON STOCKS (Cost $1,041,952,109) |
1,230,601,405
|
Money Market Funds - 5.2% |
| | | |
Fidelity Cash Central Fund, 0.11% (b) | 17,833,929 | | 17,833,929 |
Fidelity Securities Lending Cash Central Fund, 0.11% (b)(c) | 47,369,375 | | 47,369,375 |
TOTAL MONEY MARKET FUNDS (Cost $65,203,304) |
65,203,304
|
TOTAL INVESTMENT PORTFOLIO - 104.1% (Cost $1,107,155,413) | 1,295,804,709 |
NET OTHER ASSETS (LIABILITIES) - (4.1)% | | (51,002,271) |
NET ASSETS - 100% | $ 1,244,802,438 |
Legend |
(a) Non-income producing |
(b) Affiliated fund that is generally available only to investment companies and other accounts managed by Fidelity Investments. The rate quoted is the annualized seven-day yield of the fund at period end. A complete unaudited listing of the fund's holdings as of its most recent quarter end is available upon request. In addition, each Fidelity Central Fund's financial statements, which are not covered by the Fund's Report of Independent Registered Public Accounting Firm, are available on the SEC's website or upon request. |
(c) Investment made with cash collateral received from securities on loan. |
(d) Security or a portion of the security is on loan at period end. |
Affiliated Central Funds |
Information regarding fiscal year to date income earned by the Fund from investments in Fidelity Central Funds is as follows: |
Fund | Income earned |
Fidelity Cash Central Fund | $ 19,966 |
Fidelity Securities Lending Cash Central Fund | 86,648 |
Total | $ 106,614 |
Other Information |
All investments are categorized as Level 1 under the Fair Value Hierarchy. The inputs or methodology used for valuing securities may not be an indication of the risk associated with investing in those securities. For more information on valuation inputs, please refer to the Investment Valuation section in the accompanying Notes to Financial Statements. |
See accompanying notes which are an integral part of the financial statements.
Annual Report
Statement of Assets and Liabilities
| July 31, 2014 |
| | |
Assets | | |
Investment in securities, at value (including securities loaned of $45,959,789) - See accompanying schedule: Unaffiliated issuers (cost $1,041,952,109) | $ 1,230,601,405 | |
Fidelity Central Funds (cost $65,203,304) | 65,203,304 | |
Total Investments (cost $1,107,155,413) | | $ 1,295,804,709 |
Receivable for investments sold | | 11,144,634 |
Receivable for fund shares sold | | 109,253 |
Dividends receivable | | 453,319 |
Distributions receivable from Fidelity Central Funds | | 8,441 |
Other receivables | | 28,971 |
Total assets | | 1,307,549,327 |
| | |
Liabilities | | |
Payable for investments purchased | $ 13,573,207 | |
Payable for fund shares redeemed | 1,058,586 | |
Accrued management fee | 574,704 | |
Other affiliated payables | 122,649 | |
Other payables and accrued expenses | 48,368 | |
Collateral on securities loaned, at value | 47,369,375 | |
Total liabilities | | 62,746,889 |
| | |
Net Assets | | $ 1,244,802,438 |
Net Assets consist of: | | |
Paid in capital | | $ 1,001,677,059 |
Undistributed net investment income | | 4,533,326 |
Accumulated undistributed net realized gain (loss) on investments | | 49,942,757 |
Net unrealized appreciation (depreciation) on investments | | 188,649,296 |
Net Assets | | $ 1,244,802,438 |
See accompanying notes which are an integral part of the financial statements.
Annual Report
Statement of Assets and Liabilities - continued
| July 31, 2014 |
| | |
Series Real Estate Equity:
Net Asset Value, offering price and redemption price per share ($598,298,482 ÷ 43,196,781 shares) | | $ 13.85 |
| | |
Class F:
Net Asset Value, offering price and redemption price per share ($646,503,956 ÷ 46,660,517 shares) | | $ 13.86 |
See accompanying notes which are an integral part of the financial statements.
Annual Report
Financial Statements - continued
Statement of Operations
| Year ended July 31, 2014 |
| | |
Investment Income | | |
Dividends | | $ 29,164,246 |
Interest | | 6 |
Income from Fidelity Central Funds | | 106,614 |
Total income | | 29,270,866 |
| | |
Expenses | | |
Management fee | $ 6,193,721 | |
Transfer agent fees | 979,919 | |
Accounting and security lending fees | 370,700 | |
Custodian fees and expenses | 37,066 | |
Independent trustees' compensation | 4,558 | |
Audit | 50,664 | |
Legal | 3,334 | |
Miscellaneous | 8,969 | |
Total expenses before reductions | 7,648,931 | |
Expense reductions | (73,159) | 7,575,772 |
Net investment income (loss) | | 21,695,094 |
Realized and Unrealized Gain (Loss) Net realized gain (loss) on: | | |
Investment securities: | | |
Unaffiliated issuers | | 51,455,849 |
Change in net unrealized appreciation (depreciation) on investment securities | | 71,304,807 |
Net gain (loss) | | 122,760,656 |
Net increase (decrease) in net assets resulting from operations | | $ 144,455,750 |
See accompanying notes which are an integral part of the financial statements.
Annual Report
Statement of Changes in Net Assets
| Year ended
July 31,
2014 | Year ended
July 31,
2013 |
Increase (Decrease) in Net Assets | | |
Operations | | |
Net investment income (loss) | $ 21,695,094 | $ 13,612,092 |
Net realized gain (loss) | 51,455,849 | 39,712,522 |
Change in net unrealized appreciation (depreciation) | 71,304,807 | 8,545,406 |
Net increase (decrease) in net assets resulting
from operations | 144,455,750 | 61,870,020 |
Distributions to shareholders from net investment income | (19,187,861) | (12,676,438) |
Distributions to shareholders from net realized gain | (29,660,377) | (20,512,803) |
Total distributions | (48,848,238) | (33,189,241) |
Share transactions - net increase (decrease) | 124,245,341 | 197,354,537 |
Total increase (decrease) in net assets | 219,852,853 | 226,035,316 |
| | |
Net Assets | | |
Beginning of period | 1,024,949,585 | 798,914,269 |
End of period (including undistributed net investment income of $4,533,236 and undistributed net investment income of $2,701,320, respectively) | $ 1,244,802,438 | $ 1,024,949,585 |
See accompanying notes which are an integral part of the financial statements.
Annual Report
Financial Highlights - Series Real Estate Equity
Years ended July 31, | 2014 | 2013 | 2012 G |
Selected Per-Share Data | | | |
Net asset value, beginning of period | $ 12.87 | $ 12.39 | $ 10.00 |
Income from Investment Operations | | | |
Net investment income (loss) D | .23 | .18 | .11 |
Net realized and unrealized gain (loss) | 1.31 | .78 | 2.38 |
Total from investment operations | 1.54 | .96 | 2.49 |
Distributions from net investment income | (.21) | (.17) | (.08) |
Distributions from net realized gain | (.35) | (.31) | (.02) |
Total distributions | (.56) | (.48) | (.10) |
Net asset value, end of period | $ 13.85 | $ 12.87 | $ 12.39 |
Total ReturnB, C | 12.72% | 8.06% | 25.03% |
Ratios to Average Net Assets E, H | | | |
Expenses before reductions | .77% | .79% | .81%A |
Expenses net of fee waivers, if any | .77% | .79% | .81%A |
Expenses net of all reductions | .76% | .78% | .81%A |
Net investment income (loss) | 1.84% | 1.44% | 1.27%A |
Supplemental Data | | | |
Net assets, end of period (000 omitted) | $ 598,298 | $ 531,188 | $ 475,392 |
Portfolio turnover rateF | 69% | 48% | 40%A |
A Annualized
B Total returns for periods of less than one year are not annualized.
C Total returns would have been lower if certain expenses had not been reduced during the applicable periods shown.
D Calculated based on average shares outstanding during the period.
E Fees and expenses of any underlying Fidelity Central Funds are not included in the Fund's expense ratio. The Fund indirectly bears its proportionate share of the expenses of any underlying Fidelity Central Funds.
F Amount does not include the portfolio activity of any underlying Fidelity Central Funds.
G For the period October 20, 2011 (commencement of operations) to July 31, 2012.
H Expense ratios reflect operating expenses of the class. Expenses before reductions do not reflect amounts reimbursed by the investment adviser or reductions from brokerage service arrangements or reductions from other expense offset arrangements and do not represent the amount paid by the class during periods when reimbursements or reductions occur. Expense ratios before reductions for start-up periods may not be representative of longer-term operating periods.Expenses net of fee waivers reflect expenses after reimbursement by the investment adviser but prior to reductions from brokerage service arrangements or other expense offset arrangements. Expenses net of all reductions represent the net expenses paid by the class.
See accompanying notes which are an integral part of the financial statements.
Annual Report
Financial Highlights - Class F
Years ended July 31, | 2014 | 2013 | 2012 G |
Selected Per-Share Data | | | |
Net asset value, beginning of period | $ 12.87 | $ 12.39 | $ 10.00 |
Income from Investment Operations | | | |
Net investment income (loss) D | .26 | .21 | .13 |
Net realized and unrealized gain (loss) | 1.31 | .78 | 2.37 |
Total from investment operations | 1.57 | .99 | 2.50 |
Distributions from net investment income | (.23) | (.20) | (.09) |
Distributions from net realized gain | (.35) | (.31) | (.02) |
Total distributions | (.58) | (.51) | (.11) |
Net asset value, end of period | $ 13.86 | $ 12.87 | $ 12.39 |
Total ReturnB, C | 13.01% | 8.27% | 25.16% |
Ratios to Average Net Assets E, H | | | |
Expenses before reductions | .59% | .60% | .61%A |
Expenses net of fee waivers, if any | .59% | .60% | .61%A |
Expenses net of all reductions | .59% | .59% | .61%A |
Net investment income (loss) | 2.02% | 1.63% | 1.47%A |
Supplemental Data | | | |
Net assets, end of period (000 omitted) | $ 646,504 | $ 493,761 | $ 323,523 |
Portfolio turnover rateF | 69% | 48% | 40%A |
A Annualized
B Total returns for periods of less than one year are not annualized.
C Total returns would have been lower if certain expenses had not been reduced during the applicable periods shown.
D Calculated based on average shares outstanding during the period.
E Fees and expenses of any underlying Fidelity Central Funds are not included in the Fund's expense ratio. The Fund indirectly bears its proportionate share of the expenses of any underlying Fidelity Central Funds.
F Amount does not include the portfolio activity of any underlying Fidelity Central Funds.
G For the period October 20, 2011 (commencement of operations) to July 31, 2012.
H Expense ratios reflect operating expenses of the class. Expenses before reductions do not reflect amounts reimbursed by the investment adviser or reductions from brokerage service arrangements or reductions from other expense offset arrangements and do not represent the amount paid by the class during periods when reimbursements or reductions occur. Expense ratios before reductions for start-up periods may not be representative of longer-term operating periods. Expenses net of fee waivers reflect expenses after reimbursement by the investment adviser but prior to reductions from brokerage service arrangements or other expense offset arrangements. Expenses net of all reductions represent the net expenses paid by the class.
See accompanying notes which are an integral part of the financial statements.
Annual Report
Notes to Financial Statements
For the period ended July 31, 2014
1. Organization.
Fidelity Series Real Estate Equity Fund (the Fund) is a non-diversified fund of Fidelity Securities Fund (the Trust) and is authorized to issue an unlimited number of shares. Shares of the Fund are only available for purchase by mutual funds for which Fidelity Management & Research Company (FMR) or an affiliate serves as an investment manager. The Trust is registered under the Investment Company Act of 1940, as amended (the 1940 Act), as an open-end management investment company organized as a Massachusetts business trust. The Fund offers Series Real Estate Equity and Class F shares, each of which has equal rights as to assets and voting privileges. Each class has exclusive voting rights with respect to matters that affect that class.
2. Investments in Fidelity Central Funds.
The Fund invests in Fidelity Central Funds, which are open-end investment companies generally available only to other investment companies and accounts managed by the investment adviser and its affiliates. The Fund's Schedule of Investments lists each of the Fidelity Central Funds held as of period end, if any, as an investment of the Fund, but does not include the underlying holdings of each Fidelity Central Fund. As an Investing Fund, the Fund indirectly bears its proportionate share of the expenses of the underlying Fidelity Central Funds.
The Money Market Central Funds seek preservation of capital and current income and are managed by Fidelity Investments Money Management, Inc. (FIMM), an affiliate of the investment adviser. Annualized expenses of the Money Market Central Funds as of their most recent shareholder report date are less than .01%.
A complete unaudited list of holdings for each Fidelity Central Fund is available upon request or at the Securities and Exchange Commission (the SEC) website at www.sec.gov. In addition, the financial statements of the Fidelity Central Funds, which are not covered by the Fund's Report of Independent Registered Public Accounting Firm, are available on the SEC website or upon request.
3. Significant Accounting Policies.
The financial statements have been prepared in conformity with accounting principles generally accepted in the United States of America (GAAP), which require management to make certain estimates and assumptions at the date of the financial statements. Actual results could differ from those estimates. Subsequent events, if any, through the date that the financial statements were issued have been evaluated in the preparation of the financial statements. The following summarizes the significant accounting policies of the Fund:
Annual Report
Notes to Financial Statements - continued
3. Significant Accounting Policies - continued
Investment Valuation. Investments are valued as of 4:00 p.m. Eastern time on the last calendar day of the period. In accordance with valuation policies and procedures approved by the Board of Trustees (the Board), the Fund attempts to obtain prices from one or more third party pricing vendors or brokers to value its investments. When current market prices, quotations or currency exchange rates are not readily available or reliable, investments will be fair valued in good faith by the FMR Fair Value Committee (the Committee), in accordance with procedures adopted by the Board. Factors used in determining fair value vary by investment type and may include market or investment specific events. The frequency with which these procedures are used cannot be predicted and they may be utilized to a significant extent. The Committee oversees the Fund's valuation policies and procedures and is responsible for approving and reporting to the Board all fair value determinations.
The Fund categorizes the inputs to valuation techniques used to value its investments into a disclosure hierarchy consisting of three levels as shown below:
Level 1 - quoted prices in active markets for identical investments
Level 2 - other significant observable inputs (including quoted prices for similar investments, interest rates, prepayment speeds, etc.)
Level 3 - unobservable inputs (including the Fund's own assumptions based on the best information available)
Valuation techniques used to value the Fund's investments by major category are as follows:
Equity securities, including restricted securities, for which market quotations are readily available, are valued at the last reported sale price or official closing price as reported by a third party pricing vendor on the primary market or exchange on which they are traded and are categorized as Level 1 in the hierarchy. In the event there were no sales during the day or closing prices are not available, securities are valued at the last quoted bid price or may be valued using the last available price and are generally categorized as Level 2 in the hierarchy. For foreign equity securities, when market or security specific events arise, comparisons to the valuation of American Depositary Receipts (ADRs), futures contracts, Exchange-Traded Funds (ETFs) and certain indexes as well as quoted prices for similar securities may be used and would be categorized as Level 2 in the hierarchy. Utilizing these techniques may result in transfers between Level 1 and Level 2. For equity securities, including restricted securities, where observable inputs are limited, assumptions about market activity and risk are used and these securities may be categorized as Level 3 in the hierarchy.
Annual Report
3. Significant Accounting Policies - continued
Investment Valuation - continued
Investments in open-end mutual funds, including the Fidelity Central Funds, are valued at their closing net asset value (NAV) each business day and are categorized as Level 1 in the hierarchy.
Changes in valuation techniques may result in transfers in or out of an assigned level within the disclosure hierarchy.
Investment Transactions and Income. For financial reporting purposes, the Fund's investment holdings and NAV include trades executed through the end of the last business day of the period. The NAV per share for processing shareholder transactions is calculated as of the close of business of the New York Stock Exchange (NYSE), normally 4:00 p.m. Eastern time and includes trades executed through the end of the prior business day. Gains and losses on securities sold are determined on the basis of identified cost. Dividend income is recorded on the ex-dividend date, except for certain dividends from foreign securities where the ex-dividend date may have passed, which are recorded as soon as the Fund is informed of the ex-dividend date. Non-cash dividends included in dividend income, if any, are recorded at the fair market value of the securities received. Income and capital gain distributions from Fidelity Central Funds, if any, are recorded on the ex-dividend date. Distributions received on securities that represent a return of capital or capital gain are recorded as a reduction of cost of investments and/or as a realized gain. Subsequent to ex-dividend date the Fund determines the components of these distributions, based upon receipt of tax filings or other correspondence relating to the underlying investment. Interest income is accrued as earned and includes coupon interest and amortization of premium and accretion of discount on debt securities as applicable.
Class Allocations and Expenses. Investment income, realized and unrealized capital gains and losses, common expenses of the Fund, and certain fund-level expense reductions, if any, are allocated daily on a pro-rata basis to each class based on the relative net assets of each class to the total net assets of the Fund. Each class differs with respect to transfer agent fees incurred. Certain expense reductions may also differ by class. For the reporting period, the allocated portion of income and expenses to each class as a percent of its average net assets may vary due to the timing of recording these transactions in relation to fluctuating net assets of the classes. Expenses directly attributable to a fund are charged to that fund. Expenses attributable to more than one fund are allocated among the respective funds on the basis of relative net assets or other appropriate methods. Expense estimates are accrued in the period to which they relate and adjustments are made when actual amounts are known.
Annual Report
Notes to Financial Statements - continued
3. Significant Accounting Policies - continued
Income Tax Information and Distributions to Shareholders. Each year, the Fund intends to qualify as a regulated investment company under Subchapter M of the Internal Revenue Code, including distributing substantially all of its taxable income and realized gains. As a result, no provision for U.S. Federal income taxes is required. As of July 31, 2014, the Fund did not have any unrecognized tax benefits in the financial statements; nor is the Fund aware of any tax positions for which it is reasonably possible that the total amounts of unrecognized tax benefits will significantly change in the next twelve months. The Fund files a U.S. federal tax return, in addition to state and local tax returns as required. The Fund's federal income tax returns are subject to examination by the Internal Revenue Service (IRS) for a period of three fiscal years after they are filed. State and local tax returns may be subject to examination for an additional fiscal year depending on the jurisdiction.
Distributions are declared and recorded on the ex-dividend date. Income dividends and capital gain distributions are declared separately for each class. Income and capital gain distributions are determined in accordance with income tax regulations, which may differ from GAAP.
Capital accounts within the financial statements are adjusted for permanent book-tax differences. These adjustments have no impact on net assets or the results of operations. Capital accounts are not adjusted for temporary book-tax differences which will reverse in a subsequent period.
Book-tax differences are primarily due to losses deferred due to wash sales.
The federal tax cost of investment securities and unrealized appreciation (depreciation) as of period end were as follows:
Gross unrealized appreciation | $ 192,492,604 |
Gross unrealized depreciation | (4,943,085) |
Net unrealized appreciation (depreciation) on securities | $ 187,549,519 |
| |
Tax Cost | $ 1,108,255,190 |
The tax-based components of distributable earnings as of period end were as follows:
Undistributed ordinary income | $ 4,533,326 |
Undistributed long-term capital gain | $ 51,042,532 |
Net unrealized appreciation (depreciation) on securities and other investments | $ 187,549,519 |
Annual Report
3. Significant Accounting Policies - continued
Income Tax Information and Distributions to Shareholders - continued
The tax character of distributions paid was as follows:
| July 31, 2014 | July 31, 2013 |
Ordinary Income | $ 25,299,133 | $ 30,506,015 |
Long-term Capital Gains | 23,549,105 | 2,683,226 |
Total | $ 48,848,238 | $ 33,189,241 |
4. Purchases and Sales of Investments.
Purchases and sales of securities, other than short-term securities, aggregated $880,527,964 and $765,798,774, respectively.
5. Fees and Other Transactions with Affiliates.
Management Fee. Fidelity Management & Research Company (the investment adviser) and its affiliates provide the Fund with investment management related services for which the Fund pays a monthly management fee. The management fee is the sum of an individual fund fee rate that is based on an annual rate of .30% of the Fund's average net assets and an annualized group fee rate that averaged .25% during the period. The group fee rate is based upon the average net assets of all the mutual funds advised by the investment adviser, including any mutual funds previously advised by the investment adviser that are currently advised by Fidelity SelectCo, LLC, an affiliate of the investment adviser. The group fee rate decreases as assets under management increase and increases as assets under management decrease. For the reporting period, the total annual management fee rate was .55% of the Fund's average net assets.
Transfer Agent Fees. Fidelity Investments Institutional Operations Company, Inc., (FIIOC), an affiliate of the investment adviser, is the transfer, dividend disbursing and shareholder servicing agent for each class of the Fund. FIIOC receives account fees and asset-based fees that vary according to the account size and type of account of the shareholders of Series Real Estate Equity. FIIOC receives no fees for providing transfer agency services to Class F. FIIOC pays for typesetting, printing and mailing of shareholder reports, except proxy statements.
For the period, transfer agent fees for each applicable class were as follows:
| Amount | % of
Average
Net Assets |
Series Real Estate Equity | $ 979,919 | .17 |
Annual Report
Notes to Financial Statements - continued
5. Fees and Other Transactions with Affiliates - continued
Accounting and Security Lending Fees. Fidelity Service Company, Inc. (FSC), an affiliate of the investment adviser, maintains the Fund's accounting records. The accounting fee is based on the level of average net assets for each month. Under a separate contract, FSC administers the security lending program. The security lending fee is based on the number and duration of lending transactions.
Brokerage Commissions. The Fund placed a portion of its portfolio transactions with brokerage firms which are affiliates of the investment adviser. Brokerage commissions are included in net realized gain (loss) and change in net unrealized appreciation (depreciation) in the Statement of Operations. The commissions paid to these affiliated firms were $9,162 for the period.
6. Committed Line of Credit.
The Fund participates with other funds managed by the investment adviser or an affiliate in a $4.25 billion credit facility (the "line of credit") to be utilized for temporary or emergency purposes to fund shareholder redemptions or for other short-term liquidity purposes. The Fund has agreed to pay commitment fees on its pro-rata portion of the line of credit, which amounted to $1,880 and is reflected in Miscellaneous expenses on the Statement of Operations. During the period, the Fund did not borrow on this line of credit.
7. Security Lending.
The Fund lends portfolio securities through a lending agent from time to time in order to earn additional income. For equity securities, a lending agent is used and may loan securities to certain qualified borrowers, including Fidelity Capital Markets (FCM), a broker-dealer affiliated with the Fund. On the settlement date of the loan, the Fund receives collateral (in the form of U.S. Treasury obligations, letters of credit and/or cash) against the loaned securities and maintains collateral in an amount not less than 100% of the market value of the loaned securities during the period of the loan. The market value of the loaned securities is determined at the close of business of the Fund and any additional required collateral is delivered to the Fund on the next business day. If the borrower defaults on its obligation to return the securities loaned because of insolvency or other reasons, the Fund may apply collateral received from the borrower against the obligation. The Fund may experience delays and costs in recovering the securities loaned. Any cash collateral received is invested in the Fidelity Securities Lending Cash Central Fund. The value of loaned securities and cash collateral at period end are disclosed on the Fund's Statement of Assets and Liabilities. Security lending income
Annual Report
7. Security Lending - continued
represents the income earned on investing cash collateral, less rebates paid to borrowers and any lending agent fees associated with the loan, plus any premium payments received for lending certain types of securities. Security lending income is presented in the Statement of Operations as a component of income from Fidelity Central Funds. Total security lending income during the period amounted to $86,648. During the period, there were no securities loaned to FCM.
8. Expense Reductions.
Commissions paid to certain brokers with whom the investment adviser, or its affiliates, places trades on behalf of the Fund include an amount in addition to trade execution, which may be rebated back to the Fund to offset certain expenses. This amount totaled $73,135 for the period.
In addition, through arrangements with the Fund's custodian, credits realized as a result of uninvested cash balances were used to reduce the Fund's expenses. During the period, these credits reduced the Fund's custody expenses by $24.
9. Distributions to Shareholders.
Distributions to shareholders of each class were as follows:
Years ended July 31, | 2014 | 2013 |
From net investment income | | |
Series Real Estate Equity | $ 9,282,647 | $ 6,714,600 |
Class F | 9,905,214 | 5,961,838 |
Total | $ 19,187,861 | $ 12,676,438 |
From net realized gain | | |
Series Real Estate Equity | $ 14,856,526 | $ 11,925,873 |
Class F | 14,803,851 | 8,586,930 |
Total | $ 29,660,377 | $ 20,512,803 |
Annual Report
Notes to Financial Statements - continued
10. Share Transactions.
Transactions for each class of shares were as follows:
| Shares | Dollars |
Years ended July 31, | 2014 | 2013 | 2014 | 2013 |
Series Real Estate Equity | | | | |
Shares sold | 12,135,298 | 6,610,741 | $ 155,920,114 | $ 86,029,893 |
Reinvestment of distributions | 2,036,221 | 1,534,780 | 24,139,173 | 18,640,473 |
Shares redeemed | (12,260,138) | (5,238,476) | (160,457,152) | (65,738,689) |
Net increase (decrease) | 1,911,381 | 2,907,045 | $ 19,602,135 | $ 38,931,677 |
Class F | | | | |
Shares sold | 17,886,060 | 12,141,060 | $ 232,091,231 | $ 157,366,547 |
Reinvestment of distributions | 2,085,724 | 1,195,373 | 24,709,065 | 14,548,768 |
Shares redeemed | (11,669,575) | (1,083,592) | (152,157,090) | (13,492,455) |
Net increase (decrease) | 8,302,209 | 12,252,841 | $ 104,643,206 | $ 158,422,860 |
11. Other.
The Fund's organizational documents provide former and current trustees and officers with a limited indemnification against liabilities arising in connection with the performance of their duties to the Fund. In the normal course of business, the Fund may also enter into contracts that provide general indemnifications. The Fund's maximum exposure under these arrangements is unknown as this would be dependent on future claims that may be made against the Fund. The risk of material loss from such claims is considered remote.
At the end of the period, mutual funds managed by the investment adviser or its affiliates were the owners of record of all of the outstanding shares of the Fund.
Annual Report
To the Trustees of Fidelity Securities Fund and Shareholders of Fidelity Series Real Estate Equity Fund:
We have audited the accompanying statement of assets and liabilities of Fidelity Series Real Estate Equity Fund (the Fund), a fund of Fidelity Securities Fund, including the schedule of investments, as of July 31, 2014, and the related statement of operations for the year then ended, the statement of changes in net assets for each of the two years in the period then ended, and the financial highlights for the periods presented. These financial statements and financial highlights are the responsibility of the Fund's management. Our responsibility is to express an opinion on these financial statements and financial highlights based on our audits.
We conducted our audits in accordance with the standards of the Public Company Accounting Oversight Board (United States). Those standards require that we plan and perform the audit to obtain reasonable assurance about whether the financial statements and financial highlights are free of material misstatement. The Fund is not required to have, nor were we engaged to perform, an audit of its internal control over financial reporting. Our audits included consideration of internal control over financial reporting as a basis for designing audit procedures that are appropriate in the circumstances, but not for the purpose of expressing an opinion on the effectiveness of the Fund's internal control over financial reporting. Accordingly, we express no such opinion. An audit also includes examining, on a test basis, evidence supporting the amounts and disclosures in the financial statements, assessing the accounting principles used and significant estimates made by management, as well as evaluating the overall financial statement presentation. Our procedures included confirmation of securities owned as of July 31, 2014, by correspondence with the custodians and brokers; where replies were not received from brokers, we performed other auditing procedures. We believe that our audits provide a reasonable basis for our opinion.
In our opinion, the financial statements and financial highlights referred to above present fairly, in all material respects, the financial position of Fidelity Series Real Estate Equity Fund as of July 31, 2014, the results of its operations for the year then ended, the changes in its net assets for each of the two years in the period then ended, and the financial highlights for the periods presented, in conformity with accounting principles generally accepted in the United States of America.
DELOITTE & TOUCHE LLP
Boston, Massachusetts
September 12, 2014
Annual Report
The Trustees, Member of the Advisory Board, and officers of the trust and fund, as applicable, are listed below. The Board of Trustees governs the fund and is responsible for protecting the interests of shareholders. The Trustees are experienced executives who meet periodically throughout the year to oversee the fund's activities, review contractual arrangements with companies that provide services to the fund, oversee management of the risks associated with such activities and contractual arrangements, and review the fund's performance. Except for James C. Curvey, each of the Trustees oversees 173 funds. Mr. Curvey oversees 397 funds.
The Trustees hold office without limit in time except that (a) any Trustee may resign; (b) any Trustee may be removed by written instrument, signed by at least two-thirds of the number of Trustees prior to such removal; (c) any Trustee who requests to be retired or who has become incapacitated by illness or injury may be retired by written instrument signed by a majority of the other Trustees; and (d) any Trustee may be removed at any special meeting of shareholders by a two-thirds vote of the outstanding voting securities of the trust. Each Trustee who is not an interested person (as defined in the 1940 Act) of the trust and the fund (Independent Trustee), shall retire not later than the last day of the calendar year in which his or her 75th birthday occurs. The Independent Trustees may waive this mandatory retirement age policy with respect to individual Trustees. The officers and Advisory Board Member hold office without limit in time, except that any officer and Advisory Board Member may resign or may be removed by a vote of a majority of the Trustees at any regular meeting or any special meeting of the Trustees. Except as indicated, each individual has held the office shown or other offices in the same company for the past five years.
Experience, Skills, Attributes, and Qualifications of the Fund's Trustees. The Governance and Nominating Committee has adopted a statement of policy that describes the experience, qualifications, attributes, and skills that are necessary and desirable for potential Independent Trustee candidates (Statement of Policy). The Board believes that each Trustee satisfied at the time he or she was initially elected or appointed a Trustee, and continues to satisfy, the standards contemplated by the Statement of Policy. The Governance and Nominating Committee also engages professional search firms to help identify potential Independent Trustee candidates who have the experience, qualifications, attributes, and skills consistent with the Statement of Policy. From time to time, additional criteria based on the composition and skills of the current Independent Trustees, as well as experience or skills that may be appropriate in light of future changes to board composition, business conditions, and regulatory or other developments, have also been considered by the professional search firms and the Governance and Nominating Committee. In addition, the Board takes into account the Trustees' commitment and participation in Board and committee meetings, as well as their leadership of standing and ad hoc committees throughout their tenure.
In determining that a particular Trustee was and continues to be qualified to serve as a Trustee, the Board has considered a variety of criteria, none of which, in isolation, was controlling. The Board believes that, collectively, the Trustees have balanced and diverse experience, qualifications, attributes, and skills, which allow the Board to operate effectively in governing the fund and protecting the interests of shareholders. Information about the specific experience, skills, attributes, and qualifications of each Trustee, which in each case led to the Board's conclusion that the Trustee should serve (or continue to serve) as a trustee of the fund, is provided below.
Annual Report
Trustees and Officers - continued
Board Structure and Oversight Function. James C. Curvey is an interested person (as defined in the 1940 Act) and currently serves as Chairman. The Trustees have determined that an interested Chairman is appropriate and benefits shareholders because an interested Chairman has a personal and professional stake in the quality and continuity of services provided to the fund. Independent Trustees exercise their informed business judgment to appoint an individual of their choosing to serve as Chairman, regardless of whether the Trustee happens to be independent or a member of management. The Independent Trustees have determined that they can act independently and effectively without having an Independent Trustee serve as Chairman and that a key structural component for assuring that they are in a position to do so is for the Independent Trustees to constitute a substantial majority for the Board. The Independent Trustees also regularly meet in executive session. Ned C. Lautenbach serves as Chairman of the Independent Trustees and as such (i) acts as a liaison between the Independent Trustees and management with respect to matters important to the Independent Trustees and (ii) with management prepares agendas for Board meetings.
Fidelity funds are overseen by different Boards of Trustees. The fund's Board oversees Fidelity's equity and high income funds and another Board oversees Fidelity's investment-grade bond, money market, and asset allocation funds. The asset allocation funds may invest in Fidelity funds overseen by the fund's Board. The use of separate Boards, each with its own committee structure, allows the Trustees of each group of Fidelity funds to focus on the unique issues of the funds they oversee, including common research, investment, and operational issues. On occasion, the separate Boards establish joint committees to address issues of overlapping consequences for the Fidelity funds overseen by each Board.
The Trustees operate using a system of committees to facilitate the timely and efficient consideration of all matters of importance to the Trustees, the fund, and fund shareholders and to facilitate compliance with legal and regulatory requirements and oversight of the fund's activities and associated risks. The Board, acting through its committees, has charged FMR and its affiliates with (i) identifying events or circumstances the occurrence of which could have demonstrably adverse effects on the fund's business and/or reputation; (ii) implementing processes and controls to lessen the possibility that such events or circumstances occur or to mitigate the effects of such events or circumstances if they do occur; and (iii) creating and maintaining a system designed to evaluate continuously business and market conditions in order to facilitate the identification and implementation processes described in (i) and (ii) above. Because the day-to-day operations and activities of the fund are carried out by or through FMR, its affiliates and other service providers, the fund's exposure to risks is mitigated but not eliminated by the processes overseen by the Trustees. While each of the Board's committees has responsibility for overseeing different aspects of the fund's activities, oversight is exercised primarily through the Operations, Audit, and Compliance Committees. In addition, the Independent Trustees have worked with FMR to enhance the Board's oversight of investment and financial risks, legal and regulatory risks, technology risks, and operational risks, including the development of additional risk reporting to the Board. For example, a working group comprised of Independent Trustees and FMR has worked and continues to work to review the Fidelity funds' valuation-related activities, reporting and risk management. Appropriate personnel, including but not limited to the fund's Chief Compliance Officer (CCO), FMR's internal auditor, the independent accountants, the fund's Treasurer and portfolio management personnel, make periodic reports to the Board's committees, as appropriate, including an annual review of FMR's risk management program for the Fidelity funds. The responsibilities of each standing committee, including their oversight responsibilities, are described further under "Standing Committees of the Fund's Trustees."
Annual Report
The fund's Statements of Additional Information (SAIs) include more information about the Trustees. To request a free copy, call Fidelity at 1-800-544-8544 for Fidelity Series Real Estate Equity Fund, or 1-800-835-5092 for Class F.
Interested Trustees*:
Correspondence intended for each Trustee who is an interested person may be sent to Fidelity Investments, 245 Summer Street, Boston, Massachusetts 02210.
Name, Year of Birth; Principal Occupations and Other Relevant Experience+ |
James C. Curvey (1935) |
Year of Election or Appointment: 2007 Trustee Chairman of the Board of Trustees |
| Mr. Curvey also serves as Trustee of other Fidelity funds. Mr. Curvey is a Director of Fidelity Research & Analysis Co. (2009-present), and Vice Chairman (2007-present) and Director of FMR LLC. In addition, Mr. Curvey serves as an Overseer for the Boston Symphony Orchestra and a member of the Trustees of Villanova University. Previously, Mr. Curvey served as a Director of Fidelity Investments Money Management, Inc. (2009-2014), a Director of FMR (2007-2014), a Director of FMR Co., Inc. (2007-2014) and was the Vice Chairman (2006-2007) and Director (2000-2007) of FMR Corp. |
Name, Year of Birth; Principal Occupations and Other Relevant Experience+ |
Charles S. Morrison (1960) |
Year of Election or Appointment: 2014 Trustee |
| Mr. Morrison also serves as Trustee of other funds. He serves as President, Asset Management (2014-present) and is an employee of Fidelity Investments. Previously, Mr. Morrison served as Vice President of Fidelity's Fixed Income and Asset Allocation Funds (2012-2014), President, Fixed Income (2011-2014), Vice President of Fidelity's Money Market Funds (2005-2009), President, Money Market Group Leader of FMR (2009), and Senior Vice President, Money Market Group of FMR (2004-2009). Mr. Morrison also served as Vice President of Fidelity's Bond Funds (2002-2005), certain Balanced Funds (2002-2005), and certain Asset Allocation Funds (2002-2007), and as Senior Vice President (2002-2005) of Fidelity's Bond Division. |
* Trustees have been determined to be "Interested Trustees" by virtue of, among other things, their affiliation with the trust or various entities under common control with FMR.
+ The information above includes each Trustee's principal occupation during the last five years and other information relating to the experience, attributes, and skills relevant to each Trustee's qualifications to serve as a Trustee, which led to the conclusion that each Trustee should serve as a Trustee for the fund.
Annual Report
Independent Trustees:
Correspondence intended for each Independent Trustee (that is, the Trustees other than the Interested Trustees) may be sent to Fidelity Investments, P.O. Box 55235, Boston, Massachusetts 02205-5235.
Name, Year of Birth; Principal Occupations and Other Relevant Experience+ |
Dennis J. Dirks (1948) |
Year of Election or Appointment: 2005 Trustee |
| Mr. Dirks also serves as Trustee of other Fidelity funds. Prior to his retirement in May 2003, Mr. Dirks was Chief Operating Officer and a member of the Board of The Depository Trust & Clearing Corporation (DTCC). He also served as President, Chief Operating Officer, and Board member of The Depository Trust Company (DTC) and President and Board member of the National Securities Clearing Corporation (NSCC). In addition, Mr. Dirks served as Chief Executive Officer and Board member of the Government Securities Clearing Corporation, Chief Executive Officer and Board member of the Mortgage-Backed Securities Clearing Corporation, as a Trustee and a member of the Finance Committee of Manhattan College (2005-2008), and as a Trustee and a member of the Finance Committee of AHRC of Nassau County (2006-2008). Mr. Dirks is a member of the Independent Directors Council (IDC) Governing Council (2010-present) and Board of Directors for The Brookville Center for Children's Services, Inc. (2009-present). |
Alan J. Lacy (1953) |
Year of Election or Appointment: 2008 Trustee |
| Mr. Lacy also serves as Trustee of other Fidelity funds. Mr. Lacy serves as Senior Adviser (2007-present) of Oak Hill Capital Partners, L.P. (private equity). Mr. Lacy also served as Chief Executive Officer (2000-2005) and Vice Chairman (2005-2006) of Sears Holdings Corporation and Sears, Roebuck and Co. (retail). In addition, Mr. Lacy serves as a member of the Board of Directors of Dave & Buster's Entertainment, Inc. (restaurant and entertainment complexes, 2010-present), Earth Fare, Inc. (retail grocery, 2012-present), The Hillman Companies, Inc. (hardware wholesalers, 2010-present), and Bristol-Myers Squibb Company (global pharmaceuticals, 2008-present). Mr. Lacy is a member of the Board of Trustees of The National Parks Conservation Association (2006-present). Previously, Mr. Lacy served as Chairman of the Board of Trustees of the National Parks Conservation Association (2008-2011) and as a member of the Board of Directors for the Western Union Company (global money transfer, 2006-2011). |
Ned C. Lautenbach (1944) |
Year of Election or Appointment: 2000 Trustee Chairman of the Independent Trustees |
| Mr. Lautenbach also serves as Trustee of other Fidelity funds. Mr. Lautenbach currently serves as the Lead Director of the Eaton Corporation Board of Directors (diversified industrial, 1997-present). Mr. Lautenbach is Chairman of the Board of Directors of the Philharmonic Center for the Arts in Naples, Florida (2012-present) and a member of the Council on Foreign Relations (1994-present). Previously, Mr. Lautenbach was a Partner/Advisory Partner at Clayton, Dubilier & Rice, LLC (private equity investment, 1998-2010), as well as a Director of Sony Corporation (2006-2007). |
Joseph Mauriello (1944) |
Year of Election or Appointment: 2008 Trustee |
| Mr. Mauriello also serves as Trustee of other Fidelity funds. Prior to his retirement in January 2006, Mr. Mauriello served in numerous senior management positions including Deputy Chairman and Chief Operating Officer (2004-2005), and Vice Chairman of Financial Services (2002-2004) of KPMG LLP US (professional services, 1965-2005). Mr. Mauriello currently serves as a member of the Board of Directors of XL Group plc. (global insurance and re-insurance, 2006-present). Previously, Mr. Mauriello served as a Director of the Hamilton Funds of the Bank of New York (2006-2007) and of Arcadia Resources Inc. (health care services and products, 2007-2012). |
Robert W. Selander (1950) |
Year of Election or Appointment: 2011 Trustee |
| Mr. Selander also serves as Trustee of other Fidelity funds. Previously, Mr. Selander served as a Member of the Advisory Board of other Fidelity funds (2011), and Executive Vice Chairman (2010), Chief Executive Officer (2009-2010), and President and Chief Executive Officer (1997-2009) of Mastercard, Inc. |
Cornelia M. Small (1944) |
Year of Election or Appointment: 2005 Trustee |
| Ms. Small also serves as Trustee of other Fidelity funds. Ms. Small is a member of the Board of Directors (2009-present) and Chair of the Investment Committee (2010-present) of the Teagle Foundation. Ms. Small also serves on the Investment Committee of the Berkshire Taconic Community Foundation (2008-present). Previously, Ms. Small served as Chairperson (2002-2008) and a member of the Investment Committee and Chairperson (2008-2012) and a member of the Board of Trustees of Smith College. In addition, Ms. Small served as Chief Investment Officer, Director of Global Equity Investments, and a member of the Board of Directors of Scudder, Stevens & Clark and Scudder Kemper Investments. |
William S. Stavropoulos (1939) |
Year of Election or Appointment: 2002 Trustee Vice Chairman of the Independent Trustees |
| Mr. Stavropoulos also serves as Trustee of other Fidelity funds. Mr. Stavropoulos serves as President and Founder of the Michigan Baseball Foundation, the Great Lakes Loons (2007-present). Mr. Stavropoulos is Chairman Emeritus of the Board of Directors of The Dow Chemical Company, where he previously served in numerous senior management positions, including President, CEO (1995-2000; 2002-2004), Chairman of the Executive Committee (2000-2006), and as a member of the Board of Directors (1990-2006). Currently, Mr. Stavropoulos is Chairman of the Board of Directors of Univar Inc. (global distributor of commodity and specialty chemicals), a Director of Teradata Corporation (data warehousing and technology solutions), and Maersk Inc. (industrial conglomerate), and a member of the Advisory Board for Metalmark Capital LLC (private equity investment, 2005-present). Mr. Stavropoulos is an operating advisor to Clayton, Dubilier & Rice, LLC (private equity investment). In addition, Mr. Stavropoulos is a member of the University of Notre Dame Advisory Council for the College of Science, a Trustee of the Rollin L. Gerstacker Foundation, and a Director of the Naples Philharmonic Center for the Arts. Previously, Mr. Stavropoulos served as a Director of Chemical Financial Corporation (bank holding company, 1993-2012) and Tyco International, Ltd. (multinational manufacturing and services, 2007-2012). |
David M. Thomas (1949) |
Year of Election or Appointment: 2008 Trustee |
| Mr. Thomas also serves as Trustee of other Fidelity funds. Mr. Thomas serves as Non-Executive Chairman of the Board of Directors of Fortune Brands Home and Security (home and security products, 2011-present), and as a member of the Board of Directors of Interpublic Group of Companies, Inc. (marketing communication, 2004-present). Previously, Mr. Thomas served as Executive Chairman (2005-2006) and Chairman and Chief Executive Officer (2000-2005) of IMS Health, Inc. (pharmaceutical and healthcare information solutions), and a Director of Fortune Brands, Inc. (consumer products, 2000-2011). |
+ The information above includes each Trustee's principal occupation during the last five years and other information relating to the experience, attributes, and skills relevant to each Trustee's qualifications to serve as a Trustee, which led to the conclusion that each Trustee should serve as a Trustee for the fund.
Advisory Board Member and Officers:
Correspondence intended for each officer and Peter S. Lynch may be sent to Fidelity Investments, 245 Summer Street, Boston, Massachusetts 02210. Officers appear below in alphabetical order.
Name, Year of Birth; Principal Occupation |
Peter S. Lynch (1944) |
Year of Election or Appointment: 2003 Member of the Advisory Board |
| Mr. Lynch also serves as Member of the Advisory Board of other Fidelity funds. Mr. Lynch is Vice Chairman and a Director of FMR and FMR Co., Inc. In addition, Mr. Lynch serves as a Trustee of Boston College and as the Chairman of the Inner-City Scholarship Fund. Previously, Mr. Lynch served on the Special Olympics International Board of Directors (1997-2006). |
Christopher S. Bartel (1971) |
Year of Election or Appointment: 2011 Vice President |
| Mr. Bartel also serves as Vice President of other funds. Mr. Bartel serves as a Director, President, and Chief Executive Officer of Fidelity Management & Research (Japan) Inc. (2012-present), a Director of Fidelity Management & Research (Hong Kong) (2012-present), and Senior Vice President of Global Equity Research (2010-present). Previously, Mr. Bartel served as Senior Vice President of Equity Research (2009-2010), Managing Director of Research (2006-2009), and an analyst and portfolio manager (2000-2006). |
Elizabeth Paige Baumann (1968) |
Year of Election or Appointment: 2012 Anti-Money Laundering (AML) Officer |
| Ms. Baumann also serves as AML Officer of other funds. She is Chief AML Officer of FMR LLC (2012-present) and is an employee of Fidelity Investments. Previously, Ms. Baumann served as Vice President and Deputy Anti-Money Laundering Officer (2007-2012). |
William C. Coffey (1969) |
Year of Election or Appointment: 2009 Assistant Secretary |
| Mr. Coffey also serves as Assistant Secretary of other funds. He is Senior Vice President and Deputy General Counsel of FMR LLC (2010-present), and is an employee of Fidelity Investments. Previously, Mr. Coffey served as Vice President and Associate General Counsel of FMR LLC (2005-2009). |
Jonathan Davis (1968) |
Year of Election or Appointment: 2010 Assistant Treasurer |
| Mr. Davis also serves as Assistant Treasurer of other funds. Mr. Davis is an employee of Fidelity Investments. Previously, Mr. Davis served as Vice President and Associate General Counsel of FMR LLC (2003-2010). |
Adrien E. Deberghes (1967) |
Year of Election or Appointment: 2008 Deputy Treasurer |
| Mr. Deberghes also serves as an officer of other funds. He is an employee of Fidelity Investments (2008-present). Prior to joining Fidelity Investments, Mr. Deberghes was Senior Vice President of Mutual Fund Administration at State Street Corporation (2007-2008), Senior Director of Mutual Fund Administration at Investors Bank & Trust (2005-2007), and Director of Finance for Dunkin' Brands (2000-2005). |
Stephanie J. Dorsey (1969) |
Year of Election or Appointment: 2010 Assistant Treasurer |
| Ms. Dorsey also serves as an officer of other funds. She is an employee of Fidelity Investments (2008-present) and has served in other fund officer roles. Prior to joining Fidelity Investments, Ms. Dorsey served as Treasurer (2004-2008) of the JPMorgan Mutual Funds and Vice President (2004-2008) of JPMorgan Chase Bank. |
Howard J. Galligan III (1966) |
Year of Election or Appointment: 2014 Chief Financial Officer |
| Mr. Galligan also serves as Chief Financial Officer of other funds. Mr. Galligan serves as President of Fidelity Pricing and Cash Management Services (FPCMS) (2014-present) and as a Director of Strategic Advisers, Inc. (2008-present). Previously, Mr. Galligan served as Chief Administrative Officer of Asset Management (2011-2014) and Chief Operating Officer and Senior Vice President of Investment Support for Strategic Advisers, Inc. (2003-2011). |
Scott C. Goebel (1968) |
Year of Election or Appointment: 2008 Secretary and Chief Legal Officer (CLO) |
| Mr. Goebel serves as Secretary and CLO of other funds. Mr. Goebel also serves as Secretary of Fidelity SelectCo, LLC (2013-present), Fidelity Investments Money Management, Inc. (FIMM) (2010-present) and Fidelity Research and Analysis Company (FRAC) (2010-present); General Counsel, Secretary, and Senior Vice President of FMR (2008-present) and FMR Co., Inc. (2008-present); Chief Legal Officer of Fidelity Management & Research (Hong Kong) Limited (2008-present); and Assistant Secretary of Fidelity Management & Research (Japan) Inc. (2008-present) and Fidelity Management & Research (U.K.) Inc. (2008-present). Previously, Mr. Goebel served as Secretary and CLO of other Fidelity funds (2008-2013), Assistant Secretary of FIMM (2008-2010), FRAC (2008-2010), and certain funds (2007-2008); and as Vice President and Secretary of Fidelity Distributors Corporation (FDC) (2005-2007). Mr. Goebel has been employed by FMR LLC or an affiliate since 2001. |
Brian B. Hogan (1964) |
Year of Election or Appointment: 2011 Vice President |
| Mr. Hogan also serves as Trustee or Vice President of other funds. Mr. Hogan serves as President of FMR's Equity Division (2009-present). Previously, Mr. Hogan served as Senior Vice President, Equity Research of FMR (2006-2009) and as a portfolio manager. |
Chris Maher (1972) |
Year of Election or Appointment: 2013 Assistant Treasurer |
| Mr. Maher serves as Assistant Treasurer of other funds. Mr. Maher is Vice President of Valuation Oversight and is an employee of Fidelity Investments. Previously, Mr. Maher served as Vice President of Asset Management Compliance (2013), Vice President of FMR's Program Management Group (2010-2013), and Vice President of Valuation Oversight (2008-2010). |
Kenneth B. Robins (1969) |
Year of Election or Appointment: 2008 President and Treasurer |
| Mr. Robins also serves as an officer of other funds. Mr. Robins serves as Executive Vice President of Fidelity Investments Money Management, Inc. (FIMM) (2013-present) and is an employee of Fidelity Investments (2004-present). Previously, Mr. Robins served in other fund officer roles. |
Stephen Sadoski (1971) |
Year of Election or Appointment: 2012 Deputy Treasurer |
| Mr. Sadoski also serves as Deputy Treasurer of other funds. He is an employee of Fidelity Investments (2012-present) and has served in another fund officer role. Prior to joining Fidelity Investments, Mr. Sadoski served as an assistant chief accountant in the Division of Investment Management of the Securities and Exchange Commission (SEC) (2009-2012) and as a senior manager at Deloitte & Touche LLP (1997-2009). |
Stacie M. Smith (1974) |
Year of Election or Appointment: 2013 Deputy Treasurer |
| Ms. Smith also serves as an officer of other funds. She is an employee of Fidelity Investments (2009-present) and has served in other fund officer roles. Prior to joining Fidelity Investments, Ms. Smith served as Senior Audit Manager of Ernst & Young LLP (1996-2009). |
Renee Stagnone (1975) |
Year of Election or Appointment: 2013 Deputy Treasurer |
| Ms. Stagnone also serves as Deputy Treasurer of other funds. Ms. Stagnone is an employee of Fidelity Investments. |
Linda J. Wondrack (1964) |
Year of Election or Appointment: 2014 Chief Compliance Officer |
| Ms. Wondrack also serves as Chief Compliance Officer of other funds. Ms. Wondrack is Executive Vice President and head of the Ethics Office and Asset Management Compliance for Fidelity Investments (2012- present). Ms. Wondrack also serves as Chief Compliance Officer of Fidelity SelectCo, LLC (2014-present); Chief Compliance Officer of Impresa Management LLC (2013-present); and Chief Compliance Officer of FMR Co., Inc., Fidelity Investments Money Management, Inc., Fidelity Management & Research (Japan) Inc., Fidelity Management & Research (U.K.) Inc., Fidelity Management & Research (Hong Kong), Fidelity Management & Research Company, Pyramis Global Advisors, LLC, and Strategic Advisers, Inc., Ballyrock Investment Advisors LLC, and Northern Neck Investors LLC (2012-present). Previously, Ms. Wondrack served as Senior Vice President and Chief Compliance Officer for Columbia Management Investment Advisers, LLC (2005-2012); Chief Compliance Officer for certain funds within the Columbia Family of Funds (2007-2012); and Senior Vice President of Compliance Risk Management at Bank of America (2005-2010). |
Joseph F. Zambello (1957) |
Year of Election or Appointment: 2011 Deputy Treasurer |
| Mr. Zambello also serves as Deputy Treasurer of other funds. Mr. Zambello is an employee of Fidelity Investments. Previously, Mr. Zambello served as Vice President of FMR's Program Management Group (2009-2011) and Vice President of the Transfer Agent Oversight Group (2005-2009). |
Annual Report
The Board of Trustees of Fidelity Series Real Estate Equity Fund voted to pay shareholders of record at the opening of business on record date, the following distributions per share derived from capital gains realized from sales of portfolio securities, and dividends derived from net investment income:
| Pay Date | Record Date | Dividends | Capital Gains |
Series Real Estate
Equity | 09/08/14 | 09/05/14 | $0.068 | $0.568 |
Class F | 09/08/14 | 09/05/14 | $0.075 | $0.568 |
The fund hereby designates as a capital gain dividend with respect to the taxable year ended July 31, 2014, $51,410,291, or, if subsequently determined to be different, the net capital gain of such year.
A total of 0.02% of the dividends distributed during the fiscal year was derived from interest on U.S. Government securities which is generally exempt from state income tax.
The fund will notify shareholders in January 2015 of amounts for use in preparing 2014 income tax returns.
Annual Report
Board Approval of Investment Advisory Contracts and Management Fees
Fidelity Series Real Estate Equity Fund
Each year, the Board of Trustees, including the Independent Trustees (together, the Board), votes on the renewal of the management contract with Fidelity Management & Research Company (FMR) and the sub-advisory agreements (together, the Advisory Contracts) for the fund. The Board, assisted by the advice of fund counsel and Independent Trustees' counsel, requests and considers a broad range of information relevant to the renewal of the Advisory Contracts throughout the year.
The Board meets regularly and, at each of its meetings, covers an extensive agenda of topics and materials and considers factors that are relevant to its annual consideration of the renewal of the fund's Advisory Contracts, including the services and support provided to the fund and its shareholders. The Board has established various standing committees (Committees), each composed of and chaired by Independent Trustees with varying backgrounds, to which the Board has assigned specific subject matter responsibilities in order to enhance effective decision-making by the Board. The Board, acting directly and through its Committees, requests and receives information concerning the annual consideration of the renewal of the fund's Advisory Contracts. The Board also meets as needed to consider matters specifically related to the Board's annual consideration of the renewal of the Advisory Contracts. Members of the Board may also meet with trustees of other Fidelity funds through ad hoc joint committees to discuss certain matters relevant to the Fidelity funds.
At its July 2014 meeting, the Board, including the Independent Trustees, unanimously determined to renew the fund's Advisory Contracts. In reaching its determination, the Board considered all factors it believed relevant, including (i) the nature, extent, and quality of the services to be provided to the fund and its shareholders (including the investment performance of the fund); (ii) the competitiveness of the fund's management fee and total expense ratio relative to peer funds; (iii) the total costs of the services to be provided by and the profits to be realized by Fidelity from its relationship with the fund; (iv) the extent to which economies of scale exist and would be realized as the fund grows; and (v) whether fee levels reflect these economies of scale, if any, for the benefit of fund shareholders. In connection with separate internal corporate reorganizations involving Fidelity Management & Research (U.K.) Inc. (FMR U.K.) and Fidelity Management & Research (Japan) Inc. (FMR Japan), the Board approved certain non-material amendments to the fund's sub-advisory agreements with FMR U.K. and FMR Japan to reflect that, after these reorganizations, FMR Investment Management (UK) Limited and Fidelity Management & Research (Japan) Limited will carry on the business of FMR U.K. and FMR Japan, respectively. The Board noted that no changes to the portfolio managers or to the foreign research or investment advisory services provided to the fund were expected in connection with either reorganization and that the same personnel and resources would continue to be available to the fund at the new entities.
Annual Report
Board Approval of Investment Advisory Contracts and
Management Fees - continued
In considering whether to renew the Advisory Contracts for the fund, the Board reached a determination, with the assistance of fund counsel and Independent Trustees' counsel and through the exercise of its business judgment, that the renewal of the Advisory Contracts was in the best interests of the fund and its shareholders and that the compensation payable under the Advisory Contracts was fair and reasonable. The Board's decision to renew the Advisory Contracts was not based on any single factor, but rather was based on a comprehensive consideration of all the information provided to the Board at its meetings throughout the year. The Board, in reaching its determination to renew the Advisory Contracts, was aware that shareholders of the fund have a broad range of investment choices available to them, including a wide choice among funds offered by Fidelity's competitors, and that the fund's shareholders, who have the opportunity to review and weigh the disclosure provided by the fund in its prospectus and other public disclosures, have chosen to invest in this fund, which is part of the Fidelity family of funds.
Nature, Extent, and Quality of Services Provided. The Board considered Fidelity's staffing as it relates to the fund, including the backgrounds of investment personnel of FMR and the sub-advisers (together, the Investment Advisers), and also considered the fund's investment objective, strategies, and related investment philosophy. The Independent Trustees also had discussions with senior management of Fidelity's investment operations and investment groups. The Board considered the structure of the portfolio manager compensation program and whether this structure provides appropriate incentives to act in the best interests of the fund. Additionally, the Board considered the portfolio managers' investments, if any, in the funds that they manage.
Resources Dedicated to Investment Management and Support Services. The Board and the Fund Oversight and Research Committees reviewed the general qualifications and capabilities of Fidelity's investment staff, including its size, education, experience, and resources, as well as Fidelity's approach to recruiting, training, managing, and compensating investment personnel. The Board noted that Fidelity has continued to increase the resources devoted to non-U.S. offices, including expansion of Fidelity's global investment organization. The Board also noted that Fidelity's analysts have extensive resources, tools and capabilities that allow them to conduct sophisticated quantitative and fundamental analysis, as well as credit analysis of issuers, counterparties and guarantors. Further, the Board believes that Fidelity's investment professionals have sufficient access to global information and data so as to provide competitive investment results over time, and that those professionals also have access to sophisticated tools that permit them to assess portfolio construction and risk and performance attribution characteristics continuously, as well as to transmit new information and research conclusions rapidly around the world. Additionally, in its deliberations, the Board considered Fidelity's trading and risk management capabilities and resources and global compliance infrastructure, which are an integral part of the investment management process.
Annual Report
Shareholder and Administrative Services. The Board considered (i) the nature, extent, quality, and cost of advisory, administrative, and shareholder services performed by the Investment Advisers and their affiliates under the Advisory Contracts and under separate agreements covering transfer agency, pricing and bookkeeping, and securities lending services for the fund; (ii) the nature and extent of the supervision of third party service providers, principally custodians and subcustodians; and (iii) the resources devoted to, and the record of compliance with, the fund's compliance policies and procedures. The Board also reviewed the allocation of fund brokerage, including allocations to brokers affiliated with the Investment Advisers, the use of brokerage commissions to pay fund expenses, and the use of "soft" commission dollars to pay for research services.
The Board noted that the growth of fund assets over time across the complex allows Fidelity to reinvest in the development of services designed to enhance the value or convenience of the Fidelity funds as investment vehicles. These services include 24-hour access to account information and market information through telephone representatives and over the Internet, investor education materials and asset allocation tools, and the expanded availability of Fidelity Investor Centers.
In 2014, the Board formed an ad hoc Committee on Transfer Agency Fees to review the variety of transfer agency fee structures throughout the industry and Fidelity's competitive positioning with respect to industry participants.
Investment in a Large Fund Family. The Board considered the benefits to shareholders of investing in a Fidelity fund, including the benefits of investing in a fund that is part of a large family of funds offering a variety of investment disciplines and providing a large variety of mutual fund investor services. The Board noted that Fidelity had taken, or had made recommendations that resulted in the Fidelity funds taking, a number of actions over the previous year that benefited particular funds, including (i) continuing to dedicate additional resources to investment research and to the support of the senior management team that oversees asset management; (ii) persisting in efforts to enhance Fidelity's global research capabilities; (iii) launching new funds and making other enhancements to meet client needs for income-oriented solutions; (iv) reducing fund expenses for certain index funds; (v) continuing to launch dedicated lower cost underlying funds to meet portfolio construction needs related to expanding underlying fund options for Fidelity funds of funds, specifically for the Freedom Fund product lines; (vi) rationalizing product lines and gaining increased efficiencies through fund mergers; (vii) launching sector-based exchange-traded funds and establishing a new Fidelity adviser to manage sector-based funds and products; (viii) continuing to develop and implement technology to improve security and increase efficiency; (ix) modifying the eligibility criteria for certain share classes to increase their marketability to a portion of the defined contribution plan market; (x) waiving redemption fees for certain qualified fund-of-fund and wrap programs and certain retirement plan transactions; and (xi) launching new Institutional Class shares of certain money market funds to attract and retain assets and to fill a gap in the money market fund lineup.
Annual Report
Board Approval of Investment Advisory Contracts and
Management Fees - continued
Investment Performance. The Board considered whether the fund has operated in accordance with its investment objective, as well as its record of compliance with its investment restrictions and its performance history.
The Board took into account discussions with the Investment Advisers about fund investment performance that occur at Board meetings throughout the year. In this regard the Board noted that as part of regularly scheduled fund reviews and other reports to the Board on fund performance, the Board periodically considers annualized return information for the fund, for different time periods, measured against a securities market index ("benchmark index") and a peer group of funds with similar objectives ("peer group"). In its evaluation of fund investment performance, the Board gave particular attention to information indicating changes in performance of certain Fidelity funds for specific time periods and the Investment Advisers' explanations for any overperformance or underperformance.
In addition to reviewing absolute and relative fund performance, the Independent Trustees periodically consider the appropriateness of fund performance metrics in evaluating the results achieved. In general, the Independent Trustees believe that fund performance should be evaluated based on net performance (after fees and expenses) of both the highest performing and lowest performing classes, where applicable, compared to appropriate benchmark indices, over appropriate time periods which may include full market cycles, and compared to peer groups, as applicable, over the same periods, taking into account relevant factors including the following: general market conditions; issuer-specific information; tactical opportunities for investment; and fund cash flows and other factors.
The Independent Trustees recognize that shareholders evaluate performance on a net basis over their own holding periods, for which one-, three-, and five-year periods are often used as a proxy. For this reason, the performance information reviewed by the Board also included net cumulative calendar year total return information for the fund and an appropriate benchmark index for the most recent one-year period, as shown below. A peer group comparison is not shown below.
Annual Report
Fidelity Series Real Estate Equity Fund
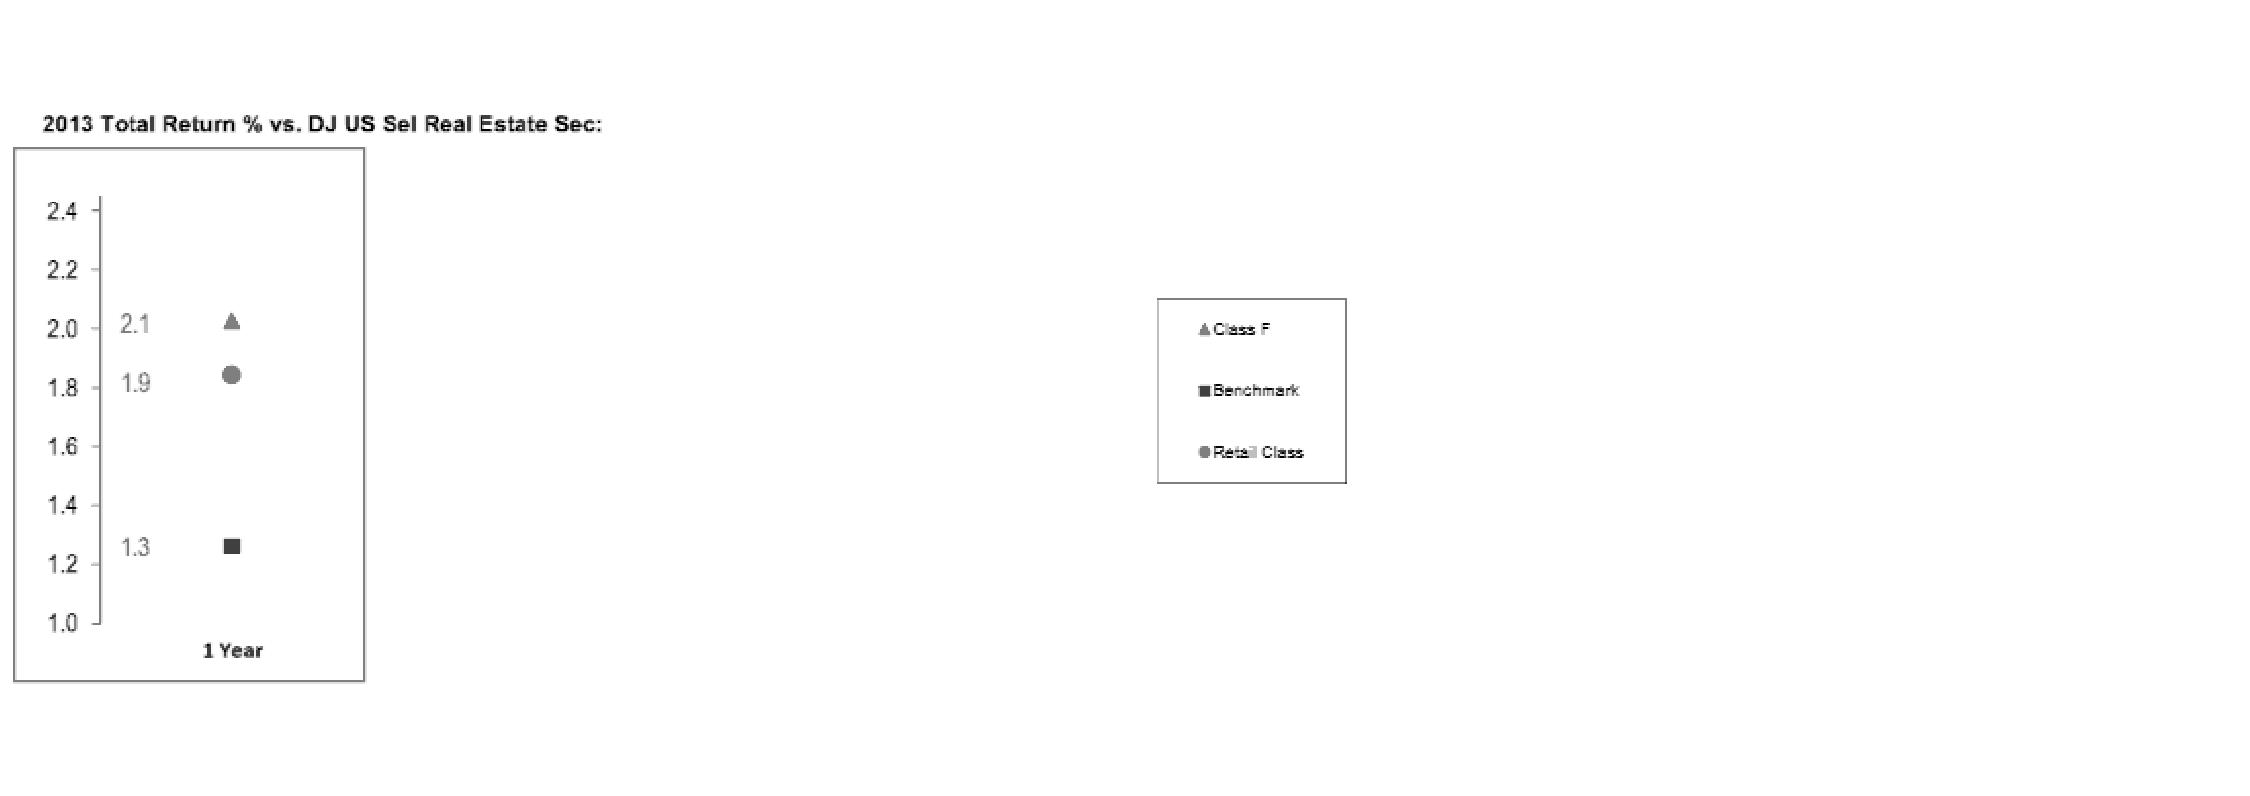
Based on its review, the Board concluded that the nature, extent, and quality of services provided to the fund under the Advisory Contracts should benefit the fund's shareholders.
Competitiveness of Management Fee and Total Expense Ratio. The Board considered the fund's management fee and total expense ratio compared to "mapped groups" of competitive funds and classes. Fidelity creates "mapped groups" by combining similar Lipper investment objective categories that have comparable investment mandates. Combining Lipper investment objective categories aids the Board's management fee and total expense ratio comparisons by broadening the competitive group used for comparison and by reducing the number of universes to which various Fidelity funds are compared.
Management Fee. The Board considered two proprietary management fee comparisons for the 12-month (or shorter) periods shown in the chart below. The group of Lipper funds used by the Board for management fee comparisons is referred to below as the "Total Mapped Group." The Total Mapped Group comparison focuses on a fund's standing in terms of gross management fees before expense reimbursements or caps relative to the total universe of funds with comparable investment mandates, regardless of whether their management fee structures also are comparable. Funds with comparable investment mandates offer exposure to similar types of securities. Funds with comparable management fee structures have similar management fee contractual arrangements (e.g., flat rate charged for advisory services, all-inclusive fee rate, etc.). "TMG %" represents the percentage of funds in the Total Mapped Group that had management fees that were lower than the fund's. For example, a hypothetical TMG % of 20% would mean that 80% of the funds in the Total Mapped Group had higher, and 20% had lower, management fees than the fund. The fund's actual TMG %s are in the chart below. The "Asset-Size Peer Group" (ASPG) comparison focuses on a fund's standing relative to a subset of non-Fidelity funds within the Total Mapped Group that are similar in size and management fee structure. For example, if a fund is in the first quartile of the ASPG, the fund's management fee ranks in the least expensive or lowest 25% of funds in the ASPG. The ASPG represents at least 15% of the funds in the Total Mapped Group with comparable asset size and management fee structures, subject to a minimum of 50 funds (or all funds in the Total Mapped Group if fewer than 50). Additional information, such as the ASPG quartile in which the fund's management fee rate ranked, is also included in the chart and considered by the Board.
Annual Report
Board Approval of Investment Advisory Contracts and
Management Fees - continued
Fidelity Series Real Estate Equity Fund
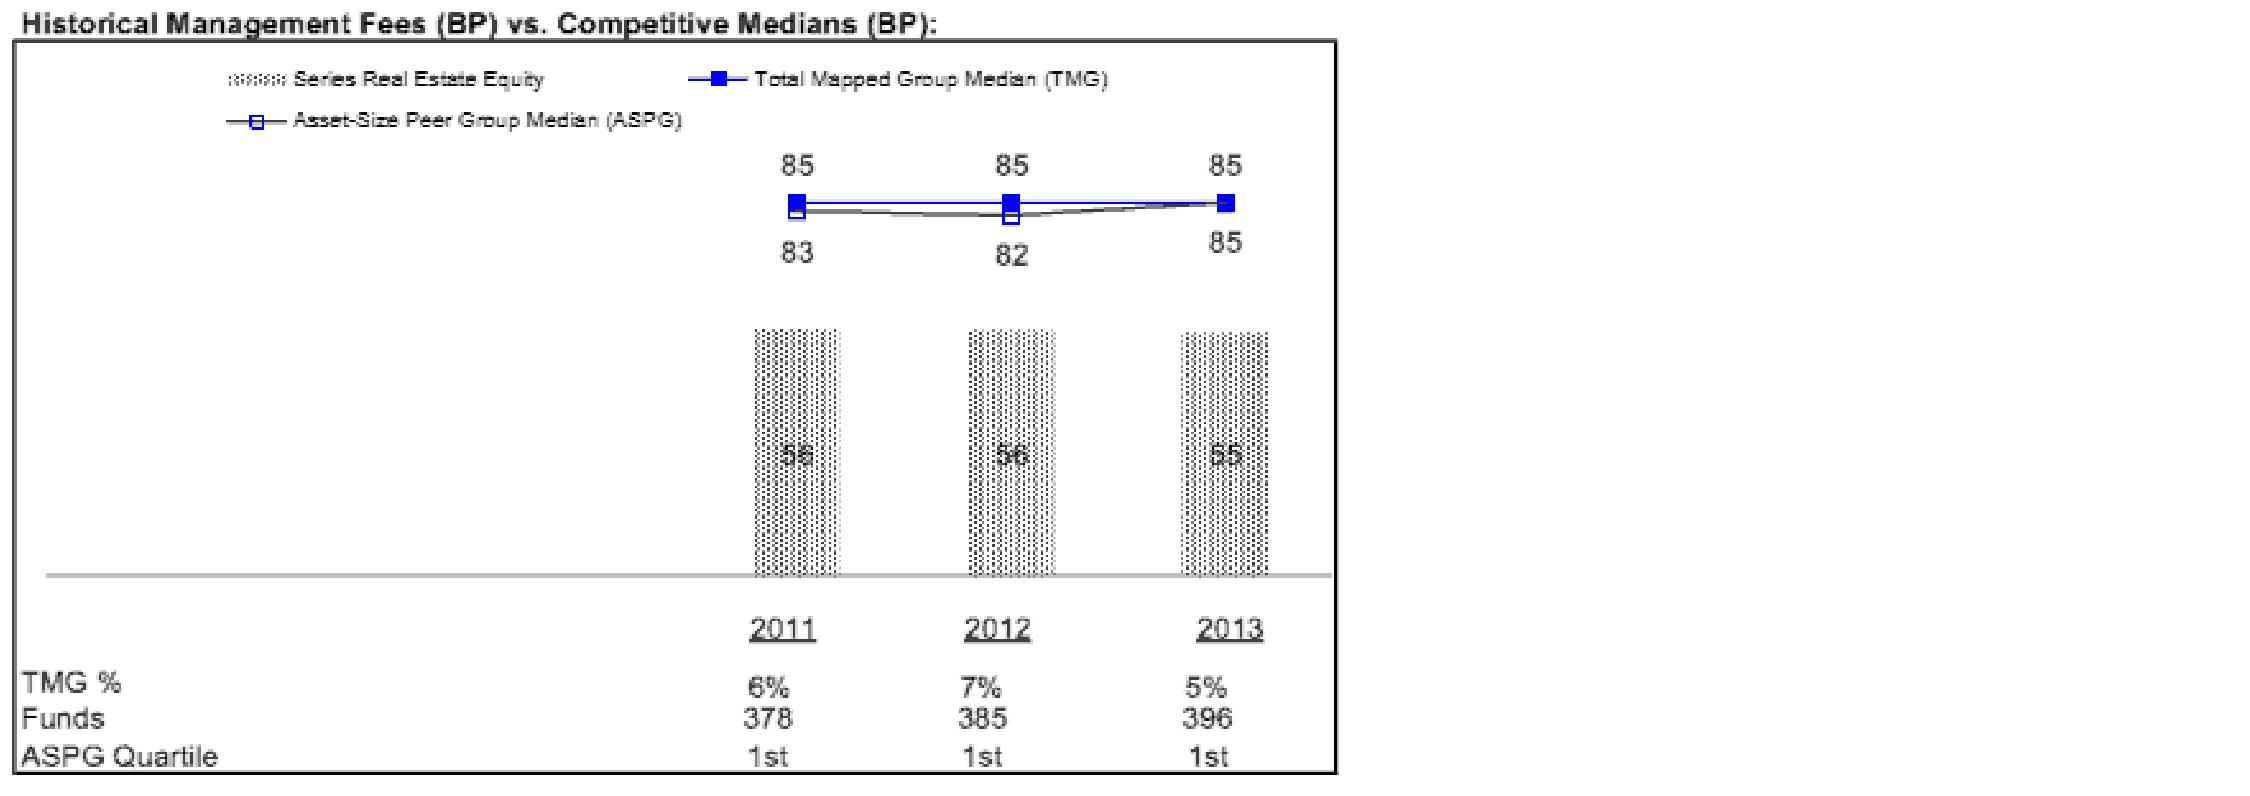
The Board noted that the fund's management fee rate ranked below the median of its Total Mapped Group and below the median of its ASPG for 2013.
The Board also noted that, in August 2013, the ad hoc Committee on Management Fees was formed to conduct an in-depth review of the management fee rates of Fidelity's active equity mutual funds. The Committee focused on the following areas: (i) standard fee structures; (ii) research consumption and trading evolution; (iii) management fee competitiveness/profitability by category; and (iv) factors that drive institutional pricing.
Based on its review, the Board concluded that the fund's management fee is fair and reasonable in light of the services that the fund receives and the other factors considered.
Annual Report
Total Expense Ratio. In its review of each class's total expense ratio, the Board considered the fund's management fee as well as other fund or class expenses, as applicable, such as transfer agent fees, pricing and bookkeeping fees, and custodial, legal, and audit fees. The Board also noted the effects of any waivers and reimbursements on fees and expenses. As part of its review, the Board also considered the current and historical total expense ratios of each class of the fund compared to competitive fund median expenses. Each class of the fund is compared to those funds and classes in the Total Mapped Group (used by the Board for management fee comparisons) that have a similar sales load structure.
The Board noted that the total expense ratio of each class ranked below its competitive median for 2013.
Fees Charged to Other Fidelity Clients. The Board also considered Fidelity fee structures and other information with respect to clients of Fidelity, such as other funds advised or subadvised by Fidelity, pension plan clients, and other institutional clients. The Board noted the findings of the 2013 ad hoc joint committee (created with the board of other Fidelity funds), which reviewed and compared Fidelity's institutional investment advisory business with its business of providing services to the Fidelity funds, including the differences in services provided, fees charged, and costs incurred, as well as competition in their respective marketplaces.
Based on its review of total expense ratios and fees charged to other Fidelity clients, the Board concluded that the total expense ratio of each class of the fund was reasonable in light of the services that the fund and its shareholders receive and the other factors considered.
Costs of the Services and Profitability. The Board considered the revenues earned and the expenses incurred by Fidelity in conducting the business of developing, marketing, distributing, managing, administering and servicing the fund and servicing the fund's shareholders. The Board also considered the level of Fidelity's profits in respect of all the Fidelity funds.
On an annual basis, Fidelity presents to the Board Fidelity's profitability for the fund. Fidelity calculates the profitability for each fund, as well as aggregate profitability for groups of Fidelity funds and all Fidelity funds, using a series of detailed revenue and cost allocation methodologies which originate with the books and records of Fidelity on which Fidelity's audited financial statements are based. The Audit Committee of the Board reviews any significant changes from the prior year's methodologies.
PricewaterhouseCoopers LLP (PwC), independent registered public accounting firm and auditor to Fidelity and certain Fidelity funds, has been engaged annually by the Board as part of the Board's assessment of Fidelity's profitability analysis. PwC's engagement includes the review and assessment of the methodologies used by Fidelity in determining the revenues and expenses attributable to Fidelity's mutual fund business, and completion of agreed-upon procedures in respect of the mathematical accuracy of fund profitability and its conformity to established allocation methodologies. After considering PwC's reports issued under the engagement and information provided by Fidelity, the Board concluded that while other allocation methods may also be reasonable, Fidelity's profitability methodologies are reasonable in all material respects.
Annual Report
Board Approval of Investment Advisory Contracts and
Management Fees - continued
The Board also reviewed Fidelity's non-fund businesses and fall-out benefits related to the mutual fund business as well as cases where Fidelity's affiliates may benefit from or be related to the fund's business.
The Board considered the costs of the services provided by and the profits realized by Fidelity in connection with the operation of the fund and was satisfied that the profitability was not excessive in the circumstances.
Economies of Scale. The Board considered whether there have been economies of scale in respect of the management of the Fidelity funds, whether the Fidelity funds (including the fund) have appropriately benefited from any such economies of scale, and whether there is potential for realization of any further economies of scale. The Board considered the extent to which the fund will benefit from economies of scale through increased services to the fund, through waivers or reimbursements, or through fee or expense ratio reductions. The Board also noted that in 2013, it and the boards of other Fidelity funds created an ad hoc committee (the Economies of Scale Committee) to analyze whether Fidelity attains economies of scale in respect of the management and servicing of the Fidelity funds, whether the Fidelity funds have appropriately benefited from such economies of scale, and whether there is potential for realization of any further economies of scale.
The Board recognized that the fund's management contract incorporates a "group fee" structure, which provides for lower group fee rates as total group assets increase, and for higher group fee rates as total group assets decrease (with "group assets" defined to include fund assets under FMR's management plus sector fund assets previously under FMR's management and currently managed by Fidelity SelectCo, LLC). FMR calculates the group fee rates based on a tiered asset "breakpoint" schedule that varies based on asset class. The Board considered that the group fee is designed to deliver the benefits of economies of scale to fund shareholders when total Fidelity fund assets increase, even if assets of any particular fund are unchanged or have declined, because some portion of Fidelity's costs are attributable to services provided to all Fidelity funds, and all funds benefit if those costs can be allocated among more assets. The Board also considered that although the fund is offered only to other Fidelity funds, it continues to incur investment management expenses. The Board further noted that the fund may continue to realize benefits from the group fee structure, even though assets may not be expected to grow significantly at the fund level. The Board concluded that, given the group fee structure, fund shareholders will benefit from lower management fees as group assets increase at the fund complex level, regardless of whether Fidelity achieves any such economies of scale.
Annual Report
The Board concluded, taking into account the analysis of the Economies of Scale Committee, that economies of scale, if any, are being appropriately shared between fund shareholders and Fidelity.
Additional Information Requested by the Board. In order to develop fully the factual basis for consideration of the Fidelity funds' Advisory Contracts, the Board requested and received additional information on certain topics, including: (i) fund performance trends and Fidelity's long-term strategies for certain funds; (ii) Fidelity's strategic marketing and product lineup goals; (iii) the methodology with respect to competitive fund data and peer group classifications; (iv) the arrangements with, and performance of, certain sub-advisers on behalf of the Fidelity funds, as well as certain proposed participating affiliate arrangements; (v) the realization of fall-out benefits in certain Fidelity business units; (vi) Fidelity's group fee structures, including the rationale for the individual fee rates of certain categories of funds and the definition of group assets; (vii) trends regarding industry use of performance fee structures and the performance adjustment methodologies applicable to the Fidelity funds; (viii) additional competitive analysis regarding the total expenses for certain classes; (ix) fund profitability methodology, including Fidelity's cost allocation methodology, and the impact of certain factors on fund profitability results; and (x) the process by which Fidelity determines sub-advisory fees for funds it advises.
Based on its evaluation of all of the conclusions noted above, and after considering all factors it believed relevant, the Board ultimately concluded that the advisory fee structures are fair and reasonable, and that the fund's Advisory Contracts should be renewed.
Annual Report
Investment Adviser
Fidelity Management & Research Company
Boston, MA
Investment Sub-Advisers
FMR Co., Inc.
Fidelity Management & Research (U.K.) Inc.
Fidelity Management & Research
(Hong Kong) Limited
Fidelity Management & Research
(Japan) Inc.
General Distributor
Fidelity Distributors Corporation
Smithfield, RI
Transfer and Service Agents
Fidelity Investments Institutional Operations Company, Inc.
Boston, MA
Fidelity Service Company, Inc.
Boston, MA
Custodian
State Street Bank and Trust Company
Quincy, MA
(Fidelity Investment logo)(registered trademark)
Corporate Headquarters
245 Summer St., Boston, MA 02210
www.fidelity.com
SLE-ANN-0914
1.930453.102
Fidelity®
Series Small Cap Opportunities
Fund
Fidelity Series Small Cap Opportunities Fund
Class F
Annual Report
July 31, 2014
(Fidelity Cover Art)
Contents
Performance | (Click Here) | How the fund has done over time. |
Management's Discussion of Fund Performance | (Click Here) | The Portfolio Managers' review of fund performance and strategy. |
Shareholder Expense Example | (Click Here) | An example of shareholder expenses. |
Investment Changes | (Click Here) | A summary of major shifts in the fund's investments over the past six months. |
Investments | (Click Here) | A complete list of the fund's investments with their market values. |
Financial Statements | (Click Here) | Statements of assets and liabilities, operations, and changes in net assets, as well as financial highlights. |
Notes | (Click Here) | Notes to the financial statements. |
Report of Independent Registered Public Accounting Firm | (Click Here) | |
Trustees and Officers | (Click Here) | |
Distributions | (Click Here) | |
Board Approval of Investment Advisory Contracts and Management Fees | (Click Here) | |
To view a fund's proxy voting guidelines and proxy voting record for the 12-month period ended June 30, visit http://www.fidelity.com/proxyvotingresults or visit the Securities and Exchange Commission's (SEC) web site at http://www.sec.gov. You may also call 1-800-544-8544 for Fidelity® Series Small Cap Opportunities Fund or 1-800-835-5092 for Class F of the fund to request a free copy of the proxy voting guidelines.
Standard & Poor's, S&P and S&P 500 are registered service marks of The McGraw-Hill Companies, Inc. and have been licensed for use by Fidelity Distributors Corporation.
Other third-party marks appearing herein are the property of their respective owners.
All other marks appearing herein are registered or unregistered trademarks or service marks of FMR LLC or an affiliated company. © 2014 FMR LLC. All rights reserved.
Annual Report
This report and the financial statements contained herein are submitted for the general information of the shareholders of the fund. This report is not authorized for distribution to prospective investors in the fund unless preceded or accompanied by an effective prospectus.
A fund files its complete schedule of portfolio holdings with the SEC for the first and third quarters of each fiscal year on Form N-Q. Forms N-Q are available on the SEC's web site at http://www.sec.gov. A fund's Forms N-Q may be reviewed and copied at the SEC's Public Reference Room in Washington, DC. Information regarding the operation of the SEC's Public Reference Room may be obtained by calling 1-800-SEC-0330. For a complete list of a fund's portfolio holdings, view the most recent holdings listing, semiannual report, or annual report on Fidelity's web site at http://www.fidelity.com, http://www.advisor.fidelity.com, or http://www.401k.com, as applicable.
NOT FDIC INSURED • MAY LOSE VALUE • NO BANK GUARANTEE
Neither the fund nor Fidelity Distributors Corporation is a bank.
Annual Report
Average annual total return reflects the change in the value of an investment, assuming reinvestment of the class' distributions from dividend income and capital gains (the profits earned upon the sale of securities that have grown in value, if any) and assuming a constant rate of performance each year. The $10,000 table and the fund's returns do not reflect the deduction of taxes that a shareholder would pay on fund distributions or the redemption of fund shares. During periods of reimbursement by Fidelity, a fund's total return will be greater than it would be had the reimbursement not occurred. How a fund did yesterday is no guarantee of how it will do tomorrow.
Average Annual Total Returns
Periods ended July 31, 2014 | Past 1
year | Past 5
years | Life of
fund A |
Fidelity ® Series Small Cap Opportunities Fund | 6.29% | 17.35% | 6.23% |
Class F B | 6.52% | 17.60% | 6.38% |
A From March 22, 2007.
B The initial offering of Class F shares took place on June 26, 2009. Returns prior to June 26, 2009, are those of Fidelity Series Small Cap Opportunities Fund, the original class of the fund.
$10,000 Over Life of Fund
Let's say hypothetically that $10,000 was invested in Fidelity Series Small Cap Opportunities Fund, a class of the fund, on March 22, 2007, when the fund started. The chart shows how the value of your investment would have changed, and also shows how the Russell 2000® Index performed over the same period.
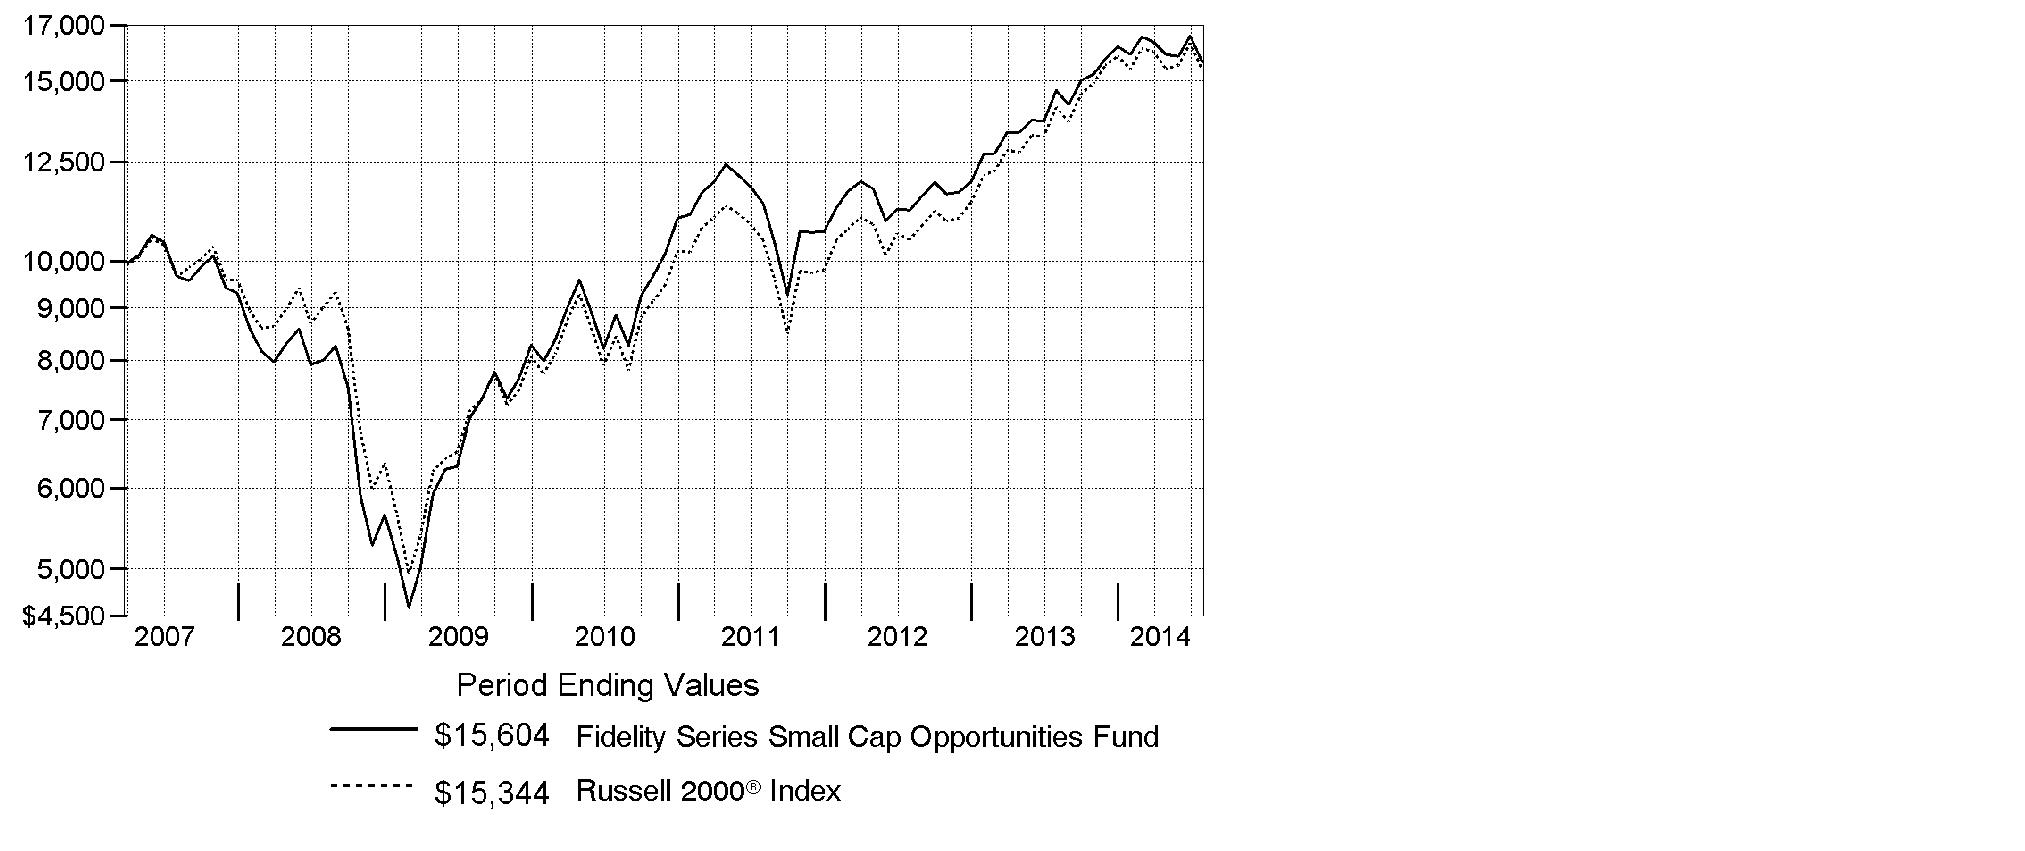
Annual Report
Market Recap: U.S. stocks overcame a slowing economy early in 2014 to post a strong gain for the 12-month period ending July 31, 2014, supported by corporate profits and continued low interest rates. The S&P 500® Index rose 16.94%, reaching an all-time high near period end. The technology-heavy Nasdaq Composite Index® gained 22.00%. The Russell 2000® Index returned 8.56%, reflecting the relatively lackluster performance of small-cap stocks. Information technology (+28%) was the top-performing sector within the S&P 500®, driven by strong semiconductor and computer hardware sales. Materials (+23%) gained amid higher prices for many commodity products. Health care (+21%) rose, driven by gains in pharmaceuticals, biotechnology & life sciences companies. Energy stocks (+19%) advanced in the latter part of the period amid healthy U.S. output and the threat of supply disruptions in Iraq. Conversely, most defensive sectors, including consumer staples, utilities and telecommunication services, lagged the broader market. Volatility remained tame throughout most of the period, with markets supported by declining unemployment, near-record profit margins for companies, muted cost inflation and fairly low corporate debt levels. Geopolitical tension remained a concern at period end, with conflict in Ukraine and strained relations between Russia and the West posing a potential threat to global growth.
Comments from Richard Thompson, Lead Portfolio Manager of Fidelity® Series Small Cap Opportunities Fund, and Rayna Lesser, one of the fund's Co-Portfolio Managers: For the year, the fund's Series Small Cap Opportunities and Class F shares gained 6.29% and 6.52%, respectively, lagging the 8.56% advance of the Russell 2000® Index. Despite the relative underperformance this period, we remain confident that the diversified nature of the fund's multi-manager approach and its emphasis on security selection with sector neutrality can support our goal of delivering consistent risk-adjusted returns over time. Versus the index, choices in the software & services and capital goods industries detracted the most, more than offsetting strong picks in pharmaceuticals, biotechnology & life science and banks. The fund's largest individual detractor was cloud-computing recurring revenue management provider ServiceSource International, while consumer discretionary's Francesca's Holdings, an operator of a chain of women's clothing boutiques, also didn't help. On the plus side, Intercept Pharmaceuticals easily was the fund's top individual contributor, largely due to a successful clinical trial outcome. Choices in financials also added value, including PacWest Bancorp, the fund's largest holding at period end. The bank holding company continued to generate above-average returns, while we also saw opportunities from a recent merger.
The views expressed above reflect those of the portfolio manager(s) only through the end of the period as stated on the cover of this report and do not necessarily represent the views of Fidelity or any other person in the Fidelity organization. Any such views are subject to change at any time based upon market or other conditions and Fidelity disclaims any responsibility to update such views. These views may not be relied on as investment advice and, because investment decisions for a Fidelity fund are based on numerous factors, may not be relied on as an indication of trading intent on behalf of any Fidelity fund.
Annual Report
Shareholder Expense Example
As a shareholder of the Fund, you incur two types of costs: (1) transaction costs, and (2) ongoing costs, including management fees and other Fund expenses. This Example is intended to help you understand your ongoing costs (in dollars) of investing in the Fund and to compare these costs with the ongoing costs of investing in other mutual funds.
The Example is based on an investment of $1,000 invested at the beginning of the period and held for the entire period (February 1, 2014 to July 31, 2014).
Actual Expenses
The first line of the accompanying table for each class of the Fund provides information about actual account values and actual expenses. You may use the information in this line, together with the amount you invested, to estimate the expenses that you paid over the period. Simply divide your account value by $1,000.00 (for example, an $8,600 account value divided by $1,000.00 = 8.6), then multiply the result by the number in the first line for a class of the Fund under the heading entitled "Expenses Paid During Period" to estimate the expenses you paid on your account during this period. In addition, the Fund, as a shareholder in the underlying Fidelity Central Funds, will indirectly bear its pro-rata share of the fees and expenses incurred by the underlying Fidelity Central Funds. These fees and expenses are not included in the Fund's annualized expense ratio used to calculate the expense estimate in the table below.
Hypothetical Example for Comparison Purposes
The second line of the accompanying table for each class of the Fund provides information about hypothetical account values and hypothetical expenses based on a Class' actual expense ratio and an assumed rate of return of 5% per year before expenses, which is not the Class' actual return. The hypothetical account values and expenses may not be used to estimate the actual ending account balance or expenses you paid for the period. You may use this information to compare the ongoing costs of investing in the Fund and other funds. To do so, compare this 5% hypothetical example with the 5% hypothetical examples that appear in the shareholder reports of the other funds. In addition, the Fund, as a shareholder in the underlying Fidelity Central Funds, will indirectly bear its pro-rata share of the fees and expenses incurred by the underlying Fidelity Central Funds. These fees and expenses are not included in the Fund's annualized expense ratio used to calculate the expense estimate in the table below.
Please note that the expenses shown in the table are meant to highlight your ongoing costs only and do not reflect any transaction costs. Therefore, the second line of the table is useful in comparing ongoing costs only, and will not help you determine the relative total costs of owning different funds.
Annual Report
| Annualized
Expense RatioB | Beginning
Account Value
February 1, 2014 | Ending
Account Value
July 31, 2014 | Expenses Paid
During Period*
February 1, 2014
to July 31, 2014 |
Series Small Cap Opportunities | .81% | | | |
Actual | | $ 1,000.00 | $ 981.80 | $ 3.98 |
HypotheticalA | | $ 1,000.00 | $ 1,020.78 | $ 4.06 |
Class F | .63% | | | |
Actual | | $ 1,000.00 | $ 982.70 | $ 3.10 |
HypotheticalA | | $ 1,000.00 | $ 1,021.67 | $ 3.16 |
A 5% return per year before expenses
B Annualized expense ratio reflects expenses net of applicable fee waivers.
* Expenses are equal to each Class' annualized expense ratio, multiplied by the average account value over the period, multiplied by 181/365 (to reflect the one-half year period).
Annual Report
Investment Changes (Unaudited)
Top Ten Stocks as of July 31, 2014 |
| % of fund's
net assets | % of fund's net assets
6 months ago |
PacWest Bancorp | 1.3 | 1.1 |
Targa Resources Corp. | 1.2 | 0.8 |
Newfield Exploration Co. | 1.1 | 0.4 |
Associated Banc-Corp. | 1.1 | 0.9 |
Huntington Bancshares, Inc. | 1.0 | 0.9 |
Banner Bank | 1.0 | 0.9 |
Stone Energy Corp. | 1.0 | 0.8 |
City National Corp. | 1.0 | 0.9 |
Global Payments, Inc. | 1.0 | 0.7 |
Allied World Assurance Co. Holdings Ltd. | 0.9 | 0.8 |
| 10.6 | |
Top Five Market Sectors as of July 31, 2014 |
| % of fund's
net assets | % of fund's net assets
6 months ago |
Financials | 22.5 | 20.3 |
Information Technology | 18.8 | 19.8 |
Industrials | 13.3 | 14.4 |
Health Care | 12.4 | 13.1 |
Consumer Discretionary | 12.4 | 11.5 |
Asset Allocation (% of fund's net assets) |
As of July 31, 2014 * | As of January 31, 2014 ** |
| Stocks and
Equity Futures 98.1% | | | Stocks and
Equity Futures 96.6% | |
| Short-Term
Investments and
Net Other Assets (Liabilities) 1.9% | | | Short-Term
Investments and
Net Other Assets (Liabilities) 3.4% | |
* Foreign investments | 8.0% | | ** Foreign investments | 7.4% | |

Annual Report
Investments July 31, 2014
Showing Percentage of Net Assets
Common Stocks - 97.5% |
| Shares | | Value |
CONSUMER DISCRETIONARY - 12.4% |
Auto Components - 1.0% |
Motorcar Parts of America, Inc. (a) | 580,235 | | $ 12,916,031 |
Tenneco, Inc. (a) | 610,386 | | 38,881,588 |
| | 51,797,619 |
Diversified Consumer Services - 1.2% |
Bright Horizons Family Solutions, Inc. (a) | 683,923 | | 28,430,679 |
Service Corp. International | 1,620,200 | | 34,024,200 |
| | 62,454,879 |
Hotels, Restaurants & Leisure - 1.2% |
Bloomin' Brands, Inc. (a) | 1,420,616 | | 27,829,867 |
Chuy's Holdings, Inc. (a) | 149,729 | | 4,289,736 |
Life Time Fitness, Inc. (a)(d) | 709,920 | | 27,935,352 |
| | 60,054,955 |
Household Durables - 0.5% |
KB Home (d) | 1,652,192 | | 26,930,730 |
Internet & Catalog Retail - 0.5% |
HomeAway, Inc. (a) | 741,000 | | 25,727,520 |
Media - 1.3% |
MDC Partners, Inc. Class A (sub. vtg.) | 1,385,250 | | 29,080,912 |
Nexstar Broadcasting Group, Inc. Class A (d) | 731,417 | | 34,076,718 |
| | 63,157,630 |
Multiline Retail - 0.8% |
Dillard's, Inc. Class A | 287,744 | | 34,304,840 |
Mothercare PLC (a) | 820,500 | | 3,328,064 |
| | 37,632,904 |
Specialty Retail - 3.2% |
Ascena Retail Group, Inc. (a) | 1,220,467 | | 19,600,700 |
Conn's, Inc. (a)(d) | 683,488 | | 27,339,520 |
Francesca's Holdings Corp. (a)(d) | 1,383,313 | | 17,678,740 |
GameStop Corp. Class A | 794,326 | | 33,337,862 |
Genesco, Inc. (a) | 359,125 | | 27,390,464 |
GNC Holdings, Inc. | 561,500 | | 18,422,815 |
Rent-A-Center, Inc. | 624,319 | | 14,946,197 |
| | 158,716,298 |
Textiles, Apparel & Luxury Goods - 2.7% |
Fossil Group, Inc. (a) | 341,100 | | 33,427,800 |
Iconix Brand Group, Inc. (a) | 930,700 | | 39,303,461 |
Common Stocks - continued |
| Shares | | Value |
CONSUMER DISCRETIONARY - continued |
Textiles, Apparel & Luxury Goods - continued |
Kate Spade & Co. (a) | 781,467 | | $ 29,562,897 |
Steven Madden Ltd. (a) | 1,034,939 | | 32,962,807 |
| | 135,256,965 |
TOTAL CONSUMER DISCRETIONARY | | 621,729,500 |
CONSUMER STAPLES - 3.0% |
Beverages - 0.3% |
Cott Corp. | 1,917,365 | | 13,083,134 |
Food & Staples Retailing - 1.0% |
Andersons, Inc. | 349,600 | | 18,885,392 |
Sprouts Farmers Market LLC | 211,600 | | 6,455,916 |
United Natural Foods, Inc. (a) | 434,110 | | 25,447,528 |
| | 50,788,836 |
Food Products - 1.4% |
Darling International, Inc. (a) | 1,282,310 | | 24,004,843 |
Fresh Del Monte Produce, Inc. | 440,465 | | 13,187,522 |
Greencore Group PLC | 2,647,152 | | 11,812,061 |
J&J Snack Foods Corp. | 224,250 | | 20,202,683 |
| | 69,207,109 |
Personal Products - 0.3% |
Inter Parfums, Inc. | 617,900 | | 16,145,727 |
TOTAL CONSUMER STAPLES | | 149,224,806 |
ENERGY - 6.5% |
Energy Equipment & Services - 0.9% |
Atwood Oceanics, Inc. (a) | 431,326 | | 20,768,347 |
Total Energy Services, Inc. | 1,223,650 | | 24,409,032 |
| | 45,177,379 |
Oil, Gas & Consumable Fuels - 5.6% |
Cloud Peak Energy, Inc. (a) | 1,559,830 | | 24,146,168 |
Energen Corp. | 127,468 | | 10,405,213 |
Genesis Energy LP | 249,696 | | 13,106,543 |
Newfield Exploration Co. (a) | 1,398,810 | | 56,372,043 |
Rosetta Resources, Inc. (a) | 879,052 | | 44,893,186 |
Stone Energy Corp. (a) | 1,271,415 | | 48,377,341 |
Common Stocks - continued |
| Shares | | Value |
ENERGY - continued |
Oil, Gas & Consumable Fuels - continued |
Targa Resources Corp. | 468,890 | | $ 59,783,475 |
Western Refining, Inc. | 659,312 | | 27,005,420 |
| | 284,089,389 |
TOTAL ENERGY | | 329,266,768 |
FINANCIALS - 22.5% |
Banks - 9.2% |
Associated Banc-Corp. | 3,069,228 | | 55,000,566 |
BancFirst Corp. | 411,520 | | 25,061,568 |
Bank of the Ozarks, Inc. | 1,459,974 | | 44,923,400 |
Banner Bank (e) | 1,280,871 | | 51,542,249 |
BBCN Bancorp, Inc. | 2,551,110 | | 38,317,672 |
Cathay General Bancorp | 1,050,524 | | 26,882,909 |
City National Corp. | 641,578 | | 48,278,745 |
Huntington Bancshares, Inc. | 5,330,000 | | 52,340,600 |
Investors Bancorp, Inc. | 3,349,200 | | 34,664,220 |
National Penn Bancshares, Inc. | 1,853,144 | | 19,087,383 |
PacWest Bancorp | 1,558,588 | | 64,946,357 |
| | 461,045,669 |
Capital Markets - 2.1% |
Affiliated Managers Group, Inc. (a) | 113,300 | | 22,575,025 |
AURELIUS AG | 848,707 | | 30,002,573 |
LPL Financial | 472,400 | | 22,429,552 |
Waddell & Reed Financial, Inc. Class A | 586,041 | | 30,937,104 |
| | 105,944,254 |
Insurance - 3.3% |
Allied World Assurance Co. Holdings Ltd. | 1,271,613 | | 45,790,784 |
Amerisafe, Inc. | 883,992 | | 32,354,107 |
Aspen Insurance Holdings Ltd. | 760,690 | | 30,435,207 |
Primerica, Inc. | 694,075 | | 31,982,976 |
StanCorp Financial Group, Inc. | 459,877 | | 27,748,978 |
| | 168,312,052 |
Real Estate Investment Trusts - 6.9% |
Cousins Properties, Inc. | 3,401,420 | | 42,109,580 |
First Industrial Realty Trust, Inc. | 2,173,792 | | 39,236,946 |
Home Properties, Inc. | 655,090 | | 43,098,371 |
Kite Realty Group Trust | 5,709,595 | | 34,828,530 |
Mid-America Apartment Communities, Inc. | 553,600 | | 38,707,712 |
Common Stocks - continued |
| Shares | | Value |
FINANCIALS - continued |
Real Estate Investment Trusts - continued |
National Retail Properties, Inc. (d) | 1,149,541 | | $ 40,889,173 |
Parkway Properties, Inc. | 1,864,746 | | 38,656,185 |
Ramco-Gershenson Properties Trust (SBI) | 2,678,650 | | 44,465,590 |
Stag Industrial, Inc. | 1,003,900 | | 22,929,076 |
| | 344,921,163 |
Thrifts & Mortgage Finance - 1.0% |
Washington Federal, Inc. | 926,360 | | 19,416,506 |
WSFS Financial Corp. | 440,840 | | 31,559,736 |
| | 50,976,242 |
TOTAL FINANCIALS | | 1,131,199,380 |
HEALTH CARE - 12.4% |
Biotechnology - 6.9% |
ACADIA Pharmaceuticals, Inc. (a)(d) | 671,791 | | 13,617,204 |
Agios Pharmaceuticals, Inc. (d) | 188,463 | | 7,595,059 |
Auspex Pharmaceuticals, Inc. | 463,926 | | 8,448,092 |
BioCryst Pharmaceuticals, Inc. (a) | 1,289,050 | | 16,138,906 |
BioMarin Pharmaceutical, Inc. (a) | 247,244 | | 15,284,624 |
Bluebird Bio, Inc. (a)(d) | 165,212 | | 5,518,081 |
Celldex Therapeutics, Inc. (a) | 779,849 | | 10,208,223 |
Chimerix, Inc. (a) | 697,818 | | 15,854,425 |
Cubist Pharmaceuticals, Inc. | 188,017 | | 11,450,235 |
Dicerna Pharmaceuticals, Inc. (d) | 197,835 | | 2,971,482 |
Discovery Laboratories, Inc. (a)(d) | 3,332,539 | | 5,232,086 |
Dyax Corp. (a) | 1,907,615 | | 17,969,733 |
Genocea Biosciences, Inc. | 256,091 | | 4,458,544 |
Hyperion Therapeutics, Inc. (a)(d) | 348,947 | | 7,945,523 |
Insmed, Inc. (a) | 875,535 | | 14,962,893 |
Intercept Pharmaceuticals, Inc. (a) | 110,198 | | 25,605,607 |
InterMune, Inc. (a) | 850,543 | | 37,313,321 |
Isis Pharmaceuticals, Inc. (a) | 604,972 | | 18,748,082 |
Medivation, Inc. (a) | 198,914 | | 14,765,386 |
Mirati Therapeutics, Inc. (a) | 658,269 | | 11,960,748 |
Neurocrine Biosciences, Inc. (a) | 1,115,382 | | 15,146,888 |
Novavax, Inc. (a) | 3,775,362 | | 16,347,317 |
Puma Biotechnology, Inc. (a) | 106,100 | | 23,524,492 |
Common Stocks - continued |
| Shares | | Value |
HEALTH CARE - continued |
Biotechnology - continued |
Synageva BioPharma Corp. (a) | 214,297 | | $ 14,660,058 |
XOMA Corp. (a) | 2,524,322 | | 9,794,369 |
| | 345,521,378 |
Health Care Equipment & Supplies - 1.4% |
Cerus Corp. (a)(d) | 2,070,940 | | 7,289,709 |
DexCom, Inc. (a) | 412,716 | | 15,551,139 |
Sirona Dental Systems, Inc. (a) | 169,600 | | 13,601,920 |
Steris Corp. | 650,497 | | 33,097,287 |
| | 69,540,055 |
Health Care Providers & Services - 2.0% |
Community Health Systems, Inc. (a) | 396,600 | | 18,917,820 |
MEDNAX, Inc. (a) | 174,890 | | 10,349,990 |
Omnicare, Inc. | 232,000 | | 14,500,000 |
PharMerica Corp. (a) | 484,216 | | 13,068,990 |
Surgical Care Affiliates, Inc. | 728,636 | | 21,407,326 |
Team Health Holdings, Inc. (a) | 385,500 | | 21,800,025 |
| | 100,044,151 |
Health Care Technology - 0.3% |
MedAssets, Inc. (a) | 695,900 | | 14,780,916 |
Life Sciences Tools & Services - 1.2% |
Bruker BioSciences Corp. (a) | 1,051,366 | | 23,897,549 |
Fluidigm Corp. (a) | 429,627 | | 12,300,221 |
PAREXEL International Corp. (a) | 316,200 | | 16,935,672 |
Techne Corp. | 82,249 | | 7,675,477 |
| | 60,808,919 |
Pharmaceuticals - 0.6% |
Prestige Brands Holdings, Inc. (a) | 581,354 | | 17,905,703 |
Theravance, Inc. (a)(d) | 655,549 | | 14,225,413 |
| | 32,131,116 |
TOTAL HEALTH CARE | | 622,826,535 |
INDUSTRIALS - 13.3% |
Aerospace & Defense - 1.2% |
AAR Corp. | 773,757 | | 20,814,063 |
Teledyne Technologies, Inc. (a) | 451,734 | | 41,198,141 |
| | 62,012,204 |
Air Freight & Logistics - 0.9% |
Hub Group, Inc. Class A (a) | 937,063 | | 43,273,569 |
Common Stocks - continued |
| Shares | | Value |
INDUSTRIALS - continued |
Building Products - 0.3% |
Ply Gem Holdings, Inc. (a)(d) | 1,551,602 | | $ 12,924,845 |
Commercial Services & Supplies - 0.6% |
Civeo Corp. | 1,230,500 | | 31,254,700 |
Construction & Engineering - 1.6% |
Chicago Bridge & Iron Co. NV | 349,349 | | 20,723,383 |
EMCOR Group, Inc. | 773,400 | | 31,655,262 |
MasTec, Inc. (a) | 925,322 | | 25,159,505 |
| | 77,538,150 |
Electrical Equipment - 0.4% |
General Cable Corp. | 963,927 | | 21,428,097 |
Industrial Conglomerates - 0.6% |
Carlisle Companies, Inc. | 382,800 | | 30,631,656 |
Machinery - 2.7% |
Allison Transmission Holdings, Inc. | 1,038,771 | | 30,415,215 |
Navistar International Corp. (a)(d) | 830,853 | | 29,221,100 |
TriMas Corp. (a) | 816,344 | | 25,861,778 |
Valmont Industries, Inc. | 175,100 | | 25,499,813 |
Wabtec Corp. | 320,750 | | 25,878,110 |
| | 136,876,016 |
Marine - 0.3% |
DryShips, Inc. (d) | 5,533,403 | | 15,825,533 |
Professional Services - 1.8% |
Dun & Bradstreet Corp. | 245,006 | | 26,958,010 |
Huron Consulting Group, Inc. (a) | 359,931 | | 21,754,230 |
Stantec, Inc. | 624,800 | | 39,642,009 |
| | 88,354,249 |
Trading Companies & Distributors - 2.9% |
Applied Industrial Technologies, Inc. | 661,823 | | 32,071,943 |
DXP Enterprises, Inc. (a) | 544,929 | | 38,706,307 |
Kaman Corp. | 621,880 | | 24,881,419 |
Now, Inc. | 906,300 | | 29,173,797 |
Titan Machinery, Inc. (a)(d)(e) | 1,560,789 | | 22,881,167 |
| | 147,714,633 |
TOTAL INDUSTRIALS | | 667,833,652 |
INFORMATION TECHNOLOGY - 18.8% |
Communications Equipment - 2.0% |
Aruba Networks, Inc. (a) | 1,726,326 | | 30,832,182 |
Common Stocks - continued |
| Shares | | Value |
INFORMATION TECHNOLOGY - continued |
Communications Equipment - continued |
Ixia (a) | 2,735,869 | | $ 29,273,798 |
Radware Ltd. (a) | 1,652,966 | | 27,092,113 |
Riverbed Technology, Inc. (a) | 759,657 | | 13,597,860 |
| | 100,795,953 |
Electronic Equipment & Components - 0.8% |
InvenSense, Inc. (a)(d) | 735,300 | | 16,919,253 |
Neonode, Inc. (a)(d)(e) | 3,508,590 | | 9,543,365 |
TTM Technologies, Inc. (a) | 1,928,493 | | 14,482,982 |
| | 40,945,600 |
Internet Software & Services - 2.9% |
Bankrate, Inc. (a) | 1,617,001 | | 27,262,637 |
EarthLink Holdings Corp. | 1,469,795 | | 5,790,992 |
Move, Inc. (a) | 1,462,587 | | 21,353,770 |
NIC, Inc. | 1,063,302 | | 17,937,905 |
Points International Ltd. (a)(e) | 1,345,014 | | 25,447,665 |
Rackspace Hosting, Inc. (a) | 417,417 | | 12,643,561 |
Stamps.com, Inc. (a) | 440,004 | | 13,917,327 |
Web.com Group, Inc. (a) | 911,641 | | 24,204,069 |
| | 148,557,926 |
IT Services - 4.1% |
Datalink Corp. (a)(e) | 1,138,340 | | 12,863,242 |
ExlService Holdings, Inc. (a) | 1,141,762 | | 32,026,424 |
Global Payments, Inc. | 686,500 | | 47,553,855 |
Interxion Holding N.V. (a) | 995,853 | | 27,087,202 |
Maximus, Inc. | 877,300 | | 36,285,128 |
Sapient Corp. (a) | 2,184,147 | | 32,238,010 |
ServiceSource International, Inc. (a)(d)(e) | 4,434,876 | | 19,646,501 |
| | 207,700,362 |
Semiconductors & Semiconductor Equipment - 2.8% |
Ambarella, Inc. (a)(d) | 364,200 | | 10,419,762 |
Atmel Corp. (a) | 502,000 | | 4,116,400 |
Intersil Corp. Class A | 693,900 | | 8,902,737 |
Lattice Semiconductor Corp. (a) | 1,496,700 | | 10,237,428 |
M/A-COM Technology Solutions, Inc. (a) | 241,400 | | 4,803,860 |
Monolithic Power Systems, Inc. | 699,770 | | 28,858,515 |
PDF Solutions, Inc. (a) | 299,000 | | 5,728,840 |
Peregrine Semiconductor Corp. (a) | 328,252 | | 2,212,418 |
PMC-Sierra, Inc. (a) | 1,253,800 | | 8,438,074 |
RF Micro Devices, Inc. (a) | 1,342,200 | | 14,978,952 |
Common Stocks - continued |
| Shares | | Value |
INFORMATION TECHNOLOGY - continued |
Semiconductors & Semiconductor Equipment - continued |
Semtech Corp. (a) | 973,000 | | $ 21,727,090 |
Silicon Laboratories, Inc. (a) | 276,100 | | 11,245,553 |
Ultratech, Inc. (a) | 300,800 | | 7,122,944 |
| | 138,792,573 |
Software - 4.6% |
BroadSoft, Inc. (a) | 901,309 | | 21,991,940 |
CommVault Systems, Inc. (a) | 497,689 | | 23,899,026 |
Infoblox, Inc. (a) | 643,700 | | 7,801,644 |
Interactive Intelligence Group, Inc. (a) | 371,300 | | 16,845,881 |
Nuance Communications, Inc. (a) | 1,348,503 | | 24,515,785 |
Parametric Technology Corp. (a) | 716,526 | | 25,766,275 |
Pegasystems, Inc. | 406,400 | | 8,684,768 |
Rovi Corp. (a) | 729,359 | | 17,045,120 |
SS&C Technologies Holdings, Inc. (a) | 664,009 | | 28,758,230 |
Synchronoss Technologies, Inc. (a) | 905,814 | | 36,603,944 |
Tangoe, Inc. (a) | 1,405,800 | | 19,400,040 |
| | 231,312,653 |
Technology Hardware, Storage & Peripherals - 1.6% |
Electronics for Imaging, Inc. (a) | 618,425 | | 27,253,990 |
Quantum Corp. (a)(d) | 11,950,411 | | 14,938,014 |
Silicon Graphics International Corp. (a)(e) | 2,179,809 | | 20,729,984 |
Super Micro Computer, Inc. (a) | 641,479 | | 16,787,505 |
| | 79,709,493 |
TOTAL INFORMATION TECHNOLOGY | | 947,814,560 |
MATERIALS - 5.4% |
Chemicals - 4.1% |
Axiall Corp. | 803,646 | | 34,420,158 |
Cabot Corp. | 448,314 | | 23,487,170 |
Flotek Industries, Inc. (a) | 973,345 | | 28,081,003 |
Kronos Worldwide, Inc. | 1,681,324 | | 25,068,541 |
PolyOne Corp. | 965,401 | | 36,636,968 |
Rayonier Advanced Materials, Inc. | 661,589 | | 21,475,179 |
Tronox Ltd. Class A | 1,419,693 | | 37,678,652 |
| | 206,847,671 |
Containers & Packaging - 0.5% |
Berry Plastics Group, Inc. (a) | 940,360 | | 22,841,344 |
Common Stocks - continued |
| Shares | | Value |
MATERIALS - continued |
Metals & Mining - 0.8% |
Royal Gold, Inc. | 178,939 | | $ 13,522,420 |
Worthington Industries, Inc. | 689,846 | | 26,386,610 |
| | 39,909,030 |
TOTAL MATERIALS | | 269,598,045 |
TELECOMMUNICATION SERVICES - 0.4% |
Diversified Telecommunication Services - 0.4% |
8x8, Inc. (a) | 450,554 | | 3,640,476 |
Cogent Communications Group, Inc. | 232,600 | | 8,073,546 |
Towerstream Corp. (a)(d)(e) | 5,386,878 | | 8,888,349 |
| | 20,602,371 |
UTILITIES - 2.8% |
Electric Utilities - 1.7% |
Cleco Corp. | 353,050 | | 19,679,007 |
El Paso Electric Co. | 496,280 | | 18,287,918 |
Great Plains Energy, Inc. | 670,280 | | 16,616,241 |
PNM Resources, Inc. | 273,453 | | 7,014,069 |
Portland General Electric Co. | 740,332 | | 23,638,801 |
| | 85,236,036 |
Gas Utilities - 0.8% |
Atmos Energy Corp. | 445,786 | | 21,540,380 |
Laclede Group, Inc. | 415,900 | | 19,538,982 |
| | 41,079,362 |
Independent Power Producers & Energy Traders - 0.3% |
Dynegy, Inc. (a) | 513,100 | | 13,622,805 |
TOTAL UTILITIES | | 139,938,203 |
TOTAL COMMON STOCKS (Cost $4,437,270,386) |
4,900,033,820
|
U.S. Treasury Obligations - 0.1% |
| Principal Amount | | |
U.S. Treasury Bills, yield at date of purchase 0.01% to 0.03% 8/21/14 to 9/25/14 (f)
(Cost $3,369,941) | | $ 3,370,000 | |
3,369,957
|
Money Market Funds - 6.2% |
| Shares | | Value |
Fidelity Cash Central Fund, 0.11% (b) | 137,805,488 | | $ 137,805,488 |
Fidelity Securities Lending Cash Central Fund, 0.11% (b)(c) | 174,422,807 | | 174,422,807 |
TOTAL MONEY MARKET FUNDS (Cost $312,228,295) |
312,228,295
|
TOTAL INVESTMENT PORTFOLIO - 103.8% (Cost $4,752,868,622) | | 5,215,632,072 |
NET OTHER ASSETS (LIABILITIES) - (3.8)% | | (189,447,654) |
NET ASSETS - 100% | $ 5,026,184,418 |
Futures Contracts |
| Expiration Date | | Underlying
Face Amount
at Value | | Unrealized
Appreciation/
(Depreciation) |
Purchased |
Equity Index Contracts |
288 ICE Russell 2000 Index Contracts | Sept. 2014 | | $ 32,160,960 | | $ (939,387) |
|
The face value of futures purchased as a percentage of net assets is 0.6% |
Legend |
(a) Non-income producing |
(b) Affiliated fund that is generally available only to investment companies and other accounts managed by Fidelity Investments. The rate quoted is the annualized seven-day yield of the fund at period end. A complete unaudited listing of the fund's holdings as of its most recent quarter end is available upon request. In addition, each Fidelity Central Fund's financial statements, which are not covered by the Fund's Report of Independent Registered Public Accounting Firm, are available on the SEC's website or upon request. |
(c) Investment made with cash collateral received from securities on loan. |
(d) Security or a portion of the security is on loan at period end. |
(e) Affiliated company |
(f) Security or a portion of the security was pledged to cover margin requirements for futures contracts. At period end, the value of securities pledged amounted to $1,550,977. |
Affiliated Central Funds |
Information regarding fiscal year to date income earned by the Fund from investments in Fidelity Central Funds is as follows: |
Fund | Income earned |
Fidelity Cash Central Fund | $ 191,685 |
Fidelity Securities Lending Cash Central Fund | 2,192,240 |
Total | $ 2,383,925 |
Other Affiliated Issuers |
An affiliated company is a company in which the Fund has ownership of at least 5% of the voting securities. Fiscal year to date transactions with companies which are or were affiliates are as follows: |
Affiliate | Value,
beginning of
period | Purchases | Sales
Proceeds | Dividend Income | Value,
end of
period |
Banner Bank | $ 30,229,248 | $ 19,307,674 | $ - | $ 775,531 | $ 51,542,249 |
Cerus Corp. | 14,358,624 | 10,632,532* | 10,407,325 | - | - |
Datalink Corp. | - | 13,232,549 | - | - | 12,863,242 |
MEI Pharma, Inc. | 5,880,907 | 4,624,829 | 9,252,514 | - | - |
Neonode, Inc. | 6,714,902 | 13,478,038* | - | - | 9,543,365 |
Points International Ltd. | 7,568,049 | 25,633,317 | 3,522,252 | - | 25,447,665 |
ServiceSource International, Inc. | 11,255,057 | 31,464,148* | 1,129,544 | - | 19,646,501 |
Silicon Graphics International Corp. | - | 30,725,193 | - | - | 20,729,984 |
Titan Machinery, Inc. | - | 27,738,024 | 140,580 | - | 22,881,167 |
Towerstream Corp. | 14,782,688 | 837,719 | - | - | 8,888,349 |
Total | $ 90,789,475 | $ 177,674,023 | $ 24,452,215 | $ 775,531 | $ 171,542,522 |
* Includes the value of securities received through in-kind transactions.
See accompanying notes which are an integral part of the financial statements.
Annual Report
Investments - continued
Other Information |
The following is a summary of the inputs used, as of July 31, 2014, involving the Fund's assets and liabilities carried at fair value. The inputs or methodology used for valuing securities may not be an indication of the risk associated with investing in those securities. For more information on valuation inputs, and their aggregation into the levels used in the table below, please refer to the Investment Valuation section in the accompanying Notes to Financial Statements. |
Valuation Inputs at Reporting Date: |
Description | Total | Level 1 | Level 2 | Level 3 |
Investments in Securities: | | | | |
Equities: | | | | |
Consumer Discretionary | $ 621,729,500 | $ 621,729,500 | $ - | $ - |
Consumer Staples | 149,224,806 | 149,224,806 | - | - |
Energy | 329,266,768 | 329,266,768 | - | - |
Financials | 1,131,199,380 | 1,131,199,380 | - | - |
Health Care | 622,826,535 | 622,826,535 | - | - |
Industrials | 667,833,652 | 667,833,652 | - | - |
Information Technology | 947,814,560 | 947,814,560 | - | - |
Materials | 269,598,045 | 269,598,045 | - | - |
Telecommunication Services | 20,602,371 | 20,602,371 | - | - |
Utilities | 139,938,203 | 139,938,203 | - | - |
U.S. Government and Government Agency Obligations | 3,369,957 | - | 3,369,957 | - |
Money Market Funds | 312,228,295 | 312,228,295 | - | - |
Total Investments in Securities: | $ 5,215,632,072 | $ 5,212,262,115 | $ 3,369,957 | $ - |
Derivative Instruments: | | | | |
Liabilities | | | | |
Futures Contracts | $ (939,387) | $ (939,387) | $ - | $ - |
Value of Derivative Instruments |
The following table is a summary of the Fund's value of derivative instruments by primary risk exposure as of July 31, 2014. For additional information on derivative instruments, please refer to the Derivative Instruments section in the accompanying Notes to Financial Statements. |
Primary Risk Exposure /
Derivative Type | Value |
| Asset | Liability |
Equity Risk | | |
Futures Contracts (a) | $ - | $ (939,387) |
Total Value of Derivatives | $ - | $ (939,387) |
(a) Reflects gross cumulative appreciation (depreciation) on futures contracts as presented in the Schedule of Investments. Only the period end receivable or payable for daily variation margin and net unrealized appreciation (depreciation) are presented in the Statement of Assets and Liabilities. |
See accompanying notes which are an integral part of the financial statements.
Annual Report
Statement of Assets and Liabilities
| July 31, 2014 |
Assets | | |
Investment in securities, at value (including securities loaned of $167,213,862) - See accompanying schedule: Unaffiliated issuers (cost $4,220,222,133) | $ 4,731,861,255 | |
Fidelity Central Funds (cost $312,228,295) | 312,228,295 | |
Other affiliated issuers (cost $220,418,194) | 171,542,522 | |
Total Investments (cost $4,752,868,622) | | $ 5,215,632,072 |
Cash | | 1,063 |
Foreign currency held at value (cost $56,935) | | 56,846 |
Receivable for investments sold | | 16,452,971 |
Receivable for fund shares sold | | 480,981 |
Dividends receivable | | 2,527,642 |
Distributions receivable from Fidelity Central Funds | | 279,905 |
Other receivables | | 63,320 |
Total assets | | 5,235,494,800 |
| | |
Liabilities | | |
Payable for investments purchased | $ 26,358,722 | |
Payable for fund shares redeemed | 4,665,147 | |
Accrued management fee | 2,556,104 | |
Payable for daily variation margin for derivative instruments | 777,600 | |
Other affiliated payables | 452,762 | |
Other payables and accrued expenses | 77,240 | |
Collateral on securities loaned, at value | 174,422,807 | |
Total liabilities | | 209,310,382 |
| | |
Net Assets | | $ 5,026,184,418 |
Net Assets consist of: | | |
Paid in capital | | $ 4,308,870,121 |
Undistributed net investment income | | 9,455,513 |
Accumulated undistributed net realized gain (loss) on investments and foreign currency transactions | | 246,046,338 |
Net unrealized appreciation (depreciation) on investments and assets and liabilities in foreign currencies | | 461,812,446 |
Net Assets | | $ 5,026,184,418 |
See accompanying notes which are an integral part of the financial statements.
Annual Report
Financial Statements - continued
Statement of Assets and Liabilities - continued
| July 31, 2014 |
Series Small Cap Opportunities:
Net Asset Value, offering price and redemption price per share ($2,425,972,665 ÷ 187,145,497 shares) | | $ 12.96 |
| | |
Class F:
Net Asset Value, offering price and redemption price per share ($2,600,211,753 ÷ 199,343,190 shares) | | $ 13.04 |
See accompanying notes which are an integral part of the financial statements.
Annual Report
Statement of Operations
| Year ended July 31, 2014 |
Investment Income | | |
Dividends (including $775,531 earned from other affiliated issuers) | | $ 43,473,926 |
Interest | | 1,586 |
Income from Fidelity Central Funds (including $2,192,240 from security lending) | | 2,383,925 |
Total income | | 45,859,437 |
| | |
Expenses | | |
Management fee
Basic fee | $ 32,044,744 | |
Performance adjustment | (3,830,564) | |
Transfer agent fees | 3,990,414 | |
Accounting and security lending fees | 1,078,885 | |
Custodian fees and expenses | 150,263 | |
Independent trustees' compensation | 17,849 | |
Audit | 65,946 | |
Legal | 11,450 | |
Miscellaneous | 27,953 | |
Total expenses before reductions | 33,556,940 | |
Expense reductions | (146,257) | 33,410,683 |
Net investment income (loss) | | 12,448,754 |
Realized and Unrealized Gain (Loss) Net realized gain (loss) on: | | |
Investment securities: | | |
Unaffiliated issuers | 383,099,333 | |
Other affiliated issuers | (1,176,793) | |
Foreign currency transactions | (3,404) | |
Futures contracts | 6,481,063 | |
Total net realized gain (loss) | | 388,400,199 |
Change in net unrealized appreciation (depreciation) on: Investment securities | (187,665,456) | |
Assets and liabilities in foreign currencies | (3,381) | |
Futures contracts | (1,397,219) | |
Total change in net unrealized appreciation (depreciation) | | (189,066,056) |
Net gain (loss) | | 199,334,143 |
Net increase (decrease) in net assets resulting from operations | | $ 211,782,897 |
See accompanying notes which are an integral part of the financial statements.
Annual Report
Financial Statements - continued
Statement of Changes in Net Assets
| Year ended
July 31,
2014 | Year ended
July 31,
2013 |
Increase (Decrease) in Net Assets | | |
Operations | | |
Net investment income (loss) | $ 12,448,754 | $ 10,121,371 |
Net realized gain (loss) | 388,400,199 | 250,130,786 |
Change in net unrealized appreciation (depreciation) | (189,066,056) | 462,510,828 |
Net increase (decrease) in net assets resulting
from operations | 211,782,897 | 722,762,985 |
Distributions to shareholders from net investment income | (2,397,517) | (11,718,166) |
Distributions to shareholders from net realized gain | (355,403,438) | (119,046,114) |
Total distributions | (357,800,955) | (130,764,280) |
Share transactions - net increase (decrease) | 2,217,612,913 | 109,169,036 |
Total increase (decrease) in net assets | 2,071,594,855 | 701,167,741 |
| | |
Net Assets | | |
Beginning of period | 2,954,589,563 | 2,253,421,822 |
End of period (including undistributed net investment income of $9,455,513 and undistributed net investment income of $0, respectively) | $ 5,026,184,418 | $ 2,954,589,563 |
See accompanying notes which are an integral part of the financial statements.
Annual Report
Financial Highlights - Series Small Cap Opportunities
Years ended July 31, | 2014 | 2013 | 2012 | 2011 | 2010 |
Selected Per-Share Data | | | | | |
Net asset value, beginning of period | $ 13.55 | $ 10.93 | $ 11.22 | $ 8.76 | $ 6.94 |
Income from Investment Operations | | | | | |
Net investment income (loss) B | .02 | .04 | - H | - E, H | (.01) |
Net realized and unrealized gain (loss) | .77 | 3.20 | (.17) | 2.50 | 1.83 |
Total from investment operations | .79 | 3.24 | (.17) | 2.50 | 1.82 |
Distributions from net investment income | - H | (.05) | - H | - F | - |
Distributions from net realized gain | (1.38) | (.57) | (.11) | (.04) F | - |
Total distributions | (1.38) | (.62) | (.12) J | (.04) | - |
Net asset value, end of period | $ 12.96 | $ 13.55 | $ 10.93 | $ 11.22 | $ 8.76 |
Total ReturnA | 6.29% | 30.91% | (1.41)% | 28.50% | 26.22% |
Ratios to Average Net Assets C, G | | | | |
Expenses before reductions | .82% | .98% | 1.12% | 1.10% | 1.02% |
Expenses net of fee waivers, if any | .82% | .98% | 1.12% | 1.10% | 1.02% |
Expenses net of all reductions | .82% | .96% | 1.11% | 1.09% | 1.01% |
Net investment income (loss) | .19% | .30% | .04% | (.04)% E | (.07)% |
Supplemental Data | | | | | |
Net assets, end of period (000 omitted) | $ 2,425,973 | $ 1,602,664 | $ 1,329,447 | $ 1,415,570 | $ 1,363,646 |
Portfolio turnover rate D | 90% I | 77% | 66% | 73% | 104% |
A Total returns would have been lower if certain expenses had not been reduced during the applicable periods shown.
B Calculated based on average shares outstanding during the period.
C Fees and expenses of any underlying Fidelity Central Funds are not included in the Fund's expense ratio. The Fund indirectly bears its proportionate share of the expenses of any underlying Fidelity Central Funds.
D Amount does not include the portfolio activity of any underlying Fidelity Central Funds.
E Investment income per share reflects a large, non-recurring dividend which amounted to $.02 per share. Excluding this non-recurring dividend, the ratio of net investment income (loss) to average net assets would have been (.27)%.
F The amounts shown reflect certain reclassifications related to book to tax differences that were made in the year shown.
G Expense ratios reflect operating expenses of the class. Expenses before reductions do not reflect amounts reimbursed by the investment adviser or reductions from brokerage service arrangements or reductions from other expense offset arrangements and do not represent the amount paid by the class during periods when reimbursements or reductions occur. Expenses net of fee waivers reflect expenses after reimbursement by the investment adviser but prior to reductions from brokerage service arrangements or other expense offset arrangements. Expenses net of all reductions represent the net expenses paid by the class.
H Amount represents less than $.01 per share.
I Portfolio turnover rate excludes securities received or delivered in-kind.
J Total distributions of $.12 per share is comprised of distributions from net investment income of $.003 and distributions from net realized gain of $.113 per share.
See accompanying notes which are an integral part of the financial statements.
Annual Report
Financial Highlights - Class F
Years ended July 31, | 2014 | 2013 | 2012 | 2011 | 2010 |
Selected Per-Share Data | | | | | |
Net asset value, beginning of period | $ 13.62 | $ 10.99 | $ 11.27 | $ 8.79 | $ 6.94 |
Income from Investment Operations | | | | | |
Net investment income (loss) B | .05 | .06 | .03 | .02 E | .01 |
Net realized and unrealized gain (loss) | .77 | 3.21 | (.18) | 2.50 | 1.84 |
Total from investment operations | .82 | 3.27 | (.15) | 2.52 | 1.85 |
Distributions from net investment income | (.01) | (.07) | (.01) | - F | - |
Distributions from net realized gain | (1.39) | (.57) | (.11) | (.04) F | - |
Total distributions | (1.40) | (.64) | (.13) I | (.04) | - |
Net asset value, end of period | $ 13.04 | $ 13.62 | $ 10.99 | $ 11.27 | $ 8.79 |
Total Return A | 6.52% | 31.09% | (1.23)% | 28.74% | 26.66% |
Ratios to Average Net Assets C, G | | | | | |
Expenses before reductions | .65% | .79% | .91% | .89% | .78% |
Expenses net of fee waivers, if any | .65% | .79% | .91% | .89% | .78% |
Expenses net of all reductions | .65% | .77% | .91% | .88% | .77% |
Net investment income (loss) | .36% | .49% | .24% | .17% E | .17% |
Supplemental Data | | | | | |
Net assets, end of period (000 omitted) | $ 2,600,212 | $ 1,351,926 | $ 923,975 | $ 478,821 | $ 174,783 |
Portfolio turnover rate D | 90% H | 77% | 66% | 73% | 104% |
A Total returns would have been lower if certain expenses had not been reduced during the applicable periods shown.
B Calculated based on average shares outstanding during the period.
C Fees and expenses of any underlying Fidelity Central Funds are not included in the Fund's expense ratio. The Fund indirectly bears its proportionate share of the expenses of any underlying Fidelity Central Funds.
D Amount does not include the portfolio activity of any underlying Fidelity Central Funds.
E Investment income per share reflects a large, non-recurring dividend which amounted to $.02 per share. Excluding this non-recurring dividend, the ratio of net investment income (loss) to average net assets would have been (.06)%.
F The amounts shown reflect certain reclassifications related to book to tax differences that were made in the year shown.
G Expense ratios reflect operating expenses of the class. Expenses before reductions do not reflect amounts reimbursed by the investment adviser or reductions from brokerage service arrangements or reductions from other expense offset arrangements and do not represent the amount paid by the class during periods when reimbursements or reductions occur. Expenses net of fee waivers reflect expenses after reimbursement by the investment adviser but prior to reductions from brokerage service arrangements or other expense offset arrangements. Expenses net of all reductions represent the net expenses paid by the class.
H Portfolio turnover rate excludes securities received or delivered in-kind.
I Total distributions of $.13 per share is comprised of distributions from net investment income of $.012 and distributions from net realized gain of $.113 per share.
See accompanying notes which are an integral part of the financial statements.
Annual Report
Notes to Financial Statements
For the period ended July 31, 2014
1. Organization.
Fidelity Series Small Cap Opportunities Fund (the Fund) is a fund of Fidelity Securities Fund (the Trust) and is authorized to issue an unlimited number of shares. Shares of the Fund are only available for purchase by mutual funds for which Fidelity Management & Research Company (FMR) or an affiliate serves as an investment manager and, for shares of Series Small Cap Opportunities, FMR investment professionals. The Trust is registered under the Investment Company Act of 1940, as amended (the 1940 Act), as an open-end management investment company organized as a Massachusetts business trust. The Fund offers Series Small Cap Opportunities and Class F shares, each of which has equal rights as to assets and voting privileges. Each class has exclusive voting rights with respect to matters that affect that class.
2. Investments in Fidelity Central Funds.
The Fund invests in Fidelity Central Funds, which are open-end investment companies generally available only to other investment companies and accounts managed by the investment adviser and its affiliates. The Fund's Schedule of Investments lists each of the Fidelity Central Funds held as of period end, if any, as an investment of the Fund, but does not include the underlying holdings of each Fidelity Central Fund. As an Investing Fund, the Fund indirectly bears its proportionate share of the expenses of the underlying Fidelity Central Funds.
The Money Market Central Funds seek preservation of capital and current income and are managed by Fidelity Investments Money Management, Inc. (FIMM), an affiliate of the investment adviser. Annualized expenses of the Money Market Central Funds as of their most recent shareholder report date are less than .01%.
A complete unaudited list of holdings for each Fidelity Central Fund is available upon request or at the Securities and Exchange Commission (the SEC) website at www.sec.gov. In addition, the financial statements of the Fidelity Central Funds, which are not covered by the Fund's Report of Independent Registered Public Accounting Firm, are available on the SEC website or upon request.
3. Significant Accounting Policies.
The financial statements have been prepared in conformity with accounting principles generally accepted in the United States of America (GAAP), which require management to make certain estimates and assumptions at the date of the financial statements. Actual results could differ from those estimates. Subsequent events, if any, through the date that the financial statements were issued have been evaluated in the preparation of
Annual Report
Notes to Financial Statements - continued
3. Significant Accounting Policies - continued
the financial statements. The following summarizes the significant accounting policies of the Fund:
Investment Valuation. Investments are valued as of 4:00 p.m. Eastern time on the last calendar day of the period. In accordance with valuation policies and procedures approved by the Board of Trustees (the Board), the Fund attempts to obtain prices from one or more third party pricing vendors or brokers to value its investments. When current market prices, quotations or currency exchange rates are not readily available or reliable, investments will be fair valued in good faith by the FMR Fair Value Committee (the Committee), in accordance with procedures adopted by the Board. Factors used in determining fair value vary by investment type and may include market or investment specific events, changes in interest rates and credit quality. The frequency with which these procedures are used cannot be predicted and they may be utilized to a significant extent. The Committee oversees the Fund's valuation policies and procedures and is responsible for approving and reporting to the Board all fair value determinations.
The Fund categorizes the inputs to valuation techniques used to value its investments into a disclosure hierarchy consisting of three levels as shown below:
Level 1 - quoted prices in active markets for identical investments
Level 2 - other significant observable inputs (including quoted prices for similar investments, interest rates, prepayment speeds, etc.)
Level 3 - unobservable inputs (including the Fund's own assumptions based on the best information available)
Valuation techniques used to value the Fund's investments by major category are as follows:
Equity securities, including restricted securities, for which market quotations are readily available, are valued at the last reported sale price or official closing price as reported by a third party pricing vendor on the primary market or exchange on which they are traded and are categorized as Level 1 in the hierarchy. In the event there were no sales during the day or closing prices are not available, securities are valued at the last quoted bid price or may be valued using the last available price and are generally categorized as Level 2 in the hierarchy. For foreign equity securities, when market or security specific events arise, comparisons to the valuation of American Depositary Receipts (ADRs), futures contracts, Exchange-Traded Funds (ETFs) and certain indexes as well as quoted prices for similar securities may be used and would be categorized as Level 2 in the hierarchy. Utilizing these techniques may result in transfers between Level 1 and Level 2. For equity securities, including restricted securities, where observable inputs are
Annual Report
3. Significant Accounting Policies - continued
Investment Valuation - continued
limited, assumptions about market activity and risk are used and these securities may be categorized as Level 3 in the hierarchy.
Debt securities, including restricted securities, are valued based on evaluated prices received from third party pricing vendors or from brokers who make markets in such securities. U.S. government and government agency obligations are valued by pricing vendors who utilize matrix pricing which considers yield or price of bonds of comparable quality, coupon, maturity and type or by broker-supplied prices. When independent prices are unavailable or unreliable, debt securities may be valued utilizing pricing methodologies which consider similar factors that would be used by third party pricing vendors. Debt securities are generally categorized as Level 2 in the hierarchy but may be Level 3 depending on the circumstances.
Futures contracts are valued at the settlement price established each day by the board of trade or exchange on which they are traded and are categorized as Level 1 in the hierarchy. Investments in open-end mutual funds, including the Fidelity Central Funds, are valued at their closing net asset value (NAV) each business day and are categorized as Level 1 in the hierarchy.
Changes in valuation techniques may result in transfers in or out of an assigned level within the disclosure hierarchy. The aggregate value of investments by input level, as of July 31, 2014, is included at the end of the Fund's Schedule of Investments.
Foreign Currency. The Fund may use foreign currency contracts to facilitate transactions in foreign-denominated securities. Gains and losses from these transactions may arise from changes in the value of the foreign currency or if the counterparties do not perform under the contracts' terms.
Foreign-denominated assets, including investment securities, and liabilities are translated into U.S. dollars at the exchange rates at period end. Purchases and sales of investment securities, income and dividends received and expenses denominated in foreign currencies are translated into U.S. dollars at the exchange rate in effect on the transaction date.
The effects of exchange rate fluctuations on investments are included with the net realized and unrealized gain (loss) on investment securities. Other foreign currency transactions resulting in realized and unrealized gain (loss) are disclosed separately.
Investment Transactions and Income. For financial reporting purposes, the Fund's investment holdings and NAV include trades executed through the end of the last business day of the period. The NAV per share for processing shareholder transactions is calculated as of the close of business of the New York Stock Exchange (NYSE), normally
Annual Report
Notes to Financial Statements - continued
3. Significant Accounting Policies - continued
Investment Transactions and Income - continued
4:00 p.m. Eastern time and includes trades executed through the end of the prior business day. Gains and losses on securities sold are determined on the basis of identified cost and may include proceeds received from litigation. Dividend income is recorded on the ex-dividend date, except for certain dividends from foreign securities where the ex-dividend date may have passed, which are recorded as soon as the Fund is informed of the ex-dividend date. Non-cash dividends included in dividend income, if any, are recorded at the fair market value of the securities received. Income and capital gain distributions from Fidelity Central Funds, if any, are recorded on the ex-dividend date. Distributions received on securities that represent a return of capital or capital gain are recorded as a reduction of cost of investments and/or as a realized gain. Subsequent to ex-dividend date the Fund determines the components of these distributions, based upon receipt of tax filings or other correspondence relating to the underlying investment. Interest income is accrued as earned and includes coupon interest and amortization of premium and accretion of discount on debt securities as applicable. Investment income is recorded net of foreign taxes withheld where recovery of such taxes is uncertain.
Class Allocations and Expenses. Investment income, realized and unrealized capital gains and losses, common expenses of the Fund, and certain fund-level expense reductions, if any, are allocated daily on a pro-rata basis to each class based on the relative net assets of each class to the total net assets of the Fund. Each class differs with respect to transfer agent and distribution and service plan fees incurred. Certain expense reductions may also differ by class. For the reporting period, the allocated portion of income and expenses to each class as a percent of its average net assets may vary due to the timing of recording these transactions in relation to fluctuating net assets of the classes. Expenses directly attributable to a fund are charged to that fund. Expenses attributable to more than one fund are allocated among the respective funds on the basis of relative net assets or other appropriate methods. Expense estimates are accrued in the period to which they relate and adjustments are made when actual amounts are known.
Income Tax Information and Distributions to Shareholders. Each year, the Fund intends to qualify as a regulated investment company under Subchapter M of the Internal Revenue Code, including distributing substantially all of its taxable income and realized gains. As a result, no provision for U.S. Federal income taxes is required. As of July 31, 2014, the Fund did not have any unrecognized tax benefits in the financial statements; nor is the Fund aware of any tax positions for which it is reasonably possible that the total amounts of unrecognized tax benefits will significantly change in the next twelve months. The Fund files a U.S. federal tax return, in addition to state and local tax returns as required. The Fund's federal income tax returns are subject to examination by the Internal Revenue Service (IRS) for a period of three fiscal years after they are filed.
Annual Report
3. Significant Accounting Policies - continued
Income Tax Information and Distributions to Shareholders - continued
State and local tax returns may be subject to examination for an additional fiscal year depending on the jurisdiction. Foreign taxes are provided for based on the Fund's understanding of the tax rules and rates that exist in the foreign markets in which it invests.
Distributions are declared and recorded on the ex-dividend date. Income dividends and capital gain distributions are declared separately for each class. Income and capital gain distributions are determined in accordance with income tax regulations, which may differ from GAAP.
Capital accounts within the financial statements are adjusted for permanent book-tax differences. These adjustments have no impact on net assets or the results of operations. Capital accounts are not adjusted for temporary book-tax differences which will reverse in a subsequent period.
Book-tax differences are primarily due to futures contracts, foreign currency transactions, market discount, partnerships and losses deferred due to wash sales.
The federal tax cost of investment securities and unrealized appreciation (depreciation) as of period end were as follows:
Gross unrealized appreciation | $ 775,284,121 |
Gross unrealized depreciation | (319,336,848) |
Net unrealized appreciation (depreciation) on securities | $ 455,947,273 |
| |
Tax Cost | $ 4,759,684,799 |
The tax-based components of distributable earnings as of period end were as follows:
Undistributed ordinary income | $ 96,944,763 |
Undistributed long-term capital gain | $ 164,433,877 |
Net unrealized appreciation (depreciation) on securities and other investments | $ 455,935,656 |
The tax character of distributions paid was as follows:
| July 31, 2014 | July 31, 2013 |
Ordinary Income | $ 93,611,792 | $ 11,718,166 |
Long-term Capital Gains | 264,189,163 | 119,046,114 |
Total | $ 357,800,955 | $ 130,764,280 |
Annual Report
Notes to Financial Statements - continued
4. Derivative Instruments.
Risk Exposures and the Use of Derivative Instruments. The Fund's investment objective allows the Fund to enter into various types of derivative contracts, including futures contracts. Derivatives are investments whose value is primarily derived from underlying assets, indices or reference rates and may be transacted on an exchange or over-the-counter (OTC). Derivatives may involve a future commitment to buy or sell a specified asset based on specified terms, to exchange future cash flows at periodic intervals based on a notional principal amount, or for one party to make one or more payments upon the occurrence of specified events in exchange for periodic payments from the other party.
The Fund used derivatives to increase returns and to manage exposure to certain risks as defined below. The success of any strategy involving derivatives depends on analysis of numerous economic factors, and if the strategies for investment do not work as intended, the Fund may not achieve its objectives.
The Fund's use of derivatives increased or decreased its exposure to the following risk:
Equity Risk | Equity risk relates to the fluctuations in the value of financial instruments as a result of changes in market prices (other than those arising from interest rate risk or foreign exchange risk), whether caused by factors specific to an individual investment, its issuer, or all factors affecting all instruments traded in a market or market segment. |
The Fund is also exposed to additional risks from investing in derivatives, such as liquidity risk and counterparty credit risk. Liquidity risk is the risk that the Fund will be unable to close out the derivative in the open market in a timely manner. Counterparty credit risk is the risk that the counterparty will not be able to fulfill its obligation to the Fund. Counterparty credit risk related to exchange-traded futures contracts may be mitigated by the protection provided by the exchange on which they trade.
Investing in derivatives may involve greater risks than investing in the underlying assets directly and, to varying degrees, may involve risk of loss in excess of any initial investment and collateral received and amounts recognized in the Statement of Assets and Liabilities. In addition, there may be the risk that the change in value of the derivative contract does not correspond to the change in value of the underlying instrument.
Futures Contracts. A futures contract is an agreement between two parties to buy or sell a specified underlying instrument for a fixed price at a specified future date. The Fund used futures contracts to manage its exposure to the stock market.
Upon entering into a futures contract, a fund is required to deposit either cash or securities (initial margin) with a clearing broker in an amount equal to a certain percentage of the face value of the contract. Futures contracts are marked-to-market daily and subsequent daily payments (variation margin) are made or received by a fund depending on
Annual Report
4. Derivative Instruments - continued
Futures Contracts - continued
the daily fluctuations in the value of the futures contracts and are recorded as unrealized appreciation or (depreciation). This receivable and/or payable, if any, is included in daily variation margin for derivative instruments in the Statement of Assets and Liabilities. Realized gain or (loss) is recorded upon the expiration or closing of a futures contract.
Any open futures contracts at period end are presented in the Schedule of Investments under the caption "Futures Contracts." The underlying face amount at value reflects each contract's exposure to the underlying instrument or index at period end and is representative of volume of activity during the period. Securities deposited to meet initial margin requirements are identified in the Schedule of Investments.
During the period the Fund recognized net realized gain (loss) of $6,481,063 and a change in net unrealized appreciation (depreciation) of $(1,397,219) related to its investment in futures contracts. These amounts are included in the Statement of Operations.
5. Purchases and Sales of Investments.
Purchases and sales of securities, other than short-term securities and in-kind transactions, aggregated $4,380,503,110 and $3,826,957,209, respectively.
6. Fees and Other Transactions with Affiliates.
Management Fee. Fidelity Management & Research Company (the investment adviser) and its affiliates provide the Fund with investment management related services for which the Fund pays a monthly management fee. The management fee is the sum of an individual fund fee rate that is based on an annual rate of .45% of the Fund's average net assets and an annualized group fee rate that averaged .25% during the period. The group fee rate is based upon the average net assets of all the mutual funds advised by the investment adviser, including any mutual funds previously advised by the investment adviser that are currently advised by Fidelity SelectCo, LLC, an affiliate of the investment adviser. The group fee rate decreases as assets under management increase and increases as assets under management decrease. In addition, the management fee is subject to a performance adjustment (up to a maximum of ± .20% of the Fund's average net assets over a 36 month performance period). The upward or downward adjustment to the management fee is based on the relative investment performance of Series Small Cap Opportunities as compared to its benchmark index, the Russell 2000® Index, over the same 36 month performance period. For the reporting period, the total annual management fee rate, including the performance adjustment, was .62% of the Fund's average net assets. The performance adjustment included in the management fee rate may be higher
Annual Report
Notes to Financial Statements - continued
6. Fees and Other Transactions with Affiliates - continued
Management Fee - continued
or lower than the maximum performance adjustment rate due to the difference between the average net assets for the reporting and performance periods.
Transfer Agent Fees. Fidelity Investments Institutional Operations Company, Inc., (FIIOC), an affiliate of the investment adviser, is the transfer, dividend disbursing and shareholder servicing agent for each class of the Fund. FIIOC receives account fees and asset-based fees that vary according to the account size and type of account of the shareholders of Series Small Cap Opportunities. FIIOC receives no fees for providing transfer agency services to Class F. FIIOC pays for typesetting, printing and mailing of shareholder reports, except proxy statements.
For the period, transfer agent fees for each class were as follows:
| Amount | % of
Average
Net Assets |
Series Small Cap Opportunities | $ 3,990,414 | .17 |
Accounting and Security Lending Fees. Fidelity Service Company, Inc. (FSC), an affiliate of the investment adviser, maintains the Fund's accounting records. The accounting fee is based on the level of average net assets for each month. Under a separate contract, FSC administers the security lending program. The security lending fee is based on the number and duration of lending transactions.
Brokerage Commissions. The Fund placed a portion of its portfolio transactions with brokerage firms which are affiliates of the investment adviser. Brokerage commissions are included in net realized gain (loss) and change in net unrealized appreciation (depreciation) in the Statement of Operations. The commissions paid to these affiliated firms were $128,972 for the period.
Exchanges In-kind. During the period, certain investment companies managed by the investment adviser or its affiliates (Investing Funds) completed exchanges in-kind with the Fund. The Investing Funds delivered investments valued at $1,380,652,585 in exchange for 103,972,612 shares of the Fund. The amount of in-kind exchanges is included in share transactions in the accompanying Statement of Changes in Net Assets as well as Note 11: Share Transactions. The Fund recognized no gain or loss for federal income tax purposes.
Other. During the period, the investment adviser reimbursed the Fund for certain losses in the amount of $3,468.
Annual Report
7. Committed Line of Credit.
The Fund participates with other funds managed by the investment adviser or an affiliate in a $4.25 billion credit facility (the "line of credit") to be utilized for temporary or emergency purposes to fund shareholder redemptions or for other short-term liquidity purposes. The Fund has agreed to pay commitment fees on its pro-rata portion of the line of credit, which amounted to $7,447 and is reflected in Miscellaneous expenses on the Statement of Operations. During the period, the Fund did not borrow on this line of credit.
8. Security Lending.
The Fund lends portfolio securities through a lending agent from time to time in order to earn additional income. For equity securities, a lending agent is used and may loan securities to certain qualified borrowers, including Fidelity Capital Markets (FCM), a broker-dealer affiliated with the Fund. On the settlement date of the loan, the Fund receives collateral (in the form of U.S. Treasury obligations, letters of credit and/or cash) against the loaned securities and maintains collateral in an amount not less than 100% of the market value of the loaned securities during the period of the loan. The market value of the loaned securities is determined at the close of business of the Fund and any additional required collateral is delivered to the Fund on the next business day. If the borrower defaults on its obligation to return the securities loaned because of insolvency or other reasons, the Fund may apply collateral received from the borrower against the obligation. The Fund may experience delays and costs in recovering the securities loaned. Any cash collateral received is invested in the Fidelity Securities Lending Cash Central Fund. The value of loaned securities and cash collateral at period end are disclosed on the Fund's Statement of Assets and Liabilities. The value of securities loaned to FCM at period end was $800,000. Security lending income represents the income earned on investing cash collateral, less rebates paid to borrowers and any lending agent fees associated with the loan, plus any premium payments received for lending certain types of securities. Security lending income is presented in the Statement of Operations as a component of income from Fidelity Central Funds and includes $141,913 from securities loaned to FCM.
9. Expense Reductions.
Commissions paid to certain brokers with whom the investment adviser, or its affiliates, places trades on behalf of the Fund include an amount in addition to trade execution, which may be rebated back to the Fund to offset certain expenses. This amount totaled $146,257 for the period.
Annual Report
Notes to Financial Statements - continued
10. Distributions to Shareholders.
Distributions to shareholders of each class were as follows:
Years ended July 31, | 2014 | 2013 |
From net investment income | | |
Series Small Cap Opportunities | $ 562,708 | $ 5,439,782 |
Class F | 1,834,809 | 6,278,384 |
Total | $ 2,397,517 | $ 11,718,166 |
From net realized gain | | |
Series Small Cap Opportunities | $ 185,928,427 | $ 68,495,319 |
Class F | 169,475,011 | 50,550,795 |
Total | $ 355,403,438 | $ 119,046,114 |
11. Share Transactions.
Transactions for each class of shares were as follows:
| Shares | Dollars |
Years ended July 31, | 2014 | 2013 | 2014 | 2013 |
Series Small Cap Opportunities | | | | |
Shares sold | 88,985,520 A | 18,962,910 | $ 1,176,045,095 A | $ 213,903,891 |
Reinvestment of distributions | 14,725,510 | 6,656,221 | 186,491,135 | 73,935,101 |
Shares redeemed | (34,876,222) | (28,900,880) | (465,134,933) | (343,341,551) |
Net increase (decrease) | 68,834,808 | (3,281,749) | $ 897,401,297 | $ (55,502,559) |
Class F | | | | |
Shares sold | 112,573,524 A | 21,246,567 | $ 1,499,078,862 A | $ 247,783,165 |
Reinvestment of distributions | 13,452,037 | 5,100,288 | 171,309,820 | 56,829,179 |
Shares redeemed | (25,924,826) | (11,157,740) | (350,177,066) | (139,940,749) |
Net increase (decrease) | 100,100,735 | 15,189,115 | $ 1,320,211,616 | $ 164,671,595 |
A Amount includes in-kind exchanges (see Note 6: Exchanges In-Kind).
12. Other.
The Fund's organizational documents provide former and current trustees and officers with a limited indemnification against liabilities arising in connection with the performance of their duties to the Fund. In the normal course of business, the Fund may also enter into contracts that provide general indemnifications. The Fund's maximum exposure under these arrangements is unknown as this would be dependent on future
Annual Report
12. Other - continued
claims that may be made against the Fund. The risk of material loss from such claims is considered remote.
At the end of the period, mutual funds managed by the investment adviser or its affiliates were the owners of record of all of the outstanding shares of the Fund.
Annual Report
To the Trustees of Fidelity Securities Fund and Shareholders of Fidelity Series Small Cap Opportunities Fund:
We have audited the accompanying statement of assets and liabilities of Fidelity Series Small Cap Opportunities Fund (the Fund), a fund of Fidelity Securities Fund, including the schedule of investments, as of July 31, 2014, and the related statement of operations for the year then ended, the statement of changes in net assets for each of the two years in the period then ended, and the financial highlights for each of the five years in the period then ended. These financial statements and financial highlights are the responsibility of the Fund's management. Our responsibility is to express an opinion on these financial statements and financial highlights based on our audits.
We conducted our audits in accordance with the standards of the Public Company Accounting Oversight Board (United States). Those standards require that we plan and perform the audit to obtain reasonable assurance about whether the financial statements and financial highlights are free of material misstatement. The Fund is not required to have, nor were we engaged to perform, an audit of its internal control over financial reporting. Our audits included consideration of internal control over financial reporting as a basis for designing audit procedures that are appropriate in the circumstances, but not for the purpose of expressing an opinion on the effectiveness of the Fund's internal control over financial reporting. Accordingly, we express no such opinion. An audit also includes examining, on a test basis, evidence supporting the amounts and disclosures in the financial statements, assessing the accounting principles used and significant estimates made by management, as well as evaluating the overall financial statement presentation. Our procedures included confirmation of securities owned as of July 31, 2014, by correspondence with the custodians and brokers; where replies were not received from brokers, we performed other auditing procedures. We believe that our audits provide a reasonable basis for our opinion.
In our opinion, the financial statements and financial highlights referred to above present fairly, in all material respects, the financial position of Fidelity Series Small Cap Opportunities Fund as of July 31, 2014, the results of its operations for the year then ended, the changes in its net assets for each of the two years in the period then ended, and the financial highlights for each of the five years in the period then ended, in conformity with accounting principles generally accepted in the United States of America.
DELOITTE & TOUCHE LLP
Boston, Massachusetts
September 15, 2014
Annual Report
The Trustees, Member of the Advisory Board, and officers of the trust and fund, as applicable, are listed below. The Board of Trustees governs the fund and is responsible for protecting the interests of shareholders. The Trustees are experienced executives who meet periodically throughout the year to oversee the fund's activities, review contractual arrangements with companies that provide services to the fund, oversee management of the risks associated with such activities and contractual arrangements, and review the fund's performance. Except for James C. Curvey, each of the Trustees oversees 173 funds. Mr. Curvey oversees 397 funds.
The Trustees hold office without limit in time except that (a) any Trustee may resign; (b) any Trustee may be removed by written instrument, signed by at least two-thirds of the number of Trustees prior to such removal; (c) any Trustee who requests to be retired or who has become incapacitated by illness or injury may be retired by written instrument signed by a majority of the other Trustees; and (d) any Trustee may be removed at any special meeting of shareholders by a two-thirds vote of the outstanding voting securities of the trust. Each Trustee who is not an interested person (as defined in the 1940 Act) of the trust and the fund (Independent Trustee), shall retire not later than the last day of the calendar year in which his or her 75th birthday occurs. The Independent Trustees may waive this mandatory retirement age policy with respect to individual Trustees. The officers and Advisory Board Member hold office without limit in time, except that any officer and Advisory Board Member may resign or may be removed by a vote of a majority of the Trustees at any regular meeting or any special meeting of the Trustees. Except as indicated, each individual has held the office shown or other offices in the same company for the past five years.
Experience, Skills, Attributes, and Qualifications of the Fund's Trustees. The Governance and Nominating Committee has adopted a statement of policy that describes the experience, qualifications, attributes, and skills that are necessary and desirable for potential Independent Trustee candidates (Statement of Policy). The Board believes that each Trustee satisfied at the time he or she was initially elected or appointed a Trustee, and continues to satisfy, the standards contemplated by the Statement of Policy. The Governance and Nominating Committee also engages professional search firms to help identify potential Independent Trustee candidates who have the experience, qualifications, attributes, and skills consistent with the Statement of Policy. From time to time, additional criteria based on the composition and skills of the current Independent Trustees, as well as experience or skills that may be appropriate in light of future changes to board composition, business conditions, and regulatory or other developments, have also been considered by the professional search firms and the Governance and Nominating Committee. In addition, the Board takes into account the Trustees' commitment and participation in Board and committee meetings, as well as their leadership of standing and ad hoc committees throughout their tenure.
In determining that a particular Trustee was and continues to be qualified to serve as a Trustee, the Board has considered a variety of criteria, none of which, in isolation, was controlling. The Board believes that, collectively, the Trustees have balanced and diverse experience, qualifications, attributes, and skills, which allow the Board to operate effectively in governing the fund and protecting the interests of shareholders. Information about the specific experience, skills, attributes, and qualifications of each Trustee, which in each case led to the Board's conclusion that the Trustee should serve (or continue to serve) as a trustee of the fund, is provided below.
Annual Report
Trustees and Officers - continued
Board Structure and Oversight Function. James C. Curvey is an interested person (as defined in the 1940 Act) and currently serves as Chairman. The Trustees have determined that an interested Chairman is appropriate and benefits shareholders because an interested Chairman has a personal and professional stake in the quality and continuity of services provided to the fund. Independent Trustees exercise their informed business judgment to appoint an individual of their choosing to serve as Chairman, regardless of whether the Trustee happens to be independent or a member of management. The Independent Trustees have determined that they can act independently and effectively without having an Independent Trustee serve as Chairman and that a key structural component for assuring that they are in a position to do so is for the Independent Trustees to constitute a substantial majority for the Board. The Independent Trustees also regularly meet in executive session. Ned C. Lautenbach serves as Chairman of the Independent Trustees and as such (i) acts as a liaison between the Independent Trustees and management with respect to matters important to the Independent Trustees and (ii) with management prepares agendas for Board meetings.
Fidelity funds are overseen by different Boards of Trustees. The fund's Board oversees Fidelity's equity and high income funds and another Board oversees Fidelity's investment-grade bond, money market, and asset allocation funds. The asset allocation funds may invest in Fidelity funds overseen by the fund's Board. The use of separate Boards, each with its own committee structure, allows the Trustees of each group of Fidelity funds to focus on the unique issues of the funds they oversee, including common research, investment, and operational issues. On occasion, the separate Boards establish joint committees to address issues of overlapping consequences for the Fidelity funds overseen by each Board.
The Trustees operate using a system of committees to facilitate the timely and efficient consideration of all matters of importance to the Trustees, the fund, and fund shareholders and to facilitate compliance with legal and regulatory requirements and oversight of the fund's activities and associated risks. The Board, acting through its committees, has charged FMR and its affiliates with (i) identifying events or circumstances the occurrence of which could have demonstrably adverse effects on the fund's business and/or reputation; (ii) implementing processes and controls to lessen the possibility that such events or circumstances occur or to mitigate the effects of such events or circumstances if they do occur; and (iii) creating and maintaining a system designed to evaluate continuously business and market conditions in order to facilitate the identification and implementation processes described in (i) and (ii) above. Because the day-to-day operations and activities of the fund are carried out by or through FMR, its affiliates and other service providers, the fund's exposure to risks is mitigated but not eliminated by the processes overseen by the Trustees. While each of the Board's committees has responsibility for overseeing different aspects of the fund's activities, oversight is exercised primarily through the Operations, Audit, and Compliance Committees. In addition, the Independent Trustees have worked with FMR to enhance the Board's oversight of investment and financial risks, legal and regulatory risks, technology risks, and operational risks, including the development of additional risk reporting to the Board. For example, a working group comprised of Independent Trustees and FMR has worked and continues to work to review the Fidelity funds' valuation-related activities, reporting and risk management. Appropriate personnel, including but not limited to the fund's Chief Compliance Officer (CCO), FMR's internal auditor, the independent accountants, the fund's Treasurer and portfolio management personnel, make periodic reports to the Board's committees, as appropriate, including an annual review of FMR's risk management program for the Fidelity funds. The responsibilities of each standing committee, including their oversight responsibilities, are described further under "Standing Committees of the Fund's Trustees."
Annual Report
The fund's Statement of Additional Information (SAI) includes more information about the Trustees. To request a free copy, call Fidelity at 1-800-544-8544 for Fidelity Series Small Cap Opportunities Fund, or 1-800-835-5092 for Class F.
Interested Trustees*:
Correspondence intended for each Trustee who is an interested person may be sent to Fidelity Investments, 245 Summer Street, Boston, Massachusetts 02210.
Name, Year of Birth; Principal Occupations and Other Relevant Experience+ |
James C. Curvey (1935) |
Year of Election or Appointment: 2007 Trustee Chairman of the Board of Trustees |
| Mr. Curvey also serves as Trustee of other Fidelity funds. Mr. Curvey is a Director of Fidelity Research & Analysis Co. (2009-present), and Vice Chairman (2007-present) and Director of FMR LLC. In addition, Mr. Curvey serves as an Overseer for the Boston Symphony Orchestra and a member of the Trustees of Villanova University. Previously, Mr. Curvey served as a Director of Fidelity Investments Money Management, Inc. (2009-2014), a Director of FMR (2007-2014), a Director of FMR Co., Inc. (2007-2014) and was the Vice Chairman (2006-2007) and Director (2000-2007) of FMR Corp. |
Charles S. Morrison (1960) |
Year of Election or Appointment: 2014 Trustee |
| Mr. Morrison also serves as Trustee of other funds. He serves as President, Asset Management (2014-present) and is an employee of Fidelity Investments. Previously, Mr. Morrison served as Vice President of Fidelity's Fixed Income and Asset Allocation Funds (2012-2014), President, Fixed Income (2011-2014), Vice President of Fidelity's Money Market Funds (2005-2009), President, Money Market Group Leader of FMR (2009), and Senior Vice President, Money Market Group of FMR (2004-2009). Mr. Morrison also served as Vice President of Fidelity's Bond Funds (2002-2005), certain Balanced Funds (2002-2005), and certain Asset Allocation Funds (2002-2007), and as Senior Vice President (2002-2005) of Fidelity's Bond Division. |
* Trustees have been determined to be "Interested Trustees" by virtue of, among other things, their affiliation with the trust or various entities under common control with FMR.
+ The information above includes each Trustee's principal occupation during the last five years and other information relating to the experience, attributes, and skills relevant to each Trustee's qualifications to serve as a Trustee, which led to the conclusion that each Trustee should serve as a Trustee for the fund.
Annual Report
Independent Trustees:
Correspondence intended for each Independent Trustee (that is, the Trustees other than the Interested Trustees) may be sent to Fidelity Investments, P.O. Box 55235, Boston, Massachusetts 02205-5235.
Name, Year of Birth; Principal Occupations and Other Relevant Experience+ |
Dennis J. Dirks (1948) |
Year of Election or Appointment: 2005 Trustee |
| Mr. Dirks also serves as Trustee of other Fidelity funds. Prior to his retirement in May 2003, Mr. Dirks was Chief Operating Officer and a member of the Board of The Depository Trust & Clearing Corporation (DTCC). He also served as President, Chief Operating Officer, and Board member of The Depository Trust Company (DTC) and President and Board member of the National Securities Clearing Corporation (NSCC). In addition, Mr. Dirks served as Chief Executive Officer and Board member of the Government Securities Clearing Corporation, Chief Executive Officer and Board member of the Mortgage-Backed Securities Clearing Corporation, as a Trustee and a member of the Finance Committee of Manhattan College (2005-2008), and as a Trustee and a member of the Finance Committee of AHRC of Nassau County (2006-2008). Mr. Dirks is a member of the Independent Directors Council (IDC) Governing Council (2010-present) and Board of Directors for The Brookville Center for Children's Services, Inc. (2009-present). |
Alan J. Lacy (1953) |
Year of Election or Appointment: 2008 Trustee |
| Mr. Lacy also serves as Trustee of other Fidelity funds. Mr. Lacy serves as Senior Adviser (2007-present) of Oak Hill Capital Partners, L.P. (private equity). Mr. Lacy also served as Chief Executive Officer (2000-2005) and Vice Chairman (2005-2006) of Sears Holdings Corporation and Sears, Roebuck and Co. (retail). In addition, Mr. Lacy serves as a member of the Board of Directors of Dave & Buster's Entertainment, Inc. (restaurant and entertainment complexes, 2010-present), Earth Fare, Inc. (retail grocery, 2012-present), The Hillman Companies, Inc. (hardware wholesalers, 2010-present), and Bristol-Myers Squibb Company (global pharmaceuticals, 2008-present). Mr. Lacy is a member of the Board of Trustees of The National Parks Conservation Association (2006-present). Previously, Mr. Lacy served as Chairman of the Board of Trustees of the National Parks Conservation Association (2008-2011) and as a member of the Board of Directors for the Western Union Company (global money transfer, 2006-2011). |
Ned C. Lautenbach (1944) |
Year of Election or Appointment: 2000 Trustee Chairman of the Independent Trustees |
| Mr. Lautenbach also serves as Trustee of other Fidelity funds. Mr. Lautenbach currently serves as the Lead Director of the Eaton Corporation Board of Directors (diversified industrial, 1997-present). Mr. Lautenbach is Chairman of the Board of Directors of the Philharmonic Center for the Arts in Naples, Florida (2012-present) and a member of the Council on Foreign Relations (1994-present). Previously, Mr. Lautenbach was a Partner/Advisory Partner at Clayton, Dubilier & Rice, LLC (private equity investment, 1998-2010), as well as a Director of Sony Corporation (2006-2007). |
Joseph Mauriello (1944) |
Year of Election or Appointment: 2008 Trustee |
| Mr. Mauriello also serves as Trustee of other Fidelity funds. Prior to his retirement in January 2006, Mr. Mauriello served in numerous senior management positions including Deputy Chairman and Chief Operating Officer (2004-2005), and Vice Chairman of Financial Services (2002-2004) of KPMG LLP US (professional services, 1965-2005). Mr. Mauriello currently serves as a member of the Board of Directors of XL Group plc. (global insurance and re-insurance, 2006-present). Previously, Mr. Mauriello served as a Director of the Hamilton Funds of the Bank of New York (2006-2007) and of Arcadia Resources Inc. (health care services and products, 2007-2012). |
Robert W. Selander (1950) |
Year of Election or Appointment: 2011 Trustee |
| Mr. Selander also serves as Trustee of other Fidelity funds. Previously, Mr. Selander served as a Member of the Advisory Board of other Fidelity funds (2011), and Executive Vice Chairman (2010), Chief Executive Officer (2009-2010), and President and Chief Executive Officer (1997-2009) of Mastercard, Inc. |
Cornelia M. Small (1944) |
Year of Election or Appointment: 2005 Trustee |
| Ms. Small also serves as Trustee of other Fidelity funds. Ms. Small is a member of the Board of Directors (2009-present) and Chair of the Investment Committee (2010-present) of the Teagle Foundation. Ms. Small also serves on the Investment Committee of the Berkshire Taconic Community Foundation (2008-present). Previously, Ms. Small served as Chairperson (2002-2008) and a member of the Investment Committee and Chairperson (2008-2012) and a member of the Board of Trustees of Smith College. In addition, Ms. Small served as Chief Investment Officer, Director of Global Equity Investments, and a member of the Board of Directors of Scudder, Stevens & Clark and Scudder Kemper Investments. |
William S. Stavropoulos (1939) |
Year of Election or Appointment: 2002 Trustee Vice Chairman of the Independent Trustees |
| Mr. Stavropoulos also serves as Trustee of other Fidelity funds. Mr. Stavropoulos serves as President and Founder of the Michigan Baseball Foundation, the Great Lakes Loons (2007-present). Mr. Stavropoulos is Chairman Emeritus of the Board of Directors of The Dow Chemical Company, where he previously served in numerous senior management positions, including President, CEO (1995-2000; 2002-2004), Chairman of the Executive Committee (2000-2006), and as a member of the Board of Directors (1990-2006). Currently, Mr. Stavropoulos is Chairman of the Board of Directors of Univar Inc. (global distributor of commodity and specialty chemicals), a Director of Teradata Corporation (data warehousing and technology solutions), and Maersk Inc. (industrial conglomerate), and a member of the Advisory Board for Metalmark Capital LLC (private equity investment, 2005-present). Mr. Stavropoulos is an operating advisor to Clayton, Dubilier & Rice, LLC (private equity investment). In addition, Mr. Stavropoulos is a member of the University of Notre Dame Advisory Council for the College of Science, a Trustee of the Rollin L. Gerstacker Foundation, and a Director of the Naples Philharmonic Center for the Arts. Previously, Mr. Stavropoulos served as a Director of Chemical Financial Corporation (bank holding company, 1993-2012) and Tyco International, Ltd. (multinational manufacturing and services, 2007-2012). |
David M. Thomas (1949) |
Year of Election or Appointment: 2008 Trustee |
| Mr. Thomas also serves as Trustee of other Fidelity funds. Mr. Thomas serves as Non-Executive Chairman of the Board of Directors of Fortune Brands Home and Security (home and security products, 2011-present), and as a member of the Board of Directors of Interpublic Group of Companies, Inc. (marketing communication, 2004-present). Previously, Mr. Thomas served as Executive Chairman (2005-2006) and Chairman and Chief Executive Officer (2000-2005) of IMS Health, Inc. (pharmaceutical and healthcare information solutions), and a Director of Fortune Brands, Inc. (consumer products, 2000-2011). |
+ The information above includes each Trustee's principal occupation during the last five years and other information relating to the experience, attributes, and skills relevant to each Trustee's qualifications to serve as a Trustee, which led to the conclusion that each Trustee should serve as a Trustee for the fund.
Advisory Board Member and Officers:
Correspondence intended for each officer and Peter S. Lynch may be sent to Fidelity Investments, 245 Summer Street, Boston, Massachusetts 02210. Officers appear below in alphabetical order.
Name, Year of Birth; Principal Occupation |
Peter S. Lynch (1944) |
Year of Election or Appointment: 2003 Member of the Advisory Board |
| Mr. Lynch also serves as Member of the Advisory Board of other Fidelity funds. Mr. Lynch is Vice Chairman and a Director of FMR and FMR Co., Inc. In addition, Mr. Lynch serves as a Trustee of Boston College and as the Chairman of the Inner-City Scholarship Fund. Previously, Mr. Lynch served on the Special Olympics International Board of Directors (1997-2006). |
Elizabeth Paige Baumann (1968) |
Year of Election or Appointment: 2012 Anti-Money Laundering (AML) Officer |
| Ms. Baumann also serves as AML Officer of other funds. She is Chief AML Officer of FMR LLC (2012-present) and is an employee of Fidelity Investments. Previously, Ms. Baumann served as Vice President and Deputy Anti-Money Laundering Officer (2007-2012). |
William C. Coffey (1969) |
Year of Election or Appointment: 2009 Assistant Secretary |
| Mr. Coffey also serves as Assistant Secretary of other funds. He is Senior Vice President and Deputy General Counsel of FMR LLC (2010-present), and is an employee of Fidelity Investments. Previously, Mr. Coffey served as Vice President and Associate General Counsel of FMR LLC (2005-2009). |
Jonathan Davis (1968) |
Year of Election or Appointment: 2010 Assistant Treasurer |
| Mr. Davis also serves as Assistant Treasurer of other funds. Mr. Davis is an employee of Fidelity Investments. Previously, Mr. Davis served as Vice President and Associate General Counsel of FMR LLC (2003-2010). |
Adrien E. Deberghes (1967) |
Year of Election or Appointment: 2008 Deputy Treasurer |
| Mr. Deberghes also serves as an officer of other funds. He is an employee of Fidelity Investments (2008-present). Prior to joining Fidelity Investments, Mr. Deberghes was Senior Vice President of Mutual Fund Administration at State Street Corporation (2007-2008), Senior Director of Mutual Fund Administration at Investors Bank & Trust (2005-2007), and Director of Finance for Dunkin' Brands (2000-2005). |
Stephanie J. Dorsey (1969) |
Year of Election or Appointment: 2010 Assistant Treasurer |
| Ms. Dorsey also serves as an officer of other funds. She is an employee of Fidelity Investments (2008-present) and has served in other fund officer roles. Prior to joining Fidelity Investments, Ms. Dorsey served as Treasurer (2004-2008) of the JPMorgan Mutual Funds and Vice President (2004-2008) of JPMorgan Chase Bank. |
Howard J. Galligan III (1966) |
Year of Election or Appointment: 2014 Chief Financial Officer |
| Mr. Galligan also serves as Chief Financial Officer of other funds. Mr. Galligan serves as President of Fidelity Pricing and Cash Management Services (FPCMS) (2014-present) and as a Director of Strategic Advisers, Inc. (2008-present). Previously, Mr. Galligan served as Chief Administrative Officer of Asset Management (2011-2014) and Chief Operating Officer and Senior Vice President of Investment Support for Strategic Advisers, Inc. (2003-2011). |
Scott C. Goebel (1968) |
Year of Election or Appointment: 2008 Secretary and Chief Legal Officer (CLO) |
| Mr. Goebel serves as Secretary and CLO of other funds. Mr. Goebel also serves as Secretary of Fidelity SelectCo, LLC (2013-present), Fidelity Investments Money Management, Inc. (FIMM) (2010-present) and Fidelity Research and Analysis Company (FRAC) (2010-present); General Counsel, Secretary, and Senior Vice President of FMR (2008-present) and FMR Co., Inc. (2008-present); Chief Legal Officer of Fidelity Management & Research (Hong Kong) Limited (2008-present); and Assistant Secretary of Fidelity Management & Research (Japan) Inc. (2008-present) and Fidelity Management & Research (U.K.) Inc. (2008-present). Previously, Mr. Goebel served as Secretary and CLO of other Fidelity funds (2008-2013), Assistant Secretary of FIMM (2008-2010), FRAC (2008-2010), and certain funds (2007-2008); and as Vice President and Secretary of Fidelity Distributors Corporation (FDC) (2005-2007). Mr. Goebel has been employed by FMR LLC or an affiliate since 2001. |
Thomas C. Hense (1964) |
Year of Election or Appointment: 2008/2010 Vice President |
| Mr. Hense also serves as Vice President of other funds (High Income (2008), Small Cap (2008), and Value (2010) funds). Previously, Mr. Hense served as a portfolio manager for Fidelity's Institutional Money Management Group (Pyramis) (2003-2008). |
Brian B. Hogan (1964) |
Year of Election or Appointment: 2009 Vice President |
| Mr. Hogan also serves as Trustee or Vice President of other funds. Mr. Hogan serves as President of FMR's Equity Division (2009-present). Previously, Mr. Hogan served as Senior Vice President, Equity Research of FMR (2006-2009) and as a portfolio manager. |
Chris Maher (1972) |
Year of Election or Appointment: 2013 Assistant Treasurer |
| Mr. Maher serves as Assistant Treasurer of other funds. Mr. Maher is Vice President of Valuation Oversight and is an employee of Fidelity Investments. Previously, Mr. Maher served as Vice President of Asset Management Compliance (2013), Vice President of FMR's Program Management Group (2010-2013), and Vice President of Valuation Oversight (2008-2010). |
Kenneth B. Robins (1969) |
Year of Election or Appointment: 2008 President and Treasurer |
| Mr. Robins also serves as an officer of other funds. Mr. Robins serves as Executive Vice President of Fidelity Investments Money Management, Inc. (FIMM) (2013-present) and is an employee of Fidelity Investments (2004-present). Previously, Mr. Robins served in other fund officer roles. |
Stephen Sadoski (1971) |
Year of Election or Appointment: 2012 Deputy Treasurer |
| Mr. Sadoski also serves as Deputy Treasurer of other funds. He is an employee of Fidelity Investments (2012-present) and has served in another fund officer role. Prior to joining Fidelity Investments, Mr. Sadoski served as an assistant chief accountant in the Division of Investment Management of the Securities and Exchange Commission (SEC) (2009-2012) and as a senior manager at Deloitte & Touche LLP (1997-2009). |
Stacie M. Smith (1974) |
Year of Election or Appointment: 2013 Deputy Treasurer |
| Ms. Smith also serves as an officer of other funds. She is an employee of Fidelity Investments (2009-present) and has served in other fund officer roles. Prior to joining Fidelity Investments, Ms. Smith served as Senior Audit Manager of Ernst & Young LLP (1996-2009). |
Renee Stagnone (1975) |
Year of Election or Appointment: 2013 Deputy Treasurer |
| Ms. Stagnone also serves as Deputy Treasurer of other funds. Ms. Stagnone is an employee of Fidelity Investments. |
Linda J. Wondrack (1964) |
Year of Election or Appointment: 2014 Chief Compliance Officer |
| Ms. Wondrack also serves as Chief Compliance Officer of other funds. Ms. Wondrack is Executive Vice President and head of the Ethics Office and Asset Management Compliance for Fidelity Investments (2012-present). Ms. Wondrack also serves as Chief Compliance Officer of Fidelity SelectCo, LLC (2014-present); Chief Compliance Officer of Impresa Management LLC (2013-present); and Chief Compliance Officer of FMR Co., Inc., Fidelity Investments Money Management, Inc., Fidelity Management & Research (Japan) Inc., Fidelity Management & Research (U.K.) Inc., Fidelity Management & Research (Hong Kong), Fidelity Management & Research Company, Pyramis Global Advisors, LLC, and Strategic Advisers, Inc., Ballyrock Investment Advisors LLC, and Northern Neck Investors LLC (2012-present). Previously, Ms. Wondrack served as Senior Vice President and Chief Compliance Officer for Columbia Management Investment Advisers, LLC (2005-2012); Chief Compliance Officer for certain funds within the Columbia Family of Funds (2007-2012); and Senior Vice President of Compliance Risk Management at Bank of America (2005-2010). |
Joseph F. Zambello (1957) |
Year of Election or Appointment: 2011 Deputy Treasurer |
| Mr. Zambello also serves as Deputy Treasurer of other funds. Mr. Zambello is an employee of Fidelity Investments. Previously, Mr. Zambello served as Vice President of FMR's Program Management Group (2009-2011) and Vice President of the Transfer Agent Oversight Group (2005-2009). |
Annual Report
The Board of Trustees of Fidelity Series Small Cap Opportunities Fund voted to pay to shareholders of record at the opening of business on record date, the following distributions per share derived from capital gains realized from sales of portfolio securities; and dividends derived from net investment income:
| Pay Date | Record Date | Dividends | Capital Gains |
Fidelity Series Small Cap
Opportunities Fund | 09/15/14 | 09/12/14 | $0.015 | $0.614 |
Class F | 09/15/14 | 09/12/14 | $0.03 | $0.614 |
The fund hereby designates as a capital gain dividend with respect to the taxable year ended July 31, 2014, $260,636,570, or, if subsequently determined to be different, the net capital gain of such year.
Series Small Cap Opportunities designates 27% and 23%; and Class F designates 25% and 21% of the dividends distributed in September and December respectively during the fiscal year as qualifying for the dividends-received deduction for corporate shareholders.
Series Small Cap Opportunities designates 31% and 25%; and Class F designates 29% and 23% of the dividends distributed in September and December, respectively during the fiscal year as amounts which may be taken into account as a dividend for purposes of the maximum rate under section 1(h)(11) of the Internal Revenue Code.
The fund will notify shareholders in January 2015 of amounts for use in preparing 2014 income tax returns.
Annual Report
Board Approval of Investment Advisory Contracts and Management Fees
Fidelity Series Small Cap Opportunities Fund
Each year, the Board of Trustees, including the Independent Trustees (together, the Board), votes on the renewal of the management contract with Fidelity Management & Research Company (FMR) and the sub-advisory agreements (together, the Advisory Contracts) for the fund. The Board, assisted by the advice of fund counsel and Independent Trustees' counsel, requests and considers a broad range of information relevant to the renewal of the Advisory Contracts throughout the year.
The Board meets regularly and, at each of its meetings, covers an extensive agenda of topics and materials and considers factors that are relevant to its annual consideration of the renewal of the fund's Advisory Contracts, including the services and support provided to the fund and its shareholders. The Board has established various standing committees (Committees), each composed of and chaired by Independent Trustees with varying backgrounds, to which the Board has assigned specific subject matter responsibilities in order to enhance effective decision-making by the Board. The Board, acting directly and through its Committees, requests and receives information concerning the annual consideration of the renewal of the fund's Advisory Contracts. The Board also meets as needed to consider matters specifically related to the Board's annual consideration of the renewal of the Advisory Contracts. Members of the Board may also meet with trustees of other Fidelity funds through ad hoc joint committees to discuss certain matters relevant to the Fidelity funds.
At its July 2014 meeting, the Board, including the Independent Trustees, unanimously determined to renew the fund's Advisory Contracts. In reaching its determination, the Board considered all factors it believed relevant, including (i) the nature, extent, and quality of the services to be provided to the fund and its shareholders (including the investment performance of the fund); (ii) the competitiveness of the fund's management fee and total expense ratio relative to peer funds; (iii) the total costs of the services to be provided by and the profits to be realized by Fidelity from its relationship with the fund; (iv) the extent to which economies of scale exist and would be realized as the fund grows; and (v) whether fee levels reflect these economies of scale, if any, for the benefit of fund shareholders. In connection with separate internal corporate reorganizations involving Fidelity Management & Research (U.K.) Inc. (FMR U.K.) and Fidelity Management & Research (Japan) Inc. (FMR Japan), the Board approved certain non-material amendments to the fund's sub-advisory agreements with FMR U.K. and FMR Japan to reflect that, after these reorganizations, FMR Investment Management (UK) Limited and Fidelity Management & Research (Japan) Limited will carry on the business of FMR U.K. and FMR Japan, respectively. The Board noted that no changes to the portfolio managers or to the foreign research or investment advisory services provided to the fund were expected in connection with either reorganization and that the same personnel and resources would continue to be available to the fund at the new entities.
Annual Report
In considering whether to renew the Advisory Contracts for the fund, the Board reached a determination, with the assistance of fund counsel and Independent Trustees' counsel and through the exercise of its business judgment, that the renewal of the Advisory Contracts was in the best interests of the fund and its shareholders and that the compensation payable under the Advisory Contracts was fair and reasonable. The Board's decision to renew the Advisory Contracts was not based on any single factor, but rather was based on a comprehensive consideration of all the information provided to the Board at its meetings throughout the year. The Board, in reaching its determination to renew the Advisory Contracts, was aware that shareholders of the fund have a broad range of investment choices available to them, including a wide choice among funds offered by Fidelity's competitors, and that the fund's shareholders, who have the opportunity to review and weigh the disclosure provided by the fund in its prospectus and other public disclosures, have chosen to invest in this fund, which is part of the Fidelity family of funds.
Nature, Extent, and Quality of Services Provided. The Board considered Fidelity's staffing as it relates to the fund, including the backgrounds of investment personnel of FMR and the sub-advisers (together, the Investment Advisers), and also considered the fund's investment objective, strategies, and related investment philosophy. The Independent Trustees also had discussions with senior management of Fidelity's investment operations and investment groups. The Board considered the structure of the portfolio manager compensation program and whether this structure provides appropriate incentives to act in the best interests of the fund. Additionally, the Board considered the portfolio managers' investments, if any, in the funds that they manage.
Resources Dedicated to Investment Management and Support Services. The Board and the Fund Oversight and Research Committees reviewed the general qualifications and capabilities of Fidelity's investment staff, including its size, education, experience, and resources, as well as Fidelity's approach to recruiting, training, managing, and compensating investment personnel. The Board noted that Fidelity has continued to increase the resources devoted to non-U.S. offices, including expansion of Fidelity's global investment organization. The Board also noted that Fidelity's analysts have extensive resources, tools and capabilities that allow them to conduct sophisticated quantitative and fundamental analysis, as well as credit analysis of issuers, counterparties and guarantors. Further, the Board believes that Fidelity's investment professionals have sufficient access to global information and data so as to provide competitive investment results over time, and that those professionals also have access to sophisticated tools that permit them to assess portfolio construction and risk and performance attribution characteristics continuously, as well as to transmit new information and research conclusions rapidly around the world. Additionally, in its deliberations, the Board considered Fidelity's trading and risk management capabilities and resources and global compliance infrastructure, which are an integral part of the investment management process.
Annual Report
Board Approval of Investment Advisory Contracts and
Management Fees - continued
Shareholder and Administrative Services. The Board considered (i) the nature, extent, quality, and cost of advisory, administrative, and shareholder services performed by the Investment Advisers and their affiliates under the Advisory Contracts and under separate agreements covering transfer agency, pricing and bookkeeping, and securities lending services for the fund; (ii) the nature and extent of the supervision of third party service providers, principally custodians and subcustodians; and (iii) the resources devoted to, and the record of compliance with, the fund's compliance policies and procedures. The Board also reviewed the allocation of fund brokerage, including allocations to brokers affiliated with the Investment Advisers, the use of brokerage commissions to pay fund expenses, and the use of "soft" commission dollars to pay for research services.
The Board noted that the growth of fund assets over time across the complex allows Fidelity to reinvest in the development of services designed to enhance the value or convenience of the Fidelity funds as investment vehicles. These services include 24-hour access to account information and market information through telephone representatives and over the Internet, investor education materials and asset allocation tools, and the expanded availability of Fidelity Investor Centers.
In 2014, the Board formed an ad hoc Committee on Transfer Agency Fees to review the variety of transfer agency fee structures throughout the industry and Fidelity's competitive positioning with respect to industry participants.
Investment in a Large Fund Family. The Board considered the benefits to shareholders of investing in a Fidelity fund, including the benefits of investing in a fund that is part of a large family of funds offering a variety of investment disciplines and providing a large variety of mutual fund investor services. The Board noted that Fidelity had taken, or had made recommendations that resulted in the Fidelity funds taking, a number of actions over the previous year that benefited particular funds, including (i) continuing to dedicate additional resources to investment research and to the support of the senior management team that oversees asset management; (ii) persisting in efforts to enhance Fidelity's global research capabilities; (iii) launching new funds and making other enhancements to meet client needs for income-oriented solutions; (iv) reducing fund expenses for certain index funds; (v) continuing to launch dedicated lower cost underlying funds to meet portfolio construction needs related to expanding underlying fund options for Fidelity funds of funds, specifically for the Freedom Fund product lines; (vi) rationalizing product lines and gaining increased efficiencies through fund mergers; (vii) launching sector-based exchange-traded funds and establishing a new Fidelity adviser to manage sector-based funds and products; (viii) continuing to develop and implement technology to improve security and increase efficiency; (ix) modifying the eligibility criteria for certain share classes to increase their marketability to a portion of the defined contribution plan market; (x) waiving redemption fees for certain qualified fund-of-fund and wrap programs and certain retirement plan transactions; and (xi) launching new Institutional Class shares of certain money market funds to attract and retain assets and to fill a gap in the money market fund lineup.
Annual Report
Investment Performance. The Board considered whether the fund has operated in accordance with its investment objective, as well as its record of compliance with its investment restrictions and its performance history. The Board noted that there was a portfolio management change for a sleeve of the fund in January 2013, April 2013 and October 2013.
The Board took into account discussions with the Investment Advisers about fund investment performance that occur at Board meetings throughout the year. In this regard the Board noted that as part of regularly scheduled fund reviews and other reports to the Board on fund performance, the Board periodically considers annualized return information for the fund, for different time periods, measured against a securities market index ("benchmark index") and a peer group of funds with similar objectives ("peer group"). In its evaluation of fund investment performance, the Board gave particular attention to information indicating changes in performance of certain Fidelity funds for specific time periods and the Investment Advisers' explanations for any overperformance or underperformance.
In addition to reviewing absolute and relative fund performance, the Independent Trustees periodically consider the appropriateness of fund performance metrics in evaluating the results achieved. In general, the Independent Trustees believe that fund performance should be evaluated based on net performance (after fees and expenses) of both the highest performing and lowest performing classes, where applicable, compared to appropriate benchmark indices, over appropriate time periods which may include full market cycles, and compared to peer groups, as applicable, over the same periods, taking into account relevant factors including the following: general market conditions; issuer-specific information; tactical opportunities for investment; and fund cash flows and other factors.
The Independent Trustees recognize that shareholders evaluate performance on a net basis over their own holding periods, for which one-, three-, and five-year periods are often used as a proxy. For this reason, the performance information reviewed by the Board also included net cumulative calendar year total return information for the fund and an appropriate benchmark index and peer group for the most recent one-, three-, and five-year periods, as shown below. Returns are shown compared to the 25th percentile (top of box, 75% beaten) and 75th percentile (bottom of box, 25% beaten) of the peer universe.
Annual Report
Board Approval of Investment Advisory Contracts and
Management Fees - continued
Fidelity Series Small Cap Opportunities Fund
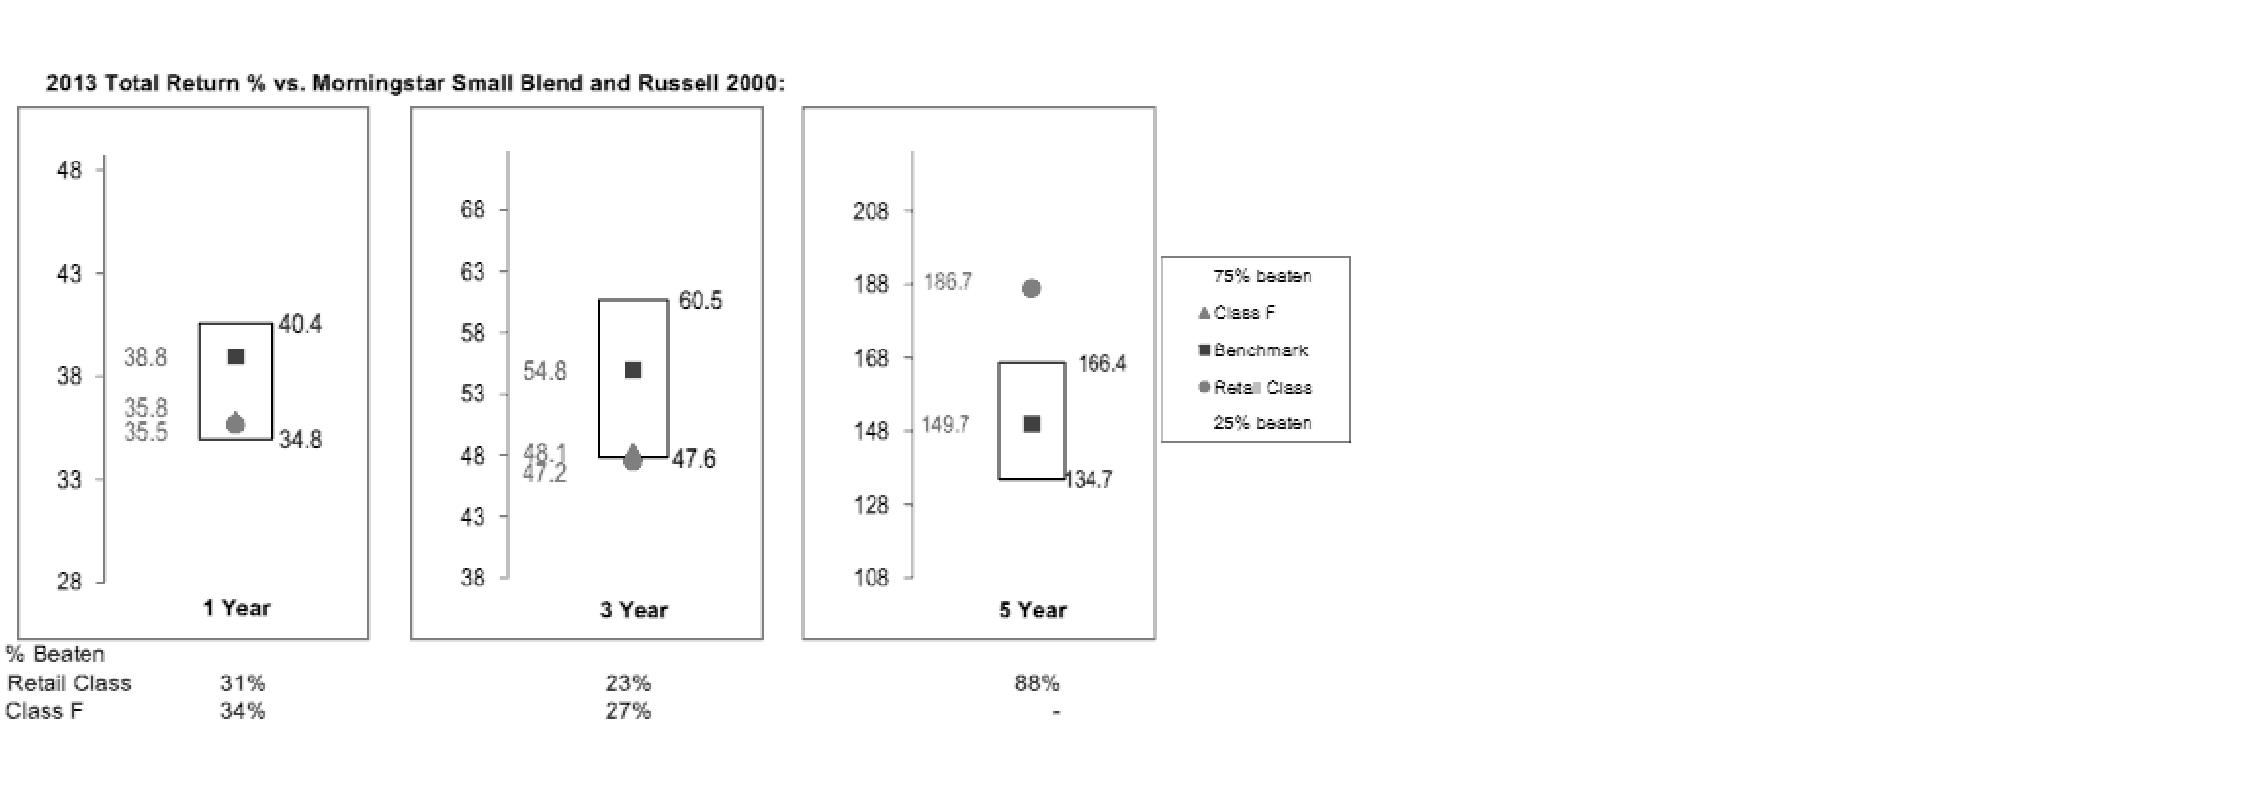
The Board has discussed the fund's underperformance with FMR and has engaged with FMR to consider what steps might be taken to remediate the fund's underperformance.
The Board also considered that the fund's management fee is subject to upward or downward adjustment depending upon whether, and to what extent, the fund's investment performance for the performance period exceeds, or is exceeded by, a securities index, thus leading to a performance adjustment for the same period. The Board noted that the performance adjustment provides FMR with a strong economic incentive to seek to achieve superior performance for the fund's shareholders and helps to more closely align the interests of FMR and the fund's shareholders.
Based on its review, the Board concluded that the nature, extent, and quality of services provided to the fund under the Advisory Contracts should benefit the fund's shareholders.
Competitiveness of Management Fee and Total Expense Ratio. The Board considered the fund's management fee and total expense ratio compared to "mapped groups" of competitive funds and classes. Fidelity creates "mapped groups" by combining similar Lipper investment objective categories that have comparable investment mandates. Combining Lipper investment objective categories aids the Board's management fee and total expense ratio comparisons by broadening the competitive group used for comparison and by reducing the number of universes to which various Fidelity funds are compared.
Annual Report
Management Fee. The Board considered two proprietary management fee comparisons for the 12-month periods shown in the chart below. The group of Lipper funds used by the Board for management fee comparisons is referred to below as the "Total Mapped Group." The Total Mapped Group comparison focuses on a fund's standing in terms of gross management fees before expense reimbursements or caps, and without giving effect to the fund's performance adjustment, relative to the total universe of funds with comparable investment mandates, regardless of whether their management fee structures also are comparable. Funds with comparable investment mandates offer exposure to similar types of securities. Funds with comparable management fee structures have similar management fee contractual arrangements (e.g., flat rate charged for advisory services, all-inclusive fee rate, etc.). "TMG %" represents the percentage of funds in the Total Mapped Group that had management fees that were lower than the fund's. For example, a hypothetical TMG % of 20% would mean that 80% of the funds in the Total Mapped Group had higher, and 20% had lower, management fees than the fund. The fund's actual TMG %s are in the chart below. The "Asset-Size Peer Group" (ASPG) comparison focuses on a fund's standing relative to a subset of non-Fidelity funds within the Total Mapped Group that are similar in size and management fee structure. For example, if a fund is in the first quartile of the ASPG, the fund's management fee ranks in the least expensive or lowest 25% of funds in the ASPG. The ASPG represents at least 15% of the funds in the Total Mapped Group with comparable asset size and management fee structures, subject to a minimum of 50 funds (or all funds in the Total Mapped Group if fewer than 50). Additional information, such as the ASPG quartile in which the fund's management fee rate ranked and the impact of the fund's performance adjustment, is also included in the chart and considered by the Board.
Annual Report
Board Approval of Investment Advisory Contracts and
Management Fees - continued
Fidelity Series Small Cap Opportunities Fund
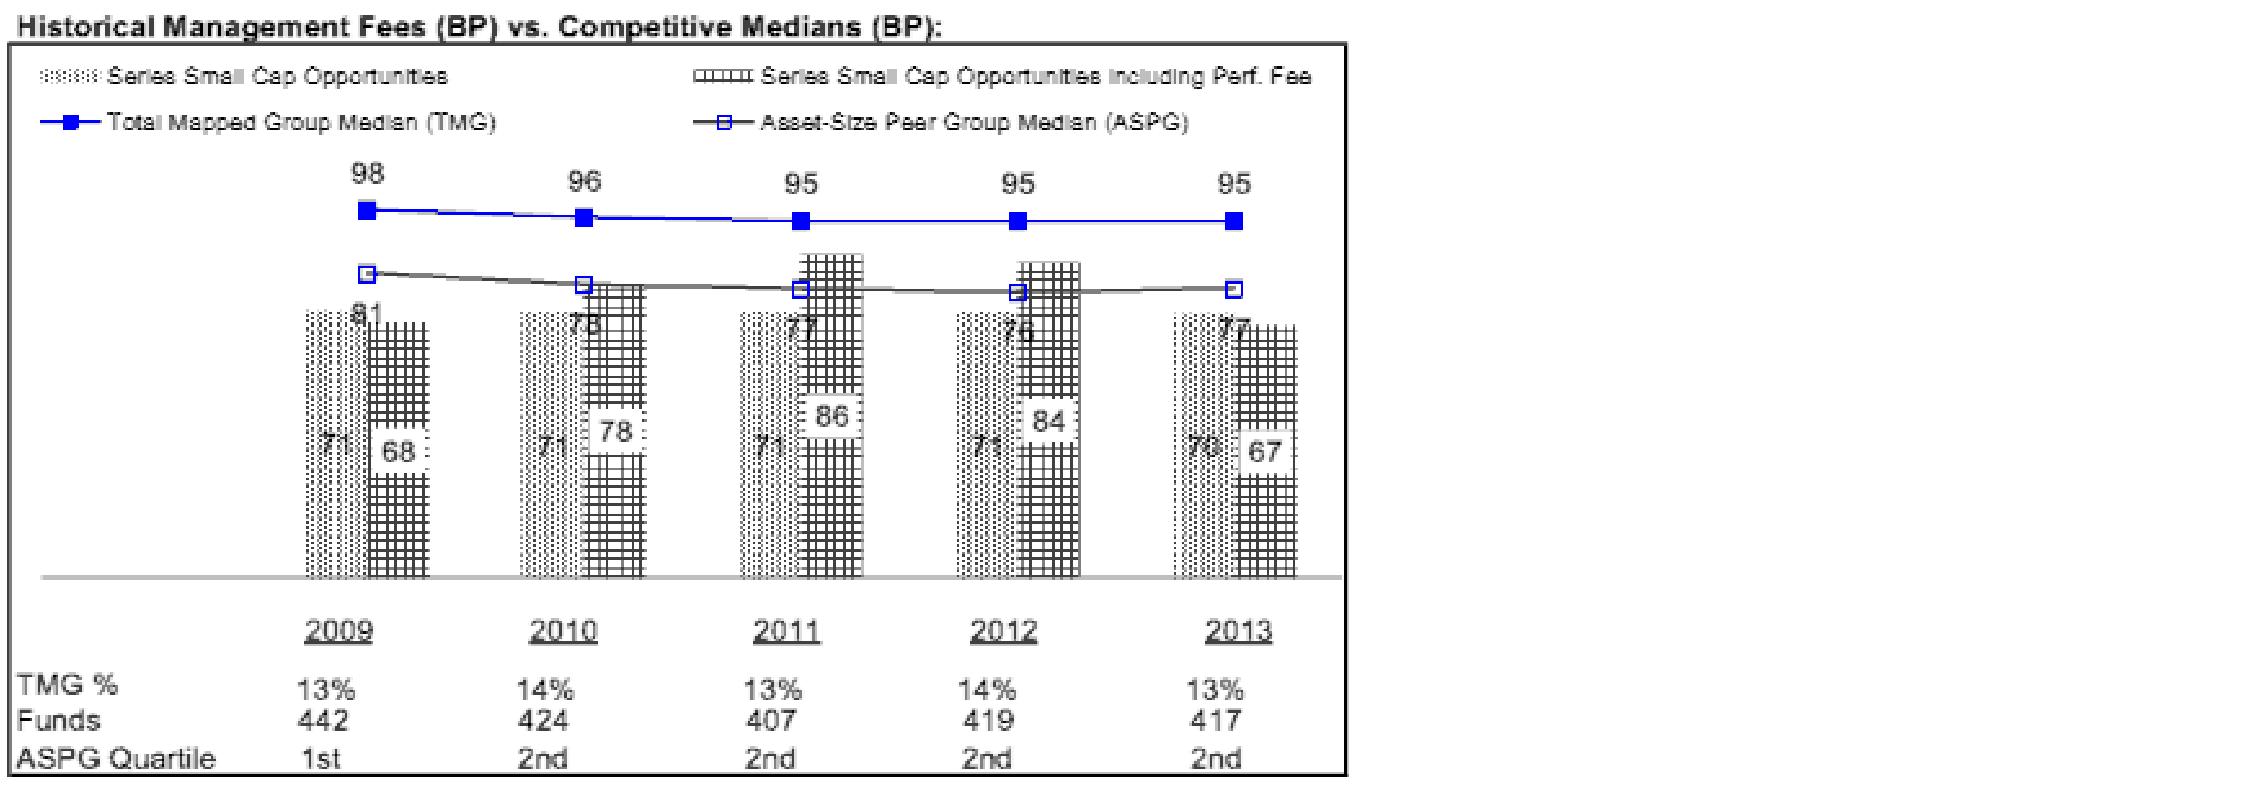
The Board noted that the fund's management fee rate ranked below the median of its Total Mapped Group and below the median of its ASPG for 2013. The Board also noted the effect of the fund's negative performance adjustment on the fund's management fee ranking.
The Board also noted that, in August 2013, the ad hoc Committee on Management Fees was formed to conduct an in-depth review of the management fee rates of Fidelity's active equity mutual funds. The Committee focused on the following areas: (i) standard fee structures; (ii) research consumption and trading evolution; (iii) management fee competitiveness/profitability by category; and (iv) factors that drive institutional pricing.
Based on its review, the Board concluded that the fund's management fee is fair and reasonable in light of the services that the fund receives and the other factors considered.
Total Expense Ratio. In its review of each class's total expense ratio, the Board considered the fund's management fee as well as other fund or class expenses, as applicable, such as transfer agent fees, pricing and bookkeeping fees, and custodial, legal, and audit fees. The Board also noted the effects of any waivers and reimbursements on fees and expenses, as well as the impact of the fund's performance adjustment. As part of its review, the Board also considered the current and historical total expense ratios of each class of the fund compared to competitive fund median expenses. Each class of the fund is compared to those funds and classes in the Total Mapped Group (used by the Board for management fee comparisons) that have a similar sales load structure.
Annual Report
The Board noted that the total expense ratio of each class ranked below its competitive median for 2013.
Fees Charged to Other Fidelity Clients. The Board also considered Fidelity fee structures and other information with respect to clients of Fidelity, such as other funds advised or subadvised by Fidelity, pension plan clients, and other institutional clients. The Board noted the findings of the 2013 ad hoc joint committee (created with the board of other Fidelity funds), which reviewed and compared Fidelity's institutional investment advisory business with its business of providing services to the Fidelity funds, including the differences in services provided, fees charged, and costs incurred, as well as competition in their respective marketplaces.
Based on its review of total expense ratios and fees charged to other Fidelity clients, the Board concluded that the total expense ratio of each class of the fund was reasonable in light of the services that the fund and its shareholders receive and the other factors considered.
Costs of the Services and Profitability. The Board considered the revenues earned and the expenses incurred by Fidelity in conducting the business of developing, marketing, distributing, managing, administering and servicing the fund and servicing the fund's shareholders. The Board also considered the level of Fidelity's profits in respect of all the Fidelity funds.
On an annual basis, Fidelity presents to the Board Fidelity's profitability for the fund. Fidelity calculates the profitability for each fund, as well as aggregate profitability for groups of Fidelity funds and all Fidelity funds, using a series of detailed revenue and cost allocation methodologies which originate with the books and records of Fidelity on which Fidelity's audited financial statements are based. The Audit Committee of the Board reviews any significant changes from the prior year's methodologies.
PricewaterhouseCoopers LLP (PwC), independent registered public accounting firm and auditor to Fidelity and certain Fidelity funds, has been engaged annually by the Board as part of the Board's assessment of Fidelity's profitability analysis. PwC's engagement includes the review and assessment of the methodologies used by Fidelity in determining the revenues and expenses attributable to Fidelity's mutual fund business, and completion of agreed-upon procedures in respect of the mathematical accuracy of fund profitability and its conformity to established allocation methodologies. After considering PwC's reports issued under the engagement and information provided by Fidelity, the Board concluded that while other allocation methods may also be reasonable, Fidelity's profitability methodologies are reasonable in all material respects.
The Board also reviewed Fidelity's non-fund businesses and fall-out benefits related to the mutual fund business as well as cases where Fidelity's affiliates may benefit from or be related to the fund's business.
Annual Report
Board Approval of Investment Advisory Contracts and
Management Fees - continued
The Board considered the costs of the services provided by and the profits realized by Fidelity in connection with the operation of the fund and was satisfied that the profitability was not excessive in the circumstances.
Economies of Scale. The Board considered whether there have been economies of scale in respect of the management of the Fidelity funds, whether the Fidelity funds (including the fund) have appropriately benefited from any such economies of scale, and whether there is potential for realization of any further economies of scale. The Board considered the extent to which the fund will benefit from economies of scale through increased services to the fund, through waivers or reimbursements, or through fee or expense ratio reductions. The Board also noted that in 2013, it and the boards of other Fidelity funds created an ad hoc committee (the Economies of Scale Committee) to analyze whether Fidelity attains economies of scale in respect of the management and servicing of the Fidelity funds, whether the Fidelity funds have appropriately benefited from such economies of scale, and whether there is potential for realization of any further economies of scale.
The Board recognized that the fund's management contract incorporates a "group fee" structure, which provides for lower group fee rates as total group assets increase, and for higher group fee rates as total group assets decrease (with "group assets" defined to include fund assets under FMR's management plus sector fund assets previously under FMR's management and currently managed by Fidelity SelectCo, LLC). FMR calculates the group fee rates based on a tiered asset "breakpoint" schedule that varies based on asset class. The Board considered that the group fee is designed to deliver the benefits of economies of scale to fund shareholders when total Fidelity fund assets increase, even if assets of any particular fund are unchanged or have declined, because some portion of Fidelity's costs are attributable to services provided to all Fidelity funds, and all funds benefit if those costs can be allocated among more assets. The Board also considered that although the fund is offered only to other Fidelity funds, it continues to incur investment management expenses. The Board further noted that the fund may continue to realize benefits from the group fee structure, even though assets may not be expected to grow significantly at the fund level. The Board concluded that, given the group fee structure, fund shareholders will benefit from lower management fees as group assets increase at the fund complex level, regardless of whether Fidelity achieves any such economies of scale.
The Board concluded, taking into account the analysis of the Economies of Scale Committee, that economies of scale, if any, are being appropriately shared between fund shareholders and Fidelity.
Additional Information Requested by the Board. In order to develop fully the factual basis for consideration of the Fidelity funds' Advisory Contracts, the Board requested and received additional information on certain topics, including: (i) fund performance trends and Fidelity's long-term strategies for certain funds; (ii) Fidelity's strategic marketing and product lineup goals; (iii) the methodology with respect to competitive fund data and peer group classifications; (iv) the arrangements with, and performance of, certain sub-advisers on behalf of the Fidelity funds, as well as certain proposed participating affiliate arrangements; (v) the realization of fall-out benefits in certain Fidelity business units; (vi) Fidelity's group fee structures, including the rationale for the individual fee rates of certain categories of funds and the definition of group assets; (vii) trends regarding industry use of performance fee structures and the performance adjustment methodologies applicable to the Fidelity funds; (viii) additional competitive analysis regarding the total expenses for certain classes; (ix) fund profitability methodology, including Fidelity's cost allocation methodology, and the impact of certain factors on fund profitability results; and (x) the process by which Fidelity determines sub-advisory fees for funds it advises.
Annual Report
Based on its evaluation of all of the conclusions noted above, and after considering all factors it believed relevant, the Board ultimately concluded that the advisory fee structures are fair and reasonable, and that the fund's Advisory Contracts should be renewed.
Annual Report
Investment Adviser
Fidelity Management & Research Company
Boston, MA
Investment Sub-Advisers
FMR Co., Inc.
Fidelity Management & Research (U.K.) Inc.
Fidelity Management & Research
(Hong Kong) Limited
Fidelity Management & Research
(Japan) Inc.
FIL Investments (Japan) Limited
FIL Investment Advisors
FIL Investment Advisors (UK) Limited
General Distributor
Fidelity Distributors Corporation
Smithfield, RI
Transfer and Service Agents
Fidelity Investments Institutional Operations Company, Inc.
Boston, MA
Fidelity Service Company, Inc.
Boston, MA
Custodian
Citibank, N.A.
New York, NY
(Fidelity Investment logo)(registered trademark)
Corporate Headquarters
245 Summer St., Boston, MA 02210
www.fidelity.com
SMO-ANN-0914
1.839807.107
Fidelity®
Series Blue Chip Growth
Fund
Fidelity Series Blue Chip Growth
Fund
Class F
Annual Report
July 31, 2014
(Fidelity Cover Art)
Contents
Performance | (Click Here) | How the fund has done over time. |
Management's Discussion of Fund Performance | (Click Here) | The Portfolio Manager's review of fund performance and strategy. |
Shareholder Expense Example | (Click Here) | An example of shareholder expenses. |
Investment Changes | (Click Here) | A summary of major shifts in the fund's investments over the past six months. |
Investments | (Click Here) | A complete list of the fund's investments with their market values. |
Financial Statements | (Click Here) | Statements of assets and liabilities, operations, and changes in net assets, as well as financial highlights. |
Notes | (Click Here) | Notes to the financial statements. |
Report of Independent Registered Public Accounting Firm | (Click Here) | |
Trustees and Officers | (Click Here) | |
Distributions | (Click Here) | |
Board Approval of Investment Advisory Contracts and Management Fees | (Click Here) | |
To view a fund's proxy voting guidelines and proxy voting record for the 12-month period ended June 30, visit http://www.fidelity.com/proxyvotingresults or visit the Securities and Exchange Commission's (SEC) web site at http://www.sec.gov. You may also call 1-800-544-8544 for Fidelity® Series Blue Chip Growth Fund or 1-800-835-5092 for Class F of the fund to request a free copy of the proxy voting guidelines.
Standard & Poor's, S&P and S&P 500 are registered service marks of The McGraw-Hill Companies, Inc. and have been licensed for use by Fidelity Distributors Corporation.
Other third-party marks appearing herein are the property of their respective owners.
All other marks appearing herein are registered or unregistered trademarks or service marks of FMR LLC or an affiliated company. © 2014 FMR LLC. All rights reserved.
Annual Report
This report and the financial statements contained herein are submitted for the general information of the shareholders of the fund. This report is not authorized for distribution to prospective investors in the fund unless preceded or accompanied by an effective prospectus.
A fund files its complete schedule of portfolio holdings with the SEC for the first and third quarters of each fiscal year on Form N-Q. Forms N-Q are available on the SEC's web site at http://www.sec.gov. A fund's Forms N-Q may be reviewed and copied at the SEC's Public Reference Room in Washington, DC. Information regarding the operation of the SEC's Public Reference Room may be obtained by calling 1-800-SEC-0330. For a complete list of a fund's portfolio holdings, view the most recent holdings listing, semiannual report, or annual report on Fidelity's web site at http://www.fidelity.com, http://www.advisor.fidelity.com, or http://www.401k.com, as applicable.
NOT FDIC INSURED • MAY LOSE VALUE • NO BANK GUARANTEE
Neither the fund nor Fidelity Distributors Corporation is a bank.
Annual Report
Average annual total return reflects the change in the value of an investment, assuming reinvestment of the class' distributions from dividend income and capital gains (the profits earned upon the sale of securities that have grown in value, if any) and assuming a constant rate of performance each year. The $10,000 table and the fund's returns do not reflect the deduction of taxes that a shareholder would pay on fund distributions or the redemption of fund shares. During periods of reimbursement by Fidelity, a fund's total return will be greater than it would be had the reimbursement not occurred. How a fund did yesterday is no guarantee of how it will do tomorrow.
Average annual total returns take each class' cumulative total return and show you what would have happened if Fidelity® Series Blue Chip Growth Fund and Class F shares had performed at a constant rate each year. These numbers will be reported once the fund is a year old.
$10,000 Over Life of Fund
Let's say hypothetically that $10,000 was invested in Fidelity ® Series Blue Chip Growth Fund, a class of the fund, on November 7, 2013, when the fund started. The chart shows how the value of your investment would have changed, and also shows how the Russell 1000® Growth Index performed over the same period.
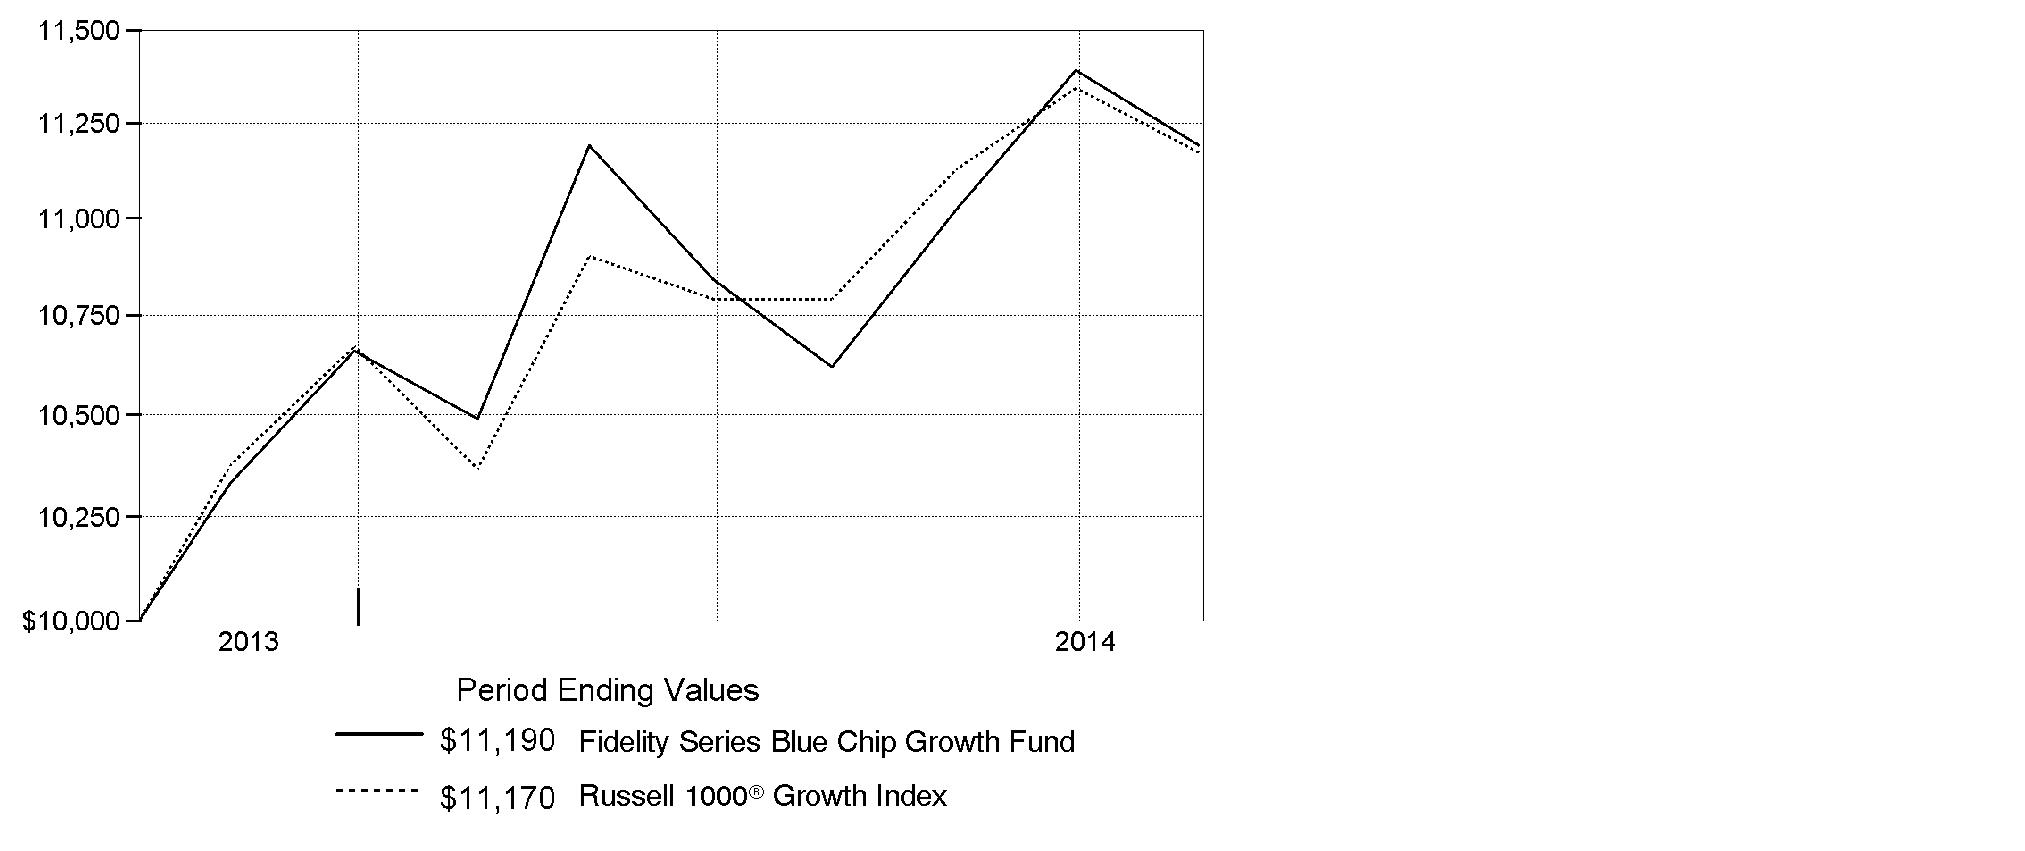
Annual Report
Market Recap: U.S. stocks overcame a slowing economy early in 2014 to post a strong gain for the period from November 7, 2013, through July 31, 2014, supported by healthy corporate profits and continued low interest rates. The S&P 500® Index rose 12.13%, reaching an all-time high near period end. The technology-heavy Nasdaq Composite Index® rose 14.24%, driven by advancing shares of Apple, Facebook, Google and other large-cap companies. Among S&P 500® sectors, information technology (+18%) led the way amid strong demand for hardware, software and semiconductors. Health care (+17%) also performed well, with hefty contributions from pharmaceuticals, biotechnology & life sciences companies. Materials (+13%) rose amid higher prices for many commodity products. Energy (+13%) advanced due to strong global demand for crude oil, healthy U.S. output and the threat of supply disruptions in Iraq. Conversely, consumer staples (+2%) proved the worst performer, as many investors preferred to invest in stock sectors with more exposure to the growing economy. Volatility remained tame overall, with markets supported by declining unemployment, near-record profit margins for companies, muted cost inflation and low corporate debt levels. Geopolitical tensions remained a concern at period end, however, with conflict in Ukraine and strained relations between Russia and the West posing a potential threat to global growth.
Comments from Sonu Kalra, Portfolio Manager of Fidelity® Series Blue Chip Growth Fund: For the abbreviated period, the fund's Series Blue Chip Growth and Class F shares advanced 11.90% and 12.03%, respectively, outpacing the 11.70% gain of the Russell 1000® Growth Index. The largest contributor to relative performance was the fund's overweighted position in specialty coffee company Keurig Green Mountain (formerly Green Mountain Coffee Roasters). Shares soared during the abbreviated period, including a more than 20% rise in early February after the company announced an agreement with Coca-Cola to allow consumers to produce cold carbonated beverages at home. The new division, "Keurig Cold," will include single-serve packs compatible with the company's upcoming cold-brewing machines. The stock jumped again in May when the firm announced quarterly earnings that beat analysts' estimates. I continued to maintain the overweighting, as I believed the cold beverage and international growth prospects for the company were undervalued by the market. Conversely, electronics retailer Best Buy was the fund's largest individual detractor. I had thought that the CEO's new strategy would help turn the business around, but the stock hit a pitfall in January when the firm announced disappointing sales and declining revenue for the holiday season. I sold our position in Best Buy by period end.
The views expressed above reflect those of the portfolio manager(s) only through the end of the period as stated on the cover of this report and do not necessarily represent the views of Fidelity or any other person in the Fidelity organization. Any such views are subject to change at any time based upon market or other conditions and Fidelity disclaims any responsibility to update such views. These views may not be relied on as investment advice and, because investment decisions for a Fidelity fund are based on numerous factors, may not be relied on as an indication of trading intent on behalf of any Fidelity fund.
Annual Report
Shareholder Expense Example
As a shareholder of the Fund, you incur two types of costs: (1) transaction costs, and (2) ongoing costs, including management fees and other Fund expenses. This Example is intended to help you understand your ongoing costs (in dollars) of investing in the Fund and to compare these costs with the ongoing costs of investing in other mutual funds.
The Example is based on an investment of $1,000 invested at the beginning of the period and held for the entire period (February 1, 2014 to July 31, 2014).
Actual Expenses
The first line of the accompanying table for each class of the Fund provides information about actual account values and actual expenses. You may use the information in this line, together with the amount you invested, to estimate the expenses that you paid over the period. Simply divide your account value by $1,000.00 (for example, an $8,600 account value divided by $1,000.00 = 8.6), then multiply the result by the number in the first line for a class of the Fund under the heading entitled "Expenses Paid During Period" to estimate the expenses you paid on your account during this period. In addition, the Fund, as a shareholder in the underlying Fidelity Central Funds, will indirectly bear its pro-rata share of the fees and expenses incurred by the underlying Fidelity Central Funds. These fees and expenses are not included in the Fund's annualized expense ratio used to calculate the expense estimate in the table below.
Hypothetical Example for Comparison Purposes
The second line of the accompanying table for each class of the Fund provides information about hypothetical account values and hypothetical expenses based on a Class' actual expense ratio and an assumed rate of return of 5% per year before expenses, which is not the Class' actual return. The hypothetical account values and expenses may not be used to estimate the actual ending account balance or expenses you paid for the period. You may use this information to compare the ongoing costs of investing in the Fund and other funds. To do so, compare this 5% hypothetical example with the 5% hypothetical examples that appear in the shareholder reports of the other funds. In addition, the Fund, as a shareholder in the underlying Fidelity Central Funds, will indirectly bear its pro-rata share of the fees and expenses incurred by the underlying Fidelity Central Funds. These fees and expenses are not included in the Fund's annualized expense ratio used to calculate the expense estimate in the table below.
Please note that the expenses shown in the table are meant to highlight your ongoing costs only and do not reflect any transaction costs. Therefore, the second line of the table is useful in comparing ongoing costs only, and will not help you determine the relative total costs of owning different funds.
Annual Report
Shareholder Expense Example - continued
| Annualized
Expense RatioB | Beginning
Account Value
February 1, 2014 | Ending
Account Value
July 31, 2014 | Expenses Paid
During Period*
February 1, 2014
to July 31, 2014 |
Series Blue Chip Growth | .74% | | | |
Actual | | $ 1,000.00 | $ 1,066.80 | $ 3.79 |
HypotheticalA | | $ 1,000.00 | $ 1,021.12 | $ 3.71 |
Class F | .57% | | | |
Actual | | $ 1,000.00 | $ 1,067.70 | $ 2.92 |
HypotheticalA | | $ 1,000.00 | $ 1,021.97 | $ 2.86 |
A 5% return per year before expenses
B Annualized expense ratio reflects expenses net of applicable fee waivers.
* Expenses are equal to each Class' annualized expense ratio, multiplied by the average account value over the period, multiplied by 181/365 (to reflect the one-half year period).
Annual Report
Investment Changes (Unaudited)
Top Ten Stocks as of July 31, 2014 |
| % of fund's
net assets | % of fund's net assets
6 months ago |
Apple, Inc. | 6.6 | 3.7 |
Google, Inc. Class A | 2.9 | 6.0 |
Gilead Sciences, Inc. | 2.7 | 3.2 |
Google, Inc. Class C | 2.6 | 0.0 |
Facebook, Inc. Class A | 2.4 | 2.8 |
Amazon.com, Inc. | 2.2 | 2.3 |
Home Depot, Inc. | 1.6 | 1.5 |
The Walt Disney Co. | 1.6 | 0.3 |
Keurig Green Mountain, Inc. | 1.5 | 1.3 |
Biogen Idec, Inc. | 1.5 | 1.5 |
| 25.6 | |
Top Five Market Sectors as of July 31, 2014 |
| % of fund's
net assets | % of fund's net assets
6 months ago |
Information Technology | 33.3 | 31.1 |
Consumer Discretionary | 20.8 | 21.2 |
Health Care | 15.4 | 16.4 |
Industrials | 9.2 | 10.5 |
Consumer Staples | 9.0 | 10.5 |
Asset Allocation (% of fund's net assets) |
As of July 31, 2014* | As of January 31, 2014** |
| Stocks 98.9% | | | Stocks 100.0% | |
| Convertible
Securities 0.5% | |  | Convertible
Securities 0.0% | |
| Short-Term
Investments and
Net Other Assets (Liabilities) 0.6% | | | Short-Term
Investments and
Net Other Assets (Liabilities) 0.0% | |
* Foreign investments | 10.1% | | ** Foreign investments | 9.5% | |

Annual Report
Investments July 31, 2014
Showing Percentage of Net Assets
Common Stocks - 98.9% |
| Shares | | Value |
CONSUMER DISCRETIONARY - 20.8% |
Auto Components - 0.4% |
Johnson Controls, Inc. | 264,900 | | $ 12,513,876 |
Magna International, Inc. Class A (sub. vtg.) | 153,775 | | 16,513,518 |
| | 29,027,394 |
Automobiles - 0.3% |
Tesla Motors, Inc. (a) | 103,737 | | 23,164,472 |
Diversified Consumer Services - 0.3% |
H&R Block, Inc. | 626,300 | | 20,123,019 |
ServiceMaster Global Holdings, Inc. | 236,500 | | 4,155,305 |
| | 24,278,324 |
Hotels, Restaurants & Leisure - 5.2% |
500.com Ltd. sponsored ADR Class A (d) | 166,700 | | 6,149,563 |
Buffalo Wild Wings, Inc. (a) | 37,114 | | 5,393,406 |
China Lodging Group Ltd. ADR (a) | 107,900 | | 2,692,105 |
Chipotle Mexican Grill, Inc. (a) | 106,900 | | 71,890,250 |
Domino's Pizza, Inc. | 55,600 | | 4,003,200 |
Dunkin' Brands Group, Inc. | 207,100 | | 8,876,306 |
Fiesta Restaurant Group, Inc. (a) | 122,000 | | 5,536,360 |
Hilton Worldwide Holdings, Inc. | 236,800 | | 5,732,928 |
Home Inns & Hotels Management, Inc. sponsored ADR (a) | 149,578 | | 5,336,943 |
Hyatt Hotels Corp. Class A (a) | 288,500 | | 16,972,455 |
Las Vegas Sands Corp. | 1,020,600 | | 75,371,310 |
Melco Crown Entertainment Ltd. sponsored ADR | 263,500 | | 8,748,200 |
MGM Mirage, Inc. (a) | 580,200 | | 15,572,568 |
Multimedia Games Holding Co., Inc. (a) | 127,052 | | 3,064,494 |
Panera Bread Co. Class A (a) | 162,844 | | 23,986,921 |
Starbucks Corp. | 1,199,310 | | 93,162,401 |
Whitbread PLC | 156,724 | | 11,385,615 |
Wynn Resorts Ltd. | 51,100 | | 10,894,520 |
Yum! Brands, Inc. | 492,251 | | 34,162,219 |
Zoe's Kitchen, Inc. (d) | 82,100 | | 2,381,721 |
| | 411,313,485 |
Household Durables - 0.4% |
D.R. Horton, Inc. | 530,300 | | 10,977,210 |
Whirlpool Corp. | 127,100 | | 18,129,544 |
| | 29,106,754 |
Internet & Catalog Retail - 4.2% |
Amazon.com, Inc. (a) | 568,080 | | 177,803,359 |
Ctrip.com International Ltd. sponsored ADR (a) | 189,743 | | 12,149,244 |
Expedia, Inc. | 138,854 | | 11,027,785 |
Common Stocks - continued |
| Shares | | Value |
CONSUMER DISCRETIONARY - continued |
Internet & Catalog Retail - continued |
Groupon, Inc. Class A (a)(d) | 748,200 | | $ 4,840,854 |
HomeAway, Inc. (a) | 180,200 | | 6,256,544 |
MakeMyTrip Ltd. (a) | 159,400 | | 4,825,038 |
Netflix, Inc. (a) | 32,278 | | 13,644,556 |
priceline.com, Inc. (a) | 73,400 | | 91,195,830 |
RetailMeNot, Inc. (d) | 106,707 | | 2,610,053 |
Vipshop Holdings Ltd. ADR (a)(d) | 51,625 | | 10,611,003 |
| | 334,964,266 |
Media - 3.4% |
Comcast Corp. Class A | 2,165,500 | | 116,352,315 |
DISH Network Corp. Class A (a) | 113,800 | | 7,039,668 |
Lions Gate Entertainment Corp. | 135,400 | | 4,170,320 |
Naspers Ltd. Class N | 27,200 | | 3,375,408 |
The Walt Disney Co. | 1,450,217 | | 124,544,636 |
Time Warner Cable, Inc. | 56,960 | | 8,264,896 |
Time Warner, Inc. | 108,200 | | 8,982,764 |
| | 272,730,007 |
Multiline Retail - 1.1% |
Dollar General Corp. (a) | 79,700 | | 4,401,831 |
Macy's, Inc. | 657,800 | | 38,014,262 |
Target Corp. | 758,341 | | 45,189,540 |
| | 87,605,633 |
Specialty Retail - 3.8% |
Abercrombie & Fitch Co. Class A | 211,063 | | 8,303,218 |
AutoZone, Inc. (a) | 6,174 | | 3,192,143 |
Home Depot, Inc. | 1,544,500 | | 124,872,825 |
L Brands, Inc. | 362,714 | | 21,026,531 |
Lumber Liquidators Holdings, Inc. (a) | 94,100 | | 5,102,102 |
Murphy U.S.A., Inc. (a) | 381,100 | | 18,833,962 |
Restoration Hardware Holdings, Inc. (a) | 483,077 | | 39,510,868 |
Ross Stores, Inc. | 478,638 | | 30,824,287 |
TJX Companies, Inc. | 865,300 | | 46,111,837 |
| | 297,777,773 |
Textiles, Apparel & Luxury Goods - 1.7% |
G-III Apparel Group Ltd. (a) | 31,400 | | 2,438,838 |
Kate Spade & Co. (a) | 705,156 | | 26,676,051 |
lululemon athletica, Inc. (a) | 201,030 | | 7,733,624 |
Michael Kors Holdings Ltd. (a) | 315,000 | | 25,666,200 |
NIKE, Inc. Class B | 278,400 | | 21,472,992 |
Common Stocks - continued |
| Shares | | Value |
CONSUMER DISCRETIONARY - continued |
Textiles, Apparel & Luxury Goods - continued |
Pandora A/S | 117,200 | | $ 8,048,791 |
PVH Corp. | 218,328 | | 24,055,379 |
Ralph Lauren Corp. | 96,400 | | 15,024,904 |
Under Armour, Inc. Class A (sub. vtg.) (a) | 13,400 | | 894,450 |
| | 132,011,229 |
TOTAL CONSUMER DISCRETIONARY | | 1,641,979,337 |
CONSUMER STAPLES - 9.0% |
Beverages - 2.7% |
Anheuser-Busch InBev SA NV ADR | 219,900 | | 23,744,802 |
Monster Beverage Corp. (a) | 496,081 | | 31,729,341 |
PepsiCo, Inc. | 884,986 | | 77,967,267 |
The Coca-Cola Co. | 1,978,281 | | 77,726,660 |
| | 211,168,070 |
Food & Staples Retailing - 2.4% |
Costco Wholesale Corp. | 423,900 | | 49,825,206 |
CVS Caremark Corp. | 912,500 | | 69,678,500 |
Kroger Co. | 939,759 | | 46,029,396 |
Sprouts Farmers Market LLC (d) | 463,423 | | 14,139,036 |
Whole Foods Market, Inc. | 357,360 | | 13,658,299 |
| | 193,330,437 |
Food Products - 2.4% |
Associated British Foods PLC | 200,200 | | 9,389,575 |
Bunge Ltd. | 183,600 | | 14,475,024 |
Dean Foods Co. | 137,800 | | 2,111,096 |
Keurig Green Mountain, Inc. | 1,003,400 | | 119,685,552 |
Mead Johnson Nutrition Co. Class A | 425,300 | | 38,889,432 |
WhiteWave Foods Co. (a) | 228,129 | | 6,795,963 |
| | 191,346,642 |
Household Products - 0.6% |
Procter & Gamble Co. | 540,200 | | 41,768,264 |
Svenska Cellulosa AB (SCA) (B Shares) | 274,100 | | 6,774,818 |
| | 48,543,082 |
Personal Products - 0.3% |
Coty, Inc. Class A | 249,800 | | 4,274,078 |
Common Stocks - continued |
| Shares | | Value |
CONSUMER STAPLES - continued |
Personal Products - continued |
Herbalife Ltd. | 283,138 | | $ 14,836,431 |
Natura Cosmeticos SA | 43,100 | | 671,173 |
| | 19,781,682 |
Tobacco - 0.6% |
Lorillard, Inc. | 741,252 | | 44,830,921 |
TOTAL CONSUMER STAPLES | | 709,000,834 |
ENERGY - 5.1% |
Energy Equipment & Services - 1.0% |
Halliburton Co. | 967,422 | | 66,742,444 |
National Oilwell Varco, Inc. | 67,500 | | 5,470,200 |
Schlumberger Ltd. | 49,600 | | 5,376,144 |
Seventy Seven Energy, Inc. (a) | 8,495 | | 190,543 |
Transocean Partners LLC (a) | 54,200 | | 1,317,060 |
| | 79,096,391 |
Oil, Gas & Consumable Fuels - 4.1% |
Anadarko Petroleum Corp. | 428,678 | | 45,804,244 |
BG Group PLC | 152,900 | | 3,015,075 |
Cabot Oil & Gas Corp. | 121,627 | | 4,007,610 |
Canadian Natural Resources Ltd. | 146,900 | | 6,403,592 |
Carrizo Oil & Gas, Inc. (a) | 112,400 | | 6,902,484 |
Cheniere Energy, Inc. (a) | 142,200 | | 10,062,072 |
Chevron Corp. | 12,200 | | 1,576,728 |
Cimarex Energy Co. | 186,930 | | 25,987,009 |
Continental Resources, Inc. (a) | 216,532 | | 31,782,567 |
EOG Resources, Inc. | 399,326 | | 43,702,237 |
Golar LNG Ltd. | 68,700 | | 4,232,607 |
Hess Corp. | 144,038 | | 14,256,881 |
Marathon Petroleum Corp. | 90,800 | | 7,579,984 |
Memorial Resource Development Corp. | 132,700 | | 3,049,446 |
Navigator Holdings Ltd. (a) | 54,800 | | 1,526,180 |
Newfield Exploration Co. (a) | 474,900 | | 19,138,470 |
Phillips 66 Co. | 138,134 | | 11,204,049 |
Pioneer Natural Resources Co. | 216,400 | | 47,923,944 |
PrairieSky Royalty Ltd. (d) | 92,200 | | 3,331,664 |
Rice Energy, Inc. | 261,000 | | 6,864,300 |
Scorpio Tankers, Inc. | 327,700 | | 3,077,103 |
Targa Resources Corp. | 46,800 | | 5,967,000 |
Common Stocks - continued |
| Shares | | Value |
ENERGY - continued |
Oil, Gas & Consumable Fuels - continued |
Teekay Corp. | 26,200 | | $ 1,458,292 |
Valero Energy Corp. | 203,356 | | 10,330,485 |
| | 319,184,023 |
TOTAL ENERGY | | 398,280,414 |
FINANCIALS - 4.4% |
Banks - 2.3% |
Bank of America Corp. | 3,091,600 | | 47,146,900 |
Citigroup, Inc. | 1,064,589 | | 52,069,048 |
HDFC Bank Ltd. sponsored ADR | 196,600 | | 9,318,840 |
ICICI Bank Ltd. sponsored ADR | 228,900 | | 11,449,578 |
JPMorgan Chase & Co. | 1,127,372 | | 65,015,543 |
| | 184,999,909 |
Capital Markets - 1.1% |
Ameriprise Financial, Inc. | 91,862 | | 10,986,695 |
BlackRock, Inc. Class A | 84,700 | | 25,810,631 |
Carlyle Group LP | 133,800 | | 4,466,244 |
Invesco Ltd. | 309,992 | | 11,664,999 |
Morgan Stanley | 707,200 | | 22,870,848 |
Och-Ziff Capital Management Group LLC Class A | 454,600 | | 6,187,106 |
State Street Corp. | 34,200 | | 2,409,048 |
The Blackstone Group LP | 204,400 | | 6,679,792 |
| | 91,075,363 |
Consumer Finance - 0.7% |
American Express Co. | 563,045 | | 49,547,960 |
Capital One Financial Corp. | 66,900 | | 5,321,226 |
| | 54,869,186 |
Insurance - 0.1% |
MetLife, Inc. | 132,400 | | 6,964,240 |
Real Estate Management & Development - 0.2% |
Howard Hughes Corp. (a) | 27,100 | | 3,940,882 |
Realogy Holdings Corp. (a) | 223,795 | | 8,226,704 |
| | 12,167,586 |
TOTAL FINANCIALS | | 350,076,284 |
Common Stocks - continued |
| Shares | | Value |
HEALTH CARE - 15.4% |
Biotechnology - 8.4% |
Acceleron Pharma, Inc. | 20,600 | | $ 610,172 |
Agios Pharmaceuticals, Inc. | 82,500 | | 3,324,750 |
Alexion Pharmaceuticals, Inc. (a) | 297,804 | | 47,347,858 |
Alkermes PLC (a) | 361,500 | | 15,457,740 |
Alnylam Pharmaceuticals, Inc. (a) | 307,200 | | 16,604,160 |
Amgen, Inc. | 702,098 | | 89,440,264 |
Avalanche Biotechnologies, Inc. (a) | 10,600 | | 296,694 |
BioCryst Pharmaceuticals, Inc. (a) | 401,073 | | 5,021,434 |
Biogen Idec, Inc. (a) | 348,000 | | 116,367,720 |
BioMarin Pharmaceutical, Inc. (a) | 137,700 | | 8,512,614 |
Bluebird Bio, Inc. (a) | 62,600 | | 2,090,840 |
Celgene Corp. (a) | 33,600 | | 2,928,240 |
Dicerna Pharmaceuticals, Inc. | 78,600 | | 1,180,572 |
Exelixis, Inc. (a) | 1,288,200 | | 5,204,328 |
Gilead Sciences, Inc. (a) | 2,303,335 | | 210,870,319 |
Grifols SA | 62,800 | | 2,844,003 |
Intercept Pharmaceuticals, Inc. (a) | 41,058 | | 9,540,237 |
InterMune, Inc. (a) | 182,955 | | 8,026,236 |
Intrexon Corp. (d) | 119,300 | | 2,635,337 |
Ironwood Pharmaceuticals, Inc. Class A (a) | 442,916 | | 6,555,157 |
Isis Pharmaceuticals, Inc. (a) | 31,100 | | 963,789 |
Keryx Biopharmaceuticals, Inc. (a)(d) | 260,060 | | 3,913,903 |
KYTHERA Biopharmaceuticals, Inc. (a) | 129,033 | | 4,332,928 |
Merrimack Pharmaceuticals, Inc. (a) | 813,200 | | 4,806,012 |
Neurocrine Biosciences, Inc. (a) | 215,800 | | 2,930,564 |
NPS Pharmaceuticals, Inc. (a) | 42,900 | | 1,198,626 |
Pharmacyclics, Inc. (a) | 81,700 | | 9,839,948 |
Puma Biotechnology, Inc. (a) | 24,600 | | 5,454,312 |
Regeneron Pharmaceuticals, Inc. (a) | 154,980 | | 49,007,776 |
Seattle Genetics, Inc. (a) | 81,000 | | 2,851,200 |
Synageva BioPharma Corp. (a) | 62,900 | | 4,302,989 |
Ultragenyx Pharmaceutical, Inc. | 12,600 | | 550,620 |
uniQure B.V. | 146,459 | | 1,496,811 |
Vertex Pharmaceuticals, Inc. (a) | 213,400 | | 18,973,394 |
| | 665,481,547 |
Health Care Equipment & Supplies - 0.9% |
Accuray, Inc. (a) | 476,900 | | 3,753,203 |
Boston Scientific Corp. (a) | 1,218,300 | | 15,569,874 |
Insulet Corp. (a) | 42,300 | | 1,494,882 |
Intuitive Surgical, Inc. (a) | 43,700 | | 19,994,935 |
Common Stocks - continued |
| Shares | | Value |
HEALTH CARE - continued |
Health Care Equipment & Supplies - continued |
Novadaq Technologies, Inc. (a) | 292,099 | | $ 4,480,799 |
The Cooper Companies, Inc. | 158,475 | | 25,495,458 |
Zeltiq Aesthetics, Inc. (a) | 96,900 | | 1,961,256 |
| | 72,750,407 |
Health Care Providers & Services - 0.5% |
Cardinal Health, Inc. | 150,800 | | 10,804,820 |
Express Scripts Holding Co. (a) | 22,900 | | 1,594,985 |
HCA Holdings, Inc. (a) | 370,950 | | 24,226,745 |
Healthequity, Inc. (a) | 20,000 | | 352,000 |
iKang Healthcare Group, Inc. sponsored ADR (d) | 130,352 | | 2,445,404 |
| | 39,423,954 |
Health Care Technology - 0.4% |
Allscripts Healthcare Solutions, Inc. (a) | 149,000 | | 2,372,080 |
athenahealth, Inc. (a)(d) | 36,700 | | 4,565,480 |
Castlight Health, Inc. Class B (a)(d) | 65,000 | | 871,650 |
Cerner Corp. (a) | 359,600 | | 19,849,920 |
| | 27,659,130 |
Life Sciences Tools & Services - 0.9% |
Agilent Technologies, Inc. | 180,823 | | 10,142,362 |
Genfit (a) | 42,500 | | 1,598,591 |
Illumina, Inc. (a) | 334,338 | | 53,463,990 |
Lonza Group AG | 19,589 | | 2,177,154 |
Thermo Fisher Scientific, Inc. | 26,400 | | 3,207,600 |
| | 70,589,697 |
Pharmaceuticals - 4.3% |
AbbVie, Inc. | 1,177,265 | | 61,618,050 |
Achaogen, Inc. (a) | 161,500 | | 1,745,815 |
Actavis PLC (a) | 406,372 | | 87,069,265 |
Allergan, Inc. | 135,627 | | 22,495,094 |
GW Pharmaceuticals PLC ADR (a)(d) | 127,169 | | 10,758,497 |
Jazz Pharmaceuticals PLC (a) | 23,400 | | 3,269,682 |
Johnson & Johnson | 90,700 | | 9,078,163 |
Merck & Co., Inc. | 287,758 | | 16,327,389 |
Pacira Pharmaceuticals, Inc. (a) | 57,186 | | 5,261,112 |
Perrigo Co. PLC | 72,600 | | 10,922,670 |
Salix Pharmaceuticals Ltd. (a) | 113,452 | | 14,965,453 |
Shire PLC sponsored ADR | 82,200 | | 20,262,300 |
Common Stocks - continued |
| Shares | | Value |
HEALTH CARE - continued |
Pharmaceuticals - continued |
Teva Pharmaceutical Industries Ltd. sponsored ADR | 489,000 | | $ 26,161,500 |
Valeant Pharmaceuticals International (Canada) (a) | 405,300 | | 47,516,393 |
| | 337,451,383 |
TOTAL HEALTH CARE | | 1,213,356,118 |
INDUSTRIALS - 9.2% |
Aerospace & Defense - 1.8% |
Honeywell International, Inc. | 433,600 | | 39,817,488 |
Precision Castparts Corp. | 125,350 | | 28,680,080 |
The Boeing Co. | 463,300 | | 55,818,384 |
United Technologies Corp. | 143,200 | | 15,057,480 |
| | 139,373,432 |
Air Freight & Logistics - 0.7% |
C.H. Robinson Worldwide, Inc. | 38,800 | | 2,617,448 |
FedEx Corp. | 123,612 | | 18,156,131 |
Hub Group, Inc. Class A (a) | 79,700 | | 3,680,546 |
United Parcel Service, Inc. Class B | 260,600 | | 25,301,654 |
XPO Logistics, Inc. (a)(d) | 251,600 | | 7,771,924 |
| | 57,527,703 |
Airlines - 1.9% |
American Airlines Group, Inc. | 1,970,734 | | 76,563,016 |
Delta Air Lines, Inc. | 861,600 | | 32,275,536 |
Southwest Airlines Co. | 214,900 | | 6,077,372 |
Spirit Airlines, Inc. (a) | 430,700 | | 28,176,394 |
United Continental Holdings, Inc. (a) | 80,200 | | 3,720,478 |
| | 146,812,796 |
Building Products - 0.1% |
A.O. Smith Corp. | 131,951 | | 6,162,112 |
Electrical Equipment - 0.7% |
Acuity Brands, Inc. | 70,300 | | 7,541,081 |
Eaton Corp. PLC | 333,800 | | 22,671,696 |
Generac Holdings, Inc. (a) | 93,677 | | 4,065,582 |
SolarCity Corp. (a)(d) | 196,526 | | 14,057,505 |
TCP International Holdings Ltd. | 227,100 | | 1,962,144 |
Vestas Wind Systems A/S (a) | 110,800 | | 5,012,485 |
| | 55,310,493 |
Common Stocks - continued |
| Shares | | Value |
INDUSTRIALS - continued |
Industrial Conglomerates - 0.8% |
Danaher Corp. | 890,700 | | $ 65,804,916 |
Machinery - 1.4% |
Caterpillar, Inc. | 240,263 | | 24,206,497 |
Cummins, Inc. | 343,600 | | 47,894,404 |
Ingersoll-Rand PLC | 293,800 | | 17,272,502 |
ITT Corp. | 196,100 | | 9,014,717 |
Manitowoc Co., Inc. | 307,900 | | 8,177,824 |
Navistar International Corp. (a)(d) | 175,200 | | 6,161,784 |
| | 112,727,728 |
Professional Services - 0.2% |
Huron Consulting Group, Inc. (a) | 93,299 | | 5,638,992 |
Towers Watson & Co. | 113,861 | | 11,616,099 |
| | 17,255,091 |
Road & Rail - 1.4% |
Avis Budget Group, Inc. (a) | 126,182 | | 7,090,167 |
Canadian Pacific Railway Ltd. | 92,000 | | 17,493,796 |
Hertz Global Holdings, Inc. (a) | 568,700 | | 16,048,714 |
J.B. Hunt Transport Services, Inc. | 244,500 | | 18,890,070 |
Landstar System, Inc. | 36,400 | | 2,407,132 |
Union Pacific Corp. | 523,000 | | 51,416,130 |
| | 113,346,009 |
Trading Companies & Distributors - 0.2% |
United Rentals, Inc. (a) | 123,800 | | 13,110,420 |
TOTAL INDUSTRIALS | | 727,430,700 |
INFORMATION TECHNOLOGY - 32.8% |
Communications Equipment - 2.0% |
Arista Networks, Inc. (d) | 54,000 | | 3,570,480 |
Cisco Systems, Inc. | 92,600 | | 2,336,298 |
F5 Networks, Inc. (a) | 128,740 | | 14,494,837 |
Palo Alto Networks, Inc. (a) | 166,297 | | 13,446,775 |
QUALCOMM, Inc. | 1,504,581 | | 110,887,620 |
Riverbed Technology, Inc. (a) | 699,800 | | 12,526,420 |
| | 157,262,430 |
Electronic Equipment & Components - 0.3% |
InvenSense, Inc. (a)(d) | 615,900 | | 14,171,859 |
Common Stocks - continued |
| Shares | | Value |
INFORMATION TECHNOLOGY - continued |
Electronic Equipment & Components - continued |
Samsung SDI Co. Ltd. | 4,812 | | $ 740,847 |
TE Connectivity Ltd. | 161,916 | | 10,020,981 |
| | 24,933,687 |
Internet Software & Services - 10.9% |
Akamai Technologies, Inc. (a) | 270,236 | | 15,949,329 |
Baidu.com, Inc. sponsored ADR (a) | 149,700 | | 32,342,685 |
Cornerstone OnDemand, Inc. (a) | 127,100 | | 5,317,864 |
Facebook, Inc. Class A (a) | 2,590,955 | | 188,232,881 |
Gogo, Inc. (a)(d) | 393,400 | | 6,377,014 |
Google, Inc.: | | | |
Class A (a) | 388,913 | | 225,394,529 |
Class C (a) | 365,413 | | 208,870,071 |
IAC/InterActiveCorp | 284,700 | | 19,131,840 |
LinkedIn Corp. (a) | 27,900 | | 5,039,856 |
NAVER Corp. | 26,732 | | 19,085,113 |
Rackspace Hosting, Inc. (a) | 852,695 | | 25,828,132 |
Tencent Holdings Ltd. | 1,744,900 | | 28,336,757 |
Twitter, Inc. | 580,000 | | 26,210,200 |
Wix.com Ltd. (a) | 72,700 | | 1,232,265 |
Xoom Corp. (a) | 201,115 | | 4,356,151 |
Xunlei Ltd. sponsored ADR (d) | 42,700 | | 512,827 |
Yahoo!, Inc. (a) | 1,237,785 | | 44,325,081 |
Zoopla Property Group PLC | 639,700 | | 2,721,614 |
| | 859,264,209 |
IT Services - 4.0% |
Cognizant Technology Solutions Corp. Class A (a) | 1,845,648 | | 90,529,034 |
MasterCard, Inc. Class A | 1,322,800 | | 98,085,620 |
VeriFone Systems, Inc. (a) | 475,900 | | 15,947,409 |
Visa, Inc. Class A | 536,837 | | 113,277,975 |
| | 317,840,038 |
Semiconductors & Semiconductor Equipment - 4.1% |
Broadcom Corp. Class A | 327,000 | | 12,511,020 |
Canadian Solar, Inc. (a)(d) | 233,000 | | 5,815,680 |
Cavium, Inc. (a) | 420,655 | | 19,623,556 |
Cree, Inc. (a) | 343,723 | | 16,234,037 |
Cypress Semiconductor Corp. | 1,385,435 | | 14,006,748 |
eMemory Technology, Inc. | 75,000 | | 679,697 |
First Solar, Inc. (a) | 540,820 | | 34,131,150 |
Freescale Semiconductor, Inc. (a) | 797,019 | | 15,956,320 |
GCL-Poly Energy Holdings Ltd. (a) | 6,332,000 | | 2,044,185 |
Common Stocks - continued |
| Shares | | Value |
INFORMATION TECHNOLOGY - continued |
Semiconductors & Semiconductor Equipment - continued |
GT Advanced Technologies, Inc. (a)(d) | 155,600 | | $ 2,153,504 |
Integrated Device Technology, Inc. (a) | 378,000 | | 5,428,080 |
MediaTek, Inc. | 235,000 | | 3,628,123 |
Mellanox Technologies Ltd. (a) | 66,500 | | 2,769,725 |
Micron Technology, Inc. (a) | 1,485,000 | | 45,366,750 |
Monolithic Power Systems, Inc. | 80,256 | | 3,309,757 |
NVIDIA Corp. | 556,020 | | 9,730,350 |
NXP Semiconductors NV (a) | 1,781,569 | | 111,080,827 |
RF Micro Devices, Inc. (a) | 506,600 | | 5,653,656 |
Silicon Laboratories, Inc. (a) | 44,922 | | 1,829,673 |
SunEdison, Inc. (a) | 405,805 | | 8,116,100 |
SunPower Corp. (a)(d) | 69,800 | | 2,563,754 |
| | 322,632,692 |
Software - 4.3% |
Activision Blizzard, Inc. | 2,259,800 | | 50,574,324 |
Adobe Systems, Inc. (a) | 436,120 | | 30,140,253 |
CommVault Systems, Inc. (a) | 10,669 | | 512,325 |
Concur Technologies, Inc. (a) | 37,900 | | 3,523,184 |
Electronic Arts, Inc. (a) | 278,500 | | 9,357,600 |
Fortinet, Inc. (a) | 276,006 | | 6,775,947 |
Imperva, Inc. (a) | 62,001 | | 1,374,562 |
Intuit, Inc. | 59,800 | | 4,901,806 |
Microsoft Corp. | 2,534,588 | | 109,392,818 |
Red Hat, Inc. (a) | 100,900 | | 5,864,308 |
salesforce.com, Inc. (a) | 1,992,804 | | 108,109,617 |
Zynga, Inc. (a) | 1,090,459 | | 3,184,140 |
| | 333,710,884 |
Technology Hardware, Storage & Peripherals - 7.2% |
Apple, Inc. | 5,400,434 | | 516,119,479 |
BlackBerry Ltd. (a)(d) | 2,401,900 | | 22,409,737 |
Cray, Inc. (a) | 28,900 | | 766,428 |
Hewlett-Packard Co. | 507,100 | | 18,057,831 |
NCR Corp. (a) | 344,974 | | 10,676,945 |
Nimble Storage, Inc. | 57,200 | | 1,480,336 |
| | 569,510,756 |
TOTAL INFORMATION TECHNOLOGY | | 2,585,154,696 |
Common Stocks - continued |
| Shares | | Value |
MATERIALS - 2.0% |
Chemicals - 1.9% |
Cabot Corp. | 144,230 | | $ 7,556,210 |
Celanese Corp. Class A | 122,315 | | 7,119,956 |
Eastman Chemical Co. | 355,400 | | 27,998,412 |
Huntsman Corp. | 299,600 | | 7,804,580 |
Intrepid Potash, Inc. (a) | 263,100 | | 3,896,511 |
LyondellBasell Industries NV Class A | 79,667 | | 8,464,619 |
Monsanto Co. | 554,900 | | 62,753,641 |
Orion Engineered Carbons SA (a) | 92,900 | | 1,579,300 |
Potash Corp. of Saskatchewan, Inc. | 190,700 | | 6,770,300 |
The Mosaic Co. | 156,743 | | 7,227,420 |
Westlake Chemical Corp. | 73,800 | | 6,449,382 |
| | 147,620,331 |
Construction Materials - 0.1% |
CaesarStone Sdot-Yam Ltd. | 122,400 | | 5,307,264 |
Metals & Mining - 0.0% |
Freeport-McMoRan Copper & Gold, Inc. | 107,800 | | 4,012,316 |
TOTAL MATERIALS | | 156,939,911 |
TELECOMMUNICATION SERVICES - 0.1% |
Diversified Telecommunication Services - 0.0% |
Jazztel PLC (a) | 292,300 | | 3,941,441 |
Wireless Telecommunication Services - 0.1% |
RingCentral, Inc. | 66,800 | | 997,324 |
T-Mobile U.S., Inc. (a) | 147,238 | | 4,850,020 |
| | 5,847,344 |
TOTAL TELECOMMUNICATION SERVICES | | 9,788,785 |
UTILITIES - 0.1% |
Independent Power and Renewable Electricity Producers - 0.1% |
Abengoa Yield PLC | 39,900 | | 1,443,582 |
NextEra Energy Partners LP | 110,400 | | 3,758,016 |
| | 5,201,598 |
Common Stocks - continued |
| Shares | | Value |
UTILITIES - continued |
Independent Power Producers & Energy Traders - 0.0% |
Dynegy, Inc. (a) | 187,280 | | $ 4,972,284 |
TOTAL UTILITIES | | 10,173,882 |
TOTAL COMMON STOCKS (Cost $6,990,685,509) |
7,802,180,961
|
Convertible Preferred Stocks - 0.5% |
| | | |
INFORMATION TECHNOLOGY - 0.5% |
Internet Software & Services - 0.5% |
Uber Technologies, Inc. 8.00% (e) (Cost $40,000,027) | 644,619 | |
40,000,027
|
Money Market Funds - 1.8% |
| | | |
Fidelity Cash Central Fund, 0.11% (b) | 53,289,767 | | 53,289,767 |
Fidelity Securities Lending Cash Central Fund, 0.11% (b)(c) | 88,398,169 | | 88,398,169 |
TOTAL MONEY MARKET FUNDS (Cost $141,687,936) |
141,687,936
|
TOTAL INVESTMENT PORTFOLIO - 101.2% (Cost $7,172,373,472) | | 7,983,868,924 |
NET OTHER ASSETS (LIABILITIES) - (1.2)% | | (91,799,065) |
NET ASSETS - 100% | $ 7,892,069,859 |
Legend |
(a) Non-income producing |
(b) Affiliated fund that is generally available only to investment companies and other accounts managed by Fidelity Investments. The rate quoted is the annualized seven-day yield of the fund at period end. A complete unaudited listing of the fund's holdings as of its most recent quarter end is available upon request. In addition, each Fidelity Central Fund's financial statements, which are not covered by the Fund's Report of Independent Registered Public Accounting Firm, are available on the SEC's website or upon request. |
(c) Investment made with cash collateral received from securities on loan. |
(d) Security or a portion of the security is on loan at period end. |
(e) Restricted securities - Investment in securities not registered under the Securities Act of 1933 (excluding 144A issues). At the end of the period, the value of restricted securities (excluding 144A issues) amounted to $40,000,027 or 0.5% of net assets. |
Additional information on each restricted holding is as follows: |
Security | Acquisition Date | Acquisition Cost |
Uber Technologies, Inc. 8.00% | 6/6/14 | $ 40,000,027 |
Affiliated Central Funds |
Information regarding fiscal year to date income earned by the Fund from investments in Fidelity Central Funds is as follows: |
Fund | Income earned |
Fidelity Cash Central Fund | $ 16,961 |
Fidelity Securities Lending Cash Central Fund | 418,809 |
Total | $ 435,770 |
Other Information |
The following is a summary of the inputs used, as of July 31, 2014, involving the Fund's assets and liabilities carried at fair value. The inputs or methodology used for valuing securities may not be an indication of the risk associated with investing in those securities. For more information on valuation inputs, and their aggregation into the levels used in the table below, please refer to the Investment Valuation section in the accompanying Notes to Financial Statements. |
Valuation Inputs at Reporting Date: |
Description | Total | Level 1 | Level 2 | Level 3 |
Investments in Securities: | | | | |
Equities: | | | | |
Consumer Discretionary | $ 1,641,979,337 | $ 1,641,979,337 | $ - | $ - |
Consumer Staples | 709,000,834 | 709,000,834 | - | - |
Energy | 398,280,414 | 395,265,339 | 3,015,075 | - |
Financials | 350,076,284 | 350,076,284 | - | - |
Health Care | 1,213,356,118 | 1,213,356,118 | - | - |
Industrials | 727,430,700 | 727,430,700 | - | - |
Information Technology | 2,625,154,723 | 2,530,639,974 | 54,514,722 | 40,000,027 |
Materials | 156,939,911 | 156,939,911 | - | - |
Telecommunication Services | 9,788,785 | 9,788,785 | - | - |
Utilities | 10,173,882 | 10,173,882 | - | - |
Money Market Funds | 141,687,936 | 141,687,936 | - | - |
Total Investments in Securities: | $ 7,983,868,924 | $ 7,886,339,100 | $ 57,529,797 | $ 40,000,027 |
Distribution of investments by country or territory of incorporation, as a percentage of total net assets, is as follows (Unaudited): |
United States of America | 89.9% |
Ireland | 2.0% |
Canada | 1.8% |
Cayman Islands | 1.5% |
Netherlands | 1.5% |
Others (Individually Less Than 1%) | 3.3% |
| 100.0% |
See accompanying notes which are an integral part of the financial statements.
Annual Report
Statement of Assets and Liabilities
| July 31, 2014 |
| | |
Assets | | |
Investment in securities, at value (including securities loaned of $83,375,474) - See accompanying schedule: Unaffiliated issuers (cost $7,030,685,536) | $ 7,842,180,988 | |
Fidelity Central Funds (cost $141,687,936) | 141,687,936 | |
Total Investments (cost $7,172,373,472) | | $ 7,983,868,924 |
Cash | | 490,230 |
Foreign currency held at value (cost $56,683) | | 56,683 |
Receivable for investments sold | | 54,316,823 |
Receivable for fund shares sold | | 721,647 |
Dividends receivable | | 2,670,239 |
Distributions receivable from Fidelity Central Funds | | 95,954 |
Other receivables | | 43,400 |
Total assets | | 8,042,263,900 |
| | |
Liabilities | | |
Payable for investments purchased | $ 50,628,313 | |
Payable for fund shares redeemed | 6,818,368 | |
Accrued management fee | 3,687,748 | |
Other affiliated payables | 568,228 | |
Other payables and accrued expenses | 93,215 | |
Collateral on securities loaned, at value | 88,398,169 | |
Total liabilities | | 150,194,041 |
| | |
Net Assets | | $ 7,892,069,859 |
Net Assets consist of: | | |
Paid in capital | | $ 7,030,919,966 |
Undistributed net investment income | | 11,955,287 |
Accumulated undistributed net realized gain (loss) on investments and foreign currency transactions | | 37,699,004 |
Net unrealized appreciation (depreciation) on investments and assets and liabilities in foreign currencies | | 811,495,602 |
Net Assets | | $ 7,892,069,859 |
See accompanying notes which are an integral part of the financial statements.
Annual Report
Statement of Assets and Liabilities - continued
| July 31, 2014 |
| | |
Series Blue Chip Growth:
Net Asset Value, offering price and redemption price per share ($3,288,708,456 ÷ 294,152,801 shares) | | $ 11.18 |
| | |
Class F:
Net Asset Value, offering price and redemption price per share ($4,603,361,403 ÷ 411,352,240 shares) | | $ 11.19 |
See accompanying notes which are an integral part of the financial statements.
Annual Report
Financial Statements - continued
Statement of Operations
For the period November 7, 2013
(commencement of operations) to
July 31, 2014 |
| | |
Investment Income | | |
Dividends | | $ 55,862,999 |
Interest | | 8 |
Income from Fidelity Central Funds | | 435,770 |
Total income | | 56,298,777 |
| | |
Expenses | | |
Management fee | $ 31,005,444 | |
Transfer agent fees | 4,087,378 | |
Accounting and security lending fees | 879,979 | |
Custodian fees and expenses | 155,182 | |
Independent trustees' compensation | 20,062 | |
Audit | 64,727 | |
Legal | 6,592 | |
Interest | 4,420 | |
Miscellaneous | 12,487 | |
Total expenses before reductions | 36,236,271 | |
Expense reductions | (90,730) | 36,145,541 |
Net investment income (loss) | | 20,153,236 |
Realized and Unrealized Gain (Loss) Net realized gain (loss) on: | | |
Investment securities: | | |
Unaffiliated issuers | 37,435,924 | |
Foreign currency transactions | (85,367) | |
Total net realized gain (loss) | | 37,350,557 |
Change in net unrealized appreciation (depreciation) on: Investment securities | 811,495,452 | |
Assets and liabilities in foreign currencies | 150 | |
Total change in net unrealized appreciation (depreciation) | | 811,495,602 |
Net gain (loss) | | 848,846,159 |
Net increase (decrease) in net assets resulting from operations | | $ 868,999,395 |
See accompanying notes which are an integral part of the financial statements.
Annual Report
Statement of Changes in Net Assets
| For the period
November 7, 2013
(commencement of operations) to
July 31, 2014 |
Increase (Decrease) in Net Assets | |
Operations | |
Net investment income (loss) | $ 20,153,236 |
Net realized gain (loss) | 37,350,557 |
Change in net unrealized appreciation (depreciation) | 811,495,602 |
Net increase (decrease) in net assets resulting
from operations | 868,999,395 |
Distributions to shareholders from net investment income | (7,849,502) |
Share transactions - net increase (decrease) | 7,030,919,966 |
Total increase (decrease) in net assets | 7,892,069,859 |
| |
Net Assets | |
Beginning of period | - |
End of period (including undistributed net investment income of $11,955,287) | $ 7,892,069,859 |
See accompanying notes which are an integral part of the financial statements.
Annual Report
Financial Highlights - Series Blue Chip Growth
Year ended July 31, | 2014 G |
Selected Per-Share Data | |
Net asset value, beginning of period | $ 10.00 |
Income from Investment Operations | |
Net investment income (loss) D | .02 |
Net realized and unrealized gain (loss) | 1.17 |
Total from investment operations | 1.19 |
Distributions from net investment income | (.01) |
Net asset value, end of period | $ 11.18 |
Total ReturnB, C | 11.90% |
Ratios to Average Net Assets E, H | |
Expenses before reductions | .74% A |
Expenses net of fee waivers, if any | .74% A |
Expenses net of all reductions | .74% A |
Net investment income (loss) | .26% A |
Supplemental Data | |
Net assets, end of period (000 omitted) | $ 3,288,708 |
Portfolio turnover rateF | 67% A, I |
A Annualized
B Total returns for periods of less than one year are not annualized.
C Total returns would have been lower if certain expenses had not been reduced during the applicable periods shown.
D Calculated based on average shares outstanding during the period.
E Fees and expenses of any underlying Fidelity Central Funds are not included in the Fund's expense ratio. The Fund indirectly bears its proportionate share of the expenses of any underlying Fidelity Central Funds.
F Amount does not include the portfolio activity of any underlying Fidelity Central Funds.
G For the period November 7, 2013 (commencement of operations) to July 31, 2014.
H Expense ratios reflect operating expenses of the class. Expenses before reductions do not reflect amounts reimbursed by the investment adviser or reductions from brokerage service arrangements or reductions from other expense offset arrangements and do not represent the amount paid by the class during periods when reimbursements or reductions occur. Expense ratios before reductions for start-up periods may not be representative of longer-term operating periods. Expenses net of fee waivers reflect expenses after reimbursement by the investment adviser but prior to reductions from brokerage service arrangements or other expense offset arrangements. Expenses net of all reductions represent the net expenses paid by the class.
I Portfolio turnover rate excludes securities received or delivered in-kind.
See accompanying notes which are an integral part of the financial statements.
Annual Report
Financial Highlights - Class F
Year ended July 31, | 2014 G |
Selected Per-Share Data | |
Net asset value, beginning of period | $ 10.00 |
Income from Investment Operations | |
Net investment income (loss) D | .03 |
Net realized and unrealized gain (loss) | 1.17 |
Total from investment operations | 1.20 |
Distributions from net investment income | (.01) |
Net asset value, end of period | $ 11.19 |
Total ReturnB, C | 12.03% |
Ratios to Average Net Assets E, H | |
Expenses before reductions | .57%A |
Expenses net of fee waivers, if any | .57% A |
Expenses net of all reductions | .57% A |
Net investment income (loss) | .43% A |
Supplemental Data | |
Net assets, end of period (000 omitted) | $ 4,603,361 |
Portfolio turnover rateF | 67% A, I |
A Annualized
B Total returns for periods of less than one year are not annualized.
C Total returns would have been lower if certain expenses had not been reduced during the applicable periods shown.
D Calculated based on average shares outstanding during the period.
E Fees and expenses of any underlying Fidelity Central Funds are not included in the Fund's expense ratio. The Fund indirectly bears its proportionate share of the expenses of any underlying Fidelity Central Funds.
F Amount does not include the portfolio activity of any underlying Fidelity Central Funds.
G For the period November 7, 2013 (commencement of operations) to July 31, 2014.
H Expense ratios reflect operating expenses of the class. Expenses before reductions do not reflect amounts reimbursed by the investment adviser or reductions from brokerage service arrangements or reductions from other expense offset arrangements and do not represent the amount paid by the class during periods when reimbursements or reductions occur. Expense ratios before reductions for start-up periods may not be representative of longer-term operating periods. Expenses net of fee waivers reflect expenses after reimbursement by the investment adviser but prior to reductions from brokerage service arrangements or other expense offset arrangements. Expenses net of all reductions represent the net expenses paid by the class.
I Portfolio turnover rate excludes securities received or delivered in-kind.
See accompanying notes which are an integral part of the financial statements.
Annual Report
Notes to Financial Statements
For the period ended July 31, 2014
1. Organization.
Fidelity Series Blue Chip Growth Fund (the Fund) is a fund of Fidelity Securities Fund (the Trust) and is authorized to issue an unlimited number of shares. Shares of the Fund are only available for purchase by mutual funds for which Fidelity Management & Research Company (FMR) or an affiliate serves as an investment manager. The Trust is registered under the Investment Company Act of 1940, as amended (the 1940 Act), as an open-end management investment company organized as a Massachusetts business trust. The Fund offers Series Blue Chip Growth and Class F shares, each of which has equal rights as to assets and voting privileges. Each class has exclusive voting rights with respect to matters that affect that class.
2. Investments in Fidelity Central Funds.
The Fund invests in Fidelity Central Funds, which are open-end investment companies generally available only to other investment companies and accounts managed by the investment adviser and its affiliates. The Fund's Schedule of Investments lists each of the Fidelity Central Funds held as of period end, if any, as an investment of the Fund, but does not include the underlying holdings of each Fidelity Central Fund. As an Investing Fund, the Fund indirectly bears its proportionate share of the expenses of the underlying Fidelity Central Funds.
The Money Market Central Funds seek preservation of capital and current income and are managed by Fidelity Investments Money Management, Inc. (FIMM), an affiliate of the investment adviser. Annualized expenses of the Money Market Central Funds as of their most recent shareholder report date are less than .01%.
A complete unaudited list of holdings for each Fidelity Central Fund is available upon request or at the Securities and Exchange Commission (the SEC) website at www.sec.gov. In addition, the financial statements of the Fidelity Central Funds, which are not covered by the Fund's Report of Independent Registered Public Accounting Firm, are available on the SEC website or upon request.
3. Significant Accounting Policies.
The financial statements have been prepared in conformity with accounting principles generally accepted in the United States of America (GAAP), which require management to make certain estimates and assumptions at the date of the financial statements. Actual results could differ from those estimates. Subsequent events, if any, through the date that the financial statements were issued have been evaluated in the preparation of
Annual Report
Notes to Financial Statements - continued
3. Significant Accounting Policies - continued
the financial statements. The following summarizes the significant accounting policies of the Fund:
Investment Valuation. Investments are valued as of 4:00 p.m. Eastern time on the last calendar day of the period. In accordance with valuation policies and procedures approved by the Board of Trustees (the Board), the Fund attempts to obtain prices from one or more third party pricing vendors or brokers to value its investments. When current market prices, quotations or currency exchange rates are not readily available or reliable, investments will be fair valued in good faith by the FMR Fair Value Committee (the Committee), in accordance with procedures adopted by the Board. Factors used in determining fair value vary by investment type and may include market or investment specific events. The frequency with which these procedures are used cannot be predicted and they may be utilized to a significant extent. The Committee oversees the Fund's valuation policies and procedures and is responsible for approving and reporting to the Board all fair value determinations.
The Fund categorizes the inputs to valuation techniques used to value its investments into a disclosure hierarchy consisting of three levels as shown below:
Level 1 - quoted prices in active markets for identical investments
Level 2 - other significant observable inputs (including quoted prices for similar investments, interest rates, prepayment speeds, etc.)
Level 3 - unobservable inputs (including the Fund's own assumptions based on the best information available)
Valuation techniques used to value the Fund's investments by major category are as follows:
Equity securities, including restricted securities, for which market quotations are readily available, are valued at the last reported sale price or official closing price as reported by a third party pricing vendor on the primary market or exchange on which they are traded and are categorized as Level 1 in the hierarchy. In the event there were no sales during the day or closing prices are not available, securities are valued at the last quoted bid price or may be valued using the last available price and are generally categorized as Level 2 in the hierarchy. For foreign equity securities, when market or security specific events arise, comparisons to the valuation of American Depositary Receipts (ADRs), futures contracts, Exchange-Traded Funds (ETFs) and certain indexes as well as quoted prices for similar securities may be used and would be categorized as Level 2 in the hierarchy. Utilizing these techniques may result in transfers between Level 1 and Level 2. For equity securities, including restricted securities, where observable inputs are limited, assumptions about market activity and risk are used and these securities may be categorized as Level 3 in the hierarchy.
Annual Report
3. Significant Accounting Policies - continued
Investment Valuation - continued
Investments in open-end mutual funds, including the Fidelity Central Funds, are valued at their closing net asset value (NAV) each business day and are categorized as Level 1 in the hierarchy.
Changes in valuation techniques may result in transfers in or out of an assigned level within the disclosure hierarchy. The aggregate value of investments by input level, as of July 31, 2014, is included at the end of the Fund's Schedule of Investments.
Foreign Currency. The Fund may use foreign currency contracts to facilitate transactions in foreign-denominated securities. Gains and losses from these transactions may arise from changes in the value of the foreign currency or if the counterparties do not perform under the contracts' terms.
Foreign-denominated assets, including investment securities, and liabilities are translated into U.S. dollars at the exchange rates at period end. Purchases and sales of investment securities, income and dividends received and expenses denominated in foreign currencies are translated into U.S. dollars at the exchange rate in effect on the transaction date.
The effects of exchange rate fluctuations on investments are included with the net realized and unrealized gain (loss) on investment securities. Other foreign currency transactions resulting in realized and unrealized gain (loss) are disclosed separately.
Investment Transactions and Income. For financial reporting purposes, the Fund's investment holdings and NAV include trades executed through the end of the last business day of the period. The NAV per share for processing shareholder transactions is calculated as of the close of business of the New York Stock Exchange (NYSE), normally 4:00 p.m. Eastern time and includes trades executed through the end of the prior business day. Gains and losses on securities sold are determined on the basis of identified cost. Dividend income is recorded on the ex-dividend date, except for certain dividends from foreign securities where the ex-dividend date may have passed, which are recorded as soon as the Fund is informed of the ex-dividend date. Non-cash dividends included in dividend income, if any, are recorded at the fair market value of the securities received. Income and capital gain distributions from Fidelity Central Funds, if any, are recorded on the ex-dividend date. Distributions received on securities that represent a return of capital or capital gain are recorded as a reduction of cost of investments and/or as a realized gain. Subsequent to ex-dividend date the Fund determines the components of these distributions, based upon receipt of tax filings or other correspondence relating to the underlying investment. Interest income is accrued as earned and includes coupon interest and amortization of premium and accretion of discount on debt securities as applicable. Investment income is recorded net of foreign taxes withheld where recovery of such taxes is uncertain.
Annual Report
Notes to Financial Statements - continued
3. Significant Accounting Policies - continued
Class Allocations and Expenses. Investment income, realized and unrealized capital gains and losses, common expenses of the Fund, and certain fund-level expense reductions, if any, are allocated daily on a pro-rata basis to each class based on the relative net assets of each class to the total net assets of the Fund. Each class differs with respect to transfer agent fees incurred. Certain expense reductions may also differ by class. For the reporting period, the allocated portion of income and expenses to each class as a percent of its average net assets may vary due to the timing of recording these transactions in relation to fluctuating net assets of the classes. Expenses directly attributable to a fund are charged to that fund. Expenses attributable to more than one fund are allocated among the respective funds on the basis of relative net assets or other appropriate methods. Expense estimates are accrued in the period to which they relate and adjustments are made when actual amounts are known.
Income Tax Information and Distributions to Shareholders. Each year, the Fund intends to qualify as a regulated investment company under Subchapter M of the Internal Revenue Code, including distributing substantially all of its taxable income and realized gains. As a result, no provision for U.S. Federal income taxes is required. As of July 31, 2014, the Fund did not have any unrecognized tax benefits in the financial statements; nor is the Fund aware of any tax positions for which it is reasonably possible that the total amounts of unrecognized tax benefits will significantly change in the next twelve months. The Fund files a U.S. federal tax return, in addition to state and local tax returns as required. The Fund's federal income tax returns are subject to examination by the Internal Revenue Service (IRS) for a period of three fiscal years after they are filed. State and local tax returns may be subject to examination for an additional fiscal year depending on the jurisdiction. Foreign taxes are provided for based on the Fund's understanding of the tax rules and rates that exist in the foreign markets in which it invests.
Distributions are declared and recorded on the ex-dividend date. Income dividends and capital gain distributions are declared separately for each class. Income and capital gain distributions are determined in accordance with income tax regulations, which may differ from GAAP.
Capital accounts within the financial statements are adjusted for permanent book-tax differences. These adjustments have no impact on net assets or the results of operations. Capital accounts are not adjusted for temporary book-tax differences which will reverse in a subsequent period.
Annual Report
3. Significant Accounting Policies - continued
Income Tax Information and Distributions to Shareholders - continued
Book-tax differences are primarily due to foreign currency transactions, partnerships and losses deferred due to wash sales.
The federal tax cost of investment securities and unrealized appreciation (depreciation) as of period end were as follows:
Gross unrealized appreciation | $ 973,017,201 |
Gross unrealized depreciation | (170,748,097) |
Net unrealized appreciation (depreciation) on securities | $ 802,269,104 |
| |
Tax Cost | $ 7,181,599,820 |
The tax-based components of distributable earnings as of period end were as follows:
Undistributed ordinary income | $ 58,880,640 |
Net unrealized appreciation (depreciation) on securities and other investments | $ 802,269,254 |
The tax character of distributions paid was as follows:
| July 31, 2014 |
Ordinary Income | $ 7,849,502 |
Restricted Securities. The Fund may invest in securities that are subject to legal or contractual restrictions on resale. These securities generally may be resold in transactions exempt from registration or to the public if the securities are registered. Disposal of these securities may involve time-consuming negotiations and expense, and prompt sale at an acceptable price may be difficult. Information regarding restricted securities is included at the end of the Fund's Schedule of Investments.
4. Purchases and Sales of Investments.
Purchases and sales of securities other than short-term securities and in-kind transactions, aggregated $3,426,556,138 and $3,735,064,529, respectively.
5. Fees and Other Transactions with Affiliates.
Management Fee. Fidelity Management & Research Company (the investment adviser) and its affiliates provide the Fund with investment management related services for which the Fund pays a monthly management fee. The management fee is the sum of an individual fund fee rate that is based on an annual rate of .30% of the Fund's average net assets and an annualized group fee rate that averaged .25% during the
Annual Report
Notes to Financial Statements - continued
5. Fees and Other Transactions with Affiliates - continued
Management Fee - continued
period. The group fee rate is based upon the average net assets of all the mutual funds advised by the investment adviser, including any mutual funds previously advised by the investment adviser that are currently advised by Fidelity SelectCo, LLC, an affiliate of the investment adviser. The group fee rate decreases as assets under management increase and increases as assets under management decrease. In addition, the management fee is subject to a performance adjustment (up to a maximum of ± .20% of the Fund's average net assets over a 36 month performance period). The upward or downward adjustment to the management fee is based on the relative investment performance of Series Blue Chip Growth as compared to its benchmark index, the Russell 1000 Growth Index, over the same 36 month performance period. The Fund's performance adjustment will not take effect until November 1, 2014. Subsequent months will be added until the performance period includes 36 months. For the reporting period, the total annualized management fee rate was .55% of the Fund's average net assets.
Transfer Agent Fees. Fidelity Investments Institutional Operations Company, Inc., (FIIOC), an affiliate of the investment adviser, is the transfer, dividend disbursing and shareholder servicing agent for each class of the Fund. FIIOC receives account fees and asset-based fees that vary according to the account size and type of account of the shareholders of Series Blue Chip Growth. FIIOC receives no fees for providing transfer agency services to Class F. FIIOC pays for typesetting, printing and mailing of shareholder reports, except proxy statements.
For the period, transfer agent fees for each applicable class were as follows:
| Amount | % of
Average
Net Assets* |
Series Blue Chip Growth | $ 4,087,378 | .17 |
* Annualized
Accounting and Security Lending Fees. Fidelity Service Company, Inc. (FSC), an affiliate of the investment adviser, maintains the Fund's accounting records. The accounting fee is based on the level of average net assets for each month. Under a separate contract, FSC administers the security lending program. The security lending fee is based on the number and duration of lending transactions.
Brokerage Commissions. The Fund placed a portion of its portfolio transactions with brokerage firms which are affiliates of the investment adviser. Brokerage commissions are included in net realized gain (loss) and change in net unrealized appreciation (depreciation) in the Statement of Operations. The commissions paid to these affiliated firms were $8,909 for the period.
Annual Report
5. Fees and Other Transactions with Affiliates - continued
Interfund Lending Program. Pursuant to an Exemptive Order issued by the SEC, the Fund, along with other registered investment companies having management contracts with FMR or other affiliated entities of FMR, may participate in an interfund lending program. This program provides an alternative credit facility allowing the funds to borrow from, or lend money to, other participating affiliated funds. At period end, there were no interfund loans outstanding. The Fund's activity in this program during the period for which loans were outstanding was as follows:
Borrower or Lender | Average Loan
Balance | Weighted Average Interest Rate | Interest Expense |
Borrower | $ 21,696,261 | .32% | $ 4,420 |
Exchanges In-Kind. During the period, certain investment companies managed by the investment adviser or its affiliates (Investing Funds) completed exchanges in-kind with the Fund. The Investing Funds delivered investments valued at $7,325,217,400 in exchange for 732,521,740 shares of the Fund. The amount of in-kind exchanges is included in share transactions in the accompanying Statement of Changes in Net Assets as well as Note 10: Share Transactions. The Fund recognized no gain or loss for federal income tax purposes.
Other. During the period, the investment adviser reimbursed the Fund for certain losses in the amount of $188,955.
6. Committed Line of Credit.
The Fund participates with other funds managed by the investment adviser or an affiliate in a $4.25 billion credit facility (the "line of credit") to be utilized for temporary or emergency purposes to fund shareholder redemptions or for other short-term liquidity purposes. The Fund has agreed to pay commitment fees on its pro-rata portion of the line of credit, which amounted to $3,886 and is reflected in Miscellaneous expenses on the Statement of Operations. During the period, the Fund did not borrow on this line of credit.
7. Security Lending.
The Fund lends portfolio securities through a lending agent from time to time in order to earn additional income. For equity securities, a lending agent is used and may loan securities to certain qualified borrowers, including Fidelity Capital Markets (FCM), a broker-dealer affiliated with the Fund. On the settlement date of the loan, the Fund receives collateral (in the form of U.S. Treasury obligations, letters of credit and/or cash) against the loaned securities and maintains collateral in an amount not less than 100% of the market value of the loaned securities during the period of the loan. The market value
Annual Report
Notes to Financial Statements - continued
7. Security Lending - continued
of the loaned securities is determined at the close of business of the Fund and any additional required collateral is delivered to the Fund on the next business day. If the borrower defaults on its obligation to return the securities loaned because of insolvency or other reasons, the Fund may apply collateral received from the borrower against the obligation. The Fund may experience delays and costs in recovering the securities loaned. Any cash collateral received is invested in the Fidelity Securities Lending Cash Central Fund. The value of loaned securities and cash collateral at period end are disclosed on the Fund's Statement of Assets and Liabilities. Security lending income represents the income earned on investing cash collateral, less rebates paid to borrowers and any lending agent fees associated with the loan, plus any premium payments received for lending certain types of securities. Security lending income is presented in the Statement of Operations as a component of income from Fidelity Central Funds. Total security lending income during the period amounted to $418,809. During the period, there were no securities loaned to FCM.
8. Expense Reductions.
Commissions paid to certain brokers with whom the investment adviser, or its affiliates, places trades on behalf of the Fund include an amount in addition to trade execution, which may be rebated back to the Fund to offset certain expenses. This amount totaled $90,730 for the period.
9. Distributions to Shareholders.
Distributions to shareholders of each class were as follows:
Year ended July 31, | 2014 A |
From net investment income | |
Series Blue Chip Growth | $ 2,859,214 |
Class F | 4,990,288 |
Total | $ 7,849,502 |
A For the period November 7, 2013 (commencement of operations) to July 31, 2014. | |
Annual Report
10. Share Transactions.
Transactions for each class of shares were as follows:
| Shares | Dollars |
Year ended July 31, | 2014 A | 2014 A |
Series Blue Chip Growth | | |
Shares sold | 343,560,306 B | $ 3,450,544,092 B |
Reinvestment of distributions | 280,041 | 2,859,214 |
Shares redeemed | (49,687,546) | (532,601,253) |
Net increase (decrease) | 294,152,801 | $ 2,920,802,053 |
Class F | | |
Shares sold | 468,726,617 B | $ 4,729,291,768 B |
Reinvestment of distributions | 488,765 | 4,990,288 |
Shares redeemed | (57,863,142) | (624,164,143) |
Net increase (decrease) | 411,352,240 | $ 4,110,117,913 |
A For the period November 7, 2013 (commencement of operations) to July 31, 2014.
B Amount includes in-kind exchanges (see Note 5: Exchanges In-Kind).
11. Other.
The Fund's organizational documents provide former and current trustees and officers with a limited indemnification against liabilities arising in connection with the performance of their duties to the Fund. In the normal course of business, the Fund may also enter into contracts that provide general indemnifications. The Fund's maximum exposure under these arrangements is unknown as this would be dependent on future claims that may be made against the Fund. The risk of material loss from such claims is considered remote.
At the end of the period, mutual funds managed by the investment adviser or its affiliates were the owners of record of all of the outstanding shares of the Fund.
Annual Report
To the Trustees of Fidelity Securities Fund and Shareholders of Fidelity Series Blue Chip Growth Fund:
We have audited the accompanying statement of assets and liabilities of Fidelity Series Blue Chip Growth Fund (the Fund), a fund of Fidelity Securities Fund, including the schedule of investments, as of July 31, 2014, and the related statement of operations, the statement of changes in net assets and financial highlights for the period from November 7, 2013 (commencement of operations) to July 31, 2014. These financial statements and financial highlights are the responsibility of the Fund's management. Our responsibility is to express an opinion on these financial statements and financial highlights based on our audit.
We conducted our audit in accordance with the standards of the Public Company Accounting Oversight Board (United States). Those standards require that we plan and perform the audit to obtain reasonable assurance about whether the financial statements and financial highlights are free of material misstatement. The Fund is not required to have, nor were we engaged to perform, an audit of its internal control over financial reporting. Our audits included consideration of internal control over financial reporting as a basis for designing audit procedures that are appropriate in the circumstances, but not for the purpose of expressing an opinion on the effectiveness of the Fund's internal control over financial reporting. Accordingly, we express no such opinion. An audit also includes examining, on a test basis, evidence supporting the amounts and disclosures in the financial statements, assessing the accounting principles used and significant estimates made by management, as well as evaluating the overall financial statement presentation. Our procedures included confirmation of securities owned as of July 31, 2014, by correspondence with the custodians and brokers; where replies were not received from brokers, we performed other auditing procedures. We believe that our audit provides a reasonable basis for our opinion.
In our opinion, the financial statements and financial highlights referred to above present fairly, in all material respects, the financial position of Fidelity Series Blue Chip Growth Fund as of July 31, 2014, and the results of its operations, the changes in its net assets and the financial highlights for the period from November 7, 2013 (commencement of operations) to July 31, 2014, in conformity with accounting principles generally accepted in the United States of America.
DELOITTE & TOUCHE LLP
Boston, Massachusetts
September 15, 2014
Annual Report
The Trustees, Member of the Advisory Board, and officers of the trust and fund, as applicable, are listed below. The Board of Trustees governs the fund and is responsible for protecting the interests of shareholders. The Trustees are experienced executives who meet periodically throughout the year to oversee the fund's activities, review contractual arrangements with companies that provide services to the fund, oversee management of the risks associated with such activities and contractual arrangements, and review the fund's performance. Except for James C. Curvey, each of the Trustees oversees 173 funds. Mr. Curvey oversees 397 funds.
The Trustees hold office without limit in time except that (a) any Trustee may resign; (b) any Trustee may be removed by written instrument, signed by at least two-thirds of the number of Trustees prior to such removal; (c) any Trustee who requests to be retired or who has become incapacitated by illness or injury may be retired by written instrument signed by a majority of the other Trustees; and (d) any Trustee may be removed at any special meeting of shareholders by a two-thirds vote of the outstanding voting securities of the trust. Each Trustee who is not an interested person (as defined in the 1940 Act) of the trust and the fund (Independent Trustee), shall retire not later than the last day of the calendar year in which his or her 75th birthday occurs. The Independent Trustees may waive this mandatory retirement age policy with respect to individual Trustees. The officers and Advisory Board Member hold office without limit in time, except that any officer and Advisory Board Member may resign or may be removed by a vote of a majority of the Trustees at any regular meeting or any special meeting of the Trustees. Except as indicated, each individual has held the office shown or other offices in the same company for the past five years.
Experience, Skills, Attributes, and Qualifications of the Fund's Trustees. The Governance and Nominating Committee has adopted a statement of policy that describes the experience, qualifications, attributes, and skills that are necessary and desirable for potential Independent Trustee candidates (Statement of Policy). The Board believes that each Trustee satisfied at the time he or she was initially elected or appointed a Trustee, and continues to satisfy, the standards contemplated by the Statement of Policy. The Governance and Nominating Committee also engages professional search firms to help identify potential Independent Trustee candidates who have the experience, qualifications, attributes, and skills consistent with the Statement of Policy. From time to time, additional criteria based on the composition and skills of the current Independent Trustees, as well as experience or skills that may be appropriate in light of future changes to board composition, business conditions, and regulatory or other developments, have also been considered by the professional search firms and the Governance and Nominating Committee. In addition, the Board takes into account the Trustees' commitment and participation in Board and committee meetings, as well as their leadership of standing and ad hoc committees throughout their tenure.
In determining that a particular Trustee was and continues to be qualified to serve as a Trustee, the Board has considered a variety of criteria, none of which, in isolation, was controlling. The Board believes that, collectively, the Trustees have balanced and diverse experience, qualifications, attributes, and skills, which allow the Board to operate effectively in governing the fund and protecting the interests of shareholders. Information about the specific experience, skills, attributes, and qualifications of each Trustee, which in each case led to the Board's conclusion that the Trustee should serve (or continue to serve) as a trustee of the fund, is provided below.
Annual Report
Board Structure and Oversight Function. James C. Curvey is an interested person (as defined in the 1940 Act) and currently serves as Chairman. The Trustees have determined that an interested Chairman is appropriate and benefits shareholders because an interested Chairman has a personal and professional stake in the quality and continuity of services provided to the fund. Independent Trustees exercise their informed business judgment to appoint an individual of their choosing to serve as Chairman, regardless of whether the Trustee happens to be independent or a member of management. The Independent Trustees have determined that they can act independently and effectively without having an Independent Trustee serve as Chairman and that a key structural component for assuring that they are in a position to do so is for the Independent Trustees to constitute a substantial majority for the Board. The Independent Trustees also regularly meet in executive session. Ned C. Lautenbach serves as Chairman of the Independent Trustees and as such (i) acts as a liaison between the Independent Trustees and management with respect to matters important to the Independent Trustees and (ii) with management prepares agendas for Board meetings.
Fidelity funds are overseen by different Boards of Trustees. The fund's Board oversees Fidelity's equity and high income funds and another Board oversees Fidelity's investment-grade bond, money market, and asset allocation funds. The asset allocation funds may invest in Fidelity funds overseen by the fund's Board. The use of separate Boards, each with its own committee structure, allows the Trustees of each group of Fidelity funds to focus on the unique issues of the funds they oversee, including common research, investment, and operational issues. On occasion, the separate Boards establish joint committees to address issues of overlapping consequences for the Fidelity funds overseen by each Board.
The Trustees operate using a system of committees to facilitate the timely and efficient consideration of all matters of importance to the Trustees, the fund, and fund shareholders and to facilitate compliance with legal and regulatory requirements and oversight of the fund's activities and associated risks. The Board, acting through its committees, has charged FMR and its affiliates with (i) identifying events or circumstances the occurrence of which could have demonstrably adverse effects on the fund's business and/or reputation; (ii) implementing processes and controls to lessen the possibility that such events or circumstances occur or to mitigate the effects of such events or circumstances if they do occur; and (iii) creating and maintaining a system designed to evaluate continuously business and market conditions in order to facilitate the identification and implementation processes described in (i) and (ii) above. Because the day-to-day operations and activities of the fund are carried out by or through FMR, its affiliates and other service providers, the fund's exposure to risks is mitigated but not eliminated by the processes overseen by the Trustees. While each of the Board's committees has responsibility for overseeing different aspects of the fund's activities, oversight is exercised primarily through the Operations, Audit, and Compliance Committees. In addition, the Independent Trustees have worked with FMR to enhance the Board's oversight of investment and financial risks, legal and regulatory risks, technology risks, and operational risks, including the development of additional risk reporting to the Board. For example, a working group comprised of Independent Trustees and FMR has worked and continues to work to review the Fidelity funds' valuation-related activities, reporting and risk management. Appropriate personnel, including but not limited to the fund's Chief Compliance Officer (CCO), FMR's internal auditor, the independent accountants, the fund's Treasurer and portfolio management personnel, make periodic reports to the Board's committees, as appropriate, including an annual review of FMR's risk management program for the Fidelity funds. The responsibilities of each standing committee, including their oversight responsibilities, are described further under "Standing Committees of the Fund's Trustees."
Annual Report
Trustees and Officers - continued
The fund's Statement of Additional Information (SAI) includes more information about the Trustees. To request a free copy, call Fidelity at 1-800-544-8544 for Fidelity Series Blue Chip Growth Fund, or 1-800-835-5092 for Class F.
Interested Trustees*:
Correspondence intended for each Trustee who is an interested person may be sent to Fidelity Investments, 245 Summer Street, Boston, Massachusetts 02210.
Name, Year of Birth; Principal Occupations and Other Relevant Experience+ |
James C. Curvey (1935) |
Year of Election or Appointment: 2007 Trustee Chairman of the Board of Trustees |
| Mr. Curvey also serves as Trustee of other Fidelity funds. Mr. Curvey is a Director of Fidelity Research & Analysis Co. (2009-present), and Vice Chairman (2007-present) and Director of FMR LLC. In addition, Mr. Curvey serves as an Overseer for the Boston Symphony Orchestra and a member of the Trustees of Villanova University. Previously, Mr. Curvey served as a Director of Fidelity Investments Money Management, Inc. (2009-2014), a Director of FMR (2007-2014), a Director of FMR Co., Inc. (2007-2014) and was the Vice Chairman (2006-2007) and Director (2000-2007) of FMR Corp. |
Charles S. Morrison (1960) |
Year of Election or Appointment: 2014 Trustee |
| Mr. Morrison also serves as Trustee of other funds. He serves as President, Asset Management (2014-present) and is an employee of Fidelity Investments. Previously, Mr. Morrison served as Vice President of Fidelity's Fixed Income and Asset Allocation Funds (2012-2014), President, Fixed Income (2011-2014), Vice President of Fidelity's Money Market Funds (2005-2009), President, Money Market Group Leader of FMR (2009), and Senior Vice President, Money Market Group of FMR (2004-2009). Mr. Morrison also served as Vice President of Fidelity's Bond Funds (2002-2005), certain Balanced Funds (2002-2005), and certain Asset Allocation Funds (2002-2007), and as Senior Vice President (2002-2005) of Fidelity's Bond Division. |
* Trustees have been determined to be "Interested Trustees" by virtue of, among other things, their affiliation with the trust or various entities under common control with FMR.
+ The information above includes each Trustee's principal occupation during the last five years and other information relating to the experience, attributes, and skills relevant to each Trustee's qualifications to serve as a Trustee, which led to the conclusion that each Trustee should serve as a Trustee for the fund.
Annual Report
Trustees and Officers - continued
Independent Trustees:
Correspondence intended for each Independent Trustee (that is, the Trustees other than the Interested Trustees) may be sent to Fidelity Investments, P.O. Box 55235, Boston, Massachusetts 02205-5235.
Name, Year of Birth; Principal Occupations and Other Relevant Experience+ |
Dennis J. Dirks (1948) |
Year of Election or Appointment: 2005 Trustee |
| Mr. Dirks also serves as Trustee of other Fidelity funds. Prior to his retirement in May 2003, Mr. Dirks was Chief Operating Officer and a member of the Board of The Depository Trust & Clearing Corporation (DTCC). He also served as President, Chief Operating Officer, and Board member of The Depository Trust Company (DTC) and President and Board member of the National Securities Clearing Corporation (NSCC). In addition, Mr. Dirks served as Chief Executive Officer and Board member of the Government Securities Clearing Corporation, Chief Executive Officer and Board member of the Mortgage-Backed Securities Clearing Corporation, as a Trustee and a member of the Finance Committee of Manhattan College (2005-2008), and as a Trustee and a member of the Finance Committee of AHRC of Nassau County (2006-2008). Mr. Dirks is a member of the Independent Directors Council (IDC) Governing Council (2010-present) and Board of Directors for The Brookville Center for Children's Services, Inc. (2009-present). |
Alan J. Lacy (1953) |
Year of Election or Appointment: 2008 Trustee |
| Mr. Lacy also serves as Trustee of other Fidelity funds. Mr. Lacy serves as Senior Adviser (2007-present) of Oak Hill Capital Partners, L.P. (private equity). Mr. Lacy also served as Chief Executive Officer (2000-2005) and Vice Chairman (2005-2006) of Sears Holdings Corporation and Sears, Roebuck and Co. (retail). In addition, Mr. Lacy serves as a member of the Board of Directors of Dave & Buster's Entertainment, Inc. (restaurant and entertainment complexes, 2010-present), Earth Fare, Inc. (retail grocery, 2012-present), The Hillman Companies, Inc. (hardware wholesalers, 2010-present), and Bristol-Myers Squibb Company (global pharmaceuticals, 2008-present). Mr. Lacy is a member of the Board of Trustees of The National Parks Conservation Association (2006-present). Previously, Mr. Lacy served as Chairman of the Board of Trustees of the National Parks Conservation Association (2008-2011) and as a member of the Board of Directors for the Western Union Company (global money transfer, 2006-2011). |
Ned C. Lautenbach (1944) |
Year of Election or Appointment: 2000 Trustee Chairman of the Independent Trustees |
| Mr. Lautenbach also serves as Trustee of other Fidelity funds. Mr. Lautenbach currently serves as the Lead Director of the Eaton Corporation Board of Directors (diversified industrial, 1997-present). Mr. Lautenbach is Chairman of the Board of Directors of the Philharmonic Center for the Arts in Naples, Florida (2012-present) and a member of the Council on Foreign Relations (1994-present). Previously, Mr. Lautenbach was a Partner/Advisory Partner at Clayton, Dubilier & Rice, LLC (private equity investment, 1998-2010), as well as a Director of Sony Corporation (2006-2007). |
Joseph Mauriello (1944) |
Year of Election or Appointment: 2008 Trustee |
| Mr. Mauriello also serves as Trustee of other Fidelity funds. Prior to his retirement in January 2006, Mr. Mauriello served in numerous senior management positions including Deputy Chairman and Chief Operating Officer (2004-2005), and Vice Chairman of Financial Services (2002-2004) of KPMG LLP US (professional services, 1965-2005). Mr. Mauriello currently serves as a member of the Board of Directors of XL Group plc. (global insurance and re-insurance, 2006-present). Previously, Mr. Mauriello served as a Director of the Hamilton Funds of the Bank of New York (2006-2007) and of Arcadia Resources Inc. (health care services and products, 2007-2012). |
Robert W. Selander (1950) |
Year of Election or Appointment: 2011 Trustee |
| Mr. Selander also serves as Trustee of other Fidelity funds. Previously, Mr. Selander served as a Member of the Advisory Board of other Fidelity funds (2011), and Executive Vice Chairman (2010), Chief Executive Officer (2009-2010), and President and Chief Executive Officer (1997-2009) of Mastercard, Inc. |
Cornelia M. Small (1944) |
Year of Election or Appointment: 2005 Trustee |
| Ms. Small also serves as Trustee of other Fidelity funds. Ms. Small is a member of the Board of Directors (2009-present) and Chair of the Investment Committee (2010-present) of the Teagle Foundation. Ms. Small also serves on the Investment Committee of the Berkshire Taconic Community Foundation (2008-present). Previously, Ms. Small served as Chairperson (2002-2008) and a member of the Investment Committee and Chairperson (2008-2012) and a member of the Board of Trustees of Smith College. In addition, Ms. Small served as Chief Investment Officer, Director of Global Equity Investments, and a member of the Board of Directors of Scudder, Stevens & Clark and Scudder Kemper Investments. |
William S. Stavropoulos (1939) |
Year of Election or Appointment: 2002 Trustee Vice Chairman of the Independent Trustees |
| Mr. Stavropoulos also serves as Trustee of other Fidelity funds. Mr. Stavropoulos serves as President and Founder of the Michigan Baseball Foundation, the Great Lakes Loons (2007-present). Mr. Stavropoulos is Chairman Emeritus of the Board of Directors of The Dow Chemical Company, where he previously served in numerous senior management positions, including President, CEO (1995-2000; 2002-2004), Chairman of the Executive Committee (2000-2006), and as a member of the Board of Directors (1990-2006). Currently, Mr. Stavropoulos is Chairman of the Board of Directors of Univar Inc. (global distributor of commodity and specialty chemicals), a Director of Teradata Corporation (data warehousing and technology solutions), and Maersk Inc. (industrial conglomerate), and a member of the Advisory Board for Metalmark Capital LLC (private equity investment, 2005-present). Mr. Stavropoulos is an operating advisor to Clayton, Dubilier & Rice, LLC (private equity investment). In addition, Mr. Stavropoulos is a member of the University of Notre Dame Advisory Council for the College of Science, a Trustee of the Rollin L. Gerstacker Foundation, and a Director of the Naples Philharmonic Center for the Arts. Previously, Mr. Stavropoulos served as a Director of Chemical Financial Corporation (bank holding company, 1993-2012) and Tyco International, Ltd. (multinational manufacturing and services, 2007-2012). |
David M. Thomas (1949) |
Year of Election or Appointment: 2008 Trustee |
| Mr. Thomas also serves as Trustee of other Fidelity funds. Mr. Thomas serves as Non-Executive Chairman of the Board of Directors of Fortune Brands Home and Security (home and security products, 2011-present), and as a member of the Board of Directors of Interpublic Group of Companies, Inc. (marketing communication, 2004-present). Previously, Mr. Thomas served as Executive Chairman (2005-2006) and Chairman and Chief Executive Officer (2000-2005) of IMS Health, Inc. (pharmaceutical and healthcare information solutions), and a Director of Fortune Brands, Inc. (consumer products, 2000-2011). |
+ The information above includes each Trustee's principal occupation during the last five years and other information relating to the experience, attributes, and skills relevant to each Trustee's qualifications to serve as a Trustee, which led to the conclusion that each Trustee should serve as a Trustee for the fund.
Advisory Board Member and Officers:
Correspondence intended for each officer and Peter S. Lynch may be sent to Fidelity Investments, 245 Summer Street, Boston, Massachusetts 02210. Officers appear below in alphabetical order.
Name, Year of Birth; Principal Occupation |
Peter S. Lynch (1944) |
Year of Election or Appointment: 2003 Member of the Advisory Board |
| Mr. Lynch also serves as Member of the Advisory Board of other Fidelity funds. Mr. Lynch is Vice Chairman and a Director of FMR and FMR Co., Inc. In addition, Mr. Lynch serves as a Trustee of Boston College and as the Chairman of the Inner-City Scholarship Fund. Previously, Mr. Lynch served on the Special Olympics International Board of Directors (1997-2006). |
Elizabeth Paige Baumann (1968) |
Year of Election or Appointment: 2012 Anti-Money Laundering (AML) Officer |
| Ms. Baumann also serves as AML Officer of other funds. She is Chief AML Officer of FMR LLC (2012-present) and is an employee of Fidelity Investments. Previously, Ms. Baumann served as Vice President and Deputy Anti-Money Laundering Officer (2007-2012). |
William C. Coffey (1969) |
Year of Election or Appointment: 2009 Assistant Secretary |
| Mr. Coffey also serves as Assistant Secretary of other funds. He is Senior Vice President and Deputy General Counsel of FMR LLC (2010-present), and is an employee of Fidelity Investments. Previously, Mr. Coffey served as Vice President and Associate General Counsel of FMR LLC (2005-2009). |
Jonathan Davis (1968) |
Year of Election or Appointment: 2010 Assistant Treasurer |
| Mr. Davis also serves as Assistant Treasurer of other funds. Mr. Davis is an employee of Fidelity Investments. Previously, Mr. Davis served as Vice President and Associate General Counsel of FMR LLC (2003-2010). |
Adrien E. Deberghes (1967) |
Year of Election or Appointment: 2008 Deputy Treasurer |
| Mr. Deberghes also serves as an officer of other funds. He is an employee of Fidelity Investments (2008-present). Prior to joining Fidelity Investments, Mr. Deberghes was Senior Vice President of Mutual Fund Administration at State Street Corporation (2007-2008), Senior Director of Mutual Fund Administration at Investors Bank & Trust (2005-2007), and Director of Finance for Dunkin' Brands (2000-2005). |
Stephanie J. Dorsey (1969) |
Year of Election or Appointment: 2010 Assistant Treasurer |
| Ms. Dorsey also serves as an officer of other funds. She is an employee of Fidelity Investments (2008-present) and has served in other fund officer roles. Prior to joining Fidelity Investments, Ms. Dorsey served as Treasurer (2004-2008) of the JPMorgan Mutual Funds and Vice President (2004-2008) of JPMorgan Chase Bank. |
Howard J. Galligan III (1966) |
Year of Election or Appointment: 2014 Chief Financial Officer |
| Mr. Galligan also serves as Chief Financial Officer of other funds. Mr. Galligan serves as President of Fidelity Pricing and Cash Management Services (FPCMS) (2014-present) and as a Director of Strategic Advisers, Inc. (2008-present). Previously, Mr. Galligan served as Chief Administrative Officer of Asset Management (2011-2014) and Chief Operating Officer and Senior Vice President of Investment Support for Strategic Advisers, Inc. (2003-2011). |
Scott C. Goebel (1968) |
Year of Election or Appointment: 2008 Secretary and Chief Legal Officer (CLO) |
| Mr. Goebel serves as Secretary and CLO of other funds. Mr. Goebel also serves as Secretary of Fidelity SelectCo, LLC (2013-present), Fidelity Investments Money Management, Inc. (FIMM) (2010-present) and Fidelity Research and Analysis Company (FRAC) (2010-present); General Counsel, Secretary, and Senior Vice President of FMR (2008-present) and FMR Co., Inc. (2008-present); Chief Legal Officer of Fidelity Management & Research (Hong Kong) Limited (2008-present); and Assistant Secretary of Fidelity Management & Research (Japan) Inc. (2008-present) and Fidelity Management & Research (U.K.) Inc. (2008-present). Previously, Mr. Goebel served as Secretary and CLO of other Fidelity funds (2008-2013), Assistant Secretary of FIMM (2008-2010), FRAC (2008-2010), and certain funds (2007-2008); and as Vice President and Secretary of Fidelity Distributors Corporation (FDC) (2005-2007). Mr. Goebel has been employed by FMR LLC or an affiliate since 2001. |
Brian B. Hogan (1964) |
Year of Election or Appointment: 2013 Vice President |
| Mr. Hogan also serves as Trustee or Vice President of other funds. Mr. Hogan serves as President of FMR's Equity Division (2009-present). Previously, Mr. Hogan served as Senior Vice President, Equity Research of FMR (2006-2009) and as a portfolio manager. |
Chris Maher (1972) |
Year of Election or Appointment: 2013 Assistant Treasurer |
| Mr. Maher serves as Assistant Treasurer of other funds. Mr. Maher is Vice President of Valuation Oversight and is an employee of Fidelity Investments. Previously, Mr. Maher served as Vice President of Asset Management Compliance (2013), Vice President of FMR's Program Management Group (2010-2013), and Vice President of Valuation Oversight (2008-2010). |
Melissa M. Reilly (1971) |
Year of Election or Appointment: 2014 Vice President of certain Equity Funds |
| Ms. Reilly also serves as Vice President of other funds. Ms. Reilly is an employee of Fidelity Investments (2004-present). |
Kenneth B. Robins (1969) |
Year of Election or Appointment: 2008 President and Treasurer |
| Mr. Robins also serves as an officer of other funds. Mr. Robins serves as Executive Vice President of Fidelity Investments Money Management, Inc. (FIMM) (2013-present) and is an employee of Fidelity Investments (2004-present). Previously, Mr. Robins served in other fund officer roles. |
Stephen Sadoski (1971) |
Year of Election or Appointment: 2012 Deputy Treasurer |
| Mr. Sadoski also serves as Deputy Treasurer of other funds. He is an employee of Fidelity Investments (2012-present) and has served in another fund officer role. Prior to joining Fidelity Investments, Mr. Sadoski served as an assistant chief accountant in the Division of Investment Management of the Securities and Exchange Commission (SEC) (2009-2012) and as a senior manager at Deloitte & Touche LLP (1997-2009). |
Stacie M. Smith (1974) |
Year of Election or Appointment: 2013 Deputy Treasurer |
| Ms. Smith also serves as an officer of other funds. She is an employee of Fidelity Investments (2009-present) and has served in other fund officer roles. Prior to joining Fidelity Investments, Ms. Smith served as Senior Audit Manager of Ernst & Young LLP (1996-2009). |
Renee Stagnone (1975) |
Year of Election or Appointment: 2013 Deputy Treasurer |
| Ms. Stagnone also serves as Deputy Treasurer of other funds. Ms. Stagnone is an employee of Fidelity Investments. |
Linda J. Wondrack (1964) |
Year of Election or Appointment: 2014 Chief Compliance Officer |
| Ms. Wondrack also serves as Chief Compliance Officer of other funds. Ms. Wondrack is Executive Vice President and head of the Ethics Office and Asset Management Compliance for Fidelity Investments (2012- present). Ms. Wondrack also serves as Chief Compliance Officer of Fidelity SelectCo, LLC (2014-present); Chief Compliance Officer of Impresa Management LLC (2013-present); and Chief Compliance Officer of FMR Co., Inc., Fidelity Investments Money Management, Inc., Fidelity Management & Research (Japan) Inc., Fidelity Management & Research (U.K.) Inc., Fidelity Management & Research (Hong Kong), Fidelity Management & Research Company, Pyramis Global Advisors, LLC, and Strategic Advisers, Inc., Ballyrock Investment Advisors LLC, and Northern Neck Investors LLC (2012-present). Previously, Ms. Wondrack served as Senior Vice President and Chief Compliance Officer for Columbia Management Investment Advisers, LLC (2005-2012); Chief Compliance Officer for certain funds within the Columbia Family of Funds (2007-2012); and Senior Vice President of Compliance Risk Management at Bank of America (2005-2010). |
Joseph F. Zambello (1957) |
Year of Election or Appointment: 2011 Deputy Treasurer |
| Mr. Zambello also serves as Deputy Treasurer of other funds. Mr. Zambello is an employee of Fidelity Investments. Previously, Mr. Zambello served as Vice President of FMR's Program Management Group (2009-2011) and Vice President of the Transfer Agent Oversight Group (2005-2009). |
Annual Report
The Board of Trustees of Fidelity Series Blue Chip Growth Fund voted to pay to shareholders of record at the opening of business on record date, the following distributions per share derived from capital gains realized from sales of portfolio securities; and dividends derived from net investment income:
| Pay Date | Record Date | Dividends | Capital Gains |
Series Blue Chip Growth | 09/08/14 | 09/05/14 | $0.011 | $0.068 |
Class F | 09/08/14 | 09/05/14 | $0.021 | $0.068 |
Series Blue Chip Growth and Class F designate 100% of the dividends distributed during the fiscal year as qualifying for the dividends-received deduction for corporate shareholders.
Series Blue Chip Growth and Class F designate 100% of the dividends distributed during the fiscal year as amounts which can be taken into account as a dividend for the purposes of the maximum rate under section 1(h)(11) of the Internal Revenue Code.
The fund will notify shareholders in January 2015 of amounts for use in preparing 2014 income tax returns.
Annual Report
Board Approval of Investment Advisory Contracts and Management Fees
Fidelity Series Blue Chip Growth Fund
In connection with a separate internal corporate reorganization involving Fidelity Management & Research (Japan) Inc. (FMR Japan), the Board approved certain non-material amendments to the fund's subadvisory agreement with FMR Japan to reflect that, after this reorganization, Fidelity Management & Research (Japan) Limited will carry on the business of FMR Japan. The Board noted that no changes to the portfolio managers or to the foreign research or investment advisory services provided to the funds were expected in connection with the reorganization and that the same personnel and resources will be available to the funds with the new entity. After considering all of the factors it believed relevant, the Board concluded that the amended sub-advisory agreement should be approved.
Annual Report
Investment Adviser
Fidelity Management & Research Company
Boston, MA
Investment Sub-Advisers
FMR Co., Inc.
Fidelity Management & Research
(Hong Kong) Limited
Fidelity Management & Research
(Japan) Inc.
General Distributor
Fidelity Distributors Corporation
Smithfield, RI
Transfer and Service Agents
Fidelity Investments Institutional Operations Company, Inc.
Boston, MA
Fidelity Service Company, Inc.
Boston, MA
Custodian
State Street Bank and Trust Company
Quincy, MA
(Fidelity Investment logo)(registered trademark)
Corporate Headquarters
245 Summer St., Boston, MA 02210
www.fidelity.com
XS1-ANN-0914
1.967985.100
(Fidelity Investment logo)(registered trademark)
Fidelity Advisor®
Small Cap Growth
Fund - Class A, Class T,
Class B and Class C
Annual Report
July 31, 2014
(Fidelity Cover Art)
Class A, Class T, Class B,
and Class C are classes
of Fidelity® Small Cap
Growth Fund
Contents
Performance | (Click Here) | How the fund has done over time. |
Management's Discussion of Fund Performance | (Click Here) | The Portfolio Manager's review of fund performance and strategy. |
Shareholder Expense Example | (Click Here) | An example of shareholder expenses. |
Investment Changes | (Click Here) | A summary of major shifts in the fund's investments over the past six months. |
Investments | (Click Here) | A complete list of the fund's investments with their market values. |
Financial Statements | (Click Here) | Statements of assets and liabilities, operations, and changes in net assets, as well as financial highlights. |
Notes | (Click Here) | Notes to the financial statements. |
Report of Independent Registered Public Accounting Firm | (Click Here) | |
Trustees and Officers | (Click Here) | |
Distributions | (Click Here) | |
Board Approval of Investment Advisory Contracts and Management Fees | (Click Here) | |
To view a fund's proxy voting guidelines and proxy voting record for the 12-month period ended June 30, visit http://www.fidelity.com/proxyvotingresults or visit the Securities and Exchange Commission's (SEC) web site at http://www.sec.gov. You may also call 1-877-208-0098 to request a free copy of the proxy voting guidelines.
Standard & Poor's, S&P and S&P 500 are registered service marks of The McGraw-Hill Companies, Inc. and have been licensed for use by Fidelity Distributors Corporation.
Other third-party marks appearing herein are the property of their respective owners.
All other marks appearing herein are registered or unregistered trademarks or service marks of FMR LLC or an affiliated company. © 2014 FMR LLC. All rights reserved.
Annual Report
This report and the financial statements contained herein are submitted for the general information of the shareholders of the fund. This report is not authorized for distribution to prospective investors in the fund unless preceded or accompanied by an effective prospectus.
A fund files its complete schedule of portfolio holdings with the SEC for the first and third quarters of each fiscal year on Form N-Q. Forms N-Q are available on the SEC's web site at http://www.sec.gov. A fund's Forms N-Q may be reviewed and copied at the SEC's Public Reference Room in Washington, DC. Information regarding the operation of the SEC's Public Reference Room may be obtained by calling 1-800-SEC-0330. For a complete list of a fund's portfolio holdings, view the most recent holdings listing, semiannual report, or annual report on Fidelity's web site at http://www.fidelity.com, http://www.advisor.fidelity.com, or http://www.401k.com, as applicable.
NOT FDIC INSURED • MAY LOSE VALUE • NO BANK GUARANTEE
Neither the fund nor Fidelity Distributors Corporation is a bank.
Annual Report
Average annual total return reflects the change in the value of an investment, assuming reinvestment of the class' distributions from dividend income and capital gains (the profits earned upon the sale of securities that have grown in value, if any) and assuming a constant rate of performance each year. The $10,000 table and the fund's returns do not reflect the deduction of taxes that a shareholder would pay on fund distributions or the redemption of fund shares. During periods of reimbursement by Fidelity, a fund's total return will be greater than it would be had the reimbursement not occurred. How a fund did yesterday is no guarantee of how it will do tomorrow. Returns reflect the conversion of Class B shares to Class A shares after a maximum of seven years.
Average Annual Total Returns
Periods ended July 31, 2014 | Past 1
year | Past 5
years | Life of
fundA |
Class A (incl. 5.75% sales charge) | 2.34% | 15.29% | 9.36% |
Class T (incl. 3.50% sales charge) | 4.51% | 15.53% | 9.35% |
Class B (incl. contingent deferred sales charge) B | 3.21% | 15.55% | 9.43% |
Class C (incl. contingent deferred sales charge) C | 6.79% | 15.78% | 9.20% |
A From November 3, 2004.
B Class B shares' contingent deferred sales charges included in the past one year, past five years, and life of fund total return figures are 5%, 2%, and 0%, respectively.
C Class C shares' contingent deferred sales charges included in the past one year, past five years, and life of fund total return figures are 1%, 0%, and 0%, respectively.
Annual Report
$10,000 Over Life of Fund
Let's say hypothetically that $10,000 was invested in Fidelity Advisor® Small Cap Growth Fund - Class A on November 3, 2004, when the fund started, and the current 5.75% sales charge was paid. The chart shows how the value of your investment would have changed, and also shows how the Russell 2000® Growth Index performed over the same period.
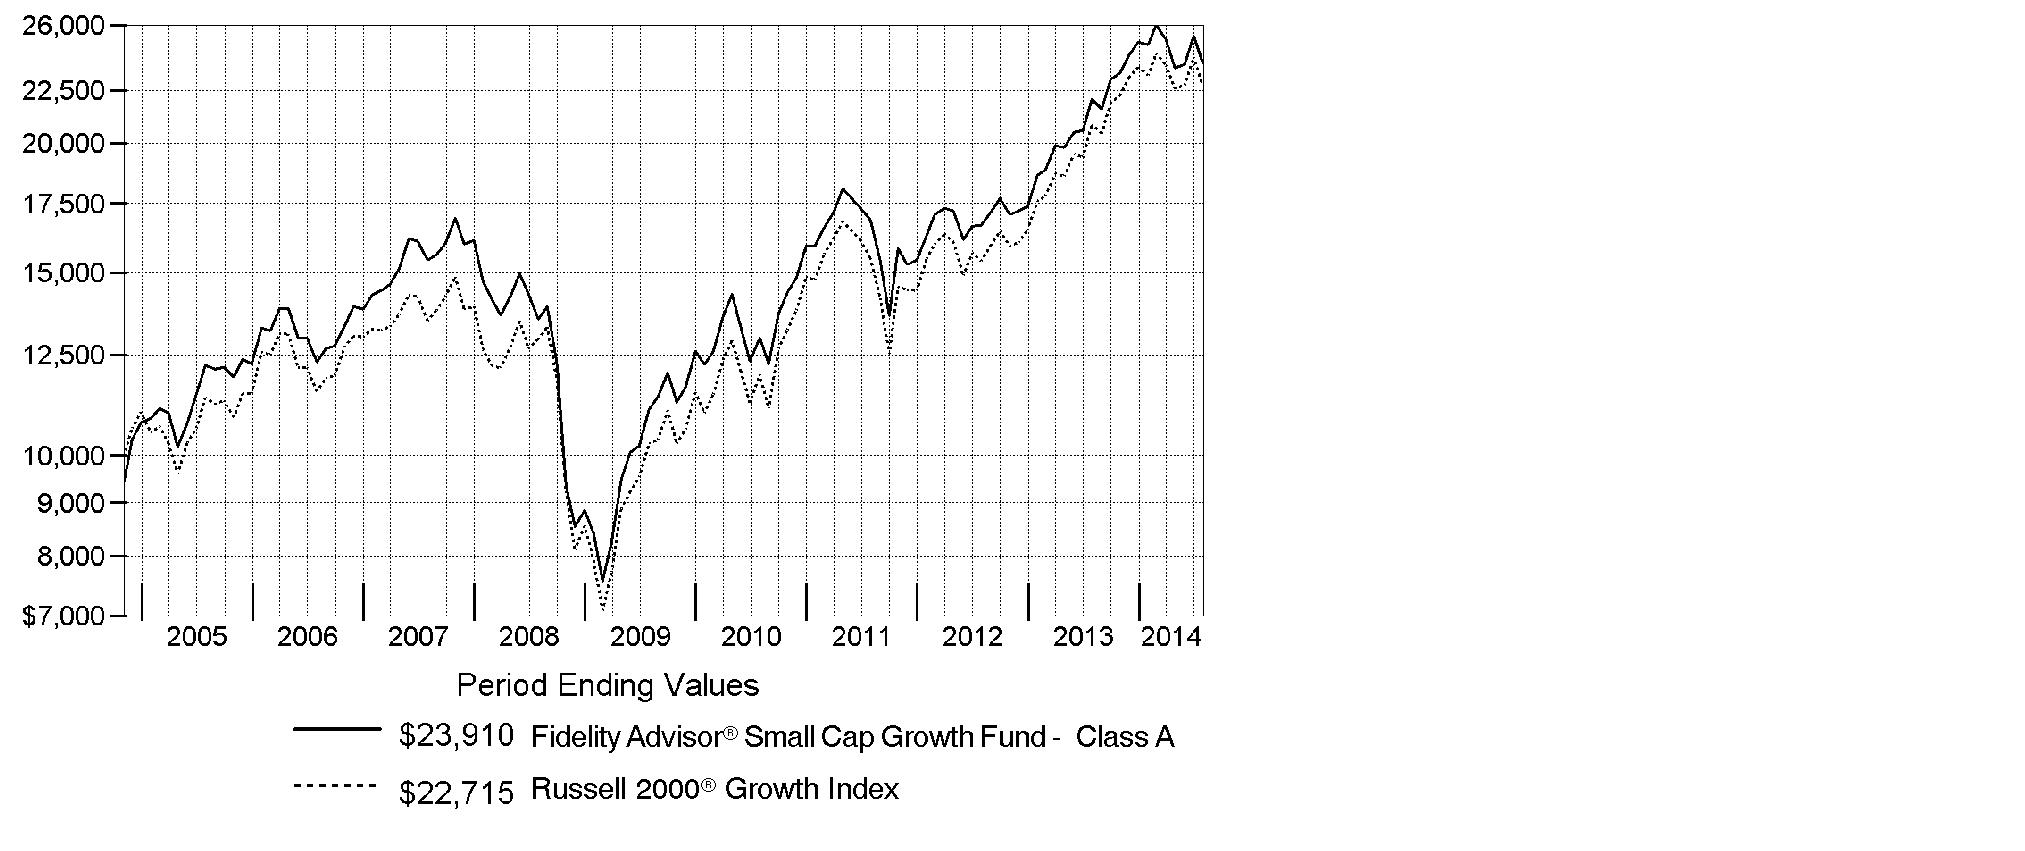
Annual Report
Market Recap: U.S. stocks overcame a slowing economy early in 2014 to post a strong gain for the 12-month period ending July 31, 2014, supported by corporate profits and continued low interest rates. The S&P 500® Index rose 16.94%, reaching an all-time high near period end. The technology-heavy Nasdaq Composite Index® gained 22.00%. The Russell 2000® Index returned 8.56%, reflecting the relatively lackluster performance of small-cap stocks. Information technology (+28%) was the top-performing sector within the S&P 500®, driven by strong semiconductor and computer hardware sales. Materials (+23%) gained amid higher prices for many commodity products. Health care (+21%) rose, driven by gains in pharmaceuticals, biotechnology & life sciences companies. Energy stocks (+19%) advanced in the latter part of the period amid healthy U.S. output and the threat of supply disruptions in Iraq. Conversely, most defensive sectors, including consumer staples, utilities and telecommunication services, lagged the broader market. Volatility remained tame throughout most of the period, with markets supported by declining unemployment, near-record profit margins for companies, muted cost inflation and fairly low corporate debt levels. Geopolitical tension remained a concern at period end, with conflict in Ukraine and strained relations between Russia and the West posing a potential threat to global growth.
Comments from Patrick Venanzi Portfolio Manager of Fidelity Advisor® Small Cap Growth Fund: For the year, the fund's Class A, Class T, Class B and Class C shares rose 8.58%, 8.30%, 7.73% and 7.70%, respectively (excluding sales charges), versus 8.93% for the Russell 2000® Growth Index. Relative to the index, the fund's top individual contributor was bioprocessing firm Repligen, a position I established during the period. Repligen has a terrific competitive position in several consumable products used to manufacture biologics, a class of drugs that I see as well-poised to outgrow the overall pharmaceuticals industry for years to come. Elsewhere, shares of Spirit Airlines rose more than 90% the past year, and our large overweighting helped results. I still like the story behind Spirit, but I nevertheless reduced our position as the stock climbed. Apparel retailer G-III Apparel Group also added value, as the company's shares gained on management's excellent execution in new categories, as well as the extremely cold weather. Conversely, BioScrip, a provider of home infusion services whereby patients can receive intravenous drugs without a visit to the hospital, was our largest individual detractor. The stock stumbled as the firm encountered challenges integrating two recent acquisitions, and I sold our stake. The fund also suffered by underweighting or not owning two stocks in the benchmark that did particularly well, Puma Biotechnology and solar panel manufacturer SunEdison, respectively.
The views expressed above reflect those of the portfolio manager(s) only through the end of the period as stated on the cover of this report and do not necessarily represent the views of Fidelity or any other person in the Fidelity organization. Any such views are subject to change at any time based upon market or other conditions and Fidelity disclaims any responsibility to update such views. These views may not be relied on as investment advice and, because investment decisions for a Fidelity fund are based on numerous factors, may not be relied on as an indication of trading intent on behalf of any Fidelity fund.
Annual Report
Shareholder Expense Example
As a shareholder of the Fund, you incur two types of costs: (1) transaction costs, including sales charges (loads) on purchase payments or redemption proceeds, redemption fees and (2) ongoing costs, including management fees, distribution and/or service (12b-1) fees and other Fund expenses. This Example is intended to help you understand your ongoing costs (in dollars) of investing in the Fund and to compare these costs with the ongoing costs of investing in other mutual funds.
The Example is based on an investment of $1,000 invested at the beginning of the period and held for the entire period (February 1, 2014 to July 31, 2014).
Actual Expenses
The first line of the accompanying table for each class of the Fund provides information about actual account values and actual expenses. You may use the information in this line, together with the amount you invested, to estimate the expenses that you paid over the period. Simply divide your account value by $1,000.00 (for example, an $8,600 account value divided by $1,000.00 = 8.6), then multiply the result by the number in the first line for a class of the Fund under the heading entitled "Expenses Paid During Period" to estimate the expenses you paid on your account during this period. A small balance maintenance fee of $12.00 that is charged once a year may apply for certain accounts with a value of less than $2,000. This fee is not included in the table below. If it was, the estimate of expenses you paid during the period would be higher, and your ending account value lower, by this amount. In addition, the Fund, as a shareholder in the underlying Fidelity Central Funds, will indirectly bear its pro-rata share of the fees and expenses incurred by the underlying Fidelity Central Funds. These fees and expenses are not included in the Fund's annualized expense ratio used to calculate the expense estimate in the table below.
Hypothetical Example for Comparison Purposes
The second line of the accompanying table for each class of the Fund provides information about hypothetical account values and hypothetical expenses based on a Class' actual expense ratio and an assumed rate of return of 5% per year before expenses, which is not the Class' actual return. The hypothetical account values and expenses may not be used to estimate the actual ending account balance or expenses you paid for the period. You may use this information to compare the ongoing costs of investing in the Fund and other funds. To do so, compare this 5% hypothetical example with the 5% hypothetical examples that appear in the shareholder reports of the other funds. A small balance maintenance fee of $12.00 that is charged once a year may apply for certain accounts with a value of less than $2,000. This fee is not included in the table below. If it was, the estimate of expenses you paid during the period would be higher, and your ending account value lower, by this amount. In addition, the Fund, as a shareholder in the underlying Fidelity Central Funds, will indirectly bear its pro-rata share of the fees and expenses incurred by the underlying Fidelity Central Funds. These fees and expenses are not included in the Fund's annualized expense ratio used to calculate the expense estimate in the table below.
Please note that the expenses shown in the table are meant to highlight your ongoing costs only and do not reflect any transaction costs. Therefore, the second line of the table is useful in comparing ongoing costs only, and will not help you determine the relative total costs of owning different funds. In addition, if these transactional costs were included, your costs would have been higher.
Annual Report
| Annualized
Expense Ratio B | Beginning
Account Value
February 1, 2014 | Ending
Account Value
July 31, 2014 | Expenses Paid
During Period*
February 1, 2014
to July 31, 2014 |
Class A | 1.23% | | | |
Actual | | $ 1,000.00 | $ 961.50 | $ 5.98 |
HypotheticalA | | $ 1,000.00 | $ 1,018.70 | $ 6.16 |
Class T | 1.51% | | | |
Actual | | $ 1,000.00 | $ 960.30 | $ 7.34 |
HypotheticalA | | $ 1,000.00 | $ 1,017.31 | $ 7.55 |
Class B | 2.03% | | | |
Actual | | $ 1,000.00 | $ 958.00 | $ 9.86 |
HypotheticalA | | $ 1,000.00 | $ 1,014.73 | $ 10.14 |
Class C | 2.02% | | | |
Actual | | $ 1,000.00 | $ 957.80 | $ 9.81 |
HypotheticalA | | $ 1,000.00 | $ 1,014.78 | $ 10.09 |
Small Cap Growth | .93% | | | |
Actual | | $ 1,000.00 | $ 962.90 | $ 4.53 |
HypotheticalA | | $ 1,000.00 | $ 1,020.18 | $ 4.66 |
Institutional Class | .94% | | | |
Actual | | $ 1,000.00 | $ 963.00 | $ 4.58 |
HypotheticalA | | $ 1,000.00 | $ 1,020.13 | $ 4.71 |
A 5% return per year before expenses
B Annualized expense ratio reflects expenses net of applicable fee waivers.
* Expenses are equal to each Class' annualized expense ratio, multiplied by the average account value over the period, multiplied by 181/365 (to reflect the one-half year period).
Annual Report
Investment Changes (Unaudited)
Top Ten Stocks as of July 31, 2014 |
| % of fund's
net assets | % of fund's net assets
6 months ago |
Team Health Holdings, Inc. | 2.0 | 0.0 |
KAR Auction Services, Inc. | 1.5 | 1.2 |
Hub Group, Inc. Class A | 1.5 | 0.0 |
G-III Apparel Group Ltd. | 1.5 | 1.0 |
Teledyne Technologies, Inc. | 1.4 | 0.8 |
Huron Consulting Group, Inc. | 1.4 | 1.1 |
Graphic Packaging Holding Co. | 1.4 | 0.9 |
Service Corp. International | 1.3 | 1.0 |
PolyOne Corp. | 1.3 | 0.0 |
Global Payments, Inc. | 1.3 | 0.7 |
| 14.6 | |
Top Five Market Sectors as of July 31, 2014 |
| % of fund's
net assets | % of fund's net assets
6 months ago |
Information Technology | 22.7 | 23.9 |
Health Care | 21.8 | 20.2 |
Industrials | 16.0 | 15.9 |
Consumer Discretionary | 13.5 | 13.5 |
Financials | 6.8 | 8.4 |
Asset Allocation (% of fund's net assets) |
As of July 31, 2014* | As of January 31, 2014** |
 | Stocks 98.0% | | | Stocks and
Equity Futures 97.4% | |
 | Short-Term
Investments and
Net Other Assets
(Liabilities) 2.0% | | | Short-Term
Investments and
Net Other Assets
(Liabilities) 2.6% | |
* Foreign investments | 5.8% | | ** Foreign investments | 5.0% | |

Annual Report
Investments July 31, 2014
Showing Percentage of Net Assets
Common Stocks - 98.0% |
| Shares | | Value |
CONSUMER DISCRETIONARY - 13.5% |
Auto Components - 2.9% |
Standard Motor Products, Inc. | 265,717 | | $ 9,579,098 |
Tenneco, Inc. (a) | 220,300 | | 14,033,110 |
Visteon Corp. (a) | 145,000 | | 13,847,500 |
| | 37,459,708 |
Diversified Consumer Services - 1.3% |
Service Corp. International | 820,300 | | 17,226,300 |
Household Durables - 0.8% |
Universal Electronics, Inc. (a) | 230,114 | | 10,960,330 |
Internet & Catalog Retail - 0.6% |
HomeAway, Inc. (a) | 240,000 | | 8,332,800 |
Leisure Products - 1.7% |
Brunswick Corp. | 252,600 | | 10,187,358 |
Malibu Boats, Inc. Class A (a) | 590,000 | | 11,357,500 |
| | 21,544,858 |
Media - 0.9% |
Cablevision Systems Corp. - NY Group Class A | 200,000 | | 3,844,000 |
Live Nation Entertainment, Inc. (a) | 350,000 | | 8,123,500 |
| | 11,967,500 |
Multiline Retail - 1.6% |
Burlington Stores, Inc. | 170,000 | | 5,564,100 |
Dillard's, Inc. Class A | 100,000 | | 11,922,000 |
Tuesday Morning Corp. (a) | 163,789 | | 2,695,967 |
| | 20,182,067 |
Textiles, Apparel & Luxury Goods - 3.7% |
G-III Apparel Group Ltd. (a) | 245,300 | | 19,052,451 |
Iconix Brand Group, Inc. (a) | 223,800 | | 9,451,074 |
Steven Madden Ltd. (a) | 283,000 | | 9,013,550 |
Vera Bradley, Inc. (a) | 500,000 | | 9,915,000 |
| | 47,432,075 |
TOTAL CONSUMER DISCRETIONARY | | 175,105,638 |
CONSUMER STAPLES - 4.0% |
Food Products - 1.5% |
Darling International, Inc. (a) | 600,000 | | 11,232,000 |
Ingredion, Inc. | 100,000 | | 7,363,000 |
| | 18,595,000 |
Common Stocks - continued |
| Shares | | Value |
CONSUMER STAPLES - continued |
Household Products - 1.2% |
Spectrum Brands Holdings, Inc. | 190,000 | | $ 15,846,000 |
Personal Products - 1.3% |
Inter Parfums, Inc. | 276,185 | | 7,216,714 |
MediFast, Inc. (a) | 350,000 | | 10,048,500 |
| | 17,265,214 |
TOTAL CONSUMER STAPLES | | 51,706,214 |
ENERGY - 4.8% |
Energy Equipment & Services - 1.3% |
Dril-Quip, Inc. (a) | 59,900 | | 6,036,123 |
Xtreme Drilling & Coil Services Corp. (a) | 2,541,700 | | 11,095,971 |
| | 17,132,094 |
Oil, Gas & Consumable Fuels - 3.5% |
Golar LNG Ltd. (d) | 140,000 | | 8,625,400 |
MPLX LP | 161,157 | | 9,145,660 |
Phillips 66 Partners LP | 171,525 | | 10,969,024 |
StealthGas, Inc. (a) | 600,000 | | 6,420,000 |
Valero Energy Partners LP | 210,000 | | 9,760,800 |
| | 44,920,884 |
TOTAL ENERGY | | 62,052,978 |
FINANCIALS - 6.8% |
Banks - 2.5% |
Banner Bank | 110,284 | | 4,437,828 |
Investors Bancorp, Inc. | 1,100,000 | | 11,385,000 |
Lakeland Financial Corp. | 203,700 | | 7,412,643 |
Pacific Premier Bancorp, Inc. (a) | 648,586 | | 9,274,780 |
| | 32,510,251 |
Capital Markets - 1.7% |
E*TRADE Financial Corp. (a) | 310,200 | | 6,520,404 |
FXCM, Inc. Class A (d) | 311,264 | | 4,239,416 |
Lazard Ltd. Class A | 215,000 | | 11,244,500 |
| | 22,004,320 |
Consumer Finance - 0.5% |
Portfolio Recovery Associates, Inc. (a) | 100,000 | | 5,896,000 |
Common Stocks - continued |
| Shares | | Value |
FINANCIALS - continued |
Insurance - 1.2% |
Amerisafe, Inc. | 106,448 | | $ 3,895,997 |
Primerica, Inc. | 264,219 | | 12,175,212 |
| | 16,071,209 |
Thrifts & Mortgage Finance - 0.9% |
Meridian Bancorp, Inc. (a) | 1,101,780 | | 11,965,331 |
TOTAL FINANCIALS | | 88,447,111 |
HEALTH CARE - 21.8% |
Biotechnology - 9.0% |
BioCryst Pharmaceuticals, Inc. (a) | 500,000 | | 6,260,000 |
Celldex Therapeutics, Inc. (a)(d) | 293,400 | | 3,840,606 |
Chimerix, Inc. (a) | 210,100 | | 4,773,472 |
Cubist Pharmaceuticals, Inc. | 41,262 | | 2,512,856 |
Dyax Corp. (a) | 650,000 | | 6,123,000 |
Exact Sciences Corp. (a)(d) | 731,705 | | 11,421,915 |
Genomic Health, Inc. (a)(d) | 225,288 | | 5,740,338 |
Hyperion Therapeutics, Inc. (a) | 121,500 | | 2,766,555 |
Insmed, Inc. (a) | 223,400 | | 3,817,906 |
Intercept Pharmaceuticals, Inc. (a) | 30,600 | | 7,110,216 |
Isis Pharmaceuticals, Inc. (a) | 224,457 | | 6,955,922 |
Lion Biotechnologies, Inc. (a) | 300,000 | | 2,145,000 |
Medivation, Inc. (a) | 64,800 | | 4,810,104 |
Mirati Therapeutics, Inc. (a) | 170,820 | | 3,103,799 |
Novavax, Inc. (a) | 1,218,200 | | 5,274,806 |
Puma Biotechnology, Inc. (a) | 36,600 | | 8,114,952 |
Receptos, Inc. (a) | 81,069 | | 3,357,067 |
Repligen Corp. (a) | 490,000 | | 10,275,300 |
Stemline Therapeutics, Inc. (a) | 104,500 | | 1,338,645 |
Sunesis Pharmaceuticals, Inc. (a)(d) | 550,600 | | 3,622,948 |
Synageva BioPharma Corp. (a)(d) | 109,200 | | 7,470,372 |
Threshold Pharmaceuticals, Inc. (a)(d) | 604,453 | | 2,544,747 |
XOMA Corp. (a) | 800,400 | | 3,105,552 |
| | 116,486,078 |
Health Care Equipment & Supplies - 4.0% |
Accuray, Inc. (a)(d) | 600,000 | | 4,722,000 |
DexCom, Inc. (a) | 100,000 | | 3,768,000 |
Greatbatch, Inc. (a) | 61,615 | | 3,050,559 |
Ldr Holding Corp. | 475,000 | | 10,882,250 |
Novadaq Technologies, Inc. (a) | 576,300 | | 8,840,442 |
Common Stocks - continued |
| Shares | | Value |
HEALTH CARE - continued |
Health Care Equipment & Supplies - continued |
NxStage Medical, Inc. (a) | 300,000 | | $ 4,005,000 |
Quidel Corp. (a)(d) | 113,800 | | 2,716,406 |
Steris Corp. | 281,400 | | 14,317,632 |
| | 52,302,289 |
Health Care Providers & Services - 4.9% |
Accretive Health, Inc. (a) | 1,137,226 | | 9,575,443 |
LifePoint Hospitals, Inc. (a) | 80,000 | | 5,737,600 |
Omnicare, Inc. | 190,000 | | 11,875,000 |
Select Medical Holdings Corp. | 400,000 | | 6,216,000 |
Team Health Holdings, Inc. (a) | 454,400 | | 25,696,318 |
Wellcare Health Plans, Inc. (a) | 65,937 | | 4,113,150 |
| | 63,213,511 |
Health Care Technology - 1.3% |
athenahealth, Inc. (a)(d) | 45,000 | | 5,598,000 |
MedAssets, Inc. (a) | 530,000 | | 11,257,200 |
| | 16,855,200 |
Life Sciences Tools & Services - 2.4% |
Bruker BioSciences Corp. (a) | 323,700 | | 7,357,701 |
Fluidigm Corp. (a) | 246,000 | | 7,042,980 |
ICON PLC (a) | 190,000 | | 9,842,000 |
Techne Corp. | 78,888 | | 7,361,828 |
| | 31,604,509 |
Pharmaceuticals - 0.2% |
Flamel Technologies SA sponsored ADR (a) | 212,002 | | 2,825,987 |
TOTAL HEALTH CARE | | 283,287,574 |
INDUSTRIALS - 16.0% |
Aerospace & Defense - 2.4% |
Esterline Technologies Corp. (a) | 120,000 | | 13,026,000 |
Teledyne Technologies, Inc. (a) | 197,700 | | 18,030,240 |
| | 31,056,240 |
Air Freight & Logistics - 1.6% |
Hub Group, Inc. Class A (a) | 425,000 | | 19,626,500 |
Park-Ohio Holdings Corp. | 21,154 | | 1,255,701 |
| | 20,882,201 |
Airlines - 1.1% |
Spirit Airlines, Inc. (a) | 214,500 | | 14,032,590 |
Common Stocks - continued |
| Shares | | Value |
INDUSTRIALS - continued |
Commercial Services & Supplies - 2.5% |
KAR Auction Services, Inc. | 691,900 | | $ 20,279,589 |
Msa Safety, Inc. | 145,979 | | 7,558,793 |
Multi-Color Corp. | 131,853 | | 5,191,053 |
| | 33,029,435 |
Electrical Equipment - 0.3% |
AZZ, Inc. | 100,000 | | 4,364,000 |
Machinery - 5.5% |
Allison Transmission Holdings, Inc. | 530,000 | | 15,518,400 |
Crane Co. | 160,000 | | 10,977,600 |
ITT Corp. | 213,812 | | 9,828,938 |
Luxfer Holdings PLC sponsored ADR | 413,066 | | 7,852,385 |
Manitowoc Co., Inc. | 260,000 | | 6,905,600 |
NN, Inc. | 36,870 | | 1,069,230 |
Superior Drilling Products, Inc. (e) | 1,294,115 | | 8,049,395 |
Valmont Industries, Inc. | 50,000 | | 7,281,500 |
Woodward, Inc. | 70,216 | | 3,507,991 |
| | 70,991,039 |
Professional Services - 2.3% |
CBIZ, Inc. (a) | 1,469,100 | | 11,987,856 |
Huron Consulting Group, Inc. (a) | 286,700 | | 17,328,148 |
| | 29,316,004 |
Road & Rail - 0.3% |
Marten Transport Ltd. | 159,359 | | 3,225,426 |
TOTAL INDUSTRIALS | | 206,896,935 |
INFORMATION TECHNOLOGY - 22.7% |
Communications Equipment - 0.3% |
Plantronics, Inc. | 100,000 | | 4,697,000 |
Electronic Equipment & Components - 2.3% |
CDW Corp. | 280,000 | | 8,649,200 |
Ingram Micro, Inc. Class A (a) | 480,000 | | 13,776,000 |
Neonode, Inc. (a)(d) | 848,022 | | 2,306,620 |
RealD, Inc. (a) | 442,300 | | 4,675,111 |
| | 29,406,931 |
Internet Software & Services - 4.6% |
comScore, Inc. (a) | 290,641 | | 10,518,298 |
Cvent, Inc. (d) | 387,646 | | 10,586,612 |
Demandware, Inc. (a)(d) | 134,984 | | 8,131,436 |
Common Stocks - continued |
| Shares | | Value |
INFORMATION TECHNOLOGY - continued |
Internet Software & Services - continued |
E2open, Inc. (a)(d) | 657,094 | | $ 10,631,781 |
NIC, Inc. | 358,940 | | 6,055,318 |
Perficient, Inc. (a) | 99,910 | | 1,697,471 |
Stamps.com, Inc. (a) | 383,796 | | 12,139,467 |
| | 59,760,383 |
IT Services - 4.7% |
Computer Sciences Corp. | 180,000 | | 11,230,200 |
EVERTEC, Inc. | 389,400 | | 8,706,984 |
Global Payments, Inc. | 240,500 | | 16,659,435 |
Maximus, Inc. | 206,900 | | 8,557,384 |
Sapient Corp. (a) | 797,200 | | 11,766,672 |
Sykes Enterprises, Inc. (a) | 176,953 | | 3,662,927 |
| | 60,583,602 |
Semiconductors & Semiconductor Equipment - 3.7% |
Integrated Silicon Solution, Inc. | 513,994 | | 7,514,592 |
MKS Instruments, Inc. | 170,000 | | 5,402,600 |
Monolithic Power Systems, Inc. | 269,900 | | 11,130,676 |
PDF Solutions, Inc. (a) | 631,672 | | 12,102,836 |
Tessera Technologies, Inc. | 450,000 | | 11,434,500 |
| | 47,585,204 |
Software - 5.6% |
Aspen Technology, Inc. (a) | 373,100 | | 16,207,464 |
Cadence Design Systems, Inc. (a) | 700,000 | | 11,781,000 |
Evolving Systems, Inc. | 300,000 | | 2,964,000 |
Interactive Intelligence Group, Inc. (a) | 364,733 | | 16,547,936 |
Rovi Corp. (a) | 430,000 | | 10,049,100 |
SS&C Technologies Holdings, Inc. (a) | 243,600 | | 10,550,316 |
Vasco Data Security International, Inc. (a) | 189,366 | | 2,569,697 |
Verint Systems, Inc. (a) | 36,660 | | 1,720,820 |
| | 72,390,333 |
Technology Hardware, Storage & Peripherals - 1.5% |
Electronics for Imaging, Inc. (a) | 375,100 | | 16,530,657 |
Immersion Corp. (a) | 253,470 | | 3,459,866 |
| | 19,990,523 |
TOTAL INFORMATION TECHNOLOGY | | 294,413,976 |
Common Stocks - continued |
| Shares | | Value |
MATERIALS - 6.0% |
Chemicals - 2.7% |
Cabot Corp. | 147,146 | | $ 7,708,979 |
Cytec Industries, Inc. | 100,000 | | 10,085,000 |
PolyOne Corp. | 450,000 | | 17,077,500 |
| | 34,871,479 |
Construction Materials - 0.9% |
Eagle Materials, Inc. | 133,168 | | 12,094,318 |
Containers & Packaging - 2.4% |
Graphic Packaging Holding Co. (a) | 1,443,700 | | 17,324,400 |
Silgan Holdings, Inc. | 265,552 | | 13,070,469 |
| | 30,394,869 |
TOTAL MATERIALS | | 77,360,666 |
TELECOMMUNICATION SERVICES - 1.9% |
Diversified Telecommunication Services - 1.9% |
Cogent Communications Group, Inc. | 400,000 | | 13,884,000 |
inContact, Inc. (a) | 1,300,000 | | 10,387,000 |
| | 24,271,000 |
UTILITIES - 0.5% |
Independent Power and Renewable Electricity Producers - 0.5% |
NextEra Energy Partners LP | 206,500 | | 7,029,260 |
TOTAL COMMON STOCKS (Cost $1,189,621,783) |
1,270,571,352
|
Money Market Funds - 3.9% |
| Shares | | Value |
Fidelity Cash Central Fund, 0.11% (b) | 4,831,978 | | 4,831,978 |
Fidelity Securities Lending Cash Central Fund, 0.11% (b)(c) | 45,930,575 | | 45,930,575 |
TOTAL MONEY MARKET FUNDS (Cost $50,762,553) |
50,762,553
|
TOTAL INVESTMENT PORTFOLIO - 101.9% (Cost $1,240,384,336) | | 1,321,333,905 |
NET OTHER ASSETS (LIABILITIES) - (1.9)% | | (24,235,291) |
NET ASSETS - 100% | $ 1,297,098,614 |
Legend |
(a) Non-income producing |
(b) Affiliated fund that is generally available only to investment companies and other accounts managed by Fidelity Investments. The rate quoted is the annualized seven-day yield of the fund at period end. A complete unaudited listing of the fund's holdings as of its most recent quarter end is available upon request. In addition, each Fidelity Central Fund's financial statements, which are not covered by the Fund's Report of Independent Registered Public Accounting Firm, are available on the SEC's website or upon request. |
(c) Investment made with cash collateral received from securities on loan. |
(d) Security or a portion of the security is on loan at period end. |
(e) Affiliated company |
Affiliated Central Funds |
Information regarding fiscal year to date income earned by the Fund from investments in Fidelity Central Funds is as follows: |
Fund | Income earned |
Fidelity Cash Central Fund | $ 41,667 |
Fidelity Securities Lending Cash Central Fund | 1,724,148 |
Total | $ 1,765,815 |
Other Affiliated Issuers |
An affiliated company is a company in which the Fund has ownership of at least 5% of the voting securities. Fiscal year to date transactions with companies which are or were affiliates are as follows: |
Affiliate | Value,
beginning of
period | Purchases | Sales
Proceeds | Dividend
Income | Value,
end of
period |
Parametric Sound Corp. | $ 11,382,447 | $ - | $ 9,334,036* | $ - | $ - |
Superior Drilling Products, Inc. | - | 5,573,300 | - | - | 8,049,395 |
Xtreme Drilling & Coil Services Corp. | 14,769,740 | 7,453,947 | 13,187,684* | - | - |
Zedi, Inc. | 4,053,675 | - | 4,333,432 | - | - |
Total | $ 30,205,862 | $ 13,027,247 | $ 26,855,152 | $ - | $ 8,049,395 |
* Includes the value of securities delivered through in-kind transactions.
See accompanying notes which are an integral part of the financial statements.
Annual Report
Other Information |
All investments are categorized as Level 1 under the Fair Value Hierarchy. The inputs or methodology used for valuing securities may not be an indication of the risk associated with investing in those securities. For more information on valuation inputs, please refer to the Investment Valuation section in the accompanying Notes to Financial Statements. |
See accompanying notes which are an integral part of the financial statements.
Annual Report
Statement of Assets and Liabilities
| July 31, 2014 |
| | |
Assets | | |
Investment in securities, at value (including securities loaned of $43,224,490) - See accompanying schedule: Unaffiliated issuers (cost $1,184,048,483) | $ 1,262,521,957 | |
Fidelity Central Funds (cost $50,762,553) | 50,762,553 | |
Other affiliated issuers (cost $5,573,300) | 8,049,395 | |
Total Investments (cost $1,240,384,336) | | $ 1,321,333,905 |
Cash | | 1,077,543 |
Receivable for investments sold | | 70,156,652 |
Receivable for fund shares sold | | 1,080,689 |
Dividends receivable | | 432,657 |
Distributions receivable from Fidelity Central Funds | | 147,646 |
Receivable from investment adviser for expense reductions | | 744 |
Other receivables | | 26,021 |
Total assets | | 1,394,255,857 |
| | |
Liabilities | | |
Payable for investments purchased | $ 46,312,173 | |
Payable for fund shares redeemed | 3,819,361 | |
Accrued management fee | 678,266 | |
Distribution and service plan fees payable | 77,290 | |
Other affiliated payables | 277,336 | |
Other payables and accrued expenses | 62,242 | |
Collateral on securities loaned, at value | 45,930,575 | |
Total liabilities | | 97,157,243 |
| | |
Net Assets | | $ 1,297,098,614 |
Net Assets consist of: | | |
Paid in capital | | $ 1,141,004,177 |
Accumulated net investment loss | | (4,082,221) |
Accumulated undistributed net realized gain (loss) on investments and foreign currency transactions | | 79,230,791 |
Net unrealized appreciation (depreciation) on investments and assets and liabilities in foreign currencies | | 80,945,867 |
Net Assets | | $ 1,297,098,614 |
See accompanying notes which are an integral part of the financial statements.
Annual Report
Financial Statements - continued
Statement of Assets and Liabilities - continued
| July 31, 2014 |
| | |
Calculation of Maximum Offering Price Class A:
Net Asset Value and redemption price per share ($88,821,558 ÷ 4,937,588 shares) | | $ 17.99 |
| | |
Maximum offering price per share (100/94.25 of $17.99) | | $ 19.09 |
Class T:
Net Asset Value and redemption price per share ($42,586,335 ÷ 2,411,859 shares) | | $ 17.66 |
| | |
Maximum offering price per share (100/96.50 of $17.66) | | $ 18.30 |
Class B:
Net Asset Value and offering price per share ($2,763,621 ÷ 163,933 shares)A | | $ 16.86 |
| | |
Class C:
Net Asset Value and offering price per share ($42,215,155 ÷ 2,515,912 shares)A | | $ 16.78 |
| | |
Small Cap Growth:
Net Asset Value, offering price and redemption price per share ($1,069,105,078 ÷ 57,935,831 shares) | | $ 18.45 |
| | |
Institutional Class:
Net Asset Value, offering price and redemption price per share ($51,606,867 ÷ 2,791,390 shares) | | $ 18.49 |
A Redemption price per share is equal to net asset value less any applicable contingent deferred sales charge.
See accompanying notes which are an integral part of the financial statements.
Annual Report
Statement of Operations
| Year ended July 31, 2014 |
| | |
Investment Income | | |
Dividends | | $ 7,894,062 |
Interest | | 288 |
Income from Fidelity Central Funds (including $1,724,148 from security lending) | | 1,765,815 |
Total income | | 9,660,165 |
| | |
Expenses | | |
Management fee
Basic fee | $ 11,347,434 | |
Performance adjustment | (699,324) | |
Transfer agent fees | 2,882,872 | |
Distribution and service plan fees | 874,291 | |
Accounting and security lending fees | 519,891 | |
Custodian fees and expenses | 71,344 | |
Independent trustees' compensation | 7,051 | |
Registration fees | 192,913 | |
Audit | 59,462 | |
Legal | 6,624 | |
Interest | 819 | |
Miscellaneous | 17,559 | |
Total expenses before reductions | 15,280,936 | |
Expense reductions | (80,901) | 15,200,035 |
Net investment income (loss) | | (5,539,870) |
Realized and Unrealized Gain (Loss) Net realized gain (loss) on: | | |
Investment securities: | | |
Unaffiliated issuers | 228,023,968 | |
Redemption in-kind with affiliated entities (including
gain from other affiliated issuers of $4,613,051) | 304,585,595 | |
Other affiliated issuers | (398,906) | |
Foreign currency transactions | (13,148) | |
Futures contracts | (2,221,706) | |
Total net realized gain (loss) | | 529,975,803 |
Change in net unrealized appreciation (depreciation) on: Investment securities | (344,219,875) | |
Assets and liabilities in foreign currencies | 691 | |
Total change in net unrealized appreciation (depreciation) | | (344,219,184) |
Net gain (loss) | | 185,756,619 |
Net increase (decrease) in net assets resulting from operations | | $ 180,216,749 |
See accompanying notes which are an integral part of the financial statements.
Annual Report
Financial Statements - continued
Statement of Changes in Net Assets
| Year ended
July 31,
2014 | Year ended
July 31,
2013 |
Increase (Decrease) in Net Assets | | |
Operations | | |
Net investment income (loss) | $ (5,539,870) | $ 2,185,197 |
Net realized gain (loss) | 529,975,803 | 327,291,382 |
Change in net unrealized appreciation (depreciation) | (344,219,184) | 244,679,550 |
Net increase (decrease) in net assets resulting
from operations | 180,216,749 | 574,156,129 |
Distributions to shareholders from net realized gain | (306,246,236) | (122,560,447) |
Share transactions - net increase (decrease) | (817,676,738) | (58,479,174) |
Redemption fees | 398,744 | 117,383 |
Total increase (decrease) in net assets | (943,307,481) | 393,233,891 |
| | |
Net Assets | | |
Beginning of period | 2,240,406,095 | 1,847,172,204 |
End of period (including accumulated net investment loss of $4,082,221 and accumulated net investment loss of $0, respectively) | $ 1,297,098,614 | $ 2,240,406,095 |
See accompanying notes which are an integral part of the financial statements.
Annual Report
Financial Highlights - Class A
Years ended July 31, | 2014 | 2013 | 2012 | 2011 | 2010 |
Selected Per-Share Data | | | | | |
Net asset value, beginning of period | $ 19.66 | $ 15.87 | $ 16.42 | $ 12.66 | $ 10.79 |
Income from Investment Operations | | | | | |
Net investment income (loss) C | (.12) | (.04) | (.07) F | (.07) G | (.07) H |
Net realized and unrealized gain (loss) | 1.69 | 4.87 | (.16) | 3.84 | 1.94 |
Total from investment operations | 1.57 | 4.83 | (.23) | 3.77 | 1.87 |
Distributions from net realized gain | (3.24) | (1.04) | (.32) | (.01) L | - |
Redemption fees added to paid in capital C, J | - | - | - | - | - |
Net asset value, end of period | $ 17.99 | $ 19.66 | $ 15.87 | $ 16.42 | $ 12.66 |
Total ReturnA, B | 8.58% | 32.20% | (1.14)% | 29.78% | 17.33% |
Ratios to Average Net Assets D, I | | | | | |
Expenses before reductions | 1.22% | 1.24% | 1.35% | 1.25% | 1.35% |
Expenses net of fee waivers, if any | 1.22% | 1.24% | 1.35% | 1.25% | 1.35% |
Expenses net of all reductions | 1.22% | 1.22% | 1.34% | 1.23% | 1.34% |
Net investment income (loss) | (.62)% | (.26)% | (.49)% F | (.47)% G | (.56)% H |
Supplemental Data | | | | | |
Net assets, end of period (000 omitted) | $ 88,822 | $ 74,978 | $ 59,684 | $ 67,272 | $ 50,620 |
Portfolio turnover rate E | 148% K | 142% | 150% | 106% | 105% |
A Total returns would have been lower if certain expenses had not been reduced during the applicable periods shown.
B Total returns do not include the effect of the sales charges.
C Calculated based on average shares outstanding during the period.
D Fees and expenses of any underlying Fidelity Central Funds are not included in the Fund's expense ratio. The Fund indirectly bears its proportionate share of the expenses of any underlying Fidelity Central Funds.
E Amount does not include the portfolio activity of any underlying Fidelity Central Funds.
F Investment income per share reflects a large, non-recurring dividend which amounted to $.01 per share. Excluding this non-recurring dividend, the ratio of net investment income (loss) to average net assets would have been (.57)%.
G Investment income per share reflects a large, non-recurring dividend which amounted to $.02 per share. Excluding this non-recurring dividend, the ratio of net investment income (loss) to average net assets would have been (.61)%.
H Investment income per share reflects a large, non-recurring dividend which amounted to $.01 per share. Excluding this non-recurring dividend, the ratio of net investment income (loss) to average net assets would have been (.67)%.
I Expense ratios reflect operating expenses of the class. Expenses before reductions do not reflect amounts reimbursed by the investment adviser or reductions from brokerage service arrangements or reductions from other expense offset arrangements and do not represent the amount paid by the class during periods when reimbursements or reductions occur. Expenses net of fee waivers reflect expenses after reimbursement by the investment adviser but prior to reductions from brokerage service arrangements or other expense offset arrangements. Expenses net of all reductions represent the net expenses paid by the class.
J Amount represents less than $.01 per share.
K Portfolio turnover rate excludes securities received or delivered in-kind.
L The amounts shown reflect certain reclassifications related to book to tax differences that were made in the year shown.
See accompanying notes which are an integral part of the financial statements.
Annual Report
Financial Highlights - Class T
Years ended July 31, | 2014 | 2013 | 2012 | 2011 | 2010 |
Selected Per-Share Data | | | | | |
Net asset value, beginning of period | $ 19.38 | $ 15.68 | $ 16.27 | $ 12.57 | $ 10.74 |
Income from Investment Operations | | | | | |
Net investment income (loss) C | (.16) | (.09) | (.11) F | (.11) G | (.10) H |
Net realized and unrealized gain (loss) | 1.66 | 4.82 | (.16) | 3.81 | 1.93 |
Total from investment operations | 1.50 | 4.73 | (.27) | 3.70 | 1.83 |
Distributions from net realized gain | (3.22) | (1.03) | (.32) | - | - |
Redemption fees added to paid in capital C, J | - | - | - | - | - |
Net asset value, end of period | $ 17.66 | $ 19.38 | $ 15.68 | $ 16.27 | $ 12.57 |
Total ReturnA, B | 8.30% | 31.87% | (1.41)% | 29.44% | 17.04% |
Ratios to Average Net Assets D, I | | | | | |
Expenses before reductions | 1.50% | 1.49% | 1.61% | 1.50% | 1.61% |
Expenses net of fee waivers, if any | 1.50% | 1.49% | 1.61% | 1.50% | 1.61% |
Expenses net of all reductions | 1.49% | 1.48% | 1.60% | 1.49% | 1.60% |
Net investment income (loss) | (.90)% | (.52)% | (.74)% F | (.73)% G | (.82)% H |
Supplemental Data | | | | | |
Net assets, end of period (000 omitted) | $ 42,586 | $ 34,686 | $ 27,658 | $ 30,764 | $ 23,930 |
Portfolio turnover rate E | 148% K | 142% | 150% | 106% | 105% |
A Total returns would have been lower if certain expenses had not been reduced during the applicable periods shown.
B Total returns do not include the effect of the sales charges.
C Calculated based on average shares outstanding during the period.
D Fees and expenses of any underlying Fidelity Central Funds are not included in the Fund's expense ratio. The Fund indirectly bears its proportionate share of the expenses of any underlying Fidelity Central Funds.
E Amount does not include the portfolio activity of any underlying Fidelity Central Funds.
F Investment income per share reflects a large, non-recurring dividend which amounted to $.01 per share. Excluding this non-recurring dividend, the ratio of net investment income (loss) to average net assets would have been (.83)%.
G Investment income per share reflects a large, non-recurring dividend which amounted to $.02 per share. Excluding this non-recurring dividend, the ratio of net investment income (loss) to average net assets would have been (.86)%.
H Investment income per share reflects a large, non-recurring dividend which amounted to $.01 per share. Excluding this non-recurring dividend, the ratio of net investment income (loss) to average net assets would have been (.93)%.
I Expense ratios reflect operating expenses of the class. Expenses before reductions do not reflect amounts reimbursed by the investment adviser or reductions from brokerage service arrangements or reductions from other expense offset arrangements and do not represent the amount paid by the class during periods when reimbursements or reductions occur. Expenses net of fee waivers reflect expenses after reimbursement by the investment adviser but prior to reductions from brokerage service arrangements or other expense offset arrangements. Expenses net of all reductions represent the net expenses paid by the class.
J Amount represents less than $.01 per share.
K Portfolio turnover rate excludes securities received or delivered in-kind.
See accompanying notes which are an integral part of the financial statements.
Annual Report
Financial Highlights - Class B
Years ended July 31, | 2014 | 2013 | 2012 | 2011 | 2010 |
Selected Per-Share Data | | | | | |
Net asset value, beginning of period | $ 18.65 | $ 15.19 | $ 15.86 | $ 12.30 | $ 10.57 |
Income from Investment Operations | | | | | |
Net investment income (loss) C | (.25) | (.16) | (.18) F | (.18) G | (.16) H |
Net realized and unrealized gain (loss) | 1.60 | 4.64 | (.17) | 3.74 | 1.89 |
Total from investment operations | 1.35 | 4.48 | (.35) | 3.56 | 1.73 |
Distributions from net realized gain | (3.14) | (1.02) | (.32) | - | - |
Redemption fees added to paid in capital C, J | - | - | - | - | - |
Net asset value, end of period | $ 16.86 | $ 18.65 | $ 15.19 | $ 15.86 | $ 12.30 |
Total ReturnA, B | 7.73% | 31.25% | (1.96)% | 28.94% | 16.37% |
Ratios to Average Net Assets D, I | | | | | |
Expenses before reductions | 2.01% | 1.99% | 2.10% | 2.00% | 2.11% |
Expenses net of fee waivers, if any | 2.01% | 1.99% | 2.10% | 2.00% | 2.11% |
Expenses net of all reductions | 2.01% | 1.97% | 2.09% | 1.98% | 2.09% |
Net investment income (loss) | (1.41)% | (1.01)% | (1.23)% F | (1.22)% G | (1.32)% H |
Supplemental Data | | | | | |
Net assets, end of period (000 omitted) | $ 2,764 | $ 3,486 | $ 4,123 | $ 5,295 | $ 5,142 |
Portfolio turnover rate E | 148% K | 142% | 150% | 106% | 105% |
A Total returns would have been lower if certain expenses had not been reduced during the applicable periods shown.
B Total returns do not include the effect of the contingent deferred sales charge.
C Calculated based on average shares outstanding during the period.
D Fees and expenses of any underlying Fidelity Central Funds are not included in the Fund's expense ratio. The Fund indirectly bears its proportionate share of the expenses of any underlying Fidelity Central Funds.
E Amount does not include the portfolio activity of any underlying Fidelity Central Funds.
F Investment income per share reflects a large, non-recurring dividend which amounted to $.01 per share. Excluding this non-recurring dividend, the ratio of net investment income (loss) to average net assets would have been (1.32)%.
G Investment income per share reflects a large, non-recurring dividend which amounted to $.02 per share. Excluding this non-recurring dividend, the ratio of net investment income (loss) to average net assets would have been (1.36)%.
H Investment income per share reflects a large, non-recurring dividend which amounted to $.01 per share. Excluding this non-recurring dividend, the ratio of net investment income (loss) to average net assets would have been (1.42)%.
I Expense ratios reflect operating expenses of the class. Expenses before reductions do not reflect amounts reimbursed by the investment adviser or reductions from brokerage service arrangements or reductions from other expense offset arrangements and do not represent the amount paid by the class during periods when reimbursements or reductions occur. Expenses net of fee waivers reflect expenses after reimbursement by the investment adviser but prior to reductions from brokerage service arrangements or other expense offset arrangements. Expenses net of all reductions represent the net expenses paid by the class.
J Amount represents less than $.01 per share.
K Portfolio turnover rate excludes securities received or delivered in-kind.
See accompanying notes which are an integral part of the financial statements.
Annual Report
Financial Highlights - Class C
Years ended July 31, | 2014 | 2013 | 2012 | 2011 | 2010 |
Selected Per-Share Data | | | | | |
Net asset value, beginning of period | $ 18.62 | $ 15.16 | $ 15.83 | $ 12.28 | $ 10.55 |
Income from Investment Operations | | | | | |
Net investment income (loss) C | (.25) | (.16) | (.18) F | (.18) G | (.16) H |
Net realized and unrealized gain (loss) | 1.59 | 4.64 | (.17) | 3.73 | 1.89 |
Total from investment operations | 1.34 | 4.48 | (.35) | 3.55 | 1.73 |
Distributions from net realized gain | (3.18) | (1.02) | (.32) | - | - |
Redemption fees added to paid in capital C, J | - | - | - | - | - |
Net asset value, end of period | $ 16.78 | $ 18.62 | $ 15.16 | $ 15.83 | $ 12.28 |
Total ReturnA, B | 7.70% | 31.32% | (1.96)% | 28.91% | 16.40% |
Ratios to Average Net Assets D, I | | | | | |
Expenses before reductions | 2.01% | 1.99% | 2.10% | 2.00% | 2.11% |
Expenses net of fee waivers, if any | 2.00% | 1.99% | 2.10% | 2.00% | 2.11% |
Expenses net of all reductions | 2.00% | 1.97% | 2.09% | 1.98% | 2.09% |
Net investment income (loss) | (1.41)% | (1.01)% | (1.24)% F | (1.22)% G | (1.32)% H |
Supplemental Data | | | | | |
Net assets, end of period (000 omitted) | $ 42,215 | $ 32,756 | $ 24,683 | $ 24,914 | $ 18,091 |
Portfolio turnover rate E | 148% K | 142% | 150% | 106% | 105% |
A Total returns would have been lower if certain expenses had not been reduced during the applicable periods shown.
B Total returns do not include the effect of the contingent deferred sales charge.
C Calculated based on average shares outstanding during the period.
D Fees and expenses of any underlying Fidelity Central Funds are not included in the Fund's expense ratio. The Fund indirectly bears its proportionate share of the expenses of any underlying Fidelity Central Funds.
E Amount does not include the portfolio activity of any underlying Fidelity Central Funds.
F Investment income per share reflects a large, non-recurring dividend which amounted to $.01 per share. Excluding this non-recurring dividend, the ratio of net investment income (loss) to average net assets would have been (1.32)%.
G Investment income per share reflects a large, non-recurring dividend which amounted to $.02 per share. Excluding this non-recurring dividend, the ratio of net investment income (loss) to average net assets would have been (1.36)%.
H Investment income per share reflects a large, non-recurring dividend which amounted to $.01 per share. Excluding this non-recurring dividend, the ratio of net investment income (loss) to average net assets would have been (1.42)%.
I Expense ratios reflect operating expenses of the class. Expenses before reductions do not reflect amounts reimbursed by the investment adviser or reductions from brokerage service arrangements or reductions from other expense offset arrangements and do not represent the amount paid by the class during periods when reimbursements or reductions occur. Expenses net of fee waivers reflect expenses after reimbursement by the investment adviser but prior to reductions from brokerage service arrangements or other expense offset arrangements. Expenses net of all reductions represent the net expenses paid by the class.
J Amount represents less than $.01 per share.
K Portfolio turnover rate excludes securities received or delivered in-kind.
See accompanying notes which are an integral part of the financial statements.
Annual Report
Financial Highlights - Small Cap Growth
Years ended July 31, | 2014 | 2013 | 2012 | 2011 | 2010 |
Selected Per-Share Data | | | | | |
Net asset value, beginning of period | $ 20.07 | $ 16.14 | $ 16.65 | $ 12.81 | $ 10.89 |
Income from Investment Operations | | | | | |
Net investment income (loss) B | (.06) | .01 | (.03) E | (.03) F | (.04) G |
Net realized and unrealized gain (loss) | 1.71 | 4.98 | (.16) | 3.90 | 1.96 |
Total from investment operations | 1.65 | 4.99 | (.19) | 3.87 | 1.92 |
Distributions from net realized gain | (3.27) | (1.06) | (.32) | (.03) K | - |
Redemption fees added to paid in capital B, I | - | - | - | - | - |
Net asset value, end of period | $ 18.45 | $ 20.07 | $ 16.14 | $ 16.65 | $ 12.81 |
Total ReturnA | 8.87% | 32.74% | (.88)% | 30.20% | 17.63% |
Ratios to Average Net Assets C, H | | | | |
Expenses before reductions | .91% | .90% | 1.03% | .95% | 1.08% |
Expenses net of fee waivers, if any | .90% | .90% | 1.03% | .95% | 1.08% |
Expenses net of all reductions | .90% | .88% | 1.02% | .93% | 1.07% |
Net investment income (loss) | (.31)% | .08% | (.16)% E | (.17)% F | (.29)% G |
Supplemental Data | | | | | |
Net assets, end of period (000 omitted) | $ 1,069,105 | $ 1,315,659 | $ 1,166,101 | $ 1,382,688 | $ 1,204,818 |
Portfolio turnover rate D | 148% J | 142% | 150% | 106% | 105% |
A Total returns would have been lower if certain expenses had not been reduced during the applicable periods shown.
B Calculated based on average shares outstanding during the period.
C Fees and expenses of any underlying Fidelity Central Funds are not included in the Fund's expense ratio. The Fund indirectly bears its proportionate share of the expenses of any underlying Fidelity Central Funds.
D Amount does not include the portfolio activity of any underlying Fidelity Central Funds.
E Investment income per share reflects a large, non-recurring dividend which amounted to $.01 per share. Excluding this non-recurring dividend, the ratio of net investment income (loss) to average net assets would have been (.25)%.
F Investment income per share reflects a large, non-recurring dividend which amounted to $.02 per share. Excluding this non-recurring dividend, the ratio of net investment income (loss) to average net assets would have been (.31)%.
G Investment income per share reflects a large, non-recurring dividend which amounted to $.01 per share. Excluding this non-recurring dividend, the ratio of net investment income (loss) to average net assets would have been (.39)%.
H Expense ratios reflect operating expenses of the class. Expenses before reductions do not reflect amounts reimbursed by the investment adviser or reductions from brokerage service arrangements or reductions from other expense offset arrangements and do not represent the amount paid by the class during periods when reimbursements or reductions occur. Expenses net of fee waivers reflect expenses after reimbursement by the investment adviser but prior to reductions from brokerage service arrangements or other expense offset arrangements. Expenses net of all reductions represent the net expenses paid by the class.
I Amount represents less than $.01 per share.
J Portfolio turnover rate excludes securities received or delivered in-kind.
K The amounts shown reflect certain reclassifications related to book to tax differences that were made in the year shown.
See accompanying notes which are an integral part of the financial statements.
Annual Report
Financial Highlights - Institutional Class
Years ended July 31, | 2014 | 2013 | 2012 | 2011 | 2010 |
Selected Per-Share Data | | | | | |
Net asset value, beginning of period | $ 20.10 | $ 16.17 | $ 16.68 | $ 12.83 | $ 10.91 |
Income from Investment Operations | | | | | |
Net investment income (loss) B | (.06) | .01 | (.03) E | (.03) F | (.03) G |
Net realized and unrealized gain (loss) | 1.72 | 4.98 | (.16) | 3.91 | 1.95 |
Total from investment operations | 1.66 | 4.99 | (.19) | 3.88 | 1.92 |
Distributions from net realized gain | (3.27) | (1.06) | (.32) | (.03) K | - |
Redemption fees added to paid in capital B, I | - | - | - | - | - |
Net asset value, end of period | $ 18.49 | $ 20.10 | $ 16.17 | $ 16.68 | $ 12.83 |
Total ReturnA | 8.89% | 32.65% | (.88)% | 30.24% | 17.60% |
Ratios to Average Net Assets C, H | | | | | |
Expenses before reductions | .92% | .92% | 1.06% | .94% | 1.03% |
Expenses net of fee waivers, if any | .92% | .92% | 1.06% | .94% | 1.03% |
Expenses net of all reductions | .92% | .91% | 1.05% | .93% | 1.02% |
Net investment income (loss) | (.32)% | .06% | (.19)% E | (.17)% F | (.24)% G |
Supplemental Data | | | | | |
Net assets, end of period (000 omitted) | $ 51,607 | $ 51,158 | $ 36,694 | $ 41,440 | $ 25,650 |
Portfolio turnover rateD | 148% J | 142% | 150% | 106% | 105% |
A Total returns would have been lower if certain expenses had not been reduced during the applicable periods shown.
B Calculated based on average shares outstanding during the period.
C Fees and expenses of any underlying Fidelity Central Funds are not included in the Fund's expense ratio. The Fund indirectly bears its proportionate share of the expenses of any underlying Fidelity Central Funds.
D Amount does not include the portfolio activity of any underlying Fidelity Central Funds.
E Investment income per share reflects a large, non-recurring dividend which amounted to $.01 per share. Excluding this non-recurring dividend, the ratio of net investment income (loss) to average net assets would have been (.28)%.
F Investment income per share reflects a large, non-recurring dividend which amounted to $.02 per share. Excluding this non-recurring dividend, the ratio of net investment income (loss) to average net assets would have been (.30)%.
G Investment income per share reflects a large, non-recurring dividend which amounted to $.01 per share. Excluding this non-recurring dividend, the ratio of net investment income (loss) to average net assets would have been (.34)%.
H Expense ratios reflect operating expenses of the class. Expenses before reductions do not reflect amounts reimbursed by the investment adviser or reductions from brokerage service arrangements or reductions from other expense offset arrangements and do not represent the amount paid by the class during periods when reimbursements or reductions occur. Expenses net of fee waivers reflect expenses after reimbursement by the investment adviser but prior to reductions from brokerage service arrangements or other expense offset arrangements. Expenses net of all reductions represent the net expenses paid by the class.
I Amount represents less than $.01 per share.
J Portfolio turnover rate excludes securities received or delivered in-kind.
K The amounts shown reflect certain reclassifications related to book to tax differences that were made in the year shown.
See accompanying notes which are an integral part of the financial statements.
Annual Report
Notes to Financial Statements
For the period ended July 31, 2014
1. Organization.
Fidelity® Small Cap Growth Fund (the Fund) is a fund of Fidelity Securities Fund (the Trust) and is authorized to issue an unlimited number of shares. The Trust is registered under the Investment Company Act of 1940, as amended (the 1940 Act), as an open-end management investment company organized as a Massachusetts business trust. The Fund offers Class A, Class T, Class C, Small Cap Growth and Institutional Class shares, each of which, along with Class B shares, has equal rights as to assets and voting privileges. Class B shares are closed to new accounts and additional purchases, except for exchanges and reinvestments. The Fund offered Class F shares during the period June 26, 2009 through November 15, 2013, and all outstanding shares were redeemed by November 15, 2013. Each class has exclusive voting rights with respect to matters that affect that class. Class B shares will automatically convert to Class A shares after a holding period of seven years from the initial date of purchase.
2. Investments in Fidelity Central Funds.
The Fund invests in Fidelity Central Funds, which are open-end investment companies generally available only to other investment companies and accounts managed by the investment adviser and its affiliates. The Fund's Schedule of Investments lists each of the Fidelity Central Funds held as of period end, if any, as an investment of the Fund, but does not include the underlying holdings of each Fidelity Central Fund. As an Investing Fund, the Fund indirectly bears its proportionate share of the expenses of the underlying Fidelity Central Funds.
The Money Market Central Funds seek preservation of capital and current income and are managed by Fidelity Investments Money Management, Inc. (FIMM), an affiliate of the investment adviser. Annualized expenses of the Money Market Central Funds as of their most recent shareholder report date are less than .01%.
A complete unaudited list of holdings for each Fidelity Central Fund is available upon request or at the Securities and Exchange Commission (the SEC) website at www.sec.gov. In addition, the financial statements of the Fidelity Central Funds, which are not covered by the Fund's Report of Independent Registered Public Accounting Firm, are available on the SEC website or upon request.
3. Significant Accounting Policies.
The financial statements have been prepared in conformity with accounting principles generally accepted in the United States of America (GAAP), which require management to make certain estimates and assumptions at the date of the financial statements. Actual results could differ from those estimates. Subsequent events, if any, through the date that the financial statements were issued have been evaluated in the preparation of
Annual Report
3. Significant Accounting Policies - continued
the financial statements. The following summarizes the significant accounting policies of the Fund:
Investment Valuation. Investments are valued as of 4:00 p.m. Eastern time on the last calendar day of the period. In accordance with valuation policies and procedures approved by the Board of Trustees (the Board), the Fund attempts to obtain prices from one or more third party pricing vendors or brokers to value its investments. When current market prices, quotations or currency exchange rates are not readily available or reliable, investments will be fair valued in good faith by the Fidelity Management & Research Company (FMR) Fair Value Committee (the Committee), in accordance with procedures adopted by the Board. Factors used in determining fair value vary by investment type and may include market or investment specific events. The frequency with which these procedures are used cannot be predicted and they may be utilized to a significant extent. The Committee oversees the Fund's valuation policies and procedures and is responsible for approving and reporting to the Board all fair value determinations.
The Fund categorizes the inputs to valuation techniques used to value its investments into a disclosure hierarchy consisting of three levels as shown below:
Level 1 - quoted prices in active markets for identical investments
Level 2 - other significant observable inputs (including quoted prices for similar investments, interest rates, prepayment speeds, etc.)
Level 3 - unobservable inputs (including the Fund's own assumptions based on the best information available)
Valuation techniques used to value the Fund's investments by major category are as follows:
Equity securities, including restricted securities, for which market quotations are readily available, are valued at the last reported sale price or official closing price as reported by a third party pricing vendor on the primary market or exchange on which they are traded and are categorized as Level 1 in the hierarchy. In the event there were no sales during the day or closing prices are not available, securities are valued at the last quoted bid price or may be valued using the last available price and are generally categorized as Level 2 in the hierarchy. For foreign equity securities, when market or security specific events arise, comparisons to the valuation of American Depositary Receipts (ADRs), futures contracts, Exchange-Traded Funds (ETFs) and certain indexes as well as quoted prices for similar securities may be used and would be categorized as Level 2 in the hierarchy. Utilizing these techniques may result in transfers between Level 1 and Level 2. For equity securities, including restricted securities, where observable inputs are
Annual Report
Notes to Financial Statements - continued
3. Significant Accounting Policies - continued
Investment Valuation - continued
limited, assumptions about market activity and risk are used and these securities may be categorized as Level 3 in the hierarchy.
Investments in open-end mutual funds, including the Fidelity Central Funds, are valued at their closing net asset value (NAV) each business day and are categorized as Level 1 in the hierarchy.
Changes in valuation techniques may result in transfers in or out of an assigned level within the disclosure hierarchy.
Foreign Currency. The Fund may use foreign currency contracts to facilitate transactions in foreign-denominated securities. Gains and losses from these transactions may arise from changes in the value of the foreign currency or if the counterparties do not perform under the contracts' terms.
Foreign-denominated assets, including investment securities, and liabilities are translated into U.S. dollars at the exchange rates at period end. Purchases and sales of investment securities, income and dividends received and expenses denominated in foreign currencies are translated into U.S. dollars at the exchange rate in effect on the transaction date.
The effects of exchange rate fluctuations on investments are included with the net realized and unrealized gain (loss) on investment securities. Other foreign currency transactions resulting in realized and unrealized gain (loss) are disclosed separately.
Investment Transactions and Income. For financial reporting purposes, the Fund's investment holdings and NAV include trades executed through the end of the last business day of the period. The NAV per share for processing shareholder transactions is calculated as of the close of business of the New York Stock Exchange (NYSE), normally 4:00 p.m. Eastern time and includes trades executed through the end of the prior business day. Gains and losses on securities sold are determined on the basis of identified cost and may include proceeds received from litigation. Dividend income is recorded on the ex-dividend date, except for certain dividends from foreign securities where the ex-dividend date may have passed, which are recorded as soon as the Fund is informed of the ex-dividend date. Non-cash dividends included in dividend income, if any, are recorded at the fair market value of the securities received. Income and capital gain distributions from Fidelity Central Funds, if any, are recorded on the ex-dividend date. Distributions received on securities that represent a return of capital or capital gain are recorded as a reduction of cost of investments and/or as a realized gain. Subsequent to ex-dividend date the Fund determines the components of these distributions, based upon receipt of tax filings or other correspondence relating to the underlying investment.
Annual Report
3. Significant Accounting Policies - continued
Investment Transactions and Income - continued
Interest income is accrued as earned and includes coupon interest and amortization of premium and accretion of discount on debt securities as applicable. Investment income is recorded net of foreign taxes withheld where recovery of such taxes is uncertain.
Class Allocations and Expenses. Investment income, realized and unrealized capital gains and losses, common expenses of the Fund, and certain fund-level expense reductions, if any, are allocated daily on a pro-rata basis to each class based on the relative net assets of each class to the total net assets of the Fund. Each class differs with respect to transfer agent and distribution and service plan fees incurred. Certain expense reductions may also differ by class. For the reporting period, the allocated portion of income and expenses to each class as a percent of its average net assets may vary due to the timing of recording these transactions in relation to fluctuating net assets of the classes. Expenses directly attributable to a fund are charged to that fund. Expenses attributable to more than one fund are allocated among the respective funds on the basis of relative net assets or other appropriate methods. Expense estimates are accrued in the period to which they relate and adjustments are made when actual amounts are known.
Income Tax Information and Distributions to Shareholders. Each year, the Fund intends to qualify as a regulated investment company under Subchapter M of the Internal Revenue Code, including distributing substantially all of its taxable income and realized gains. As a result, no provision for U.S. Federal income taxes is required. As of July 31, 2014, the Fund did not have any unrecognized tax benefits in the financial statements; nor is the Fund aware of any tax positions for which it is reasonably possible that the total amounts of unrecognized tax benefits will significantly change in the next twelve months. The Fund files a U.S. federal tax return, in addition to state and local tax returns as required. The Fund's federal income tax returns are subject to examination by the Internal Revenue Service (IRS) for a period of three fiscal years after they are filed. State and local tax returns may be subject to examination for an additional fiscal year depending on the jurisdiction. Foreign taxes are provided for based on the Fund's understanding of the tax rules and rates that exist in the foreign markets in which it invests.
Distributions are declared and recorded on the ex-dividend date. Income dividends and capital gain distributions are declared separately for each class. Income and capital gain distributions are determined in accordance with income tax regulations, which may differ from GAAP. In addition, the Fund claimed a portion of the payment made to redeeming shareholders as a distribution for income tax purposes.
Capital accounts within the financial statements are adjusted for permanent book-tax differences. These adjustments have no impact on net assets or the results of operations.
Annual Report
Notes to Financial Statements - continued
3. Significant Accounting Policies - continued
Income Tax Information and Distributions to Shareholders - continued
Capital accounts are not adjusted for temporary book-tax differences which will reverse in a subsequent period.
Book-tax differences are primarily due to in-kind transactions, futures transactions, foreign currency transactions, partnerships and losses deferred due to wash sales and excise tax regulations.
The federal tax cost of investment securities and unrealized appreciation (depreciation) as of period end were as follows:
Gross unrealized appreciation | $ 133,804,925 |
Gross unrealized depreciation | (55,161,096) |
Net unrealized appreciation (depreciation) on securities | $ 78,643,829 |
| |
Tax Cost | $ 1,242,690,076 |
The tax-based components of distributable earnings as of period end were as follows:
Undistributed long-term capital gain | $ 81,536,530 |
Net unrealized appreciation (depreciation) on securities and other investments | $ 78,640,127 |
The Fund intends to elect to defer to its next fiscal year $4,082,221 of ordinary losses recognized during the period January 1, 2014 to July 31, 2014.
The tax character of distributions paid was as follows:
| July 31, 2014 | July 31, 2013 |
Ordinary Income | $ 106,613,332 | $ 5,191,398 |
Long-term Capital Gains | 199,632,904 | 117,369,049 |
Total | $ 306,246,236 | $ 122,560,447 |
Short-Term Trading (Redemption) Fees. Shares held by investors in the Fund less than 90 days may have been subject to a redemption fee equal to 1.50% of the NAV of shares redeemed. All redemption fees, which reduce the proceeds of the shareholder redemption, are retained by the Fund and accounted for as an addition to paid in capital.
4. Derivative Instruments.
Risk Exposures and the Use of Derivative Instruments. The Fund's investment objective allows the Fund to enter into various types of derivative contracts, including futures contracts. Derivatives are investments whose value is primarily derived from underlying assets, indices or reference rates and may be transacted on an exchange or over-the-counter (OTC). Derivatives may involve a future commitment to buy or sell a
Annual Report
4. Derivative Instruments - continued
Risk Exposures and the Use of Derivative Instruments - continued
specified asset based on specified terms, to exchange future cash flows at periodic intervals based on a notional principal amount, or for one party to make one or more payments upon the occurrence of specified events in exchange for periodic payments from the other party.
The Fund used derivatives to increase returns and to manage exposure to certain risks as defined below. The success of any strategy involving derivatives depends on analysis of numerous economic factors, and if the strategies for investment do not work as intended, the Fund may not achieve its objectives.
The Fund's use of derivatives increased or decreased its exposure to the following risk:
Equity Risk | Equity risk relates to the fluctuations in the value of financial instruments as a result of changes in market prices (other than those arising from interest rate risk or foreign exchange risk), whether caused by factors specific to an individual investment, its issuer, or all factors affecting all instruments traded in a market or market segment. |
The Fund is also exposed to additional risks from investing in derivatives, such as liquidity risk and counterparty credit risk. Liquidity risk is the risk that the Fund will be unable to close out the derivative in the open market in a timely manner. Counterparty credit risk is the risk that the counterparty will not be able to fulfill its obligation to the Fund. Counterparty credit risk related to exchange-traded futures contracts may be mitigated by the protection provided by the exchange on which they trade.
Investing in derivatives may involve greater risks than investing in the underlying assets directly and, to varying degrees, may involve risk of loss in excess of any initial investment and collateral received and amounts recognized in the Statement of Assets and Liabilities. In addition, there may be the risk that the change in value of the derivative contract does not correspond to the change in value of the underlying instrument.
Futures Contracts. A futures contract is an agreement between two parties to buy or sell a specified underlying instrument for a fixed price at a specified future date. The Fund used futures contracts to manage its exposure to the stock market.
Upon entering into a futures contract, a fund is required to deposit either cash or securities (initial margin) with a clearing broker in an amount equal to a certain percentage of the face value of the contract. Futures contracts are marked-to-market daily and subsequent daily payments (variation margin) are made or received by a fund depending on the daily fluctuations in the value of the futures contracts and are recorded as unrealized appreciation or (depreciation). This receivable and/or payable, if any, is included in daily
Annual Report
Notes to Financial Statements - continued
4. Derivative Instruments - continued
Futures Contracts - continued
variation margin for derivative instruments in the Statement of Assets and Liabilities. Realized gain or (loss) is recorded upon the expiration or closing of a futures contract.
Any open futures contracts at period end are presented in the Schedule of Investments under the caption "Futures Contracts." The underlying face amount at value reflects each contract's exposure to the underlying instrument or index at period end.
During the period the Fund recognized net realized gain (loss) of $(2,221,706) related to its investment in futures contracts. This amount is included in the Statement of Operations.
5. Purchases and Sales of Investments.
Purchases and sales of securities, other than short-term securities and in-kind transactions, aggregated $2,507,771,818 and $2,337,256,072, respectively.
6. Fees and Other Transactions with Affiliates.
Management Fee. Fidelity Management & Research Company (the investment adviser) and its affiliates provide the Fund with investment management related services for which the Fund pays a monthly management fee. The management fee is the sum of an individual fund fee rate that is based on an annual rate of .45% of the Fund's average net assets and an annualized group fee rate that averaged .25% during the period. The group fee rate is based upon the average net assets of all the mutual funds advised by the investment adviser, including any mutual funds previously advised by the investment adviser that are currently advised by Fidelity SelectCo, LLC, an affiliate of the investment adviser. The group fee rate decreases as assets under management increase and increases as assets under management decrease. In addition, the management fee is subject to a performance adjustment (up to a maximum of ± .20% of the Fund's average net assets over a 36 month performance period). The upward or downward adjustment to the management fee is based on the relative investment performance of Small Cap Growth as compared to its benchmark index, the Russell 2000 Growth Index, over the same 36 month performance period. For the reporting period, the total annual management fee rate, including the performance adjustment, was .66% of the Fund's average net assets. The performance adjustment included in the management fee rate may be higher or lower than the maximum performance adjustment rate due to the difference between the average net assets for the reporting and performance periods.
Annual Report
6. Fees and Other Transactions with Affiliates - continued
Distribution and Service Plan Fees. In accordance with Rule 12b-1 of the 1940 Act, the Fund has adopted separate Distribution and Service Plans for each class of shares. Certain classes pay Fidelity Distributors Corporation (FDC), an affiliate of the investment adviser, separate Distribution and Service Fees, each of which is based on an annual percentage of each class' average net assets. In addition, FDC may pay financial intermediaries for selling shares of the Fund and providing shareholder support services. For the period, the Distribution and Service Fee rates, total fees and amounts retained by FDC were as follows:
| Distribution
Fee | Service
Fee | Total Fees | Retained
by FDC |
Class A | -% | .25% | $ 218,076 | $ 4,628 |
Class T | .25% | .25% | 210,598 | - |
Class B | .75% | .25% | 32,670 | 24,728 |
Class C | .75% | .25% | 412,947 | 83,407 |
| | | $ 874,291 | $ 112,763 |
Sales Load. FDC may receive a front-end sales charge of up to 5.75% for selling Class A shares and 3.50% for selling Class T shares, some of which is paid to financial intermediaries for selling shares of the Fund. Depending on the holding period, FDC may receive contingent deferred sales charges levied on Class A, Class T, Class B, and Class C redemptions. The deferred sales charges range from 5.00% to 1.00% for Class B shares, 1.00% for Class C shares, 1.00% for certain purchases of Class A shares and .25% for certain purchases of Class T shares.
For the period, sales charge amounts retained by FDC were as follows:
| Retained
by FDC |
Class A | $ 58,222 |
Class T | 14,217 |
Class B* | 1,899 |
Class C* | 4,695 |
| $ 79,033 |
* When Class B and Class C shares are initially sold, FDC pays commissions from its own resources to financial intermediaries through which the sales
are made.
Transfer Agent Fees. Fidelity Investments Institutional Operations Company, Inc., (FIIOC), an affiliate of the investment adviser, is the transfer, dividend disbursing and shareholder servicing agent for each class of the Fund. FIIOC receives account fees and asset-based fees that vary according to the account size and type of account of the shareholders of the respective classes of the Fund. FIIOC pays for typesetting, printing and mailing of shareholder reports, except proxy statements.
Annual Report
Notes to Financial Statements - continued
6. Fees and Other Transactions with Affiliates - continued
Transfer Agent Fees - continued
For the period, transfer agent fees for each class were as follows:
| Amount | % of
Average
Net Assets |
Class A | $ 229,497 | .26 |
Class T | 120,469 | .29 |
Class B | 9,848 | .30 |
Class C | 121,452 | .29 |
Small Cap Growth | 2,290,179 | .20 |
Institutional Class | 111,427 | .21 |
| $ 2,882,872 | |
Accounting and Security Lending Fees. Fidelity Service Company, Inc. (FSC), an affiliate of the investment adviser, maintains the Fund's accounting records. The accounting fee is based on the level of average net assets for each month. Under a separate contract, FSC administers the security lending program. The security lending fee is based on the number and duration of lending transactions.
Brokerage Commissions. The Fund placed a portion of its portfolio transactions with brokerage firms which are affiliates of the investment adviser. Brokerage commissions are included in net realized gain (loss) and change in net unrealized appreciation (depreciation) in the Statement of Operations. The commissions paid to these affiliated firms were $89,841 for the period.
Interfund Lending Program. Pursuant to an Exemptive Order issued by the SEC, the Fund, along with other registered investment companies having management contracts with FMR or other affiliated entities of FMR, may participate in an interfund lending program. This program provides an alternative credit facility allowing the funds to borrow from, or lend money to, other participating affiliated funds. At period end, there were no interfund loans outstanding. The Fund's activity in this program during the period for which loans were outstanding was as follows:
Borrower or Lender | Average Loan
Balance | Weighted Average
Interest Rate | Interest Expense |
Borrower | $ 8,287,364 | .32% | $ 819 |
Redemptions In-Kind. During the period, 70,585,530 shares of the Fund held by affiliated entities were redeemed for investments with a value of $1,380,652,586. The net realized gain of $304,585,595 on investments delivered through in-kind redemptions is included in the accompanying Statement of Operations. The amount of the in-kind redemption is included in share transactions in the accompanying Statement of Changes
Annual Report
6. Fees and Other Transactions with Affiliates - continued
Redemptions In-Kind - continued
in Net Assets as well as Note 11: Share Transactions. The Fund recognized no gain or loss for federal income tax purposes.
7. Committed Line of Credit.
The Fund participates with other funds managed by the investment adviser or an affiliate in a $4.25 billion credit facility (the "line of credit") to be utilized for temporary or emergency purposes to fund shareholder redemptions or for other short-term liquidity purposes. The Fund has agreed to pay commitment fees on its pro-rata portion of the line of credit, which amounted to $2,899 and is reflected in Miscellaneous expenses on the Statement of Operations. During the period, the Fund did not borrow on this line of credit.
8. Security Lending.
The Fund lends portfolio securities through a lending agent from time to time in order to earn additional income. For equity securities, a lending agent is used and may loan securities to certain qualified borrowers, including Fidelity Capital Markets (FCM), a broker-dealer affiliated with the Fund. On the settlement date of the loan, the Fund receives collateral (in the form of U.S. Treasury obligations, letters of credit and/or cash) against the loaned securities and maintains collateral in an amount not less than 100% of the market value of the loaned securities during the period of the loan. The market value of the loaned securities is determined at the close of business of the Fund and any additional required collateral is delivered to the Fund on the next business day. If the borrower defaults on its obligation to return the securities loaned because of insolvency or other reasons, the Fund may apply collateral received from the borrower against the obligation. The Fund may experience delays and costs in recovering the securities loaned. Any cash collateral received is invested in the Fidelity Securities Lending Cash Central Fund. The value of loaned securities and cash collateral at period end are disclosed on the Fund's Statement of Assets and Liabilities. At period end, there were no security loans outstanding with FCM. Security lending income represents the income earned on investing cash collateral, less rebates paid to borrowers and any lending agent fees associated with the loan, plus any premium payments received for lending certain types of securities. Security lending income is presented in the Statement of Operations as a component of income from Fidelity Central Funds and includes $68,452 from securities loaned to FCM.
Annual Report
Notes to Financial Statements - continued
9. Expense Reductions.
Commissions paid to certain brokers with whom the investment adviser, or its affiliates, places trades on behalf of the Fund include an amount in addition to trade execution, which may be rebated back to the Fund to offset certain expenses. This amount totaled $56,370 for the period. In addition, through arrangements with the Fund's custodian, credits realized as a result of uninvested cash balances were used to reduce the Fund's expenses. During the period, these credits reduced the Fund's custody expenses by $86.
In addition, the investment adviser reimbursed a portion of the Fund's operating expenses during the period in the amount of $24,445.
10. Distributions to Shareholders.
Distributions to shareholders of each class were as follows:
Years ended July 31, | 2014 A | 2013 |
From net realized gain | | |
Class A | $ 13,043,180 | $ 3,855,020 |
Class T | 6,310,012 | 1,778,904 |
Class B | 574,582 | 260,524 |
Class C | 6,249,863 | 1,656,727 |
Small Cap Growth | 191,545,684 | 74,940,038 |
Class F | 80,609,253 | 37,680,389 |
Institutional Class | 7,913,662 | 2,388,845 |
Total | $ 306,246,236 | $ 122,560,447 |
A All Class F shares were redeemed on November 15, 2013.
11. Share Transactions.
Transactions for each class of shares were as follows:
| Shares | Dollars |
Years ended July 31, | 2014 A | 2013 | 2014 A | 2013 |
Class A | | | | |
Shares sold | 1,706,264 | 969,311 | $ 32,017,468 | $ 16,711,827 |
Reinvestment of distributions | 685,582 | 231,282 | 12,377,436 | 3,646,231 |
Shares redeemed | (1,267,150) | (1,149,326) | (23,663,751) | (19,219,034) |
Net increase (decrease) | 1,124,696 | 51,267 | $ 20,731,153 | $ 1,139,024 |
Class T | | | | |
Shares sold | 787,491 | 457,321 | $ 14,539,628 | $ 7,743,595 |
Reinvestment of distributions | 341,036 | 106,640 | 6,061,090 | 1,660,117 |
Shares redeemed | (506,140) | (538,707) | (9,192,820) | (8,802,237) |
Net increase (decrease) | 622,387 | 25,254 | $ 11,407,898 | $ 601,475 |
Annual Report
11. Share Transactions - continued
| Shares | Dollars |
Years ended July 31, | 2014 A | 2013 | 2014 A | 2013 |
Class B | | | | |
Shares sold | 11,205 | 6,696 | $ 198,217 | $ 106,485 |
Reinvestment of distributions | 32,147 | 16,337 | 548,598 | 246,159 |
Shares redeemed | (66,282) | (107,598) | (1,168,208) | (1,730,845) |
Net increase (decrease) | (22,930) | (84,565) | $ (421,393) | $ (1,378,201) |
Class C | | | | |
Shares sold | 918,904 | 456,788 | $ 16,220,240 | $ 7,531,447 |
Reinvestment of distributions | 347,970 | 103,215 | 5,911,022 | 1,550,542 |
Shares redeemed | (510,512) | (428,305) | (8,883,388) | (6,821,754) |
Net increase (decrease) | 756,362 | 131,698 | $ 13,247,874 | $ 2,260,235 |
Small Cap Growth | | | | |
Shares sold | 30,614,664 | 10,379,088 | $ 589,831,022 | $ 182,249,151 |
Reinvestment of distributions | 10,184,956 | 4,595,875 | 187,557,177 | 73,721,316 |
Shares redeemed | (48,426,256) B | (21,652,202) | (934,113,968) B | (371,997,767) |
Net increase (decrease) | (7,626,636) | (6,677,239) | $ (156,725,769) | $ (116,027,300) |
Class F | | | | |
Shares sold | 768,083 | 7,670,010 | $ 15,293,461 | $ 131,231,307 |
Reinvestment of distributions | 4,357,257 | 2,336,095 | 80,609,253 | 37,680,389 |
Shares redeemed | (41,060,113) B | (6,554,937) | (806,457,595) B | (118,928,973) |
Net increase (decrease) | (35,934,773) | 3,451,168 | $ (710,554,881) | $ 49,982,723 |
Institutional Class | | | | |
Shares sold | 933,934 | 727,207 | $ 18,129,031 | $ 12,757,998 |
Reinvestment of distributions | 381,830 | 128,780 | 7,062,159 | 2,069,290 |
Shares redeemed | (1,069,577) | (580,321) | (20,552,810) | (9,884,418) |
Net increase (decrease) | 246,187 | 275,666 | $ 4,638,380 | $ 4,942,870 |
A All Class F shares were redeemed on November 15, 2013.
B Amount includes in-kind redemptions (see Note 6: Redemptions In-Kind).
12. Other.
The Fund's organizational documents provide former and current trustees and officers with a limited indemnification against liabilities arising in connection with the performance of their duties to the Fund. In the normal course of business, the Fund may also enter into contracts that provide general indemnifications. The Fund's maximum exposure under these arrangements is unknown as this would be dependent on future claims that may be made against the Fund. The risk of material loss from such claims is considered remote.
Annual Report
To the Trustees of Fidelity Securities Fund and the Shareholders of Fidelity Small Cap Growth Fund:
In our opinion, the accompanying statement of assets and liabilities, including the schedule of investments, and the related statements of operations and of changes in net assets and the financial highlights present fairly, in all material respects, the financial position of Fidelity Small Cap Growth Fund (a fund of Fidelity Securities Fund) at July 31, 2014, the results of its operations for the year then ended, the changes in its net assets for each of the two years in the period then ended and the financial highlights for each of the five years in the period then ended, in conformity with accounting principles generally accepted in the United States of America. These financial statements and financial highlights (hereafter referred to as "financial statements") are the responsibility of the Fidelity Small Cap Growth Fund's management. Our responsibility is to express an opinion on these financial statements based on our audits. We conducted our audits of these financial statements in accordance with the standards of the Public Company Accounting Oversight Board (United States). Those standards require that we plan and perform the audit to obtain reasonable assurance about whether the financial statements are free of material misstatement. An audit includes examining, on a test basis, evidence supporting the amounts and disclosures in the financial statements, assessing the accounting principles used and significant estimates made by management, and evaluating the overall financial statement presentation. We believe that our audits, which included confirmation of securities at July 31, 2014 by correspondence with the custodian and brokers, provide a reasonable basis for our opinion.
PricewaterhouseCoopers LLP
Boston, Massachusetts
September 15, 2014
Annual Report
The Trustees, Member of the Advisory Board, and officers of the trust and fund, as applicable, are listed below. The Board of Trustees governs the fund and is responsible for protecting the interests of shareholders. The Trustees are experienced executives who meet periodically throughout the year to oversee the fund's activities, review contractual arrangements with companies that provide services to the fund, oversee management of the risks associated with such activities and contractual arrangements, and review the fund's performance. Except for James C. Curvey, each of the Trustees oversees 173 funds. Mr. Curvey oversees 397 funds.
The Trustees hold office without limit in time except that (a) any Trustee may resign; (b) any Trustee may be removed by written instrument, signed by at least two-thirds of the number of Trustees prior to such removal; (c) any Trustee who requests to be retired or who has become incapacitated by illness or injury may be retired by written instrument signed by a majority of the other Trustees; and (d) any Trustee may be removed at any special meeting of shareholders by a two-thirds vote of the outstanding voting securities of the trust. Each Trustee who is not an interested person (as defined in the 1940 Act) of the trust and the fund (Independent Trustee), shall retire not later than the last day of the calendar year in which his or her 75th birthday occurs. The Independent Trustees may waive this mandatory retirement age policy with respect to individual Trustees. The officers and Advisory Board Member hold office without limit in time, except that any officer and Advisory Board Member may resign or may be removed by a vote of a majority of the Trustees at any regular meeting or any special meeting of the Trustees. Except as indicated, each individual has held the office shown or other offices in the same company for the past five years.
Experience, Skills, Attributes, and Qualifications of the Fund's Trustees. The Governance and Nominating Committee has adopted a statement of policy that describes the experience, qualifications, attributes, and skills that are necessary and desirable for potential Independent Trustee candidates (Statement of Policy). The Board believes that each Trustee satisfied at the time he or she was initially elected or appointed a Trustee, and continues to satisfy, the standards contemplated by the Statement of Policy. The Governance and Nominating Committee also engages professional search firms to help identify potential Independent Trustee candidates who have the experience, qualifications, attributes, and skills consistent with the Statement of Policy. From time to time, additional criteria based on the composition and skills of the current Independent Trustees, as well as experience or skills that may be appropriate in light of future changes to board composition, business conditions, and regulatory or other developments, have also been considered by the professional search firms and the Governance and Nominating Committee. In addition, the Board takes into account the Trustees' commitment and participation in Board and committee meetings, as well as their leadership of standing and ad hoc committees throughout their tenure.
In determining that a particular Trustee was and continues to be qualified to serve as a Trustee, the Board has considered a variety of criteria, none of which, in isolation, was controlling. The Board believes that, collectively, the Trustees have balanced and diverse experience, qualifications, attributes, and skills, which allow the Board to operate effectively in governing the fund and protecting the interests of shareholders. Information about the specific experience, skills, attributes, and qualifications of each Trustee, which in each case led to the Board's conclusion that the Trustee should serve (or continue to serve) as a trustee of the fund, is provided below.
Annual Report
Trustees and Officers - continued
Board Structure and Oversight Function. James C. Curvey is an interested person (as defined in the 1940 Act) and currently serves as Chairman. The Trustees have determined that an interested Chairman is appropriate and benefits shareholders because an interested Chairman has a personal and professional stake in the quality and continuity of services provided to the fund. Independent Trustees exercise their informed business judgment to appoint an individual of their choosing to serve as Chairman, regardless of whether the Trustee happens to be independent or a member of management. The Independent Trustees have determined that they can act independently and effectively without having an Independent Trustee serve as Chairman and that a key structural component for assuring that they are in a position to do so is for the Independent Trustees to constitute a substantial majority for the Board. The Independent Trustees also regularly meet in executive session. Ned C. Lautenbach serves as Chairman of the Independent Trustees and as such (i) acts as a liaison between the Independent Trustees and management with respect to matters important to the Independent Trustees and (ii) with management prepares agendas for Board meetings.
Fidelity funds are overseen by different Boards of Trustees. The fund's Board oversees Fidelity's equity and high income funds and another Board oversees Fidelity's investment-grade bond, money market, and asset allocation funds. The asset allocation funds may invest in Fidelity funds overseen by the fund's Board. The use of separate Boards, each with its own committee structure, allows the Trustees of each group of Fidelity funds to focus on the unique issues of the funds they oversee, including common research, investment, and operational issues. On occasion, the separate Boards establish joint committees to address issues of overlapping consequences for the Fidelity funds overseen by each Board.
The Trustees operate using a system of committees to facilitate the timely and efficient consideration of all matters of importance to the Trustees, the fund, and fund shareholders and to facilitate compliance with legal and regulatory requirements and oversight of the fund's activities and associated risks. The Board, acting through its committees, has charged FMR and its affiliates with (i) identifying events or circumstances the occurrence of which could have demonstrably adverse effects on the fund's business and/or reputation; (ii) implementing processes and controls to lessen the possibility that such events or circumstances occur or to mitigate the effects of such events or circumstances if they do occur; and (iii) creating and maintaining a system designed to evaluate continuously business and market conditions in order to facilitate the identification and implementation processes described in (i) and (ii) above. Because the day-to-day operations and activities of the fund are carried out by or through FMR, its affiliates and other service providers, the fund's exposure to risks is mitigated but not eliminated by the processes overseen by the Trustees. While each of the Board's committees has responsibility for overseeing different aspects of the fund's activities, oversight is exercised primarily through the Operations, Audit, and Compliance Committees. In addition, the Independent Trustees have worked with FMR to enhance the Board's oversight of investment and financial risks, legal and regulatory risks, technology risks, and operational risks, including the development of additional risk reporting to the Board. For example, a working group comprised of Independent Trustees and FMR has worked and continues to work to review the Fidelity funds' valuation-related activities, reporting and risk management. Appropriate personnel, including but not limited to the fund's Chief Compliance Officer (CCO), FMR's internal auditor, the independent accountants, the fund's Treasurer and portfolio management personnel, make periodic reports to the Board's committees, as appropriate, including an annual review of FMR's risk management program for the Fidelity funds. The responsibilities of each standing committee, including their oversight responsibilities, are described further under "Standing Committees of the Fund's Trustees."
Annual Report
The fund's Statement of Additional Information (SAI) includes more information about the Trustees. To request a free copy, call Fidelity at 1-877-208-0098.
Interested Trustees*:
Correspondence intended for each Trustee who is an interested person may be sent to Fidelity Investments, 245 Summer Street, Boston, Massachusetts 02210.
Name, Year of Birth; Principal Occupations and Other Relevant Experience+ |
James C. Curvey (1935) |
Year of Election or Appointment: 2007 Trustee Chairman of the Board of Trustees |
| Mr. Curvey also serves as Trustee of other Fidelity funds. Mr. Curvey is a Director of Fidelity Research & Analysis Co. (2009-present), and Vice Chairman (2007-present) and Director of FMR LLC. In addition, Mr. Curvey serves as an Overseer for the Boston Symphony Orchestra and a member of the Trustees of Villanova University. Previously, Mr. Curvey served as a Director of Fidelity Investments Money Management, Inc. (2009-2014), a Director of FMR (2007-2014), a Director of FMR Co., Inc. (2007-2014) and was the Vice Chairman (2006-2007) and Director (2000-2007) of FMR Corp. |
Charles S. Morrison (1960) |
Year of Election or Appointment: 2014 Trustee |
| Mr. Morrison also serves as Trustee of other funds. He serves as President, Asset Management (2014-present) and is an employee of Fidelity Investments. Previously, Mr. Morrison served as Vice President of Fidelity's Fixed Income and Asset Allocation Funds (2012-2014), President, Fixed Income (2011-2014), Vice President of Fidelity's Money Market Funds (2005-2009), President, Money Market Group Leader of FMR (2009), and Senior Vice President, Money Market Group of FMR (2004-2009). Mr. Morrison also served as Vice President of Fidelity's Bond Funds (2002-2005), certain Balanced Funds (2002-2005), and certain Asset Allocation Funds (2002-2007), and as Senior Vice President (2002-2005) of Fidelity's Bond Division. |
* Trustees have been determined to be "Interested Trustees" by virtue of, among other things, their affiliation with the trust or various entities under common control with FMR
+ The information above includes each Trustee's principal occupation during the last five years and other information relating to the experience, attributes, and skills relevant to each Trustee's qualifications to serve as a Trustee, which led to the conclusion that each Trustee should serve as a Trustee for the fund.
Annual Report
Independent Trustees:
Correspondence intended for each Independent Trustee (that is, the Trustees other than the Interested Trustees) may be sent to Fidelity Investments, P.O. Box 55235, Boston, Massachusetts 02205-5235.
Name, Year of Birth; Principal Occupations and Other Relevant Experience+ |
Dennis J. Dirks (1948) |
Year of Election or Appointment: 2005 Trustee |
| Mr. Dirks also serves as Trustee of other Fidelity funds. Prior to his retirement in May 2003, Mr. Dirks was Chief Operating Officer and a member of the Board of The Depository Trust & Clearing Corporation (DTCC). He also served as President, Chief Operating Officer, and Board member of The Depository Trust Company (DTC) and President and Board member of the National Securities Clearing Corporation (NSCC). In addition, Mr. Dirks served as Chief Executive Officer and Board member of the Government Securities Clearing Corporation, Chief Executive Officer and Board member of the Mortgage-Backed Securities Clearing Corporation, as a Trustee and a member of the Finance Committee of Manhattan College (2005-2008), and as a Trustee and a member of the Finance Committee of AHRC of Nassau County (2006-2008). Mr. Dirks is a member of the Independent Directors Council (IDC) Governing Council (2010-present) and Board of Directors for The Brookville Center for Children's Services, Inc. (2009-present). |
Alan J. Lacy (1953) |
Year of Election or Appointment: 2008 Trustee |
| Mr. Lacy also serves as Trustee of other Fidelity funds. Mr. Lacy serves as Senior Adviser (2007-present) of Oak Hill Capital Partners, L.P. (private equity). Mr. Lacy also served as Chief Executive Officer (2000-2005) and Vice Chairman (2005-2006) of Sears Holdings Corporation and Sears, Roebuck and Co. (retail). In addition, Mr. Lacy serves as a member of the Board of Directors of Dave & Buster's Entertainment, Inc. (restaurant and entertainment complexes, 2010-present), Earth Fare, Inc. (retail grocery, 2012-present), The Hillman Companies, Inc. (hardware wholesalers, 2010-present), and Bristol-Myers Squibb Company (global pharmaceuticals, 2008-present). Mr. Lacy is a member of the Board of Trustees of The National Parks Conservation Association (2006-present). Previously, Mr. Lacy served as Chairman of the Board of Trustees of the National Parks Conservation Association (2008-2011) and as a member of the Board of Directors for the Western Union Company (global money transfer, 2006-2011). |
Ned C. Lautenbach (1944) |
Year of Election or Appointment: 2000 Trustee Chairman of the Independent Trustees |
| Mr. Lautenbach also serves as Trustee of other Fidelity funds. Mr. Lautenbach currently serves as the Lead Director of the Eaton Corporation Board of Directors (diversified industrial, 1997-present). Mr. Lautenbach is Chairman of the Board of Directors of the Philharmonic Center for the Arts in Naples, Florida (2012-present) and a member of the Council on Foreign Relations (1994-present). Previously, Mr. Lautenbach was a Partner/Advisory Partner at Clayton, Dubilier & Rice, LLC (private equity investment, 1998-2010), as well as a Director of Sony Corporation (2006-2007). |
Joseph Mauriello (1944) |
Year of Election or Appointment: 2008 Trustee |
| Mr. Mauriello also serves as Trustee of other Fidelity funds. Prior to his retirement in January 2006, Mr. Mauriello served in numerous senior management positions including Deputy Chairman and Chief Operating Officer (2004-2005), and Vice Chairman of Financial Services (2002-2004) of KPMG LLP US (professional services, 1965-2005). Mr. Mauriello currently serves as a member of the Board of Directors of XL Group plc. (global insurance and re-insurance, 2006-present). Previously, Mr. Mauriello served as a Director of the Hamilton Funds of the Bank of New York (2006-2007) and of Arcadia Resources Inc. (health care services and products, 2007-2012). |
Robert W. Selander (1950) |
Year of Election or Appointment: 2011 Trustee |
| Mr. Selander also serves as Trustee of other Fidelity funds. Previously, Mr. Selander served as a Member of the Advisory Board of other Fidelity funds (2011), and Executive Vice Chairman (2010), Chief Executive Officer (2009-2010), and President and Chief Executive Officer (1997-2009) of Mastercard, Inc. |
Cornelia M. Small (1944) |
Year of Election or Appointment: 2005 Trustee |
| Ms. Small also serves as Trustee of other Fidelity funds. Ms. Small is a member of the Board of Directors (2009-present) and Chair of the Investment Committee (2010-present) of the Teagle Foundation. Ms. Small also serves on the Investment Committee of the Berkshire Taconic Community Foundation (2008-present). Previously, Ms. Small served as Chairperson (2002-2008) and a member of the Investment Committee and Chairperson (2008-2012) and a member of the Board of Trustees of Smith College. In addition, Ms. Small served as Chief Investment Officer, Director of Global Equity Investments, and a member of the Board of Directors of Scudder, Stevens & Clark and Scudder Kemper Investments. |
William S. Stavropoulos (1939) |
Year of Election or Appointment: 2002 Trustee Vice Chairman of the Independent Trustees |
| Mr. Stavropoulos also serves as Trustee of other Fidelity funds. Mr. Stavropoulos serves as President and Founder of the Michigan Baseball Foundation, the Great Lakes Loons (2007-present). Mr. Stavropoulos is Chairman Emeritus of the Board of Directors of The Dow Chemical Company, where he previously served in numerous senior management positions, including President, CEO (1995-2000; 2002-2004), Chairman of the Executive Committee (2000-2006), and as a member of the Board of Directors (1990-2006). Currently, Mr. Stavropoulos is Chairman of the Board of Directors of Univar Inc. (global distributor of commodity and specialty chemicals), a Director of Teradata Corporation (data warehousing and technology solutions), and Maersk Inc. (industrial conglomerate), and a member of the Advisory Board for Metalmark Capital LLC (private equity investment, 2005-present). Mr. Stavropoulos is an operating advisor to Clayton, Dubilier & Rice, LLC (private equity investment). In addition, Mr. Stavropoulos is a member of the University of Notre Dame Advisory Council for the College of Science, a Trustee of the Rollin L. Gerstacker Foundation, and a Director of the Naples Philharmonic Center for the Arts. Previously, Mr. Stavropoulos served as a Director of Chemical Financial Corporation (bank holding company, 1993-2012) and Tyco International, Ltd. (multinational manufacturing and services, 2007-2012). |
David M. Thomas (1949) |
Year of Election or Appointment: 2008 Trustee |
| Mr. Thomas also serves as Trustee of other Fidelity funds. Mr. Thomas serves as Non-Executive Chairman of the Board of Directors of Fortune Brands Home and Security (home and security products, 2011-present), and as a member of the Board of Directors of Interpublic Group of Companies, Inc. (marketing communication, 2004-present). Previously, Mr. Thomas served as Executive Chairman (2005-2006) and Chairman and Chief Executive Officer (2000-2005) of IMS Health, Inc. (pharmaceutical and healthcare information solutions), and a Director of Fortune Brands, Inc. (consumer products, 2000-2011). |
+ The information above includes each Trustee's principal occupation during the last five years and other information relating to the experience, attributes, and skills relevant to each Trustee's qualifications to serve as a Trustee, which led to the conclusion that each Trustee should serve as a Trustee for the fund.
Advisory Board Member and Officers:
Correspondence intended for each officer and Peter S. Lynch may be sent to Fidelity Investments, 245 Summer Street, Boston, Massachusetts 02210. Officers appear below in alphabetical order.
Name, Year of Birth; Principal Occupation |
Peter S. Lynch (1944) |
Year of Election or Appointment: 2003 Member of the Advisory Board |
| Mr. Lynch also serves as Member of the Advisory Board of other Fidelity funds. Mr. Lynch is Vice Chairman and a Director of FMR and FMR Co., Inc. In addition, Mr. Lynch serves as a Trustee of Boston College and as the Chairman of the Inner-City Scholarship Fund. Previously, Mr. Lynch served on the Special Olympics International Board of Directors (1997-2006). |
Elizabeth Paige Baumann (1968) |
Year of Election or Appointment: 2012 Anti-Money Laundering (AML) Officer |
| Ms. Baumann also serves as AML Officer of other funds. She is Chief AML Officer of FMR LLC (2012-present) and is an employee of Fidelity Investments. Previously, Ms. Baumann served as Vice President and Deputy Anti-Money Laundering Officer (2007-2012). |
William C. Coffey (1969) |
Year of Election or Appointment: 2009 Assistant Secretary |
| Mr. Coffey also serves as Assistant Secretary of other funds. He is Senior Vice President and Deputy General Counsel of FMR LLC (2010-present), and is an employee of Fidelity Investments. Previously, Mr. Coffey served as Vice President and Associate General Counsel of FMR LLC (2005-2009). |
Jonathan Davis (1968) |
Year of Election or Appointment: 2010 Assistant Treasurer |
| Mr. Davis also serves as Assistant Treasurer of other funds. Mr. Davis is an employee of Fidelity Investments. Previously, Mr. Davis served as Vice President and Associate General Counsel of FMR LLC (2003-2010). |
Adrien E. Deberghes (1967) |
Year of Election or Appointment: 2008 Deputy Treasurer |
| Mr. Deberghes also serves as an officer of other funds. He is an employee of Fidelity Investments (2008-present). Prior to joining Fidelity Investments, Mr. Deberghes was Senior Vice President of Mutual Fund Administration at State Street Corporation (2007-2008), Senior Director of Mutual Fund Administration at Investors Bank & Trust (2005-2007), and Director of Finance for Dunkin' Brands (2000-2005). |
Stephanie J. Dorsey (1969) |
Year of Election or Appointment: 2010 Assistant Treasurer |
| Ms. Dorsey also serves as an officer of other funds. She is an employee of Fidelity Investments (2008-present) and has served in other fund officer roles. Prior to joining Fidelity Investments, Ms. Dorsey served as Treasurer (2004-2008) of the JPMorgan Mutual Funds and Vice President (2004-2008) of JPMorgan Chase Bank. |
Howard J. Galligan III (1966) |
Year of Election or Appointment: 2014 Chief Financial Officer |
| Mr. Galligan also serves as Chief Financial Officer of other funds. Mr. Galligan serves as President of Fidelity Pricing and Cash Management Services (FPCMS) (2014-present) and as a Director of Strategic Advisers, Inc. (2008-present). Previously, Mr. Galligan served as Chief Administrative Officer of Asset Management (2011-2014) and Chief Operating Officer and Senior Vice President of Investment Support for Strategic Advisers, Inc. (2003-2011). |
Scott C. Goebel (1968) |
Year of Election or Appointment: 2008 Secretary and Chief Legal Officer (CLO) |
| Mr. Goebel serves as Secretary and CLO of other funds. Mr. Goebel also serves as Secretary of Fidelity SelectCo, LLC (2013-present), Fidelity Investments Money Management, Inc. (FIMM) (2010-present) and Fidelity Research and Analysis Company (FRAC) (2010-present); General Counsel, Secretary, and Senior Vice President of FMR (2008-present) and FMR Co., Inc. (2008-present); Chief Legal Officer of Fidelity Management & Research (Hong Kong) Limited (2008-present); and Assistant Secretary of Fidelity Management & Research (Japan) Inc. (2008-present) and Fidelity Management & Research (U.K.) Inc. (2008-present). Previously, Mr. Goebel served as Secretary and CLO of other Fidelity funds (2008-2013), Assistant Secretary of FIMM (2008-2010), FRAC (2008-2010), and certain funds (2007-2008); and as Vice President and Secretary of Fidelity Distributors Corporation (FDC) (2005-2007). Mr. Goebel has been employed by FMR LLC or an affiliate since 2001. |
Thomas C. Hense (1964) |
Year of Election or Appointment: 2008/2010 Vice President |
| Mr. Hense also serves as Vice President of other funds (High Income (2008), Small Cap (2008), and Value (2010) funds). Previously, Mr. Hense served as a portfolio manager for Fidelity's Institutional Money Management Group (Pyramis) (2003-2008).] |
Brian B. Hogan (1964) |
Year of Election or Appointment: 2009 Vice President |
| Mr. Hogan also serves as Trustee or Vice President of other funds. Mr. Hogan serves as President of FMR's Equity Division (2009-present). Previously, Mr. Hogan served as Senior Vice President, Equity Research of FMR (2006-2009) and as a portfolio manager. |
Chris Maher (1972) |
Year of Election or Appointment: 2013 Assistant Treasurer |
| Mr. Maher serves as Assistant Treasurer of other funds. Mr. Maher is Vice President of Valuation Oversight and is an employee of Fidelity Investments. Previously, Mr. Maher served as Vice President of Asset Management Compliance (2013), Vice President of FMR's Program Management Group (2010-2013), and Vice President of Valuation Oversight (2008-2010). |
Kenneth B. Robins (1969) |
Year of Election or Appointment: 2008 President and Treasurer |
| Mr. Robins also serves as an officer of other funds. Mr. Robins serves as Executive Vice President of Fidelity Investments Money Management, Inc. (FIMM) (2013-present) and is an employee of Fidelity Investments (2004-present). Previously, Mr. Robins served in other fund officer roles. |
Stephen Sadoski (1971) |
Year of Election or Appointment: 2012 Deputy Treasurer |
| Mr. Sadoski also serves as Deputy Treasurer of other funds. He is an employee of Fidelity Investments (2012-present) and has served in another fund officer role. Prior to joining Fidelity Investments, Mr. Sadoski served as an assistant chief accountant in the Division of Investment Management of the Securities and Exchange Commission (SEC) (2009-2012) and as a senior manager at Deloitte & Touche LLP (1997-2009). |
Stacie M. Smith (1974) |
Year of Election or Appointment: 2013 Deputy Treasurer |
| Ms. Smith also serves as an officer of other funds. She is an employee of Fidelity Investments (2009-present) and has served in other fund officer roles. Prior to joining Fidelity Investments, Ms. Smith served as Senior Audit Manager of Ernst & Young LLP (1996-2009). |
Renee Stagnone (1975) |
Year of Election or Appointment: 2013 Deputy Treasurer |
| Ms. Stagnone also serves as Deputy Treasurer of other funds. Ms. Stagnone is an employee of Fidelity Investments. |
Linda J. Wondrack (1964) |
Year of Election or Appointment: 2014 Chief Compliance Officer |
| Ms. Wondrack also serves as Chief Compliance Officer of other funds. Ms. Wondrack is Executive Vice President and head of the Ethics Office and Asset Management Compliance for Fidelity Investments (2012-present). Ms. Wondrack also serves as Chief Compliance Officer of Fidelity SelectCo, LLC (2014-present); Chief Compliance Officer of Impresa Management LLC (2013-present); and Chief Compliance Officer of FMR Co., Inc., Fidelity Investments Money Management, Inc., Fidelity Management & Research (Japan) Inc., Fidelity Management & Research (U.K.) Inc., Fidelity Management & Research (Hong Kong), Fidelity Management & Research Company, Pyramis Global Advisors, LLC, and Strategic Advisers, Inc., Ballyrock Investment Advisors LLC, and Northern Neck Investors LLC (2012-present). Previously, Ms. Wondrack served as Senior Vice President and Chief Compliance Officer for Columbia Management Investment Advisers, LLC (2005-2012); Chief Compliance Officer for certain funds within the Columbia Family of Funds (2007-2012); and Senior Vice President of Compliance Risk Management at Bank of America (2005-2010). |
Joseph F. Zambello (1957) |
Year of Election or Appointment: 2011 Deputy Treasurer |
| Mr. Zambello also serves as Deputy Treasurer of other funds. Mr. Zambello is an employee of Fidelity Investments. Previously, Mr. Zambello served as Vice President of FMR's Program Management Group (2009-2011) and Vice President of the Transfer Agent Oversight Group (2005-2009). |
Annual Report
The Board of Trustees of Fidelity Small Cap Growth Fund voted to pay to shareholders of record at the opening of business, the following distributions per share derived from capital gains realized from sales of portfolio securities:
| Pay Date | Record Date | Capital Gains |
Class A | 09/15/14 | 09/12/14 | $1.188 |
Class T | 09/15/14 | 09/12/14 | $1.188 |
Class B | 09/15/14 | 09/12/14 | $1.188 |
Class C | 09/15/14 | 09/12/14 | $1.188 |
The fund hereby designates as a capital gain dividend with respect to the taxable year ended July 31, 2014, $155,260,658, or, if subsequently determined to be different, the net capital gain of such year.
Class A, Class T, Class B, and Class C designate 8%, 8%, 9%, and 8% of the dividends distributed during the fiscal year, respectively, as qualifying for the dividends-received deduction for corporate shareholders.
Class A, Class T, Class B, and Class C designate 10%, 11%, 12%, and 11% of the dividends distributed during the fiscal year, respectively, as amounts which may be taken into account as a dividend for purposes of the maximum rate under section 1(h)(11) of the Internal Revenue Code.
The fund will notify shareholders in January 2015 of amounts for use in preparing 2014 income tax returns.
Annual Report
Board Approval of Investment Advisory Contracts and Management Fees
Fidelity Small Cap Growth Fund
Each year, the Board of Trustees, including the Independent Trustees (together, the Board), votes on the renewal of the management contract with Fidelity Management & Research Company (FMR) and the sub-advisory agreements (together, the Advisory Contracts) for the fund. The Board, assisted by the advice of fund counsel and Independent Trustees' counsel, requests and considers a broad range of information relevant to the renewal of the Advisory Contracts throughout the year.
The Board meets regularly and, at each of its meetings, covers an extensive agenda of topics and materials and considers factors that are relevant to its annual consideration of the renewal of the fund's Advisory Contracts, including the services and support provided to the fund and its shareholders. The Board has established various standing committees (Committees), each composed of and chaired by Independent Trustees with varying backgrounds, to which the Board has assigned specific subject matter responsibilities in order to enhance effective decision-making by the Board. The Board, acting directly and through its Committees, requests and receives information concerning the annual consideration of the renewal of the fund's Advisory Contracts. The Board also meets as needed to consider matters specifically related to the Board's annual consideration of the renewal of the Advisory Contracts. Members of the Board may also meet with trustees of other Fidelity funds through ad hoc joint committees to discuss certain matters relevant to the Fidelity funds.
At its July 2014 meeting, the Board, including the Independent Trustees, unanimously determined to renew the fund's Advisory Contracts. In reaching its determination, the Board considered all factors it believed relevant, including (i) the nature, extent, and quality of the services to be provided to the fund and its shareholders (including the investment performance of the fund); (ii) the competitiveness of the fund's management fee and total expense ratio relative to peer funds; (iii) the total costs of the services to be provided by and the profits to be realized by Fidelity from its relationship with the fund; (iv) the extent to which economies of scale exist and would be realized as the fund grows; and (v) whether fee levels reflect these economies of scale, if any, for the benefit of fund shareholders. In connection with separate internal corporate reorganizations involving Fidelity Management & Research (U.K.) Inc. (FMR U.K.) and Fidelity Management & Research (Japan) Inc. (FMR Japan), the Board approved certain non-material amendments to the fund's sub-advisory agreements with FMR U.K. and FMR Japan to reflect that, after these reorganizations, FMR Investment Management (UK) Limited and Fidelity Management & Research (Japan) Limited will carry on the business of FMR U.K. and FMR Japan, respectively. The Board noted that no changes to the portfolio managers or to the foreign research or investment advisory services provided to the fund were expected in connection with either reorganization and that the same personnel and resources would continue to be available to the fund at the new entities.
Annual Report
In considering whether to renew the Advisory Contracts for the fund, the Board reached a determination, with the assistance of fund counsel and Independent Trustees' counsel and through the exercise of its business judgment, that the renewal of the Advisory Contracts was in the best interests of the fund and its shareholders and that the compensation payable under the Advisory Contracts was fair and reasonable. The Board's decision to renew the Advisory Contracts was not based on any single factor, but rather was based on a comprehensive consideration of all the information provided to the Board at its meetings throughout the year. The Board, in reaching its determination to renew the Advisory Contracts, was aware that shareholders of the fund have a broad range of investment choices available to them, including a wide choice among funds offered by Fidelity's competitors, and that the fund's shareholders, who have the opportunity to review and weigh the disclosure provided by the fund in its prospectus and other public disclosures, have chosen to invest in this fund, which is part of the Fidelity family of funds.
Nature, Extent, and Quality of Services Provided. The Board considered Fidelity's staffing as it relates to the fund, including the backgrounds of investment personnel of FMR and the sub-advisers (together, the Investment Advisers), and also considered the fund's investment objective, strategies, and related investment philosophy. The Independent Trustees also had discussions with senior management of Fidelity's investment operations and investment groups. The Board considered the structure of the portfolio manager compensation program and whether this structure provides appropriate incentives to act in the best interests of the fund. Additionally, the Board considered the portfolio managers' investments, if any, in the funds that they manage.
Resources Dedicated to Investment Management and Support Services. The Board and the Fund Oversight and Research Committees reviewed the general qualifications and capabilities of Fidelity's investment staff, including its size, education, experience, and resources, as well as Fidelity's approach to recruiting, training, managing, and compensating investment personnel. The Board noted that Fidelity has continued to increase the resources devoted to non-U.S. offices, including expansion of Fidelity's global investment organization. The Board also noted that Fidelity's analysts have extensive resources, tools and capabilities that allow them to conduct sophisticated quantitative and fundamental analysis, as well as credit analysis of issuers, counterparties and guarantors. Further, the Board believes that Fidelity's investment professionals have sufficient access to global information and data so as to provide competitive investment results over time, and that those professionals also have access to sophisticated tools that permit them to assess portfolio construction and risk and performance attribution characteristics continuously, as well as to transmit new information and research conclusions rapidly around the world. Additionally, in its deliberations, the Board considered Fidelity's trading and risk management capabilities and resources and global compliance infrastructure, which are an integral part of the investment management process.
Annual Report
Board Approval of Investment Advisory Contracts and
Management Fees - continued
Shareholder and Administrative Services. The Board considered (i) the nature, extent, quality, and cost of advisory, administrative, and shareholder services performed by the Investment Advisers and their affiliates under the Advisory Contracts and under separate agreements covering transfer agency, pricing and bookkeeping, and securities lending services for the fund; (ii) the nature and extent of the supervision of third party service providers, principally custodians and subcustodians; and (iii) the resources devoted to, and the record of compliance with, the fund's compliance policies and procedures. The Board also reviewed the allocation of fund brokerage, including allocations to brokers affiliated with the Investment Advisers, the use of brokerage commissions to pay fund expenses, and the use of "soft" commission dollars to pay for research services.
The Board noted that the growth of fund assets over time across the complex allows Fidelity to reinvest in the development of services designed to enhance the value or convenience of the Fidelity funds as investment vehicles. These services include 24-hour access to account information and market information through telephone representatives and over the Internet, investor education materials and asset allocation tools, and the expanded availability of Fidelity Investor Centers.
In 2014, the Board formed an ad hoc Committee on Transfer Agency Fees to review the variety of transfer agency fee structures throughout the industry and Fidelity's competitive positioning with respect to industry participants.
Investment in a Large Fund Family. The Board considered the benefits to shareholders of investing in a Fidelity fund, including the benefits of investing in a fund that is part of a large family of funds offering a variety of investment disciplines and providing a large variety of mutual fund investor services. The Board noted that Fidelity had taken, or had made recommendations that resulted in the Fidelity funds taking, a number of actions over the previous year that benefited particular funds, including (i) continuing to dedicate additional resources to investment research and to the support of the senior management team that oversees asset management; (ii) persisting in efforts to enhance Fidelity's global research capabilities; (iii) launching new funds and making other enhancements to meet client needs for income-oriented solutions; (iv) reducing fund expenses for certain index funds; (v) continuing to launch dedicated lower cost underlying funds to meet portfolio construction needs related to expanding underlying fund options for Fidelity funds of funds, specifically for the Freedom Fund product lines; (vi) rationalizing product lines and gaining increased efficiencies through fund mergers; (vii) launching sector-based exchange-traded funds and establishing a new Fidelity adviser to manage sector-based funds and products; (viii) continuing to develop and implement technology to improve security and increase efficiency; (ix) modifying the eligibility criteria for certain share classes to increase their marketability to a portion of the defined contribution plan market; (x) waiving redemption fees for certain qualified fund-of-fund and wrap programs and certain retirement plan transactions; and (xi) launching new Institutional Class shares of certain money market funds to attract and retain assets and to fill a gap in the money market fund lineup.
Annual Report
Investment Performance. The Board considered whether the fund has operated in accordance with its investment objective, as well as its record of compliance with its investment restrictions and its performance history. The Board noted that there was a portfolio management change for the fund in November 2011.
The Board took into account discussions with the Investment Advisers about fund investment performance that occur at Board meetings throughout the year. In this regard the Board noted that as part of regularly scheduled fund reviews and other reports to the Board on fund performance, the Board periodically considers annualized return information for the fund, for different time periods, measured against a securities market index ("benchmark index") and a peer group of funds with similar objectives ("peer group"). In its evaluation of fund investment performance, the Board gave particular attention to information indicating changes in performance of certain Fidelity funds for specific time periods and the Investment Advisers' explanations for any overperformance or underperformance.
In addition to reviewing absolute and relative fund performance, the Independent Trustees periodically consider the appropriateness of fund performance metrics in evaluating the results achieved. In general, the Independent Trustees believe that fund performance should be evaluated based on net performance (after fees and expenses) of both the highest performing and lowest performing classes, where applicable, compared to appropriate benchmark indices, over appropriate time periods which may include full market cycles, and compared to peer groups, as applicable, over the same periods, taking into account relevant factors including the following: general market conditions; issuer-specific information; tactical opportunities for investment; and fund cash flows and other factors.
The Independent Trustees recognize that shareholders evaluate performance on a net basis over their own holding periods, for which one-, three-, and five-year periods are often used as a proxy. For this reason, the performance information reviewed by the Board also included net cumulative calendar year total return information for the fund and an appropriate benchmark index and peer group for the most recent one-, three-, and five-year periods, as shown below. Returns are shown compared to the 25th percentile (top of box, 75% beaten) and 75th percentile (bottom of box, 25% beaten) of the peer universe.
Annual Report
Board Approval of Investment Advisory Contracts and
Management Fees - continued
Fidelity Small Cap Growth Fund

The Board also considered that the fund's management fee is subject to upward or downward adjustment depending upon whether, and to what extent, the fund's investment performance for the performance period exceeds, or is exceeded by, a securities index, thus leading to a performance adjustment for the same period. The Board noted that the performance adjustment provides FMR with a strong economic incentive to seek to achieve superior performance for the fund's shareholders and helps to more closely align the interests of FMR and the fund's shareholders.
Based on its review, the Board concluded that the nature, extent, and quality of services provided to the fund under the Advisory Contracts should benefit the fund's shareholders.
Competitiveness of Management Fee and Total Expense Ratio. The Board considered the fund's management fee and total expense ratio compared to "mapped groups" of competitive funds and classes. Fidelity creates "mapped groups" by combining similar Lipper investment objective categories that have comparable investment mandates. Combining Lipper investment objective categories aids the Board's management fee and total expense ratio comparisons by broadening the competitive group used for comparison and by reducing the number of universes to which various Fidelity funds are compared.
Management Fee. The Board considered two proprietary management fee comparisons for the 12-month periods shown in the chart below. The group of Lipper funds used by the Board for management fee comparisons is referred to below as the "Total Mapped Group." The Total Mapped Group comparison focuses on a fund's standing in terms of gross management fees before expense reimbursements or caps, and without giving effect to the fund's performance adjustment, relative to the total universe of funds with comparable investment mandates, regardless of whether their management fee structures also are comparable. Funds with comparable investment mandates offer exposure to similar types of securities. Funds with comparable management fee structures have similar management fee contractual arrangements (e.g., flat rate charged for advisory services, all-inclusive fee rate, etc.). "TMG %" represents the percentage of funds in the Total Mapped Group that had management fees that were lower than the fund's. For example, a hypothetical TMG % of 20% would mean that 80% of the funds in the Total Mapped Group had higher, and 20% had lower, management fees than the fund. The fund's actual TMG %s are in the chart below. The "Asset-Size Peer Group" (ASPG) comparison focuses on a fund's standing relative to a subset of non-Fidelity funds within the Total Mapped Group that are similar in size and management fee structure. For example, if a fund is in the first quartile of the ASPG, the fund's management fee ranks in the least expensive or lowest 25% of funds in the ASPG. The ASPG represents at least 15% of the funds in the Total Mapped Group with comparable asset size and management fee structures, subject to a minimum of 50 funds (or all funds in the Total Mapped Group if fewer than 50). Additional information, such as the ASPG quartile in which the fund's management fee rate ranked and the impact of the fund's performance adjustment, is also included in the chart and considered by the Board.
Annual Report
Fidelity Small Cap Growth Fund

The Board noted that the fund's management fee rate ranked below the median of its Total Mapped Group and below the median of its ASPG for 2013. The Board also noted the effect of the fund's negative performance adjustment on the fund's management fee ranking.
Annual Report
Board Approval of Investment Advisory Contracts and
Management Fees - continued
The Board also noted that, in August 2013, the ad hoc Committee on Management Fees was formed to conduct an in-depth review of the management fee rates of Fidelity's active equity mutual funds. The Committee focused on the following areas: (i) standard fee structures; (ii) research consumption and trading evolution; (iii) management fee competitiveness/profitability by category; and (iv) factors that drive institutional pricing.
Based on its review, the Board concluded that the fund's management fee is fair and reasonable in light of the services that the fund receives and the other factors considered.
Total Expense Ratio. In its review of each class's total expense ratio, the Board considered the fund's management fee as well as other fund or class expenses, as applicable, such as transfer agent fees, pricing and bookkeeping fees, fund-paid 12b-1 fees, and custodial, legal, and audit fees. The Board also noted the effects of any waivers and reimbursements on fees and expenses, as well as the impact of the fund's performance adjustment. As part of its review, the Board also considered the current and historical total expense ratios of each class of the fund compared to competitive fund median expenses. Each class of the fund is compared to those funds and classes in the Total Mapped Group (used by the Board for management fee comparisons) that have a similar sales load structure.
The Board noted that the total expense ratio of each of Class A, Class B, Class C, Institutional Class, and the retail class ranked below its competitive median for 2013 and the total expense ratio of Class T ranked above its competitive median for 2013. The Board considered that, in general, various factors can affect total expense ratios. The Board noted that the total expense ratio of Class T was above the competitive median primarily because of higher 12b-1 fees on Class T as compared to most competitor funds. Class T has a higher 12b-1 fee, but a lower front-end sales charge, than traditionally priced front-end sales charge classes. The Board considered that Class T is primarily sold load-waived in the retirement plan market where its 0.50% 12b-1 fee is comparable to competing no-load, higher 12b-1 fee classes designed specifically for retirement plans. The Board noted that the fund offers multiple classes, each of which has a different sales load and 12b-1 fee structure, and that the multiple structures are intended to offer a range of pricing options for the intermediary market. The Board also noted that the total expense ratios of the classes vary primarily by the level of their 12b-1 fees, although differences in transfer agent fees may also cause expenses to vary from class to class.
Fees Charged to Other Fidelity Clients. The Board also considered Fidelity fee structures and other information with respect to clients of Fidelity, such as other funds advised or subadvised by Fidelity, pension plan clients, and other institutional clients. The Board noted the findings of the 2013 ad hoc joint committee (created with the board of other Fidelity funds), which reviewed and compared Fidelity's institutional investment advisory business with its business of providing services to the Fidelity funds, including the differences in services provided, fees charged, and costs incurred, as well as competition in their respective marketplaces.
Annual Report
Based on its review of total expense ratios and fees charged to other Fidelity clients, the Board concluded that the total expense ratio of each class of the fund was reasonable, although Class T was above the median of the universe presented for comparison, in light of the services that the fund and its shareholders receive and the other factors considered.
Costs of the Services and Profitability. The Board considered the revenues earned and the expenses incurred by Fidelity in conducting the business of developing, marketing, distributing, managing, administering and servicing the fund and servicing the fund's shareholders. The Board also considered the level of Fidelity's profits in respect of all the Fidelity funds.
On an annual basis, Fidelity presents to the Board Fidelity's profitability for the fund. Fidelity calculates the profitability for each fund, as well as aggregate profitability for groups of Fidelity funds and all Fidelity funds, using a series of detailed revenue and cost allocation methodologies which originate with the books and records of Fidelity on which Fidelity's audited financial statements are based. The Audit Committee of the Board reviews any significant changes from the prior year's methodologies.
PricewaterhouseCoopers LLP (PwC), independent registered public accounting firm and auditor to Fidelity and certain Fidelity funds, has been engaged annually by the Board as part of the Board's assessment of Fidelity's profitability analysis. PwC's engagement includes the review and assessment of the methodologies used by Fidelity in determining the revenues and expenses attributable to Fidelity's mutual fund business, and completion of agreed-upon procedures in respect of the mathematical accuracy of fund profitability and its conformity to established allocation methodologies. After considering PwC's reports issued under the engagement and information provided by Fidelity, the Board concluded that while other allocation methods may also be reasonable, Fidelity's profitability methodologies are reasonable in all material respects.
The Board also reviewed Fidelity's non-fund businesses and fall-out benefits related to the mutual fund business as well as cases where Fidelity's affiliates may benefit from or be related to the fund's business.
The Board considered the costs of the services provided by and the profits realized by Fidelity in connection with the operation of the fund and was satisfied that the profitability was not excessive in the circumstances.
Economies of Scale. The Board considered whether there have been economies of scale in respect of the management of the Fidelity funds, whether the Fidelity funds (including the fund) have appropriately benefited from any such economies of scale, and whether there is potential for realization of any further economies of scale. The Board considered the extent to which the fund will benefit from economies of scale through increased services to the fund, through waivers or reimbursements, or through fee or expense ratio reductions. The Board also noted that in 2013, it and the boards of other Fidelity funds created an ad hoc committee (the Economies of Scale Committee) to analyze whether Fidelity attains economies of scale in respect of the management and servicing of the Fidelity funds, whether the Fidelity funds have appropriately benefited from such economies of scale, and whether there is potential for realization of any further economies of scale.
Annual Report
Board Approval of Investment Advisory Contracts and
Management Fees - continued
The Board recognized that the fund's management contract incorporates a "group fee" structure, which provides for lower group fee rates as total group assets increase, and for higher group fee rates as total group assets decrease (with "group assets" defined to include fund assets under FMR's management plus sector fund assets previously under FMR's management and currently managed by Fidelity SelectCo, LLC). FMR calculates the group fee rates based on a tiered asset "breakpoint" schedule that varies based on asset class. The Board considered that the group fee is designed to deliver the benefits of economies of scale to fund shareholders when total Fidelity fund assets increase, even if assets of any particular fund are unchanged or have declined, because some portion of Fidelity's costs are attributable to services provided to all Fidelity funds, and all funds benefit if those costs can be allocated among more assets. The Board concluded that, given the group fee structure, fund shareholders will benefit from lower management fees as group assets increase at the fund complex level, regardless of whether Fidelity achieves any such economies of scale.
The Board concluded, taking into account the analysis of the Economies of Scale Committee, that economies of scale, if any, are being appropriately shared between fund shareholders and Fidelity.
Additional Information Requested by the Board. In order to develop fully the factual basis for consideration of the Fidelity funds' Advisory Contracts, the Board requested and received additional information on certain topics, including: (i) fund performance trends and Fidelity's long-term strategies for certain funds; (ii) Fidelity's strategic marketing and product lineup goals; (iii) the methodology with respect to competitive fund data and peer group classifications; (iv) the arrangements with, and performance of, certain sub-advisers on behalf of the Fidelity funds, as well as certain proposed participating affiliate arrangements; (v) the realization of fall-out benefits in certain Fidelity business units; (vi) Fidelity's group fee structures, including the rationale for the individual fee rates of certain categories of funds and the definition of group assets; (vii) trends regarding industry use of performance fee structures and the performance adjustment methodologies applicable to the Fidelity funds; (viii) additional competitive analysis regarding the total expenses for certain classes; (ix) fund profitability methodology, including Fidelity's cost allocation methodology, and the impact of certain factors on fund profitability results; and (x) the process by which Fidelity determines sub-advisory fees for funds it advises.
Annual Report
Based on its evaluation of all of the conclusions noted above, and after considering all factors it believed relevant, the Board ultimately concluded that the advisory fee structures are fair and reasonable, and that the fund's Advisory Contracts should be renewed.
Annual Report
Investment Adviser
Fidelity Management & Research Company
Boston, MA
Investment Sub-Advisers
FMR Co., Inc.
Fidelity Management & Research
(U.K.) Inc.
Fidelity Management & Research
(Hong Kong) Limited
Fidelity Management & Research
(Japan) Inc.
General Distributor
Fidelity Distributors Corporation
Smithfield, RI
Transfer and Service Agents
Fidelity Investments Institutional
Operations Company, Inc.
Boston, MA
Fidelity Service Company, Inc.
Boston, MA
Custodian
Citibank, N.A.
New York, NY
(Fidelity Investment logo)(registered trademark)
ASCP-UANN-0914
1.803713.109
(Fidelity Investment logo)(registered trademark)
Fidelity Advisor®
Small Cap Growth
Fund - Institutional Class
Annual Report
July 31, 2014
(Fidelity Cover Art)
Institutional Class
is a class of Fidelity®
Small Cap Growth
Fund
Contents
Performance | (Click Here) | How the fund has done over time. |
Management's Discussion of Fund Performance | (Click Here) | The Portfolio Manager's review of fund performance and strategy. |
Shareholder Expense Example | (Click Here) | An example of shareholder expenses. |
Investment Changes | (Click Here) | A summary of major shifts in the fund's investments over the past six months. |
Investments | (Click Here) | A complete list of the fund's investments with their market values. |
Financial Statements | (Click Here) | Statements of assets and liabilities, operations, and changes in net assets, as well as financial highlights. |
Notes | (Click Here) | Notes to the financial statements. |
Report of Independent Registered Public Accounting Firm | (Click Here) | |
Trustees and Officers | (Click Here) | |
Distributions | (Click Here) | |
Board Approval of Investment Advisory Contracts and Management Fees | (Click Here) | |
To view a fund's proxy voting guidelines and proxy voting record for the 12-month period ended June 30, visit http://www.fidelity.com/proxyvotingresults or visit the Securities and Exchange Commission's (SEC) web site at http://www.sec.gov. You may also call 1-877-208-0098 to request a free copy of the proxy voting guidelines.
Standard & Poor's, S&P and S&P 500 are registered service marks of The McGraw-Hill Companies, Inc. and have been licensed for use by Fidelity Distributors Corporation.
Other third-party marks appearing herein are the property of their respective owners.
All other marks appearing herein are registered or unregistered trademarks or service marks of FMR LLC or an affiliated company. © 2014 FMR LLC. All rights reserved.
Annual Report
This report and the financial statements contained herein are submitted for the general information of the shareholders of the fund. This report is not authorized for distribution to prospective investors in the fund unless preceded or accompanied by an effective prospectus.
A fund files its complete schedule of portfolio holdings with the SEC for the first and third quarters of each fiscal year on Form N-Q. Forms N-Q are available on the SEC's web site at http://www.sec.gov. A fund's Forms N-Q may be reviewed and copied at the SEC's Public Reference Room in Washington, DC. Information regarding the operation of the SEC's Public Reference Room may be obtained by calling 1-800-SEC-0330. For a complete list of a fund's portfolio holdings, view the most recent holdings listing, semiannual report, or annual report on Fidelity's web site at http://www.fidelity.com, http://www.advisor.fidelity.com, or http://www.401k.com, as applicable.
NOT FDIC INSURED • MAY LOSE VALUE • NO BANK GUARANTEE
Neither the fund nor Fidelity Distributors Corporation is a bank.
Annual Report
Average annual total return reflects the change in the value of an investment, assuming reinvestment of the class' distributions from dividend income and capital gains (the profits earned upon the sale of securities that have grown in value, if any) and assuming a constant rate of performance each year. The $10,000 table and the fund's returns do not reflect the deduction of taxes that a shareholder would pay on fund distributions or the redemption of fund shares. During periods of reimbursement by Fidelity, a fund's total return will be greater than it would be had the reimbursement not occurred. How a fund did yesterday is no guarantee of how it will do tomorrow.
Average Annual Total Returns
Periods ended July 31, 2014 | Past 1
year | Past 5
years | Life of
fund A |
Institutional Class | 8.89% | 17.01% | 10.36% |
A From November 3, 2004.
$10,000 Over Life of Fund
Let's say hypothetically that $10,000 was invested in Fidelity Advisor® Small Cap Growth Fund - Institutional Class on November 3, 2004, when the fund started. The chart shows how the value of your investment would have changed, and also shows how the Russell 2000® Growth Index performed over the same period.
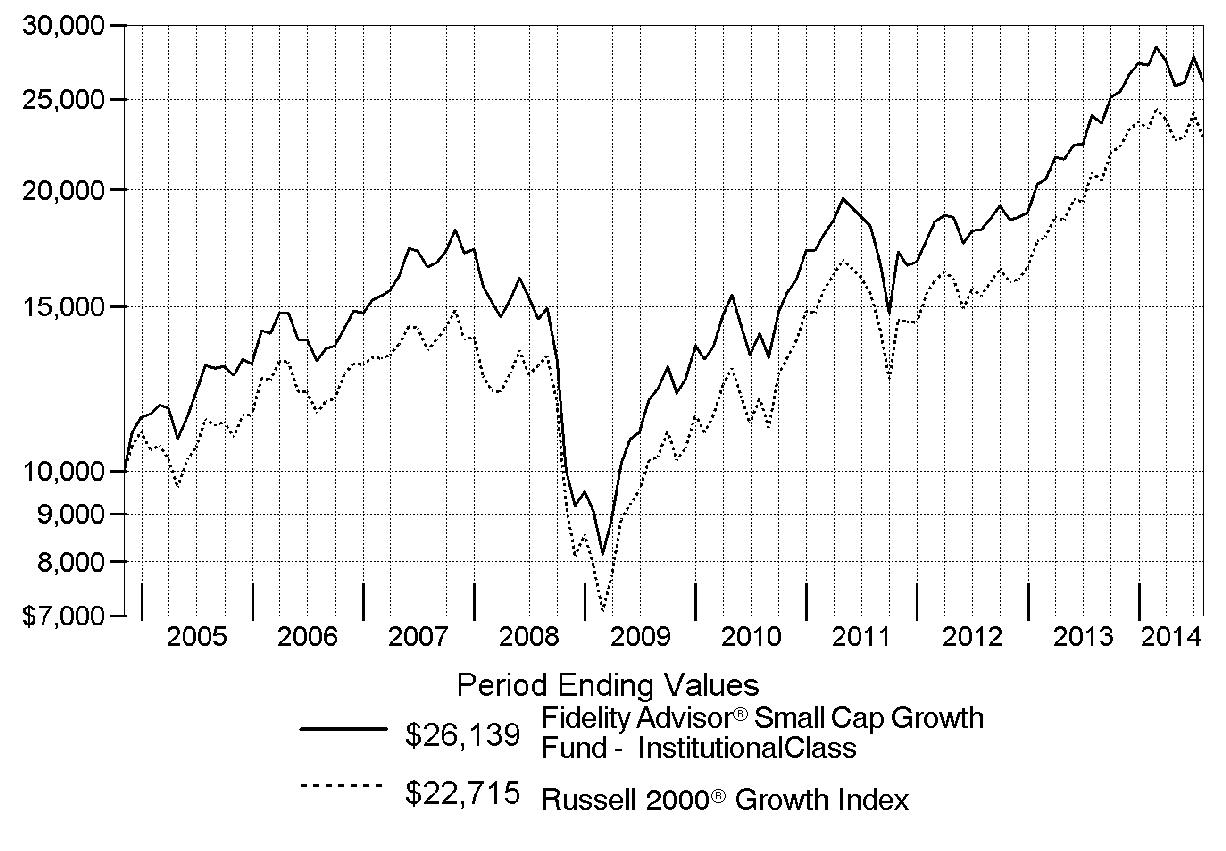
Annual Report
Market Recap: U.S. stocks overcame a slowing economy early in 2014 to post a strong gain for the 12-month period ending July 31, 2014, supported by corporate profits and continued low interest rates. The S&P 500® Index rose 16.94%, reaching an all-time high near period end. The technology-heavy Nasdaq Composite Index® gained 22.00%. The Russell 2000® Index returned 8.56%, reflecting the relatively lackluster performance of small-cap stocks. Information technology (+28%) was the top-performing sector within the S&P 500®, driven by strong semiconductor and computer hardware sales. Materials (+23%) gained amid higher prices for many commodity products. Health care (+21%) rose, driven by gains in pharmaceuticals, biotechnology & life sciences companies. Energy stocks (+19%) advanced in the latter part of the period amid healthy U.S. output and the threat of supply disruptions in Iraq. Conversely, most defensive sectors, including consumer staples, utilities and telecommunication services, lagged the broader market. Volatility remained tame throughout most of the period, with markets supported by declining unemployment, near-record profit margins for companies, muted cost inflation and fairly low corporate debt levels. Geopolitical tension remained a concern at period end, with conflict in Ukraine and strained relations between Russia and the West posing a potential threat to global growth.
Comments from Patrick Venanzi Portfolio Manager of Fidelity Advisor® Small Cap Growth Fund: For the year, the fund's Institutional Class shares rose 8.89%, versus 8.93% for the Russell 2000® Growth Index. Relative to the index, the fund's top individual contributor was bioprocessing firm Repligen, a position I established during the period. Repligen has a terrific competitive position in several consumable products used to manufacture biologics, a class of drugs that I see as well-poised to outgrow the overall pharmaceuticals industry for years to come. Elsewhere, shares of Spirit Airlines rose more than 90% the past year, and our large overweighting helped results. I still like the story behind Spirit, but I nevertheless reduced our position as the stock climbed. Apparel retailer G-III Apparel Group also added value, as the company's shares gained on management's excellent execution in new categories, as well as the extremely cold weather. Conversely, BioScrip, a provider of home infusion services whereby patients can receive intravenous drugs without a visit to the hospital, was our largest individual detractor. The stock stumbled as the firm encountered challenges integrating two recent acquisitions, and I sold our stake. The fund also suffered by underweighting or not owning two stocks in the benchmark that did particularly well, Puma Biotechnology and solar panel manufacturer SunEdison, respectively.
The views expressed above reflect those of the portfolio manager(s) only through the end of the period as stated on the cover of this report and do not necessarily represent the views of Fidelity or any other person in the Fidelity organization. Any such views are subject to change at any time based upon market or other conditions and Fidelity disclaims any responsibility to update such views. These views may not be relied on as investment advice and, because investment decisions for a Fidelity fund are based on numerous factors, may not be relied on as an indication of trading intent on behalf of any Fidelity fund.
Annual Report
Shareholder Expense Example
As a shareholder of the Fund, you incur two types of costs: (1) transaction costs, including sales charges (loads) on purchase payments or redemption proceeds, redemption fees and (2) ongoing costs, including management fees, distribution and/or service (12b-1) fees and other Fund expenses. This Example is intended to help you understand your ongoing costs (in dollars) of investing in the Fund and to compare these costs with the ongoing costs of investing in other mutual funds.
The Example is based on an investment of $1,000 invested at the beginning of the period and held for the entire period (February 1, 2014 to July 31, 2014).
Actual Expenses
The first line of the accompanying table for each class of the Fund provides information about actual account values and actual expenses. You may use the information in this line, together with the amount you invested, to estimate the expenses that you paid over the period. Simply divide your account value by $1,000.00 (for example, an $8,600 account value divided by $1,000.00 = 8.6), then multiply the result by the number in the first line for a class of the Fund under the heading entitled "Expenses Paid During Period" to estimate the expenses you paid on your account during this period. A small balance maintenance fee of $12.00 that is charged once a year may apply for certain accounts with a value of less than $2,000. This fee is not included in the table below. If it was, the estimate of expenses you paid during the period would be higher, and your ending account value lower, by this amount. In addition, the Fund, as a shareholder in the underlying Fidelity Central Funds, will indirectly bear its pro-rata share of the fees and expenses incurred by the underlying Fidelity Central Funds. These fees and expenses are not included in the Fund's annualized expense ratio used to calculate the expense estimate in the table below.
Hypothetical Example for Comparison Purposes
The second line of the accompanying table for each class of the Fund provides information about hypothetical account values and hypothetical expenses based on a Class' actual expense ratio and an assumed rate of return of 5% per year before expenses, which is not the Class' actual return. The hypothetical account values and expenses may not be used to estimate the actual ending account balance or expenses you paid for the period. You may use this information to compare the ongoing costs of investing in the Fund and other funds. To do so, compare this 5% hypothetical example with the 5% hypothetical examples that appear in the shareholder reports of the other funds. A small balance maintenance fee of $12.00 that is charged once a year may apply for certain accounts with a value of less than $2,000. This fee is not included in the table below. If it was, the estimate of expenses you paid during the period would be higher, and your ending account value lower, by this amount. In addition, the Fund, as a shareholder in the underlying Fidelity Central Funds, will indirectly bear its pro-rata share of the fees and expenses incurred by the underlying Fidelity Central Funds. These fees and expenses are not included in the Fund's annualized expense ratio used to calculate the expense estimate in the table below.
Please note that the expenses shown in the table are meant to highlight your ongoing costs only and do not reflect any transaction costs. Therefore, the second line of the table is useful in comparing ongoing costs only, and will not help you determine the relative total costs of owning different funds. In addition, if these transactional costs were included, your costs would have been higher.
Annual Report
| Annualized
Expense Ratio B | Beginning
Account Value
February 1, 2014 | Ending
Account Value
July 31, 2014 | Expenses Paid
During Period*
February 1, 2014
to July 31, 2014 |
Class A | 1.23% | | | |
Actual | | $ 1,000.00 | $ 961.50 | $ 5.98 |
HypotheticalA | | $ 1,000.00 | $ 1,018.70 | $ 6.16 |
Class T | 1.51% | | | |
Actual | | $ 1,000.00 | $ 960.30 | $ 7.34 |
HypotheticalA | | $ 1,000.00 | $ 1,017.31 | $ 7.55 |
Class B | 2.03% | | | |
Actual | | $ 1,000.00 | $ 958.00 | $ 9.86 |
HypotheticalA | | $ 1,000.00 | $ 1,014.73 | $ 10.14 |
Class C | 2.02% | | | |
Actual | | $ 1,000.00 | $ 957.80 | $ 9.81 |
HypotheticalA | | $ 1,000.00 | $ 1,014.78 | $ 10.09 |
Small Cap Growth | .93% | | | |
Actual | | $ 1,000.00 | $ 962.90 | $ 4.53 |
HypotheticalA | | $ 1,000.00 | $ 1,020.18 | $ 4.66 |
Institutional Class | .94% | | | |
Actual | | $ 1,000.00 | $ 963.00 | $ 4.58 |
HypotheticalA | | $ 1,000.00 | $ 1,020.13 | $ 4.71 |
A 5% return per year before expenses
B Annualized expense ratio reflects expenses net of applicable fee waivers.
* Expenses are equal to each Class' annualized expense ratio, multiplied by the average account value over the period, multiplied by 181/365 (to reflect the one-half year period).
Annual Report
Investment Changes (Unaudited)
Top Ten Stocks as of July 31, 2014 |
| % of fund's
net assets | % of fund's net assets
6 months ago |
Team Health Holdings, Inc. | 2.0 | 0.0 |
KAR Auction Services, Inc. | 1.5 | 1.2 |
Hub Group, Inc. Class A | 1.5 | 0.0 |
G-III Apparel Group Ltd. | 1.5 | 1.0 |
Teledyne Technologies, Inc. | 1.4 | 0.8 |
Huron Consulting Group, Inc. | 1.4 | 1.1 |
Graphic Packaging Holding Co. | 1.4 | 0.9 |
Service Corp. International | 1.3 | 1.0 |
PolyOne Corp. | 1.3 | 0.0 |
Global Payments, Inc. | 1.3 | 0.7 |
| 14.6 | |
Top Five Market Sectors as of July 31, 2014 |
| % of fund's
net assets | % of fund's net assets
6 months ago |
Information Technology | 22.7 | 23.9 |
Health Care | 21.8 | 20.2 |
Industrials | 16.0 | 15.9 |
Consumer Discretionary | 13.5 | 13.5 |
Financials | 6.8 | 8.4 |
Asset Allocation (% of fund's net assets) |
As of July 31, 2014* | As of January 31, 2014** |
| Stocks 98.0% | | | Stocks and
Equity Futures 97.4% | |
| Short-Term
Investments and
Net Other Assets
(Liabilities) 2.0% | | | Short-Term
Investments and
Net Other Assets
(Liabilities) 2.6% | |
* Foreign investments | 5.8% | | ** Foreign investments | 5.0% | |

Annual Report
Investments July 31, 2014
Showing Percentage of Net Assets
Common Stocks - 98.0% |
| Shares | | Value |
CONSUMER DISCRETIONARY - 13.5% |
Auto Components - 2.9% |
Standard Motor Products, Inc. | 265,717 | | $ 9,579,098 |
Tenneco, Inc. (a) | 220,300 | | 14,033,110 |
Visteon Corp. (a) | 145,000 | | 13,847,500 |
| | 37,459,708 |
Diversified Consumer Services - 1.3% |
Service Corp. International | 820,300 | | 17,226,300 |
Household Durables - 0.8% |
Universal Electronics, Inc. (a) | 230,114 | | 10,960,330 |
Internet & Catalog Retail - 0.6% |
HomeAway, Inc. (a) | 240,000 | | 8,332,800 |
Leisure Products - 1.7% |
Brunswick Corp. | 252,600 | | 10,187,358 |
Malibu Boats, Inc. Class A (a) | 590,000 | | 11,357,500 |
| | 21,544,858 |
Media - 0.9% |
Cablevision Systems Corp. - NY Group Class A | 200,000 | | 3,844,000 |
Live Nation Entertainment, Inc. (a) | 350,000 | | 8,123,500 |
| | 11,967,500 |
Multiline Retail - 1.6% |
Burlington Stores, Inc. | 170,000 | | 5,564,100 |
Dillard's, Inc. Class A | 100,000 | | 11,922,000 |
Tuesday Morning Corp. (a) | 163,789 | | 2,695,967 |
| | 20,182,067 |
Textiles, Apparel & Luxury Goods - 3.7% |
G-III Apparel Group Ltd. (a) | 245,300 | | 19,052,451 |
Iconix Brand Group, Inc. (a) | 223,800 | | 9,451,074 |
Steven Madden Ltd. (a) | 283,000 | | 9,013,550 |
Vera Bradley, Inc. (a) | 500,000 | | 9,915,000 |
| | 47,432,075 |
TOTAL CONSUMER DISCRETIONARY | | 175,105,638 |
CONSUMER STAPLES - 4.0% |
Food Products - 1.5% |
Darling International, Inc. (a) | 600,000 | | 11,232,000 |
Ingredion, Inc. | 100,000 | | 7,363,000 |
| | 18,595,000 |
Common Stocks - continued |
| Shares | | Value |
CONSUMER STAPLES - continued |
Household Products - 1.2% |
Spectrum Brands Holdings, Inc. | 190,000 | | $ 15,846,000 |
Personal Products - 1.3% |
Inter Parfums, Inc. | 276,185 | | 7,216,714 |
MediFast, Inc. (a) | 350,000 | | 10,048,500 |
| | 17,265,214 |
TOTAL CONSUMER STAPLES | | 51,706,214 |
ENERGY - 4.8% |
Energy Equipment & Services - 1.3% |
Dril-Quip, Inc. (a) | 59,900 | | 6,036,123 |
Xtreme Drilling & Coil Services Corp. (a) | 2,541,700 | | 11,095,971 |
| | 17,132,094 |
Oil, Gas & Consumable Fuels - 3.5% |
Golar LNG Ltd. (d) | 140,000 | | 8,625,400 |
MPLX LP | 161,157 | | 9,145,660 |
Phillips 66 Partners LP | 171,525 | | 10,969,024 |
StealthGas, Inc. (a) | 600,000 | | 6,420,000 |
Valero Energy Partners LP | 210,000 | | 9,760,800 |
| | 44,920,884 |
TOTAL ENERGY | | 62,052,978 |
FINANCIALS - 6.8% |
Banks - 2.5% |
Banner Bank | 110,284 | | 4,437,828 |
Investors Bancorp, Inc. | 1,100,000 | | 11,385,000 |
Lakeland Financial Corp. | 203,700 | | 7,412,643 |
Pacific Premier Bancorp, Inc. (a) | 648,586 | | 9,274,780 |
| | 32,510,251 |
Capital Markets - 1.7% |
E*TRADE Financial Corp. (a) | 310,200 | | 6,520,404 |
FXCM, Inc. Class A (d) | 311,264 | | 4,239,416 |
Lazard Ltd. Class A | 215,000 | | 11,244,500 |
| | 22,004,320 |
Consumer Finance - 0.5% |
Portfolio Recovery Associates, Inc. (a) | 100,000 | | 5,896,000 |
Common Stocks - continued |
| Shares | | Value |
FINANCIALS - continued |
Insurance - 1.2% |
Amerisafe, Inc. | 106,448 | | $ 3,895,997 |
Primerica, Inc. | 264,219 | | 12,175,212 |
| | 16,071,209 |
Thrifts & Mortgage Finance - 0.9% |
Meridian Bancorp, Inc. (a) | 1,101,780 | | 11,965,331 |
TOTAL FINANCIALS | | 88,447,111 |
HEALTH CARE - 21.8% |
Biotechnology - 9.0% |
BioCryst Pharmaceuticals, Inc. (a) | 500,000 | | 6,260,000 |
Celldex Therapeutics, Inc. (a)(d) | 293,400 | | 3,840,606 |
Chimerix, Inc. (a) | 210,100 | | 4,773,472 |
Cubist Pharmaceuticals, Inc. | 41,262 | | 2,512,856 |
Dyax Corp. (a) | 650,000 | | 6,123,000 |
Exact Sciences Corp. (a)(d) | 731,705 | | 11,421,915 |
Genomic Health, Inc. (a)(d) | 225,288 | | 5,740,338 |
Hyperion Therapeutics, Inc. (a) | 121,500 | | 2,766,555 |
Insmed, Inc. (a) | 223,400 | | 3,817,906 |
Intercept Pharmaceuticals, Inc. (a) | 30,600 | | 7,110,216 |
Isis Pharmaceuticals, Inc. (a) | 224,457 | | 6,955,922 |
Lion Biotechnologies, Inc. (a) | 300,000 | | 2,145,000 |
Medivation, Inc. (a) | 64,800 | | 4,810,104 |
Mirati Therapeutics, Inc. (a) | 170,820 | | 3,103,799 |
Novavax, Inc. (a) | 1,218,200 | | 5,274,806 |
Puma Biotechnology, Inc. (a) | 36,600 | | 8,114,952 |
Receptos, Inc. (a) | 81,069 | | 3,357,067 |
Repligen Corp. (a) | 490,000 | | 10,275,300 |
Stemline Therapeutics, Inc. (a) | 104,500 | | 1,338,645 |
Sunesis Pharmaceuticals, Inc. (a)(d) | 550,600 | | 3,622,948 |
Synageva BioPharma Corp. (a)(d) | 109,200 | | 7,470,372 |
Threshold Pharmaceuticals, Inc. (a)(d) | 604,453 | | 2,544,747 |
XOMA Corp. (a) | 800,400 | | 3,105,552 |
| | 116,486,078 |
Health Care Equipment & Supplies - 4.0% |
Accuray, Inc. (a)(d) | 600,000 | | 4,722,000 |
DexCom, Inc. (a) | 100,000 | | 3,768,000 |
Greatbatch, Inc. (a) | 61,615 | | 3,050,559 |
Ldr Holding Corp. | 475,000 | | 10,882,250 |
Novadaq Technologies, Inc. (a) | 576,300 | | 8,840,442 |
Common Stocks - continued |
| Shares | | Value |
HEALTH CARE - continued |
Health Care Equipment & Supplies - continued |
NxStage Medical, Inc. (a) | 300,000 | | $ 4,005,000 |
Quidel Corp. (a)(d) | 113,800 | | 2,716,406 |
Steris Corp. | 281,400 | | 14,317,632 |
| | 52,302,289 |
Health Care Providers & Services - 4.9% |
Accretive Health, Inc. (a) | 1,137,226 | | 9,575,443 |
LifePoint Hospitals, Inc. (a) | 80,000 | | 5,737,600 |
Omnicare, Inc. | 190,000 | | 11,875,000 |
Select Medical Holdings Corp. | 400,000 | | 6,216,000 |
Team Health Holdings, Inc. (a) | 454,400 | | 25,696,318 |
Wellcare Health Plans, Inc. (a) | 65,937 | | 4,113,150 |
| | 63,213,511 |
Health Care Technology - 1.3% |
athenahealth, Inc. (a)(d) | 45,000 | | 5,598,000 |
MedAssets, Inc. (a) | 530,000 | | 11,257,200 |
| | 16,855,200 |
Life Sciences Tools & Services - 2.4% |
Bruker BioSciences Corp. (a) | 323,700 | | 7,357,701 |
Fluidigm Corp. (a) | 246,000 | | 7,042,980 |
ICON PLC (a) | 190,000 | | 9,842,000 |
Techne Corp. | 78,888 | | 7,361,828 |
| | 31,604,509 |
Pharmaceuticals - 0.2% |
Flamel Technologies SA sponsored ADR (a) | 212,002 | | 2,825,987 |
TOTAL HEALTH CARE | | 283,287,574 |
INDUSTRIALS - 16.0% |
Aerospace & Defense - 2.4% |
Esterline Technologies Corp. (a) | 120,000 | | 13,026,000 |
Teledyne Technologies, Inc. (a) | 197,700 | | 18,030,240 |
| | 31,056,240 |
Air Freight & Logistics - 1.6% |
Hub Group, Inc. Class A (a) | 425,000 | | 19,626,500 |
Park-Ohio Holdings Corp. | 21,154 | | 1,255,701 |
| | 20,882,201 |
Airlines - 1.1% |
Spirit Airlines, Inc. (a) | 214,500 | | 14,032,590 |
Common Stocks - continued |
| Shares | | Value |
INDUSTRIALS - continued |
Commercial Services & Supplies - 2.5% |
KAR Auction Services, Inc. | 691,900 | | $ 20,279,589 |
Msa Safety, Inc. | 145,979 | | 7,558,793 |
Multi-Color Corp. | 131,853 | | 5,191,053 |
| | 33,029,435 |
Electrical Equipment - 0.3% |
AZZ, Inc. | 100,000 | | 4,364,000 |
Machinery - 5.5% |
Allison Transmission Holdings, Inc. | 530,000 | | 15,518,400 |
Crane Co. | 160,000 | | 10,977,600 |
ITT Corp. | 213,812 | | 9,828,938 |
Luxfer Holdings PLC sponsored ADR | 413,066 | | 7,852,385 |
Manitowoc Co., Inc. | 260,000 | | 6,905,600 |
NN, Inc. | 36,870 | | 1,069,230 |
Superior Drilling Products, Inc. (e) | 1,294,115 | | 8,049,395 |
Valmont Industries, Inc. | 50,000 | | 7,281,500 |
Woodward, Inc. | 70,216 | | 3,507,991 |
| | 70,991,039 |
Professional Services - 2.3% |
CBIZ, Inc. (a) | 1,469,100 | | 11,987,856 |
Huron Consulting Group, Inc. (a) | 286,700 | | 17,328,148 |
| | 29,316,004 |
Road & Rail - 0.3% |
Marten Transport Ltd. | 159,359 | | 3,225,426 |
TOTAL INDUSTRIALS | | 206,896,935 |
INFORMATION TECHNOLOGY - 22.7% |
Communications Equipment - 0.3% |
Plantronics, Inc. | 100,000 | | 4,697,000 |
Electronic Equipment & Components - 2.3% |
CDW Corp. | 280,000 | | 8,649,200 |
Ingram Micro, Inc. Class A (a) | 480,000 | | 13,776,000 |
Neonode, Inc. (a)(d) | 848,022 | | 2,306,620 |
RealD, Inc. (a) | 442,300 | | 4,675,111 |
| | 29,406,931 |
Internet Software & Services - 4.6% |
comScore, Inc. (a) | 290,641 | | 10,518,298 |
Cvent, Inc. (d) | 387,646 | | 10,586,612 |
Demandware, Inc. (a)(d) | 134,984 | | 8,131,436 |
Common Stocks - continued |
| Shares | | Value |
INFORMATION TECHNOLOGY - continued |
Internet Software & Services - continued |
E2open, Inc. (a)(d) | 657,094 | | $ 10,631,781 |
NIC, Inc. | 358,940 | | 6,055,318 |
Perficient, Inc. (a) | 99,910 | | 1,697,471 |
Stamps.com, Inc. (a) | 383,796 | | 12,139,467 |
| | 59,760,383 |
IT Services - 4.7% |
Computer Sciences Corp. | 180,000 | | 11,230,200 |
EVERTEC, Inc. | 389,400 | | 8,706,984 |
Global Payments, Inc. | 240,500 | | 16,659,435 |
Maximus, Inc. | 206,900 | | 8,557,384 |
Sapient Corp. (a) | 797,200 | | 11,766,672 |
Sykes Enterprises, Inc. (a) | 176,953 | | 3,662,927 |
| | 60,583,602 |
Semiconductors & Semiconductor Equipment - 3.7% |
Integrated Silicon Solution, Inc. | 513,994 | | 7,514,592 |
MKS Instruments, Inc. | 170,000 | | 5,402,600 |
Monolithic Power Systems, Inc. | 269,900 | | 11,130,676 |
PDF Solutions, Inc. (a) | 631,672 | | 12,102,836 |
Tessera Technologies, Inc. | 450,000 | | 11,434,500 |
| | 47,585,204 |
Software - 5.6% |
Aspen Technology, Inc. (a) | 373,100 | | 16,207,464 |
Cadence Design Systems, Inc. (a) | 700,000 | | 11,781,000 |
Evolving Systems, Inc. | 300,000 | | 2,964,000 |
Interactive Intelligence Group, Inc. (a) | 364,733 | | 16,547,936 |
Rovi Corp. (a) | 430,000 | | 10,049,100 |
SS&C Technologies Holdings, Inc. (a) | 243,600 | | 10,550,316 |
Vasco Data Security International, Inc. (a) | 189,366 | | 2,569,697 |
Verint Systems, Inc. (a) | 36,660 | | 1,720,820 |
| | 72,390,333 |
Technology Hardware, Storage & Peripherals - 1.5% |
Electronics for Imaging, Inc. (a) | 375,100 | | 16,530,657 |
Immersion Corp. (a) | 253,470 | | 3,459,866 |
| | 19,990,523 |
TOTAL INFORMATION TECHNOLOGY | | 294,413,976 |
Common Stocks - continued |
| Shares | | Value |
MATERIALS - 6.0% |
Chemicals - 2.7% |
Cabot Corp. | 147,146 | | $ 7,708,979 |
Cytec Industries, Inc. | 100,000 | | 10,085,000 |
PolyOne Corp. | 450,000 | | 17,077,500 |
| | 34,871,479 |
Construction Materials - 0.9% |
Eagle Materials, Inc. | 133,168 | | 12,094,318 |
Containers & Packaging - 2.4% |
Graphic Packaging Holding Co. (a) | 1,443,700 | | 17,324,400 |
Silgan Holdings, Inc. | 265,552 | | 13,070,469 |
| | 30,394,869 |
TOTAL MATERIALS | | 77,360,666 |
TELECOMMUNICATION SERVICES - 1.9% |
Diversified Telecommunication Services - 1.9% |
Cogent Communications Group, Inc. | 400,000 | | 13,884,000 |
inContact, Inc. (a) | 1,300,000 | | 10,387,000 |
| | 24,271,000 |
UTILITIES - 0.5% |
Independent Power and Renewable Electricity Producers - 0.5% |
NextEra Energy Partners LP | 206,500 | | 7,029,260 |
TOTAL COMMON STOCKS (Cost $1,189,621,783) |
1,270,571,352
|
Money Market Funds - 3.9% |
| Shares | | Value |
Fidelity Cash Central Fund, 0.11% (b) | 4,831,978 | | 4,831,978 |
Fidelity Securities Lending Cash Central Fund, 0.11% (b)(c) | 45,930,575 | | 45,930,575 |
TOTAL MONEY MARKET FUNDS (Cost $50,762,553) |
50,762,553
|
TOTAL INVESTMENT PORTFOLIO - 101.9% (Cost $1,240,384,336) | | 1,321,333,905 |
NET OTHER ASSETS (LIABILITIES) - (1.9)% | | (24,235,291) |
NET ASSETS - 100% | $ 1,297,098,614 |
Legend |
(a) Non-income producing |
(b) Affiliated fund that is generally available only to investment companies and other accounts managed by Fidelity Investments. The rate quoted is the annualized seven-day yield of the fund at period end. A complete unaudited listing of the fund's holdings as of its most recent quarter end is available upon request. In addition, each Fidelity Central Fund's financial statements, which are not covered by the Fund's Report of Independent Registered Public Accounting Firm, are available on the SEC's website or upon request. |
(c) Investment made with cash collateral received from securities on loan. |
(d) Security or a portion of the security is on loan at period end. |
(e) Affiliated company |
Affiliated Central Funds |
Information regarding fiscal year to date income earned by the Fund from investments in Fidelity Central Funds is as follows: |
Fund | Income earned |
Fidelity Cash Central Fund | $ 41,667 |
Fidelity Securities Lending Cash Central Fund | 1,724,148 |
Total | $ 1,765,815 |
Other Affiliated Issuers |
An affiliated company is a company in which the Fund has ownership of at least 5% of the voting securities. Fiscal year to date transactions with companies which are or were affiliates are as follows: |
Affiliate | Value,
beginning of
period | Purchases | Sales
Proceeds | Dividend
Income | Value,
end of
period |
Parametric Sound Corp. | $ 11,382,447 | $ - | $ 9,334,036* | $ - | $ - |
Superior Drilling Products, Inc. | - | 5,573,300 | - | - | 8,049,395 |
Xtreme Drilling & Coil Services Corp. | 14,769,740 | 7,453,947 | 13,187,684* | - | - |
Zedi, Inc. | 4,053,675 | - | 4,333,432 | - | - |
Total | $ 30,205,862 | $ 13,027,247 | $ 26,855,152 | $ - | $ 8,049,395 |
* Includes the value of securities delivered through in-kind transactions.
See accompanying notes which are an integral part of the financial statements.
Annual Report
Other Information |
All investments are categorized as Level 1 under the Fair Value Hierarchy. The inputs or methodology used for valuing securities may not be an indication of the risk associated with investing in those securities. For more information on valuation inputs, please refer to the Investment Valuation section in the accompanying Notes to Financial Statements. |
See accompanying notes which are an integral part of the financial statements.
Annual Report
Statement of Assets and Liabilities
| July 31, 2014 |
| | |
Assets | | |
Investment in securities, at value (including securities loaned of $43,224,490) - See accompanying schedule: Unaffiliated issuers (cost $1,184,048,483) | $ 1,262,521,957 | |
Fidelity Central Funds (cost $50,762,553) | 50,762,553 | |
Other affiliated issuers (cost $5,573,300) | 8,049,395 | |
Total Investments (cost $1,240,384,336) | | $ 1,321,333,905 |
Cash | | 1,077,543 |
Receivable for investments sold | | 70,156,652 |
Receivable for fund shares sold | | 1,080,689 |
Dividends receivable | | 432,657 |
Distributions receivable from Fidelity Central Funds | | 147,646 |
Receivable from investment adviser for expense reductions | | 744 |
Other receivables | | 26,021 |
Total assets | | 1,394,255,857 |
| | |
Liabilities | | |
Payable for investments purchased | $ 46,312,173 | |
Payable for fund shares redeemed | 3,819,361 | |
Accrued management fee | 678,266 | |
Distribution and service plan fees payable | 77,290 | |
Other affiliated payables | 277,336 | |
Other payables and accrued expenses | 62,242 | |
Collateral on securities loaned, at value | 45,930,575 | |
Total liabilities | | 97,157,243 |
| | |
Net Assets | | $ 1,297,098,614 |
Net Assets consist of: | | |
Paid in capital | | $ 1,141,004,177 |
Accumulated net investment loss | | (4,082,221) |
Accumulated undistributed net realized gain (loss) on investments and foreign currency transactions | | 79,230,791 |
Net unrealized appreciation (depreciation) on investments and assets and liabilities in foreign currencies | | 80,945,867 |
Net Assets | | $ 1,297,098,614 |
See accompanying notes which are an integral part of the financial statements.
Annual Report
Financial Statements - continued
Statement of Assets and Liabilities - continued
| July 31, 2014 |
| | |
Calculation of Maximum Offering Price Class A:
Net Asset Value and redemption price per share ($88,821,558 ÷ 4,937,588 shares) | | $ 17.99 |
| | |
Maximum offering price per share (100/94.25 of $17.99) | | $ 19.09 |
Class T:
Net Asset Value and redemption price per share ($42,586,335 ÷ 2,411,859 shares) | | $ 17.66 |
| | |
Maximum offering price per share (100/96.50 of $17.66) | | $ 18.30 |
Class B:
Net Asset Value and offering price per share ($2,763,621 ÷ 163,933 shares)A | | $ 16.86 |
| | |
Class C:
Net Asset Value and offering price per share ($42,215,155 ÷ 2,515,912 shares)A | | $ 16.78 |
| | |
Small Cap Growth:
Net Asset Value, offering price and redemption price per share ($1,069,105,078 ÷ 57,935,831 shares) | | $ 18.45 |
| | |
Institutional Class:
Net Asset Value, offering price and redemption price per share ($51,606,867 ÷ 2,791,390 shares) | | $ 18.49 |
A Redemption price per share is equal to net asset value less any applicable contingent deferred sales charge.
See accompanying notes which are an integral part of the financial statements.
Annual Report
Statement of Operations
| Year ended July 31, 2014 |
| | |
Investment Income | | |
Dividends | | $ 7,894,062 |
Interest | | 288 |
Income from Fidelity Central Funds (including $1,724,148 from security lending) | | 1,765,815 |
Total income | | 9,660,165 |
| | |
Expenses | | |
Management fee
Basic fee | $ 11,347,434 | |
Performance adjustment | (699,324) | |
Transfer agent fees | 2,882,872 | |
Distribution and service plan fees | 874,291 | |
Accounting and security lending fees | 519,891 | |
Custodian fees and expenses | 71,344 | |
Independent trustees' compensation | 7,051 | |
Registration fees | 192,913 | |
Audit | 59,462 | |
Legal | 6,624 | |
Interest | 819 | |
Miscellaneous | 17,559 | |
Total expenses before reductions | 15,280,936 | |
Expense reductions | (80,901) | 15,200,035 |
Net investment income (loss) | | (5,539,870) |
Realized and Unrealized Gain (Loss) Net realized gain (loss) on: | | |
Investment securities: | | |
Unaffiliated issuers | 228,023,968 | |
Redemption in-kind with affiliated entities (including
gain from other affiliated issuers of $4,613,051) | 304,585,595 | |
Other affiliated issuers | (398,906) | |
Foreign currency transactions | (13,148) | |
Futures contracts | (2,221,706) | |
Total net realized gain (loss) | | 529,975,803 |
Change in net unrealized appreciation (depreciation) on: Investment securities | (344,219,875) | |
Assets and liabilities in foreign currencies | 691 | |
Total change in net unrealized appreciation (depreciation) | | (344,219,184) |
Net gain (loss) | | 185,756,619 |
Net increase (decrease) in net assets resulting from operations | | $ 180,216,749 |
See accompanying notes which are an integral part of the financial statements.
Annual Report
Financial Statements - continued
Statement of Changes in Net Assets
| Year ended
July 31,
2014 | Year ended
July 31,
2013 |
Increase (Decrease) in Net Assets | | |
Operations | | |
Net investment income (loss) | $ (5,539,870) | $ 2,185,197 |
Net realized gain (loss) | 529,975,803 | 327,291,382 |
Change in net unrealized appreciation (depreciation) | (344,219,184) | 244,679,550 |
Net increase (decrease) in net assets resulting
from operations | 180,216,749 | 574,156,129 |
Distributions to shareholders from net realized gain | (306,246,236) | (122,560,447) |
Share transactions - net increase (decrease) | (817,676,738) | (58,479,174) |
Redemption fees | 398,744 | 117,383 |
Total increase (decrease) in net assets | (943,307,481) | 393,233,891 |
| | |
Net Assets | | |
Beginning of period | 2,240,406,095 | 1,847,172,204 |
End of period (including accumulated net investment loss of $4,082,221 and accumulated net investment loss of $0, respectively) | $ 1,297,098,614 | $ 2,240,406,095 |
See accompanying notes which are an integral part of the financial statements.
Annual Report
Financial Highlights - Class A
Years ended July 31, | 2014 | 2013 | 2012 | 2011 | 2010 |
Selected Per-Share Data | | | | | |
Net asset value, beginning of period | $ 19.66 | $ 15.87 | $ 16.42 | $ 12.66 | $ 10.79 |
Income from Investment Operations | | | | | |
Net investment income (loss) C | (.12) | (.04) | (.07) F | (.07) G | (.07) H |
Net realized and unrealized gain (loss) | 1.69 | 4.87 | (.16) | 3.84 | 1.94 |
Total from investment operations | 1.57 | 4.83 | (.23) | 3.77 | 1.87 |
Distributions from net realized gain | (3.24) | (1.04) | (.32) | (.01) L | - |
Redemption fees added to paid in capital C, J | - | - | - | - | - |
Net asset value, end of period | $ 17.99 | $ 19.66 | $ 15.87 | $ 16.42 | $ 12.66 |
Total ReturnA, B | 8.58% | 32.20% | (1.14)% | 29.78% | 17.33% |
Ratios to Average Net Assets D, I | | | | | |
Expenses before reductions | 1.22% | 1.24% | 1.35% | 1.25% | 1.35% |
Expenses net of fee waivers, if any | 1.22% | 1.24% | 1.35% | 1.25% | 1.35% |
Expenses net of all reductions | 1.22% | 1.22% | 1.34% | 1.23% | 1.34% |
Net investment income (loss) | (.62)% | (.26)% | (.49)% F | (.47)% G | (.56)% H |
Supplemental Data | | | | | |
Net assets, end of period (000 omitted) | $ 88,822 | $ 74,978 | $ 59,684 | $ 67,272 | $ 50,620 |
Portfolio turnover rate E | 148% K | 142% | 150% | 106% | 105% |
A Total returns would have been lower if certain expenses had not been reduced during the applicable periods shown.
B Total returns do not include the effect of the sales charges.
C Calculated based on average shares outstanding during the period.
D Fees and expenses of any underlying Fidelity Central Funds are not included in the Fund's expense ratio. The Fund indirectly bears its proportionate share of the expenses of any underlying Fidelity Central Funds.
E Amount does not include the portfolio activity of any underlying Fidelity Central Funds.
F Investment income per share reflects a large, non-recurring dividend which amounted to $.01 per share. Excluding this non-recurring dividend, the ratio of net investment income (loss) to average net assets would have been (.57)%.
G Investment income per share reflects a large, non-recurring dividend which amounted to $.02 per share. Excluding this non-recurring dividend, the ratio of net investment income (loss) to average net assets would have been (.61)%.
H Investment income per share reflects a large, non-recurring dividend which amounted to $.01 per share. Excluding this non-recurring dividend, the ratio of net investment income (loss) to average net assets would have been (.67)%.
I Expense ratios reflect operating expenses of the class. Expenses before reductions do not reflect amounts reimbursed by the investment adviser or reductions from brokerage service arrangements or reductions from other expense offset arrangements and do not represent the amount paid by the class during periods when reimbursements or reductions occur. Expenses net of fee waivers reflect expenses after reimbursement by the investment adviser but prior to reductions from brokerage service arrangements or other expense offset arrangements. Expenses net of all reductions represent the net expenses paid by the class.
J Amount represents less than $.01 per share.
K Portfolio turnover rate excludes securities received or delivered in-kind.
L The amounts shown reflect certain reclassifications related to book to tax differences that were made in the year shown.
See accompanying notes which are an integral part of the financial statements.
Annual Report
Financial Highlights - Class T
Years ended July 31, | 2014 | 2013 | 2012 | 2011 | 2010 |
Selected Per-Share Data | | | | | |
Net asset value, beginning of period | $ 19.38 | $ 15.68 | $ 16.27 | $ 12.57 | $ 10.74 |
Income from Investment Operations | | | | | |
Net investment income (loss) C | (.16) | (.09) | (.11) F | (.11) G | (.10) H |
Net realized and unrealized gain (loss) | 1.66 | 4.82 | (.16) | 3.81 | 1.93 |
Total from investment operations | 1.50 | 4.73 | (.27) | 3.70 | 1.83 |
Distributions from net realized gain | (3.22) | (1.03) | (.32) | - | - |
Redemption fees added to paid in capital C, J | - | - | - | - | - |
Net asset value, end of period | $ 17.66 | $ 19.38 | $ 15.68 | $ 16.27 | $ 12.57 |
Total ReturnA, B | 8.30% | 31.87% | (1.41)% | 29.44% | 17.04% |
Ratios to Average Net Assets D, I | | | | | |
Expenses before reductions | 1.50% | 1.49% | 1.61% | 1.50% | 1.61% |
Expenses net of fee waivers, if any | 1.50% | 1.49% | 1.61% | 1.50% | 1.61% |
Expenses net of all reductions | 1.49% | 1.48% | 1.60% | 1.49% | 1.60% |
Net investment income (loss) | (.90)% | (.52)% | (.74)% F | (.73)% G | (.82)% H |
Supplemental Data | | | | | |
Net assets, end of period (000 omitted) | $ 42,586 | $ 34,686 | $ 27,658 | $ 30,764 | $ 23,930 |
Portfolio turnover rate E | 148% K | 142% | 150% | 106% | 105% |
A Total returns would have been lower if certain expenses had not been reduced during the applicable periods shown.
B Total returns do not include the effect of the sales charges.
C Calculated based on average shares outstanding during the period.
D Fees and expenses of any underlying Fidelity Central Funds are not included in the Fund's expense ratio. The Fund indirectly bears its proportionate share of the expenses of any underlying Fidelity Central Funds.
E Amount does not include the portfolio activity of any underlying Fidelity Central Funds.
F Investment income per share reflects a large, non-recurring dividend which amounted to $.01 per share. Excluding this non-recurring dividend, the ratio of net investment income (loss) to average net assets would have been (.83)%.
G Investment income per share reflects a large, non-recurring dividend which amounted to $.02 per share. Excluding this non-recurring dividend, the ratio of net investment income (loss) to average net assets would have been (.86)%.
H Investment income per share reflects a large, non-recurring dividend which amounted to $.01 per share. Excluding this non-recurring dividend, the ratio of net investment income (loss) to average net assets would have been (.93)%.
I Expense ratios reflect operating expenses of the class. Expenses before reductions do not reflect amounts reimbursed by the investment adviser or reductions from brokerage service arrangements or reductions from other expense offset arrangements and do not represent the amount paid by the class during periods when reimbursements or reductions occur. Expenses net of fee waivers reflect expenses after reimbursement by the investment adviser but prior to reductions from brokerage service arrangements or other expense offset arrangements. Expenses net of all reductions represent the net expenses paid by the class.
J Amount represents less than $.01 per share.
K Portfolio turnover rate excludes securities received or delivered in-kind.
See accompanying notes which are an integral part of the financial statements.
Annual Report
Financial Highlights - Class B
Years ended July 31, | 2014 | 2013 | 2012 | 2011 | 2010 |
Selected Per-Share Data | | | | | |
Net asset value, beginning of period | $ 18.65 | $ 15.19 | $ 15.86 | $ 12.30 | $ 10.57 |
Income from Investment Operations | | | | | |
Net investment income (loss) C | (.25) | (.16) | (.18) F | (.18) G | (.16) H |
Net realized and unrealized gain (loss) | 1.60 | 4.64 | (.17) | 3.74 | 1.89 |
Total from investment operations | 1.35 | 4.48 | (.35) | 3.56 | 1.73 |
Distributions from net realized gain | (3.14) | (1.02) | (.32) | - | - |
Redemption fees added to paid in capital C, J | - | - | - | - | - |
Net asset value, end of period | $ 16.86 | $ 18.65 | $ 15.19 | $ 15.86 | $ 12.30 |
Total ReturnA, B | 7.73% | 31.25% | (1.96)% | 28.94% | 16.37% |
Ratios to Average Net Assets D, I | | | | | |
Expenses before reductions | 2.01% | 1.99% | 2.10% | 2.00% | 2.11% |
Expenses net of fee waivers, if any | 2.01% | 1.99% | 2.10% | 2.00% | 2.11% |
Expenses net of all reductions | 2.01% | 1.97% | 2.09% | 1.98% | 2.09% |
Net investment income (loss) | (1.41)% | (1.01)% | (1.23)% F | (1.22)% G | (1.32)% H |
Supplemental Data | | | | | |
Net assets, end of period (000 omitted) | $ 2,764 | $ 3,486 | $ 4,123 | $ 5,295 | $ 5,142 |
Portfolio turnover rate E | 148% K | 142% | 150% | 106% | 105% |
A Total returns would have been lower if certain expenses had not been reduced during the applicable periods shown.
B Total returns do not include the effect of the contingent deferred sales charge.
C Calculated based on average shares outstanding during the period.
D Fees and expenses of any underlying Fidelity Central Funds are not included in the Fund's expense ratio. The Fund indirectly bears its proportionate share of the expenses of any underlying Fidelity Central Funds.
E Amount does not include the portfolio activity of any underlying Fidelity Central Funds.
F Investment income per share reflects a large, non-recurring dividend which amounted to $.01 per share. Excluding this non-recurring dividend, the ratio of net investment income (loss) to average net assets would have been (1.32)%.
G Investment income per share reflects a large, non-recurring dividend which amounted to $.02 per share. Excluding this non-recurring dividend, the ratio of net investment income (loss) to average net assets would have been (1.36)%.
H Investment income per share reflects a large, non-recurring dividend which amounted to $.01 per share. Excluding this non-recurring dividend, the ratio of net investment income (loss) to average net assets would have been (1.42)%.
I Expense ratios reflect operating expenses of the class. Expenses before reductions do not reflect amounts reimbursed by the investment adviser or reductions from brokerage service arrangements or reductions from other expense offset arrangements and do not represent the amount paid by the class during periods when reimbursements or reductions occur. Expenses net of fee waivers reflect expenses after reimbursement by the investment adviser but prior to reductions from brokerage service arrangements or other expense offset arrangements. Expenses net of all reductions represent the net expenses paid by the class.
J Amount represents less than $.01 per share.
K Portfolio turnover rate excludes securities received or delivered in-kind.
See accompanying notes which are an integral part of the financial statements.
Annual Report
Financial Highlights - Class C
Years ended July 31, | 2014 | 2013 | 2012 | 2011 | 2010 |
Selected Per-Share Data | | | | | |
Net asset value, beginning of period | $ 18.62 | $ 15.16 | $ 15.83 | $ 12.28 | $ 10.55 |
Income from Investment Operations | | | | | |
Net investment income (loss) C | (.25) | (.16) | (.18) F | (.18) G | (.16) H |
Net realized and unrealized gain (loss) | 1.59 | 4.64 | (.17) | 3.73 | 1.89 |
Total from investment operations | 1.34 | 4.48 | (.35) | 3.55 | 1.73 |
Distributions from net realized gain | (3.18) | (1.02) | (.32) | - | - |
Redemption fees added to paid in capital C, J | - | - | - | - | - |
Net asset value, end of period | $ 16.78 | $ 18.62 | $ 15.16 | $ 15.83 | $ 12.28 |
Total ReturnA, B | 7.70% | 31.32% | (1.96)% | 28.91% | 16.40% |
Ratios to Average Net Assets D, I | | | | | |
Expenses before reductions | 2.01% | 1.99% | 2.10% | 2.00% | 2.11% |
Expenses net of fee waivers, if any | 2.00% | 1.99% | 2.10% | 2.00% | 2.11% |
Expenses net of all reductions | 2.00% | 1.97% | 2.09% | 1.98% | 2.09% |
Net investment income (loss) | (1.41)% | (1.01)% | (1.24)% F | (1.22)% G | (1.32)% H |
Supplemental Data | | | | | |
Net assets, end of period (000 omitted) | $ 42,215 | $ 32,756 | $ 24,683 | $ 24,914 | $ 18,091 |
Portfolio turnover rate E | 148% K | 142% | 150% | 106% | 105% |
A Total returns would have been lower if certain expenses had not been reduced during the applicable periods shown.
B Total returns do not include the effect of the contingent deferred sales charge.
C Calculated based on average shares outstanding during the period.
D Fees and expenses of any underlying Fidelity Central Funds are not included in the Fund's expense ratio. The Fund indirectly bears its proportionate share of the expenses of any underlying Fidelity Central Funds.
E Amount does not include the portfolio activity of any underlying Fidelity Central Funds.
F Investment income per share reflects a large, non-recurring dividend which amounted to $.01 per share. Excluding this non-recurring dividend, the ratio of net investment income (loss) to average net assets would have been (1.32)%.
G Investment income per share reflects a large, non-recurring dividend which amounted to $.02 per share. Excluding this non-recurring dividend, the ratio of net investment income (loss) to average net assets would have been (1.36)%.
H Investment income per share reflects a large, non-recurring dividend which amounted to $.01 per share. Excluding this non-recurring dividend, the ratio of net investment income (loss) to average net assets would have been (1.42)%.
I Expense ratios reflect operating expenses of the class. Expenses before reductions do not reflect amounts reimbursed by the investment adviser or reductions from brokerage service arrangements or reductions from other expense offset arrangements and do not represent the amount paid by the class during periods when reimbursements or reductions occur. Expenses net of fee waivers reflect expenses after reimbursement by the investment adviser but prior to reductions from brokerage service arrangements or other expense offset arrangements. Expenses net of all reductions represent the net expenses paid by the class.
J Amount represents less than $.01 per share.
K Portfolio turnover rate excludes securities received or delivered in-kind.
See accompanying notes which are an integral part of the financial statements.
Annual Report
Financial Highlights - Small Cap Growth
Years ended July 31, | 2014 | 2013 | 2012 | 2011 | 2010 |
Selected Per-Share Data | | | | | |
Net asset value, beginning of period | $ 20.07 | $ 16.14 | $ 16.65 | $ 12.81 | $ 10.89 |
Income from Investment Operations | | | | | |
Net investment income (loss) B | (.06) | .01 | (.03) E | (.03) F | (.04) G |
Net realized and unrealized gain (loss) | 1.71 | 4.98 | (.16) | 3.90 | 1.96 |
Total from investment operations | 1.65 | 4.99 | (.19) | 3.87 | 1.92 |
Distributions from net realized gain | (3.27) | (1.06) | (.32) | (.03) K | - |
Redemption fees added to paid in capital B, I | - | - | - | - | - |
Net asset value, end of period | $ 18.45 | $ 20.07 | $ 16.14 | $ 16.65 | $ 12.81 |
Total ReturnA | 8.87% | 32.74% | (.88)% | 30.20% | 17.63% |
Ratios to Average Net Assets C, H | | | | |
Expenses before reductions | .91% | .90% | 1.03% | .95% | 1.08% |
Expenses net of fee waivers, if any | .90% | .90% | 1.03% | .95% | 1.08% |
Expenses net of all reductions | .90% | .88% | 1.02% | .93% | 1.07% |
Net investment income (loss) | (.31)% | .08% | (.16)% E | (.17)% F | (.29)% G |
Supplemental Data | | | | | |
Net assets, end of period (000 omitted) | $ 1,069,105 | $ 1,315,659 | $ 1,166,101 | $ 1,382,688 | $ 1,204,818 |
Portfolio turnover rate D | 148% J | 142% | 150% | 106% | 105% |
A Total returns would have been lower if certain expenses had not been reduced during the applicable periods shown.
B Calculated based on average shares outstanding during the period.
C Fees and expenses of any underlying Fidelity Central Funds are not included in the Fund's expense ratio. The Fund indirectly bears its proportionate share of the expenses of any underlying Fidelity Central Funds.
D Amount does not include the portfolio activity of any underlying Fidelity Central Funds.
E Investment income per share reflects a large, non-recurring dividend which amounted to $.01 per share. Excluding this non-recurring dividend, the ratio of net investment income (loss) to average net assets would have been (.25)%.
F Investment income per share reflects a large, non-recurring dividend which amounted to $.02 per share. Excluding this non-recurring dividend, the ratio of net investment income (loss) to average net assets would have been (.31)%.
G Investment income per share reflects a large, non-recurring dividend which amounted to $.01 per share. Excluding this non-recurring dividend, the ratio of net investment income (loss) to average net assets would have been (.39)%.
H Expense ratios reflect operating expenses of the class. Expenses before reductions do not reflect amounts reimbursed by the investment adviser or reductions from brokerage service arrangements or reductions from other expense offset arrangements and do not represent the amount paid by the class during periods when reimbursements or reductions occur. Expenses net of fee waivers reflect expenses after reimbursement by the investment adviser but prior to reductions from brokerage service arrangements or other expense offset arrangements. Expenses net of all reductions represent the net expenses paid by the class.
I Amount represents less than $.01 per share.
J Portfolio turnover rate excludes securities received or delivered in-kind.
K The amounts shown reflect certain reclassifications related to book to tax differences that were made in the year shown.
See accompanying notes which are an integral part of the financial statements.
Annual Report
Financial Highlights - Institutional Class
Years ended July 31, | 2014 | 2013 | 2012 | 2011 | 2010 |
Selected Per-Share Data | | | | | |
Net asset value, beginning of period | $ 20.10 | $ 16.17 | $ 16.68 | $ 12.83 | $ 10.91 |
Income from Investment Operations | | | | | |
Net investment income (loss) B | (.06) | .01 | (.03) E | (.03) F | (.03) G |
Net realized and unrealized gain (loss) | 1.72 | 4.98 | (.16) | 3.91 | 1.95 |
Total from investment operations | 1.66 | 4.99 | (.19) | 3.88 | 1.92 |
Distributions from net realized gain | (3.27) | (1.06) | (.32) | (.03) K | - |
Redemption fees added to paid in capital B, I | - | - | - | - | - |
Net asset value, end of period | $ 18.49 | $ 20.10 | $ 16.17 | $ 16.68 | $ 12.83 |
Total ReturnA | 8.89% | 32.65% | (.88)% | 30.24% | 17.60% |
Ratios to Average Net Assets C, H | | | | | |
Expenses before reductions | .92% | .92% | 1.06% | .94% | 1.03% |
Expenses net of fee waivers, if any | .92% | .92% | 1.06% | .94% | 1.03% |
Expenses net of all reductions | .92% | .91% | 1.05% | .93% | 1.02% |
Net investment income (loss) | (.32)% | .06% | (.19)% E | (.17)% F | (.24)% G |
Supplemental Data | | | | | |
Net assets, end of period (000 omitted) | $ 51,607 | $ 51,158 | $ 36,694 | $ 41,440 | $ 25,650 |
Portfolio turnover rateD | 148% J | 142% | 150% | 106% | 105% |
A Total returns would have been lower if certain expenses had not been reduced during the applicable periods shown.
B Calculated based on average shares outstanding during the period.
C Fees and expenses of any underlying Fidelity Central Funds are not included in the Fund's expense ratio. The Fund indirectly bears its proportionate share of the expenses of any underlying Fidelity Central Funds.
D Amount does not include the portfolio activity of any underlying Fidelity Central Funds.
E Investment income per share reflects a large, non-recurring dividend which amounted to $.01 per share. Excluding this non-recurring dividend, the ratio of net investment income (loss) to average net assets would have been (.28)%.
F Investment income per share reflects a large, non-recurring dividend which amounted to $.02 per share. Excluding this non-recurring dividend, the ratio of net investment income (loss) to average net assets would have been (.30)%.
G Investment income per share reflects a large, non-recurring dividend which amounted to $.01 per share. Excluding this non-recurring dividend, the ratio of net investment income (loss) to average net assets would have been (.34)%.
H Expense ratios reflect operating expenses of the class. Expenses before reductions do not reflect amounts reimbursed by the investment adviser or reductions from brokerage service arrangements or reductions from other expense offset arrangements and do not represent the amount paid by the class during periods when reimbursements or reductions occur. Expenses net of fee waivers reflect expenses after reimbursement by the investment adviser but prior to reductions from brokerage service arrangements or other expense offset arrangements. Expenses net of all reductions represent the net expenses paid by the class.
I Amount represents less than $.01 per share.
J Portfolio turnover rate excludes securities received or delivered in-kind.
K The amounts shown reflect certain reclassifications related to book to tax differences that were made in the year shown.
See accompanying notes which are an integral part of the financial statements.
Annual Report
Notes to Financial Statements
For the period ended July 31, 2014
1. Organization.
Fidelity® Small Cap Growth Fund (the Fund) is a fund of Fidelity Securities Fund (the Trust) and is authorized to issue an unlimited number of shares. The Trust is registered under the Investment Company Act of 1940, as amended (the 1940 Act), as an open-end management investment company organized as a Massachusetts business trust. The Fund offers Class A, Class T, Class C, Small Cap Growth and Institutional Class shares, each of which, along with Class B shares, has equal rights as to assets and voting privileges. Class B shares are closed to new accounts and additional purchases, except for exchanges and reinvestments. The Fund offered Class F shares during the period June 26, 2009 through November 15, 2013, and all outstanding shares were redeemed by November 15, 2013. Each class has exclusive voting rights with respect to matters that affect that class. Class B shares will automatically convert to Class A shares after a holding period of seven years from the initial date of purchase.
2. Investments in Fidelity Central Funds.
The Fund invests in Fidelity Central Funds, which are open-end investment companies generally available only to other investment companies and accounts managed by the investment adviser and its affiliates. The Fund's Schedule of Investments lists each of the Fidelity Central Funds held as of period end, if any, as an investment of the Fund, but does not include the underlying holdings of each Fidelity Central Fund. As an Investing Fund, the Fund indirectly bears its proportionate share of the expenses of the underlying Fidelity Central Funds.
The Money Market Central Funds seek preservation of capital and current income and are managed by Fidelity Investments Money Management, Inc. (FIMM), an affiliate of the investment adviser. Annualized expenses of the Money Market Central Funds as of their most recent shareholder report date are less than .01%.
A complete unaudited list of holdings for each Fidelity Central Fund is available upon request or at the Securities and Exchange Commission (the SEC) website at www.sec.gov. In addition, the financial statements of the Fidelity Central Funds, which are not covered by the Fund's Report of Independent Registered Public Accounting Firm, are available on the SEC website or upon request.
3. Significant Accounting Policies.
The financial statements have been prepared in conformity with accounting principles generally accepted in the United States of America (GAAP), which require management to make certain estimates and assumptions at the date of the financial statements. Actual results could differ from those estimates. Subsequent events, if any, through the date that the financial statements were issued have been evaluated in the preparation of
Annual Report
3. Significant Accounting Policies - continued
the financial statements. The following summarizes the significant accounting policies of the Fund:
Investment Valuation. Investments are valued as of 4:00 p.m. Eastern time on the last calendar day of the period. In accordance with valuation policies and procedures approved by the Board of Trustees (the Board), the Fund attempts to obtain prices from one or more third party pricing vendors or brokers to value its investments. When current market prices, quotations or currency exchange rates are not readily available or reliable, investments will be fair valued in good faith by the Fidelity Management & Research Company (FMR) Fair Value Committee (the Committee), in accordance with procedures adopted by the Board. Factors used in determining fair value vary by investment type and may include market or investment specific events. The frequency with which these procedures are used cannot be predicted and they may be utilized to a significant extent. The Committee oversees the Fund's valuation policies and procedures and is responsible for approving and reporting to the Board all fair value determinations.
The Fund categorizes the inputs to valuation techniques used to value its investments into a disclosure hierarchy consisting of three levels as shown below:
Level 1 - quoted prices in active markets for identical investments
Level 2 - other significant observable inputs (including quoted prices for similar investments, interest rates, prepayment speeds, etc.)
Level 3 - unobservable inputs (including the Fund's own assumptions based on the best information available)
Valuation techniques used to value the Fund's investments by major category are as follows:
Equity securities, including restricted securities, for which market quotations are readily available, are valued at the last reported sale price or official closing price as reported by a third party pricing vendor on the primary market or exchange on which they are traded and are categorized as Level 1 in the hierarchy. In the event there were no sales during the day or closing prices are not available, securities are valued at the last quoted bid price or may be valued using the last available price and are generally categorized as Level 2 in the hierarchy. For foreign equity securities, when market or security specific events arise, comparisons to the valuation of American Depositary Receipts (ADRs), futures contracts, Exchange-Traded Funds (ETFs) and certain indexes as well as quoted prices for similar securities may be used and would be categorized as Level 2 in the hierarchy. Utilizing these techniques may result in transfers between Level 1 and Level 2. For equity securities, including restricted securities, where observable inputs are
Annual Report
Notes to Financial Statements - continued
3. Significant Accounting Policies - continued
Investment Valuation - continued
limited, assumptions about market activity and risk are used and these securities may be categorized as Level 3 in the hierarchy.
Investments in open-end mutual funds, including the Fidelity Central Funds, are valued at their closing net asset value (NAV) each business day and are categorized as Level 1 in the hierarchy.
Changes in valuation techniques may result in transfers in or out of an assigned level within the disclosure hierarchy.
Foreign Currency. The Fund may use foreign currency contracts to facilitate transactions in foreign-denominated securities. Gains and losses from these transactions may arise from changes in the value of the foreign currency or if the counterparties do not perform under the contracts' terms.
Foreign-denominated assets, including investment securities, and liabilities are translated into U.S. dollars at the exchange rates at period end. Purchases and sales of investment securities, income and dividends received and expenses denominated in foreign currencies are translated into U.S. dollars at the exchange rate in effect on the transaction date.
The effects of exchange rate fluctuations on investments are included with the net realized and unrealized gain (loss) on investment securities. Other foreign currency transactions resulting in realized and unrealized gain (loss) are disclosed separately.
Investment Transactions and Income. For financial reporting purposes, the Fund's investment holdings and NAV include trades executed through the end of the last business day of the period. The NAV per share for processing shareholder transactions is calculated as of the close of business of the New York Stock Exchange (NYSE), normally 4:00 p.m. Eastern time and includes trades executed through the end of the prior business day. Gains and losses on securities sold are determined on the basis of identified cost and may include proceeds received from litigation. Dividend income is recorded on the ex-dividend date, except for certain dividends from foreign securities where the ex-dividend date may have passed, which are recorded as soon as the Fund is informed of the ex-dividend date. Non-cash dividends included in dividend income, if any, are recorded at the fair market value of the securities received. Income and capital gain distributions from Fidelity Central Funds, if any, are recorded on the ex-dividend date. Distributions received on securities that represent a return of capital or capital gain are recorded as a reduction of cost of investments and/or as a realized gain. Subsequent to ex-dividend date the Fund determines the components of these distributions, based upon receipt of tax filings or other correspondence relating to the underlying investment.
Annual Report
3. Significant Accounting Policies - continued
Investment Transactions and Income - continued
Interest income is accrued as earned and includes coupon interest and amortization of premium and accretion of discount on debt securities as applicable. Investment income is recorded net of foreign taxes withheld where recovery of such taxes is uncertain.
Class Allocations and Expenses. Investment income, realized and unrealized capital gains and losses, common expenses of the Fund, and certain fund-level expense reductions, if any, are allocated daily on a pro-rata basis to each class based on the relative net assets of each class to the total net assets of the Fund. Each class differs with respect to transfer agent and distribution and service plan fees incurred. Certain expense reductions may also differ by class. For the reporting period, the allocated portion of income and expenses to each class as a percent of its average net assets may vary due to the timing of recording these transactions in relation to fluctuating net assets of the classes. Expenses directly attributable to a fund are charged to that fund. Expenses attributable to more than one fund are allocated among the respective funds on the basis of relative net assets or other appropriate methods. Expense estimates are accrued in the period to which they relate and adjustments are made when actual amounts are known.
Income Tax Information and Distributions to Shareholders. Each year, the Fund intends to qualify as a regulated investment company under Subchapter M of the Internal Revenue Code, including distributing substantially all of its taxable income and realized gains. As a result, no provision for U.S. Federal income taxes is required. As of July 31, 2014, the Fund did not have any unrecognized tax benefits in the financial statements; nor is the Fund aware of any tax positions for which it is reasonably possible that the total amounts of unrecognized tax benefits will significantly change in the next twelve months. The Fund files a U.S. federal tax return, in addition to state and local tax returns as required. The Fund's federal income tax returns are subject to examination by the Internal Revenue Service (IRS) for a period of three fiscal years after they are filed. State and local tax returns may be subject to examination for an additional fiscal year depending on the jurisdiction. Foreign taxes are provided for based on the Fund's understanding of the tax rules and rates that exist in the foreign markets in which it invests.
Distributions are declared and recorded on the ex-dividend date. Income dividends and capital gain distributions are declared separately for each class. Income and capital gain distributions are determined in accordance with income tax regulations, which may differ from GAAP. In addition, the Fund claimed a portion of the payment made to redeeming shareholders as a distribution for income tax purposes.
Capital accounts within the financial statements are adjusted for permanent book-tax differences. These adjustments have no impact on net assets or the results of operations.
Annual Report
Notes to Financial Statements - continued
3. Significant Accounting Policies - continued
Income Tax Information and Distributions to Shareholders - continued
Capital accounts are not adjusted for temporary book-tax differences which will reverse in a subsequent period.
Book-tax differences are primarily due to in-kind transactions, futures transactions, foreign currency transactions, partnerships and losses deferred due to wash sales and excise tax regulations.
The federal tax cost of investment securities and unrealized appreciation (depreciation) as of period end were as follows:
Gross unrealized appreciation | $ 133,804,925 |
Gross unrealized depreciation | (55,161,096) |
Net unrealized appreciation (depreciation) on securities | $ 78,643,829 |
| |
Tax Cost | $ 1,242,690,076 |
The tax-based components of distributable earnings as of period end were as follows:
Undistributed long-term capital gain | $ 81,536,530 |
Net unrealized appreciation (depreciation) on securities and other investments | $ 78,640,127 |
The Fund intends to elect to defer to its next fiscal year $4,082,221 of ordinary losses recognized during the period January 1, 2014 to July 31, 2014.
The tax character of distributions paid was as follows:
| July 31, 2014 | July 31, 2013 |
Ordinary Income | $ 106,613,332 | $ 5,191,398 |
Long-term Capital Gains | 199,632,904 | 117,369,049 |
Total | $ 306,246,236 | $ 122,560,447 |
Short-Term Trading (Redemption) Fees. Shares held by investors in the Fund less than 90 days may have been subject to a redemption fee equal to 1.50% of the NAV of shares redeemed. All redemption fees, which reduce the proceeds of the shareholder redemption, are retained by the Fund and accounted for as an addition to paid in capital.
4. Derivative Instruments.
Risk Exposures and the Use of Derivative Instruments. The Fund's investment objective allows the Fund to enter into various types of derivative contracts, including futures contracts. Derivatives are investments whose value is primarily derived from underlying assets, indices or reference rates and may be transacted on an exchange or over-the-counter (OTC). Derivatives may involve a future commitment to buy or sell a
Annual Report
4. Derivative Instruments - continued
Risk Exposures and the Use of Derivative Instruments - continued
specified asset based on specified terms, to exchange future cash flows at periodic intervals based on a notional principal amount, or for one party to make one or more payments upon the occurrence of specified events in exchange for periodic payments from the other party.
The Fund used derivatives to increase returns and to manage exposure to certain risks as defined below. The success of any strategy involving derivatives depends on analysis of numerous economic factors, and if the strategies for investment do not work as intended, the Fund may not achieve its objectives.
The Fund's use of derivatives increased or decreased its exposure to the following risk:
Equity Risk | Equity risk relates to the fluctuations in the value of financial instruments as a result of changes in market prices (other than those arising from interest rate risk or foreign exchange risk), whether caused by factors specific to an individual investment, its issuer, or all factors affecting all instruments traded in a market or market segment. |
The Fund is also exposed to additional risks from investing in derivatives, such as liquidity risk and counterparty credit risk. Liquidity risk is the risk that the Fund will be unable to close out the derivative in the open market in a timely manner. Counterparty credit risk is the risk that the counterparty will not be able to fulfill its obligation to the Fund. Counterparty credit risk related to exchange-traded futures contracts may be mitigated by the protection provided by the exchange on which they trade.
Investing in derivatives may involve greater risks than investing in the underlying assets directly and, to varying degrees, may involve risk of loss in excess of any initial investment and collateral received and amounts recognized in the Statement of Assets and Liabilities. In addition, there may be the risk that the change in value of the derivative contract does not correspond to the change in value of the underlying instrument.
Futures Contracts. A futures contract is an agreement between two parties to buy or sell a specified underlying instrument for a fixed price at a specified future date. The Fund used futures contracts to manage its exposure to the stock market.
Upon entering into a futures contract, a fund is required to deposit either cash or securities (initial margin) with a clearing broker in an amount equal to a certain percentage of the face value of the contract. Futures contracts are marked-to-market daily and subsequent daily payments (variation margin) are made or received by a fund depending on the daily fluctuations in the value of the futures contracts and are recorded as unrealized appreciation or (depreciation). This receivable and/or payable, if any, is included in daily
Annual Report
Notes to Financial Statements - continued
4. Derivative Instruments - continued
Futures Contracts - continued
variation margin for derivative instruments in the Statement of Assets and Liabilities. Realized gain or (loss) is recorded upon the expiration or closing of a futures contract.
Any open futures contracts at period end are presented in the Schedule of Investments under the caption "Futures Contracts." The underlying face amount at value reflects each contract's exposure to the underlying instrument or index at period end.
During the period the Fund recognized net realized gain (loss) of $(2,221,706) related to its investment in futures contracts. This amount is included in the Statement of Operations.
5. Purchases and Sales of Investments.
Purchases and sales of securities, other than short-term securities and in-kind transactions, aggregated $2,507,771,818 and $2,337,256,072, respectively.
6. Fees and Other Transactions with Affiliates.
Management Fee. Fidelity Management & Research Company (the investment adviser) and its affiliates provide the Fund with investment management related services for which the Fund pays a monthly management fee. The management fee is the sum of an individual fund fee rate that is based on an annual rate of .45% of the Fund's average net assets and an annualized group fee rate that averaged .25% during the period. The group fee rate is based upon the average net assets of all the mutual funds advised by the investment adviser, including any mutual funds previously advised by the investment adviser that are currently advised by Fidelity SelectCo, LLC, an affiliate of the investment adviser. The group fee rate decreases as assets under management increase and increases as assets under management decrease. In addition, the management fee is subject to a performance adjustment (up to a maximum of ± .20% of the Fund's average net assets over a 36 month performance period). The upward or downward adjustment to the management fee is based on the relative investment performance of Small Cap Growth as compared to its benchmark index, the Russell 2000 Growth Index, over the same 36 month performance period. For the reporting period, the total annual management fee rate, including the performance adjustment, was .66% of the Fund's average net assets. The performance adjustment included in the management fee rate may be higher or lower than the maximum performance adjustment rate due to the difference between the average net assets for the reporting and performance periods.
Annual Report
6. Fees and Other Transactions with Affiliates - continued
Distribution and Service Plan Fees. In accordance with Rule 12b-1 of the 1940 Act, the Fund has adopted separate Distribution and Service Plans for each class of shares. Certain classes pay Fidelity Distributors Corporation (FDC), an affiliate of the investment adviser, separate Distribution and Service Fees, each of which is based on an annual percentage of each class' average net assets. In addition, FDC may pay financial intermediaries for selling shares of the Fund and providing shareholder support services. For the period, the Distribution and Service Fee rates, total fees and amounts retained by FDC were as follows:
| Distribution
Fee | Service
Fee | Total Fees | Retained
by FDC |
Class A | -% | .25% | $ 218,076 | $ 4,628 |
Class T | .25% | .25% | 210,598 | - |
Class B | .75% | .25% | 32,670 | 24,728 |
Class C | .75% | .25% | 412,947 | 83,407 |
| | | $ 874,291 | $ 112,763 |
Sales Load. FDC may receive a front-end sales charge of up to 5.75% for selling Class A shares and 3.50% for selling Class T shares, some of which is paid to financial intermediaries for selling shares of the Fund. Depending on the holding period, FDC may receive contingent deferred sales charges levied on Class A, Class T, Class B, and Class C redemptions. The deferred sales charges range from 5.00% to 1.00% for Class B shares, 1.00% for Class C shares, 1.00% for certain purchases of Class A shares and .25% for certain purchases of Class T shares.
For the period, sales charge amounts retained by FDC were as follows:
| Retained
by FDC |
Class A | $ 58,222 |
Class T | 14,217 |
Class B* | 1,899 |
Class C* | 4,695 |
| $ 79,033 |
* When Class B and Class C shares are initially sold, FDC pays commissions from its own resources to financial intermediaries through which the sales
are made.
Transfer Agent Fees. Fidelity Investments Institutional Operations Company, Inc., (FIIOC), an affiliate of the investment adviser, is the transfer, dividend disbursing and shareholder servicing agent for each class of the Fund. FIIOC receives account fees and asset-based fees that vary according to the account size and type of account of the shareholders of the respective classes of the Fund. FIIOC pays for typesetting, printing and mailing of shareholder reports, except proxy statements.
Annual Report
Notes to Financial Statements - continued
6. Fees and Other Transactions with Affiliates - continued
Transfer Agent Fees - continued
For the period, transfer agent fees for each class were as follows:
| Amount | % of
Average
Net Assets |
Class A | $ 229,497 | .26 |
Class T | 120,469 | .29 |
Class B | 9,848 | .30 |
Class C | 121,452 | .29 |
Small Cap Growth | 2,290,179 | .20 |
Institutional Class | 111,427 | .21 |
| $ 2,882,872 | |
Accounting and Security Lending Fees. Fidelity Service Company, Inc. (FSC), an affiliate of the investment adviser, maintains the Fund's accounting records. The accounting fee is based on the level of average net assets for each month. Under a separate contract, FSC administers the security lending program. The security lending fee is based on the number and duration of lending transactions.
Brokerage Commissions. The Fund placed a portion of its portfolio transactions with brokerage firms which are affiliates of the investment adviser. Brokerage commissions are included in net realized gain (loss) and change in net unrealized appreciation (depreciation) in the Statement of Operations. The commissions paid to these affiliated firms were $89,841 for the period.
Interfund Lending Program. Pursuant to an Exemptive Order issued by the SEC, the Fund, along with other registered investment companies having management contracts with FMR or other affiliated entities of FMR, may participate in an interfund lending program. This program provides an alternative credit facility allowing the funds to borrow from, or lend money to, other participating affiliated funds. At period end, there were no interfund loans outstanding. The Fund's activity in this program during the period for which loans were outstanding was as follows:
Borrower or Lender | Average Loan
Balance | Weighted Average
Interest Rate | Interest Expense |
Borrower | $ 8,287,364 | .32% | $ 819 |
Redemptions In-Kind. During the period, 70,585,530 shares of the Fund held by affiliated entities were redeemed for investments with a value of $1,380,652,586. The net realized gain of $304,585,595 on investments delivered through in-kind redemptions is included in the accompanying Statement of Operations. The amount of the in-kind redemption is included in share transactions in the accompanying Statement of Changes
Annual Report
6. Fees and Other Transactions with Affiliates - continued
Redemptions In-Kind - continued
in Net Assets as well as Note 11: Share Transactions. The Fund recognized no gain or loss for federal income tax purposes.
7. Committed Line of Credit.
The Fund participates with other funds managed by the investment adviser or an affiliate in a $4.25 billion credit facility (the "line of credit") to be utilized for temporary or emergency purposes to fund shareholder redemptions or for other short-term liquidity purposes. The Fund has agreed to pay commitment fees on its pro-rata portion of the line of credit, which amounted to $2,899 and is reflected in Miscellaneous expenses on the Statement of Operations. During the period, the Fund did not borrow on this line of credit.
8. Security Lending.
The Fund lends portfolio securities through a lending agent from time to time in order to earn additional income. For equity securities, a lending agent is used and may loan securities to certain qualified borrowers, including Fidelity Capital Markets (FCM), a broker-dealer affiliated with the Fund. On the settlement date of the loan, the Fund receives collateral (in the form of U.S. Treasury obligations, letters of credit and/or cash) against the loaned securities and maintains collateral in an amount not less than 100% of the market value of the loaned securities during the period of the loan. The market value of the loaned securities is determined at the close of business of the Fund and any additional required collateral is delivered to the Fund on the next business day. If the borrower defaults on its obligation to return the securities loaned because of insolvency or other reasons, the Fund may apply collateral received from the borrower against the obligation. The Fund may experience delays and costs in recovering the securities loaned. Any cash collateral received is invested in the Fidelity Securities Lending Cash Central Fund. The value of loaned securities and cash collateral at period end are disclosed on the Fund's Statement of Assets and Liabilities. At period end, there were no security loans outstanding with FCM. Security lending income represents the income earned on investing cash collateral, less rebates paid to borrowers and any lending agent fees associated with the loan, plus any premium payments received for lending certain types of securities. Security lending income is presented in the Statement of Operations as a component of income from Fidelity Central Funds and includes $68,452 from securities loaned to FCM.
Annual Report
Notes to Financial Statements - continued
9. Expense Reductions.
Commissions paid to certain brokers with whom the investment adviser, or its affiliates, places trades on behalf of the Fund include an amount in addition to trade execution, which may be rebated back to the Fund to offset certain expenses. This amount totaled $56,370 for the period. In addition, through arrangements with the Fund's custodian, credits realized as a result of uninvested cash balances were used to reduce the Fund's expenses. During the period, these credits reduced the Fund's custody expenses by $86.
In addition, the investment adviser reimbursed a portion of the Fund's operating expenses during the period in the amount of $24,445.
10. Distributions to Shareholders.
Distributions to shareholders of each class were as follows:
Years ended July 31, | 2014 A | 2013 |
From net realized gain | | |
Class A | $ 13,043,180 | $ 3,855,020 |
Class T | 6,310,012 | 1,778,904 |
Class B | 574,582 | 260,524 |
Class C | 6,249,863 | 1,656,727 |
Small Cap Growth | 191,545,684 | 74,940,038 |
Class F | 80,609,253 | 37,680,389 |
Institutional Class | 7,913,662 | 2,388,845 |
Total | $ 306,246,236 | $ 122,560,447 |
A All Class F shares were redeemed on November 15, 2013.
11. Share Transactions.
Transactions for each class of shares were as follows:
| Shares | Dollars |
Years ended July 31, | 2014 A | 2013 | 2014 A | 2013 |
Class A | | | | |
Shares sold | 1,706,264 | 969,311 | $ 32,017,468 | $ 16,711,827 |
Reinvestment of distributions | 685,582 | 231,282 | 12,377,436 | 3,646,231 |
Shares redeemed | (1,267,150) | (1,149,326) | (23,663,751) | (19,219,034) |
Net increase (decrease) | 1,124,696 | 51,267 | $ 20,731,153 | $ 1,139,024 |
Class T | | | | |
Shares sold | 787,491 | 457,321 | $ 14,539,628 | $ 7,743,595 |
Reinvestment of distributions | 341,036 | 106,640 | 6,061,090 | 1,660,117 |
Shares redeemed | (506,140) | (538,707) | (9,192,820) | (8,802,237) |
Net increase (decrease) | 622,387 | 25,254 | $ 11,407,898 | $ 601,475 |
Annual Report
11. Share Transactions - continued
| Shares | Dollars |
Years ended July 31, | 2014 A | 2013 | 2014 A | 2013 |
Class B | | | | |
Shares sold | 11,205 | 6,696 | $ 198,217 | $ 106,485 |
Reinvestment of distributions | 32,147 | 16,337 | 548,598 | 246,159 |
Shares redeemed | (66,282) | (107,598) | (1,168,208) | (1,730,845) |
Net increase (decrease) | (22,930) | (84,565) | $ (421,393) | $ (1,378,201) |
Class C | | | | |
Shares sold | 918,904 | 456,788 | $ 16,220,240 | $ 7,531,447 |
Reinvestment of distributions | 347,970 | 103,215 | 5,911,022 | 1,550,542 |
Shares redeemed | (510,512) | (428,305) | (8,883,388) | (6,821,754) |
Net increase (decrease) | 756,362 | 131,698 | $ 13,247,874 | $ 2,260,235 |
Small Cap Growth | | | | |
Shares sold | 30,614,664 | 10,379,088 | $ 589,831,022 | $ 182,249,151 |
Reinvestment of distributions | 10,184,956 | 4,595,875 | 187,557,177 | 73,721,316 |
Shares redeemed | (48,426,256) B | (21,652,202) | (934,113,968) B | (371,997,767) |
Net increase (decrease) | (7,626,636) | (6,677,239) | $ (156,725,769) | $ (116,027,300) |
Class F | | | | |
Shares sold | 768,083 | 7,670,010 | $ 15,293,461 | $ 131,231,307 |
Reinvestment of distributions | 4,357,257 | 2,336,095 | 80,609,253 | 37,680,389 |
Shares redeemed | (41,060,113) B | (6,554,937) | (806,457,595) B | (118,928,973) |
Net increase (decrease) | (35,934,773) | 3,451,168 | $ (710,554,881) | $ 49,982,723 |
Institutional Class | | | | |
Shares sold | 933,934 | 727,207 | $ 18,129,031 | $ 12,757,998 |
Reinvestment of distributions | 381,830 | 128,780 | 7,062,159 | 2,069,290 |
Shares redeemed | (1,069,577) | (580,321) | (20,552,810) | (9,884,418) |
Net increase (decrease) | 246,187 | 275,666 | $ 4,638,380 | $ 4,942,870 |
A All Class F shares were redeemed on November 15, 2013.
B Amount includes in-kind redemptions (see Note 6: Redemptions In-Kind).
12. Other.
The Fund's organizational documents provide former and current trustees and officers with a limited indemnification against liabilities arising in connection with the performance of their duties to the Fund. In the normal course of business, the Fund may also enter into contracts that provide general indemnifications. The Fund's maximum exposure under these arrangements is unknown as this would be dependent on future claims that may be made against the Fund. The risk of material loss from such claims is considered remote.
Annual Report
To the Trustees of Fidelity Securities Fund and the Shareholders of Fidelity Small Cap Growth Fund:
In our opinion, the accompanying statement of assets and liabilities, including the schedule of investments, and the related statements of operations and of changes in net assets and the financial highlights present fairly, in all material respects, the financial position of Fidelity Small Cap Growth Fund (a fund of Fidelity Securities Fund) at July 31, 2014, the results of its operations for the year then ended, the changes in its net assets for each of the two years in the period then ended and the financial highlights for each of the five years in the period then ended, in conformity with accounting principles generally accepted in the United States of America. These financial statements and financial highlights (hereafter referred to as "financial statements") are the responsibility of the Fidelity Small Cap Growth Fund's management. Our responsibility is to express an opinion on these financial statements based on our audits. We conducted our audits of these financial statements in accordance with the standards of the Public Company Accounting Oversight Board (United States). Those standards require that we plan and perform the audit to obtain reasonable assurance about whether the financial statements are free of material misstatement. An audit includes examining, on a test basis, evidence supporting the amounts and disclosures in the financial statements, assessing the accounting principles used and significant estimates made by management, and evaluating the overall financial statement presentation. We believe that our audits, which included confirmation of securities at July 31, 2014 by correspondence with the custodian and brokers, provide a reasonable basis for our opinion.
PricewaterhouseCoopers LLP
Boston, Massachusetts
September 15, 2014
Annual Report
The Trustees, Member of the Advisory Board, and officers of the trust and fund, as applicable, are listed below. The Board of Trustees governs the fund and is responsible for protecting the interests of shareholders. The Trustees are experienced executives who meet periodically throughout the year to oversee the fund's activities, review contractual arrangements with companies that provide services to the fund, oversee management of the risks associated with such activities and contractual arrangements, and review the fund's performance. Except for James C. Curvey, each of the Trustees oversees 173 funds. Mr. Curvey oversees 397 funds.
The Trustees hold office without limit in time except that (a) any Trustee may resign; (b) any Trustee may be removed by written instrument, signed by at least two-thirds of the number of Trustees prior to such removal; (c) any Trustee who requests to be retired or who has become incapacitated by illness or injury may be retired by written instrument signed by a majority of the other Trustees; and (d) any Trustee may be removed at any special meeting of shareholders by a two-thirds vote of the outstanding voting securities of the trust. Each Trustee who is not an interested person (as defined in the 1940 Act) of the trust and the fund (Independent Trustee), shall retire not later than the last day of the calendar year in which his or her 75th birthday occurs. The Independent Trustees may waive this mandatory retirement age policy with respect to individual Trustees. The officers and Advisory Board Member hold office without limit in time, except that any officer and Advisory Board Member may resign or may be removed by a vote of a majority of the Trustees at any regular meeting or any special meeting of the Trustees. Except as indicated, each individual has held the office shown or other offices in the same company for the past five years.
Experience, Skills, Attributes, and Qualifications of the Fund's Trustees. The Governance and Nominating Committee has adopted a statement of policy that describes the experience, qualifications, attributes, and skills that are necessary and desirable for potential Independent Trustee candidates (Statement of Policy). The Board believes that each Trustee satisfied at the time he or she was initially elected or appointed a Trustee, and continues to satisfy, the standards contemplated by the Statement of Policy. The Governance and Nominating Committee also engages professional search firms to help identify potential Independent Trustee candidates who have the experience, qualifications, attributes, and skills consistent with the Statement of Policy. From time to time, additional criteria based on the composition and skills of the current Independent Trustees, as well as experience or skills that may be appropriate in light of future changes to board composition, business conditions, and regulatory or other developments, have also been considered by the professional search firms and the Governance and Nominating Committee. In addition, the Board takes into account the Trustees' commitment and participation in Board and committee meetings, as well as their leadership of standing and ad hoc committees throughout their tenure.
In determining that a particular Trustee was and continues to be qualified to serve as a Trustee, the Board has considered a variety of criteria, none of which, in isolation, was controlling. The Board believes that, collectively, the Trustees have balanced and diverse experience, qualifications, attributes, and skills, which allow the Board to operate effectively in governing the fund and protecting the interests of shareholders. Information about the specific experience, skills, attributes, and qualifications of each Trustee, which in each case led to the Board's conclusion that the Trustee should serve (or continue to serve) as a trustee of the fund, is provided below.
Annual Report
Trustees and Officers - continued
Board Structure and Oversight Function. James C. Curvey is an interested person (as defined in the 1940 Act) and currently serves as Chairman. The Trustees have determined that an interested Chairman is appropriate and benefits shareholders because an interested Chairman has a personal and professional stake in the quality and continuity of services provided to the fund. Independent Trustees exercise their informed business judgment to appoint an individual of their choosing to serve as Chairman, regardless of whether the Trustee happens to be independent or a member of management. The Independent Trustees have determined that they can act independently and effectively without having an Independent Trustee serve as Chairman and that a key structural component for assuring that they are in a position to do so is for the Independent Trustees to constitute a substantial majority for the Board. The Independent Trustees also regularly meet in executive session. Ned C. Lautenbach serves as Chairman of the Independent Trustees and as such (i) acts as a liaison between the Independent Trustees and management with respect to matters important to the Independent Trustees and (ii) with management prepares agendas for Board meetings.
Fidelity funds are overseen by different Boards of Trustees. The fund's Board oversees Fidelity's equity and high income funds and another Board oversees Fidelity's investment-grade bond, money market, and asset allocation funds. The asset allocation funds may invest in Fidelity funds overseen by the fund's Board. The use of separate Boards, each with its own committee structure, allows the Trustees of each group of Fidelity funds to focus on the unique issues of the funds they oversee, including common research, investment, and operational issues. On occasion, the separate Boards establish joint committees to address issues of overlapping consequences for the Fidelity funds overseen by each Board.
The Trustees operate using a system of committees to facilitate the timely and efficient consideration of all matters of importance to the Trustees, the fund, and fund shareholders and to facilitate compliance with legal and regulatory requirements and oversight of the fund's activities and associated risks. The Board, acting through its committees, has charged FMR and its affiliates with (i) identifying events or circumstances the occurrence of which could have demonstrably adverse effects on the fund's business and/or reputation; (ii) implementing processes and controls to lessen the possibility that such events or circumstances occur or to mitigate the effects of such events or circumstances if they do occur; and (iii) creating and maintaining a system designed to evaluate continuously business and market conditions in order to facilitate the identification and implementation processes described in (i) and (ii) above. Because the day-to-day operations and activities of the fund are carried out by or through FMR, its affiliates and other service providers, the fund's exposure to risks is mitigated but not eliminated by the processes overseen by the Trustees. While each of the Board's committees has responsibility for overseeing different aspects of the fund's activities, oversight is exercised primarily through the Operations, Audit, and Compliance Committees. In addition, the Independent Trustees have worked with FMR to enhance the Board's oversight of investment and financial risks, legal and regulatory risks, technology risks, and operational risks, including the development of additional risk reporting to the Board. For example, a working group comprised of Independent Trustees and FMR has worked and continues to work to review the Fidelity funds' valuation-related activities, reporting and risk management. Appropriate personnel, including but not limited to the fund's Chief Compliance Officer (CCO), FMR's internal auditor, the independent accountants, the fund's Treasurer and portfolio management personnel, make periodic reports to the Board's committees, as appropriate, including an annual review of FMR's risk management program for the Fidelity funds. The responsibilities of each standing committee, including their oversight responsibilities, are described further under "Standing Committees of the Fund's Trustees."
Annual Report
The fund's Statement of Additional Information (SAI) includes more information about the Trustees. To request a free copy, call Fidelity at 1-877-208-0098.
Interested Trustees*:
Correspondence intended for each Trustee who is an interested person may be sent to Fidelity Investments, 245 Summer Street, Boston, Massachusetts 02210.
Name, Year of Birth; Principal Occupations and Other Relevant Experience+ |
James C. Curvey (1935) |
Year of Election or Appointment: 2007 Trustee Chairman of the Board of Trustees |
| Mr. Curvey also serves as Trustee of other Fidelity funds. Mr. Curvey is a Director of Fidelity Research & Analysis Co. (2009-present), and Vice Chairman (2007-present) and Director of FMR LLC. In addition, Mr. Curvey serves as an Overseer for the Boston Symphony Orchestra and a member of the Trustees of Villanova University. Previously, Mr. Curvey served as a Director of Fidelity Investments Money Management, Inc. (2009-2014), a Director of FMR (2007-2014), a Director of FMR Co., Inc. (2007-2014) and was the Vice Chairman (2006-2007) and Director (2000-2007) of FMR Corp. |
Charles S. Morrison (1960) |
Year of Election or Appointment: 2014 Trustee |
| Mr. Morrison also serves as Trustee of other funds. He serves as President, Asset Management (2014-present) and is an employee of Fidelity Investments. Previously, Mr. Morrison served as Vice President of Fidelity's Fixed Income and Asset Allocation Funds (2012-2014), President, Fixed Income (2011-2014), Vice President of Fidelity's Money Market Funds (2005-2009), President, Money Market Group Leader of FMR (2009), and Senior Vice President, Money Market Group of FMR (2004-2009). Mr. Morrison also served as Vice President of Fidelity's Bond Funds (2002-2005), certain Balanced Funds (2002-2005), and certain Asset Allocation Funds (2002-2007), and as Senior Vice President (2002-2005) of Fidelity's Bond Division. |
* Trustees have been determined to be "Interested Trustees" by virtue of, among other things, their affiliation with the trust or various entities under common control with FMR
+ The information above includes each Trustee's principal occupation during the last five years and other information relating to the experience, attributes, and skills relevant to each Trustee's qualifications to serve as a Trustee, which led to the conclusion that each Trustee should serve as a Trustee for the fund.
Annual Report
Independent Trustees:
Correspondence intended for each Independent Trustee (that is, the Trustees other than the Interested Trustees) may be sent to Fidelity Investments, P.O. Box 55235, Boston, Massachusetts 02205-5235.
Name, Year of Birth; Principal Occupations and Other Relevant Experience+ |
Dennis J. Dirks (1948) |
Year of Election or Appointment: 2005 Trustee |
| Mr. Dirks also serves as Trustee of other Fidelity funds. Prior to his retirement in May 2003, Mr. Dirks was Chief Operating Officer and a member of the Board of The Depository Trust & Clearing Corporation (DTCC). He also served as President, Chief Operating Officer, and Board member of The Depository Trust Company (DTC) and President and Board member of the National Securities Clearing Corporation (NSCC). In addition, Mr. Dirks served as Chief Executive Officer and Board member of the Government Securities Clearing Corporation, Chief Executive Officer and Board member of the Mortgage-Backed Securities Clearing Corporation, as a Trustee and a member of the Finance Committee of Manhattan College (2005-2008), and as a Trustee and a member of the Finance Committee of AHRC of Nassau County (2006-2008). Mr. Dirks is a member of the Independent Directors Council (IDC) Governing Council (2010-present) and Board of Directors for The Brookville Center for Children's Services, Inc. (2009-present). |
Alan J. Lacy (1953) |
Year of Election or Appointment: 2008 Trustee |
| Mr. Lacy also serves as Trustee of other Fidelity funds. Mr. Lacy serves as Senior Adviser (2007-present) of Oak Hill Capital Partners, L.P. (private equity). Mr. Lacy also served as Chief Executive Officer (2000-2005) and Vice Chairman (2005-2006) of Sears Holdings Corporation and Sears, Roebuck and Co. (retail). In addition, Mr. Lacy serves as a member of the Board of Directors of Dave & Buster's Entertainment, Inc. (restaurant and entertainment complexes, 2010-present), Earth Fare, Inc. (retail grocery, 2012-present), The Hillman Companies, Inc. (hardware wholesalers, 2010-present), and Bristol-Myers Squibb Company (global pharmaceuticals, 2008-present). Mr. Lacy is a member of the Board of Trustees of The National Parks Conservation Association (2006-present). Previously, Mr. Lacy served as Chairman of the Board of Trustees of the National Parks Conservation Association (2008-2011) and as a member of the Board of Directors for the Western Union Company (global money transfer, 2006-2011). |
Ned C. Lautenbach (1944) |
Year of Election or Appointment: 2000 Trustee Chairman of the Independent Trustees |
| Mr. Lautenbach also serves as Trustee of other Fidelity funds. Mr. Lautenbach currently serves as the Lead Director of the Eaton Corporation Board of Directors (diversified industrial, 1997-present). Mr. Lautenbach is Chairman of the Board of Directors of the Philharmonic Center for the Arts in Naples, Florida (2012-present) and a member of the Council on Foreign Relations (1994-present). Previously, Mr. Lautenbach was a Partner/Advisory Partner at Clayton, Dubilier & Rice, LLC (private equity investment, 1998-2010), as well as a Director of Sony Corporation (2006-2007). |
Joseph Mauriello (1944) |
Year of Election or Appointment: 2008 Trustee |
| Mr. Mauriello also serves as Trustee of other Fidelity funds. Prior to his retirement in January 2006, Mr. Mauriello served in numerous senior management positions including Deputy Chairman and Chief Operating Officer (2004-2005), and Vice Chairman of Financial Services (2002-2004) of KPMG LLP US (professional services, 1965-2005). Mr. Mauriello currently serves as a member of the Board of Directors of XL Group plc. (global insurance and re-insurance, 2006-present). Previously, Mr. Mauriello served as a Director of the Hamilton Funds of the Bank of New York (2006-2007) and of Arcadia Resources Inc. (health care services and products, 2007-2012). |
Robert W. Selander (1950) |
Year of Election or Appointment: 2011 Trustee |
| Mr. Selander also serves as Trustee of other Fidelity funds. Previously, Mr. Selander served as a Member of the Advisory Board of other Fidelity funds (2011), and Executive Vice Chairman (2010), Chief Executive Officer (2009-2010), and President and Chief Executive Officer (1997-2009) of Mastercard, Inc. |
Cornelia M. Small (1944) |
Year of Election or Appointment: 2005 Trustee |
| Ms. Small also serves as Trustee of other Fidelity funds. Ms. Small is a member of the Board of Directors (2009-present) and Chair of the Investment Committee (2010-present) of the Teagle Foundation. Ms. Small also serves on the Investment Committee of the Berkshire Taconic Community Foundation (2008-present). Previously, Ms. Small served as Chairperson (2002-2008) and a member of the Investment Committee and Chairperson (2008-2012) and a member of the Board of Trustees of Smith College. In addition, Ms. Small served as Chief Investment Officer, Director of Global Equity Investments, and a member of the Board of Directors of Scudder, Stevens & Clark and Scudder Kemper Investments. |
William S. Stavropoulos (1939) |
Year of Election or Appointment: 2002 Trustee Vice Chairman of the Independent Trustees |
| Mr. Stavropoulos also serves as Trustee of other Fidelity funds. Mr. Stavropoulos serves as President and Founder of the Michigan Baseball Foundation, the Great Lakes Loons (2007-present). Mr. Stavropoulos is Chairman Emeritus of the Board of Directors of The Dow Chemical Company, where he previously served in numerous senior management positions, including President, CEO (1995-2000; 2002-2004), Chairman of the Executive Committee (2000-2006), and as a member of the Board of Directors (1990-2006). Currently, Mr. Stavropoulos is Chairman of the Board of Directors of Univar Inc. (global distributor of commodity and specialty chemicals), a Director of Teradata Corporation (data warehousing and technology solutions), and Maersk Inc. (industrial conglomerate), and a member of the Advisory Board for Metalmark Capital LLC (private equity investment, 2005-present). Mr. Stavropoulos is an operating advisor to Clayton, Dubilier & Rice, LLC (private equity investment). In addition, Mr. Stavropoulos is a member of the University of Notre Dame Advisory Council for the College of Science, a Trustee of the Rollin L. Gerstacker Foundation, and a Director of the Naples Philharmonic Center for the Arts. Previously, Mr. Stavropoulos served as a Director of Chemical Financial Corporation (bank holding company, 1993-2012) and Tyco International, Ltd. (multinational manufacturing and services, 2007-2012). |
David M. Thomas (1949) |
Year of Election or Appointment: 2008 Trustee |
| Mr. Thomas also serves as Trustee of other Fidelity funds. Mr. Thomas serves as Non-Executive Chairman of the Board of Directors of Fortune Brands Home and Security (home and security products, 2011-present), and as a member of the Board of Directors of Interpublic Group of Companies, Inc. (marketing communication, 2004-present). Previously, Mr. Thomas served as Executive Chairman (2005-2006) and Chairman and Chief Executive Officer (2000-2005) of IMS Health, Inc. (pharmaceutical and healthcare information solutions), and a Director of Fortune Brands, Inc. (consumer products, 2000-2011). |
+ The information above includes each Trustee's principal occupation during the last five years and other information relating to the experience, attributes, and skills relevant to each Trustee's qualifications to serve as a Trustee, which led to the conclusion that each Trustee should serve as a Trustee for the fund.
Advisory Board Member and Officers:
Correspondence intended for each officer and Peter S. Lynch may be sent to Fidelity Investments, 245 Summer Street, Boston, Massachusetts 02210. Officers appear below in alphabetical order.
Name, Year of Birth; Principal Occupation |
Peter S. Lynch (1944) |
Year of Election or Appointment: 2003 Member of the Advisory Board |
| Mr. Lynch also serves as Member of the Advisory Board of other Fidelity funds. Mr. Lynch is Vice Chairman and a Director of FMR and FMR Co., Inc. In addition, Mr. Lynch serves as a Trustee of Boston College and as the Chairman of the Inner-City Scholarship Fund. Previously, Mr. Lynch served on the Special Olympics International Board of Directors (1997-2006). |
Elizabeth Paige Baumann (1968) |
Year of Election or Appointment: 2012 Anti-Money Laundering (AML) Officer |
| Ms. Baumann also serves as AML Officer of other funds. She is Chief AML Officer of FMR LLC (2012-present) and is an employee of Fidelity Investments. Previously, Ms. Baumann served as Vice President and Deputy Anti-Money Laundering Officer (2007-2012). |
William C. Coffey (1969) |
Year of Election or Appointment: 2009 Assistant Secretary |
| Mr. Coffey also serves as Assistant Secretary of other funds. He is Senior Vice President and Deputy General Counsel of FMR LLC (2010-present), and is an employee of Fidelity Investments. Previously, Mr. Coffey served as Vice President and Associate General Counsel of FMR LLC (2005-2009). |
Jonathan Davis (1968) |
Year of Election or Appointment: 2010 Assistant Treasurer |
| Mr. Davis also serves as Assistant Treasurer of other funds. Mr. Davis is an employee of Fidelity Investments. Previously, Mr. Davis served as Vice President and Associate General Counsel of FMR LLC (2003-2010). |
Adrien E. Deberghes (1967) |
Year of Election or Appointment: 2008 Deputy Treasurer |
| Mr. Deberghes also serves as an officer of other funds. He is an employee of Fidelity Investments (2008-present). Prior to joining Fidelity Investments, Mr. Deberghes was Senior Vice President of Mutual Fund Administration at State Street Corporation (2007-2008), Senior Director of Mutual Fund Administration at Investors Bank & Trust (2005-2007), and Director of Finance for Dunkin' Brands (2000-2005). |
Stephanie J. Dorsey (1969) |
Year of Election or Appointment: 2010 Assistant Treasurer |
| Ms. Dorsey also serves as an officer of other funds. She is an employee of Fidelity Investments (2008-present) and has served in other fund officer roles. Prior to joining Fidelity Investments, Ms. Dorsey served as Treasurer (2004-2008) of the JPMorgan Mutual Funds and Vice President (2004-2008) of JPMorgan Chase Bank. |
Howard J. Galligan III (1966) |
Year of Election or Appointment: 2014 Chief Financial Officer |
| Mr. Galligan also serves as Chief Financial Officer of other funds. Mr. Galligan serves as President of Fidelity Pricing and Cash Management Services (FPCMS) (2014-present) and as a Director of Strategic Advisers, Inc. (2008-present). Previously, Mr. Galligan served as Chief Administrative Officer of Asset Management (2011-2014) and Chief Operating Officer and Senior Vice President of Investment Support for Strategic Advisers, Inc. (2003-2011). |
Scott C. Goebel (1968) |
Year of Election or Appointment: 2008 Secretary and Chief Legal Officer (CLO) |
| Mr. Goebel serves as Secretary and CLO of other funds. Mr. Goebel also serves as Secretary of Fidelity SelectCo, LLC (2013-present), Fidelity Investments Money Management, Inc. (FIMM) (2010-present) and Fidelity Research and Analysis Company (FRAC) (2010-present); General Counsel, Secretary, and Senior Vice President of FMR (2008-present) and FMR Co., Inc. (2008-present); Chief Legal Officer of Fidelity Management & Research (Hong Kong) Limited (2008-present); and Assistant Secretary of Fidelity Management & Research (Japan) Inc. (2008-present) and Fidelity Management & Research (U.K.) Inc. (2008-present). Previously, Mr. Goebel served as Secretary and CLO of other Fidelity funds (2008-2013), Assistant Secretary of FIMM (2008-2010), FRAC (2008-2010), and certain funds (2007-2008); and as Vice President and Secretary of Fidelity Distributors Corporation (FDC) (2005-2007). Mr. Goebel has been employed by FMR LLC or an affiliate since 2001. |
Thomas C. Hense (1964) |
Year of Election or Appointment: 2008/2010 Vice President |
| Mr. Hense also serves as Vice President of other funds (High Income (2008), Small Cap (2008), and Value (2010) funds). Previously, Mr. Hense served as a portfolio manager for Fidelity's Institutional Money Management Group (Pyramis) (2003-2008).] |
Brian B. Hogan (1964) |
Year of Election or Appointment: 2009 Vice President |
| Mr. Hogan also serves as Trustee or Vice President of other funds. Mr. Hogan serves as President of FMR's Equity Division (2009-present). Previously, Mr. Hogan served as Senior Vice President, Equity Research of FMR (2006-2009) and as a portfolio manager. |
Chris Maher (1972) |
Year of Election or Appointment: 2013 Assistant Treasurer |
| Mr. Maher serves as Assistant Treasurer of other funds. Mr. Maher is Vice President of Valuation Oversight and is an employee of Fidelity Investments. Previously, Mr. Maher served as Vice President of Asset Management Compliance (2013), Vice President of FMR's Program Management Group (2010-2013), and Vice President of Valuation Oversight (2008-2010). |
Kenneth B. Robins (1969) |
Year of Election or Appointment: 2008 President and Treasurer |
| Mr. Robins also serves as an officer of other funds. Mr. Robins serves as Executive Vice President of Fidelity Investments Money Management, Inc. (FIMM) (2013-present) and is an employee of Fidelity Investments (2004-present). Previously, Mr. Robins served in other fund officer roles. |
Stephen Sadoski (1971) |
Year of Election or Appointment: 2012 Deputy Treasurer |
| Mr. Sadoski also serves as Deputy Treasurer of other funds. He is an employee of Fidelity Investments (2012-present) and has served in another fund officer role. Prior to joining Fidelity Investments, Mr. Sadoski served as an assistant chief accountant in the Division of Investment Management of the Securities and Exchange Commission (SEC) (2009-2012) and as a senior manager at Deloitte & Touche LLP (1997-2009). |
Stacie M. Smith (1974) |
Year of Election or Appointment: 2013 Deputy Treasurer |
| Ms. Smith also serves as an officer of other funds. She is an employee of Fidelity Investments (2009-present) and has served in other fund officer roles. Prior to joining Fidelity Investments, Ms. Smith served as Senior Audit Manager of Ernst & Young LLP (1996-2009). |
Renee Stagnone (1975) |
Year of Election or Appointment: 2013 Deputy Treasurer |
| Ms. Stagnone also serves as Deputy Treasurer of other funds. Ms. Stagnone is an employee of Fidelity Investments. |
Linda J. Wondrack (1964) |
Year of Election or Appointment: 2014 Chief Compliance Officer |
| Ms. Wondrack also serves as Chief Compliance Officer of other funds. Ms. Wondrack is Executive Vice President and head of the Ethics Office and Asset Management Compliance for Fidelity Investments (2012-present). Ms. Wondrack also serves as Chief Compliance Officer of Fidelity SelectCo, LLC (2014-present); Chief Compliance Officer of Impresa Management LLC (2013-present); and Chief Compliance Officer of FMR Co., Inc., Fidelity Investments Money Management, Inc., Fidelity Management & Research (Japan) Inc., Fidelity Management & Research (U.K.) Inc., Fidelity Management & Research (Hong Kong), Fidelity Management & Research Company, Pyramis Global Advisors, LLC, and Strategic Advisers, Inc., Ballyrock Investment Advisors LLC, and Northern Neck Investors LLC (2012-present). Previously, Ms. Wondrack served as Senior Vice President and Chief Compliance Officer for Columbia Management Investment Advisers, LLC (2005-2012); Chief Compliance Officer for certain funds within the Columbia Family of Funds (2007-2012); and Senior Vice President of Compliance Risk Management at Bank of America (2005-2010). |
Joseph F. Zambello (1957) |
Year of Election or Appointment: 2011 Deputy Treasurer |
| Mr. Zambello also serves as Deputy Treasurer of other funds. Mr. Zambello is an employee of Fidelity Investments. Previously, Mr. Zambello served as Vice President of FMR's Program Management Group (2009-2011) and Vice President of the Transfer Agent Oversight Group (2005-2009). |
Annual Report
The Board of Trustees of Fidelity Small Cap Growth Fund voted to pay to shareholders of record at the opening of business, the following distributions per share derived from capital gains realized from sales of portfolio securities:
| Pay Date | Record Date | Capital Gains |
Institutional Class | 09/15/14 | 09/12/14 | $1.188 |
The fund hereby designates as a capital gain dividend with respect to the taxable year ended July 31, 2014, $155,260,658, or, if subsequently determined to be different, the net capital gain of such year.
The fund designates 7% of the dividends distributed during the fiscal year as qualifying for the dividends-received deduction for corporate shareholders.
The fund designates 10% of the dividends distributed during the fiscal year as
amounts which can be taken into account as a dividend for the purposes of the maximum rate under section 1(h)(11) of the Internal Revenue Code.
The fund will notify shareholders in January 2015 of amounts for use in preparing 2014 income tax returns.
Annual Report
Board Approval of Investment Advisory Contracts and Management Fees
Fidelity Small Cap Growth Fund
Each year, the Board of Trustees, including the Independent Trustees (together, the Board), votes on the renewal of the management contract with Fidelity Management & Research Company (FMR) and the sub-advisory agreements (together, the Advisory Contracts) for the fund. The Board, assisted by the advice of fund counsel and Independent Trustees' counsel, requests and considers a broad range of information relevant to the renewal of the Advisory Contracts throughout the year.
The Board meets regularly and, at each of its meetings, covers an extensive agenda of topics and materials and considers factors that are relevant to its annual consideration of the renewal of the fund's Advisory Contracts, including the services and support provided to the fund and its shareholders. The Board has established various standing committees (Committees), each composed of and chaired by Independent Trustees with varying backgrounds, to which the Board has assigned specific subject matter responsibilities in order to enhance effective decision-making by the Board. The Board, acting directly and through its Committees, requests and receives information concerning the annual consideration of the renewal of the fund's Advisory Contracts. The Board also meets as needed to consider matters specifically related to the Board's annual consideration of the renewal of the Advisory Contracts. Members of the Board may also meet with trustees of other Fidelity funds through ad hoc joint committees to discuss certain matters relevant to the Fidelity funds.
At its July 2014 meeting, the Board, including the Independent Trustees, unanimously determined to renew the fund's Advisory Contracts. In reaching its determination, the Board considered all factors it believed relevant, including (i) the nature, extent, and quality of the services to be provided to the fund and its shareholders (including the investment performance of the fund); (ii) the competitiveness of the fund's management fee and total expense ratio relative to peer funds; (iii) the total costs of the services to be provided by and the profits to be realized by Fidelity from its relationship with the fund; (iv) the extent to which economies of scale exist and would be realized as the fund grows; and (v) whether fee levels reflect these economies of scale, if any, for the benefit of fund shareholders. In connection with separate internal corporate reorganizations involving Fidelity Management & Research (U.K.) Inc. (FMR U.K.) and Fidelity Management & Research (Japan) Inc. (FMR Japan), the Board approved certain non-material amendments to the fund's sub-advisory agreements with FMR U.K. and FMR Japan to reflect that, after these reorganizations, FMR Investment Management (UK) Limited and Fidelity Management & Research (Japan) Limited will carry on the business of FMR U.K. and FMR Japan, respectively. The Board noted that no changes to the portfolio managers or to the foreign research or investment advisory services provided to the fund were expected in connection with either reorganization and that the same personnel and resources would continue to be available to the fund at the new entities.
Annual Report
In considering whether to renew the Advisory Contracts for the fund, the Board reached a determination, with the assistance of fund counsel and Independent Trustees' counsel and through the exercise of its business judgment, that the renewal of the Advisory Contracts was in the best interests of the fund and its shareholders and that the compensation payable under the Advisory Contracts was fair and reasonable. The Board's decision to renew the Advisory Contracts was not based on any single factor, but rather was based on a comprehensive consideration of all the information provided to the Board at its meetings throughout the year. The Board, in reaching its determination to renew the Advisory Contracts, was aware that shareholders of the fund have a broad range of investment choices available to them, including a wide choice among funds offered by Fidelity's competitors, and that the fund's shareholders, who have the opportunity to review and weigh the disclosure provided by the fund in its prospectus and other public disclosures, have chosen to invest in this fund, which is part of the Fidelity family of funds.
Nature, Extent, and Quality of Services Provided. The Board considered Fidelity's staffing as it relates to the fund, including the backgrounds of investment personnel of FMR and the sub-advisers (together, the Investment Advisers), and also considered the fund's investment objective, strategies, and related investment philosophy. The Independent Trustees also had discussions with senior management of Fidelity's investment operations and investment groups. The Board considered the structure of the portfolio manager compensation program and whether this structure provides appropriate incentives to act in the best interests of the fund. Additionally, the Board considered the portfolio managers' investments, if any, in the funds that they manage.
Resources Dedicated to Investment Management and Support Services. The Board and the Fund Oversight and Research Committees reviewed the general qualifications and capabilities of Fidelity's investment staff, including its size, education, experience, and resources, as well as Fidelity's approach to recruiting, training, managing, and compensating investment personnel. The Board noted that Fidelity has continued to increase the resources devoted to non-U.S. offices, including expansion of Fidelity's global investment organization. The Board also noted that Fidelity's analysts have extensive resources, tools and capabilities that allow them to conduct sophisticated quantitative and fundamental analysis, as well as credit analysis of issuers, counterparties and guarantors. Further, the Board believes that Fidelity's investment professionals have sufficient access to global information and data so as to provide competitive investment results over time, and that those professionals also have access to sophisticated tools that permit them to assess portfolio construction and risk and performance attribution characteristics continuously, as well as to transmit new information and research conclusions rapidly around the world. Additionally, in its deliberations, the Board considered Fidelity's trading and risk management capabilities and resources and global compliance infrastructure, which are an integral part of the investment management process.
Annual Report
Board Approval of Investment Advisory Contracts and
Management Fees - continued
Shareholder and Administrative Services. The Board considered (i) the nature, extent, quality, and cost of advisory, administrative, and shareholder services performed by the Investment Advisers and their affiliates under the Advisory Contracts and under separate agreements covering transfer agency, pricing and bookkeeping, and securities lending services for the fund; (ii) the nature and extent of the supervision of third party service providers, principally custodians and subcustodians; and (iii) the resources devoted to, and the record of compliance with, the fund's compliance policies and procedures. The Board also reviewed the allocation of fund brokerage, including allocations to brokers affiliated with the Investment Advisers, the use of brokerage commissions to pay fund expenses, and the use of "soft" commission dollars to pay for research services.
The Board noted that the growth of fund assets over time across the complex allows Fidelity to reinvest in the development of services designed to enhance the value or convenience of the Fidelity funds as investment vehicles. These services include 24-hour access to account information and market information through telephone representatives and over the Internet, investor education materials and asset allocation tools, and the expanded availability of Fidelity Investor Centers.
In 2014, the Board formed an ad hoc Committee on Transfer Agency Fees to review the variety of transfer agency fee structures throughout the industry and Fidelity's competitive positioning with respect to industry participants.
Investment in a Large Fund Family. The Board considered the benefits to shareholders of investing in a Fidelity fund, including the benefits of investing in a fund that is part of a large family of funds offering a variety of investment disciplines and providing a large variety of mutual fund investor services. The Board noted that Fidelity had taken, or had made recommendations that resulted in the Fidelity funds taking, a number of actions over the previous year that benefited particular funds, including (i) continuing to dedicate additional resources to investment research and to the support of the senior management team that oversees asset management; (ii) persisting in efforts to enhance Fidelity's global research capabilities; (iii) launching new funds and making other enhancements to meet client needs for income-oriented solutions; (iv) reducing fund expenses for certain index funds; (v) continuing to launch dedicated lower cost underlying funds to meet portfolio construction needs related to expanding underlying fund options for Fidelity funds of funds, specifically for the Freedom Fund product lines; (vi) rationalizing product lines and gaining increased efficiencies through fund mergers; (vii) launching sector-based exchange-traded funds and establishing a new Fidelity adviser to manage sector-based funds and products; (viii) continuing to develop and implement technology to improve security and increase efficiency; (ix) modifying the eligibility criteria for certain share classes to increase their marketability to a portion of the defined contribution plan market; (x) waiving redemption fees for certain qualified fund-of-fund and wrap programs and certain retirement plan transactions; and (xi) launching new Institutional Class shares of certain money market funds to attract and retain assets and to fill a gap in the money market fund lineup.
Annual Report
Investment Performance. The Board considered whether the fund has operated in accordance with its investment objective, as well as its record of compliance with its investment restrictions and its performance history. The Board noted that there was a portfolio management change for the fund in November 2011.
The Board took into account discussions with the Investment Advisers about fund investment performance that occur at Board meetings throughout the year. In this regard the Board noted that as part of regularly scheduled fund reviews and other reports to the Board on fund performance, the Board periodically considers annualized return information for the fund, for different time periods, measured against a securities market index ("benchmark index") and a peer group of funds with similar objectives ("peer group"). In its evaluation of fund investment performance, the Board gave particular attention to information indicating changes in performance of certain Fidelity funds for specific time periods and the Investment Advisers' explanations for any overperformance or underperformance.
In addition to reviewing absolute and relative fund performance, the Independent Trustees periodically consider the appropriateness of fund performance metrics in evaluating the results achieved. In general, the Independent Trustees believe that fund performance should be evaluated based on net performance (after fees and expenses) of both the highest performing and lowest performing classes, where applicable, compared to appropriate benchmark indices, over appropriate time periods which may include full market cycles, and compared to peer groups, as applicable, over the same periods, taking into account relevant factors including the following: general market conditions; issuer-specific information; tactical opportunities for investment; and fund cash flows and other factors.
The Independent Trustees recognize that shareholders evaluate performance on a net basis over their own holding periods, for which one-, three-, and five-year periods are often used as a proxy. For this reason, the performance information reviewed by the Board also included net cumulative calendar year total return information for the fund and an appropriate benchmark index and peer group for the most recent one-, three-, and five-year periods, as shown below. Returns are shown compared to the 25th percentile (top of box, 75% beaten) and 75th percentile (bottom of box, 25% beaten) of the peer universe.
Annual Report
Board Approval of Investment Advisory Contracts and
Management Fees - continued
Fidelity Small Cap Growth Fund

The Board also considered that the fund's management fee is subject to upward or downward adjustment depending upon whether, and to what extent, the fund's investment performance for the performance period exceeds, or is exceeded by, a securities index, thus leading to a performance adjustment for the same period. The Board noted that the performance adjustment provides FMR with a strong economic incentive to seek to achieve superior performance for the fund's shareholders and helps to more closely align the interests of FMR and the fund's shareholders.
Based on its review, the Board concluded that the nature, extent, and quality of services provided to the fund under the Advisory Contracts should benefit the fund's shareholders.
Competitiveness of Management Fee and Total Expense Ratio. The Board considered the fund's management fee and total expense ratio compared to "mapped groups" of competitive funds and classes. Fidelity creates "mapped groups" by combining similar Lipper investment objective categories that have comparable investment mandates. Combining Lipper investment objective categories aids the Board's management fee and total expense ratio comparisons by broadening the competitive group used for comparison and by reducing the number of universes to which various Fidelity funds are compared.
Management Fee. The Board considered two proprietary management fee comparisons for the 12-month periods shown in the chart below. The group of Lipper funds used by the Board for management fee comparisons is referred to below as the "Total Mapped Group." The Total Mapped Group comparison focuses on a fund's standing in terms of gross management fees before expense reimbursements or caps, and without giving effect to the fund's performance adjustment, relative to the total universe of funds with comparable investment mandates, regardless of whether their management fee structures also are comparable. Funds with comparable investment mandates offer exposure to similar types of securities. Funds with comparable management fee structures have similar management fee contractual arrangements (e.g., flat rate charged for advisory services, all-inclusive fee rate, etc.). "TMG %" represents the percentage of funds in the Total Mapped Group that had management fees that were lower than the fund's. For example, a hypothetical TMG % of 20% would mean that 80% of the funds in the Total Mapped Group had higher, and 20% had lower, management fees than the fund. The fund's actual TMG %s are in the chart below. The "Asset-Size Peer Group" (ASPG) comparison focuses on a fund's standing relative to a subset of non-Fidelity funds within the Total Mapped Group that are similar in size and management fee structure. For example, if a fund is in the first quartile of the ASPG, the fund's management fee ranks in the least expensive or lowest 25% of funds in the ASPG. The ASPG represents at least 15% of the funds in the Total Mapped Group with comparable asset size and management fee structures, subject to a minimum of 50 funds (or all funds in the Total Mapped Group if fewer than 50). Additional information, such as the ASPG quartile in which the fund's management fee rate ranked and the impact of the fund's performance adjustment, is also included in the chart and considered by the Board.
Annual Report
Fidelity Small Cap Growth Fund
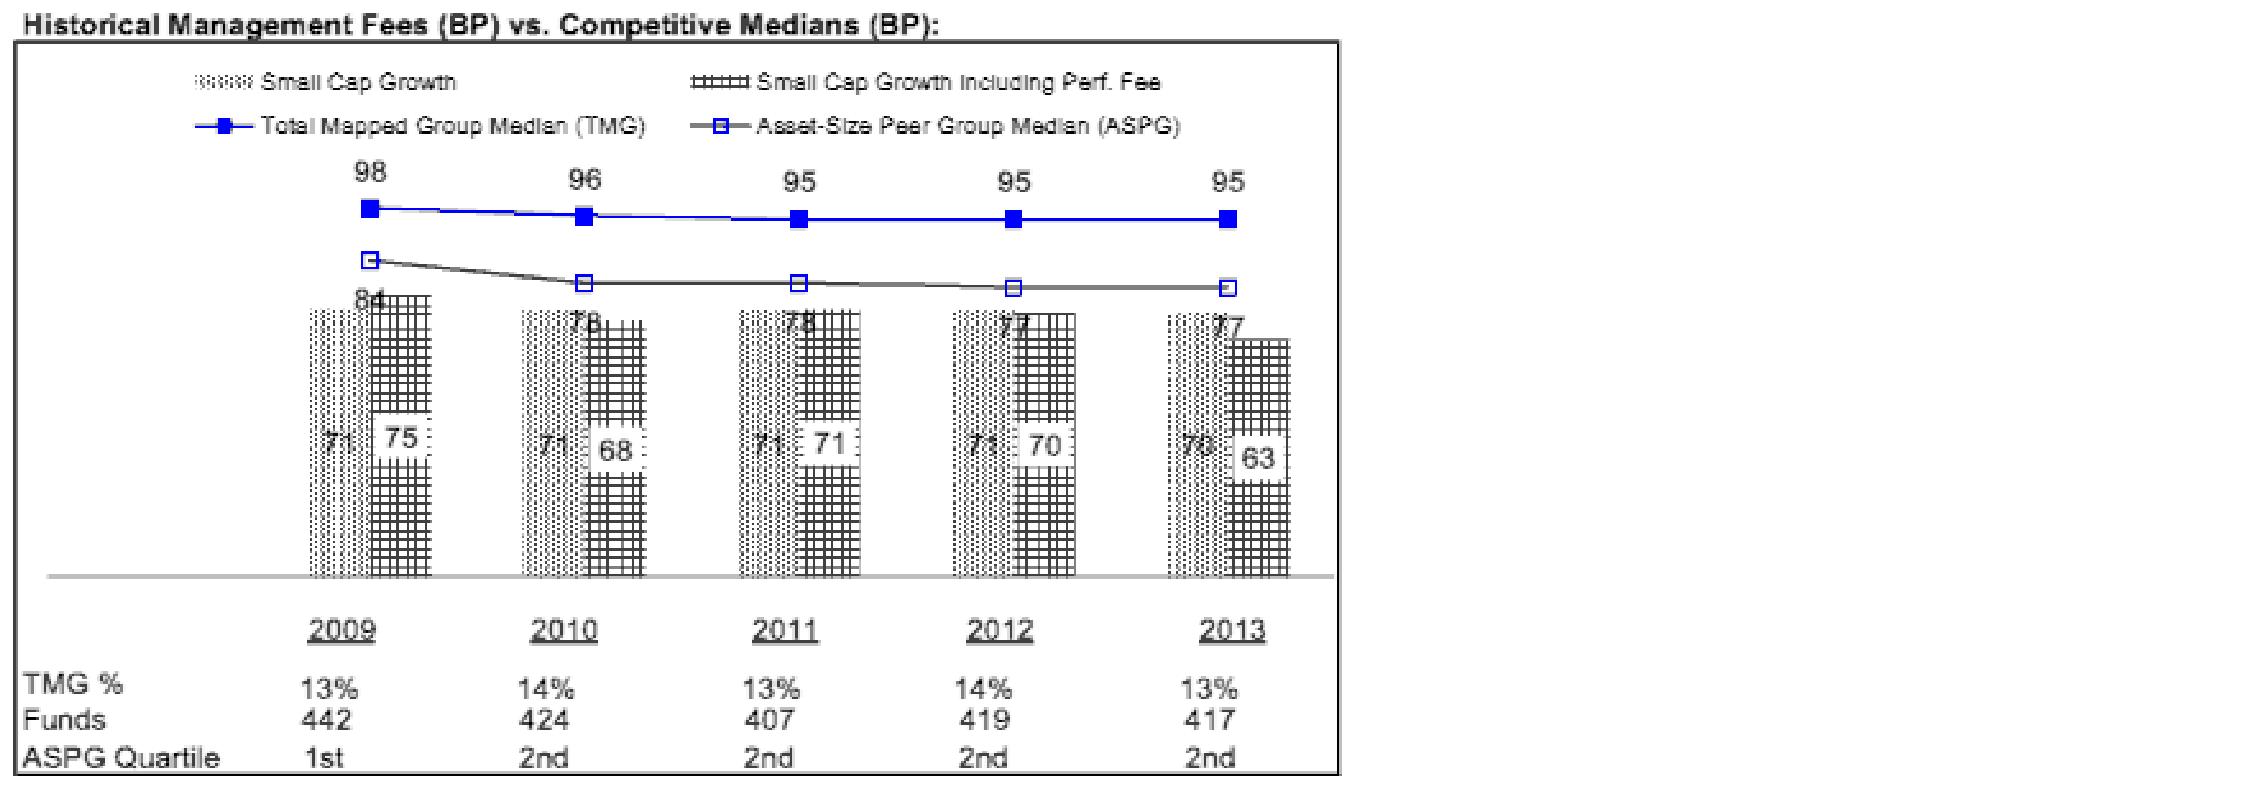
The Board noted that the fund's management fee rate ranked below the median of its Total Mapped Group and below the median of its ASPG for 2013. The Board also noted the effect of the fund's negative performance adjustment on the fund's management fee ranking.
Annual Report
Board Approval of Investment Advisory Contracts and
Management Fees - continued
The Board also noted that, in August 2013, the ad hoc Committee on Management Fees was formed to conduct an in-depth review of the management fee rates of Fidelity's active equity mutual funds. The Committee focused on the following areas: (i) standard fee structures; (ii) research consumption and trading evolution; (iii) management fee competitiveness/profitability by category; and (iv) factors that drive institutional pricing.
Based on its review, the Board concluded that the fund's management fee is fair and reasonable in light of the services that the fund receives and the other factors considered.
Total Expense Ratio. In its review of each class's total expense ratio, the Board considered the fund's management fee as well as other fund or class expenses, as applicable, such as transfer agent fees, pricing and bookkeeping fees, fund-paid 12b-1 fees, and custodial, legal, and audit fees. The Board also noted the effects of any waivers and reimbursements on fees and expenses, as well as the impact of the fund's performance adjustment. As part of its review, the Board also considered the current and historical total expense ratios of each class of the fund compared to competitive fund median expenses. Each class of the fund is compared to those funds and classes in the Total Mapped Group (used by the Board for management fee comparisons) that have a similar sales load structure.
The Board noted that the total expense ratio of each of Class A, Class B, Class C, Institutional Class, and the retail class ranked below its competitive median for 2013 and the total expense ratio of Class T ranked above its competitive median for 2013. The Board considered that, in general, various factors can affect total expense ratios. The Board noted that the total expense ratio of Class T was above the competitive median primarily because of higher 12b-1 fees on Class T as compared to most competitor funds. Class T has a higher 12b-1 fee, but a lower front-end sales charge, than traditionally priced front-end sales charge classes. The Board considered that Class T is primarily sold load-waived in the retirement plan market where its 0.50% 12b-1 fee is comparable to competing no-load, higher 12b-1 fee classes designed specifically for retirement plans. The Board noted that the fund offers multiple classes, each of which has a different sales load and 12b-1 fee structure, and that the multiple structures are intended to offer a range of pricing options for the intermediary market. The Board also noted that the total expense ratios of the classes vary primarily by the level of their 12b-1 fees, although differences in transfer agent fees may also cause expenses to vary from class to class.
Fees Charged to Other Fidelity Clients. The Board also considered Fidelity fee structures and other information with respect to clients of Fidelity, such as other funds advised or subadvised by Fidelity, pension plan clients, and other institutional clients. The Board noted the findings of the 2013 ad hoc joint committee (created with the board of other Fidelity funds), which reviewed and compared Fidelity's institutional investment advisory business with its business of providing services to the Fidelity funds, including the differences in services provided, fees charged, and costs incurred, as well as competition in their respective marketplaces.
Annual Report
Based on its review of total expense ratios and fees charged to other Fidelity clients, the Board concluded that the total expense ratio of each class of the fund was reasonable, although Class T was above the median of the universe presented for comparison, in light of the services that the fund and its shareholders receive and the other factors considered.
Costs of the Services and Profitability. The Board considered the revenues earned and the expenses incurred by Fidelity in conducting the business of developing, marketing, distributing, managing, administering and servicing the fund and servicing the fund's shareholders. The Board also considered the level of Fidelity's profits in respect of all the Fidelity funds.
On an annual basis, Fidelity presents to the Board Fidelity's profitability for the fund. Fidelity calculates the profitability for each fund, as well as aggregate profitability for groups of Fidelity funds and all Fidelity funds, using a series of detailed revenue and cost allocation methodologies which originate with the books and records of Fidelity on which Fidelity's audited financial statements are based. The Audit Committee of the Board reviews any significant changes from the prior year's methodologies.
PricewaterhouseCoopers LLP (PwC), independent registered public accounting firm and auditor to Fidelity and certain Fidelity funds, has been engaged annually by the Board as part of the Board's assessment of Fidelity's profitability analysis. PwC's engagement includes the review and assessment of the methodologies used by Fidelity in determining the revenues and expenses attributable to Fidelity's mutual fund business, and completion of agreed-upon procedures in respect of the mathematical accuracy of fund profitability and its conformity to established allocation methodologies. After considering PwC's reports issued under the engagement and information provided by Fidelity, the Board concluded that while other allocation methods may also be reasonable, Fidelity's profitability methodologies are reasonable in all material respects.
The Board also reviewed Fidelity's non-fund businesses and fall-out benefits related to the mutual fund business as well as cases where Fidelity's affiliates may benefit from or be related to the fund's business.
The Board considered the costs of the services provided by and the profits realized by Fidelity in connection with the operation of the fund and was satisfied that the profitability was not excessive in the circumstances.
Economies of Scale. The Board considered whether there have been economies of scale in respect of the management of the Fidelity funds, whether the Fidelity funds (including the fund) have appropriately benefited from any such economies of scale, and whether there is potential for realization of any further economies of scale. The Board considered the extent to which the fund will benefit from economies of scale through increased services to the fund, through waivers or reimbursements, or through fee or expense ratio reductions. The Board also noted that in 2013, it and the boards of other Fidelity funds created an ad hoc committee (the Economies of Scale Committee) to analyze whether Fidelity attains economies of scale in respect of the management and servicing of the Fidelity funds, whether the Fidelity funds have appropriately benefited from such economies of scale, and whether there is potential for realization of any further economies of scale.
Annual Report
Board Approval of Investment Advisory Contracts and
Management Fees - continued
The Board recognized that the fund's management contract incorporates a "group fee" structure, which provides for lower group fee rates as total group assets increase, and for higher group fee rates as total group assets decrease (with "group assets" defined to include fund assets under FMR's management plus sector fund assets previously under FMR's management and currently managed by Fidelity SelectCo, LLC). FMR calculates the group fee rates based on a tiered asset "breakpoint" schedule that varies based on asset class. The Board considered that the group fee is designed to deliver the benefits of economies of scale to fund shareholders when total Fidelity fund assets increase, even if assets of any particular fund are unchanged or have declined, because some portion of Fidelity's costs are attributable to services provided to all Fidelity funds, and all funds benefit if those costs can be allocated among more assets. The Board concluded that, given the group fee structure, fund shareholders will benefit from lower management fees as group assets increase at the fund complex level, regardless of whether Fidelity achieves any such economies of scale.
The Board concluded, taking into account the analysis of the Economies of Scale Committee, that economies of scale, if any, are being appropriately shared between fund shareholders and Fidelity.
Additional Information Requested by the Board. In order to develop fully the factual basis for consideration of the Fidelity funds' Advisory Contracts, the Board requested and received additional information on certain topics, including: (i) fund performance trends and Fidelity's long-term strategies for certain funds; (ii) Fidelity's strategic marketing and product lineup goals; (iii) the methodology with respect to competitive fund data and peer group classifications; (iv) the arrangements with, and performance of, certain sub-advisers on behalf of the Fidelity funds, as well as certain proposed participating affiliate arrangements; (v) the realization of fall-out benefits in certain Fidelity business units; (vi) Fidelity's group fee structures, including the rationale for the individual fee rates of certain categories of funds and the definition of group assets; (vii) trends regarding industry use of performance fee structures and the performance adjustment methodologies applicable to the Fidelity funds; (viii) additional competitive analysis regarding the total expenses for certain classes; (ix) fund profitability methodology, including Fidelity's cost allocation methodology, and the impact of certain factors on fund profitability results; and (x) the process by which Fidelity determines sub-advisory fees for funds it advises.
Annual Report
Based on its evaluation of all of the conclusions noted above, and after considering all factors it believed relevant, the Board ultimately concluded that the advisory fee structures are fair and reasonable, and that the fund's Advisory Contracts should be renewed.
Annual Report
Investment Adviser
Fidelity Management & Research Company
Boston, MA
Investment Sub-Advisers
FMR Co., Inc.
Fidelity Management & Research
(U.K.) Inc.
Fidelity Management & Research
(Hong Kong) Limited
Fidelity Management & Research
(Japan) Inc.
General Distributor
Fidelity Distributors Corporation
Smithfield, RI
Transfer and Service Agents
Fidelity Investments Institutional
Operations Company, Inc.
Boston, MA
Fidelity Service Company, Inc.
Boston, MA
Custodian
Citibank, N.A.
New York, NY
(Fidelity Investment logo)(registered trademark)
ASCPI-UANN-0914
1.803721.109
Fidelity®
Small Cap Growth
Fund
Annual Report
July 31, 2014
(Fidelity Cover Art)
Contents
Performance | (Click Here) | How the fund has done over time. |
Management's Discussion of Fund Performance | (Click Here) | The Portfolio Manager's review of fund performance and strategy. |
Shareholder Expense Example | (Click Here) | An example of shareholder expenses. |
Investment Changes | (Click Here) | A summary of major shifts in the fund's investments over the past six months. |
Investments | (Click Here) | A complete list of the fund's investments with their market values. |
Financial Statements | (Click Here) | Statements of assets and liabilities, operations, and changes in net assets, as well as financial highlights. |
Notes | (Click Here) | Notes to the financial statements. |
Report of Independent Registered Public Accounting Firm | (Click Here) | |
Trustees and Officers | (Click Here) | |
Distributions | (Click Here) | |
Board Approval of Investment Advisory Contracts and Management Fees | (Click Here) | |
To view a fund's proxy voting guidelines and proxy voting record for the 12-month period ended June 30, visit http://www.fidelity.com/proxyvotingresults or visit the Securities and Exchange Commission's (SEC) web site at http://www.sec.gov. You may also call 1-800-544-8544 to request a free copy of the proxy voting guidelines.
Standard & Poor's, S&P and S&P 500 are registered service marks of The McGraw-Hill Companies, Inc. and have been licensed for use by Fidelity Distributors Corporation.
Other third-party marks appearing herein are the property of their respective owners.
All other marks appearing herein are registered or unregistered trademarks or service marks of FMR LLC or an affiliated company. © 2014 FMR LLC. All rights reserved.
Annual Report
This report and the financial statements contained herein are submitted for the general information of the shareholders of the fund. This report is not authorized for distribution to prospective investors in the fund unless preceded or accompanied by an effective prospectus.
A fund files its complete schedule of portfolio holdings with the SEC for the first and third quarters of each fiscal year on Form N-Q. Forms N-Q are available on the SEC's web site at http://www.sec.gov. A fund's Forms N-Q may be reviewed and copied at the SEC's Public Reference Room in Washington, DC. Information regarding the operation of the SEC's Public Reference Room may be obtained by calling 1-800-SEC-0330. For a complete list of a fund's portfolio holdings, view the most recent holdings listing, semiannual report, or annual report on Fidelity's web site at http://www.fidelity.com, http://www.advisor.fidelity.com, or http://www.401k.com, as applicable.
NOT FDIC INSURED • MAY LOSE VALUE • NO BANK GUARANTEE
Neither the fund nor Fidelity Distributors Corporation is a bank.
Annual Report
Average annual total return reflects the change in the value of an investment, assuming reinvestment of the class' distributions from dividend income and capital gains (the profits earned upon the sale of securities that have grown in value, if any) and assuming a constant rate of performance each year. The $10,000 table and the fund's returns do not reflect the deduction of taxes that a shareholder would pay on fund distributions or the redemption of fund shares. During periods of reimbursement by Fidelity, a fund's total return will be greater than it would be had the reimbursement not occurred. How a fund did yesterday is no guarantee of how it will do tomorrow.
Average Annual Total Returns
Periods ended July 31, 2014 | Past 1
year | Past 5
years | Life of
fund A |
Fidelity® Small Cap Growth Fund | 8.87% | 17.01% | 10.35% |
A From November 3, 2004.
$10,000 Over Life of Fund
Let's say hypothetically that $10,000 was invested in Fidelity® Small Cap Growth Fund, a class of the fund, on November 3, 2004, when the fund started. The chart shows how the value of your investment would have changed, and also shows how the Russell 2000® Growth Index performed over the same period.
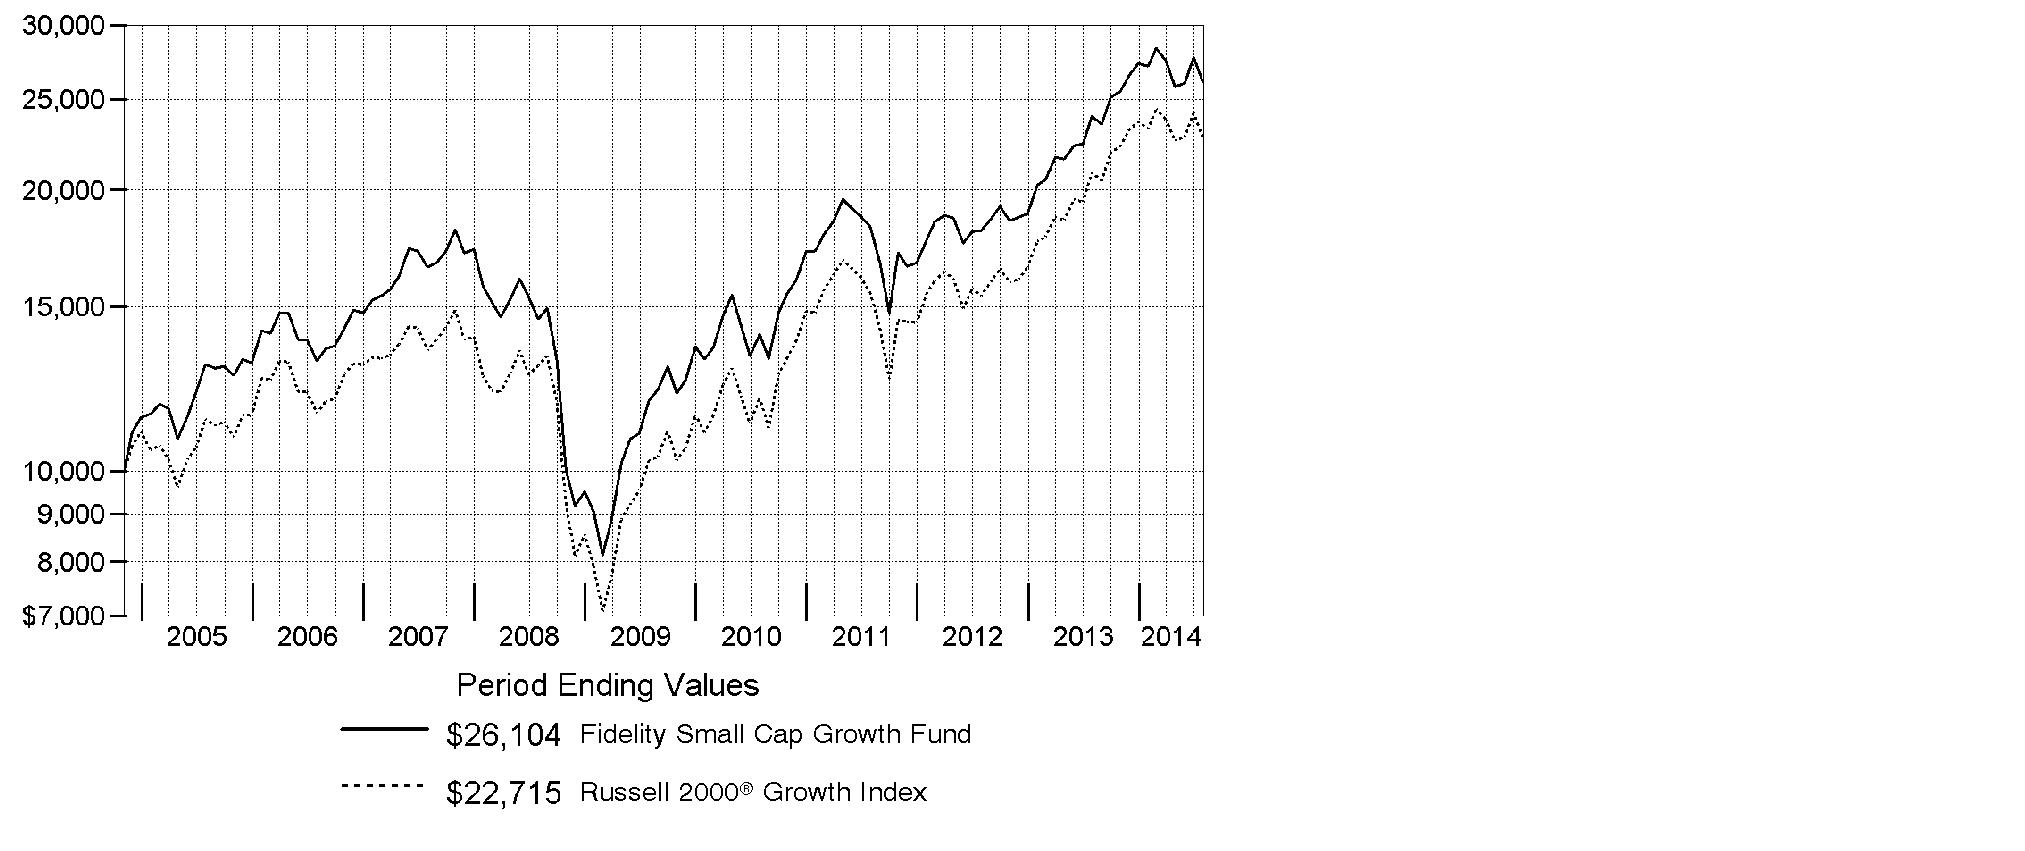
Annual Report
Market Recap: U.S. stocks overcame a slowing economy early in 2014 to post a strong gain for the 12-month period ending July 31, 2014, supported by corporate profits and continued low interest rates. The S&P 500® Index rose 16.94%, reaching an all-time high near period end. The technology-heavy Nasdaq Composite Index® gained 22.00%. The Russell 2000® Index returned 8.56%, reflecting the relatively lackluster performance of small-cap stocks. Information technology (+28%) was the top-performing sector within the S&P 500®, driven by strong semiconductor and computer hardware sales. Materials (+23%) gained amid higher prices for many commodity products. Health care (+21%) rose, driven by gains in pharmaceuticals, biotechnology & life sciences companies. Energy stocks (+19%) advanced in the latter part of the period amid healthy U.S. output and the threat of supply disruptions in Iraq. Conversely, most defensive sectors, including consumer staples, utilities and telecommunication services, lagged the broader market. Volatility remained tame throughout most of the period, with markets supported by declining unemployment, near-record profit margins for companies, muted cost inflation and fairly low corporate debt levels. Geopolitical tension remained a concern at period end, with conflict in Ukraine and strained relations between Russia and the West posing a potential threat to global growth.
Comments from Patrick Venanzi Portfolio Manager of Fidelity® Small Cap Growth Fund: For the year, the fund's Retail Class shares rose 8.87%, performing in line with the 8.93% gain of the Russell 2000® Growth Index. Relative to the index, the fund's top individual contributor was bioprocessing firm Repligen, a position I established during the period. Repligen has a terrific competitive position in several consumable products used to manufacture biologics, a class of drugs that I see as well-poised to outgrow the overall pharmaceuticals industry for years to come. Elsewhere, shares of Spirit Airlines rose more than 90% the past year, and our large overweighting helped results. I still like the story behind Spirit, but I nevertheless reduced our position as the stock climbed. Apparel retailer G-III Apparel Group also added value, as the company's shares gained on management's excellent execution in new categories, as well as the extremely cold weather. Conversely, BioScrip, a provider of home infusion services whereby patients can receive intravenous drugs without a visit to the hospital, was our largest individual detractor. The stock stumbled as the firm encountered challenges integrating two recent acquisitions, and I sold our stake. The fund also suffered by underweighting or not owning two stocks in the benchmark that did particularly well, Puma Biotechnology and solar panel manufacturer SunEdison, respectively.
The views expressed above reflect those of the portfolio manager(s) only through the end of the period as stated on the cover of this report and do not necessarily represent the views of Fidelity or any other person in the Fidelity organization. Any such views are subject to change at any time based upon market or other conditions and Fidelity disclaims any responsibility to update such views. These views may not be relied on as investment advice and, because investment decisions for a Fidelity fund are based on numerous factors, may not be relied on as an indication of trading intent on behalf of any Fidelity fund.
Annual Report
Shareholder Expense Example
As a shareholder of the Fund, you incur two types of costs: (1) transaction costs, including sales charges (loads) on purchase payments or redemption proceeds, redemption fees and (2) ongoing costs, including management fees, distribution and/or service (12b-1) fees and other Fund expenses. This Example is intended to help you understand your ongoing costs (in dollars) of investing in the Fund and to compare these costs with the ongoing costs of investing in other mutual funds.
The Example is based on an investment of $1,000 invested at the beginning of the period and held for the entire period (February 1, 2014 to July 31, 2014).
Actual Expenses
The first line of the accompanying table for each class of the Fund provides information about actual account values and actual expenses. You may use the information in this line, together with the amount you invested, to estimate the expenses that you paid over the period. Simply divide your account value by $1,000.00 (for example, an $8,600 account value divided by $1,000.00 = 8.6), then multiply the result by the number in the first line for a class of the Fund under the heading entitled "Expenses Paid During Period" to estimate the expenses you paid on your account during this period. A small balance maintenance fee of $12.00 that is charged once a year may apply for certain accounts with a value of less than $2,000. This fee is not included in the table below. If it was, the estimate of expenses you paid during the period would be higher, and your ending account value lower, by this amount. In addition, the Fund, as a shareholder in the underlying Fidelity Central Funds, will indirectly bear its pro-rata share of the fees and expenses incurred by the underlying Fidelity Central Funds. These fees and expenses are not included in the Fund's annualized expense ratio used to calculate the expense estimate in the table below.
Hypothetical Example for Comparison Purposes
The second line of the accompanying table for each class of the Fund provides information about hypothetical account values and hypothetical expenses based on a Class' actual expense ratio and an assumed rate of return of 5% per year before expenses, which is not the Class' actual return. The hypothetical account values and expenses may not be used to estimate the actual ending account balance or expenses you paid for the period. You may use this information to compare the ongoing costs of investing in the Fund and other funds. To do so, compare this 5% hypothetical example with the 5% hypothetical examples that appear in the shareholder reports of the other funds. A small balance maintenance fee of $12.00 that is charged once a year may apply for certain accounts with a value of less than $2,000. This fee is not included in the table below. If it was, the estimate of expenses you paid during the period would be higher, and your ending account value lower, by this amount. In addition, the Fund, as a shareholder in the underlying Fidelity Central Funds, will indirectly bear its pro-rata share of the fees and expenses incurred by the underlying Fidelity Central Funds. These fees and expenses are not included in the Fund's annualized expense ratio used to calculate the expense estimate in the table below.
Please note that the expenses shown in the table are meant to highlight your ongoing costs only and do not reflect any transaction costs. Therefore, the second line of the table is useful in comparing ongoing costs only, and will not help you determine the relative total costs of owning different funds. In addition, if these transactional costs were included, your costs would have been higher.
Annual Report
| Annualized
Expense Ratio B | Beginning
Account Value
February 1, 2014 | Ending
Account Value
July 31, 2014 | Expenses Paid
During Period*
February 1, 2014
to July 31, 2014 |
Class A | 1.23% | | | |
Actual | | $ 1,000.00 | $ 961.50 | $ 5.98 |
HypotheticalA | | $ 1,000.00 | $ 1,018.70 | $ 6.16 |
Class T | 1.51% | | | |
Actual | | $ 1,000.00 | $ 960.30 | $ 7.34 |
HypotheticalA | | $ 1,000.00 | $ 1,017.31 | $ 7.55 |
Class B | 2.03% | | | |
Actual | | $ 1,000.00 | $ 958.00 | $ 9.86 |
HypotheticalA | | $ 1,000.00 | $ 1,014.73 | $ 10.14 |
Class C | 2.02% | | | |
Actual | | $ 1,000.00 | $ 957.80 | $ 9.81 |
HypotheticalA | | $ 1,000.00 | $ 1,014.78 | $ 10.09 |
Small Cap Growth | .93% | | | |
Actual | | $ 1,000.00 | $ 962.90 | $ 4.53 |
HypotheticalA | | $ 1,000.00 | $ 1,020.18 | $ 4.66 |
Institutional Class | .94% | | | |
Actual | | $ 1,000.00 | $ 963.00 | $ 4.58 |
HypotheticalA | | $ 1,000.00 | $ 1,020.13 | $ 4.71 |
A 5% return per year before expenses
B Annualized expense ratio reflects expenses net of applicable fee waivers.
* Expenses are equal to each Class' annualized expense ratio, multiplied by the average account value over the period, multiplied by 181/365 (to reflect the one-half year period).
Annual Report
Investment Changes (Unaudited)
Top Ten Stocks as of July 31, 2014 |
| % of fund's
net assets | % of fund's net assets
6 months ago |
Team Health Holdings, Inc. | 2.0 | 0.0 |
KAR Auction Services, Inc. | 1.5 | 1.2 |
Hub Group, Inc. Class A | 1.5 | 0.0 |
G-III Apparel Group Ltd. | 1.5 | 1.0 |
Teledyne Technologies, Inc. | 1.4 | 0.8 |
Huron Consulting Group, Inc. | 1.4 | 1.1 |
Graphic Packaging Holding Co. | 1.4 | 0.9 |
Service Corp. International | 1.3 | 1.0 |
PolyOne Corp. | 1.3 | 0.0 |
Global Payments, Inc. | 1.3 | 0.7 |
| 14.6 | |
Top Five Market Sectors as of July 31, 2014 |
| % of fund's
net assets | % of fund's net assets
6 months ago |
Information Technology | 22.7 | 23.9 |
Health Care | 21.8 | 20.2 |
Industrials | 16.0 | 15.9 |
Consumer Discretionary | 13.5 | 13.5 |
Financials | 6.8 | 8.4 |
Asset Allocation (% of fund's net assets) |
As of July 31, 2014* | As of January 31, 2014** |
| Stocks 98.0% | | | Stocks and
Equity Futures 97.4% | |
| Short-Term
Investments and
Net Other Assets
(Liabilities) 2.0% | | | Short-Term
Investments and
Net Other Assets
(Liabilities) 2.6% | |
* Foreign investments | 5.8% | | ** Foreign investments | 5.0% | |

Annual Report
Investments July 31, 2014
Showing Percentage of Net Assets
Common Stocks - 98.0% |
| Shares | | Value |
CONSUMER DISCRETIONARY - 13.5% |
Auto Components - 2.9% |
Standard Motor Products, Inc. | 265,717 | | $ 9,579,098 |
Tenneco, Inc. (a) | 220,300 | | 14,033,110 |
Visteon Corp. (a) | 145,000 | | 13,847,500 |
| | 37,459,708 |
Diversified Consumer Services - 1.3% |
Service Corp. International | 820,300 | | 17,226,300 |
Household Durables - 0.8% |
Universal Electronics, Inc. (a) | 230,114 | | 10,960,330 |
Internet & Catalog Retail - 0.6% |
HomeAway, Inc. (a) | 240,000 | | 8,332,800 |
Leisure Products - 1.7% |
Brunswick Corp. | 252,600 | | 10,187,358 |
Malibu Boats, Inc. Class A (a) | 590,000 | | 11,357,500 |
| | 21,544,858 |
Media - 0.9% |
Cablevision Systems Corp. - NY Group Class A | 200,000 | | 3,844,000 |
Live Nation Entertainment, Inc. (a) | 350,000 | | 8,123,500 |
| | 11,967,500 |
Multiline Retail - 1.6% |
Burlington Stores, Inc. | 170,000 | | 5,564,100 |
Dillard's, Inc. Class A | 100,000 | | 11,922,000 |
Tuesday Morning Corp. (a) | 163,789 | | 2,695,967 |
| | 20,182,067 |
Textiles, Apparel & Luxury Goods - 3.7% |
G-III Apparel Group Ltd. (a) | 245,300 | | 19,052,451 |
Iconix Brand Group, Inc. (a) | 223,800 | | 9,451,074 |
Steven Madden Ltd. (a) | 283,000 | | 9,013,550 |
Vera Bradley, Inc. (a) | 500,000 | | 9,915,000 |
| | 47,432,075 |
TOTAL CONSUMER DISCRETIONARY | | 175,105,638 |
CONSUMER STAPLES - 4.0% |
Food Products - 1.5% |
Darling International, Inc. (a) | 600,000 | | 11,232,000 |
Ingredion, Inc. | 100,000 | | 7,363,000 |
| | 18,595,000 |
Common Stocks - continued |
| Shares | | Value |
CONSUMER STAPLES - continued |
Household Products - 1.2% |
Spectrum Brands Holdings, Inc. | 190,000 | | $ 15,846,000 |
Personal Products - 1.3% |
Inter Parfums, Inc. | 276,185 | | 7,216,714 |
MediFast, Inc. (a) | 350,000 | | 10,048,500 |
| | 17,265,214 |
TOTAL CONSUMER STAPLES | | 51,706,214 |
ENERGY - 4.8% |
Energy Equipment & Services - 1.3% |
Dril-Quip, Inc. (a) | 59,900 | | 6,036,123 |
Xtreme Drilling & Coil Services Corp. (a) | 2,541,700 | | 11,095,971 |
| | 17,132,094 |
Oil, Gas & Consumable Fuels - 3.5% |
Golar LNG Ltd. (d) | 140,000 | | 8,625,400 |
MPLX LP | 161,157 | | 9,145,660 |
Phillips 66 Partners LP | 171,525 | | 10,969,024 |
StealthGas, Inc. (a) | 600,000 | | 6,420,000 |
Valero Energy Partners LP | 210,000 | | 9,760,800 |
| | 44,920,884 |
TOTAL ENERGY | | 62,052,978 |
FINANCIALS - 6.8% |
Banks - 2.5% |
Banner Bank | 110,284 | | 4,437,828 |
Investors Bancorp, Inc. | 1,100,000 | | 11,385,000 |
Lakeland Financial Corp. | 203,700 | | 7,412,643 |
Pacific Premier Bancorp, Inc. (a) | 648,586 | | 9,274,780 |
| | 32,510,251 |
Capital Markets - 1.7% |
E*TRADE Financial Corp. (a) | 310,200 | | 6,520,404 |
FXCM, Inc. Class A (d) | 311,264 | | 4,239,416 |
Lazard Ltd. Class A | 215,000 | | 11,244,500 |
| | 22,004,320 |
Consumer Finance - 0.5% |
Portfolio Recovery Associates, Inc. (a) | 100,000 | | 5,896,000 |
Common Stocks - continued |
| Shares | | Value |
FINANCIALS - continued |
Insurance - 1.2% |
Amerisafe, Inc. | 106,448 | | $ 3,895,997 |
Primerica, Inc. | 264,219 | | 12,175,212 |
| | 16,071,209 |
Thrifts & Mortgage Finance - 0.9% |
Meridian Bancorp, Inc. (a) | 1,101,780 | | 11,965,331 |
TOTAL FINANCIALS | | 88,447,111 |
HEALTH CARE - 21.8% |
Biotechnology - 9.0% |
BioCryst Pharmaceuticals, Inc. (a) | 500,000 | | 6,260,000 |
Celldex Therapeutics, Inc. (a)(d) | 293,400 | | 3,840,606 |
Chimerix, Inc. (a) | 210,100 | | 4,773,472 |
Cubist Pharmaceuticals, Inc. | 41,262 | | 2,512,856 |
Dyax Corp. (a) | 650,000 | | 6,123,000 |
Exact Sciences Corp. (a)(d) | 731,705 | | 11,421,915 |
Genomic Health, Inc. (a)(d) | 225,288 | | 5,740,338 |
Hyperion Therapeutics, Inc. (a) | 121,500 | | 2,766,555 |
Insmed, Inc. (a) | 223,400 | | 3,817,906 |
Intercept Pharmaceuticals, Inc. (a) | 30,600 | | 7,110,216 |
Isis Pharmaceuticals, Inc. (a) | 224,457 | | 6,955,922 |
Lion Biotechnologies, Inc. (a) | 300,000 | | 2,145,000 |
Medivation, Inc. (a) | 64,800 | | 4,810,104 |
Mirati Therapeutics, Inc. (a) | 170,820 | | 3,103,799 |
Novavax, Inc. (a) | 1,218,200 | | 5,274,806 |
Puma Biotechnology, Inc. (a) | 36,600 | | 8,114,952 |
Receptos, Inc. (a) | 81,069 | | 3,357,067 |
Repligen Corp. (a) | 490,000 | | 10,275,300 |
Stemline Therapeutics, Inc. (a) | 104,500 | | 1,338,645 |
Sunesis Pharmaceuticals, Inc. (a)(d) | 550,600 | | 3,622,948 |
Synageva BioPharma Corp. (a)(d) | 109,200 | | 7,470,372 |
Threshold Pharmaceuticals, Inc. (a)(d) | 604,453 | | 2,544,747 |
XOMA Corp. (a) | 800,400 | | 3,105,552 |
| | 116,486,078 |
Health Care Equipment & Supplies - 4.0% |
Accuray, Inc. (a)(d) | 600,000 | | 4,722,000 |
DexCom, Inc. (a) | 100,000 | | 3,768,000 |
Greatbatch, Inc. (a) | 61,615 | | 3,050,559 |
Ldr Holding Corp. | 475,000 | | 10,882,250 |
Novadaq Technologies, Inc. (a) | 576,300 | | 8,840,442 |
Common Stocks - continued |
| Shares | | Value |
HEALTH CARE - continued |
Health Care Equipment & Supplies - continued |
NxStage Medical, Inc. (a) | 300,000 | | $ 4,005,000 |
Quidel Corp. (a)(d) | 113,800 | | 2,716,406 |
Steris Corp. | 281,400 | | 14,317,632 |
| | 52,302,289 |
Health Care Providers & Services - 4.9% |
Accretive Health, Inc. (a) | 1,137,226 | | 9,575,443 |
LifePoint Hospitals, Inc. (a) | 80,000 | | 5,737,600 |
Omnicare, Inc. | 190,000 | | 11,875,000 |
Select Medical Holdings Corp. | 400,000 | | 6,216,000 |
Team Health Holdings, Inc. (a) | 454,400 | | 25,696,318 |
Wellcare Health Plans, Inc. (a) | 65,937 | | 4,113,150 |
| | 63,213,511 |
Health Care Technology - 1.3% |
athenahealth, Inc. (a)(d) | 45,000 | | 5,598,000 |
MedAssets, Inc. (a) | 530,000 | | 11,257,200 |
| | 16,855,200 |
Life Sciences Tools & Services - 2.4% |
Bruker BioSciences Corp. (a) | 323,700 | | 7,357,701 |
Fluidigm Corp. (a) | 246,000 | | 7,042,980 |
ICON PLC (a) | 190,000 | | 9,842,000 |
Techne Corp. | 78,888 | | 7,361,828 |
| | 31,604,509 |
Pharmaceuticals - 0.2% |
Flamel Technologies SA sponsored ADR (a) | 212,002 | | 2,825,987 |
TOTAL HEALTH CARE | | 283,287,574 |
INDUSTRIALS - 16.0% |
Aerospace & Defense - 2.4% |
Esterline Technologies Corp. (a) | 120,000 | | 13,026,000 |
Teledyne Technologies, Inc. (a) | 197,700 | | 18,030,240 |
| | 31,056,240 |
Air Freight & Logistics - 1.6% |
Hub Group, Inc. Class A (a) | 425,000 | | 19,626,500 |
Park-Ohio Holdings Corp. | 21,154 | | 1,255,701 |
| | 20,882,201 |
Airlines - 1.1% |
Spirit Airlines, Inc. (a) | 214,500 | | 14,032,590 |
Common Stocks - continued |
| Shares | | Value |
INDUSTRIALS - continued |
Commercial Services & Supplies - 2.5% |
KAR Auction Services, Inc. | 691,900 | | $ 20,279,589 |
Msa Safety, Inc. | 145,979 | | 7,558,793 |
Multi-Color Corp. | 131,853 | | 5,191,053 |
| | 33,029,435 |
Electrical Equipment - 0.3% |
AZZ, Inc. | 100,000 | | 4,364,000 |
Machinery - 5.5% |
Allison Transmission Holdings, Inc. | 530,000 | | 15,518,400 |
Crane Co. | 160,000 | | 10,977,600 |
ITT Corp. | 213,812 | | 9,828,938 |
Luxfer Holdings PLC sponsored ADR | 413,066 | | 7,852,385 |
Manitowoc Co., Inc. | 260,000 | | 6,905,600 |
NN, Inc. | 36,870 | | 1,069,230 |
Superior Drilling Products, Inc. (e) | 1,294,115 | | 8,049,395 |
Valmont Industries, Inc. | 50,000 | | 7,281,500 |
Woodward, Inc. | 70,216 | | 3,507,991 |
| | 70,991,039 |
Professional Services - 2.3% |
CBIZ, Inc. (a) | 1,469,100 | | 11,987,856 |
Huron Consulting Group, Inc. (a) | 286,700 | | 17,328,148 |
| | 29,316,004 |
Road & Rail - 0.3% |
Marten Transport Ltd. | 159,359 | | 3,225,426 |
TOTAL INDUSTRIALS | | 206,896,935 |
INFORMATION TECHNOLOGY - 22.7% |
Communications Equipment - 0.3% |
Plantronics, Inc. | 100,000 | | 4,697,000 |
Electronic Equipment & Components - 2.3% |
CDW Corp. | 280,000 | | 8,649,200 |
Ingram Micro, Inc. Class A (a) | 480,000 | | 13,776,000 |
Neonode, Inc. (a)(d) | 848,022 | | 2,306,620 |
RealD, Inc. (a) | 442,300 | | 4,675,111 |
| | 29,406,931 |
Internet Software & Services - 4.6% |
comScore, Inc. (a) | 290,641 | | 10,518,298 |
Cvent, Inc. (d) | 387,646 | | 10,586,612 |
Demandware, Inc. (a)(d) | 134,984 | | 8,131,436 |
Common Stocks - continued |
| Shares | | Value |
INFORMATION TECHNOLOGY - continued |
Internet Software & Services - continued |
E2open, Inc. (a)(d) | 657,094 | | $ 10,631,781 |
NIC, Inc. | 358,940 | | 6,055,318 |
Perficient, Inc. (a) | 99,910 | | 1,697,471 |
Stamps.com, Inc. (a) | 383,796 | | 12,139,467 |
| | 59,760,383 |
IT Services - 4.7% |
Computer Sciences Corp. | 180,000 | | 11,230,200 |
EVERTEC, Inc. | 389,400 | | 8,706,984 |
Global Payments, Inc. | 240,500 | | 16,659,435 |
Maximus, Inc. | 206,900 | | 8,557,384 |
Sapient Corp. (a) | 797,200 | | 11,766,672 |
Sykes Enterprises, Inc. (a) | 176,953 | | 3,662,927 |
| | 60,583,602 |
Semiconductors & Semiconductor Equipment - 3.7% |
Integrated Silicon Solution, Inc. | 513,994 | | 7,514,592 |
MKS Instruments, Inc. | 170,000 | | 5,402,600 |
Monolithic Power Systems, Inc. | 269,900 | | 11,130,676 |
PDF Solutions, Inc. (a) | 631,672 | | 12,102,836 |
Tessera Technologies, Inc. | 450,000 | | 11,434,500 |
| | 47,585,204 |
Software - 5.6% |
Aspen Technology, Inc. (a) | 373,100 | | 16,207,464 |
Cadence Design Systems, Inc. (a) | 700,000 | | 11,781,000 |
Evolving Systems, Inc. | 300,000 | | 2,964,000 |
Interactive Intelligence Group, Inc. (a) | 364,733 | | 16,547,936 |
Rovi Corp. (a) | 430,000 | | 10,049,100 |
SS&C Technologies Holdings, Inc. (a) | 243,600 | | 10,550,316 |
Vasco Data Security International, Inc. (a) | 189,366 | | 2,569,697 |
Verint Systems, Inc. (a) | 36,660 | | 1,720,820 |
| | 72,390,333 |
Technology Hardware, Storage & Peripherals - 1.5% |
Electronics for Imaging, Inc. (a) | 375,100 | | 16,530,657 |
Immersion Corp. (a) | 253,470 | | 3,459,866 |
| | 19,990,523 |
TOTAL INFORMATION TECHNOLOGY | | 294,413,976 |
Common Stocks - continued |
| Shares | | Value |
MATERIALS - 6.0% |
Chemicals - 2.7% |
Cabot Corp. | 147,146 | | $ 7,708,979 |
Cytec Industries, Inc. | 100,000 | | 10,085,000 |
PolyOne Corp. | 450,000 | | 17,077,500 |
| | 34,871,479 |
Construction Materials - 0.9% |
Eagle Materials, Inc. | 133,168 | | 12,094,318 |
Containers & Packaging - 2.4% |
Graphic Packaging Holding Co. (a) | 1,443,700 | | 17,324,400 |
Silgan Holdings, Inc. | 265,552 | | 13,070,469 |
| | 30,394,869 |
TOTAL MATERIALS | | 77,360,666 |
TELECOMMUNICATION SERVICES - 1.9% |
Diversified Telecommunication Services - 1.9% |
Cogent Communications Group, Inc. | 400,000 | | 13,884,000 |
inContact, Inc. (a) | 1,300,000 | | 10,387,000 |
| | 24,271,000 |
UTILITIES - 0.5% |
Independent Power and Renewable Electricity Producers - 0.5% |
NextEra Energy Partners LP | 206,500 | | 7,029,260 |
TOTAL COMMON STOCKS (Cost $1,189,621,783) |
1,270,571,352
|
Money Market Funds - 3.9% |
| Shares | | Value |
Fidelity Cash Central Fund, 0.11% (b) | 4,831,978 | | 4,831,978 |
Fidelity Securities Lending Cash Central Fund, 0.11% (b)(c) | 45,930,575 | | 45,930,575 |
TOTAL MONEY MARKET FUNDS (Cost $50,762,553) |
50,762,553
|
TOTAL INVESTMENT PORTFOLIO - 101.9% (Cost $1,240,384,336) | | 1,321,333,905 |
NET OTHER ASSETS (LIABILITIES) - (1.9)% | | (24,235,291) |
NET ASSETS - 100% | $ 1,297,098,614 |
Legend |
(a) Non-income producing |
(b) Affiliated fund that is generally available only to investment companies and other accounts managed by Fidelity Investments. The rate quoted is the annualized seven-day yield of the fund at period end. A complete unaudited listing of the fund's holdings as of its most recent quarter end is available upon request. In addition, each Fidelity Central Fund's financial statements, which are not covered by the Fund's Report of Independent Registered Public Accounting Firm, are available on the SEC's website or upon request. |
(c) Investment made with cash collateral received from securities on loan. |
(d) Security or a portion of the security is on loan at period end. |
(e) Affiliated company |
Affiliated Central Funds |
Information regarding fiscal year to date income earned by the Fund from investments in Fidelity Central Funds is as follows: |
Fund | Income earned |
Fidelity Cash Central Fund | $ 41,667 |
Fidelity Securities Lending Cash Central Fund | 1,724,148 |
Total | $ 1,765,815 |
Other Affiliated Issuers |
An affiliated company is a company in which the Fund has ownership of at least 5% of the voting securities. Fiscal year to date transactions with companies which are or were affiliates are as follows: |
Affiliate | Value,
beginning of
period | Purchases | Sales
Proceeds | Dividend
Income | Value,
end of
period |
Parametric Sound Corp. | $ 11,382,447 | $ - | $ 9,334,036* | $ - | $ - |
Superior Drilling Products, Inc. | - | 5,573,300 | - | - | 8,049,395 |
Xtreme Drilling & Coil Services Corp. | 14,769,740 | 7,453,947 | 13,187,684* | - | - |
Zedi, Inc. | 4,053,675 | - | 4,333,432 | - | - |
Total | $ 30,205,862 | $ 13,027,247 | $ 26,855,152 | $ - | $ 8,049,395 |
* Includes the value of securities delivered through in-kind transactions.
See accompanying notes which are an integral part of the financial statements.
Annual Report
Other Information |
All investments are categorized as Level 1 under the Fair Value Hierarchy. The inputs or methodology used for valuing securities may not be an indication of the risk associated with investing in those securities. For more information on valuation inputs, please refer to the Investment Valuation section in the accompanying Notes to Financial Statements. |
See accompanying notes which are an integral part of the financial statements.
Annual Report
Statement of Assets and Liabilities
| July 31, 2014 |
| | |
Assets | | |
Investment in securities, at value (including securities loaned of $43,224,490) - See accompanying schedule: Unaffiliated issuers (cost $1,184,048,483) | $ 1,262,521,957 | |
Fidelity Central Funds (cost $50,762,553) | 50,762,553 | |
Other affiliated issuers (cost $5,573,300) | 8,049,395 | |
Total Investments (cost $1,240,384,336) | | $ 1,321,333,905 |
Cash | | 1,077,543 |
Receivable for investments sold | | 70,156,652 |
Receivable for fund shares sold | | 1,080,689 |
Dividends receivable | | 432,657 |
Distributions receivable from Fidelity Central Funds | | 147,646 |
Receivable from investment adviser for expense reductions | | 744 |
Other receivables | | 26,021 |
Total assets | | 1,394,255,857 |
| | |
Liabilities | | |
Payable for investments purchased | $ 46,312,173 | |
Payable for fund shares redeemed | 3,819,361 | |
Accrued management fee | 678,266 | |
Distribution and service plan fees payable | 77,290 | |
Other affiliated payables | 277,336 | |
Other payables and accrued expenses | 62,242 | |
Collateral on securities loaned, at value | 45,930,575 | |
Total liabilities | | 97,157,243 |
| | |
Net Assets | | $ 1,297,098,614 |
Net Assets consist of: | | |
Paid in capital | | $ 1,141,004,177 |
Accumulated net investment loss | | (4,082,221) |
Accumulated undistributed net realized gain (loss) on investments and foreign currency transactions | | 79,230,791 |
Net unrealized appreciation (depreciation) on investments and assets and liabilities in foreign currencies | | 80,945,867 |
Net Assets | | $ 1,297,098,614 |
See accompanying notes which are an integral part of the financial statements.
Annual Report
Financial Statements - continued
Statement of Assets and Liabilities - continued
| July 31, 2014 |
| | |
Calculation of Maximum Offering Price Class A:
Net Asset Value and redemption price per share ($88,821,558 ÷ 4,937,588 shares) | | $ 17.99 |
| | |
Maximum offering price per share (100/94.25 of $17.99) | | $ 19.09 |
Class T:
Net Asset Value and redemption price per share ($42,586,335 ÷ 2,411,859 shares) | | $ 17.66 |
| | |
Maximum offering price per share (100/96.50 of $17.66) | | $ 18.30 |
Class B:
Net Asset Value and offering price per share ($2,763,621 ÷ 163,933 shares)A | | $ 16.86 |
| | |
Class C:
Net Asset Value and offering price per share ($42,215,155 ÷ 2,515,912 shares)A | | $ 16.78 |
| | |
Small Cap Growth:
Net Asset Value, offering price and redemption price per share ($1,069,105,078 ÷ 57,935,831 shares) | | $ 18.45 |
| | |
Institutional Class:
Net Asset Value, offering price and redemption price per share ($51,606,867 ÷ 2,791,390 shares) | | $ 18.49 |
A Redemption price per share is equal to net asset value less any applicable contingent deferred sales charge.
See accompanying notes which are an integral part of the financial statements.
Annual Report
Statement of Operations
| Year ended July 31, 2014 |
| | |
Investment Income | | |
Dividends | | $ 7,894,062 |
Interest | | 288 |
Income from Fidelity Central Funds (including $1,724,148 from security lending) | | 1,765,815 |
Total income | | 9,660,165 |
| | |
Expenses | | |
Management fee
Basic fee | $ 11,347,434 | |
Performance adjustment | (699,324) | |
Transfer agent fees | 2,882,872 | |
Distribution and service plan fees | 874,291 | |
Accounting and security lending fees | 519,891 | |
Custodian fees and expenses | 71,344 | |
Independent trustees' compensation | 7,051 | |
Registration fees | 192,913 | |
Audit | 59,462 | |
Legal | 6,624 | |
Interest | 819 | |
Miscellaneous | 17,559 | |
Total expenses before reductions | 15,280,936 | |
Expense reductions | (80,901) | 15,200,035 |
Net investment income (loss) | | (5,539,870) |
Realized and Unrealized Gain (Loss) Net realized gain (loss) on: | | |
Investment securities: | | |
Unaffiliated issuers | 228,023,968 | |
Redemption in-kind with affiliated entities (including
gain from other affiliated issuers of $4,613,051) | 304,585,595 | |
Other affiliated issuers | (398,906) | |
Foreign currency transactions | (13,148) | |
Futures contracts | (2,221,706) | |
Total net realized gain (loss) | | 529,975,803 |
Change in net unrealized appreciation (depreciation) on: Investment securities | (344,219,875) | |
Assets and liabilities in foreign currencies | 691 | |
Total change in net unrealized appreciation (depreciation) | | (344,219,184) |
Net gain (loss) | | 185,756,619 |
Net increase (decrease) in net assets resulting from operations | | $ 180,216,749 |
See accompanying notes which are an integral part of the financial statements.
Annual Report
Financial Statements - continued
Statement of Changes in Net Assets
| Year ended
July 31,
2014 | Year ended
July 31,
2013 |
Increase (Decrease) in Net Assets | | |
Operations | | |
Net investment income (loss) | $ (5,539,870) | $ 2,185,197 |
Net realized gain (loss) | 529,975,803 | 327,291,382 |
Change in net unrealized appreciation (depreciation) | (344,219,184) | 244,679,550 |
Net increase (decrease) in net assets resulting
from operations | 180,216,749 | 574,156,129 |
Distributions to shareholders from net realized gain | (306,246,236) | (122,560,447) |
Share transactions - net increase (decrease) | (817,676,738) | (58,479,174) |
Redemption fees | 398,744 | 117,383 |
Total increase (decrease) in net assets | (943,307,481) | 393,233,891 |
| | |
Net Assets | | |
Beginning of period | 2,240,406,095 | 1,847,172,204 |
End of period (including accumulated net investment loss of $4,082,221 and accumulated net investment loss of $0, respectively) | $ 1,297,098,614 | $ 2,240,406,095 |
See accompanying notes which are an integral part of the financial statements.
Annual Report
Financial Highlights - Class A
Years ended July 31, | 2014 | 2013 | 2012 | 2011 | 2010 |
Selected Per-Share Data | | | | | |
Net asset value, beginning of period | $ 19.66 | $ 15.87 | $ 16.42 | $ 12.66 | $ 10.79 |
Income from Investment Operations | | | | | |
Net investment income (loss) C | (.12) | (.04) | (.07) F | (.07) G | (.07) H |
Net realized and unrealized gain (loss) | 1.69 | 4.87 | (.16) | 3.84 | 1.94 |
Total from investment operations | 1.57 | 4.83 | (.23) | 3.77 | 1.87 |
Distributions from net realized gain | (3.24) | (1.04) | (.32) | (.01) L | - |
Redemption fees added to paid in capital C, J | - | - | - | - | - |
Net asset value, end of period | $ 17.99 | $ 19.66 | $ 15.87 | $ 16.42 | $ 12.66 |
Total ReturnA, B | 8.58% | 32.20% | (1.14)% | 29.78% | 17.33% |
Ratios to Average Net Assets D, I | | | | | |
Expenses before reductions | 1.22% | 1.24% | 1.35% | 1.25% | 1.35% |
Expenses net of fee waivers, if any | 1.22% | 1.24% | 1.35% | 1.25% | 1.35% |
Expenses net of all reductions | 1.22% | 1.22% | 1.34% | 1.23% | 1.34% |
Net investment income (loss) | (.62)% | (.26)% | (.49)% F | (.47)% G | (.56)% H |
Supplemental Data | | | | | |
Net assets, end of period (000 omitted) | $ 88,822 | $ 74,978 | $ 59,684 | $ 67,272 | $ 50,620 |
Portfolio turnover rate E | 148% K | 142% | 150% | 106% | 105% |
A Total returns would have been lower if certain expenses had not been reduced during the applicable periods shown.
B Total returns do not include the effect of the sales charges.
C Calculated based on average shares outstanding during the period.
D Fees and expenses of any underlying Fidelity Central Funds are not included in the Fund's expense ratio. The Fund indirectly bears its proportionate share of the expenses of any underlying Fidelity Central Funds.
E Amount does not include the portfolio activity of any underlying Fidelity Central Funds.
F Investment income per share reflects a large, non-recurring dividend which amounted to $.01 per share. Excluding this non-recurring dividend, the ratio of net investment income (loss) to average net assets would have been (.57)%.
G Investment income per share reflects a large, non-recurring dividend which amounted to $.02 per share. Excluding this non-recurring dividend, the ratio of net investment income (loss) to average net assets would have been (.61)%.
H Investment income per share reflects a large, non-recurring dividend which amounted to $.01 per share. Excluding this non-recurring dividend, the ratio of net investment income (loss) to average net assets would have been (.67)%.
I Expense ratios reflect operating expenses of the class. Expenses before reductions do not reflect amounts reimbursed by the investment adviser or reductions from brokerage service arrangements or reductions from other expense offset arrangements and do not represent the amount paid by the class during periods when reimbursements or reductions occur. Expenses net of fee waivers reflect expenses after reimbursement by the investment adviser but prior to reductions from brokerage service arrangements or other expense offset arrangements. Expenses net of all reductions represent the net expenses paid by the class.
J Amount represents less than $.01 per share.
K Portfolio turnover rate excludes securities received or delivered in-kind.
L The amounts shown reflect certain reclassifications related to book to tax differences that were made in the year shown.
See accompanying notes which are an integral part of the financial statements.
Annual Report
Financial Highlights - Class T
Years ended July 31, | 2014 | 2013 | 2012 | 2011 | 2010 |
Selected Per-Share Data | | | | | |
Net asset value, beginning of period | $ 19.38 | $ 15.68 | $ 16.27 | $ 12.57 | $ 10.74 |
Income from Investment Operations | | | | | |
Net investment income (loss) C | (.16) | (.09) | (.11) F | (.11) G | (.10) H |
Net realized and unrealized gain (loss) | 1.66 | 4.82 | (.16) | 3.81 | 1.93 |
Total from investment operations | 1.50 | 4.73 | (.27) | 3.70 | 1.83 |
Distributions from net realized gain | (3.22) | (1.03) | (.32) | - | - |
Redemption fees added to paid in capital C, J | - | - | - | - | - |
Net asset value, end of period | $ 17.66 | $ 19.38 | $ 15.68 | $ 16.27 | $ 12.57 |
Total ReturnA, B | 8.30% | 31.87% | (1.41)% | 29.44% | 17.04% |
Ratios to Average Net Assets D, I | | | | | |
Expenses before reductions | 1.50% | 1.49% | 1.61% | 1.50% | 1.61% |
Expenses net of fee waivers, if any | 1.50% | 1.49% | 1.61% | 1.50% | 1.61% |
Expenses net of all reductions | 1.49% | 1.48% | 1.60% | 1.49% | 1.60% |
Net investment income (loss) | (.90)% | (.52)% | (.74)% F | (.73)% G | (.82)% H |
Supplemental Data | | | | | |
Net assets, end of period (000 omitted) | $ 42,586 | $ 34,686 | $ 27,658 | $ 30,764 | $ 23,930 |
Portfolio turnover rate E | 148% K | 142% | 150% | 106% | 105% |
A Total returns would have been lower if certain expenses had not been reduced during the applicable periods shown.
B Total returns do not include the effect of the sales charges.
C Calculated based on average shares outstanding during the period.
D Fees and expenses of any underlying Fidelity Central Funds are not included in the Fund's expense ratio. The Fund indirectly bears its proportionate share of the expenses of any underlying Fidelity Central Funds.
E Amount does not include the portfolio activity of any underlying Fidelity Central Funds.
F Investment income per share reflects a large, non-recurring dividend which amounted to $.01 per share. Excluding this non-recurring dividend, the ratio of net investment income (loss) to average net assets would have been (.83)%.
G Investment income per share reflects a large, non-recurring dividend which amounted to $.02 per share. Excluding this non-recurring dividend, the ratio of net investment income (loss) to average net assets would have been (.86)%.
H Investment income per share reflects a large, non-recurring dividend which amounted to $.01 per share. Excluding this non-recurring dividend, the ratio of net investment income (loss) to average net assets would have been (.93)%.
I Expense ratios reflect operating expenses of the class. Expenses before reductions do not reflect amounts reimbursed by the investment adviser or reductions from brokerage service arrangements or reductions from other expense offset arrangements and do not represent the amount paid by the class during periods when reimbursements or reductions occur. Expenses net of fee waivers reflect expenses after reimbursement by the investment adviser but prior to reductions from brokerage service arrangements or other expense offset arrangements. Expenses net of all reductions represent the net expenses paid by the class.
J Amount represents less than $.01 per share.
K Portfolio turnover rate excludes securities received or delivered in-kind.
See accompanying notes which are an integral part of the financial statements.
Annual Report
Financial Highlights - Class B
Years ended July 31, | 2014 | 2013 | 2012 | 2011 | 2010 |
Selected Per-Share Data | | | | | |
Net asset value, beginning of period | $ 18.65 | $ 15.19 | $ 15.86 | $ 12.30 | $ 10.57 |
Income from Investment Operations | | | | | |
Net investment income (loss) C | (.25) | (.16) | (.18) F | (.18) G | (.16) H |
Net realized and unrealized gain (loss) | 1.60 | 4.64 | (.17) | 3.74 | 1.89 |
Total from investment operations | 1.35 | 4.48 | (.35) | 3.56 | 1.73 |
Distributions from net realized gain | (3.14) | (1.02) | (.32) | - | - |
Redemption fees added to paid in capital C, J | - | - | - | - | - |
Net asset value, end of period | $ 16.86 | $ 18.65 | $ 15.19 | $ 15.86 | $ 12.30 |
Total ReturnA, B | 7.73% | 31.25% | (1.96)% | 28.94% | 16.37% |
Ratios to Average Net Assets D, I | | | | | |
Expenses before reductions | 2.01% | 1.99% | 2.10% | 2.00% | 2.11% |
Expenses net of fee waivers, if any | 2.01% | 1.99% | 2.10% | 2.00% | 2.11% |
Expenses net of all reductions | 2.01% | 1.97% | 2.09% | 1.98% | 2.09% |
Net investment income (loss) | (1.41)% | (1.01)% | (1.23)% F | (1.22)% G | (1.32)% H |
Supplemental Data | | | | | |
Net assets, end of period (000 omitted) | $ 2,764 | $ 3,486 | $ 4,123 | $ 5,295 | $ 5,142 |
Portfolio turnover rate E | 148% K | 142% | 150% | 106% | 105% |
A Total returns would have been lower if certain expenses had not been reduced during the applicable periods shown.
B Total returns do not include the effect of the contingent deferred sales charge.
C Calculated based on average shares outstanding during the period.
D Fees and expenses of any underlying Fidelity Central Funds are not included in the Fund's expense ratio. The Fund indirectly bears its proportionate share of the expenses of any underlying Fidelity Central Funds.
E Amount does not include the portfolio activity of any underlying Fidelity Central Funds.
F Investment income per share reflects a large, non-recurring dividend which amounted to $.01 per share. Excluding this non-recurring dividend, the ratio of net investment income (loss) to average net assets would have been (1.32)%.
G Investment income per share reflects a large, non-recurring dividend which amounted to $.02 per share. Excluding this non-recurring dividend, the ratio of net investment income (loss) to average net assets would have been (1.36)%.
H Investment income per share reflects a large, non-recurring dividend which amounted to $.01 per share. Excluding this non-recurring dividend, the ratio of net investment income (loss) to average net assets would have been (1.42)%.
I Expense ratios reflect operating expenses of the class. Expenses before reductions do not reflect amounts reimbursed by the investment adviser or reductions from brokerage service arrangements or reductions from other expense offset arrangements and do not represent the amount paid by the class during periods when reimbursements or reductions occur. Expenses net of fee waivers reflect expenses after reimbursement by the investment adviser but prior to reductions from brokerage service arrangements or other expense offset arrangements. Expenses net of all reductions represent the net expenses paid by the class.
J Amount represents less than $.01 per share.
K Portfolio turnover rate excludes securities received or delivered in-kind.
See accompanying notes which are an integral part of the financial statements.
Annual Report
Financial Highlights - Class C
Years ended July 31, | 2014 | 2013 | 2012 | 2011 | 2010 |
Selected Per-Share Data | | | | | |
Net asset value, beginning of period | $ 18.62 | $ 15.16 | $ 15.83 | $ 12.28 | $ 10.55 |
Income from Investment Operations | | | | | |
Net investment income (loss) C | (.25) | (.16) | (.18) F | (.18) G | (.16) H |
Net realized and unrealized gain (loss) | 1.59 | 4.64 | (.17) | 3.73 | 1.89 |
Total from investment operations | 1.34 | 4.48 | (.35) | 3.55 | 1.73 |
Distributions from net realized gain | (3.18) | (1.02) | (.32) | - | - |
Redemption fees added to paid in capital C, J | - | - | - | - | - |
Net asset value, end of period | $ 16.78 | $ 18.62 | $ 15.16 | $ 15.83 | $ 12.28 |
Total ReturnA, B | 7.70% | 31.32% | (1.96)% | 28.91% | 16.40% |
Ratios to Average Net Assets D, I | | | | | |
Expenses before reductions | 2.01% | 1.99% | 2.10% | 2.00% | 2.11% |
Expenses net of fee waivers, if any | 2.00% | 1.99% | 2.10% | 2.00% | 2.11% |
Expenses net of all reductions | 2.00% | 1.97% | 2.09% | 1.98% | 2.09% |
Net investment income (loss) | (1.41)% | (1.01)% | (1.24)% F | (1.22)% G | (1.32)% H |
Supplemental Data | | | | | |
Net assets, end of period (000 omitted) | $ 42,215 | $ 32,756 | $ 24,683 | $ 24,914 | $ 18,091 |
Portfolio turnover rate E | 148% K | 142% | 150% | 106% | 105% |
A Total returns would have been lower if certain expenses had not been reduced during the applicable periods shown.
B Total returns do not include the effect of the contingent deferred sales charge.
C Calculated based on average shares outstanding during the period.
D Fees and expenses of any underlying Fidelity Central Funds are not included in the Fund's expense ratio. The Fund indirectly bears its proportionate share of the expenses of any underlying Fidelity Central Funds.
E Amount does not include the portfolio activity of any underlying Fidelity Central Funds.
F Investment income per share reflects a large, non-recurring dividend which amounted to $.01 per share. Excluding this non-recurring dividend, the ratio of net investment income (loss) to average net assets would have been (1.32)%.
G Investment income per share reflects a large, non-recurring dividend which amounted to $.02 per share. Excluding this non-recurring dividend, the ratio of net investment income (loss) to average net assets would have been (1.36)%.
H Investment income per share reflects a large, non-recurring dividend which amounted to $.01 per share. Excluding this non-recurring dividend, the ratio of net investment income (loss) to average net assets would have been (1.42)%.
I Expense ratios reflect operating expenses of the class. Expenses before reductions do not reflect amounts reimbursed by the investment adviser or reductions from brokerage service arrangements or reductions from other expense offset arrangements and do not represent the amount paid by the class during periods when reimbursements or reductions occur. Expenses net of fee waivers reflect expenses after reimbursement by the investment adviser but prior to reductions from brokerage service arrangements or other expense offset arrangements. Expenses net of all reductions represent the net expenses paid by the class.
J Amount represents less than $.01 per share.
K Portfolio turnover rate excludes securities received or delivered in-kind.
See accompanying notes which are an integral part of the financial statements.
Annual Report
Financial Highlights - Small Cap Growth
Years ended July 31, | 2014 | 2013 | 2012 | 2011 | 2010 |
Selected Per-Share Data | | | | | |
Net asset value, beginning of period | $ 20.07 | $ 16.14 | $ 16.65 | $ 12.81 | $ 10.89 |
Income from Investment Operations | | | | | |
Net investment income (loss) B | (.06) | .01 | (.03) E | (.03) F | (.04) G |
Net realized and unrealized gain (loss) | 1.71 | 4.98 | (.16) | 3.90 | 1.96 |
Total from investment operations | 1.65 | 4.99 | (.19) | 3.87 | 1.92 |
Distributions from net realized gain | (3.27) | (1.06) | (.32) | (.03) K | - |
Redemption fees added to paid in capital B, I | - | - | - | - | - |
Net asset value, end of period | $ 18.45 | $ 20.07 | $ 16.14 | $ 16.65 | $ 12.81 |
Total ReturnA | 8.87% | 32.74% | (.88)% | 30.20% | 17.63% |
Ratios to Average Net Assets C, H | | | | |
Expenses before reductions | .91% | .90% | 1.03% | .95% | 1.08% |
Expenses net of fee waivers, if any | .90% | .90% | 1.03% | .95% | 1.08% |
Expenses net of all reductions | .90% | .88% | 1.02% | .93% | 1.07% |
Net investment income (loss) | (.31)% | .08% | (.16)% E | (.17)% F | (.29)% G |
Supplemental Data | | | | | |
Net assets, end of period (000 omitted) | $ 1,069,105 | $ 1,315,659 | $ 1,166,101 | $ 1,382,688 | $ 1,204,818 |
Portfolio turnover rate D | 148% J | 142% | 150% | 106% | 105% |
A Total returns would have been lower if certain expenses had not been reduced during the applicable periods shown.
B Calculated based on average shares outstanding during the period.
C Fees and expenses of any underlying Fidelity Central Funds are not included in the Fund's expense ratio. The Fund indirectly bears its proportionate share of the expenses of any underlying Fidelity Central Funds.
D Amount does not include the portfolio activity of any underlying Fidelity Central Funds.
E Investment income per share reflects a large, non-recurring dividend which amounted to $.01 per share. Excluding this non-recurring dividend, the ratio of net investment income (loss) to average net assets would have been (.25)%.
F Investment income per share reflects a large, non-recurring dividend which amounted to $.02 per share. Excluding this non-recurring dividend, the ratio of net investment income (loss) to average net assets would have been (.31)%.
G Investment income per share reflects a large, non-recurring dividend which amounted to $.01 per share. Excluding this non-recurring dividend, the ratio of net investment income (loss) to average net assets would have been (.39)%.
H Expense ratios reflect operating expenses of the class. Expenses before reductions do not reflect amounts reimbursed by the investment adviser or reductions from brokerage service arrangements or reductions from other expense offset arrangements and do not represent the amount paid by the class during periods when reimbursements or reductions occur. Expenses net of fee waivers reflect expenses after reimbursement by the investment adviser but prior to reductions from brokerage service arrangements or other expense offset arrangements. Expenses net of all reductions represent the net expenses paid by the class.
I Amount represents less than $.01 per share.
J Portfolio turnover rate excludes securities received or delivered in-kind.
K The amounts shown reflect certain reclassifications related to book to tax differences that were made in the year shown.
See accompanying notes which are an integral part of the financial statements.
Annual Report
Financial Highlights - Institutional Class
Years ended July 31, | 2014 | 2013 | 2012 | 2011 | 2010 |
Selected Per-Share Data | | | | | |
Net asset value, beginning of period | $ 20.10 | $ 16.17 | $ 16.68 | $ 12.83 | $ 10.91 |
Income from Investment Operations | | | | | |
Net investment income (loss) B | (.06) | .01 | (.03) E | (.03) F | (.03) G |
Net realized and unrealized gain (loss) | 1.72 | 4.98 | (.16) | 3.91 | 1.95 |
Total from investment operations | 1.66 | 4.99 | (.19) | 3.88 | 1.92 |
Distributions from net realized gain | (3.27) | (1.06) | (.32) | (.03) K | - |
Redemption fees added to paid in capital B, I | - | - | - | - | - |
Net asset value, end of period | $ 18.49 | $ 20.10 | $ 16.17 | $ 16.68 | $ 12.83 |
Total ReturnA | 8.89% | 32.65% | (.88)% | 30.24% | 17.60% |
Ratios to Average Net Assets C, H | | | | | |
Expenses before reductions | .92% | .92% | 1.06% | .94% | 1.03% |
Expenses net of fee waivers, if any | .92% | .92% | 1.06% | .94% | 1.03% |
Expenses net of all reductions | .92% | .91% | 1.05% | .93% | 1.02% |
Net investment income (loss) | (.32)% | .06% | (.19)% E | (.17)% F | (.24)% G |
Supplemental Data | | | | | |
Net assets, end of period (000 omitted) | $ 51,607 | $ 51,158 | $ 36,694 | $ 41,440 | $ 25,650 |
Portfolio turnover rateD | 148% J | 142% | 150% | 106% | 105% |
A Total returns would have been lower if certain expenses had not been reduced during the applicable periods shown.
B Calculated based on average shares outstanding during the period.
C Fees and expenses of any underlying Fidelity Central Funds are not included in the Fund's expense ratio. The Fund indirectly bears its proportionate share of the expenses of any underlying Fidelity Central Funds.
D Amount does not include the portfolio activity of any underlying Fidelity Central Funds.
E Investment income per share reflects a large, non-recurring dividend which amounted to $.01 per share. Excluding this non-recurring dividend, the ratio of net investment income (loss) to average net assets would have been (.28)%.
F Investment income per share reflects a large, non-recurring dividend which amounted to $.02 per share. Excluding this non-recurring dividend, the ratio of net investment income (loss) to average net assets would have been (.30)%.
G Investment income per share reflects a large, non-recurring dividend which amounted to $.01 per share. Excluding this non-recurring dividend, the ratio of net investment income (loss) to average net assets would have been (.34)%.
H Expense ratios reflect operating expenses of the class. Expenses before reductions do not reflect amounts reimbursed by the investment adviser or reductions from brokerage service arrangements or reductions from other expense offset arrangements and do not represent the amount paid by the class during periods when reimbursements or reductions occur. Expenses net of fee waivers reflect expenses after reimbursement by the investment adviser but prior to reductions from brokerage service arrangements or other expense offset arrangements. Expenses net of all reductions represent the net expenses paid by the class.
I Amount represents less than $.01 per share.
J Portfolio turnover rate excludes securities received or delivered in-kind.
K The amounts shown reflect certain reclassifications related to book to tax differences that were made in the year shown.
See accompanying notes which are an integral part of the financial statements.
Annual Report
Notes to Financial Statements
For the period ended July 31, 2014
1. Organization.
Fidelity® Small Cap Growth Fund (the Fund) is a fund of Fidelity Securities Fund (the Trust) and is authorized to issue an unlimited number of shares. The Trust is registered under the Investment Company Act of 1940, as amended (the 1940 Act), as an open-end management investment company organized as a Massachusetts business trust. The Fund offers Class A, Class T, Class C, Small Cap Growth and Institutional Class shares, each of which, along with Class B shares, has equal rights as to assets and voting privileges. Class B shares are closed to new accounts and additional purchases, except for exchanges and reinvestments. The Fund offered Class F shares during the period June 26, 2009 through November 15, 2013, and all outstanding shares were redeemed by November 15, 2013. Each class has exclusive voting rights with respect to matters that affect that class. Class B shares will automatically convert to Class A shares after a holding period of seven years from the initial date of purchase.
2. Investments in Fidelity Central Funds.
The Fund invests in Fidelity Central Funds, which are open-end investment companies generally available only to other investment companies and accounts managed by the investment adviser and its affiliates. The Fund's Schedule of Investments lists each of the Fidelity Central Funds held as of period end, if any, as an investment of the Fund, but does not include the underlying holdings of each Fidelity Central Fund. As an Investing Fund, the Fund indirectly bears its proportionate share of the expenses of the underlying Fidelity Central Funds.
The Money Market Central Funds seek preservation of capital and current income and are managed by Fidelity Investments Money Management, Inc. (FIMM), an affiliate of the investment adviser. Annualized expenses of the Money Market Central Funds as of their most recent shareholder report date are less than .01%.
A complete unaudited list of holdings for each Fidelity Central Fund is available upon request or at the Securities and Exchange Commission (the SEC) website at www.sec.gov. In addition, the financial statements of the Fidelity Central Funds, which are not covered by the Fund's Report of Independent Registered Public Accounting Firm, are available on the SEC website or upon request.
3. Significant Accounting Policies.
The financial statements have been prepared in conformity with accounting principles generally accepted in the United States of America (GAAP), which require management to make certain estimates and assumptions at the date of the financial statements. Actual results could differ from those estimates. Subsequent events, if any, through the date that the financial statements were issued have been evaluated in the preparation of
Annual Report
3. Significant Accounting Policies - continued
the financial statements. The following summarizes the significant accounting policies of the Fund:
Investment Valuation. Investments are valued as of 4:00 p.m. Eastern time on the last calendar day of the period. In accordance with valuation policies and procedures approved by the Board of Trustees (the Board), the Fund attempts to obtain prices from one or more third party pricing vendors or brokers to value its investments. When current market prices, quotations or currency exchange rates are not readily available or reliable, investments will be fair valued in good faith by the Fidelity Management & Research Company (FMR) Fair Value Committee (the Committee), in accordance with procedures adopted by the Board. Factors used in determining fair value vary by investment type and may include market or investment specific events. The frequency with which these procedures are used cannot be predicted and they may be utilized to a significant extent. The Committee oversees the Fund's valuation policies and procedures and is responsible for approving and reporting to the Board all fair value determinations.
The Fund categorizes the inputs to valuation techniques used to value its investments into a disclosure hierarchy consisting of three levels as shown below:
Level 1 - quoted prices in active markets for identical investments
Level 2 - other significant observable inputs (including quoted prices for similar investments, interest rates, prepayment speeds, etc.)
Level 3 - unobservable inputs (including the Fund's own assumptions based on the best information available)
Valuation techniques used to value the Fund's investments by major category are as follows:
Equity securities, including restricted securities, for which market quotations are readily available, are valued at the last reported sale price or official closing price as reported by a third party pricing vendor on the primary market or exchange on which they are traded and are categorized as Level 1 in the hierarchy. In the event there were no sales during the day or closing prices are not available, securities are valued at the last quoted bid price or may be valued using the last available price and are generally categorized as Level 2 in the hierarchy. For foreign equity securities, when market or security specific events arise, comparisons to the valuation of American Depositary Receipts (ADRs), futures contracts, Exchange-Traded Funds (ETFs) and certain indexes as well as quoted prices for similar securities may be used and would be categorized as Level 2 in the hierarchy. Utilizing these techniques may result in transfers between Level 1 and Level 2. For equity securities, including restricted securities, where observable inputs are
Annual Report
Notes to Financial Statements - continued
3. Significant Accounting Policies - continued
Investment Valuation - continued
limited, assumptions about market activity and risk are used and these securities may be categorized as Level 3 in the hierarchy.
Investments in open-end mutual funds, including the Fidelity Central Funds, are valued at their closing net asset value (NAV) each business day and are categorized as Level 1 in the hierarchy.
Changes in valuation techniques may result in transfers in or out of an assigned level within the disclosure hierarchy.
Foreign Currency. The Fund may use foreign currency contracts to facilitate transactions in foreign-denominated securities. Gains and losses from these transactions may arise from changes in the value of the foreign currency or if the counterparties do not perform under the contracts' terms.
Foreign-denominated assets, including investment securities, and liabilities are translated into U.S. dollars at the exchange rates at period end. Purchases and sales of investment securities, income and dividends received and expenses denominated in foreign currencies are translated into U.S. dollars at the exchange rate in effect on the transaction date.
The effects of exchange rate fluctuations on investments are included with the net realized and unrealized gain (loss) on investment securities. Other foreign currency transactions resulting in realized and unrealized gain (loss) are disclosed separately.
Investment Transactions and Income. For financial reporting purposes, the Fund's investment holdings and NAV include trades executed through the end of the last business day of the period. The NAV per share for processing shareholder transactions is calculated as of the close of business of the New York Stock Exchange (NYSE), normally 4:00 p.m. Eastern time and includes trades executed through the end of the prior business day. Gains and losses on securities sold are determined on the basis of identified cost and may include proceeds received from litigation. Dividend income is recorded on the ex-dividend date, except for certain dividends from foreign securities where the ex-dividend date may have passed, which are recorded as soon as the Fund is informed of the ex-dividend date. Non-cash dividends included in dividend income, if any, are recorded at the fair market value of the securities received. Income and capital gain distributions from Fidelity Central Funds, if any, are recorded on the ex-dividend date. Distributions received on securities that represent a return of capital or capital gain are recorded as a reduction of cost of investments and/or as a realized gain. Subsequent to ex-dividend date the Fund determines the components of these distributions, based upon receipt of tax filings or other correspondence relating to the underlying investment.
Annual Report
3. Significant Accounting Policies - continued
Investment Transactions and Income - continued
Interest income is accrued as earned and includes coupon interest and amortization of premium and accretion of discount on debt securities as applicable. Investment income is recorded net of foreign taxes withheld where recovery of such taxes is uncertain.
Class Allocations and Expenses. Investment income, realized and unrealized capital gains and losses, common expenses of the Fund, and certain fund-level expense reductions, if any, are allocated daily on a pro-rata basis to each class based on the relative net assets of each class to the total net assets of the Fund. Each class differs with respect to transfer agent and distribution and service plan fees incurred. Certain expense reductions may also differ by class. For the reporting period, the allocated portion of income and expenses to each class as a percent of its average net assets may vary due to the timing of recording these transactions in relation to fluctuating net assets of the classes. Expenses directly attributable to a fund are charged to that fund. Expenses attributable to more than one fund are allocated among the respective funds on the basis of relative net assets or other appropriate methods. Expense estimates are accrued in the period to which they relate and adjustments are made when actual amounts are known.
Income Tax Information and Distributions to Shareholders. Each year, the Fund intends to qualify as a regulated investment company under Subchapter M of the Internal Revenue Code, including distributing substantially all of its taxable income and realized gains. As a result, no provision for U.S. Federal income taxes is required. As of July 31, 2014, the Fund did not have any unrecognized tax benefits in the financial statements; nor is the Fund aware of any tax positions for which it is reasonably possible that the total amounts of unrecognized tax benefits will significantly change in the next twelve months. The Fund files a U.S. federal tax return, in addition to state and local tax returns as required. The Fund's federal income tax returns are subject to examination by the Internal Revenue Service (IRS) for a period of three fiscal years after they are filed. State and local tax returns may be subject to examination for an additional fiscal year depending on the jurisdiction. Foreign taxes are provided for based on the Fund's understanding of the tax rules and rates that exist in the foreign markets in which it invests.
Distributions are declared and recorded on the ex-dividend date. Income dividends and capital gain distributions are declared separately for each class. Income and capital gain distributions are determined in accordance with income tax regulations, which may differ from GAAP. In addition, the Fund claimed a portion of the payment made to redeeming shareholders as a distribution for income tax purposes.
Capital accounts within the financial statements are adjusted for permanent book-tax differences. These adjustments have no impact on net assets or the results of operations.
Annual Report
Notes to Financial Statements - continued
3. Significant Accounting Policies - continued
Income Tax Information and Distributions to Shareholders - continued
Capital accounts are not adjusted for temporary book-tax differences which will reverse in a subsequent period.
Book-tax differences are primarily due to in-kind transactions, futures transactions, foreign currency transactions, partnerships and losses deferred due to wash sales and excise tax regulations.
The federal tax cost of investment securities and unrealized appreciation (depreciation) as of period end were as follows:
Gross unrealized appreciation | $ 133,804,925 |
Gross unrealized depreciation | (55,161,096) |
Net unrealized appreciation (depreciation) on securities | $ 78,643,829 |
| |
Tax Cost | $ 1,242,690,076 |
The tax-based components of distributable earnings as of period end were as follows:
Undistributed long-term capital gain | $ 81,536,530 |
Net unrealized appreciation (depreciation) on securities and other investments | $ 78,640,127 |
The Fund intends to elect to defer to its next fiscal year $4,082,221 of ordinary losses recognized during the period January 1, 2014 to July 31, 2014.
The tax character of distributions paid was as follows:
| July 31, 2014 | July 31, 2013 |
Ordinary Income | $ 106,613,332 | $ 5,191,398 |
Long-term Capital Gains | 199,632,904 | 117,369,049 |
Total | $ 306,246,236 | $ 122,560,447 |
Short-Term Trading (Redemption) Fees. Shares held by investors in the Fund less than 90 days may have been subject to a redemption fee equal to 1.50% of the NAV of shares redeemed. All redemption fees, which reduce the proceeds of the shareholder redemption, are retained by the Fund and accounted for as an addition to paid in capital.
4. Derivative Instruments.
Risk Exposures and the Use of Derivative Instruments. The Fund's investment objective allows the Fund to enter into various types of derivative contracts, including futures contracts. Derivatives are investments whose value is primarily derived from underlying assets, indices or reference rates and may be transacted on an exchange or over-the-counter (OTC). Derivatives may involve a future commitment to buy or sell a
Annual Report
4. Derivative Instruments - continued
Risk Exposures and the Use of Derivative Instruments - continued
specified asset based on specified terms, to exchange future cash flows at periodic intervals based on a notional principal amount, or for one party to make one or more payments upon the occurrence of specified events in exchange for periodic payments from the other party.
The Fund used derivatives to increase returns and to manage exposure to certain risks as defined below. The success of any strategy involving derivatives depends on analysis of numerous economic factors, and if the strategies for investment do not work as intended, the Fund may not achieve its objectives.
The Fund's use of derivatives increased or decreased its exposure to the following risk:
Equity Risk | Equity risk relates to the fluctuations in the value of financial instruments as a result of changes in market prices (other than those arising from interest rate risk or foreign exchange risk), whether caused by factors specific to an individual investment, its issuer, or all factors affecting all instruments traded in a market or market segment. |
The Fund is also exposed to additional risks from investing in derivatives, such as liquidity risk and counterparty credit risk. Liquidity risk is the risk that the Fund will be unable to close out the derivative in the open market in a timely manner. Counterparty credit risk is the risk that the counterparty will not be able to fulfill its obligation to the Fund. Counterparty credit risk related to exchange-traded futures contracts may be mitigated by the protection provided by the exchange on which they trade.
Investing in derivatives may involve greater risks than investing in the underlying assets directly and, to varying degrees, may involve risk of loss in excess of any initial investment and collateral received and amounts recognized in the Statement of Assets and Liabilities. In addition, there may be the risk that the change in value of the derivative contract does not correspond to the change in value of the underlying instrument.
Futures Contracts. A futures contract is an agreement between two parties to buy or sell a specified underlying instrument for a fixed price at a specified future date. The Fund used futures contracts to manage its exposure to the stock market.
Upon entering into a futures contract, a fund is required to deposit either cash or securities (initial margin) with a clearing broker in an amount equal to a certain percentage of the face value of the contract. Futures contracts are marked-to-market daily and subsequent daily payments (variation margin) are made or received by a fund depending on the daily fluctuations in the value of the futures contracts and are recorded as unrealized appreciation or (depreciation). This receivable and/or payable, if any, is included in daily
Annual Report
Notes to Financial Statements - continued
4. Derivative Instruments - continued
Futures Contracts - continued
variation margin for derivative instruments in the Statement of Assets and Liabilities. Realized gain or (loss) is recorded upon the expiration or closing of a futures contract.
Any open futures contracts at period end are presented in the Schedule of Investments under the caption "Futures Contracts." The underlying face amount at value reflects each contract's exposure to the underlying instrument or index at period end.
During the period the Fund recognized net realized gain (loss) of $(2,221,706) related to its investment in futures contracts. This amount is included in the Statement of Operations.
5. Purchases and Sales of Investments.
Purchases and sales of securities, other than short-term securities and in-kind transactions, aggregated $2,507,771,818 and $2,337,256,072, respectively.
6. Fees and Other Transactions with Affiliates.
Management Fee. Fidelity Management & Research Company (the investment adviser) and its affiliates provide the Fund with investment management related services for which the Fund pays a monthly management fee. The management fee is the sum of an individual fund fee rate that is based on an annual rate of .45% of the Fund's average net assets and an annualized group fee rate that averaged .25% during the period. The group fee rate is based upon the average net assets of all the mutual funds advised by the investment adviser, including any mutual funds previously advised by the investment adviser that are currently advised by Fidelity SelectCo, LLC, an affiliate of the investment adviser. The group fee rate decreases as assets under management increase and increases as assets under management decrease. In addition, the management fee is subject to a performance adjustment (up to a maximum of ± .20% of the Fund's average net assets over a 36 month performance period). The upward or downward adjustment to the management fee is based on the relative investment performance of Small Cap Growth as compared to its benchmark index, the Russell 2000 Growth Index, over the same 36 month performance period. For the reporting period, the total annual management fee rate, including the performance adjustment, was .66% of the Fund's average net assets. The performance adjustment included in the management fee rate may be higher or lower than the maximum performance adjustment rate due to the difference between the average net assets for the reporting and performance periods.
Annual Report
6. Fees and Other Transactions with Affiliates - continued
Distribution and Service Plan Fees. In accordance with Rule 12b-1 of the 1940 Act, the Fund has adopted separate Distribution and Service Plans for each class of shares. Certain classes pay Fidelity Distributors Corporation (FDC), an affiliate of the investment adviser, separate Distribution and Service Fees, each of which is based on an annual percentage of each class' average net assets. In addition, FDC may pay financial intermediaries for selling shares of the Fund and providing shareholder support services. For the period, the Distribution and Service Fee rates, total fees and amounts retained by FDC were as follows:
| Distribution
Fee | Service
Fee | Total Fees | Retained
by FDC |
Class A | -% | .25% | $ 218,076 | $ 4,628 |
Class T | .25% | .25% | 210,598 | - |
Class B | .75% | .25% | 32,670 | 24,728 |
Class C | .75% | .25% | 412,947 | 83,407 |
| | | $ 874,291 | $ 112,763 |
Sales Load. FDC may receive a front-end sales charge of up to 5.75% for selling Class A shares and 3.50% for selling Class T shares, some of which is paid to financial intermediaries for selling shares of the Fund. Depending on the holding period, FDC may receive contingent deferred sales charges levied on Class A, Class T, Class B, and Class C redemptions. The deferred sales charges range from 5.00% to 1.00% for Class B shares, 1.00% for Class C shares, 1.00% for certain purchases of Class A shares and .25% for certain purchases of Class T shares.
For the period, sales charge amounts retained by FDC were as follows:
| Retained
by FDC |
Class A | $ 58,222 |
Class T | 14,217 |
Class B* | 1,899 |
Class C* | 4,695 |
| $ 79,033 |
* When Class B and Class C shares are initially sold, FDC pays commissions from its own resources to financial intermediaries through which the sales
are made.
Transfer Agent Fees. Fidelity Investments Institutional Operations Company, Inc., (FIIOC), an affiliate of the investment adviser, is the transfer, dividend disbursing and shareholder servicing agent for each class of the Fund. FIIOC receives account fees and asset-based fees that vary according to the account size and type of account of the shareholders of the respective classes of the Fund. FIIOC pays for typesetting, printing and mailing of shareholder reports, except proxy statements.
Annual Report
Notes to Financial Statements - continued
6. Fees and Other Transactions with Affiliates - continued
Transfer Agent Fees - continued
For the period, transfer agent fees for each class were as follows:
| Amount | % of
Average
Net Assets |
Class A | $ 229,497 | .26 |
Class T | 120,469 | .29 |
Class B | 9,848 | .30 |
Class C | 121,452 | .29 |
Small Cap Growth | 2,290,179 | .20 |
Institutional Class | 111,427 | .21 |
| $ 2,882,872 | |
Accounting and Security Lending Fees. Fidelity Service Company, Inc. (FSC), an affiliate of the investment adviser, maintains the Fund's accounting records. The accounting fee is based on the level of average net assets for each month. Under a separate contract, FSC administers the security lending program. The security lending fee is based on the number and duration of lending transactions.
Brokerage Commissions. The Fund placed a portion of its portfolio transactions with brokerage firms which are affiliates of the investment adviser. Brokerage commissions are included in net realized gain (loss) and change in net unrealized appreciation (depreciation) in the Statement of Operations. The commissions paid to these affiliated firms were $89,841 for the period.
Interfund Lending Program. Pursuant to an Exemptive Order issued by the SEC, the Fund, along with other registered investment companies having management contracts with FMR or other affiliated entities of FMR, may participate in an interfund lending program. This program provides an alternative credit facility allowing the funds to borrow from, or lend money to, other participating affiliated funds. At period end, there were no interfund loans outstanding. The Fund's activity in this program during the period for which loans were outstanding was as follows:
Borrower or Lender | Average Loan
Balance | Weighted Average
Interest Rate | Interest Expense |
Borrower | $ 8,287,364 | .32% | $ 819 |
Redemptions In-Kind. During the period, 70,585,530 shares of the Fund held by affiliated entities were redeemed for investments with a value of $1,380,652,586. The net realized gain of $304,585,595 on investments delivered through in-kind redemptions is included in the accompanying Statement of Operations. The amount of the in-kind redemption is included in share transactions in the accompanying Statement of Changes
Annual Report
6. Fees and Other Transactions with Affiliates - continued
Redemptions In-Kind - continued
in Net Assets as well as Note 11: Share Transactions. The Fund recognized no gain or loss for federal income tax purposes.
7. Committed Line of Credit.
The Fund participates with other funds managed by the investment adviser or an affiliate in a $4.25 billion credit facility (the "line of credit") to be utilized for temporary or emergency purposes to fund shareholder redemptions or for other short-term liquidity purposes. The Fund has agreed to pay commitment fees on its pro-rata portion of the line of credit, which amounted to $2,899 and is reflected in Miscellaneous expenses on the Statement of Operations. During the period, the Fund did not borrow on this line of credit.
8. Security Lending.
The Fund lends portfolio securities through a lending agent from time to time in order to earn additional income. For equity securities, a lending agent is used and may loan securities to certain qualified borrowers, including Fidelity Capital Markets (FCM), a broker-dealer affiliated with the Fund. On the settlement date of the loan, the Fund receives collateral (in the form of U.S. Treasury obligations, letters of credit and/or cash) against the loaned securities and maintains collateral in an amount not less than 100% of the market value of the loaned securities during the period of the loan. The market value of the loaned securities is determined at the close of business of the Fund and any additional required collateral is delivered to the Fund on the next business day. If the borrower defaults on its obligation to return the securities loaned because of insolvency or other reasons, the Fund may apply collateral received from the borrower against the obligation. The Fund may experience delays and costs in recovering the securities loaned. Any cash collateral received is invested in the Fidelity Securities Lending Cash Central Fund. The value of loaned securities and cash collateral at period end are disclosed on the Fund's Statement of Assets and Liabilities. At period end, there were no security loans outstanding with FCM. Security lending income represents the income earned on investing cash collateral, less rebates paid to borrowers and any lending agent fees associated with the loan, plus any premium payments received for lending certain types of securities. Security lending income is presented in the Statement of Operations as a component of income from Fidelity Central Funds and includes $68,452 from securities loaned to FCM.
Annual Report
Notes to Financial Statements - continued
9. Expense Reductions.
Commissions paid to certain brokers with whom the investment adviser, or its affiliates, places trades on behalf of the Fund include an amount in addition to trade execution, which may be rebated back to the Fund to offset certain expenses. This amount totaled $56,370 for the period. In addition, through arrangements with the Fund's custodian, credits realized as a result of uninvested cash balances were used to reduce the Fund's expenses. During the period, these credits reduced the Fund's custody expenses by $86.
In addition, the investment adviser reimbursed a portion of the Fund's operating expenses during the period in the amount of $24,445.
10. Distributions to Shareholders.
Distributions to shareholders of each class were as follows:
Years ended July 31, | 2014 A | 2013 |
From net realized gain | | |
Class A | $ 13,043,180 | $ 3,855,020 |
Class T | 6,310,012 | 1,778,904 |
Class B | 574,582 | 260,524 |
Class C | 6,249,863 | 1,656,727 |
Small Cap Growth | 191,545,684 | 74,940,038 |
Class F | 80,609,253 | 37,680,389 |
Institutional Class | 7,913,662 | 2,388,845 |
Total | $ 306,246,236 | $ 122,560,447 |
A All Class F shares were redeemed on November 15, 2013.
11. Share Transactions.
Transactions for each class of shares were as follows:
| Shares | Dollars |
Years ended July 31, | 2014 A | 2013 | 2014 A | 2013 |
Class A | | | | |
Shares sold | 1,706,264 | 969,311 | $ 32,017,468 | $ 16,711,827 |
Reinvestment of distributions | 685,582 | 231,282 | 12,377,436 | 3,646,231 |
Shares redeemed | (1,267,150) | (1,149,326) | (23,663,751) | (19,219,034) |
Net increase (decrease) | 1,124,696 | 51,267 | $ 20,731,153 | $ 1,139,024 |
Class T | | | | |
Shares sold | 787,491 | 457,321 | $ 14,539,628 | $ 7,743,595 |
Reinvestment of distributions | 341,036 | 106,640 | 6,061,090 | 1,660,117 |
Shares redeemed | (506,140) | (538,707) | (9,192,820) | (8,802,237) |
Net increase (decrease) | 622,387 | 25,254 | $ 11,407,898 | $ 601,475 |
Annual Report
11. Share Transactions - continued
| Shares | Dollars |
Years ended July 31, | 2014 A | 2013 | 2014 A | 2013 |
Class B | | | | |
Shares sold | 11,205 | 6,696 | $ 198,217 | $ 106,485 |
Reinvestment of distributions | 32,147 | 16,337 | 548,598 | 246,159 |
Shares redeemed | (66,282) | (107,598) | (1,168,208) | (1,730,845) |
Net increase (decrease) | (22,930) | (84,565) | $ (421,393) | $ (1,378,201) |
Class C | | | | |
Shares sold | 918,904 | 456,788 | $ 16,220,240 | $ 7,531,447 |
Reinvestment of distributions | 347,970 | 103,215 | 5,911,022 | 1,550,542 |
Shares redeemed | (510,512) | (428,305) | (8,883,388) | (6,821,754) |
Net increase (decrease) | 756,362 | 131,698 | $ 13,247,874 | $ 2,260,235 |
Small Cap Growth | | | | |
Shares sold | 30,614,664 | 10,379,088 | $ 589,831,022 | $ 182,249,151 |
Reinvestment of distributions | 10,184,956 | 4,595,875 | 187,557,177 | 73,721,316 |
Shares redeemed | (48,426,256) B | (21,652,202) | (934,113,968) B | (371,997,767) |
Net increase (decrease) | (7,626,636) | (6,677,239) | $ (156,725,769) | $ (116,027,300) |
Class F | | | | |
Shares sold | 768,083 | 7,670,010 | $ 15,293,461 | $ 131,231,307 |
Reinvestment of distributions | 4,357,257 | 2,336,095 | 80,609,253 | 37,680,389 |
Shares redeemed | (41,060,113) B | (6,554,937) | (806,457,595) B | (118,928,973) |
Net increase (decrease) | (35,934,773) | 3,451,168 | $ (710,554,881) | $ 49,982,723 |
Institutional Class | | | | |
Shares sold | 933,934 | 727,207 | $ 18,129,031 | $ 12,757,998 |
Reinvestment of distributions | 381,830 | 128,780 | 7,062,159 | 2,069,290 |
Shares redeemed | (1,069,577) | (580,321) | (20,552,810) | (9,884,418) |
Net increase (decrease) | 246,187 | 275,666 | $ 4,638,380 | $ 4,942,870 |
A All Class F shares were redeemed on November 15, 2013.
B Amount includes in-kind redemptions (see Note 6: Redemptions In-Kind).
12. Other.
The Fund's organizational documents provide former and current trustees and officers with a limited indemnification against liabilities arising in connection with the performance of their duties to the Fund. In the normal course of business, the Fund may also enter into contracts that provide general indemnifications. The Fund's maximum exposure under these arrangements is unknown as this would be dependent on future claims that may be made against the Fund. The risk of material loss from such claims is considered remote.
Annual Report
To the Trustees of Fidelity Securities Fund and the Shareholders of Fidelity Small Cap Growth Fund:
In our opinion, the accompanying statement of assets and liabilities, including the schedule of investments, and the related statements of operations and of changes in net assets and the financial highlights present fairly, in all material respects, the financial position of Fidelity Small Cap Growth Fund (a fund of Fidelity Securities Fund) at July 31, 2014, the results of its operations for the year then ended, the changes in its net assets for each of the two years in the period then ended and the financial highlights for each of the five years in the period then ended, in conformity with accounting principles generally accepted in the United States of America. These financial statements and financial highlights (hereafter referred to as "financial statements") are the responsibility of the Fidelity Small Cap Growth Fund's management. Our responsibility is to express an opinion on these financial statements based on our audits. We conducted our audits of these financial statements in accordance with the standards of the Public Company Accounting Oversight Board (United States). Those standards require that we plan and perform the audit to obtain reasonable assurance about whether the financial statements are free of material misstatement. An audit includes examining, on a test basis, evidence supporting the amounts and disclosures in the financial statements, assessing the accounting principles used and significant estimates made by management, and evaluating the overall financial statement presentation. We believe that our audits, which included confirmation of securities at July 31, 2014 by correspondence with the custodian and brokers, provide a reasonable basis for our opinion.
PricewaterhouseCoopers LLP
Boston, Massachusetts
September 15, 2014
Annual Report
The Trustees, Member of the Advisory Board, and officers of the trust and fund, as applicable, are listed below. The Board of Trustees governs the fund and is responsible for protecting the interests of shareholders. The Trustees are experienced executives who meet periodically throughout the year to oversee the fund's activities, review contractual arrangements with companies that provide services to the fund, oversee management of the risks associated with such activities and contractual arrangements, and review the fund's performance. Except for James C. Curvey, each of the Trustees oversees 173 funds. Mr. Curvey oversees 397 funds.
The Trustees hold office without limit in time except that (a) any Trustee may resign; (b) any Trustee may be removed by written instrument, signed by at least two-thirds of the number of Trustees prior to such removal; (c) any Trustee who requests to be retired or who has become incapacitated by illness or injury may be retired by written instrument signed by a majority of the other Trustees; and (d) any Trustee may be removed at any special meeting of shareholders by a two-thirds vote of the outstanding voting securities of the trust. Each Trustee who is not an interested person (as defined in the 1940 Act) of the trust and the fund (Independent Trustee), shall retire not later than the last day of the calendar year in which his or her 75th birthday occurs. The Independent Trustees may waive this mandatory retirement age policy with respect to individual Trustees. The officers and Advisory Board Member hold office without limit in time, except that any officer and Advisory Board Member may resign or may be removed by a vote of a majority of the Trustees at any regular meeting or any special meeting of the Trustees. Except as indicated, each individual has held the office shown or other offices in the same company for the past five years.
Experience, Skills, Attributes, and Qualifications of the Fund's Trustees. The Governance and Nominating Committee has adopted a statement of policy that describes the experience, qualifications, attributes, and skills that are necessary and desirable for potential Independent Trustee candidates (Statement of Policy). The Board believes that each Trustee satisfied at the time he or she was initially elected or appointed a Trustee, and continues to satisfy, the standards contemplated by the Statement of Policy. The Governance and Nominating Committee also engages professional search firms to help identify potential Independent Trustee candidates who have the experience, qualifications, attributes, and skills consistent with the Statement of Policy. From time to time, additional criteria based on the composition and skills of the current Independent Trustees, as well as experience or skills that may be appropriate in light of future changes to board composition, business conditions, and regulatory or other developments, have also been considered by the professional search firms and the Governance and Nominating Committee. In addition, the Board takes into account the Trustees' commitment and participation in Board and committee meetings, as well as their leadership of standing and ad hoc committees throughout their tenure.
In determining that a particular Trustee was and continues to be qualified to serve as a Trustee, the Board has considered a variety of criteria, none of which, in isolation, was controlling. The Board believes that, collectively, the Trustees have balanced and diverse experience, qualifications, attributes, and skills, which allow the Board to operate effectively in governing the fund and protecting the interests of shareholders. Information about the specific experience, skills, attributes, and qualifications of each Trustee, which in each case led to the Board's conclusion that the Trustee should serve (or continue to serve) as a trustee of the fund, is provided below.
Annual Report
Trustees and Officers - continued
Board Structure and Oversight Function. James C. Curvey is an interested person (as defined in the 1940 Act) and currently serves as Chairman. The Trustees have determined that an interested Chairman is appropriate and benefits shareholders because an interested Chairman has a personal and professional stake in the quality and continuity of services provided to the fund. Independent Trustees exercise their informed business judgment to appoint an individual of their choosing to serve as Chairman, regardless of whether the Trustee happens to be independent or a member of management. The Independent Trustees have determined that they can act independently and effectively without having an Independent Trustee serve as Chairman and that a key structural component for assuring that they are in a position to do so is for the Independent Trustees to constitute a substantial majority for the Board. The Independent Trustees also regularly meet in executive session. Ned C. Lautenbach serves as Chairman of the Independent Trustees and as such (i) acts as a liaison between the Independent Trustees and management with respect to matters important to the Independent Trustees and (ii) with management prepares agendas for Board meetings.
Fidelity funds are overseen by different Boards of Trustees. The fund's Board oversees Fidelity's equity and high income funds and another Board oversees Fidelity's investment-grade bond, money market, and asset allocation funds. The asset allocation funds may invest in Fidelity funds overseen by the fund's Board. The use of separate Boards, each with its own committee structure, allows the Trustees of each group of Fidelity funds to focus on the unique issues of the funds they oversee, including common research, investment, and operational issues. On occasion, the separate Boards establish joint committees to address issues of overlapping consequences for the Fidelity funds overseen by each Board.
The Trustees operate using a system of committees to facilitate the timely and efficient consideration of all matters of importance to the Trustees, the fund, and fund shareholders and to facilitate compliance with legal and regulatory requirements and oversight of the fund's activities and associated risks. The Board, acting through its committees, has charged FMR and its affiliates with (i) identifying events or circumstances the occurrence of which could have demonstrably adverse effects on the fund's business and/or reputation; (ii) implementing processes and controls to lessen the possibility that such events or circumstances occur or to mitigate the effects of such events or circumstances if they do occur; and (iii) creating and maintaining a system designed to evaluate continuously business and market conditions in order to facilitate the identification and implementation processes described in (i) and (ii) above. Because the day-to-day operations and activities of the fund are carried out by or through FMR, its affiliates and other service providers, the fund's exposure to risks is mitigated but not eliminated by the processes overseen by the Trustees. While each of the Board's committees has responsibility for overseeing different aspects of the fund's activities, oversight is exercised primarily through the Operations, Audit, and Compliance Committees. In addition, the Independent Trustees have worked with FMR to enhance the Board's oversight of investment and financial risks, legal and regulatory risks, technology risks, and operational risks, including the development of additional risk reporting to the Board. For example, a working group comprised of Independent Trustees and FMR has worked and continues to work to review the Fidelity funds' valuation-related activities, reporting and risk management. Appropriate personnel, including but not limited to the fund's Chief Compliance Officer (CCO), FMR's internal auditor, the independent accountants, the fund's Treasurer and portfolio management personnel, make periodic reports to the Board's committees, as appropriate, including an annual review of FMR's risk management program for the Fidelity funds. The responsibilities of each standing committee, including their oversight responsibilities, are described further under "Standing Committees of the Fund's Trustees."
Annual Report
The fund's Statement of Additional Information (SAI) includes more information about the Trustees. To request a free copy, call Fidelity at 1-800-544-8544.
Interested Trustees*:
Correspondence intended for each Trustee who is an interested person may be sent to Fidelity Investments, 245 Summer Street, Boston, Massachusetts 02210.
Name, Year of Birth; Principal Occupations and Other Relevant Experience+ |
James C. Curvey (1935) |
Year of Election or Appointment: 2007 Trustee Chairman of the Board of Trustees |
| Mr. Curvey also serves as Trustee of other Fidelity funds. Mr. Curvey is a Director of Fidelity Research & Analysis Co. (2009-present), and Vice Chairman (2007-present) and Director of FMR LLC. In addition, Mr. Curvey serves as an Overseer for the Boston Symphony Orchestra and a member of the Trustees of Villanova University. Previously, Mr. Curvey served as a Director of Fidelity Investments Money Management, Inc. (2009-2014), a Director of FMR (2007-2014), a Director of FMR Co., Inc. (2007-2014) and was the Vice Chairman (2006-2007) and Director (2000-2007) of FMR Corp. |
Charles S. Morrison (1960) |
Year of Election or Appointment: 2014 Trustee |
| Mr. Morrison also serves as Trustee of other funds. He serves as President, Asset Management (2014-present) and is an employee of Fidelity Investments. Previously, Mr. Morrison served as Vice President of Fidelity's Fixed Income and Asset Allocation Funds (2012-2014), President, Fixed Income (2011-2014), Vice President of Fidelity's Money Market Funds (2005-2009), President, Money Market Group Leader of FMR (2009), and Senior Vice President, Money Market Group of FMR (2004-2009). Mr. Morrison also served as Vice President of Fidelity's Bond Funds (2002-2005), certain Balanced Funds (2002-2005), and certain Asset Allocation Funds (2002-2007), and as Senior Vice President (2002-2005) of Fidelity's Bond Division. |
* Trustees have been determined to be "Interested Trustees" by virtue of, among other things, their affiliation with the trust or various entities under common control with FMR
+ The information above includes each Trustee's principal occupation during the last five years and other information relating to the experience, attributes, and skills relevant to each Trustee's qualifications to serve as a Trustee, which led to the conclusion that each Trustee should serve as a Trustee for the fund.
Annual Report
Independent Trustees:
Correspondence intended for each Independent Trustee (that is, the Trustees other than the Interested Trustees) may be sent to Fidelity Investments, P.O. Box 55235, Boston, Massachusetts 02205-5235.
Name, Year of Birth; Principal Occupations and Other Relevant Experience+ |
Dennis J. Dirks (1948) |
Year of Election or Appointment: 2005 Trustee |
| Mr. Dirks also serves as Trustee of other Fidelity funds. Prior to his retirement in May 2003, Mr. Dirks was Chief Operating Officer and a member of the Board of The Depository Trust & Clearing Corporation (DTCC). He also served as President, Chief Operating Officer, and Board member of The Depository Trust Company (DTC) and President and Board member of the National Securities Clearing Corporation (NSCC). In addition, Mr. Dirks served as Chief Executive Officer and Board member of the Government Securities Clearing Corporation, Chief Executive Officer and Board member of the Mortgage-Backed Securities Clearing Corporation, as a Trustee and a member of the Finance Committee of Manhattan College (2005-2008), and as a Trustee and a member of the Finance Committee of AHRC of Nassau County (2006-2008). Mr. Dirks is a member of the Independent Directors Council (IDC) Governing Council (2010-present) and Board of Directors for The Brookville Center for Children's Services, Inc. (2009-present). |
Alan J. Lacy (1953) |
Year of Election or Appointment: 2008 Trustee |
| Mr. Lacy also serves as Trustee of other Fidelity funds. Mr. Lacy serves as Senior Adviser (2007-present) of Oak Hill Capital Partners, L.P. (private equity). Mr. Lacy also served as Chief Executive Officer (2000-2005) and Vice Chairman (2005-2006) of Sears Holdings Corporation and Sears, Roebuck and Co. (retail). In addition, Mr. Lacy serves as a member of the Board of Directors of Dave & Buster's Entertainment, Inc. (restaurant and entertainment complexes, 2010-present), Earth Fare, Inc. (retail grocery, 2012-present), The Hillman Companies, Inc. (hardware wholesalers, 2010-present), and Bristol-Myers Squibb Company (global pharmaceuticals, 2008-present). Mr. Lacy is a member of the Board of Trustees of The National Parks Conservation Association (2006-present). Previously, Mr. Lacy served as Chairman of the Board of Trustees of the National Parks Conservation Association (2008-2011) and as a member of the Board of Directors for the Western Union Company (global money transfer, 2006-2011). |
Ned C. Lautenbach (1944) |
Year of Election or Appointment: 2000 Trustee Chairman of the Independent Trustees |
| Mr. Lautenbach also serves as Trustee of other Fidelity funds. Mr. Lautenbach currently serves as the Lead Director of the Eaton Corporation Board of Directors (diversified industrial, 1997-present). Mr. Lautenbach is Chairman of the Board of Directors of the Philharmonic Center for the Arts in Naples, Florida (2012-present) and a member of the Council on Foreign Relations (1994-present). Previously, Mr. Lautenbach was a Partner/Advisory Partner at Clayton, Dubilier & Rice, LLC (private equity investment, 1998-2010), as well as a Director of Sony Corporation (2006-2007). |
Joseph Mauriello (1944) |
Year of Election or Appointment: 2008 Trustee |
| Mr. Mauriello also serves as Trustee of other Fidelity funds. Prior to his retirement in January 2006, Mr. Mauriello served in numerous senior management positions including Deputy Chairman and Chief Operating Officer (2004-2005), and Vice Chairman of Financial Services (2002-2004) of KPMG LLP US (professional services, 1965-2005). Mr. Mauriello currently serves as a member of the Board of Directors of XL Group plc. (global insurance and re-insurance, 2006-present). Previously, Mr. Mauriello served as a Director of the Hamilton Funds of the Bank of New York (2006-2007) and of Arcadia Resources Inc. (health care services and products, 2007-2012). |
Robert W. Selander (1950) |
Year of Election or Appointment: 2011 Trustee |
| Mr. Selander also serves as Trustee of other Fidelity funds. Previously, Mr. Selander served as a Member of the Advisory Board of other Fidelity funds (2011), and Executive Vice Chairman (2010), Chief Executive Officer (2009-2010), and President and Chief Executive Officer (1997-2009) of Mastercard, Inc. |
Cornelia M. Small (1944) |
Year of Election or Appointment: 2005 Trustee |
| Ms. Small also serves as Trustee of other Fidelity funds. Ms. Small is a member of the Board of Directors (2009-present) and Chair of the Investment Committee (2010-present) of the Teagle Foundation. Ms. Small also serves on the Investment Committee of the Berkshire Taconic Community Foundation (2008-present). Previously, Ms. Small served as Chairperson (2002-2008) and a member of the Investment Committee and Chairperson (2008-2012) and a member of the Board of Trustees of Smith College. In addition, Ms. Small served as Chief Investment Officer, Director of Global Equity Investments, and a member of the Board of Directors of Scudder, Stevens & Clark and Scudder Kemper Investments. |
William S. Stavropoulos (1939) |
Year of Election or Appointment: 2002 Trustee Vice Chairman of the Independent Trustees |
| Mr. Stavropoulos also serves as Trustee of other Fidelity funds. Mr. Stavropoulos serves as President and Founder of the Michigan Baseball Foundation, the Great Lakes Loons (2007-present). Mr. Stavropoulos is Chairman Emeritus of the Board of Directors of The Dow Chemical Company, where he previously served in numerous senior management positions, including President, CEO (1995-2000; 2002-2004), Chairman of the Executive Committee (2000-2006), and as a member of the Board of Directors (1990-2006). Currently, Mr. Stavropoulos is Chairman of the Board of Directors of Univar Inc. (global distributor of commodity and specialty chemicals), a Director of Teradata Corporation (data warehousing and technology solutions), and Maersk Inc. (industrial conglomerate), and a member of the Advisory Board for Metalmark Capital LLC (private equity investment, 2005-present). Mr. Stavropoulos is an operating advisor to Clayton, Dubilier & Rice, LLC (private equity investment). In addition, Mr. Stavropoulos is a member of the University of Notre Dame Advisory Council for the College of Science, a Trustee of the Rollin L. Gerstacker Foundation, and a Director of the Naples Philharmonic Center for the Arts. Previously, Mr. Stavropoulos served as a Director of Chemical Financial Corporation (bank holding company, 1993-2012) and Tyco International, Ltd. (multinational manufacturing and services, 2007-2012). |
David M. Thomas (1949) |
Year of Election or Appointment: 2008 Trustee |
| Mr. Thomas also serves as Trustee of other Fidelity funds. Mr. Thomas serves as Non-Executive Chairman of the Board of Directors of Fortune Brands Home and Security (home and security products, 2011-present), and as a member of the Board of Directors of Interpublic Group of Companies, Inc. (marketing communication, 2004-present). Previously, Mr. Thomas served as Executive Chairman (2005-2006) and Chairman and Chief Executive Officer (2000-2005) of IMS Health, Inc. (pharmaceutical and healthcare information solutions), and a Director of Fortune Brands, Inc. (consumer products, 2000-2011). |
+ The information above includes each Trustee's principal occupation during the last five years and other information relating to the experience, attributes, and skills relevant to each Trustee's qualifications to serve as a Trustee, which led to the conclusion that each Trustee should serve as a Trustee for the fund.
Advisory Board Member and Officers:
Correspondence intended for each officer and Peter S. Lynch may be sent to Fidelity Investments, 245 Summer Street, Boston, Massachusetts 02210. Officers appear below in alphabetical order.
Name, Year of Birth; Principal Occupation |
Peter S. Lynch (1944) |
Year of Election or Appointment: 2003 Member of the Advisory Board |
| Mr. Lynch also serves as Member of the Advisory Board of other Fidelity funds. Mr. Lynch is Vice Chairman and a Director of FMR and FMR Co., Inc. In addition, Mr. Lynch serves as a Trustee of Boston College and as the Chairman of the Inner-City Scholarship Fund. Previously, Mr. Lynch served on the Special Olympics International Board of Directors (1997-2006). |
Elizabeth Paige Baumann (1968) |
Year of Election or Appointment: 2012 Anti-Money Laundering (AML) Officer |
| Ms. Baumann also serves as AML Officer of other funds. She is Chief AML Officer of FMR LLC (2012-present) and is an employee of Fidelity Investments. Previously, Ms. Baumann served as Vice President and Deputy Anti-Money Laundering Officer (2007-2012). |
William C. Coffey (1969) |
Year of Election or Appointment: 2009 Assistant Secretary |
| Mr. Coffey also serves as Assistant Secretary of other funds. He is Senior Vice President and Deputy General Counsel of FMR LLC (2010-present), and is an employee of Fidelity Investments. Previously, Mr. Coffey served as Vice President and Associate General Counsel of FMR LLC (2005-2009). |
Jonathan Davis (1968) |
Year of Election or Appointment: 2010 Assistant Treasurer |
| Mr. Davis also serves as Assistant Treasurer of other funds. Mr. Davis is an employee of Fidelity Investments. Previously, Mr. Davis served as Vice President and Associate General Counsel of FMR LLC (2003-2010). |
Adrien E. Deberghes (1967) |
Year of Election or Appointment: 2008 Deputy Treasurer |
| Mr. Deberghes also serves as an officer of other funds. He is an employee of Fidelity Investments (2008-present). Prior to joining Fidelity Investments, Mr. Deberghes was Senior Vice President of Mutual Fund Administration at State Street Corporation (2007-2008), Senior Director of Mutual Fund Administration at Investors Bank & Trust (2005-2007), and Director of Finance for Dunkin' Brands (2000-2005). |
Stephanie J. Dorsey (1969) |
Year of Election or Appointment: 2010 Assistant Treasurer |
| Ms. Dorsey also serves as an officer of other funds. She is an employee of Fidelity Investments (2008-present) and has served in other fund officer roles. Prior to joining Fidelity Investments, Ms. Dorsey served as Treasurer (2004-2008) of the JPMorgan Mutual Funds and Vice President (2004-2008) of JPMorgan Chase Bank. |
Howard J. Galligan III (1966) |
Year of Election or Appointment: 2014 Chief Financial Officer |
| Mr. Galligan also serves as Chief Financial Officer of other funds. Mr. Galligan serves as President of Fidelity Pricing and Cash Management Services (FPCMS) (2014-present) and as a Director of Strategic Advisers, Inc. (2008-present). Previously, Mr. Galligan served as Chief Administrative Officer of Asset Management (2011-2014) and Chief Operating Officer and Senior Vice President of Investment Support for Strategic Advisers, Inc. (2003-2011). |
Scott C. Goebel (1968) |
Year of Election or Appointment: 2008 Secretary and Chief Legal Officer (CLO) |
| Mr. Goebel serves as Secretary and CLO of other funds. Mr. Goebel also serves as Secretary of Fidelity SelectCo, LLC (2013-present), Fidelity Investments Money Management, Inc. (FIMM) (2010-present) and Fidelity Research and Analysis Company (FRAC) (2010-present); General Counsel, Secretary, and Senior Vice President of FMR (2008-present) and FMR Co., Inc. (2008-present); Chief Legal Officer of Fidelity Management & Research (Hong Kong) Limited (2008-present); and Assistant Secretary of Fidelity Management & Research (Japan) Inc. (2008-present) and Fidelity Management & Research (U.K.) Inc. (2008-present). Previously, Mr. Goebel served as Secretary and CLO of other Fidelity funds (2008-2013), Assistant Secretary of FIMM (2008-2010), FRAC (2008-2010), and certain funds (2007-2008); and as Vice President and Secretary of Fidelity Distributors Corporation (FDC) (2005-2007). Mr. Goebel has been employed by FMR LLC or an affiliate since 2001. |
Thomas C. Hense (1964) |
Year of Election or Appointment: 2008/2010 Vice President |
| Mr. Hense also serves as Vice President of other funds (High Income (2008), Small Cap (2008), and Value (2010) funds). Previously, Mr. Hense served as a portfolio manager for Fidelity's Institutional Money Management Group (Pyramis) (2003-2008).] |
Brian B. Hogan (1964) |
Year of Election or Appointment: 2009 Vice President |
| Mr. Hogan also serves as Trustee or Vice President of other funds. Mr. Hogan serves as President of FMR's Equity Division (2009-present). Previously, Mr. Hogan served as Senior Vice President, Equity Research of FMR (2006-2009) and as a portfolio manager. |
Chris Maher (1972) |
Year of Election or Appointment: 2013 Assistant Treasurer |
| Mr. Maher serves as Assistant Treasurer of other funds. Mr. Maher is Vice President of Valuation Oversight and is an employee of Fidelity Investments. Previously, Mr. Maher served as Vice President of Asset Management Compliance (2013), Vice President of FMR's Program Management Group (2010-2013), and Vice President of Valuation Oversight (2008-2010). |
Kenneth B. Robins (1969) |
Year of Election or Appointment: 2008 President and Treasurer |
| Mr. Robins also serves as an officer of other funds. Mr. Robins serves as Executive Vice President of Fidelity Investments Money Management, Inc. (FIMM) (2013-present) and is an employee of Fidelity Investments (2004-present). Previously, Mr. Robins served in other fund officer roles. |
Stephen Sadoski (1971) |
Year of Election or Appointment: 2012 Deputy Treasurer |
| Mr. Sadoski also serves as Deputy Treasurer of other funds. He is an employee of Fidelity Investments (2012-present) and has served in another fund officer role. Prior to joining Fidelity Investments, Mr. Sadoski served as an assistant chief accountant in the Division of Investment Management of the Securities and Exchange Commission (SEC) (2009-2012) and as a senior manager at Deloitte & Touche LLP (1997-2009). |
Stacie M. Smith (1974) |
Year of Election or Appointment: 2013 Deputy Treasurer |
| Ms. Smith also serves as an officer of other funds. She is an employee of Fidelity Investments (2009-present) and has served in other fund officer roles. Prior to joining Fidelity Investments, Ms. Smith served as Senior Audit Manager of Ernst & Young LLP (1996-2009). |
Renee Stagnone (1975) |
Year of Election or Appointment: 2013 Deputy Treasurer |
| Ms. Stagnone also serves as Deputy Treasurer of other funds. Ms. Stagnone is an employee of Fidelity Investments. |
Linda J. Wondrack (1964) |
Year of Election or Appointment: 2014 Chief Compliance Officer |
| Ms. Wondrack also serves as Chief Compliance Officer of other funds. Ms. Wondrack is Executive Vice President and head of the Ethics Office and Asset Management Compliance for Fidelity Investments (2012-present). Ms. Wondrack also serves as Chief Compliance Officer of Fidelity SelectCo, LLC (2014-present); Chief Compliance Officer of Impresa Management LLC (2013-present); and Chief Compliance Officer of FMR Co., Inc., Fidelity Investments Money Management, Inc., Fidelity Management & Research (Japan) Inc., Fidelity Management & Research (U.K.) Inc., Fidelity Management & Research (Hong Kong), Fidelity Management & Research Company, Pyramis Global Advisors, LLC, and Strategic Advisers, Inc., Ballyrock Investment Advisors LLC, and Northern Neck Investors LLC (2012-present). Previously, Ms. Wondrack served as Senior Vice President and Chief Compliance Officer for Columbia Management Investment Advisers, LLC (2005-2012); Chief Compliance Officer for certain funds within the Columbia Family of Funds (2007-2012); and Senior Vice President of Compliance Risk Management at Bank of America (2005-2010). |
Joseph F. Zambello (1957) |
Year of Election or Appointment: 2011 Deputy Treasurer |
| Mr. Zambello also serves as Deputy Treasurer of other funds. Mr. Zambello is an employee of Fidelity Investments. Previously, Mr. Zambello served as Vice President of FMR's Program Management Group (2009-2011) and Vice President of the Transfer Agent Oversight Group (2005-2009). |
Annual Report
The Board of Trustees of Fidelity Small Cap Growth Fund voted to pay on September 15, 2014, to shareholders of record at the opening of business on September 12, 2014, a distribution of $1.188 per share derived from capital gains realized from sales of portfolio securities.
The fund hereby designates as a capital gain dividend with respect to the taxable year ended July 31, 2014, $155,260,658, or, if subsequently determined to be different, the net capital gain of such year.
The fund designates 7% of the dividends distributed during the fiscal year as qualifying for the dividends-received deduction for corporate shareholders.
The fund designates 10% of the dividends distributed during the fiscal year as amounts which can be taken into account as a dividend for the purposes of the maximum rate under section 1(h)(11) of the Internal Revenue Code.
The fund will notify shareholders in January 2015 of amounts for use in preparing 2014 income tax returns.
Annual Report
Board Approval of Investment Advisory Contracts and Management Fees
Fidelity Small Cap Growth Fund
Each year, the Board of Trustees, including the Independent Trustees (together, the Board), votes on the renewal of the management contract with Fidelity Management & Research Company (FMR) and the sub-advisory agreements (together, the Advisory Contracts) for the fund. The Board, assisted by the advice of fund counsel and Independent Trustees' counsel, requests and considers a broad range of information relevant to the renewal of the Advisory Contracts throughout the year.
The Board meets regularly and, at each of its meetings, covers an extensive agenda of topics and materials and considers factors that are relevant to its annual consideration of the renewal of the fund's Advisory Contracts, including the services and support provided to the fund and its shareholders. The Board has established various standing committees (Committees), each composed of and chaired by Independent Trustees with varying backgrounds, to which the Board has assigned specific subject matter responsibilities in order to enhance effective decision-making by the Board. The Board, acting directly and through its Committees, requests and receives information concerning the annual consideration of the renewal of the fund's Advisory Contracts. The Board also meets as needed to consider matters specifically related to the Board's annual consideration of the renewal of the Advisory Contracts. Members of the Board may also meet with trustees of other Fidelity funds through ad hoc joint committees to discuss certain matters relevant to the Fidelity funds.
At its July 2014 meeting, the Board, including the Independent Trustees, unanimously determined to renew the fund's Advisory Contracts. In reaching its determination, the Board considered all factors it believed relevant, including (i) the nature, extent, and quality of the services to be provided to the fund and its shareholders (including the investment performance of the fund); (ii) the competitiveness of the fund's management fee and total expense ratio relative to peer funds; (iii) the total costs of the services to be provided by and the profits to be realized by Fidelity from its relationship with the fund; (iv) the extent to which economies of scale exist and would be realized as the fund grows; and (v) whether fee levels reflect these economies of scale, if any, for the benefit of fund shareholders. In connection with separate internal corporate reorganizations involving Fidelity Management & Research (U.K.) Inc. (FMR U.K.) and Fidelity Management & Research (Japan) Inc. (FMR Japan), the Board approved certain non-material amendments to the fund's sub-advisory agreements with FMR U.K. and FMR Japan to reflect that, after these reorganizations, FMR Investment Management (UK) Limited and Fidelity Management & Research (Japan) Limited will carry on the business of FMR U.K. and FMR Japan, respectively. The Board noted that no changes to the portfolio managers or to the foreign research or investment advisory services provided to the fund were expected in connection with either reorganization and that the same personnel and resources would continue to be available to the fund at the new entities.
Annual Report
In considering whether to renew the Advisory Contracts for the fund, the Board reached a determination, with the assistance of fund counsel and Independent Trustees' counsel and through the exercise of its business judgment, that the renewal of the Advisory Contracts was in the best interests of the fund and its shareholders and that the compensation payable under the Advisory Contracts was fair and reasonable. The Board's decision to renew the Advisory Contracts was not based on any single factor, but rather was based on a comprehensive consideration of all the information provided to the Board at its meetings throughout the year. The Board, in reaching its determination to renew the Advisory Contracts, was aware that shareholders of the fund have a broad range of investment choices available to them, including a wide choice among funds offered by Fidelity's competitors, and that the fund's shareholders, who have the opportunity to review and weigh the disclosure provided by the fund in its prospectus and other public disclosures, have chosen to invest in this fund, which is part of the Fidelity family of funds.
Nature, Extent, and Quality of Services Provided. The Board considered Fidelity's staffing as it relates to the fund, including the backgrounds of investment personnel of FMR and the sub-advisers (together, the Investment Advisers), and also considered the fund's investment objective, strategies, and related investment philosophy. The Independent Trustees also had discussions with senior management of Fidelity's investment operations and investment groups. The Board considered the structure of the portfolio manager compensation program and whether this structure provides appropriate incentives to act in the best interests of the fund. Additionally, the Board considered the portfolio managers' investments, if any, in the funds that they manage.
Resources Dedicated to Investment Management and Support Services. The Board and the Fund Oversight and Research Committees reviewed the general qualifications and capabilities of Fidelity's investment staff, including its size, education, experience, and resources, as well as Fidelity's approach to recruiting, training, managing, and compensating investment personnel. The Board noted that Fidelity has continued to increase the resources devoted to non-U.S. offices, including expansion of Fidelity's global investment organization. The Board also noted that Fidelity's analysts have extensive resources, tools and capabilities that allow them to conduct sophisticated quantitative and fundamental analysis, as well as credit analysis of issuers, counterparties and guarantors. Further, the Board believes that Fidelity's investment professionals have sufficient access to global information and data so as to provide competitive investment results over time, and that those professionals also have access to sophisticated tools that permit them to assess portfolio construction and risk and performance attribution characteristics continuously, as well as to transmit new information and research conclusions rapidly around the world. Additionally, in its deliberations, the Board considered Fidelity's trading and risk management capabilities and resources and global compliance infrastructure, which are an integral part of the investment management process.
Annual Report
Board Approval of Investment Advisory Contracts and
Management Fees - continued
Shareholder and Administrative Services. The Board considered (i) the nature, extent, quality, and cost of advisory, administrative, and shareholder services performed by the Investment Advisers and their affiliates under the Advisory Contracts and under separate agreements covering transfer agency, pricing and bookkeeping, and securities lending services for the fund; (ii) the nature and extent of the supervision of third party service providers, principally custodians and subcustodians; and (iii) the resources devoted to, and the record of compliance with, the fund's compliance policies and procedures. The Board also reviewed the allocation of fund brokerage, including allocations to brokers affiliated with the Investment Advisers, the use of brokerage commissions to pay fund expenses, and the use of "soft" commission dollars to pay for research services.
The Board noted that the growth of fund assets over time across the complex allows Fidelity to reinvest in the development of services designed to enhance the value or convenience of the Fidelity funds as investment vehicles. These services include 24-hour access to account information and market information through telephone representatives and over the Internet, investor education materials and asset allocation tools, and the expanded availability of Fidelity Investor Centers.
In 2014, the Board formed an ad hoc Committee on Transfer Agency Fees to review the variety of transfer agency fee structures throughout the industry and Fidelity's competitive positioning with respect to industry participants.
Investment in a Large Fund Family. The Board considered the benefits to shareholders of investing in a Fidelity fund, including the benefits of investing in a fund that is part of a large family of funds offering a variety of investment disciplines and providing a large variety of mutual fund investor services. The Board noted that Fidelity had taken, or had made recommendations that resulted in the Fidelity funds taking, a number of actions over the previous year that benefited particular funds, including (i) continuing to dedicate additional resources to investment research and to the support of the senior management team that oversees asset management; (ii) persisting in efforts to enhance Fidelity's global research capabilities; (iii) launching new funds and making other enhancements to meet client needs for income-oriented solutions; (iv) reducing fund expenses for certain index funds; (v) continuing to launch dedicated lower cost underlying funds to meet portfolio construction needs related to expanding underlying fund options for Fidelity funds of funds, specifically for the Freedom Fund product lines; (vi) rationalizing product lines and gaining increased efficiencies through fund mergers; (vii) launching sector-based exchange-traded funds and establishing a new Fidelity adviser to manage sector-based funds and products; (viii) continuing to develop and implement technology to improve security and increase efficiency; (ix) modifying the eligibility criteria for certain share classes to increase their marketability to a portion of the defined contribution plan market; (x) waiving redemption fees for certain qualified fund-of-fund and wrap programs and certain retirement plan transactions; and (xi) launching new Institutional Class shares of certain money market funds to attract and retain assets and to fill a gap in the money market fund lineup.
Annual Report
Investment Performance. The Board considered whether the fund has operated in accordance with its investment objective, as well as its record of compliance with its investment restrictions and its performance history. The Board noted that there was a portfolio management change for the fund in November 2011.
The Board took into account discussions with the Investment Advisers about fund investment performance that occur at Board meetings throughout the year. In this regard the Board noted that as part of regularly scheduled fund reviews and other reports to the Board on fund performance, the Board periodically considers annualized return information for the fund, for different time periods, measured against a securities market index ("benchmark index") and a peer group of funds with similar objectives ("peer group"). In its evaluation of fund investment performance, the Board gave particular attention to information indicating changes in performance of certain Fidelity funds for specific time periods and the Investment Advisers' explanations for any overperformance or underperformance.
In addition to reviewing absolute and relative fund performance, the Independent Trustees periodically consider the appropriateness of fund performance metrics in evaluating the results achieved. In general, the Independent Trustees believe that fund performance should be evaluated based on net performance (after fees and expenses) of both the highest performing and lowest performing classes, where applicable, compared to appropriate benchmark indices, over appropriate time periods which may include full market cycles, and compared to peer groups, as applicable, over the same periods, taking into account relevant factors including the following: general market conditions; issuer-specific information; tactical opportunities for investment; and fund cash flows and other factors.
The Independent Trustees recognize that shareholders evaluate performance on a net basis over their own holding periods, for which one-, three-, and five-year periods are often used as a proxy. For this reason, the performance information reviewed by the Board also included net cumulative calendar year total return information for the fund and an appropriate benchmark index and peer group for the most recent one-, three-, and five-year periods, as shown below. Returns are shown compared to the 25th percentile (top of box, 75% beaten) and 75th percentile (bottom of box, 25% beaten) of the peer universe.
Annual Report
Board Approval of Investment Advisory Contracts and
Management Fees - continued
Fidelity Small Cap Growth Fund
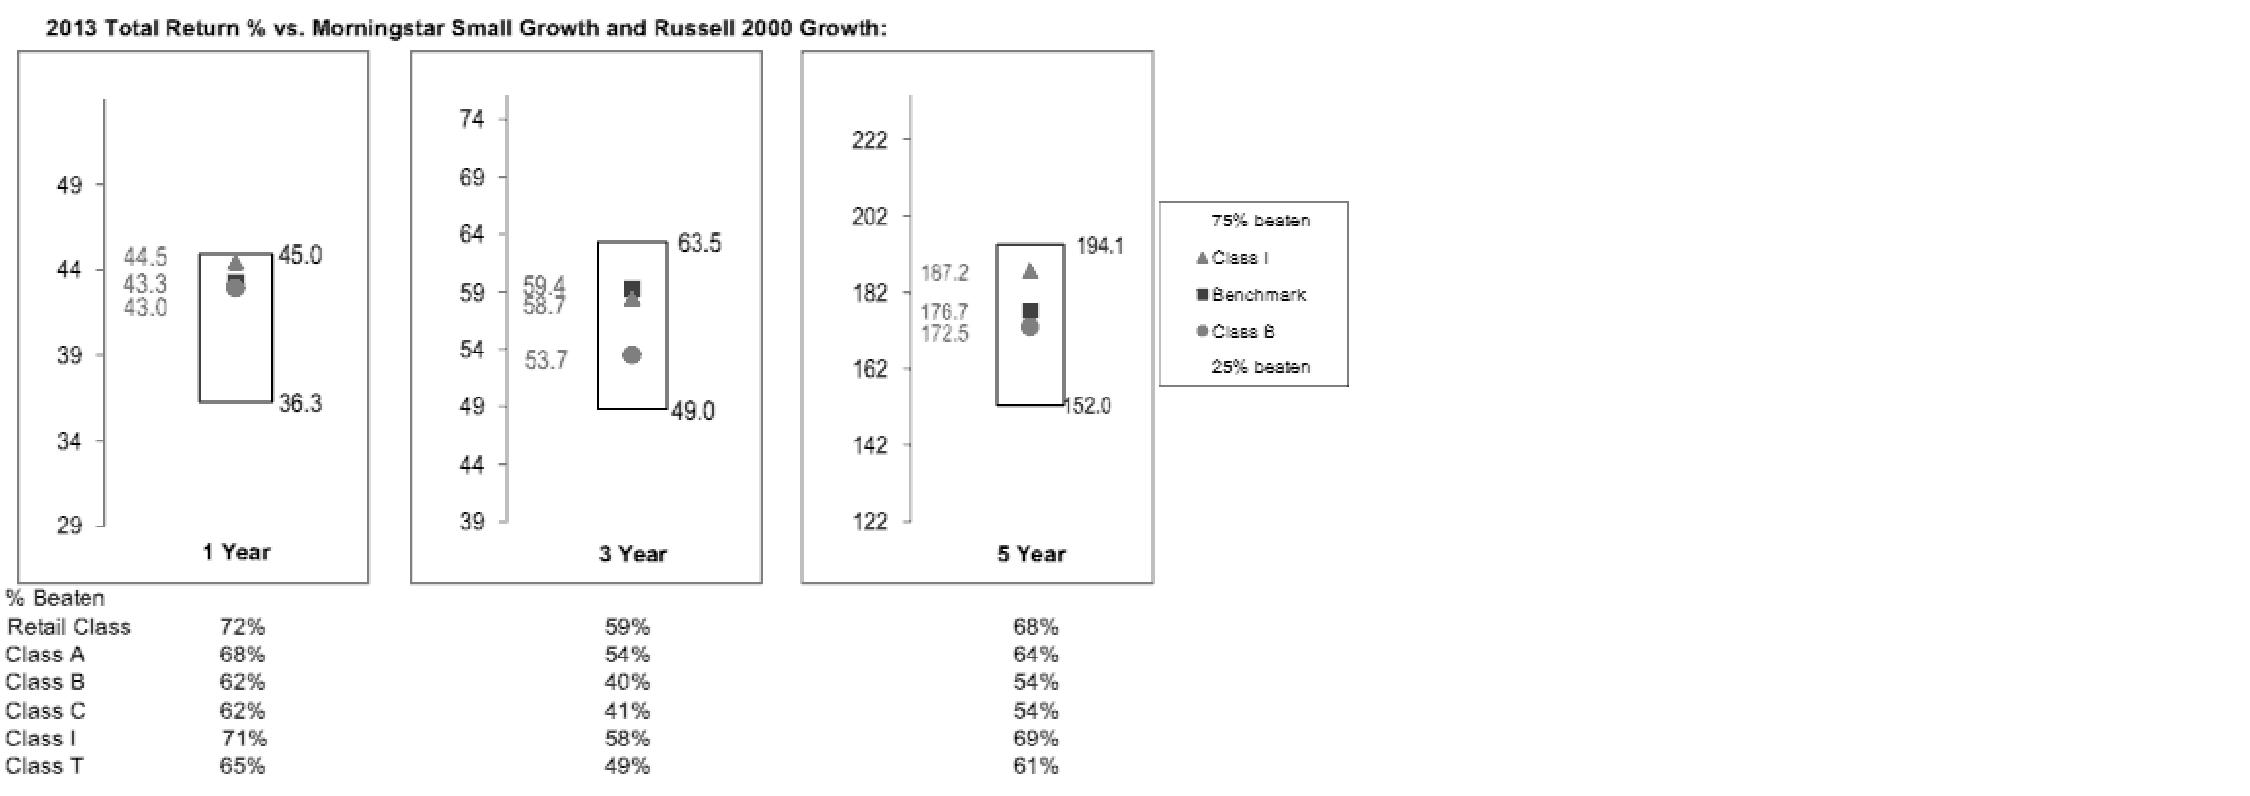
The Board also considered that the fund's management fee is subject to upward or downward adjustment depending upon whether, and to what extent, the fund's investment performance for the performance period exceeds, or is exceeded by, a securities index, thus leading to a performance adjustment for the same period. The Board noted that the performance adjustment provides FMR with a strong economic incentive to seek to achieve superior performance for the fund's shareholders and helps to more closely align the interests of FMR and the fund's shareholders.
Based on its review, the Board concluded that the nature, extent, and quality of services provided to the fund under the Advisory Contracts should benefit the fund's shareholders.
Competitiveness of Management Fee and Total Expense Ratio. The Board considered the fund's management fee and total expense ratio compared to "mapped groups" of competitive funds and classes. Fidelity creates "mapped groups" by combining similar Lipper investment objective categories that have comparable investment mandates. Combining Lipper investment objective categories aids the Board's management fee and total expense ratio comparisons by broadening the competitive group used for comparison and by reducing the number of universes to which various Fidelity funds are compared.
Management Fee. The Board considered two proprietary management fee comparisons for the 12-month periods shown in the chart below. The group of Lipper funds used by the Board for management fee comparisons is referred to below as the "Total Mapped Group." The Total Mapped Group comparison focuses on a fund's standing in terms of gross management fees before expense reimbursements or caps, and without giving effect to the fund's performance adjustment, relative to the total universe of funds with comparable investment mandates, regardless of whether their management fee structures also are comparable. Funds with comparable investment mandates offer exposure to similar types of securities. Funds with comparable management fee structures have similar management fee contractual arrangements (e.g., flat rate charged for advisory services, all-inclusive fee rate, etc.). "TMG %" represents the percentage of funds in the Total Mapped Group that had management fees that were lower than the fund's. For example, a hypothetical TMG % of 20% would mean that 80% of the funds in the Total Mapped Group had higher, and 20% had lower, management fees than the fund. The fund's actual TMG %s are in the chart below. The "Asset-Size Peer Group" (ASPG) comparison focuses on a fund's standing relative to a subset of non-Fidelity funds within the Total Mapped Group that are similar in size and management fee structure. For example, if a fund is in the first quartile of the ASPG, the fund's management fee ranks in the least expensive or lowest 25% of funds in the ASPG. The ASPG represents at least 15% of the funds in the Total Mapped Group with comparable asset size and management fee structures, subject to a minimum of 50 funds (or all funds in the Total Mapped Group if fewer than 50). Additional information, such as the ASPG quartile in which the fund's management fee rate ranked and the impact of the fund's performance adjustment, is also included in the chart and considered by the Board.
Annual Report
Fidelity Small Cap Growth Fund

The Board noted that the fund's management fee rate ranked below the median of its Total Mapped Group and below the median of its ASPG for 2013. The Board also noted the effect of the fund's negative performance adjustment on the fund's management fee ranking.
Annual Report
Board Approval of Investment Advisory Contracts and
Management Fees - continued
The Board also noted that, in August 2013, the ad hoc Committee on Management Fees was formed to conduct an in-depth review of the management fee rates of Fidelity's active equity mutual funds. The Committee focused on the following areas: (i) standard fee structures; (ii) research consumption and trading evolution; (iii) management fee competitiveness/profitability by category; and (iv) factors that drive institutional pricing.
Based on its review, the Board concluded that the fund's management fee is fair and reasonable in light of the services that the fund receives and the other factors considered.
Total Expense Ratio. In its review of each class's total expense ratio, the Board considered the fund's management fee as well as other fund or class expenses, as applicable, such as transfer agent fees, pricing and bookkeeping fees, fund-paid 12b-1 fees, and custodial, legal, and audit fees. The Board also noted the effects of any waivers and reimbursements on fees and expenses, as well as the impact of the fund's performance adjustment. As part of its review, the Board also considered the current and historical total expense ratios of each class of the fund compared to competitive fund median expenses. Each class of the fund is compared to those funds and classes in the Total Mapped Group (used by the Board for management fee comparisons) that have a similar sales load structure.
The Board noted that the total expense ratio of each of Class A, Class B, Class C, Institutional Class, and the retail class ranked below its competitive median for 2013 and the total expense ratio of Class T ranked above its competitive median for 2013. The Board considered that, in general, various factors can affect total expense ratios. The Board noted that the total expense ratio of Class T was above the competitive median primarily because of higher 12b-1 fees on Class T as compared to most competitor funds. Class T has a higher 12b-1 fee, but a lower front-end sales charge, than traditionally priced front-end sales charge classes. The Board considered that Class T is primarily sold load-waived in the retirement plan market where its 0.50% 12b-1 fee is comparable to competing no-load, higher 12b-1 fee classes designed specifically for retirement plans. The Board noted that the fund offers multiple classes, each of which has a different sales load and 12b-1 fee structure, and that the multiple structures are intended to offer a range of pricing options for the intermediary market. The Board also noted that the total expense ratios of the classes vary primarily by the level of their 12b-1 fees, although differences in transfer agent fees may also cause expenses to vary from class to class.
Fees Charged to Other Fidelity Clients. The Board also considered Fidelity fee structures and other information with respect to clients of Fidelity, such as other funds advised or subadvised by Fidelity, pension plan clients, and other institutional clients. The Board noted the findings of the 2013 ad hoc joint committee (created with the board of other Fidelity funds), which reviewed and compared Fidelity's institutional investment advisory business with its business of providing services to the Fidelity funds, including the differences in services provided, fees charged, and costs incurred, as well as competition in their respective marketplaces.
Annual Report
Based on its review of total expense ratios and fees charged to other Fidelity clients, the Board concluded that the total expense ratio of each class of the fund was reasonable, although Class T was above the median of the universe presented for comparison, in light of the services that the fund and its shareholders receive and the other factors considered.
Costs of the Services and Profitability. The Board considered the revenues earned and the expenses incurred by Fidelity in conducting the business of developing, marketing, distributing, managing, administering and servicing the fund and servicing the fund's shareholders. The Board also considered the level of Fidelity's profits in respect of all the Fidelity funds.
On an annual basis, Fidelity presents to the Board Fidelity's profitability for the fund. Fidelity calculates the profitability for each fund, as well as aggregate profitability for groups of Fidelity funds and all Fidelity funds, using a series of detailed revenue and cost allocation methodologies which originate with the books and records of Fidelity on which Fidelity's audited financial statements are based. The Audit Committee of the Board reviews any significant changes from the prior year's methodologies.
PricewaterhouseCoopers LLP (PwC), independent registered public accounting firm and auditor to Fidelity and certain Fidelity funds, has been engaged annually by the Board as part of the Board's assessment of Fidelity's profitability analysis. PwC's engagement includes the review and assessment of the methodologies used by Fidelity in determining the revenues and expenses attributable to Fidelity's mutual fund business, and completion of agreed-upon procedures in respect of the mathematical accuracy of fund profitability and its conformity to established allocation methodologies. After considering PwC's reports issued under the engagement and information provided by Fidelity, the Board concluded that while other allocation methods may also be reasonable, Fidelity's profitability methodologies are reasonable in all material respects.
The Board also reviewed Fidelity's non-fund businesses and fall-out benefits related to the mutual fund business as well as cases where Fidelity's affiliates may benefit from or be related to the fund's business.
The Board considered the costs of the services provided by and the profits realized by Fidelity in connection with the operation of the fund and was satisfied that the profitability was not excessive in the circumstances.
Economies of Scale. The Board considered whether there have been economies of scale in respect of the management of the Fidelity funds, whether the Fidelity funds (including the fund) have appropriately benefited from any such economies of scale, and whether there is potential for realization of any further economies of scale. The Board considered the extent to which the fund will benefit from economies of scale through increased services to the fund, through waivers or reimbursements, or through fee or expense ratio reductions. The Board also noted that in 2013, it and the boards of other Fidelity funds created an ad hoc committee (the Economies of Scale Committee) to analyze whether Fidelity attains economies of scale in respect of the management and servicing of the Fidelity funds, whether the Fidelity funds have appropriately benefited from such economies of scale, and whether there is potential for realization of any further economies of scale.
Annual Report
Board Approval of Investment Advisory Contracts and
Management Fees - continued
The Board recognized that the fund's management contract incorporates a "group fee" structure, which provides for lower group fee rates as total group assets increase, and for higher group fee rates as total group assets decrease (with "group assets" defined to include fund assets under FMR's management plus sector fund assets previously under FMR's management and currently managed by Fidelity SelectCo, LLC). FMR calculates the group fee rates based on a tiered asset "breakpoint" schedule that varies based on asset class. The Board considered that the group fee is designed to deliver the benefits of economies of scale to fund shareholders when total Fidelity fund assets increase, even if assets of any particular fund are unchanged or have declined, because some portion of Fidelity's costs are attributable to services provided to all Fidelity funds, and all funds benefit if those costs can be allocated among more assets. The Board concluded that, given the group fee structure, fund shareholders will benefit from lower management fees as group assets increase at the fund complex level, regardless of whether Fidelity achieves any such economies of scale.
The Board concluded, taking into account the analysis of the Economies of Scale Committee, that economies of scale, if any, are being appropriately shared between fund shareholders and Fidelity.
Additional Information Requested by the Board. In order to develop fully the factual basis for consideration of the Fidelity funds' Advisory Contracts, the Board requested and received additional information on certain topics, including: (i) fund performance trends and Fidelity's long-term strategies for certain funds; (ii) Fidelity's strategic marketing and product lineup goals; (iii) the methodology with respect to competitive fund data and peer group classifications; (iv) the arrangements with, and performance of, certain sub-advisers on behalf of the Fidelity funds, as well as certain proposed participating affiliate arrangements; (v) the realization of fall-out benefits in certain Fidelity business units; (vi) Fidelity's group fee structures, including the rationale for the individual fee rates of certain categories of funds and the definition of group assets; (vii) trends regarding industry use of performance fee structures and the performance adjustment methodologies applicable to the Fidelity funds; (viii) additional competitive analysis regarding the total expenses for certain classes; (ix) fund profitability methodology, including Fidelity's cost allocation methodology, and the impact of certain factors on fund profitability results; and (x) the process by which Fidelity determines sub-advisory fees for funds it advises.
Annual Report
Based on its evaluation of all of the conclusions noted above, and after considering all factors it believed relevant, the Board ultimately concluded that the advisory fee structures are fair and reasonable, and that the fund's Advisory Contracts should be renewed.
Annual Report
Investment Adviser
Fidelity Management & Research Company
Boston, MA
Investment Sub-Advisers
FMR Co., Inc.
Fidelity Management & Research
(U.K.) Inc.
Fidelity Management & Research
(Hong Kong) Limited
Fidelity Management & Research
(Japan) Inc.
General Distributor
Fidelity Distributors Corporation
Smithfield, RI
Transfer and Service Agents
Fidelity Investments Institutional
Operations Company, Inc.
Boston, MA
Fidelity Service Company, Inc.
Boston, MA
Custodian
Citibank, N.A.
New York, NY
The Fidelity Telephone Connection
Mutual Fund 24-Hour Service
Exchanges/Redemptions
and Account Assistance 1-800-544-6666
Product Information 1-800-544-6666
Retirement Accounts 1-800-544-4774
(8 a.m. - 9 p.m.)
TDD Service 1-800-544-0118
for the deaf and hearing impaired
(9 a.m. - 9 p.m. Eastern time)
Fidelity Automated Service
Telephone (FAST®)
1-800-544-5555
Automated line for quickest service
(Fidelity Investment logo)(registered trademark)
Corporate Headquarters
245 Summer St., Boston, MA 02210
www.fidelity.com
SCP-UANN-0914
1.803694.109
(Fidelity Investment logo)(registered trademark)
Fidelity Advisor®
Small Cap Value
Fund - Class A, Class T,
Class B and Class C
Annual Report
July 31, 2014
(Fidelity Cover Art)
Class A, Class T, Class B
and Class C are classes of
Fidelity® Small Cap Value Fund
Contents
Performance | (Click Here) | How the fund has done over time. |
Management's Discussion of Fund Performance | (Click Here) | The Portfolio Managers' review of fund performance and strategy. |
Shareholder Expense Example | (Click Here) | An example of shareholder expenses. |
Investment Changes | (Click Here) | A summary of major shifts in the fund's investments over the past six months. |
Investments | (Click Here) | A complete list of the fund's investments with their market values. |
Financial Statements | (Click Here) | Statements of assets and liabilities, operations, and changes in net assets, as well as financial highlights. |
Notes | (Click Here) | Notes to the financial statements. |
Report of Independent Registered Public Accounting Firm | (Click Here) | |
Trustees and Officers | (Click Here) | |
Distributions | (Click Here) | |
Board Approval of Investment Advisory Contracts and Management Fees | (Click Here) | |
To view a fund's proxy voting guidelines and proxy voting record for the 12-month period ended June 30, visit http://www.fidelity.com/proxyvotingresults or visit the Securities and Exchange Commission's (SEC) web site at http://www.sec.gov. You may also call 1-877-208-0098 to request a free copy of the proxy voting guidelines.
Standard & Poor's, S&P and S&P 500 are registered service marks of The McGraw-Hill Companies, Inc. and have been licensed for use by Fidelity Distributors Corporation.
Other third-party marks appearing herein are the property of their respective owners.
All other marks appearing herein are registered or unregistered trademarks or service marks of FMR LLC or an affiliated company. © 2014 FMR LLC. All rights reserved.
Annual Report
This report and the financial statements contained herein are submitted for the general information of the shareholders of the fund. This report is not authorized for distribution to prospective investors in the fund unless preceded or accompanied by an effective prospectus.
A fund files its complete schedule of portfolio holdings with the SEC for the first and third quarters of each fiscal year on Form N-Q. Forms N-Q are available on the SEC's web site at http://www.sec.gov. A fund's Forms N-Q may be reviewed and copied at the SEC's Public Reference Room in Washington, DC. Information regarding the operation of the SEC's Public Reference Room may be obtained by calling 1-800-SEC-0330. For a complete list of a fund's portfolio holdings, view the most recent holdings listing, semiannual report, or annual report on Fidelity's web site at http://www.fidelity.com, http://www.advisor.fidelity.com, or http://www.401k.com, as applicable.
NOT FDIC INSURED • MAY LOSE VALUE • NO BANK GUARANTEE
Neither the fund nor Fidelity Distributors Corporation is a bank.
Annual Report
Average annual total return reflects the change in the value of an investment, assuming reinvestment of the class' distributions from dividend income and capital gains (the profits earned upon the sale of securities that have grown in value, if any) and assuming a constant rate of performance each year. The $10,000 table and the fund's returns do not reflect the deduction of taxes that a shareholder would pay on fund distributions or the redemption of fund shares. During periods of reimbursement by Fidelity, a fund's total return will be greater than it would be had the reimbursement not occurred. How a fund did yesterday is no guarantee of how it will do tomorrow. Returns reflect the conversion of Class B shares to Class A shares after a maximum of seven years.
Average Annual Total Returns
Periods ended July 31, 2014 | Past 1
year | Past 5
years | Life of
fundA |
Class A (incl. 5.75% sales charge) | 0.69% | 15.38% | 10.29% |
Class T (incl. 3.50% sales charge) | 2.85% | 15.64% | 10.29% |
Class B (incl. contingent deferred sales charge) B | 1.15% | 15.63% | 10.36% |
Class C (incl. contingent deferred sales charge) C | 5.02% | 15.85% | 10.14% |
A From November 3, 2004.
B Class B shares' contingent deferred sales charges included in the past one year, past five years, and life of fund total return figures are 5%, 2%, and 0%, respectively.
C Class C shares' contingent deferred sales charges included in the past one year, past five years, and life of fund total return figures are 1%, 0%, and 0%, respectively.
Annual Report
$10,000 Over Life of Fund
Let's say hypothetically that $10,000 was invested in Fidelity Advisor® Small Cap Value Fund - Class A on November 3, 2004, when the fund started, and the current 5.75% sales charge was paid. The chart shows how the value of your investment would have changed, and also shows how the Russell 2000® Value Index performed over the same period.
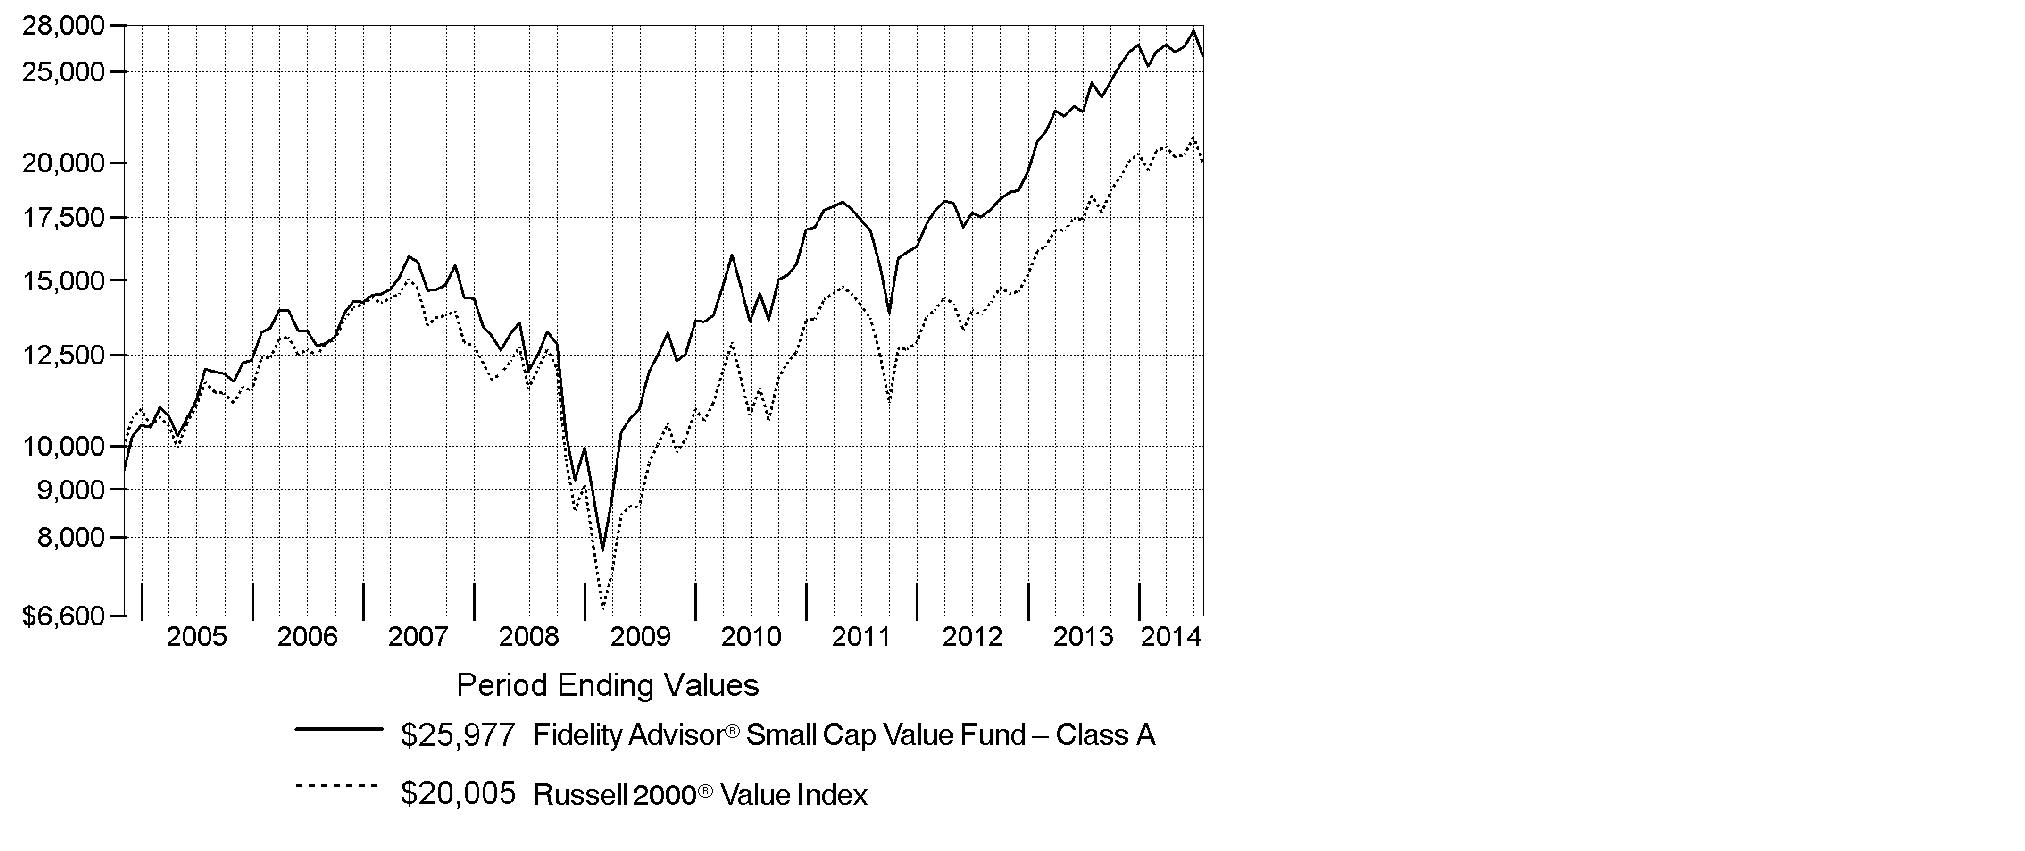
Annual Report
Market Recap: U.S. stocks overcame a slowing economy early in 2014 to post a strong gain for the 12-month period ending July 31, 2014, supported by corporate profits and continued low interest rates. The S&P 500® Index rose 16.94%, reaching an all-time high near period end. The technology-heavy Nasdaq Composite Index® gained 22.00%. The Russell 2000® Index returned 8.56%, reflecting the relatively lackluster performance of small-cap stocks. Information technology (+28%) was the top-performing sector within the S&P 500®, driven by strong semiconductor and computer hardware sales. Materials (+23%) gained amid higher prices for many commodity products. Health care (+21%) rose, driven by gains in pharmaceuticals, biotechnology & life sciences companies. Energy stocks (+19%) advanced in the latter part of the period amid healthy U.S. output and the threat of supply disruptions in Iraq. Conversely, most defensive sectors, including consumer staples, utilities and telecommunication services, lagged the broader market. Volatility remained tame throughout most of the period, with markets supported by declining unemployment, near-record profit margins for companies, muted cost inflation and fairly low corporate debt levels. Geopolitical tension remained a concern at period end, with conflict in Ukraine and strained relations between Russia and the West posing a potential threat to global growth.
Comments from Charles Myers and Derek Janssen, Lead Portfolio Manager and Co-Portfolio Manager, respectively, of Fidelity Advisor® Small Cap Value Fund: For the year, the fund's Class A, Class T, Class B and Class C shares returned 6.83%, 6.58%, 5.92% and 5.97%, respectively (excluding sales charges), trailing the 8.18% gain of the benchmark Russell 2000® Value Index. The fund was hampered the most by subpar security selection in industrials. Conversely, the fund enjoyed very good results from our picks in information technology. The biggest detractor by far was furniture and appliance rent-to-own business Rent-A-Center, which faced several business challenges during the period. Another notable detractor was Quad/Graphics, a very inexpensively valued commercial printing company. After Quad/Graphics issued a disappointing financial report in November, we reassessed our position in the stock and began to reduce the fund's stake. In contrast, the fund benefited from an out-of-benchmark position in Chemed, which runs two very different businesses - the Roto-Rooter® plumbing service and a network of professionals offering end-of-life hospice care. Chemed's shares rose about 44% during the period. Another boost came from owning energy companies LinnCo and Berry Petroleum, the latter of which was acquired by the former. Chemed and LinnCo were not in the index.
The views expressed above reflect those of the portfolio manager(s) only through the end of the period as stated on the cover of this report and do not necessarily represent the views of Fidelity or any other person in the Fidelity organization. Any such views are subject to change at any time based upon market or other conditions and Fidelity disclaims any responsibility to update such views. These views may not be relied on as investment advice and, because investment decisions for a Fidelity fund are based on numerous factors, may not be relied on as an indication of trading intent on behalf of any Fidelity fund.
Annual Report
Shareholder Expense Example
As a shareholder of the Fund, you incur two types of costs: (1) transaction costs, including sales charges (loads) on purchase payments or redemption proceeds, redemption fees and (2) ongoing costs, including management fees, distribution and/or service (12b-1) fees and other Fund expenses. This Example is intended to help you understand your ongoing costs (in dollars) of investing in the Fund and to compare these costs with the ongoing costs of investing in other mutual funds.
The Example is based on an investment of $1,000 invested at the beginning of the period and held for the entire period (February 1, 2014 to July 31, 2014).
Actual Expenses
The first line of the accompanying table for each class of the Fund provides information about actual account values and actual expenses. You may use the information in this line, together with the amount you invested, to estimate the expenses that you paid over the period. Simply divide your account value by $1,000.00 (for example, an $8,600 account value divided by $1,000.00 = 8.6), then multiply the result by the number in the first line for a class of the Fund under the heading entitled "Expenses Paid During Period" to estimate the expenses you paid on your account during this period. A small balance maintenance fee of $12.00 that is charged once a year may apply for certain accounts with a value of less than $2,000. This fee is not included in the table below. If it was, the estimate of expenses you paid during the period would be higher, and your ending account value lower, by this amount. In addition, the Fund, as a shareholder in the underlying Fidelity Central Funds, will indirectly bear its pro-rata share of the fees and expenses incurred by the underlying Fidelity Central Funds. These fees and expenses are not included in the Fund's annualized expense ratio used to calculate the expense estimate in the table below.
Hypothetical Example for Comparison Purposes
The second line of the accompanying table for each class of the Fund provides information about hypothetical account values and hypothetical expenses based on a Class' actual expense ratio and an assumed rate of return of 5% per year before expenses, which is not the Class' actual return. The hypothetical account values and expenses may not be used to estimate the actual ending account balance or expenses you paid for the period. You may use this information to compare the ongoing costs of investing in the Fund and other funds. To do so, compare this 5% hypothetical example with the 5% hypothetical examples that appear in the shareholder reports of the other funds. A small balance maintenance fee of $12.00 that is charged once a year may apply for certain accounts with a value of less than $2,000. This fee is not included in the table below. If it was, the estimate of expenses you paid during the period would be higher, and your ending account value lower, by this amount. In addition, the Fund, as a shareholder in the underlying Fidelity Central Funds, will indirectly bear its pro-rata share of the fees and expenses incurred by the underlying Fidelity Central Funds. These fees and expenses are not included in the Fund's annualized expense ratio used to calculate the expense estimate in the table below.
Please note that the expenses shown in the table are meant to highlight your ongoing costs only and do not reflect any transaction costs. Therefore, the second line of the table is useful in comparing ongoing costs only, and will not help you determine the relative total costs of owning different funds. In addition, if these transactional costs were included, your costs would have been higher.
Annual Report
| Annualized
Expense RatioB | Beginning
Account Value
February 1, 2014 | Ending
Account Value
July 31, 2014 | Expenses Paid
During Period*
February 1, 2014
to July 31, 2014 |
Class A | 1.38% | | | |
Actual | | $ 1,000.00 | $ 1,027.20 | $ 6.94 |
HypotheticalA | | $ 1,000.00 | $ 1,017.95 | $ 6.90 |
Class T | 1.62% | | | |
Actual | | $ 1,000.00 | $ 1,025.90 | $ 8.14 |
HypotheticalA | | $ 1,000.00 | $ 1,016.76 | $ 8.10 |
Class B | 2.21% | | | |
Actual | | $ 1,000.00 | $ 1,023.10 | $ 11.09 |
HypotheticalA | | $ 1,000.00 | $ 1,013.84 | $ 11.04 |
Class C | 2.14% | | | |
Actual | | $ 1,000.00 | $ 1,023.10 | $ 10.73 |
HypotheticalA | | $ 1,000.00 | $ 1,014.18 | $ 10.69 |
Small Cap Value | 1.10% | | | |
Actual | | $ 1,000.00 | $ 1,028.40 | $ 5.53 |
HypotheticalA | | $ 1,000.00 | $ 1,019.34 | $ 5.51 |
Institutional Class | 1.11% | | | |
Actual | | $ 1,000.00 | $ 1,028.40 | $ 5.58 |
HypotheticalA | | $ 1,000.00 | $ 1,019.29 | $ 5.56 |
A 5% return per year before expenses
B Annualized expense ratio reflects expenses net of applicable fee waivers.
* Expenses are equal to each Class' annualized expense ratio, multiplied by the average account value over the period, multiplied by 181/365 (to reflect the one-half year period).
Annual Report
Investment Changes (Unaudited)
Top Ten Stocks as of July 31, 2014 |
| % of fund's
net assets | % of fund's net assets
6 months ago |
Tech Data Corp. | 2.9 | 2.6 |
PacWest Bancorp | 2.9 | 1.8 |
Federated Investors, Inc. Class B (non-vtg.) | 2.9 | 2.9 |
TCF Financial Corp. | 2.8 | 2.8 |
World Fuel Services Corp. | 2.8 | 3.0 |
Endurance Specialty Holdings Ltd. | 2.5 | 2.7 |
First Citizen Bancshares, Inc. | 2.3 | 1.9 |
Ingram Micro, Inc. Class A | 2.3 | 1.9 |
DCT Industrial Trust, Inc. | 2.3 | 2.0 |
Aspen Insurance Holdings Ltd. | 2.3 | 2.1 |
| 26.0 | |
Top Five Market Sectors as of July 31, 2014 |
| % of fund's
net assets | % of fund's net assets
6 months ago |
Financials | 40.8 | 38.9 |
Industrials | 14.3 | 14.8 |
Information Technology | 13.1 | 13.5 |
Consumer Discretionary | 10.4 | 11.9 |
Health Care | 6.6 | 5.5 |
Asset Allocation (% of fund's net assets) |
As of July 31, 2014* | As of January 31, 2014** |
| Stocks 99.5% | | | Stocks 100.0% | |
| Short-Term
Investments and
Net Other Assets (Liabilities) 0.5% | | | Short-Term
Investments and
Net Other Assets (Liabilities) 0.0% | |
* Foreign investments | 8.9% | | ** Foreign investments | 7.5% | |

Annual Report
Investments July 31, 2014
Showing Percentage of Net Assets
Common Stocks - 99.5% |
| Shares | | Value |
CONSUMER DISCRETIONARY - 10.4% |
Auto Components - 0.2% |
Standard Motor Products, Inc. | 143,301 | | $ 5,166,001 |
Diversified Consumer Services - 0.7% |
Regis Corp. | 1,515,900 | | 21,116,487 |
Multiline Retail - 1.9% |
Big Lots, Inc. | 1,212,700 | | 53,055,625 |
Specialty Retail - 7.5% |
Aarons, Inc. Class A | 2,295,100 | | 60,544,738 |
Genesco, Inc. (a) | 617,728 | | 47,114,115 |
Murphy U.S.A., Inc. (a) | 1,060,715 | | 52,420,535 |
Rent-A-Center, Inc. | 1,646,367 | | 39,414,026 |
Tsutsumi Jewelry Co. Ltd. | 520,900 | | 13,304,726 |
| | 212,798,140 |
Textiles, Apparel & Luxury Goods - 0.1% |
Vera Bradley, Inc. (a) | 231,000 | | 4,580,730 |
TOTAL CONSUMER DISCRETIONARY | | 296,716,983 |
CONSUMER STAPLES - 2.7% |
Food Products - 1.5% |
Post Holdings, Inc. (a) | 931,300 | | 41,833,996 |
Tobacco - 1.2% |
Universal Corp. (d) | 660,000 | | 34,273,800 |
TOTAL CONSUMER STAPLES | | 76,107,796 |
ENERGY - 4.8% |
Energy Equipment & Services - 0.4% |
ShawCor Ltd. Class A | 246,000 | | 12,451,727 |
Oil, Gas & Consumable Fuels - 4.4% |
LinnCo LLC (d) | 507,788 | | 14,771,553 |
Northern Oil & Gas, Inc. (a)(d) | 1,958,249 | | 31,508,226 |
World Fuel Services Corp. | 1,823,800 | | 78,332,210 |
| | 124,611,989 |
TOTAL ENERGY | | 137,063,716 |
FINANCIALS - 40.8% |
Banks - 14.4% |
Associated Banc-Corp. | 2,945,300 | | 52,779,776 |
City National Corp. | 840,300 | | 63,232,575 |
Common Stocks - continued |
| Shares | | Value |
FINANCIALS - continued |
Banks - continued |
CVB Financial Corp. | 2,361,688 | | $ 36,110,210 |
First Citizen Bancshares, Inc. | 296,324 | | 65,887,642 |
National Penn Bancshares, Inc. | 2,759,400 | | 28,421,820 |
PacWest Bancorp | 2,004,105 | | 83,511,055 |
TCF Financial Corp. | 5,039,800 | | 79,679,238 |
| | 409,622,316 |
Capital Markets - 3.6% |
Federated Investors, Inc. Class B (non-vtg.) (d) | 2,949,963 | | 83,247,956 |
Waddell & Reed Financial, Inc. Class A | 339,100 | | 17,901,089 |
| | 101,149,045 |
Consumer Finance - 1.9% |
Cash America International, Inc. | 559,700 | | 24,845,083 |
EZCORP, Inc. (non-vtg.) Class A (a) | 1,412,488 | | 13,828,258 |
World Acceptance Corp. (a)(d) | 181,500 | | 14,716,020 |
| | 53,389,361 |
Insurance - 9.4% |
Aspen Insurance Holdings Ltd. | 1,599,400 | | 63,991,994 |
Endurance Specialty Holdings Ltd. | 1,352,400 | | 71,528,436 |
Platinum Underwriters Holdings Ltd. | 1,001,999 | | 58,717,141 |
ProAssurance Corp. | 793,200 | | 34,607,316 |
StanCorp Financial Group, Inc. | 631,300 | | 38,092,642 |
| | 266,937,529 |
Real Estate Investment Trusts - 7.0% |
DCT Industrial Trust, Inc. | 8,229,086 | | 64,433,743 |
Franklin Street Properties Corp. | 3,480,800 | | 42,256,912 |
National Retail Properties, Inc. (d) | 883,400 | | 31,422,538 |
Rouse Properties, Inc. (d)(e) | 3,600,000 | | 61,020,000 |
| | 199,133,193 |
Real Estate Management & Development - 1.1% |
Kennedy Wilson Europe Real Estate PLC | 1,684,900 | | 30,209,829 |
Thrifts & Mortgage Finance - 3.4% |
Astoria Financial Corp. | 3,403,499 | | 43,837,067 |
Washington Federal, Inc. | 2,492,000 | | 52,232,320 |
| | 96,069,387 |
TOTAL FINANCIALS | | 1,156,510,660 |
Common Stocks - continued |
| Shares | | Value |
HEALTH CARE - 6.6% |
Health Care Equipment & Supplies - 2.4% |
Hill-Rom Holdings, Inc. | 773,200 | | $ 30,464,080 |
Integra LifeSciences Holdings Corp. (a) | 809,200 | | 38,372,264 |
| | 68,836,344 |
Health Care Providers & Services - 3.0% |
AmSurg Corp. (a) | 893,800 | | 42,687,888 |
Chemed Corp. (d) | 423,700 | | 43,153,845 |
| | 85,841,733 |
Pharmaceuticals - 1.2% |
Theravance, Inc. (a)(d) | 1,507,033 | | 32,702,616 |
TOTAL HEALTH CARE | | 187,380,693 |
INDUSTRIALS - 14.3% |
Air Freight & Logistics - 0.9% |
Atlas Air Worldwide Holdings, Inc. (a) | 780,133 | | 26,696,151 |
Commercial Services & Supplies - 5.2% |
ACCO Brands Corp. (a)(e) | 7,611,200 | | 50,386,144 |
Knoll, Inc. | 1,269,800 | | 21,345,338 |
Quad/Graphics, Inc. | 1,250,849 | | 26,417,931 |
United Stationers, Inc. | 1,301,398 | | 50,207,935 |
| | 148,357,348 |
Electrical Equipment - 4.4% |
AZZ, Inc. | 770,000 | | 33,602,800 |
EnerSys | 743,700 | | 47,172,891 |
GrafTech International Ltd. (a)(d) | 5,212,200 | | 43,782,480 |
| | 124,558,171 |
Machinery - 1.6% |
Blount International, Inc. (a) | 1,850,200 | | 24,163,612 |
Columbus McKinnon Corp. (NY Shares) | 776,000 | | 18,042,000 |
Mueller Industries, Inc. | 80,000 | | 2,226,400 |
| | 44,432,012 |
Trading Companies & Distributors - 2.2% |
WESCO International, Inc. (a)(d) | 777,933 | | 61,059,961 |
TOTAL INDUSTRIALS | | 405,103,643 |
INFORMATION TECHNOLOGY - 13.1% |
Communications Equipment - 1.5% |
Polycom, Inc. (a) | 3,242,475 | | 41,568,530 |
Common Stocks - continued |
| Shares | | Value |
INFORMATION TECHNOLOGY - continued |
Electronic Equipment & Components - 6.4% |
Ingram Micro, Inc. Class A (a) | 2,248,300 | | $ 64,526,210 |
SYNNEX Corp. (a) | 527,200 | | 34,004,400 |
Tech Data Corp. (a) | 1,336,373 | | 83,910,860 |
| | 182,441,470 |
Internet Software & Services - 1.0% |
j2 Global, Inc. | 574,300 | | 28,094,756 |
IT Services - 2.0% |
CACI International, Inc. Class A (a) | 828,334 | | 57,146,763 |
Software - 2.2% |
SS&C Technologies Holdings, Inc. (a) | 1,418,900 | | 61,452,559 |
TOTAL INFORMATION TECHNOLOGY | | 370,704,078 |
MATERIALS - 3.0% |
Containers & Packaging - 1.3% |
Silgan Holdings, Inc. | 750,000 | | 36,915,000 |
Metals & Mining - 1.7% |
Haynes International, Inc. | 376,903 | | 18,769,769 |
RTI International Metals, Inc. (a) | 1,230,500 | | 30,590,230 |
| | 49,359,999 |
TOTAL MATERIALS | | 86,274,999 |
UTILITIES - 3.8% |
Electric Utilities - 2.8% |
El Paso Electric Co. | 974,121 | | 35,896,359 |
IDACORP, Inc. | 822,000 | | 44,018,100 |
| | 79,914,459 |
Gas Utilities - 1.0% |
Southwest Gas Corp. | 547,656 | | 27,125,402 |
TOTAL UTILITIES | | 107,039,861 |
TOTAL COMMON STOCKS (Cost $2,315,504,569) |
2,822,902,429
|
Money Market Funds - 5.5% |
| Shares | | Value |
Fidelity Cash Central Fund, 0.11% (b) | 10,267,832 | | $ 10,267,832 |
Fidelity Securities Lending Cash Central Fund, 0.11% (b)(c) | 145,531,995 | | 145,531,995 |
TOTAL MONEY MARKET FUNDS (Cost $155,799,827) |
155,799,827
|
TOTAL INVESTMENT PORTFOLIO - 105.0% (Cost $2,471,304,396) | | 2,978,702,256 |
NET OTHER ASSETS (LIABILITIES) - (5.0)% | | (141,148,058) |
NET ASSETS - 100% | $ 2,837,554,198 |
Legend |
(a) Non-income producing |
(b) Affiliated fund that is generally available only to investment companies and other accounts managed by Fidelity Investments. The rate quoted is the annualized seven-day yield of the fund at period end. A complete unaudited listing of the fund's holdings as of its most recent quarter end is available upon request. In addition, each Fidelity Central Fund's financial statements, which are not covered by the Fund's Report of Independent Registered Public Accounting Firm, are available on the SEC's website or upon request. |
(c) Investment made with cash collateral received from securities on loan. |
(d) Security or a portion of the security is on loan at period end. |
(e) Affiliated company |
Affiliated Central Funds |
Information regarding fiscal year to date income earned by the Fund from investments in Fidelity Central Funds is as follows: |
Fund | Income earned |
Fidelity Cash Central Fund | $ 18,564 |
Fidelity Securities Lending Cash Central Fund | 874,417 |
Total | $ 892,981 |
Other Affiliated Issuers |
An affiliated company is a company in which the Fund has ownership of at least 5% of the voting securities. Fiscal year to date transactions with companies which are or were affiliates are as follows: |
Affiliate | Value,
beginning of
period | Purchases | Sales
Proceeds* | Dividend
Income | Value,
end of
period |
ACCO Brands Corp. | $ 70,270,150 | $ 3,955,917 | $ 21,579,480 | $ - | $ 50,386,144 |
Astoria Financial Corp. | 63,439,988 | - | 24,073,100 | 616,420 | - |
Blount International, Inc. | 39,210,500 | - | 14,064,571 | - | - |
CACI International, Inc. Class A | 84,031,458 | - | 31,369,100 | - | - |
Columbus McKinnon Corp. (NY Shares) | 23,226,000 | - | 7,378,820 | 31,040 | - |
Franklin Street Properties Corp. | 63,888,000 | 6,710,106 | 24,031,632 | 2,914,733 | - |
GrafTech International Ltd. | 57,971,680 | - | 28,363,648 | - | - |
HNI Corp. | 97,287,208 | - | 94,962,777 | 1,325,907 | - |
Monotype Imaging Holdings, Inc. | 61,318,401 | - | 69,874,384 | 297,102 | - |
Platinum Underwriters Holdings Ltd. | 85,165,691 | - | 29,187,426 | 360,872 | - |
Quad/Graphics, Inc. | 75,007,000 | - | 34,701,403 | 2,238,965 | - |
Regis Corp. | 57,598,920 | - | 27,623,343 | 337,920 | - |
Rouse Properties, Inc. | - | 62,526,334 | - | 612,000 | 61,020,000 |
RTI International Metals, Inc. | 57,622,000 | - | 22,511,670 | - | - |
Tech Data Corp. | 98,763,117 | 6,654,871 | 38,603,914 | - | - |
Valassis Comm-unications, Inc. | 60,210,064 | 211,335 | 68,200,733 | 1,121,822 | - |
Total | $ 995,010,177 | $ 80,058,563 | $ 536,526,001 | $ 9,856,781 | $ 111,406,144 |
* Includes the value of securities delivered through in-kind transactions. |
Other Information |
The following is a summary of the inputs used, as of July 31, 2014, involving the Fund's assets and liabilities carried at fair value. The inputs or methodology used for valuing securities may not be an indication of the risk associated with investing in those securities. For more information on valuation inputs, and their aggregation into the levels used in the table below, please refer to the Investment Valuation section in the accompanying Notes to Financial Statements. |
Valuation Inputs at Reporting Date: |
Description | Total | Level 1 | Level 2 | Level 3 |
Investments in Securities: | | | | |
Equities: | | | | |
Consumer Discretionary | $ 296,716,983 | $ 283,412,257 | $ 13,304,726 | $ - |
Consumer Staples | 76,107,796 | 76,107,796 | - | - |
Energy | 137,063,716 | 137,063,716 | - | - |
Financials | 1,156,510,660 | 1,156,510,660 | - | - |
Health Care | 187,380,693 | 187,380,693 | - | - |
Industrials | 405,103,643 | 405,103,643 | - | - |
Information Technology | 370,704,078 | 370,704,078 | - | - |
Materials | 86,274,999 | 86,274,999 | - | - |
Utilities | 107,039,861 | 107,039,861 | - | - |
Money Market Funds | 155,799,827 | 155,799,827 | - | - |
Total Investments in Securities: | $ 2,978,702,256 | $ 2,965,397,530 | $ 13,304,726 | $ - |
See accompanying notes which are an integral part of the financial statements.
Annual Report
Statement of Assets and Liabilities
| July 31, 2014 |
| | |
Assets | | |
Investment in securities, at value (including securities loaned of $139,656,509) - See accompanying schedule: Unaffiliated issuers (cost $2,195,838,822) | $ 2,711,496,285 | |
Fidelity Central Funds (cost $155,799,827) | 155,799,827 | |
Other affiliated issuers (cost $119,665,747) | 111,406,144 | |
Total Investments (cost $2,471,304,396) | | $ 2,978,702,256 |
Cash | | 237,291 |
Receivable for investments sold | | 12,220,217 |
Receivable for fund shares sold | | 1,958,797 |
Dividends receivable | | 1,752,464 |
Distributions receivable from Fidelity Central Funds | | 436,344 |
Receivable from investment adviser for expense reductions | | 2,252 |
Other receivables | | 19,623 |
Total assets | | 2,995,329,244 |
| | |
Liabilities | | |
Payable for investments purchased | $ 3,264,421 | |
Payable for fund shares redeemed | 6,046,837 | |
Accrued management fee | 2,105,803 | |
Distribution and service plan fees payable | 166,855 | |
Other affiliated payables | 588,008 | |
Other payables and accrued expenses | 71,127 | |
Collateral on securities loaned, at value | 145,531,995 | |
Total liabilities | | 157,775,046 |
| | |
Net Assets | | $ 2,837,554,198 |
Net Assets consist of: | | |
Paid in capital | | $ 2,049,137,933 |
Undistributed net investment income | | 5,856,882 |
Accumulated undistributed net realized gain (loss) on investments and foreign currency transactions | | 275,161,523 |
Net unrealized appreciation (depreciation) on investments | | 507,397,860 |
Net Assets | | $ 2,837,554,198 |
See accompanying notes which are an integral part of the financial statements.
Annual Report
Financial Statements - continued
Statement of Assets and Liabilities - continued
| July 31, 2014 |
| | |
Calculation of Maximum Offering Price Class A:
Net Asset Value and redemption price per share ($258,183,354 ÷ 13,385,509 shares) | | $ 19.29 |
| | |
Maximum offering price per share (100/94.25 of $19.29) | | $ 20.47 |
Class T:
Net Asset Value and redemption price per share ($100,975,244 ÷ 5,321,352 shares) | | $ 18.98 |
| | |
Maximum offering price per share (100/96.50 of $18.98) | | $ 19.67 |
Class B:
Net Asset Value and offering price per share ($4,808,237 ÷ 264,509 shares)A | | $ 18.18 |
| | |
Class C:
Net Asset Value and offering price per share ($70,541,309 ÷ 3,877,443 shares)A | | $ 18.19 |
| | |
Small Cap Value:
Net Asset Value, offering price and redemption price per share ($2,060,546,290 ÷ 105,297,795 shares) | | $ 19.57 |
| | |
Institutional Class:
Net Asset Value, offering price and redemption price per share ($342,499,764 ÷ 17,499,817 shares) | | $ 19.57 |
A Redemption price per share is equal to net asset value less any applicable contingent deferred sales charge.
See accompanying notes which are an integral part of the financial statements.
Annual Report
Statement of Operations
| Year ended July 31, 2014 |
| | |
Investment Income | | |
Dividends (including $9,856,781 earned from other affiliated issuers) | | $ 48,393,147 |
Interest | | 45 |
Income from Fidelity Central Funds | | 892,981 |
Total income | | 49,286,173 |
| | |
Expenses | | |
Management fee
Basic fee | $ 23,398,200 | |
Performance adjustment | 4,827,948 | |
Transfer agent fees | 6,404,064 | |
Distribution and service plan fees | 2,067,458 | |
Accounting and security lending fees | 952,058 | |
Custodian fees and expenses | 56,759 | |
Independent trustees' compensation | 14,296 | |
Registration fees | 132,108 | |
Audit | 64,853 | |
Legal | 12,312 | |
Interest | 652 | |
Miscellaneous | 33,881 | |
Total expenses before reductions | 37,964,589 | |
Expense reductions | (631,182) | 37,333,407 |
Net investment income (loss) | | 11,952,766 |
Realized and Unrealized Gain (Loss) Net realized gain (loss) on: | | |
Investment securities: | | |
Unaffiliated issuers | 375,645,847 | |
Redemption in-kind with affiliated entities (including gain from Other affiliated issuers of $109,056,467) | 464,750,352 | |
Other affiliated issuers | 85,451,270 | |
Foreign currency transactions | (5,181) | |
Total net realized gain (loss) | | 925,842,288 |
Change in net unrealized appreciation (depreciation) on: Investment securities | (668,247,397) | |
Assets and liabilities in foreign currencies | (1,683) | |
Total change in net unrealized appreciation (depreciation) | | (668,249,080) |
Net gain (loss) | | 257,593,208 |
Net increase (decrease) in net assets resulting from operations | | $ 269,545,974 |
See accompanying notes which are an integral part of the financial statements.
Annual Report
Financial Statements - continued
Statement of Changes in Net Assets
| Year ended
July 31,
2014 | Year ended
July 31,
2013 |
Increase (Decrease) in Net Assets | | |
Operations | | |
Net investment income (loss) | $ 11,952,766 | $ 24,107,442 |
Net realized gain (loss) | 925,842,288 | 300,684,864 |
Change in net unrealized appreciation (depreciation) | (668,249,080) | 820,354,516 |
Net increase (decrease) in net assets resulting
from operations | 269,545,974 | 1,145,146,822 |
Distributions to shareholders from net investment income | (10,662,065) | (21,412,021) |
Distributions to shareholders from net realized gain | (362,625,477) | (85,195,362) |
Total distributions | (373,287,542) | (106,607,383) |
Share transactions - net increase (decrease) | (1,289,647,794) | 507,448,391 |
Redemption fees | 536,076 | 726,904 |
Total increase (decrease) in net assets | (1,392,853,286) | 1,546,714,734 |
| | |
Net Assets | | |
Beginning of period | 4,230,407,484 | 2,683,692,750 |
End of period (including undistributed net investment income of $5,856,882 and undistributed net investment income of $6,475,378, respectively) | $ 2,837,554,198 | $ 4,230,407,484 |
See accompanying notes which are an integral part of the financial statements.
Annual Report
Financial Highlights - Class A
Years ended July 31, | 2014 | 2013 | 2012 | 2011 | 2010 |
Selected Per-Share Data | | | | | |
Net asset value, beginning of period | $ 19.96 | $ 14.86 | $ 15.48 | $ 13.45 | $ 11.13 |
Income from Investment Operations | | | | | |
Net investment income (loss) C | .03 | .07 | .01 | .01F | .02G |
Net realized and unrealized gain (loss) | 1.24 | 5.57 | .30 | 2.22 | 2.33 |
Total from investment operations | 1.27 | 5.64 | .31 | 2.23 | 2.35 |
Distributions from net investment income | (.01) | (.07) | (.01) | (.08) | (.03) |
Distributions from net realized gain | (1.93) | (.47) | (.93) | (.12) | - |
Total distributions | (1.94) | (.54) | (.93) J | (.20) | (.03) |
Redemption fees added to paid in capitalC, I | - | - | - | - | - |
Net asset value, end of period | $ 19.29 | $ 19.96 | $ 14.86 | $ 15.48 | $ 13.45 |
Total ReturnA, B | 6.83% | 39.09% | 3.24% | 16.72% | 21.16% |
Ratios to Average Net Assets D, H | | | | | |
Expenses before reductions | 1.36% | 1.36% | 1.44% | 1.44% | 1.47% |
Expenses net of fee waivers, if any | 1.35% | 1.36% | 1.44% | 1.43% | 1.40% |
Expenses net of all reductions | 1.34% | 1.36% | 1.44% | 1.43% | 1.39% |
Net investment income (loss) | .13% | .41% | .09% | .06% F | .17% G |
Supplemental Data | | | | | |
Net assets, end of period (000 omitted) | $ 258,183 | $ 275,265 | $ 150,285 | $ 140,707 | $ 96,994 |
Portfolio turnover rateE | 26% K | 29% | 27% | 22% | 49% |
A Total returns would have been lower if certain expenses had not been reduced during the applicable periods shown.
B Total returns do not include the effect of the sales charges.
C Calculated based on average shares outstanding during the period.
D Fees and expenses of any underlying Fidelity Central Funds are not included in the Fund's expense ratio. The Fund indirectly bears its proportionate share of the expenses of any underlying Fidelity Central Funds.
E Amount does not include the portfolio activity of any underlying Fidelity Central Funds.
F Investment income per share reflects a large, non-recurring dividend which amounted to $.06 per share. Excluding this non-recurring dividend, the ratio of net investment income (loss) to average net assets would have been (.31)%.
G Investment income per share reflects a large, non-recurring dividend which amounted to $.03 per share. Excluding this non-recurring dividend, the ratio of net investment income (loss) to average net assets would have been (.10)%.
H Expense ratios reflect operating expenses of the class. Expenses before reductions do not reflect amounts reimbursed by the investment adviser or reductions from brokerage service arrangements or reductions from other expense offset arrangements and do not represent the amount paid by the class during periods when reimbursements or reductions occur. Expenses net of fee waivers reflect expenses after reimbursement by the investment adviser but prior to reductions from brokerage service arrangements or other expense offset arrangements. Expenses net of all reductions represent the net expenses paid by the class.
I Amount represents less than $.01 per share.
J Total distributions of $.93 per share is comprised of distributions from net investment income of $.006 and distributions from net realized gain of $.925 per share.
K Portfolio turnover rate excludes securities received or delivered in-kind.
See accompanying notes which are an integral part of the financial statements.
Annual Report
Financial Highlights - Class T
Years ended July 31, | 2014 | 2013 | 2012 | 2011 | 2010 |
Selected Per-Share Data | | | | | |
Net asset value, beginning of period | $ 19.70 | $ 14.70 | $ 15.34 | $ 13.34 | $ 11.05 |
Income from Investment Operations | | | | | |
Net investment income (loss) C | (.02) | .03 | (.02) | (.03) F | (.01) G |
Net realized and unrealized gain (loss) | 1.23 | 5.50 | .31 | 2.20 | 2.31 |
Total from investment operations | 1.21 | 5.53 | .29 | 2.17 | 2.30 |
Distributions from net investment income | - | (.06) | - | (.05) | (.01) |
Distributions from net realized gain | (1.93) | (.47) | (.93) | (.12) | - |
Total distributions | (1.93) | (.53) | (.93) | (.17) | (.01) |
Redemption fees added to paid in capitalC, I | - | - | - | - | - |
Net asset value, end of period | $ 18.98 | $ 19.70 | $ 14.70 | $ 15.34 | $ 13.34 |
Total ReturnA, B | 6.58% | 38.70% | 3.08% | 16.36% | 20.87% |
Ratios to Average Net Assets D, H | | | | | |
Expenses before reductions | 1.61% | 1.60% | 1.67% | 1.70% | 1.72% |
Expenses net of fee waivers, if any | 1.59% | 1.60% | 1.67% | 1.69% | 1.65% |
Expenses net of all reductions | 1.59% | 1.59% | 1.67% | 1.69% | 1.64% |
Net investment income (loss) | (.11)% | .18% | (.14)% | (.19)% F | (.08)% G |
Supplemental Data | | | | | |
Net assets, end of period (000 omitted) | $ 100,975 | $ 107,444 | $ 57,514 | $ 55,845 | $ 44,091 |
Portfolio turnover rateE | 26% J | 29% | 27% | 22% | 49% |
A Total returns would have been lower if certain expenses had not been reduced during the applicable periods shown.
B Total returns do not include the effect of the sales charges.
C Calculated based on average shares outstanding during the period.
D Fees and expenses of any underlying Fidelity Central Funds are not included in the Fund's expense ratio. The Fund indirectly bears its proportionate share of the expenses of any underlying Fidelity Central Funds.
E Amount does not include the portfolio activity of any underlying Fidelity Central Funds.
F Investment income per share reflects a large, non-recurring dividend which amounted to $.06 per share. Excluding this non-recurring dividend, the ratio of net investment income (loss) to average net assets would have been (.57)%.
G Investment income per share reflects a large, non-recurring dividend which amounted to $.03 per share. Excluding this non-recurring dividend, the ratio of net investment income (loss) to average net assets would have been (.35)%.
H Expense ratios reflect operating expenses of the class. Expenses before reductions do not reflect amounts reimbursed by the investment adviser or reductions from brokerage service arrangements or reductions from other expense offset arrangements and do not represent the amount paid by the class during periods when reimbursements or reductions occur. Expenses net of fee waivers reflect expenses after reimbursement by the investment adviser but prior to reductions from brokerage service arrangements or other expense offset arrangements. Expenses net of all reductions represent the net expenses paid by the class.
I Amount represents less than $.01 per share.
J Portfolio turnover rate excludes securities received or delivered in-kind.
See accompanying notes which are an integral part of the financial statements.
Annual Report
Financial Highlights - Class B
Years ended July 31, | 2014 | 2013 | 2012 | 2011 | 2010 |
Selected Per-Share Data | | | | | |
Net asset value, beginning of period | $ 19.06 | $ 14.27 | $ 15.00 | $ 13.08 | $ 10.88 |
Income from Investment Operations | | | | | |
Net investment income (loss) C | (.13) | (.06) | (.09) | (.10) F | (.07) G |
Net realized and unrealized gain (loss) | 1.18 | 5.34 | .29 | 2.15 | 2.27 |
Total from investment operations | 1.05 | 5.28 | .20 | 2.05 | 2.20 |
Distributions from net investment income | - | (.02) | - | (.01) | - |
Distributions from net realized gain | (1.93) | (.47) | (.93) | (.12) | - |
Total distributions | (1.93) | (.49) | (.93) | (.13) | - |
Redemption fees added to paid in capitalC, I | - | - | - | - | - |
Net asset value, end of period | $ 18.18 | $ 19.06 | $ 14.27 | $ 15.00 | $ 13.08 |
Total ReturnA, B | 5.92% | 38.07% | 2.51% | 15.80% | 20.22% |
Ratios to Average Net Assets D, H | | | | | |
Expenses before reductions | 2.18% | 2.15% | 2.19% | 2.20% | 2.22% |
Expenses net of fee waivers, if any | 2.17% | 2.15% | 2.19% | 2.19% | 2.15% |
Expenses net of all reductions | 2.16% | 2.14% | 2.19% | 2.19% | 2.14% |
Net investment income (loss) | (.69)% | (.37)% | (.66)% | (.69)% F | (.58)% G |
Supplemental Data | | | | | |
Net assets, end of period (000 omitted) | $ 4,808 | $ 7,052 | $ 6,675 | $ 8,549 | $ 9,747 |
Portfolio turnover rateE | 26% J | 29% | 27% | 22% | 49% |
A Total returns would have been lower if certain expenses had not been reduced during the applicable periods shown.
B Total returns do not include the effect of the contingent deferred sales charge.
C Calculated based on average shares outstanding during the period.
D Fees and expenses of any underlying Fidelity Central Funds are not included in the Fund's expense ratio. The Fund indirectly bears its proportionate share of the expenses of any underlying Fidelity Central Funds.
E Amount does not include the portfolio activity of any underlying Fidelity Central Funds.
F Investment income per share reflects a large, non-recurring dividend which amounted to $.06 per share. Excluding this non-recurring dividend, the ratio of net investment income (loss) to average net assets would have been (1.07)%.
G Investment income per share reflects a large, non-recurring dividend which amounted to $.03 per share. Excluding this non-recurring dividend, the ratio of net investment income (loss) to average net assets would have been (.85)%.
H Expense ratios reflect operating expenses of the class. Expenses before reductions do not reflect amounts reimbursed by the investment adviser or reductions from brokerage service arrangements or reductions from other expense offset arrangements and do not represent the amount paid by the class during periods when reimbursements or reductions occur. Expenses net of fee waivers reflect expenses after reimbursement by the investment adviser but prior to reductions from brokerage service arrangements or other expense offset arrangements. Expenses net of all reductions represent the net expenses paid by the class.
I Amount represents less than $.01 per share.
J Portfolio turnover rate excludes securities received or delivered in-kind.
See accompanying notes which are an integral part of the financial statements.
Annual Report
Financial Highlights - Class C
Years ended July 31, | 2014 | 2013 | 2012 | 2011 | 2010 |
Selected Per-Share Data | | | | | |
Net asset value, beginning of period | $ 19.06 | $ 14.28 | $ 15.01 | $ 13.08 | $ 10.89 |
Income from Investment Operations | | | | | |
Net investment income (loss) C | (.12) | (.06) | (.09) | (.10) F | (.07) G |
Net realized and unrealized gain (loss) | 1.18 | 5.34 | .29 | 2.17 | 2.26 |
Total from investment operations | 1.06 | 5.28 | .20 | 2.07 | 2.19 |
Distributions from net investment income | - | (.03) | - | (.02) | - |
Distributions from net realized gain | (1.93) | (.47) | (.93) | (.12) | - |
Total distributions | (1.93) | (.50) | (.93) | (.14) | - |
Redemption fees added to paid in capitalC, I | - | - | - | - | - |
Net asset value, end of period | $ 18.19 | $ 19.06 | $ 14.28 | $ 15.01 | $ 13.08 |
Total ReturnA, B | 5.97% | 38.00% | 2.52% | 15.91% | 20.11% |
Ratios to Average Net Assets D, H | | | | | |
Expenses before reductions | 2.12% | 2.13% | 2.19% | 2.18% | 2.22% |
Expenses net of fee waivers, if any | 2.11% | 2.13% | 2.19% | 2.18% | 2.15% |
Expenses net of all reductions | 2.10% | 2.12% | 2.19% | 2.18% | 2.14% |
Net investment income (loss) | (.63)% | (.35)% | (.66)% | (.68)% F | (.58)% G |
Supplemental Data | | | | | |
Net assets, end of period (000 omitted) | $ 70,541 | $ 76,018 | $ 47,265 | $ 47,457 | $ 37,346 |
Portfolio turnover rateE | 26% J | 29% | 27% | 22% | 49% |
A Total returns would have been lower if certain expenses had not been reduced during the applicable periods shown.
B Total returns do not include the effect of the contingent deferred sales charge.
C Calculated based on average shares outstanding during the period.
D Fees and expenses of any underlying Fidelity Central Funds are not included in the Fund's expense ratio. The Fund indirectly bears its proportionate share of the expenses of any underlying Fidelity Central Funds.
E Amount does not include the portfolio activity of any underlying Fidelity Central Funds.
F Investment income per share reflects a large, non-recurring dividend which amounted to $.06 per share. Excluding this non-recurring dividend, the ratio of net investment income (loss) to average net assets would have been (1.06)%.
G Investment income per share reflects a large, non-recurring dividend which amounted to $.03 per share. Excluding this non-recurring dividend, the ratio of net investment income (loss) to average net assets would have been (.85)%.
H Expense ratios reflect operating expenses of the class. Expenses before reductions do not reflect amounts reimbursed by the investment adviser or reductions from brokerage service arrangements or reductions from other expense offset arrangements and do not represent the amount paid by the class during periods when reimbursements or reductions occur. Expenses net of fee waivers reflect expenses after reimbursement by the investment adviser but prior to reductions from brokerage service arrangements or other expense offset arrangements. Expenses net of all reductions represent the net expenses paid by the class.
I Amount represents less than $.01 per share.
J Portfolio turnover rate excludes securities received or delivered in-kind.
See accompanying notes which are an integral part of the financial statements.
Annual Report
Financial Highlights - Small Cap Value
Years ended July 31, | 2014 | 2013 | 2012 | 2011 | 2010 |
Selected Per-Share Data | | | | | |
Net asset value, beginning of period | $ 20.22 | $ 15.05 | $ 15.62 | $ 13.56 | $ 11.22 |
Income from Investment Operations | | | | | |
Net investment income (loss)B | .08 | .12 | .06 | .06E | .05F |
Net realized and unrealized gain (loss) | 1.26 | 5.63 | .32 | 2.23 | 2.34 |
Total from investment operations | 1.34 | 5.75 | .38 | 2.29 | 2.39 |
Distributions from net investment income | (.06) | (.11) | (.02) | (.10) | (.05) |
Distributions from net realized gain | (1.93) | (.47) | (.93) | (.13) | - |
Total distributions | (1.99) | (.58) | (.95) | (.23) | (.05) |
Redemption fees added to paid in capitalB, H | - | - | - | - | - |
Net asset value, end of period | $ 19.57 | $ 20.22 | $ 15.05 | $ 15.62 | $ 13.56 |
Total ReturnA | 7.12% | 39.45% | 3.67% | 17.03% | 21.32% |
Ratios to Average Net AssetsC, G | | | | |
Expenses before reductions | 1.08% | 1.07% | 1.13% | 1.13% | 1.18% |
Expenses net of fee waivers, if any | 1.06% | 1.07% | 1.13% | 1.13% | 1.18% |
Expenses net of all reductions | 1.06% | 1.06% | 1.13% | 1.13% | 1.17% |
Net investment income (loss) | .41% | .71% | .41% | .37%E | .39%F |
Supplemental Data | | | | | |
Net assets, end of period (000 omitted) | $ 2,060,546 | $ 2,672,854 | $ 1,756,962 | $ 1,899,805 | $ 1,770,675 |
Portfolio turnover rateD | .26% I | 29% | 27% | 22% | 49% |
A Total returns would have been lower if certain expenses had not been reduced during the applicable periods shown.
B Calculated based on average shares outstanding during the period.
C Fees and expenses of any underlying Fidelity Central Funds are not included in the Fund's expense ratio. The Fund indirectly bears its proportionate share of the expenses of any underlying Fidelity Central Funds.
D Amount does not include the portfolio activity of any underlying Fidelity Central Funds.
E Investment income per share reflects a large, non-recurring dividend which amounted to $.06 per share. Excluding this non-recurring dividend, the ratio of net investment income (loss) to average net assets would have been (.01)%.
F Investment income per share reflects a large, non-recurring dividend which amounted to $.03 per share. Excluding this non-recurring dividend, the ratio of net investment income (loss) to average net assets would have been .12%.
G Expense ratios reflect operating expenses of the class. Expenses before reductions do not reflect amounts reimbursed by the investment adviser or reductions from brokerage service arrangements or reductions from other expense offset arrangements and do not represent the amount paid by the class during periods when reimbursements or reductions occur. Expenses net of fee waivers reflect expenses after reimbursement by the investment adviser but prior to reductions from brokerage service arrangements or other expense offset arrangements. Expenses net of all reductions represent the net expenses paid by the class.
H Amount represents less than $.01 per share.
I Portfolio turnover rate excludes securities received or delivered in-kind.
See accompanying notes which are an integral part of the financial statements.
Annual Report
Financial Highlights - Institutional Class
Years ended July 31, | 2014 | 2013 | 2012 | 2011 | 2010 |
Selected Per-Share Data | | | | | |
Net asset value, beginning of period | $ 20.23 | $ 15.05 | $ 15.63 | $ 13.58 | $ 11.24 |
Income from Investment Operations | | | | | |
Net investment income (loss) B | .08 | .12 | .06 | .06E | .06F |
Net realized and unrealized gain (loss) | 1.25 | 5.65 | .31 | 2.23 | 2.34 |
Total from investment operations | 1.33 | 5.77 | .37 | 2.29 | 2.40 |
Distributions from net investment income | (.06) | (.12) | (.02) | (.11) | (.06) |
Distributions from net realized gain | (1.93) | (.47) | (.93) | (.13) | - |
Total distributions | (1.99) | (.59) | (.95) | (.24) | (.06) |
Redemption fees added to paid in capitalB, H | - | - | - | - | - |
Net asset value, end of period | $ 19.57 | $ 20.23 | $ 15.05 | $ 15.63 | $ 13.58 |
Total ReturnA | 7.08% | 39.54% | 3.59% | 17.02% | 21.42% |
Ratios to Average Net Assets C, G | | | | | |
Expenses before reductions | 1.09% | 1.07% | 1.14% | 1.10% | 1.12% |
Expenses net of fee waivers, if any | 1.07% | 1.07% | 1.14% | 1.10% | 1.12% |
Expenses net of all reductions | 1.07% | 1.06% | 1.14% | 1.10% | 1.12% |
Net investment income (loss) | .40% | .70% | .39% | .39%E | .45%F |
Supplemental Data | | | | | |
Net assets, end of period (000 omitted) | $ 342,500 | $ 359,582 | $ 138,981 | $ 101,565 | $ 78,440 |
Portfolio turnover rateD | 26% I | 29% | 27% | 22% | 49% |
A Total returns would have been lower if certain expenses had not been reduced during the applicable periods shown.
B Calculated based on average shares outstanding during the period.
C Fees and expenses of any underlying Fidelity Central Funds are not included in the Fund's expense ratio. The Fund indirectly bears its proportionate share of the expenses of any underlying Fidelity Central Funds.
D Amount does not include the portfolio activity of any underlying Fidelity Central Funds.
E Investment income per share reflects a large, non-recurring dividend which amounted to $.06 per share. Excluding this non-recurring dividend, the ratio of net investment income (loss) to average net assets would have been .01%.
F Investment income per share reflects a large, non-recurring dividend which amounted to $.03 per share. Excluding this non-recurring dividend, the ratio of net investment income (loss) to average net assets would have been .18%.
G Expense ratios reflect operating expenses of the class. Expenses before reductions do not reflect amounts reimbursed by the investment adviser or reductions from brokerage service arrangements or reductions from other expense offset arrangements and do not represent the amount paid by the class during periods when reimbursements or reductions occur. Expenses net of fee waivers reflect expenses after reimbursement by the investment adviser but prior to reductions from brokerage service arrangements or other expense offset arrangements. Expenses net of all reductions represent the net expenses paid by the class.
H Amount represents less than $.01 per share.
I Portfolio turnover rate excludes securities received or delivered in-kind.
See accompanying notes which are an integral part of the financial statements.
Annual Report
Notes to Financial Statements
For the period ended July 31, 2014
1. Organization.
Fidelity® Small Cap Value Fund (the Fund) is a fund of Fidelity Securities Fund (the Trust) and is authorized to issue an unlimited number of shares. The Trust is registered under the Investment Company Act of 1940, as amended (the 1940 Act), as an open-end management investment company organized as a Massachusetts business trust. The Fund offers Class A, Class T, Class C, Small Cap Value and Institutional Class shares, each of which has equal rights as to assets and voting privileges. Class B shares are closed to new accounts and additional purchases, except for exchanges and reinvestments. Effective after the close of business on March 1, 2013, the Fund's other share classes were closed to new accounts with certain exceptions. The Fund offered Class F shares during the period June 26, 2009 through November 19, 2013 and all outstanding shares were redeemed by November 19, 2013. Each class has exclusive voting rights with respect to matters that affect that class. Class B shares will automatically convert to Class A shares after a holding period of seven years from the initial date of purchase.
2. Investments in Fidelity Central Funds.
The Fund invests in Fidelity Central Funds, which are open-end investment companies generally available only to other investment companies and accounts managed by the investment adviser and its affiliates. The Fund's Schedule of Investments lists each of the Fidelity Central Funds held as of period end, if any, as an investment of the Fund, but does not include the underlying holdings of each Fidelity Central Fund. As an Investing Fund, the Fund indirectly bears its proportionate share of the expenses of the underlying Fidelity Central Funds.
The Money Market Central Funds seek preservation of capital and current income and are managed by Fidelity Investments Money Management, Inc. (FIMM), an affiliate of the investment adviser. Annualized expenses of the Money Market Central Funds as of their most recent shareholder report date are less than .01%.
A complete unaudited list of holdings for each Fidelity Central Fund is available upon request or at the Securities and Exchange Commission (the SEC) website at www.sec.gov. In addition, the financial statements of the Fidelity Central Funds, which are not covered by the Fund's Report of Independent Registered Public Accounting Firm, are available on the SEC website or upon request.
3. Significant Accounting Policies.
The financial statements have been prepared in conformity with accounting principles generally accepted in the United States of America (GAAP), which require management to make certain estimates and assumptions at the date of the financial statements. Actual results could differ from those estimates. Subsequent events, if any, through the date that the financial statements were issued have been evaluated in the preparation of
Annual Report
Notes to Financial Statements - continued
3. Significant Accounting Policies - continued
the financial statements. The following summarizes the significant accounting policies of the Fund:
Investment Valuation. Investments are valued as of 4:00 p.m. Eastern time on the last calendar day of the period. In accordance with valuation policies and procedures approved by the Board of Trustees (the Board), the Fund attempts to obtain prices from one or more third party pricing vendors or brokers to value its investments. When current market prices, quotations or currency exchange rates are not readily available or reliable, investments will be fair valued in good faith by the Fidelity Management & Research Company (FMR) Fair Value Committee (the Committee), in accordance with procedures adopted by the Board. Factors used in determining fair value vary by investment type and may include market or investment specific events. The frequency with which these procedures are used cannot be predicted and they may be utilized to a significant extent. The Committee oversees the Fund's valuation policies and procedures and is responsible for approving and reporting to the Board all fair value determinations.
The Fund categorizes the inputs to valuation techniques used to value its investments into a disclosure hierarchy consisting of three levels as shown below:
Level 1 - quoted prices in active markets for identical investments
Level 2 - other significant observable inputs (including quoted prices for similar investments, interest rates, prepayment speeds, etc.)
Level 3 - unobservable inputs (including the Fund's own assumptions based on the best information available)
Valuation techniques used to value the Fund's investments by major category are as follows:
Equity securities, including restricted securities, for which market quotations are readily available, are valued at the last reported sale price or official closing price as reported by a third party pricing vendor on the primary market or exchange on which they are traded and are categorized as Level 1 in the hierarchy. In the event there were no sales during the day or closing prices are not available, securities are valued at the last quoted bid price or may be valued using the last available price and are generally categorized as Level 2 in the hierarchy. For foreign equity securities, when market or security specific events arise, comparisons to the valuation of American Depositary Receipts (ADRs), futures contracts, Exchange-Traded Funds (ETFs) and certain indexes as well as quoted prices for similar securities may be used and would be categorized as Level 2 in the hierarchy. Utilizing these techniques may result in transfers between Level 1 and Level 2. For equity securities, including restricted securities, where observable inputs are
Annual Report
3. Significant Accounting Policies - continued
Investment Valuation - continued
limited, assumptions about market activity and risk are used and these securities may be categorized as Level 3 in the hierarchy.
Investments in open-end mutual funds, including the Fidelity Central Funds, are valued at their closing net asset value (NAV) each business day and are categorized as Level 1 in the hierarchy.
Changes in valuation techniques may result in transfers in or out of an assigned level within the disclosure hierarchy. The aggregate value of investments by input level, as of July 31, 2014, is included at the end of the Fund's Schedule of Investments.
Foreign Currency. The Fund may use foreign currency contracts to facilitate transactions in foreign-denominated securities. Gains and losses from these transactions may arise from changes in the value of the foreign currency or if the counterparties do not perform under the contracts' terms.
Foreign-denominated assets, including investment securities, and liabilities are translated into U.S. dollars at the exchange rates at period end. Purchases and sales of investment securities, income and dividends received and expenses denominated in foreign currencies are translated into U.S. dollars at the exchange rate in effect on the transaction date.
The effects of exchange rate fluctuations on investments are included with the net realized and unrealized gain (loss) on investment securities. Other foreign currency transactions resulting in realized and unrealized gain (loss) are disclosed separately.
Investment Transactions and Income. For financial reporting purposes, the Fund's investment holdings and NAV include trades executed through the end of the last business day of the period. The NAV per share for processing shareholder transactions is calculated as of the close of business of the New York Stock Exchange (NYSE), normally 4:00 p.m. Eastern time and includes trades executed through the end of the prior business day. Gains and losses on securities sold are determined on the basis of identified cost and may include proceeds received from litigation. Dividend income is recorded on the ex-dividend date, except for certain dividends from foreign securities where the ex-dividend date may have passed, which are recorded as soon as the Fund is informed of the ex-dividend date. Non-cash dividends included in dividend income, if any, are recorded at the fair market value of the securities received. Income and capital gain distributions from Fidelity Central Funds, if any, are recorded on the ex-dividend date. Distributions received on securities that represent a return of capital or capital gain are recorded as a reduction of cost of investments and/or as a realized gain. Subsequent to ex-dividend date the Fund determines the components of these distributions, based
Annual Report
Notes to Financial Statements - continued
3. Significant Accounting Policies - continued
Investment Transactions and Income - continued
upon receipt of tax filings or other correspondence relating to the underlying investment. Interest income is accrued as earned and includes coupon interest and amortization of premium and accretion of discount on debt securities as applicable. Investment income is recorded net of foreign taxes withheld where recovery of such taxes is uncertain.
Class Allocations and Expenses. Investment income, realized and unrealized capital gains and losses, common expenses of the Fund, and certain fund-level expense reductions, if any, are allocated daily on a pro-rata basis to each class based on the relative net assets of each class to the total net assets of the Fund. Each class differs with respect to transfer agent and distribution and service plan fees incurred. Certain expense reductions may also differ by class. For the reporting period, the allocated portion of income and expenses to each class as a percent of its average net assets may vary due to the timing of recording these transactions in relation to fluctuating net assets of the classes. Expenses directly attributable to a fund are charged to that fund. Expenses attributable to more than one fund are allocated among the respective funds on the basis of relative net assets or other appropriate methods. Expense estimates are accrued in the period to which they relate and adjustments are made when actual amounts are known.
Income Tax Information and Distributions to Shareholders. Each year, the Fund intends to qualify as a regulated investment company under Subchapter M of the Internal Revenue Code, including distributing substantially all of its taxable income and realized gains. As a result, no provision for U.S. Federal income taxes is required. As of July 31, 2014, the Fund did not have any unrecognized tax benefits in the financial statements; nor is the Fund aware of any tax positions for which it is reasonably possible that the total amounts of unrecognized tax benefits will significantly change in the next twelve months. The Fund files a U.S. federal tax return, in addition to state and local tax returns as required. The Fund's federal income tax returns are subject to examination by the Internal Revenue Service (IRS) for a period of three fiscal years after they are filed. State and local tax returns may be subject to examination for an additional fiscal year depending on the jurisdiction. Foreign taxes are provided for based on the Fund's understanding of the tax rules and rates that exist in the foreign markets in which it invests.
Distributions are declared and recorded on the ex-dividend date. Income dividends and capital gain distributions are declared separately for each class. Income and capital gain distributions are determined in accordance with income tax regulations, which may differ from GAAP. In addition, the Fund claimed a portion of the payment made to redeeming shareholders as a distribution for income tax purposes.
Annual Report
3. Significant Accounting Policies - continued
Income Tax Information and Distributions to Shareholders - continued
Capital accounts within the financial statements are adjusted for permanent book-tax differences. These adjustments have no impact on net assets or the results of operations.
Capital accounts are not adjusted for temporary book-tax differences which will reverse in a subsequent period.
Book-tax differences are primarily due to in-kind transactions, foreign currency transactions, passive foreign investment companies (PFIC) and losses deferred due to wash sales.
The federal tax cost of investment securities and unrealized appreciation (depreciation) as of period end were as follows:
Gross unrealized appreciation | $ 594,149,641 |
Gross unrealized depreciation | (90,079,013) |
Net unrealized appreciation (depreciation) on securities | $ 504,070,628 |
| |
Tax Cost | $ 2,474,631,628 |
The tax-based components of distributable earnings as of period end were as follows:
Undistributed ordinary income | $ 5,856,882 |
Undistributed long-term capital gain | $ 278,488,755 |
Net unrealized appreciation (depreciation) on securities and other investments | $ 504,070,628 |
The tax character of distributions paid was as follows:
| July 31, 2014 | July 31, 2013 |
Ordinary Income | $ 10,662,065 | $ 21,412,021 |
Long-term Capital Gains | 362,625,476 | 85,195,362 |
Total | $ 373,287,541 | $ 106,607,383 |
Short-Term Trading (Redemption) Fees. Shares held by investors in the Fund less than 90 days may have been subject to a redemption fee equal to 1.50% of the NAV of shares redeemed. All redemption fees, which reduce the proceeds of the shareholder redemption, are retained by the Fund and accounted for as an addition to paid in capital.
4. Purchases and Sales of Investments.
Purchases and sales of securities, other than short-term securities and in-kind transactions, aggregated $854,969,915 and $1,179,251,195, respectively.
Annual Report
Notes to Financial Statements - continued
5. Fees and Other Transactions with Affiliates.
Management Fee. Fidelity Management & Research Company (the investment adviser) and its affiliates provide the Fund with investment management related services for which the Fund pays a monthly management fee. The management fee is the sum of an individual fund fee rate that is based on an annual rate of .45% of the Fund's average net assets and an annualized group fee rate that averaged .25% during the period. The group fee rate is based upon the average net assets of all the mutual funds advised by the investment adviser, including any mutual funds previously advised by the investment adviser that are currently advised by Fidelity SelectCo, LLC, an affiliate of the investment adviser. The group fee rate decreases as assets under management increase and increases as assets under management decrease. In addition, the management fee is subject to a performance adjustment (up to a maximum of ± .20% of the Fund's average net assets over a 36 month performance period). The upward or downward adjustment to the management fee is based on the relative investment performance of Small Cap Value as compared to its benchmark index, the Russell 2000 Value Index, over the same 36 month performance period. For the reporting period, the total annual management fee rate, including the performance adjustment, was .84% of the Fund's average net assets. The performance adjustment included in the management fee rate may be higher or lower than the maximum performance adjustment rate due to the difference between the average net assets for the reporting and performance periods.
During the period, the investment adviser waived a portion of its management fee as described in the Expense Reductions note.
Distribution and Service Plan Fees. In accordance with Rule 12b-1 of the 1940 Act, the Fund has adopted separate Distribution and Service Plans for each class of shares. Certain classes pay Fidelity Distributors Corporation (FDC), an affiliate of the investment adviser, separate Distribution and Service Fees, each of which is based on an annual percentage of each class' average net assets. In addition, FDC may pay financial intermediaries for selling shares of the Fund and providing shareholder support services. For the period, the Distribution and Service Fee rates, total fees and amounts retained by FDC were as follows:
| Distribution
Fee | Service
Fee | Total Fees | Retained
by FDC |
Class A | -% | .25% | $ 698,016 | $ 8,584 |
Class T | .25% | .25% | 546,090 | 860 |
Class B | .75% | .25% | 62,287 | 46,778 |
Class C | .75% | .25% | 761,065 | 76,077 |
| | | $ 2,067,458 | $ 132,299 |
Annual Report
5. Fees and Other Transactions with Affiliates - continued
Sales Load. FDC may receive a front-end sales charge of up to 5.75% for selling Class A shares and 3.50% for selling Class T shares, some of which is paid to financial intermediaries for selling shares of the Fund. Depending on the holding period, FDC may receive contingent deferred sales charges levied on Class A, Class T, Class B, and Class C redemptions. The deferred sales charges range from 5.00% to 1.00% for Class B shares, 1.00% for Class C shares, 1.00% for certain purchases of Class A shares and .25% for certain purchases of Class T shares.
For the period, sales charge amounts retained by FDC were as follows:
| Retained
by FDC |
Class A | $ 12,340 |
Class T | 4,891 |
Class B* | 5,101 |
Class C* | 3,506 |
| $ 25,838 |
* When Class B and Class C shares are initially sold, FDC pays commissions from its own resources to financial intermediaries through which the sales are made.
Transfer Agent Fees. Fidelity Investments Institutional Operations Company, Inc., (FIIOC), an affiliate of the investment adviser, is the transfer, dividend disbursing and shareholder servicing agent for each class of the Fund. FIIOC receives account fees and asset-based fees that vary according to the account size and type of account of the shareholders of the respective classes of the Fund. FIIOC pays for typesetting, printing and mailing of shareholder reports, except proxy statements.
For the period, transfer agent fees for each class were as follows:
| Amount | % of
Average
Net Assets |
Class A | $ 647,648 | .23 |
Class T | 244,503 | .22 |
Class B | 18,830 | .30 |
Class C | 184,822 | .24 |
Small Cap Value | 4,528,423 | .20 |
Institutional Class | 779,838 | .21 |
| $ 6,404,064 | |
Accounting and Security Lending Fees. Fidelity Service Company, Inc. (FSC), an affiliate of the investment adviser, maintains the Fund's accounting records. The accounting fee is based on the level of average net assets for each month. Under a separate contract, FSC administers the security lending program. The security lending fee is based on the number and duration of lending transactions.
Annual Report
Notes to Financial Statements - continued
5. Fees and Other Transactions with Affiliates - continued
Brokerage Commissions. The Fund placed a portion of its portfolio transactions with brokerage firms which are affiliates of the investment adviser. Brokerage commissions are included in net realized gain (loss) and change in net unrealized appreciation (depreciation) in the Statement of Operations. The commissions paid to these affiliated firms were $34,447 for the period.
Interfund Lending Program. Pursuant to an Exemptive Order issued by the SEC, the Fund, along with other registered investment companies having management contracts with FMR or other affiliated entities of FMR, may participate in an interfund lending program. This program provides an alternative credit facility allowing the funds to borrow from, or lend money to, other participating affiliated funds. At period end, there were no interfund loans outstanding. The Fund's activity in this program during the period for which loans were outstanding was as follows:
Borrower or Lender | Average Loan
Balance | Weighted Average
Interest Rate | Interest
Expense |
Borrower | $ 11,791,333 | .33% | $ 652 |
Redemptions In-Kind. During the period, 67,200,853 shares of the Fund held by affiliated entities were redeemed for investments with a value of $1,338,424,445. The net realized gain of $464,750,352 on investments delivered through in-kind redemptions is included in the accompanying Statement of Operations. The amount of in-kind redemptions is included in share transactions in the accompanying Statement of Changes in Net Assets as well as Note 10: Share Transactions. The Fund recognized no gain or loss for federal income tax purposes.
6. Committed Line of Credit.
The Fund participates with other funds managed by the investment adviser or an affiliate in a $4.25 billion credit facility (the "line of credit") to be utilized for temporary or emergency purposes to fund shareholder redemptions or for other short-term liquidity purposes. The Fund has agreed to pay commitment fees on its pro-rata portion of the line of credit, which amounted to $5,913 and is reflected in Miscellaneous expenses on the Statement of Operations. During the period, the Fund did not borrow on this line of credit.
7. Security Lending.
The Fund lends portfolio securities through a lending agent from time to time in order to earn additional income. For equity securities, a lending agent is used and may loan securities to certain qualified borrowers, including Fidelity Capital Markets (FCM), a broker-dealer affiliated with the Fund. On the settlement date of the loan, the Fund
Annual Report
7. Security Lending - continued
receives collateral (in the form of U.S. Treasury obligations, letters of credit and/or cash) against the loaned securities and maintains collateral in an amount not less than 100% of the market value of the loaned securities during the period of the loan. The market value of the loaned securities is determined at the close of business of the Fund and any additional required collateral is delivered to the Fund on the next business day. If the borrower defaults on its obligation to return the securities loaned because of insolvency or other reasons, the Fund may apply collateral received from the borrower against the obligation. The Fund may experience delays and costs in recovering the securities loaned. Any cash collateral received is invested in the Fidelity Securities Lending Cash Central Fund. The value of loaned securities and cash collateral at period end are disclosed on the Fund's Statement of Assets and Liabilities. At period end, there were no security loans outstanding with FCM. Security lending income represents the income earned on investing cash collateral, less rebates paid to borrowers and any lending agent fees associated with the loan, plus any premium payments received for lending certain types of securities. Security lending income is presented in the Statement of Operations as a component of income from Fidelity Central Funds. Total security lending income during the period amounted to $874,417, including $3,386 from securities loaned to FCM.
8. Expense Reductions.
The investment adviser has contractually agreed to waive a portion of the Fund's management fee until May 31, 2015. During the period, this waiver reduced the Fund's management fee by $538,400.
In addition, the investment adviser reimbursed a portion of the Fund's operating expenses during the period in the amount of $44,531.
Commissions paid to certain brokers with whom the investment adviser, or its affiliates, places trades on behalf of the Fund include an amount in addition to trade execution, which may be rebated back to the Fund to offset certain expenses. This amount totaled $48,251 for the period.
Annual Report
Notes to Financial Statements - continued
9. Distributions to Shareholders.
Distributions to shareholders of each class were as follows:
Years ended July 31, | 2014A | 2013 |
From net investment income | | |
Class A | $ 171,608 | $ 785,355 |
Class T | - | 231,402 |
Class B | - | 9,411 |
Class C | - | 90,526 |
Small Cap Value | 7,284,772 | 13,318,853 |
Class F | 2,011,606 | 5,669,081 |
Institutional Class | 1,194,079 | 1,307,393 |
Total | $ 10,662,065 | $ 21,412,021 |
From net realized gain | | |
Class A | $ 26,941,211 | $ 5,001,914 |
Class T | 10,672,388 | 1,871,336 |
Class B | 695,128 | 211,601 |
Class C | 7,761,033 | 1,589,582 |
Small Cap Value | 236,012,007 | 54,759,308 |
Class F | 44,973,770 | 17,097,966 |
Institutional Class | 35,569,940 | 4,663,655 |
Total | $ 362,625,477 | $ 85,195,362 |
A All Class F Shares were redeemed on November 19, 2013.
10. Share Transactions.
Transactions for each class of shares were as follows:
| Shares | Dollars |
Years ended July 31, | 2014A | 2013 | 2014A | 2013 |
Class A | | | | |
Shares sold | 2,364,232 | 6,665,265 | $ 46,165,166 | $ 113,825,347 |
Reinvestment of distributions | 1,371,738 | 357,182 | 25,837,208 | 5,478,656 |
Shares redeemed | (4,138,116) | (3,345,663) | (80,966,690) | (56,976,312) |
Net increase (decrease) | (402,146) | 3,676,784 | $ (8,964,316) | $ 62,327,691 |
Class T | | | | |
Shares sold | 987,146 | 2,420,486 | $ 19,000,773 | $ 41,524,163 |
Reinvestment of distributions | 566,918 | 135,952 | 10,525,159 | 2,060,454 |
Shares redeemed | (1,685,516) | (1,017,057) | (32,399,109) | (17,196,752) |
Net increase (decrease) | (131,452) | 1,539,381 | $ (2,873,177) | $ 26,387,865 |
Annual Report
10. Share Transactions - continued
| Shares | Dollars |
Years ended July 31, | 2014A | 2013 | 2014A | 2013 |
Class B | | | | |
Shares sold | 9,527 | 63,699 | $ 174,532 | $ 1,033,590 |
Reinvestment of distributions | 33,965 | 12,922 | 607,035 | 189,673 |
Shares redeemed | (149,029) | (174,192) | (2,755,578) | (2,861,489) |
Net increase (decrease) | (105,537) | (97,571) | $ (1,974,011) | $ (1,638,226) |
Class C | | | | |
Shares sold | 268,818 | 1,262,288 | $ 4,960,750 | $ 20,129,471 |
Reinvestment of distributions | 378,946 | 98,556 | 6,778,684 | 1,448,319 |
Shares redeemed | (758,615) | (683,043) | (14,057,302) | (11,003,236) |
Net increase (decrease) | (110,851) | 677,801 | $ (2,317,868) | $ 10,574,554 |
Small Cap Value | | | | |
Shares sold | 19,542,379 | 46,643,321 | $ 386,966,432 | $ 815,184,196 |
Reinvestment of distributions | 11,711,859 | 4,065,017 | 222,752,806 | 63,037,497 |
Shares redeemed | (58,131,122)B | (35,306,999) | (1,153,341,425)B | (618,245,939) |
Net increase (decrease) | (26,876,884) | 15,401,339 | $ (543,622,187) | $ 259,975,754 |
Class F | | | | |
Shares sold | 879,716 | 7,943,352 | $ 17,395,091 | $ 133,806,197 |
Reinvestment of distributions | 2,497,893 | 1,465,154 | 46,985,376 | 22,767,047 |
Shares redeemed | (39,476,567)B | (8,168,596) | (787,183,278)B | (151,555,822) |
Net increase (decrease) | (36,098,958) | 1,239,910 | $ (722,802,811) | $ 5,017,422 |
Institutional Class | | | | |
Shares sold | 4,292,555 | 11,988,758 | $ 84,987,281 | $ 206,274,907 |
Reinvestment of distributions | 1,739,424 | 337,968 | 33,193,654 | 5,246,517 |
Shares redeemed | (6,306,791) | (3,783,835) | (125,274,359) | (66,718,093) |
Net increase (decrease) | (274,812) | 8,542,891 | $ (7,093,424) | $ 144,803,331 |
A All Class F Shares were redeemed on November 19, 2013.
B Amount includes in-kind redemptions (see Note 5: Redemptions In-Kind).
Annual Report
Notes to Financial Statements - continued
11. Other.
The Fund's organizational documents provide former and current trustees and officers with a limited indemnification against liabilities arising in connection with the performance of their duties to the Fund. In the normal course of business, the Fund may also enter into contracts that provide general indemnifications. The Fund's maximum exposure under these arrangements is unknown as this would be dependent on future claims that may be made against the Fund. The risk of material loss from such claims is considered remote.
Annual Report
To the Trustees of Fidelity Securities Fund and the Shareholders of Fidelity Small Cap Value Fund:
In our opinion, the accompanying statement of assets and liabilities, including the schedule of investments, and the related statements of operations and of changes in net assets and the financial highlights present fairly, in all material respects, the financial position of Fidelity Small Cap Value Fund (a fund of Fidelity Securities Fund) at July 31, 2014, the results of its operations for the year then ended, the changes in its net assets for each of the two years in the period then ended and the financial highlights for each of the five years in the period then ended, in conformity with accounting principles generally accepted in the United States of America. These financial statements and financial highlights (hereafter referred to as "financial statements") are the responsibility of the Fidelity Small Cap Value Fund's management. Our responsibility is to express an opinion on these financial statements based on our audits. We conducted our audits of these financial statements in accordance with the standards of the Public Company Accounting Oversight Board (United States). Those standards require that we plan and perform the audit to obtain reasonable assurance about whether the financial statements are free of material misstatement. An audit includes examining, on a test basis, evidence supporting the amounts and disclosures in the financial statements, assessing the accounting principles used and significant estimates made by management, and evaluating the overall financial statement presentation. We believe that our audits, which included confirmation of securities at July 31, 2014 by correspondence with the custodian and brokers, provide a reasonable basis for our opinion.
PricewaterhouseCoopers LLP
Boston, Massachusetts
September 12, 2014
Annual Report
The Trustees, Member of the Advisory Board, and officers of the trust and fund, as applicable, are listed below. The Board of Trustees governs the fund and is responsible for protecting the interests of shareholders. The Trustees are experienced executives who meet periodically throughout the year to oversee the fund's activities, review contractual arrangements with companies that provide services to the fund, oversee management of the risks associated with such activities and contractual arrangements, and review the fund's performance. Except for James C. Curvey, each of the Trustees oversees 173 funds. Mr. Curvey oversees 397 funds.
The Trustees hold office without limit in time except that (a) any Trustee may resign; (b) any Trustee may be removed by written instrument, signed by at least two-thirds of the number of Trustees prior to such removal; (c) any Trustee who requests to be retired or who has become incapacitated by illness or injury may be retired by written instrument signed by a majority of the other Trustees; and (d) any Trustee may be removed at any special meeting of shareholders by a two-thirds vote of the outstanding voting securities of the trust. Each Trustee who is not an interested person (as defined in the 1940 Act) of the trust and the fund (Independent Trustee), shall retire not later than the last day of the calendar year in which his or her 75th birthday occurs. The Independent Trustees may waive this mandatory retirement age policy with respect to individual Trustees. The officers and Advisory Board Member hold office without limit in time, except that any officer and Advisory Board Member may resign or may be removed by a vote of a majority of the Trustees at any regular meeting or any special meeting of the Trustees. Except as indicated, each individual has held the office shown or other offices in the same company for the past five years.
Experience, Skills, Attributes, and Qualifications of the Fund's Trustees. The Governance and Nominating Committee has adopted a statement of policy that describes the experience, qualifications, attributes, and skills that are necessary and desirable for potential Independent Trustee candidates (Statement of Policy). The Board believes that each Trustee satisfied at the time he or she was initially elected or appointed a Trustee, and continues to satisfy, the standards contemplated by the Statement of Policy. The Governance and Nominating Committee also engages professional search firms to help identify potential Independent Trustee candidates who have the experience, qualifications, attributes, and skills consistent with the Statement of Policy. From time to time, additional criteria based on the composition and skills of the current Independent Trustees, as well as experience or skills that may be appropriate in light of future changes to board composition, business conditions, and regulatory or other developments, have also been considered by the professional search firms and the Governance and Nominating Committee. In addition, the Board takes into account the Trustees' commitment and participation in Board and committee meetings, as well as their leadership of standing and ad hoc committees throughout their tenure.
In determining that a particular Trustee was and continues to be qualified to serve as a Trustee, the Board has considered a variety of criteria, none of which, in isolation, was controlling. The Board believes that, collectively, the Trustees have balanced and diverse experience, qualifications, attributes, and skills, which allow the Board to operate effectively in governing the fund and protecting the interests of shareholders. Information about the specific experience, skills, attributes, and qualifications of each Trustee, which in each case led to the Board's conclusion that the Trustee should serve (or continue to serve) as a trustee of the fund, is provided below.
Annual Report
Board Structure and Oversight Function. James C. Curvey is an interested person (as defined in the 1940 Act) and currently serves as Chairman. The Trustees have determined that an interested Chairman is appropriate and benefits shareholders because an interested Chairman has a personal and professional stake in the quality and continuity of services provided to the fund. Independent Trustees exercise their informed business judgment to appoint an individual of their choosing to serve as Chairman, regardless of whether the Trustee happens to be independent or a member of management. The Independent Trustees have determined that they can act independently and effectively without having an Independent Trustee serve as Chairman and that a key structural component for assuring that they are in a position to do so is for the Independent Trustees to constitute a substantial majority for the Board. The Independent Trustees also regularly meet in executive session. Ned C. Lautenbach serves as Chairman of the Independent Trustees and as such (i) acts as a liaison between the Independent Trustees and management with respect to matters important to the Independent Trustees and (ii) with management prepares agendas for Board meetings.
Fidelity funds are overseen by different Boards of Trustees. The fund's Board oversees Fidelity's equity and high income funds and another Board oversees Fidelity's investment-grade bond, money market, and asset allocation funds. The asset allocation funds may invest in Fidelity funds overseen by the fund's Board. The use of separate Boards, each with its own committee structure, allows the Trustees of each group of Fidelity funds to focus on the unique issues of the funds they oversee, including common research, investment, and operational issues. On occasion, the separate Boards establish joint committees to address issues of overlapping consequences for the Fidelity funds overseen by each Board.
The Trustees operate using a system of committees to facilitate the timely and efficient consideration of all matters of importance to the Trustees, the fund, and fund shareholders and to facilitate compliance with legal and regulatory requirements and oversight of the fund's activities and associated risks. The Board, acting through its committees, has charged FMR and its affiliates with (i) identifying events or circumstances the occurrence of which could have demonstrably adverse effects on the fund's business and/or reputation; (ii) implementing processes and controls to lessen the possibility that such events or circumstances occur or to mitigate the effects of such events or circumstances if they do occur; and (iii) creating and maintaining a system designed to evaluate continuously business and market conditions in order to facilitate the identification and implementation processes described in (i) and (ii) above. Because the day-to-day operations and activities of the fund are carried out by or through FMR, its affiliates and other service providers, the fund's exposure to risks is mitigated but not eliminated by the processes overseen by the Trustees. While each of the Board's committees has responsibility for overseeing different aspects of the fund's activities, oversight is exercised primarily through the Operations, Audit, and Compliance Committees. In addition, the Independent Trustees have worked with FMR to enhance the Board's oversight of investment and financial risks, legal and regulatory risks, technology risks, and operational risks, including the development of additional risk reporting to the Board. For example, a working group comprised of Independent Trustees and FMR has worked and continues to work to review the Fidelity funds' valuation-related activities, reporting and risk management. Appropriate personnel, including but not limited to the fund's Chief Compliance Officer (CCO), FMR's internal auditor, the independent accountants, the fund's Treasurer and portfolio management personnel, make periodic reports to the Board's committees, as appropriate, including an annual review of FMR's risk management program for the Fidelity funds. The responsibilities of each standing committee, including their oversight responsibilities, are described further under "Standing Committees of the Fund's Trustees."
Annual Report
Trustees and Officers - continued
The fund's Statement of Additional Information (SAI) includes more information about the Trustees. To request a free copy, call Fidelity at 1-877-208-0098.
Interested Trustees*:
Correspondence intended for each Trustee who is an interested person may be sent to Fidelity Investments, 245 Summer Street, Boston, Massachusetts 02210.
Name, Year of Birth; Principal Occupations and Other Relevant Experience+ |
James C. Curvey (1935) |
Year of Election or Appointment: 2007 Trustee Chairman of the Board of Trustees |
| Mr. Curvey also serves as Trustee of other Fidelity funds. Mr. Curvey is a Director of Fidelity Research & Analysis Co. (2009-present), and Vice Chairman (2007-present) and Director of FMR LLC. In addition, Mr. Curvey serves as an Overseer for the Boston Symphony Orchestra and a member of the Trustees of Villanova University. Previously, Mr. Curvey served as a Director of Fidelity Investments Money Management, Inc. (2009-2014), a Director of FMR (2007-2014), a Director of FMR Co., Inc. (2007-2014) and was the Vice Chairman (2006-2007) and Director (2000-2007) of FMR Corp. |
Charles S. Morrison (1960) |
Year of Election or Appointment: 2014 Trustee |
| Mr. Morrison also serves as Trustee of other funds. He serves as President, Asset Management (2014-present) and is an employee of Fidelity Investments. Previously, Mr. Morrison served as Vice President of Fidelity's Fixed Income and Asset Allocation Funds (2012-2014), President, Fixed Income (2011-2014), Vice President of Fidelity's Money Market Funds (2005-2009), President, Money Market Group Leader of FMR (2009), and Senior Vice President, Money Market Group of FMR (2004-2009). Mr. Morrison also served as Vice President of Fidelity's Bond Funds (2002-2005), certain Balanced Funds (2002-2005), and certain Asset Allocation Funds (2002-2007), and as Senior Vice President (2002-2005) of Fidelity's Bond Division. |
* Trustees have been determined to be "Interested Trustees" by virtue of, among other things, their affiliation with the trust or various entities under common control with FMR.
+ The information above includes each Trustee's principal occupation during the last five years and other information relating to the experience, attributes, and skills relevant to each Trustee's qualifications to serve as a Trustee, which led to the conclusion that each Trustee should serve as a Trustee for the fund.
Annual Report
Trustees and Officers - continued
Independent Trustees:
Correspondence intended for each Independent Trustee (that is, the Trustees other than the Interested Trustees) may be sent to Fidelity Investments, P.O. Box 55235, Boston, Massachusetts 02205-5235.
Name, Year of Birth; Principal Occupations and Other Relevant Experience+ |
Dennis J. Dirks (1948) |
Year of Election or Appointment: 2005 Trustee |
| Mr. Dirks also serves as Trustee of other Fidelity funds. Prior to his retirement in May 2003, Mr. Dirks was Chief Operating Officer and a member of the Board of The Depository Trust & Clearing Corporation (DTCC). He also served as President, Chief Operating Officer, and Board member of The Depository Trust Company (DTC) and President and Board member of the National Securities Clearing Corporation (NSCC). In addition, Mr. Dirks served as Chief Executive Officer and Board member of the Government Securities Clearing Corporation, Chief Executive Officer and Board member of the Mortgage-Backed Securities Clearing Corporation, as a Trustee and a member of the Finance Committee of Manhattan College (2005-2008), and as a Trustee and a member of the Finance Committee of AHRC of Nassau County (2006-2008). Mr. Dirks is a member of the Independent Directors Council (IDC) Governing Council (2010-present) and Board of Directors for The Brookville Center for Children's Services, Inc. (2009-present). |
Alan J. Lacy (1953) |
Year of Election or Appointment: 2008 Trustee |
| Mr. Lacy also serves as Trustee of other Fidelity funds. Mr. Lacy serves as Senior Adviser (2007-present) of Oak Hill Capital Partners, L.P. (private equity). Mr. Lacy also served as Chief Executive Officer (2000-2005) and Vice Chairman (2005-2006) of Sears Holdings Corporation and Sears, Roebuck and Co. (retail). In addition, Mr. Lacy serves as a member of the Board of Directors of Dave & Buster's Entertainment, Inc. (restaurant and entertainment complexes, 2010-present), Earth Fare, Inc. (retail grocery, 2012-present), The Hillman Companies, Inc. (hardware wholesalers, 2010-present), and Bristol-Myers Squibb Company (global pharmaceuticals, 2008-present). Mr. Lacy is a member of the Board of Trustees of The National Parks Conservation Association (2006-present). Previously, Mr. Lacy served as Chairman of the Board of Trustees of the National Parks Conservation Association (2008-2011) and as a member of the Board of Directors for the Western Union Company (global money transfer, 2006-2011). |
Ned C. Lautenbach (1944) |
Year of Election or Appointment: 2000 Trustee Chairman of the Independent Trustees |
| Mr. Lautenbach also serves as Trustee of other Fidelity funds. Mr. Lautenbach currently serves as the Lead Director of the Eaton Corporation Board of Directors (diversified industrial, 1997-present). Mr. Lautenbach is Chairman of the Board of Directors of the Philharmonic Center for the Arts in Naples, Florida (2012-present) and a member of the Council on Foreign Relations (1994-present). Previously, Mr. Lautenbach was a Partner/Advisory Partner at Clayton, Dubilier & Rice, LLC (private equity investment, 1998-2010), as well as a Director of Sony Corporation (2006-2007). |
Joseph Mauriello (1944) |
Year of Election or Appointment: 2008 Trustee |
| Mr. Mauriello also serves as Trustee of other Fidelity funds. Prior to his retirement in January 2006, Mr. Mauriello served in numerous senior management positions including Deputy Chairman and Chief Operating Officer (2004-2005), and Vice Chairman of Financial Services (2002-2004) of KPMG LLP US (professional services, 1965-2005). Mr. Mauriello currently serves as a member of the Board of Directors of XL Group plc. (global insurance and re-insurance, 2006-present). Previously, Mr. Mauriello served as a Director of the Hamilton Funds of the Bank of New York (2006-2007) and of Arcadia Resources Inc. (health care services and products, 2007-2012). |
Robert W. Selander (1950) |
Year of Election or Appointment: 2011 Trustee |
| Mr. Selander also serves as Trustee of other Fidelity funds. Previously, Mr. Selander served as a Member of the Advisory Board of other Fidelity funds (2011), and Executive Vice Chairman (2010), Chief Executive Officer (2009-2010), and President and Chief Executive Officer (1997-2009) of Mastercard, Inc. |
Cornelia M. Small (1944) |
Year of Election or Appointment: 2005 Trustee |
| Ms. Small also serves as Trustee of other Fidelity funds. Ms. Small is a member of the Board of Directors (2009-present) and Chair of the Investment Committee (2010-present) of the Teagle Foundation. Ms. Small also serves on the Investment Committee of the Berkshire Taconic Community Foundation (2008-present). Previously, Ms. Small served as Chairperson (2002-2008) and a member of the Investment Committee and Chairperson (2008-2012) and a member of the Board of Trustees of Smith College. In addition, Ms. Small served as Chief Investment Officer, Director of Global Equity Investments, and a member of the Board of Directors of Scudder, Stevens & Clark and Scudder Kemper Investments. |
William S. Stavropoulos (1939) |
Year of Election or Appointment: 2002 Trustee Vice Chairman of the Independent Trustees |
| Mr. Stavropoulos also serves as Trustee of other Fidelity funds. Mr. Stavropoulos serves as President and Founder of the Michigan Baseball Foundation, the Great Lakes Loons (2007-present). Mr. Stavropoulos is Chairman Emeritus of the Board of Directors of The Dow Chemical Company, where he previously served in numerous senior management positions, including President, CEO (1995-2000; 2002-2004), Chairman of the Executive Committee (2000-2006), and as a member of the Board of Directors (1990-2006). Currently, Mr. Stavropoulos is Chairman of the Board of Directors of Univar Inc. (global distributor of commodity and specialty chemicals), a Director of Teradata Corporation (data warehousing and technology solutions), and Maersk Inc. (industrial conglomerate), and a member of the Advisory Board for Metalmark Capital LLC (private equity investment, 2005-present). Mr. Stavropoulos is an operating advisor to Clayton, Dubilier & Rice, LLC (private equity investment). In addition, Mr. Stavropoulos is a member of the University of Notre Dame Advisory Council for the College of Science, a Trustee of the Rollin L. Gerstacker Foundation, and a Director of the Naples Philharmonic Center for the Arts. Previously, Mr. Stavropoulos served as a Director of Chemical Financial Corporation (bank holding company, 1993-2012) and Tyco International, Ltd. (multinational manufacturing and services, 2007-2012). |
David M. Thomas (1949) |
Year of Election or Appointment: 2008 Trustee |
| Mr. Thomas also serves as Trustee of other Fidelity funds. Mr. Thomas serves as Non-Executive Chairman of the Board of Directors of Fortune Brands Home and Security (home and security products, 2011-present), and as a member of the Board of Directors of Interpublic Group of Companies, Inc. (marketing communication, 2004-present). Previously, Mr. Thomas served as Executive Chairman (2005-2006) and Chairman and Chief Executive Officer (2000-2005) of IMS Health, Inc. (pharmaceutical and healthcare information solutions), and a Director of Fortune Brands, Inc. (consumer products, 2000-2011). |
+ The information above includes each Trustee's principal occupation during the last five years and other information relating to the experience, attributes, and skills relevant to each Trustee's qualifications to serve as a Trustee, which led to the conclusion that each Trustee should serve as a Trustee for the fund.
Advisory Board Member and Officers:
Correspondence intended for each officer and Peter S. Lynch may be sent to Fidelity Investments, 245 Summer Street, Boston, Massachusetts 02210. Officers appear below in alphabetical order.
Name, Year of Birth; Principal Occupation |
Peter S. Lynch (1944) |
Year of Election or Appointment: 2003 Member of the Advisory Board |
| Mr. Lynch also serves as Member of the Advisory Board of other Fidelity funds. Mr. Lynch is Vice Chairman and a Director of FMR and FMR Co., Inc. In addition, Mr. Lynch serves as a Trustee of Boston College and as the Chairman of the Inner-City Scholarship Fund. Previously, Mr. Lynch served on the Special Olympics International Board of Directors (1997-2006). |
Elizabeth Paige Baumann (1968) |
Year of Election or Appointment: 2012 Anti-Money Laundering (AML) Officer |
| Ms. Baumann also serves as AML Officer of other funds. She is Chief AML Officer of FMR LLC (2012-present) and is an employee of Fidelity Investments. Previously, Ms. Baumann served as Vice President and Deputy Anti-Money Laundering Officer (2007-2012). |
William C. Coffey (1969) |
Year of Election or Appointment: 2009 Assistant Secretary |
| Mr. Coffey also serves as Assistant Secretary of other funds. He is Senior Vice President and Deputy General Counsel of FMR LLC (2010-present), and is an employee of Fidelity Investments. Previously, Mr. Coffey served as Vice President and Associate General Counsel of FMR LLC (2005-2009). |
Jonathan Davis (1968) |
Year of Election or Appointment: 2010 Assistant Treasurer |
| Mr. Davis also serves as Assistant Treasurer of other funds. Mr. Davis is an employee of Fidelity Investments. Previously, Mr. Davis served as Vice President and Associate General Counsel of FMR LLC (2003-2010). |
Adrien E. Deberghes (1967) |
Year of Election or Appointment: 2008 Deputy Treasurer |
| Mr. Deberghes also serves as an officer of other funds. He is an employee of Fidelity Investments (2008-present). Prior to joining Fidelity Investments, Mr. Deberghes was Senior Vice President of Mutual Fund Administration at State Street Corporation (2007-2008), Senior Director of Mutual Fund Administration at Investors Bank & Trust (2005-2007), and Director of Finance for Dunkin' Brands (2000-2005). |
Stephanie J. Dorsey (1969) |
Year of Election or Appointment: 2010 Assistant Treasurer |
| Ms. Dorsey also serves as an officer of other funds. She is an employee of Fidelity Investments (2008-present) and has served in other fund officer roles. Prior to joining Fidelity Investments, Ms. Dorsey served as Treasurer (2004-2008) of the JPMorgan Mutual Funds and Vice President (2004-2008) of JPMorgan Chase Bank. |
Howard J. Galligan III (1966) |
Year of Election or Appointment: 2014 Chief Financial Officer |
| Mr. Galligan also serves as Chief Financial Officer of other funds. Mr. Galligan serves as President of Fidelity Pricing and Cash Management Services (FPCMS) (2014-present) and as a Director of Strategic Advisers, Inc. (2008-present). Previously, Mr. Galligan served as Chief Administrative Officer of Asset Management (2011-2014) and Chief Operating Officer and Senior Vice President of Investment Support for Strategic Advisers, Inc. (2003-2011). |
Scott C. Goebel (1968) |
Year of Election or Appointment: 2008 Secretary and Chief Legal Officer (CLO) |
| Mr. Goebel serves as Secretary and CLO of other funds. Mr. Goebel also serves as Secretary of Fidelity SelectCo, LLC (2013-present), Fidelity Investments Money Management, Inc. (FIMM) (2010-present) and Fidelity Research and Analysis Company (FRAC) (2010-present); General Counsel, Secretary, and Senior Vice President of FMR (2008-present) and FMR Co., Inc. (2008-present); Chief Legal Officer of Fidelity Management & Research (Hong Kong) Limited (2008-present); and Assistant Secretary of Fidelity Management & Research (Japan) Inc. (2008-present) and Fidelity Management & Research (U.K.) Inc. (2008-present). Previously, Mr. Goebel served as Secretary and CLO of other Fidelity funds (2008-2013), Assistant Secretary of FIMM (2008-2010), FRAC (2008-2010), and certain funds (2007-2008); and as Vice President and Secretary of Fidelity Distributors Corporation (FDC) (2005-2007). Mr. Goebel has been employed by FMR LLC or an affiliate since 2001. |
Thomas C. Hense (1964) |
Year of Election or Appointment: 2008/2010 Vice President |
| Mr. Hense also serves as Vice President of other funds (High Income (2008), Small Cap (2008), and Value (2010) funds). Previously, Mr. Hense served as a portfolio manager for Fidelity's Institutional Money Management Group (Pyramis) (2003-2008). |
Brian B. Hogan (1964) |
Year of Election or Appointment: 2009 Vice President |
| Mr. Hogan also serves as Trustee or Vice President of other funds. Mr. Hogan serves as President of FMR's Equity Division (2009-present). Previously, Mr. Hogan served as Senior Vice President, Equity Research of FMR (2006-2009) and as a portfolio manager. |
Chris Maher (1972) |
Year of Election or Appointment: 2013 Assistant Treasurer |
| Mr. Maher serves as Assistant Treasurer of other funds. Mr. Maher is Vice President of Valuation Oversight and is an employee of Fidelity Investments. Previously, Mr. Maher served as Vice President of Asset Management Compliance (2013), Vice President of FMR's Program Management Group (2010-2013), and Vice President of Valuation Oversight (2008-2010). |
Kenneth B. Robins (1969) |
Year of Election or Appointment: 2008 President and Treasurer |
| Mr. Robins also serves as an officer of other funds. Mr. Robins serves as Executive Vice President of Fidelity Investments Money Management, Inc. (FIMM) (2013-present) and is an employee of Fidelity Investments (2004-present). Previously, Mr. Robins served in other fund officer roles. |
Stephen Sadoski (1971) |
Year of Election or Appointment: 2012 Deputy Treasurer |
| Mr. Sadoski also serves as Deputy Treasurer of other funds. He is an employee of Fidelity Investments (2012-present) and has served in another fund officer role. Prior to joining Fidelity Investments, Mr. Sadoski served as an assistant chief accountant in the Division of Investment Management of the Securities and Exchange Commission (SEC) (2009-2012) and as a senior manager at Deloitte & Touche LLP (1997-2009). |
Stacie M. Smith (1974) |
Year of Election or Appointment: 2013 Deputy Treasurer |
| Ms. Smith also serves as an officer of other funds. She is an employee of Fidelity Investments (2009-present) and has served in other fund officer roles. Prior to joining Fidelity Investments, Ms. Smith served as Senior Audit Manager of Ernst & Young LLP (1996-2009). |
Renee Stagnone (1975) |
Year of Election or Appointment: 2013 Deputy Treasurer |
| Ms. Stagnone also serves as Deputy Treasurer of other funds. Ms. Stagnone is an employee of Fidelity Investments. |
Linda J. Wondrack (1964) |
Year of Election or Appointment: 2014 Chief Compliance Officer |
| Ms. Wondrack also serves as Chief Compliance Officer of other funds. Ms. Wondrack is Executive Vice President and head of the Ethics Office and Asset Management Compliance for Fidelity Investments (2012-present). Ms. Wondrack also serves as Chief Compliance Officer of Fidelity SelectCo, LLC (2014-present); Chief Compliance Officer of Impresa Management LLC (2013-present); and Chief Compliance Officer of FMR Co., Inc., Fidelity Investments Money Management, Inc., Fidelity Management & Research (Japan) Inc., Fidelity Management & Research (U.K.) Inc., Fidelity Management & Research (Hong Kong), Fidelity Management & Research Company, Pyramis Global Advisors, LLC, and Strategic Advisers, Inc., Ballyrock Investment Advisors LLC, and Northern Neck Investors LLC (2012-present). Previously, Ms. Wondrack served as Senior Vice President and Chief Compliance Officer for Columbia Management Investment Advisers, LLC (2005-2012); Chief Compliance Officer for certain funds within the Columbia Family of Funds (2007-2012); and Senior Vice President of Compliance Risk Management at Bank of America (2005-2010). |
Joseph F. Zambello (1957) |
Year of Election or Appointment: 2011 Deputy Treasurer |
| Mr. Zambello also serves as Deputy Treasurer of other funds. Mr. Zambello is an employee of Fidelity Investments. Previously, Mr. Zambello served as Vice President of FMR's Program Management Group (2009-2011) and Vice President of the Transfer Agent Oversight Group (2005-2009). |
Annual Report
The Board of Trustees of Fidelity Small Cap Value Fund voted to pay to shareholders of record at the opening of business, the following distributions per share derived from capital gains realized from sales of portfolio securities, and dividends derived from net investment income:
| Pay Date | Record Date | Dividends | Capital Gains |
Class A | 09/15/14 | 09/12/14 | $0.013 | $1.955 |
Class T | 09/15/14 | 09/12/14 | $0.000 | $1.955 |
Class B | 09/15/14 | 09/12/14 | $0.000 | $1.955 |
Class C | 09/15/14 | 09/12/14 | $0.000 | $1.955 |
The fund hereby designates as a capital gain dividend with respect to the taxable year ended July 31, 2014, $441,012,533, or, if subsequently determined to be different, the net capital gain of such year.
Class A designates 100% of the dividends distributed during the fiscal year as qualifying for the dividends-received deduction for corporate shareholders.
Class A designates 100% of the dividends distributed during the fiscal year as amounts which can be taken into account as a dividend for the purposes of the maximum rate under section 1(h)(11) of the Internal Revenue Code.
The fund will notify shareholders in January 2015 of amounts for use in preparing 2014 income tax returns.
Annual Report
Board Approval of Investment Advisory Contracts and Management Fees
Fidelity Small Cap Value Fund
Each year, the Board of Trustees, including the Independent Trustees (together, the Board), votes on the renewal of the management contract with Fidelity Management & Research Company (FMR) and the sub-advisory agreements (together, the Advisory Contracts) for the fund. The Board, assisted by the advice of fund counsel and Independent Trustees' counsel, requests and considers a broad range of information relevant to the renewal of the Advisory Contracts throughout the year.
The Board meets regularly and, at each of its meetings, covers an extensive agenda of topics and materials and considers factors that are relevant to its annual consideration of the renewal of the fund's Advisory Contracts, including the services and support provided to the fund and its shareholders. The Board has established various standing committees (Committees), each composed of and chaired by Independent Trustees with varying backgrounds, to which the Board has assigned specific subject matter responsibilities in order to enhance effective decision-making by the Board. The Board, acting directly and through its Committees, requests and receives information concerning the annual consideration of the renewal of the fund's Advisory Contracts. The Board also meets as needed to consider matters specifically related to the Board's annual consideration of the renewal of the Advisory Contracts. Members of the Board may also meet with trustees of other Fidelity funds through ad hoc joint committees to discuss certain matters relevant to the Fidelity funds.
At its July 2014 meeting, the Board, including the Independent Trustees, unanimously determined to renew the fund's Advisory Contracts. In reaching its determination, the Board considered all factors it believed relevant, including (i) the nature, extent, and quality of the services to be provided to the fund and its shareholders (including the investment performance of the fund); (ii) the competitiveness of the fund's management fee and total expense ratio relative to peer funds; (iii) the total costs of the services to be provided by and the profits to be realized by Fidelity from its relationship with the fund; (iv) the extent to which economies of scale exist and would be realized as the fund grows; and (v) whether fee levels reflect these economies of scale, if any, for the benefit of fund shareholders. In connection with separate internal corporate reorganizations involving Fidelity Management & Research (U.K.) Inc. (FMR U.K.) and Fidelity Management & Research (Japan) Inc. (FMR Japan), the Board approved certain non-material amendments to the fund's sub-advisory agreements with FMR U.K. and FMR Japan to reflect that, after these reorganizations, FMR Investment Management (UK) Limited and Fidelity Management & Research (Japan) Limited will carry on the business of FMR U.K. and FMR Japan, respectively. The Board noted that no changes to the portfolio managers or to the foreign research or investment advisory services provided to the fund were expected in connection with either reorganization and that the same personnel and resources would continue to be available to the fund at the new entities.
Annual Report
Board Approval of Investment Advisory Contracts and
Management Fees - continued
In considering whether to renew the Advisory Contracts for the fund, the Board reached a determination, with the assistance of fund counsel and Independent Trustees' counsel and through the exercise of its business judgment, that the renewal of the Advisory Contracts was in the best interests of the fund and its shareholders and that the compensation payable under the Advisory Contracts was fair and reasonable. The Board's decision to renew the Advisory Contracts was not based on any single factor, but rather was based on a comprehensive consideration of all the information provided to the Board at its meetings throughout the year. The Board, in reaching its determination to renew the Advisory Contracts, was aware that shareholders of the fund have a broad range of investment choices available to them, including a wide choice among funds offered by Fidelity's competitors, and that the fund's shareholders, who have the opportunity to review and weigh the disclosure provided by the fund in its prospectus and other public disclosures, have chosen to invest in this fund, which is part of the Fidelity family of funds.
Nature, Extent, and Quality of Services Provided. The Board considered Fidelity's staffing as it relates to the fund, including the backgrounds of investment personnel of FMR and the sub-advisers (together, the Investment Advisers), and also considered the fund's investment objective, strategies, and related investment philosophy. The Independent Trustees also had discussions with senior management of Fidelity's investment operations and investment groups. The Board considered the structure of the portfolio manager compensation program and whether this structure provides appropriate incentives to act in the best interests of the fund. Additionally, the Board considered the portfolio managers' investments, if any, in the funds that they manage.
Resources Dedicated to Investment Management and Support Services. The Board and the Fund Oversight and Research Committees reviewed the general qualifications and capabilities of Fidelity's investment staff, including its size, education, experience, and resources, as well as Fidelity's approach to recruiting, training, managing, and compensating investment personnel. The Board noted that Fidelity has continued to increase the resources devoted to non-U.S. offices, including expansion of Fidelity's global investment organization. The Board also noted that Fidelity's analysts have extensive resources, tools and capabilities that allow them to conduct sophisticated quantitative and fundamental analysis, as well as credit analysis of issuers, counterparties and guarantors. Further, the Board believes that Fidelity's investment professionals have sufficient access to global information and data so as to provide competitive investment results over time, and that those professionals also have access to sophisticated tools that permit them to assess portfolio construction and risk and performance attribution characteristics continuously, as well as to transmit new information and research conclusions rapidly around the world. Additionally, in its deliberations, the Board considered Fidelity's trading and risk management capabilities and resources and global compliance infrastructure, which are an integral part of the investment management process.
Annual Report
Shareholder and Administrative Services. The Board considered (i) the nature, extent, quality, and cost of advisory, administrative, and shareholder services performed by the Investment Advisers and their affiliates under the Advisory Contracts and under separate agreements covering transfer agency, pricing and bookkeeping, and securities lending services for the fund; (ii) the nature and extent of the supervision of third party service providers, principally custodians and subcustodians; and (iii) the resources devoted to, and the record of compliance with, the fund's compliance policies and procedures. The Board also reviewed the allocation of fund brokerage, including allocations to brokers affiliated with the Investment Advisers, the use of brokerage commissions to pay fund expenses, and the use of "soft" commission dollars to pay for research services.
The Board noted that the growth of fund assets over time across the complex allows Fidelity to reinvest in the development of services designed to enhance the value or convenience of the Fidelity funds as investment vehicles. These services include 24-hour access to account information and market information through telephone representatives and over the Internet, investor education materials and asset allocation tools, and the expanded availability of Fidelity Investor Centers.
In 2014, the Board formed an ad hoc Committee on Transfer Agency Fees to review the variety of transfer agency fee structures throughout the industry and Fidelity's competitive positioning with respect to industry participants.
Investment in a Large Fund Family. The Board considered the benefits to shareholders of investing in a Fidelity fund, including the benefits of investing in a fund that is part of a large family of funds offering a variety of investment disciplines and providing a large variety of mutual fund investor services. The Board noted that Fidelity had taken, or had made recommendations that resulted in the Fidelity funds taking, a number of actions over the previous year that benefited particular funds, including (i) continuing to dedicate additional resources to investment research and to the support of the senior management team that oversees asset management; (ii) persisting in efforts to enhance Fidelity's global research capabilities; (iii) launching new funds and making other enhancements to meet client needs for income-oriented solutions; (iv) reducing fund expenses for certain index funds; (v) continuing to launch dedicated lower cost underlying funds to meet portfolio construction needs related to expanding underlying fund options for Fidelity funds of funds, specifically for the Freedom Fund product lines; (vi) rationalizing product lines and gaining increased efficiencies through fund mergers; (vii) launching sector-based exchange-traded funds and establishing a new Fidelity adviser to manage sector-based funds and products; (viii) continuing to develop and implement technology to improve security and increase efficiency; (ix) modifying the eligibility criteria for certain share classes to increase their marketability to a portion of the defined contribution plan market; (x) waiving redemption fees for certain qualified fund-of-fund and wrap programs and certain retirement plan transactions; and (xi) launching new Institutional Class shares of certain money market funds to attract and retain assets and to fill a gap in the money market fund lineup.
Annual Report
Board Approval of Investment Advisory Contracts and
Management Fees - continued
Investment Performance. The Board considered whether the fund has operated in accordance with its investment objective, as well as its record of compliance with its investment restrictions and its performance history. The Board noted that there was a portfolio management change for the fund in January 2013 and for a sleeve of the fund in August 2013.
The Board took into account discussions with the Investment Advisers about fund investment performance that occur at Board meetings throughout the year. In this regard the Board noted that as part of regularly scheduled fund reviews and other reports to the Board on fund performance, the Board periodically considers annualized return information for the fund, for different time periods, measured against a securities market index ("benchmark index") and a peer group of funds with similar objectives ("peer group"). In its evaluation of fund investment performance, the Board gave particular attention to information indicating changes in performance of certain Fidelity funds for specific time periods and the Investment Advisers' explanations for any overperformance or underperformance.
In addition to reviewing absolute and relative fund performance, the Independent Trustees periodically consider the appropriateness of fund performance metrics in evaluating the results achieved. In general, the Independent Trustees believe that fund performance should be evaluated based on net performance (after fees and expenses) of both the highest performing and lowest performing classes, where applicable, compared to appropriate benchmark indices, over appropriate time periods which may include full market cycles, and compared to peer groups, as applicable, over the same periods, taking into account relevant factors including the following: general market conditions; issuer-specific information; tactical opportunities for investment; and fund cash flows and other factors.
The Independent Trustees recognize that shareholders evaluate performance on a net basis over their own holding periods, for which one-, three-, and five-year periods are often used as a proxy. For this reason, the performance information reviewed by the Board also included net cumulative calendar year total return information for the fund and an appropriate benchmark index and peer group for the most recent one-, three-, and five-year periods, as shown below. Returns are shown compared to the 25th percentile (top of box, 75% beaten) and 75th percentile (bottom of box, 25% beaten) of the peer universe.
Annual Report
Fidelity Small Cap Value Fund
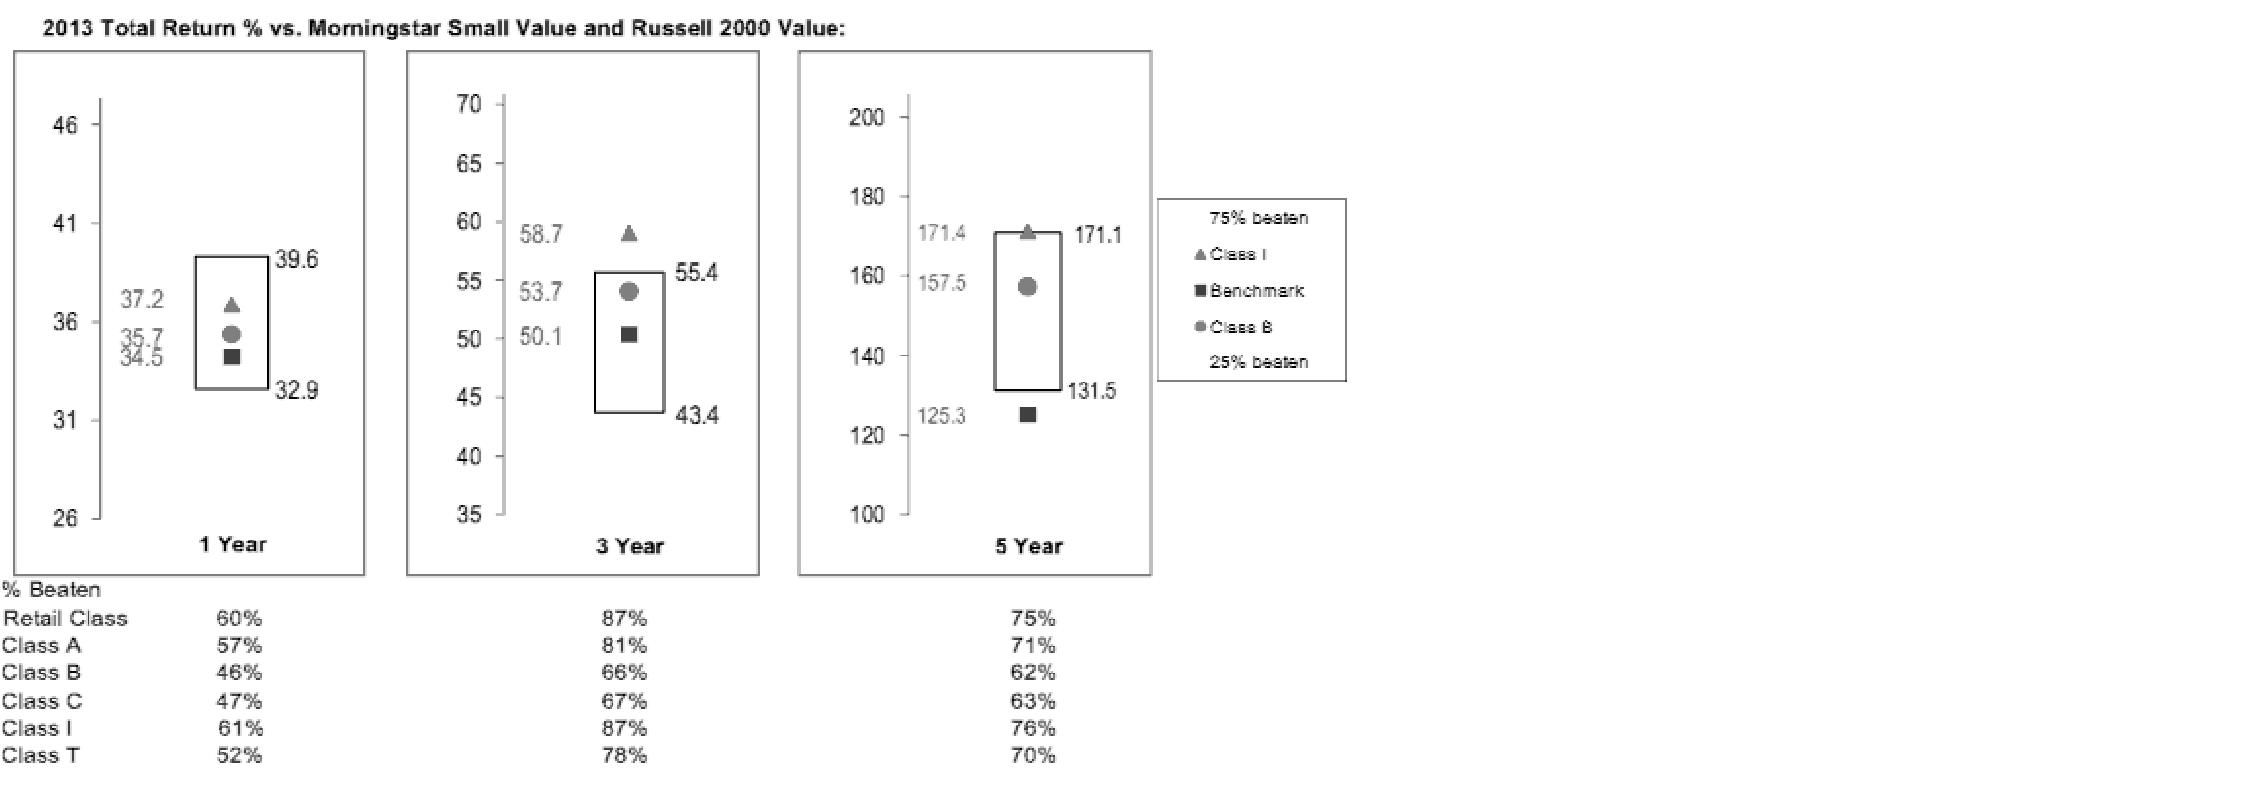
The Board also considered that the fund's management fee is subject to upward or downward adjustment depending upon whether, and to what extent, the fund's investment performance for the performance period exceeds, or is exceeded by, a securities index, thus leading to a performance adjustment for the same period. The Board noted that the performance adjustment provides FMR with a strong economic incentive to seek to achieve superior performance for the fund's shareholders and helps to more closely align the interests of FMR and the fund's shareholders.
Based on its review, the Board concluded that the nature, extent, and quality of services provided to the fund under the Advisory Contracts should benefit the fund's shareholders.
Competitiveness of Management Fee and Total Expense Ratio. The Board considered the fund's management fee and total expense ratio compared to "mapped groups" of competitive funds and classes. Fidelity creates "mapped groups" by combining similar Lipper investment objective categories that have comparable investment mandates. Combining Lipper investment objective categories aids the Board's management fee and total expense ratio comparisons by broadening the competitive group used for comparison and by reducing the number of universes to which various Fidelity funds are compared.
Management Fee. The Board considered two proprietary management fee comparisons for the 12-month periods shown in the chart below. The group of Lipper funds used by the Board for management fee comparisons is referred to below as the "Total Mapped Group." The Total Mapped Group comparison focuses on a fund's standing in terms of gross management fees before expense reimbursements or caps, and without giving effect to the fund's performance adjustment, relative to the total universe of funds with comparable investment mandates, regardless of whether their management fee structures also are comparable. Funds with comparable investment mandates offer exposure to similar types of securities. Funds with comparable management fee structures have similar management fee contractual arrangements (e.g., flat rate charged for advisory services, all-inclusive fee rate, etc.). "TMG %" represents the percentage of funds in the Total Mapped Group that had management fees that were lower than the fund's. For example, a hypothetical TMG % of 20% would mean that 80% of the funds in the Total Mapped Group had higher, and 20% had lower, management fees than the fund. The fund's actual TMG %s are in the chart below. The "Asset-Size Peer Group" (ASPG) comparison focuses on a fund's standing relative to a subset of non-Fidelity funds within the Total Mapped Group that are similar in size and management fee structure. For example, if a fund is in the first quartile of the ASPG, the fund's management fee ranks in the least expensive or lowest 25% of funds in the ASPG. The ASPG represents at least 15% of the funds in the Total Mapped Group with comparable asset size and management fee structures, subject to a minimum of 50 funds (or all funds in the Total Mapped Group if fewer than 50). Additional information, such as the ASPG quartile in which the fund's management fee rate ranked and the impact of the fund's performance adjustment, is also included in the chart and considered by the Board.
Annual Report
Board Approval of Investment Advisory Contracts and
Management Fees - continued
Fidelity Small Cap Value Fund

The Board noted that the fund's management fee rate ranked below the median of its Total Mapped Group and below the median of its ASPG for 2013. The Board also noted the effect of the fund's positive performance adjustment on the fund's management fee ranking.
Annual Report
The Board also noted that, in August 2013, the ad hoc Committee on Management Fees was formed to conduct an in-depth review of the management fee rates of Fidelity's active equity mutual funds. The Committee focused on the following areas: (i) standard fee structures; (ii) research consumption and trading evolution; (iii) management fee competitiveness/profitability by category; and (iv) factors that drive institutional pricing.
Based on its review, the Board concluded that the fund's management fee is fair and reasonable in light of the services that the fund receives and the other factors considered.
Total Expense Ratio. In its review of each class's total expense ratio, the Board considered the fund's management fee as well as other fund or class expenses, as applicable, such as transfer agent fees, pricing and bookkeeping fees, fund-paid 12b-1 fees, and custodial, legal, and audit fees. The Board also noted the effects of any waivers and reimbursements on fees and expenses, as well as the impact of the fund's performance adjustment. As part of its review, the Board also considered the current and historical total expense ratios of each class of the fund compared to competitive fund median expenses. Each class of the fund is compared to those funds and classes in the Total Mapped Group (used by the Board for management fee comparisons) that have a similar sales load structure.
The Board also considered that it had approved a transitional management fee adjustment for the fund that will decrease the fund's management fee paid each month through May 31, 2015.
The Board noted that the total expense ratio of each of Class A, Institutional Class, and the retail class ranked below its competitive median for 2013 and the total expense ratio of each of Class T, Class B, and Class C ranked above its competitive median for 2013. The Board considered that, in general, various factors can affect total expense ratios. The Board noted that the total expense ratio of Class T was above the competitive median primarily because of higher 12b-1 fees on Class T as compared to most competitor funds. Class T has a higher 12b-1 fee, but a lower front-end sales charge, than traditionally priced front-end sales charge classes. The Board considered that Class T is primarily sold load-waived in the retirement plan market where its 0.50% 12b-1 fee is comparable to competing no-load, higher 12b-1 fee classes designed specifically for retirement plans. The Board noted that the fund offers multiple classes, each of which has a different sales load and 12b-1 fee structure, and that the multiple structures are intended to offer a range of pricing options for the intermediary market. The Board also noted that the total expense ratios of the classes vary primarily by the level of their 12b-1 fees, although differences in transfer agent fees may also cause expenses to vary from class to class.
Annual Report
Board Approval of Investment Advisory Contracts and
Management Fees - continued
Fees Charged to Other Fidelity Clients. The Board also considered Fidelity fee structures and other information with respect to clients of Fidelity, such as other funds advised or subadvised by Fidelity, pension plan clients, and other institutional clients. The Board noted the findings of the 2013 ad hoc joint committee (created with the board of other Fidelity funds), which reviewed and compared Fidelity's institutional investment advisory business with its business of providing services to the Fidelity funds, including the differences in services provided, fees charged, and costs incurred, as well as competition in their respective marketplaces.
Based on its review of total expense ratios and fees charged to other Fidelity clients, the Board concluded that the total expense ratio of each class of the fund was reasonable, although in some cases above the median of the universe presented for comparison, in light of the services that the fund and its shareholders receive and the other factors considered.
Costs of the Services and Profitability. The Board considered the revenues earned and the expenses incurred by Fidelity in conducting the business of developing, marketing, distributing, managing, administering and servicing the fund and servicing the fund's shareholders. The Board also considered the level of Fidelity's profits in respect of all the Fidelity funds.
On an annual basis, Fidelity presents to the Board Fidelity's profitability for the fund. Fidelity calculates the profitability for each fund, as well as aggregate profitability for groups of Fidelity funds and all Fidelity funds, using a series of detailed revenue and cost allocation methodologies which originate with the books and records of Fidelity on which Fidelity's audited financial statements are based. The Audit Committee of the Board reviews any significant changes from the prior year's methodologies.
PricewaterhouseCoopers LLP (PwC), independent registered public accounting firm and auditor to Fidelity and certain Fidelity funds, has been engaged annually by the Board as part of the Board's assessment of Fidelity's profitability analysis. PwC's engagement includes the review and assessment of the methodologies used by Fidelity in determining the revenues and expenses attributable to Fidelity's mutual fund business, and completion of agreed-upon procedures in respect of the mathematical accuracy of fund profitability and its conformity to established allocation methodologies. After considering PwC's reports issued under the engagement and information provided by Fidelity, the Board concluded that while other allocation methods may also be reasonable, Fidelity's profitability methodologies are reasonable in all material respects.
The Board also reviewed Fidelity's non-fund businesses and fall-out benefits related to the mutual fund business as well as cases where Fidelity's affiliates may benefit from or be related to the fund's business.
Annual Report
The Board considered the costs of the services provided by and the profits realized by Fidelity in connection with the operation of the fund and was satisfied that the profitability was not excessive in the circumstances.
Economies of Scale. The Board considered whether there have been economies of scale in respect of the management of the Fidelity funds, whether the Fidelity funds (including the fund) have appropriately benefited from any such economies of scale, and whether there is potential for realization of any further economies of scale. The Board considered the extent to which the fund will benefit from economies of scale through increased services to the fund, through waivers or reimbursements, or through fee or expense ratio reductions. The Board also noted that in 2013, it and the boards of other Fidelity funds created an ad hoc committee (the Economies of Scale Committee) to analyze whether Fidelity attains economies of scale in respect of the management and servicing of the Fidelity funds, whether the Fidelity funds have appropriately benefited from such economies of scale, and whether there is potential for realization of any further economies of scale.
The Board recognized that the fund's management contract incorporates a "group fee" structure, which provides for lower group fee rates as total group assets increase, and for higher group fee rates as total group assets decrease (with "group assets" defined to include fund assets under FMR's management plus sector fund assets previously under FMR's management and currently managed by Fidelity SelectCo, LLC). FMR calculates the group fee rates based on a tiered asset "breakpoint" schedule that varies based on asset class. The Board considered that the group fee is designed to deliver the benefits of economies of scale to fund shareholders when total Fidelity fund assets increase, even if assets of any particular fund are unchanged or have declined, because some portion of Fidelity's costs are attributable to services provided to all Fidelity funds, and all funds benefit if those costs can be allocated among more assets. The Board considered that although the fund is partially closed to new investors, it continues to incur investment management expenses, and marketing and distribution expenses related to the retention of existing shareholders and assets. The Board concluded that, given the group fee structure, fund shareholders will benefit from lower management fees as group assets increase at the fund complex level, regardless of whether Fidelity achieves any such economies of scale.
The Board concluded, taking into account the analysis of the Economies of Scale Committee, that economies of scale, if any, are being appropriately shared between fund shareholders and Fidelity.
Additional Information Requested by the Board. In order to develop fully the factual basis for consideration of the Fidelity funds' Advisory Contracts, the Board requested and received additional information on certain topics, including: (i) fund performance trends and Fidelity's long-term strategies for certain funds; (ii) Fidelity's strategic marketing and product lineup goals; (iii) the methodology with respect to competitive fund data and peer group classifications; (iv) the arrangements with, and performance of, certain sub-advisers on behalf of the Fidelity funds, as well as certain proposed participating affiliate arrangements; (v) the realization of fall-out benefits in certain Fidelity business units; (vi) Fidelity's group fee structures, including the rationale for the individual fee rates of certain categories of funds and the definition of group assets; (vii) trends regarding industry use of performance fee structures and the performance adjustment methodologies applicable to the Fidelity funds; (viii) additional competitive analysis regarding the total expenses for certain classes; (ix) fund profitability methodology, including Fidelity's cost allocation methodology, and the impact of certain factors on fund profitability results; and (x) the process by which Fidelity determines sub-advisory fees for funds it advises.
Annual Report
Board Approval of Investment Advisory Contracts and
Management Fees - continued
Based on its evaluation of all of the conclusions noted above, and after considering all factors it believed relevant, the Board ultimately concluded that the advisory fee structures are fair and reasonable, and that the fund's Advisory Contracts should be renewed.
Annual Report
Investment Adviser
Fidelity Management & Research Company
Boston, MA
Investment Sub-Advisers
FMR Co., Inc.
Fidelity Management & Research
(U.K.) Inc.
Fidelity Management & Research
(Hong Kong) Limited
Fidelity Management & Research
(Japan) Inc.
General Distributor
Fidelity Distributors Corporation
Smithfield, RI
Transfer and Service Agents
Fidelity Investments Institutional
Operations Company, Inc.
Boston, MA
Fidelity Service Company, Inc.
Boston, MA
Custodian
Citibank, N.A.
New York, NY
(Fidelity Investment logo)(registered trademark)
ASCV-UANN-0914
1.803731.109
(Fidelity Investment logo)(registered trademark)
Fidelity Advisor®
Small Cap Value
Fund - Institutional Class
Annual Report
July 31, 2014
(Fidelity Cover Art)
Institutional Class
is a class of Fidelity®
Small Cap Value Fund
Contents
Performance | (Click Here) | How the fund has done over time. |
Management's Discussion of Fund Performance | (Click Here) | The Portfolio Managers' review of fund performance and strategy. |
Shareholder Expense Example | (Click Here) | An example of shareholder expenses. |
Investment Changes | (Click Here) | A summary of major shifts in the fund's investments over the past six months. |
Investments | (Click Here) | A complete list of the fund's investments with their market values. |
Financial Statements | (Click Here) | Statements of assets and liabilities, operations, and changes in net assets, as well as financial highlights. |
Notes | (Click Here) | Notes to the financial statements. |
Report of Independent Registered Public Accounting Firm | (Click Here) | |
Trustees and Officers | (Click Here) | |
Distributions | (Click Here) | |
Board Approval of Investment Advisory Contracts and Management Fees | (Click Here) | |
To view a fund's proxy voting guidelines and proxy voting record for the 12-month period ended June 30, visit http://www.fidelity.com/proxyvotingresults or visit the Securities and Exchange Commission's (SEC) web site at http://www.sec.gov. You may also call 1-877-208-0098 to request a free copy of the proxy voting guidelines.
Standard & Poor's, S&P and S&P 500 are registered service marks of The McGraw-Hill Companies, Inc. and have been licensed for use by Fidelity Distributors Corporation.
Other third-party marks appearing herein are the property of their respective owners.
All other marks appearing herein are registered or unregistered trademarks or service marks of FMR LLC or an affiliated company. © 2014 FMR LLC. All rights reserved.
Annual Report
This report and the financial statements contained herein are submitted for the general information of the shareholders of the fund. This report is not authorized for distribution to prospective investors in the fund unless preceded or accompanied by an effective prospectus.
A fund files its complete schedule of portfolio holdings with the SEC for the first and third quarters of each fiscal year on Form N-Q. Forms N-Q are available on the SEC's web site at http://www.sec.gov. A fund's Forms N-Q may be reviewed and copied at the SEC's Public Reference Room in Washington, DC. Information regarding the operation of the SEC's Public Reference Room may be obtained by calling 1-800-SEC-0330. For a complete list of a fund's portfolio holdings, view the most recent holdings listing, semiannual report, or annual report on Fidelity's web site at http://www.fidelity.com, http://www.advisor.fidelity.com, or http://www.401k.com, as applicable.
NOT FDIC INSURED • MAY LOSE VALUE • NO BANK GUARANTEE
Neither the fund nor Fidelity Distributors Corporation is a bank.
Annual Report
Average annual total return reflects the change in the value of an investment, assuming reinvestment of the class' distributions from dividend income and capital gains (the profits earned upon the sale of securities that have grown in value, if any) and assuming a constant rate of performance each year. The $10,000 table and the fund's returns do not reflect the deduction of taxes that a shareholder would pay on fund distributions or the redemption of fund shares. During periods of reimbursement by Fidelity, a fund's total return will be greater than it would be had the reimbursement not occurred. How a fund did yesterday is no guarantee of how it will do tomorrow.
Average Annual Total Returns
Periods ended July 31, 2014 | Past 1
year | Past 5
years | Life of
fundA |
Institutional Class | 7.08% | 17.07% | 11.30% |
A From November 3, 2004.
$10,000 Over Life of Fund
Let's say hypothetically that $10,000 was invested in Fidelity Advisor® Small Cap Value Fund - Institutional Class on November 3, 2004, when the fund started. The chart shows how the value of your investment would have changed, and also shows how the Russell 2000® Value Index performed over the same period.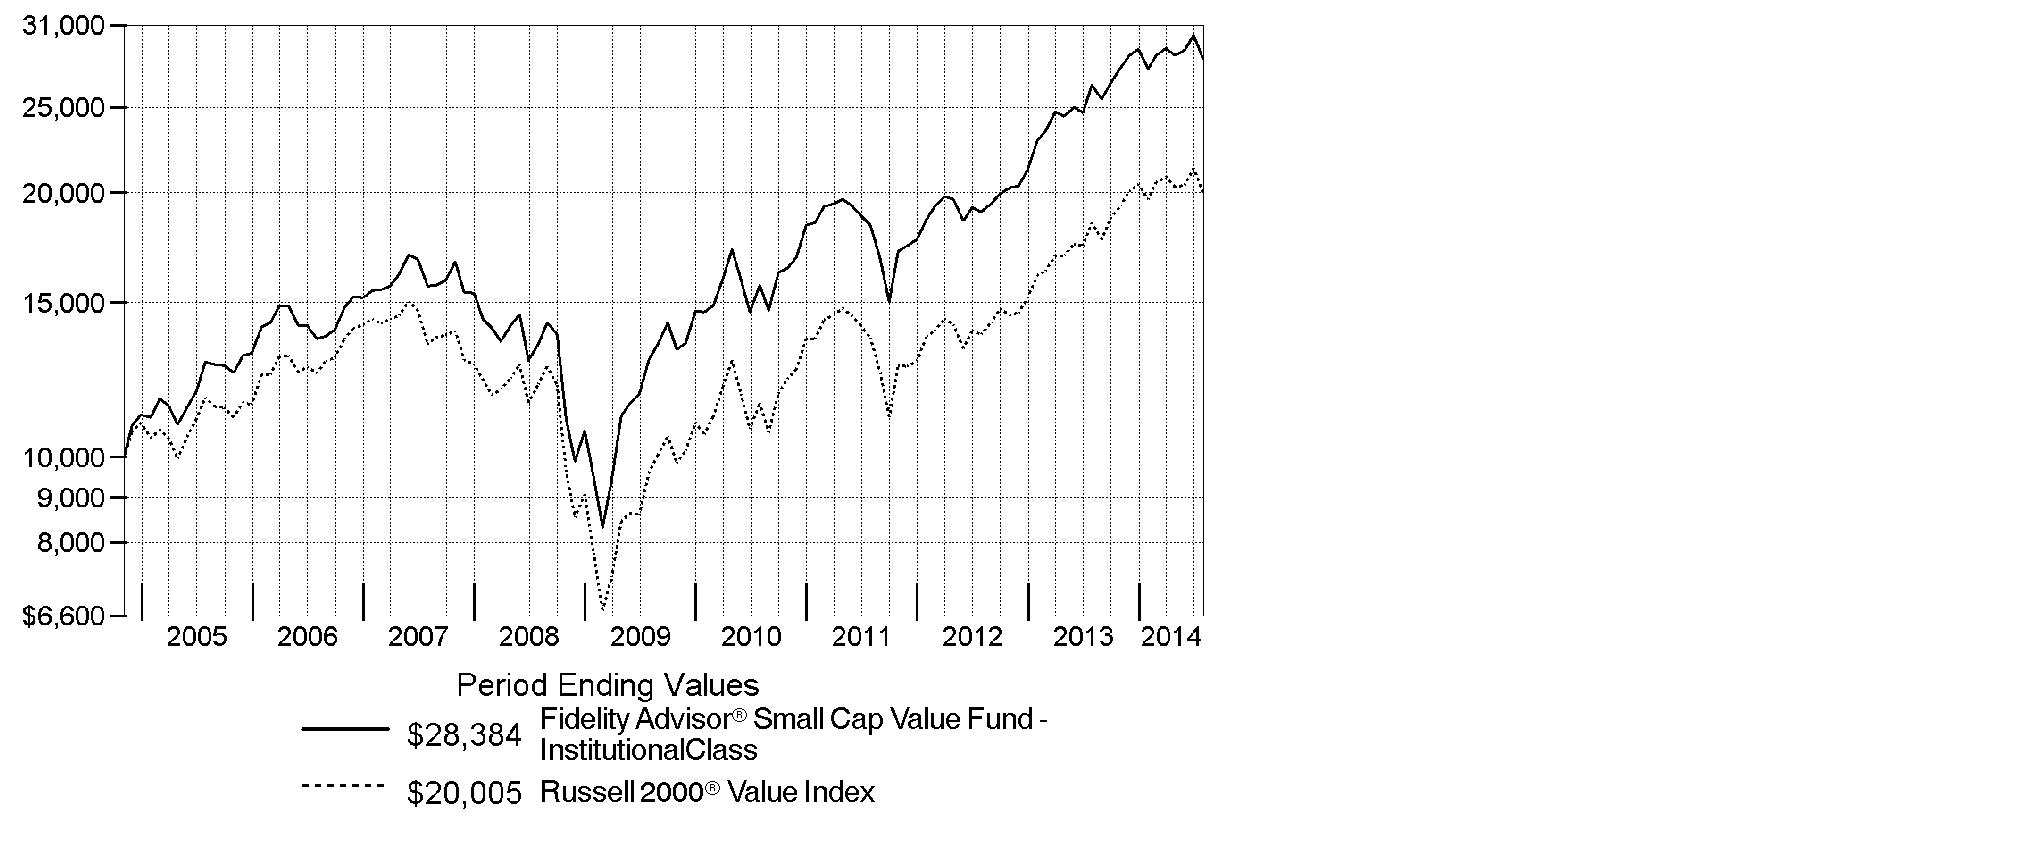
Annual Report
Market Recap: U.S. stocks overcame a slowing economy early in 2014 to post a strong gain for the 12-month period ending July 31, 2014, supported by corporate profits and continued low interest rates. The S&P 500® Index rose 16.94%, reaching an all-time high near period end. The technology-heavy Nasdaq Composite Index® gained 22.00%. The Russell 2000® Index returned 8.56%, reflecting the relatively lackluster performance of small-cap stocks. Information technology (+28%) was the top-performing sector within the S&P 500®, driven by strong semiconductor and computer hardware sales. Materials (+23%) gained amid higher prices for many commodity products. Health care (+21%) rose, driven by gains in pharmaceuticals, biotechnology & life sciences companies. Energy stocks (+19%) advanced in the latter part of the period amid healthy U.S. output and the threat of supply disruptions in Iraq. Conversely, most defensive sectors, including consumer staples, utilities and telecommunication services, lagged the broader market. Volatility remained tame throughout most of the period, with markets supported by declining unemployment, near-record profit margins for companies, muted cost inflation and fairly low corporate debt levels. Geopolitical tension remained a concern at period end, with conflict in Ukraine and strained relations between Russia and the West posing a potential threat to global growth.
Comments from Charles Myers and Derek Janssen, Lead Portfolio Manager and Co-Portfolio Manager, respectively, of Fidelity Advisor® Small Cap Value Fund: For the year, the fund's Institutional Class shares gained 7.08%, trailing the 8.18% gain of the benchmark Russell 2000® Value Index. The fund was hampered the most by subpar security selection in industrials. Conversely, the fund enjoyed very good results from our picks in information technology. The biggest detractor by far was furniture and appliance rent-to-own business Rent-A-Center, which faced several business challenges during the period. Another notable detractor was Quad/Graphics, a very inexpensively valued commercial printing company. After Quad/Graphics issued a disappointing financial report in November, we reassessed our position in the stock and began to reduce the fund's stake. In contrast, the fund benefited from an out-of-benchmark position in Chemed, which runs two very different businesses - the Roto-Rooter® plumbing service and a network of professionals offering end-of-life hospice care. Chemed's shares rose about 44% during the period. Another boost came from owning energy companies LinnCo and Berry Petroleum, the latter of which was acquired by the former. Chemed and LinnCo were not in the index.
The views expressed above reflect those of the portfolio manager(s) only through the end of the period as stated on the cover of this report and do not necessarily represent the views of Fidelity or any other person in the Fidelity organization. Any such views are subject to change at any time based upon market or other conditions and Fidelity disclaims any responsibility to update such views. These views may not be relied on as investment advice and, because investment decisions for a Fidelity fund are based on numerous factors, may not be relied on as an indication of trading intent on behalf of any Fidelity fund.
Annual Report
Shareholder Expense Example
As a shareholder of the Fund, you incur two types of costs: (1) transaction costs, including sales charges (loads) on purchase payments or redemption proceeds, redemption fees and (2) ongoing costs, including management fees, distribution and/or service (12b-1) fees and other Fund expenses. This Example is intended to help you understand your ongoing costs (in dollars) of investing in the Fund and to compare these costs with the ongoing costs of investing in other mutual funds.
The Example is based on an investment of $1,000 invested at the beginning of the period and held for the entire period (February 1, 2014 to July 31, 2014).
Actual Expenses
The first line of the accompanying table for each class of the Fund provides information about actual account values and actual expenses. You may use the information in this line, together with the amount you invested, to estimate the expenses that you paid over the period. Simply divide your account value by $1,000.00 (for example, an $8,600 account value divided by $1,000.00 = 8.6), then multiply the result by the number in the first line for a class of the Fund under the heading entitled "Expenses Paid During Period" to estimate the expenses you paid on your account during this period. A small balance maintenance fee of $12.00 that is charged once a year may apply for certain accounts with a value of less than $2,000. This fee is not included in the table below. If it was, the estimate of expenses you paid during the period would be higher, and your ending account value lower, by this amount. In addition, the Fund, as a shareholder in the underlying Fidelity Central Funds, will indirectly bear its pro-rata share of the fees and expenses incurred by the underlying Fidelity Central Funds. These fees and expenses are not included in the Fund's annualized expense ratio used to calculate the expense estimate in the table below.
Hypothetical Example for Comparison Purposes
The second line of the accompanying table for each class of the Fund provides information about hypothetical account values and hypothetical expenses based on a Class' actual expense ratio and an assumed rate of return of 5% per year before expenses, which is not the Class' actual return. The hypothetical account values and expenses may not be used to estimate the actual ending account balance or expenses you paid for the period. You may use this information to compare the ongoing costs of investing in the Fund and other funds. To do so, compare this 5% hypothetical example with the 5% hypothetical examples that appear in the shareholder reports of the other funds. A small balance maintenance fee of $12.00 that is charged once a year may apply for certain accounts with a value of less than $2,000. This fee is not included in the table below. If it was, the estimate of expenses you paid during the period would be higher, and your ending account value lower, by this amount. In addition, the Fund, as a shareholder in the underlying Fidelity Central Funds, will indirectly bear its pro-rata share of the fees and expenses incurred by the underlying Fidelity Central Funds. These fees and expenses are not included in the Fund's annualized expense ratio used to calculate the expense estimate in the table below.
Please note that the expenses shown in the table are meant to highlight your ongoing costs only and do not reflect any transaction costs. Therefore, the second line of the table is useful in comparing ongoing costs only, and will not help you determine the relative total costs of owning different funds. In addition, if these transactional costs were included, your costs would have been higher.
Annual Report
| Annualized
Expense RatioB | Beginning
Account Value
February 1, 2014 | Ending
Account Value
July 31, 2014 | Expenses Paid
During Period*
February 1, 2014
to July 31, 2014 |
Class A | 1.38% | | | |
Actual | | $ 1,000.00 | $ 1,027.20 | $ 6.94 |
HypotheticalA | | $ 1,000.00 | $ 1,017.95 | $ 6.90 |
Class T | 1.62% | | | |
Actual | | $ 1,000.00 | $ 1,025.90 | $ 8.14 |
HypotheticalA | | $ 1,000.00 | $ 1,016.76 | $ 8.10 |
Class B | 2.21% | | | |
Actual | | $ 1,000.00 | $ 1,023.10 | $ 11.09 |
HypotheticalA | | $ 1,000.00 | $ 1,013.84 | $ 11.04 |
Class C | 2.14% | | | |
Actual | | $ 1,000.00 | $ 1,023.10 | $ 10.73 |
HypotheticalA | | $ 1,000.00 | $ 1,014.18 | $ 10.69 |
Small Cap Value | 1.10% | | | |
Actual | | $ 1,000.00 | $ 1,028.40 | $ 5.53 |
HypotheticalA | | $ 1,000.00 | $ 1,019.34 | $ 5.51 |
Institutional Class | 1.11% | | | |
Actual | | $ 1,000.00 | $ 1,028.40 | $ 5.58 |
HypotheticalA | | $ 1,000.00 | $ 1,019.29 | $ 5.56 |
A 5% return per year before expenses
B Annualized expense ratio reflects expenses net of applicable fee waivers.
* Expenses are equal to each Class' annualized expense ratio, multiplied by the average account value over the period, multiplied by 181/365 (to reflect the one-half year period).
Annual Report
Investment Changes (Unaudited)
Top Ten Stocks as of July 31, 2014 |
| % of fund's
net assets | % of fund's net assets
6 months ago |
Tech Data Corp. | 2.9 | 2.6 |
PacWest Bancorp | 2.9 | 1.8 |
Federated Investors, Inc. Class B (non-vtg.) | 2.9 | 2.9 |
TCF Financial Corp. | 2.8 | 2.8 |
World Fuel Services Corp. | 2.8 | 3.0 |
Endurance Specialty Holdings Ltd. | 2.5 | 2.7 |
First Citizen Bancshares, Inc. | 2.3 | 1.9 |
Ingram Micro, Inc. Class A | 2.3 | 1.9 |
DCT Industrial Trust, Inc. | 2.3 | 2.0 |
Aspen Insurance Holdings Ltd. | 2.3 | 2.1 |
| 26.0 | |
Top Five Market Sectors as of July 31, 2014 |
| % of fund's
net assets | % of fund's net assets
6 months ago |
Financials | 40.8 | 38.9 |
Industrials | 14.3 | 14.8 |
Information Technology | 13.1 | 13.5 |
Consumer Discretionary | 10.4 | 11.9 |
Health Care | 6.6 | 5.5 |
Asset Allocation (% of fund's net assets) |
As of July 31, 2014* | As of January 31, 2014** |
| Stocks 99.5% | | | Stocks 100.0% | |
| Short-Term
Investments and
Net Other Assets (Liabilities) 0.5% | | | Short-Term
Investments and
Net Other Assets (Liabilities) 0.0% | |
* Foreign investments | 8.9% | | ** Foreign investments | 7.5% | |

Annual Report
Investments July 31, 2014
Showing Percentage of Net Assets
Common Stocks - 99.5% |
| Shares | | Value |
CONSUMER DISCRETIONARY - 10.4% |
Auto Components - 0.2% |
Standard Motor Products, Inc. | 143,301 | | $ 5,166,001 |
Diversified Consumer Services - 0.7% |
Regis Corp. | 1,515,900 | | 21,116,487 |
Multiline Retail - 1.9% |
Big Lots, Inc. | 1,212,700 | | 53,055,625 |
Specialty Retail - 7.5% |
Aarons, Inc. Class A | 2,295,100 | | 60,544,738 |
Genesco, Inc. (a) | 617,728 | | 47,114,115 |
Murphy U.S.A., Inc. (a) | 1,060,715 | | 52,420,535 |
Rent-A-Center, Inc. | 1,646,367 | | 39,414,026 |
Tsutsumi Jewelry Co. Ltd. | 520,900 | | 13,304,726 |
| | 212,798,140 |
Textiles, Apparel & Luxury Goods - 0.1% |
Vera Bradley, Inc. (a) | 231,000 | | 4,580,730 |
TOTAL CONSUMER DISCRETIONARY | | 296,716,983 |
CONSUMER STAPLES - 2.7% |
Food Products - 1.5% |
Post Holdings, Inc. (a) | 931,300 | | 41,833,996 |
Tobacco - 1.2% |
Universal Corp. (d) | 660,000 | | 34,273,800 |
TOTAL CONSUMER STAPLES | | 76,107,796 |
ENERGY - 4.8% |
Energy Equipment & Services - 0.4% |
ShawCor Ltd. Class A | 246,000 | | 12,451,727 |
Oil, Gas & Consumable Fuels - 4.4% |
LinnCo LLC (d) | 507,788 | | 14,771,553 |
Northern Oil & Gas, Inc. (a)(d) | 1,958,249 | | 31,508,226 |
World Fuel Services Corp. | 1,823,800 | | 78,332,210 |
| | 124,611,989 |
TOTAL ENERGY | | 137,063,716 |
FINANCIALS - 40.8% |
Banks - 14.4% |
Associated Banc-Corp. | 2,945,300 | | 52,779,776 |
City National Corp. | 840,300 | | 63,232,575 |
Common Stocks - continued |
| Shares | | Value |
FINANCIALS - continued |
Banks - continued |
CVB Financial Corp. | 2,361,688 | | $ 36,110,210 |
First Citizen Bancshares, Inc. | 296,324 | | 65,887,642 |
National Penn Bancshares, Inc. | 2,759,400 | | 28,421,820 |
PacWest Bancorp | 2,004,105 | | 83,511,055 |
TCF Financial Corp. | 5,039,800 | | 79,679,238 |
| | 409,622,316 |
Capital Markets - 3.6% |
Federated Investors, Inc. Class B (non-vtg.) (d) | 2,949,963 | | 83,247,956 |
Waddell & Reed Financial, Inc. Class A | 339,100 | | 17,901,089 |
| | 101,149,045 |
Consumer Finance - 1.9% |
Cash America International, Inc. | 559,700 | | 24,845,083 |
EZCORP, Inc. (non-vtg.) Class A (a) | 1,412,488 | | 13,828,258 |
World Acceptance Corp. (a)(d) | 181,500 | | 14,716,020 |
| | 53,389,361 |
Insurance - 9.4% |
Aspen Insurance Holdings Ltd. | 1,599,400 | | 63,991,994 |
Endurance Specialty Holdings Ltd. | 1,352,400 | | 71,528,436 |
Platinum Underwriters Holdings Ltd. | 1,001,999 | | 58,717,141 |
ProAssurance Corp. | 793,200 | | 34,607,316 |
StanCorp Financial Group, Inc. | 631,300 | | 38,092,642 |
| | 266,937,529 |
Real Estate Investment Trusts - 7.0% |
DCT Industrial Trust, Inc. | 8,229,086 | | 64,433,743 |
Franklin Street Properties Corp. | 3,480,800 | | 42,256,912 |
National Retail Properties, Inc. (d) | 883,400 | | 31,422,538 |
Rouse Properties, Inc. (d)(e) | 3,600,000 | | 61,020,000 |
| | 199,133,193 |
Real Estate Management & Development - 1.1% |
Kennedy Wilson Europe Real Estate PLC | 1,684,900 | | 30,209,829 |
Thrifts & Mortgage Finance - 3.4% |
Astoria Financial Corp. | 3,403,499 | | 43,837,067 |
Washington Federal, Inc. | 2,492,000 | | 52,232,320 |
| | 96,069,387 |
TOTAL FINANCIALS | | 1,156,510,660 |
Common Stocks - continued |
| Shares | | Value |
HEALTH CARE - 6.6% |
Health Care Equipment & Supplies - 2.4% |
Hill-Rom Holdings, Inc. | 773,200 | | $ 30,464,080 |
Integra LifeSciences Holdings Corp. (a) | 809,200 | | 38,372,264 |
| | 68,836,344 |
Health Care Providers & Services - 3.0% |
AmSurg Corp. (a) | 893,800 | | 42,687,888 |
Chemed Corp. (d) | 423,700 | | 43,153,845 |
| | 85,841,733 |
Pharmaceuticals - 1.2% |
Theravance, Inc. (a)(d) | 1,507,033 | | 32,702,616 |
TOTAL HEALTH CARE | | 187,380,693 |
INDUSTRIALS - 14.3% |
Air Freight & Logistics - 0.9% |
Atlas Air Worldwide Holdings, Inc. (a) | 780,133 | | 26,696,151 |
Commercial Services & Supplies - 5.2% |
ACCO Brands Corp. (a)(e) | 7,611,200 | | 50,386,144 |
Knoll, Inc. | 1,269,800 | | 21,345,338 |
Quad/Graphics, Inc. | 1,250,849 | | 26,417,931 |
United Stationers, Inc. | 1,301,398 | | 50,207,935 |
| | 148,357,348 |
Electrical Equipment - 4.4% |
AZZ, Inc. | 770,000 | | 33,602,800 |
EnerSys | 743,700 | | 47,172,891 |
GrafTech International Ltd. (a)(d) | 5,212,200 | | 43,782,480 |
| | 124,558,171 |
Machinery - 1.6% |
Blount International, Inc. (a) | 1,850,200 | | 24,163,612 |
Columbus McKinnon Corp. (NY Shares) | 776,000 | | 18,042,000 |
Mueller Industries, Inc. | 80,000 | | 2,226,400 |
| | 44,432,012 |
Trading Companies & Distributors - 2.2% |
WESCO International, Inc. (a)(d) | 777,933 | | 61,059,961 |
TOTAL INDUSTRIALS | | 405,103,643 |
INFORMATION TECHNOLOGY - 13.1% |
Communications Equipment - 1.5% |
Polycom, Inc. (a) | 3,242,475 | | 41,568,530 |
Common Stocks - continued |
| Shares | | Value |
INFORMATION TECHNOLOGY - continued |
Electronic Equipment & Components - 6.4% |
Ingram Micro, Inc. Class A (a) | 2,248,300 | | $ 64,526,210 |
SYNNEX Corp. (a) | 527,200 | | 34,004,400 |
Tech Data Corp. (a) | 1,336,373 | | 83,910,860 |
| | 182,441,470 |
Internet Software & Services - 1.0% |
j2 Global, Inc. | 574,300 | | 28,094,756 |
IT Services - 2.0% |
CACI International, Inc. Class A (a) | 828,334 | | 57,146,763 |
Software - 2.2% |
SS&C Technologies Holdings, Inc. (a) | 1,418,900 | | 61,452,559 |
TOTAL INFORMATION TECHNOLOGY | | 370,704,078 |
MATERIALS - 3.0% |
Containers & Packaging - 1.3% |
Silgan Holdings, Inc. | 750,000 | | 36,915,000 |
Metals & Mining - 1.7% |
Haynes International, Inc. | 376,903 | | 18,769,769 |
RTI International Metals, Inc. (a) | 1,230,500 | | 30,590,230 |
| | 49,359,999 |
TOTAL MATERIALS | | 86,274,999 |
UTILITIES - 3.8% |
Electric Utilities - 2.8% |
El Paso Electric Co. | 974,121 | | 35,896,359 |
IDACORP, Inc. | 822,000 | | 44,018,100 |
| | 79,914,459 |
Gas Utilities - 1.0% |
Southwest Gas Corp. | 547,656 | | 27,125,402 |
TOTAL UTILITIES | | 107,039,861 |
TOTAL COMMON STOCKS (Cost $2,315,504,569) |
2,822,902,429
|
Money Market Funds - 5.5% |
| Shares | | Value |
Fidelity Cash Central Fund, 0.11% (b) | 10,267,832 | | $ 10,267,832 |
Fidelity Securities Lending Cash Central Fund, 0.11% (b)(c) | 145,531,995 | | 145,531,995 |
TOTAL MONEY MARKET FUNDS (Cost $155,799,827) |
155,799,827
|
TOTAL INVESTMENT PORTFOLIO - 105.0% (Cost $2,471,304,396) | | 2,978,702,256 |
NET OTHER ASSETS (LIABILITIES) - (5.0)% | | (141,148,058) |
NET ASSETS - 100% | $ 2,837,554,198 |
Legend |
(a) Non-income producing |
(b) Affiliated fund that is generally available only to investment companies and other accounts managed by Fidelity Investments. The rate quoted is the annualized seven-day yield of the fund at period end. A complete unaudited listing of the fund's holdings as of its most recent quarter end is available upon request. In addition, each Fidelity Central Fund's financial statements, which are not covered by the Fund's Report of Independent Registered Public Accounting Firm, are available on the SEC's website or upon request. |
(c) Investment made with cash collateral received from securities on loan. |
(d) Security or a portion of the security is on loan at period end. |
(e) Affiliated company |
Affiliated Central Funds |
Information regarding fiscal year to date income earned by the Fund from investments in Fidelity Central Funds is as follows: |
Fund | Income earned |
Fidelity Cash Central Fund | $ 18,564 |
Fidelity Securities Lending Cash Central Fund | 874,417 |
Total | $ 892,981 |
Other Affiliated Issuers |
An affiliated company is a company in which the Fund has ownership of at least 5% of the voting securities. Fiscal year to date transactions with companies which are or were affiliates are as follows: |
Affiliate | Value,
beginning of
period | Purchases | Sales
Proceeds* | Dividend
Income | Value,
end of
period |
ACCO Brands Corp. | $ 70,270,150 | $ 3,955,917 | $ 21,579,480 | $ - | $ 50,386,144 |
Astoria Financial Corp. | 63,439,988 | - | 24,073,100 | 616,420 | - |
Blount International, Inc. | 39,210,500 | - | 14,064,571 | - | - |
CACI International, Inc. Class A | 84,031,458 | - | 31,369,100 | - | - |
Columbus McKinnon Corp. (NY Shares) | 23,226,000 | - | 7,378,820 | 31,040 | - |
Franklin Street Properties Corp. | 63,888,000 | 6,710,106 | 24,031,632 | 2,914,733 | - |
GrafTech International Ltd. | 57,971,680 | - | 28,363,648 | - | - |
HNI Corp. | 97,287,208 | - | 94,962,777 | 1,325,907 | - |
Monotype Imaging Holdings, Inc. | 61,318,401 | - | 69,874,384 | 297,102 | - |
Platinum Underwriters Holdings Ltd. | 85,165,691 | - | 29,187,426 | 360,872 | - |
Quad/Graphics, Inc. | 75,007,000 | - | 34,701,403 | 2,238,965 | - |
Regis Corp. | 57,598,920 | - | 27,623,343 | 337,920 | - |
Rouse Properties, Inc. | - | 62,526,334 | - | 612,000 | 61,020,000 |
RTI International Metals, Inc. | 57,622,000 | - | 22,511,670 | - | - |
Tech Data Corp. | 98,763,117 | 6,654,871 | 38,603,914 | - | - |
Valassis Comm-unications, Inc. | 60,210,064 | 211,335 | 68,200,733 | 1,121,822 | - |
Total | $ 995,010,177 | $ 80,058,563 | $ 536,526,001 | $ 9,856,781 | $ 111,406,144 |
* Includes the value of securities delivered through in-kind transactions. |
Other Information |
The following is a summary of the inputs used, as of July 31, 2014, involving the Fund's assets and liabilities carried at fair value. The inputs or methodology used for valuing securities may not be an indication of the risk associated with investing in those securities. For more information on valuation inputs, and their aggregation into the levels used in the table below, please refer to the Investment Valuation section in the accompanying Notes to Financial Statements. |
Valuation Inputs at Reporting Date: |
Description | Total | Level 1 | Level 2 | Level 3 |
Investments in Securities: | | | | |
Equities: | | | | |
Consumer Discretionary | $ 296,716,983 | $ 283,412,257 | $ 13,304,726 | $ - |
Consumer Staples | 76,107,796 | 76,107,796 | - | - |
Energy | 137,063,716 | 137,063,716 | - | - |
Financials | 1,156,510,660 | 1,156,510,660 | - | - |
Health Care | 187,380,693 | 187,380,693 | - | - |
Industrials | 405,103,643 | 405,103,643 | - | - |
Information Technology | 370,704,078 | 370,704,078 | - | - |
Materials | 86,274,999 | 86,274,999 | - | - |
Utilities | 107,039,861 | 107,039,861 | - | - |
Money Market Funds | 155,799,827 | 155,799,827 | - | - |
Total Investments in Securities: | $ 2,978,702,256 | $ 2,965,397,530 | $ 13,304,726 | $ - |
See accompanying notes which are an integral part of the financial statements.
Annual Report
Statement of Assets and Liabilities
| July 31, 2014 |
| | |
Assets | | |
Investment in securities, at value (including securities loaned of $139,656,509) - See accompanying schedule: Unaffiliated issuers (cost $2,195,838,822) | $ 2,711,496,285 | |
Fidelity Central Funds (cost $155,799,827) | 155,799,827 | |
Other affiliated issuers (cost $119,665,747) | 111,406,144 | |
Total Investments (cost $2,471,304,396) | | $ 2,978,702,256 |
Cash | | 237,291 |
Receivable for investments sold | | 12,220,217 |
Receivable for fund shares sold | | 1,958,797 |
Dividends receivable | | 1,752,464 |
Distributions receivable from Fidelity Central Funds | | 436,344 |
Receivable from investment adviser for expense reductions | | 2,252 |
Other receivables | | 19,623 |
Total assets | | 2,995,329,244 |
| | |
Liabilities | | |
Payable for investments purchased | $ 3,264,421 | |
Payable for fund shares redeemed | 6,046,837 | |
Accrued management fee | 2,105,803 | |
Distribution and service plan fees payable | 166,855 | |
Other affiliated payables | 588,008 | |
Other payables and accrued expenses | 71,127 | |
Collateral on securities loaned, at value | 145,531,995 | |
Total liabilities | | 157,775,046 |
| | |
Net Assets | | $ 2,837,554,198 |
Net Assets consist of: | | |
Paid in capital | | $ 2,049,137,933 |
Undistributed net investment income | | 5,856,882 |
Accumulated undistributed net realized gain (loss) on investments and foreign currency transactions | | 275,161,523 |
Net unrealized appreciation (depreciation) on investments | | 507,397,860 |
Net Assets | | $ 2,837,554,198 |
See accompanying notes which are an integral part of the financial statements.
Annual Report
Financial Statements - continued
Statement of Assets and Liabilities - continued
| July 31, 2014 |
| | |
Calculation of Maximum Offering Price Class A:
Net Asset Value and redemption price per share ($258,183,354 ÷ 13,385,509 shares) | | $ 19.29 |
| | |
Maximum offering price per share (100/94.25 of $19.29) | | $ 20.47 |
Class T:
Net Asset Value and redemption price per share ($100,975,244 ÷ 5,321,352 shares) | | $ 18.98 |
| | |
Maximum offering price per share (100/96.50 of $18.98) | | $ 19.67 |
Class B:
Net Asset Value and offering price per share ($4,808,237 ÷ 264,509 shares)A | | $ 18.18 |
| | |
Class C:
Net Asset Value and offering price per share ($70,541,309 ÷ 3,877,443 shares)A | | $ 18.19 |
| | |
Small Cap Value:
Net Asset Value, offering price and redemption price per share ($2,060,546,290 ÷ 105,297,795 shares) | | $ 19.57 |
| | |
Institutional Class:
Net Asset Value, offering price and redemption price per share ($342,499,764 ÷ 17,499,817 shares) | | $ 19.57 |
A Redemption price per share is equal to net asset value less any applicable contingent deferred sales charge.
See accompanying notes which are an integral part of the financial statements.
Annual Report
Statement of Operations
| Year ended July 31, 2014 |
| | |
Investment Income | | |
Dividends (including $9,856,781 earned from other affiliated issuers) | | $ 48,393,147 |
Interest | | 45 |
Income from Fidelity Central Funds | | 892,981 |
Total income | | 49,286,173 |
| | |
Expenses | | |
Management fee
Basic fee | $ 23,398,200 | |
Performance adjustment | 4,827,948 | |
Transfer agent fees | 6,404,064 | |
Distribution and service plan fees | 2,067,458 | |
Accounting and security lending fees | 952,058 | |
Custodian fees and expenses | 56,759 | |
Independent trustees' compensation | 14,296 | |
Registration fees | 132,108 | |
Audit | 64,853 | |
Legal | 12,312 | |
Interest | 652 | |
Miscellaneous | 33,881 | |
Total expenses before reductions | 37,964,589 | |
Expense reductions | (631,182) | 37,333,407 |
Net investment income (loss) | | 11,952,766 |
Realized and Unrealized Gain (Loss) Net realized gain (loss) on: | | |
Investment securities: | | |
Unaffiliated issuers | 375,645,847 | |
Redemption in-kind with affiliated entities (including gain from Other affiliated issuers of $109,056,467) | 464,750,352 | |
Other affiliated issuers | 85,451,270 | |
Foreign currency transactions | (5,181) | |
Total net realized gain (loss) | | 925,842,288 |
Change in net unrealized appreciation (depreciation) on: Investment securities | (668,247,397) | |
Assets and liabilities in foreign currencies | (1,683) | |
Total change in net unrealized appreciation (depreciation) | | (668,249,080) |
Net gain (loss) | | 257,593,208 |
Net increase (decrease) in net assets resulting from operations | | $ 269,545,974 |
See accompanying notes which are an integral part of the financial statements.
Annual Report
Financial Statements - continued
Statement of Changes in Net Assets
| Year ended
July 31,
2014 | Year ended
July 31,
2013 |
Increase (Decrease) in Net Assets | | |
Operations | | |
Net investment income (loss) | $ 11,952,766 | $ 24,107,442 |
Net realized gain (loss) | 925,842,288 | 300,684,864 |
Change in net unrealized appreciation (depreciation) | (668,249,080) | 820,354,516 |
Net increase (decrease) in net assets resulting
from operations | 269,545,974 | 1,145,146,822 |
Distributions to shareholders from net investment income | (10,662,065) | (21,412,021) |
Distributions to shareholders from net realized gain | (362,625,477) | (85,195,362) |
Total distributions | (373,287,542) | (106,607,383) |
Share transactions - net increase (decrease) | (1,289,647,794) | 507,448,391 |
Redemption fees | 536,076 | 726,904 |
Total increase (decrease) in net assets | (1,392,853,286) | 1,546,714,734 |
| | |
Net Assets | | |
Beginning of period | 4,230,407,484 | 2,683,692,750 |
End of period (including undistributed net investment income of $5,856,882 and undistributed net investment income of $6,475,378, respectively) | $ 2,837,554,198 | $ 4,230,407,484 |
See accompanying notes which are an integral part of the financial statements.
Annual Report
Financial Highlights - Class A
Years ended July 31, | 2014 | 2013 | 2012 | 2011 | 2010 |
Selected Per-Share Data | | | | | |
Net asset value, beginning of period | $ 19.96 | $ 14.86 | $ 15.48 | $ 13.45 | $ 11.13 |
Income from Investment Operations | | | | | |
Net investment income (loss) C | .03 | .07 | .01 | .01F | .02G |
Net realized and unrealized gain (loss) | 1.24 | 5.57 | .30 | 2.22 | 2.33 |
Total from investment operations | 1.27 | 5.64 | .31 | 2.23 | 2.35 |
Distributions from net investment income | (.01) | (.07) | (.01) | (.08) | (.03) |
Distributions from net realized gain | (1.93) | (.47) | (.93) | (.12) | - |
Total distributions | (1.94) | (.54) | (.93) J | (.20) | (.03) |
Redemption fees added to paid in capitalC, I | - | - | - | - | - |
Net asset value, end of period | $ 19.29 | $ 19.96 | $ 14.86 | $ 15.48 | $ 13.45 |
Total ReturnA, B | 6.83% | 39.09% | 3.24% | 16.72% | 21.16% |
Ratios to Average Net Assets D, H | | | | | |
Expenses before reductions | 1.36% | 1.36% | 1.44% | 1.44% | 1.47% |
Expenses net of fee waivers, if any | 1.35% | 1.36% | 1.44% | 1.43% | 1.40% |
Expenses net of all reductions | 1.34% | 1.36% | 1.44% | 1.43% | 1.39% |
Net investment income (loss) | .13% | .41% | .09% | .06% F | .17% G |
Supplemental Data | | | | | |
Net assets, end of period (000 omitted) | $ 258,183 | $ 275,265 | $ 150,285 | $ 140,707 | $ 96,994 |
Portfolio turnover rateE | 26% K | 29% | 27% | 22% | 49% |
A Total returns would have been lower if certain expenses had not been reduced during the applicable periods shown.
B Total returns do not include the effect of the sales charges.
C Calculated based on average shares outstanding during the period.
D Fees and expenses of any underlying Fidelity Central Funds are not included in the Fund's expense ratio. The Fund indirectly bears its proportionate share of the expenses of any underlying Fidelity Central Funds.
E Amount does not include the portfolio activity of any underlying Fidelity Central Funds.
F Investment income per share reflects a large, non-recurring dividend which amounted to $.06 per share. Excluding this non-recurring dividend, the ratio of net investment income (loss) to average net assets would have been (.31)%.
G Investment income per share reflects a large, non-recurring dividend which amounted to $.03 per share. Excluding this non-recurring dividend, the ratio of net investment income (loss) to average net assets would have been (.10)%.
H Expense ratios reflect operating expenses of the class. Expenses before reductions do not reflect amounts reimbursed by the investment adviser or reductions from brokerage service arrangements or reductions from other expense offset arrangements and do not represent the amount paid by the class during periods when reimbursements or reductions occur. Expenses net of fee waivers reflect expenses after reimbursement by the investment adviser but prior to reductions from brokerage service arrangements or other expense offset arrangements. Expenses net of all reductions represent the net expenses paid by the class.
I Amount represents less than $.01 per share.
J Total distributions of $.93 per share is comprised of distributions from net investment income of $.006 and distributions from net realized gain of $.925 per share.
K Portfolio turnover rate excludes securities received or delivered in-kind.
See accompanying notes which are an integral part of the financial statements.
Annual Report
Financial Highlights - Class T
Years ended July 31, | 2014 | 2013 | 2012 | 2011 | 2010 |
Selected Per-Share Data | | | | | |
Net asset value, beginning of period | $ 19.70 | $ 14.70 | $ 15.34 | $ 13.34 | $ 11.05 |
Income from Investment Operations | | | | | |
Net investment income (loss) C | (.02) | .03 | (.02) | (.03) F | (.01) G |
Net realized and unrealized gain (loss) | 1.23 | 5.50 | .31 | 2.20 | 2.31 |
Total from investment operations | 1.21 | 5.53 | .29 | 2.17 | 2.30 |
Distributions from net investment income | - | (.06) | - | (.05) | (.01) |
Distributions from net realized gain | (1.93) | (.47) | (.93) | (.12) | - |
Total distributions | (1.93) | (.53) | (.93) | (.17) | (.01) |
Redemption fees added to paid in capitalC, I | - | - | - | - | - |
Net asset value, end of period | $ 18.98 | $ 19.70 | $ 14.70 | $ 15.34 | $ 13.34 |
Total ReturnA, B | 6.58% | 38.70% | 3.08% | 16.36% | 20.87% |
Ratios to Average Net Assets D, H | | | | | |
Expenses before reductions | 1.61% | 1.60% | 1.67% | 1.70% | 1.72% |
Expenses net of fee waivers, if any | 1.59% | 1.60% | 1.67% | 1.69% | 1.65% |
Expenses net of all reductions | 1.59% | 1.59% | 1.67% | 1.69% | 1.64% |
Net investment income (loss) | (.11)% | .18% | (.14)% | (.19)% F | (.08)% G |
Supplemental Data | | | | | |
Net assets, end of period (000 omitted) | $ 100,975 | $ 107,444 | $ 57,514 | $ 55,845 | $ 44,091 |
Portfolio turnover rateE | 26% J | 29% | 27% | 22% | 49% |
A Total returns would have been lower if certain expenses had not been reduced during the applicable periods shown.
B Total returns do not include the effect of the sales charges.
C Calculated based on average shares outstanding during the period.
D Fees and expenses of any underlying Fidelity Central Funds are not included in the Fund's expense ratio. The Fund indirectly bears its proportionate share of the expenses of any underlying Fidelity Central Funds.
E Amount does not include the portfolio activity of any underlying Fidelity Central Funds.
F Investment income per share reflects a large, non-recurring dividend which amounted to $.06 per share. Excluding this non-recurring dividend, the ratio of net investment income (loss) to average net assets would have been (.57)%.
G Investment income per share reflects a large, non-recurring dividend which amounted to $.03 per share. Excluding this non-recurring dividend, the ratio of net investment income (loss) to average net assets would have been (.35)%.
H Expense ratios reflect operating expenses of the class. Expenses before reductions do not reflect amounts reimbursed by the investment adviser or reductions from brokerage service arrangements or reductions from other expense offset arrangements and do not represent the amount paid by the class during periods when reimbursements or reductions occur. Expenses net of fee waivers reflect expenses after reimbursement by the investment adviser but prior to reductions from brokerage service arrangements or other expense offset arrangements. Expenses net of all reductions represent the net expenses paid by the class.
I Amount represents less than $.01 per share.
J Portfolio turnover rate excludes securities received or delivered in-kind.
See accompanying notes which are an integral part of the financial statements.
Annual Report
Financial Highlights - Class B
Years ended July 31, | 2014 | 2013 | 2012 | 2011 | 2010 |
Selected Per-Share Data | | | | | |
Net asset value, beginning of period | $ 19.06 | $ 14.27 | $ 15.00 | $ 13.08 | $ 10.88 |
Income from Investment Operations | | | | | |
Net investment income (loss) C | (.13) | (.06) | (.09) | (.10) F | (.07) G |
Net realized and unrealized gain (loss) | 1.18 | 5.34 | .29 | 2.15 | 2.27 |
Total from investment operations | 1.05 | 5.28 | .20 | 2.05 | 2.20 |
Distributions from net investment income | - | (.02) | - | (.01) | - |
Distributions from net realized gain | (1.93) | (.47) | (.93) | (.12) | - |
Total distributions | (1.93) | (.49) | (.93) | (.13) | - |
Redemption fees added to paid in capitalC, I | - | - | - | - | - |
Net asset value, end of period | $ 18.18 | $ 19.06 | $ 14.27 | $ 15.00 | $ 13.08 |
Total ReturnA, B | 5.92% | 38.07% | 2.51% | 15.80% | 20.22% |
Ratios to Average Net Assets D, H | | | | | |
Expenses before reductions | 2.18% | 2.15% | 2.19% | 2.20% | 2.22% |
Expenses net of fee waivers, if any | 2.17% | 2.15% | 2.19% | 2.19% | 2.15% |
Expenses net of all reductions | 2.16% | 2.14% | 2.19% | 2.19% | 2.14% |
Net investment income (loss) | (.69)% | (.37)% | (.66)% | (.69)% F | (.58)% G |
Supplemental Data | | | | | |
Net assets, end of period (000 omitted) | $ 4,808 | $ 7,052 | $ 6,675 | $ 8,549 | $ 9,747 |
Portfolio turnover rateE | 26% J | 29% | 27% | 22% | 49% |
A Total returns would have been lower if certain expenses had not been reduced during the applicable periods shown.
B Total returns do not include the effect of the contingent deferred sales charge.
C Calculated based on average shares outstanding during the period.
D Fees and expenses of any underlying Fidelity Central Funds are not included in the Fund's expense ratio. The Fund indirectly bears its proportionate share of the expenses of any underlying Fidelity Central Funds.
E Amount does not include the portfolio activity of any underlying Fidelity Central Funds.
F Investment income per share reflects a large, non-recurring dividend which amounted to $.06 per share. Excluding this non-recurring dividend, the ratio of net investment income (loss) to average net assets would have been (1.07)%.
G Investment income per share reflects a large, non-recurring dividend which amounted to $.03 per share. Excluding this non-recurring dividend, the ratio of net investment income (loss) to average net assets would have been (.85)%.
H Expense ratios reflect operating expenses of the class. Expenses before reductions do not reflect amounts reimbursed by the investment adviser or reductions from brokerage service arrangements or reductions from other expense offset arrangements and do not represent the amount paid by the class during periods when reimbursements or reductions occur. Expenses net of fee waivers reflect expenses after reimbursement by the investment adviser but prior to reductions from brokerage service arrangements or other expense offset arrangements. Expenses net of all reductions represent the net expenses paid by the class.
I Amount represents less than $.01 per share.
J Portfolio turnover rate excludes securities received or delivered in-kind.
See accompanying notes which are an integral part of the financial statements.
Annual Report
Financial Highlights - Class C
Years ended July 31, | 2014 | 2013 | 2012 | 2011 | 2010 |
Selected Per-Share Data | | | | | |
Net asset value, beginning of period | $ 19.06 | $ 14.28 | $ 15.01 | $ 13.08 | $ 10.89 |
Income from Investment Operations | | | | | |
Net investment income (loss) C | (.12) | (.06) | (.09) | (.10) F | (.07) G |
Net realized and unrealized gain (loss) | 1.18 | 5.34 | .29 | 2.17 | 2.26 |
Total from investment operations | 1.06 | 5.28 | .20 | 2.07 | 2.19 |
Distributions from net investment income | - | (.03) | - | (.02) | - |
Distributions from net realized gain | (1.93) | (.47) | (.93) | (.12) | - |
Total distributions | (1.93) | (.50) | (.93) | (.14) | - |
Redemption fees added to paid in capitalC, I | - | - | - | - | - |
Net asset value, end of period | $ 18.19 | $ 19.06 | $ 14.28 | $ 15.01 | $ 13.08 |
Total ReturnA, B | 5.97% | 38.00% | 2.52% | 15.91% | 20.11% |
Ratios to Average Net Assets D, H | | | | | |
Expenses before reductions | 2.12% | 2.13% | 2.19% | 2.18% | 2.22% |
Expenses net of fee waivers, if any | 2.11% | 2.13% | 2.19% | 2.18% | 2.15% |
Expenses net of all reductions | 2.10% | 2.12% | 2.19% | 2.18% | 2.14% |
Net investment income (loss) | (.63)% | (.35)% | (.66)% | (.68)% F | (.58)% G |
Supplemental Data | | | | | |
Net assets, end of period (000 omitted) | $ 70,541 | $ 76,018 | $ 47,265 | $ 47,457 | $ 37,346 |
Portfolio turnover rateE | 26% J | 29% | 27% | 22% | 49% |
A Total returns would have been lower if certain expenses had not been reduced during the applicable periods shown.
B Total returns do not include the effect of the contingent deferred sales charge.
C Calculated based on average shares outstanding during the period.
D Fees and expenses of any underlying Fidelity Central Funds are not included in the Fund's expense ratio. The Fund indirectly bears its proportionate share of the expenses of any underlying Fidelity Central Funds.
E Amount does not include the portfolio activity of any underlying Fidelity Central Funds.
F Investment income per share reflects a large, non-recurring dividend which amounted to $.06 per share. Excluding this non-recurring dividend, the ratio of net investment income (loss) to average net assets would have been (1.06)%.
G Investment income per share reflects a large, non-recurring dividend which amounted to $.03 per share. Excluding this non-recurring dividend, the ratio of net investment income (loss) to average net assets would have been (.85)%.
H Expense ratios reflect operating expenses of the class. Expenses before reductions do not reflect amounts reimbursed by the investment adviser or reductions from brokerage service arrangements or reductions from other expense offset arrangements and do not represent the amount paid by the class during periods when reimbursements or reductions occur. Expenses net of fee waivers reflect expenses after reimbursement by the investment adviser but prior to reductions from brokerage service arrangements or other expense offset arrangements. Expenses net of all reductions represent the net expenses paid by the class.
I Amount represents less than $.01 per share.
J Portfolio turnover rate excludes securities received or delivered in-kind.
See accompanying notes which are an integral part of the financial statements.
Annual Report
Financial Highlights - Small Cap Value
Years ended July 31, | 2014 | 2013 | 2012 | 2011 | 2010 |
Selected Per-Share Data | | | | | |
Net asset value, beginning of period | $ 20.22 | $ 15.05 | $ 15.62 | $ 13.56 | $ 11.22 |
Income from Investment Operations | | | | | |
Net investment income (loss)B | .08 | .12 | .06 | .06E | .05F |
Net realized and unrealized gain (loss) | 1.26 | 5.63 | .32 | 2.23 | 2.34 |
Total from investment operations | 1.34 | 5.75 | .38 | 2.29 | 2.39 |
Distributions from net investment income | (.06) | (.11) | (.02) | (.10) | (.05) |
Distributions from net realized gain | (1.93) | (.47) | (.93) | (.13) | - |
Total distributions | (1.99) | (.58) | (.95) | (.23) | (.05) |
Redemption fees added to paid in capitalB, H | - | - | - | - | - |
Net asset value, end of period | $ 19.57 | $ 20.22 | $ 15.05 | $ 15.62 | $ 13.56 |
Total ReturnA | 7.12% | 39.45% | 3.67% | 17.03% | 21.32% |
Ratios to Average Net AssetsC, G | | | | |
Expenses before reductions | 1.08% | 1.07% | 1.13% | 1.13% | 1.18% |
Expenses net of fee waivers, if any | 1.06% | 1.07% | 1.13% | 1.13% | 1.18% |
Expenses net of all reductions | 1.06% | 1.06% | 1.13% | 1.13% | 1.17% |
Net investment income (loss) | .41% | .71% | .41% | .37%E | .39%F |
Supplemental Data | | | | | |
Net assets, end of period (000 omitted) | $ 2,060,546 | $ 2,672,854 | $ 1,756,962 | $ 1,899,805 | $ 1,770,675 |
Portfolio turnover rateD | .26% I | 29% | 27% | 22% | 49% |
A Total returns would have been lower if certain expenses had not been reduced during the applicable periods shown.
B Calculated based on average shares outstanding during the period.
C Fees and expenses of any underlying Fidelity Central Funds are not included in the Fund's expense ratio. The Fund indirectly bears its proportionate share of the expenses of any underlying Fidelity Central Funds.
D Amount does not include the portfolio activity of any underlying Fidelity Central Funds.
E Investment income per share reflects a large, non-recurring dividend which amounted to $.06 per share. Excluding this non-recurring dividend, the ratio of net investment income (loss) to average net assets would have been (.01)%.
F Investment income per share reflects a large, non-recurring dividend which amounted to $.03 per share. Excluding this non-recurring dividend, the ratio of net investment income (loss) to average net assets would have been .12%.
G Expense ratios reflect operating expenses of the class. Expenses before reductions do not reflect amounts reimbursed by the investment adviser or reductions from brokerage service arrangements or reductions from other expense offset arrangements and do not represent the amount paid by the class during periods when reimbursements or reductions occur. Expenses net of fee waivers reflect expenses after reimbursement by the investment adviser but prior to reductions from brokerage service arrangements or other expense offset arrangements. Expenses net of all reductions represent the net expenses paid by the class.
H Amount represents less than $.01 per share.
I Portfolio turnover rate excludes securities received or delivered in-kind.
See accompanying notes which are an integral part of the financial statements.
Annual Report
Financial Highlights - Institutional Class
Years ended July 31, | 2014 | 2013 | 2012 | 2011 | 2010 |
Selected Per-Share Data | | | | | |
Net asset value, beginning of period | $ 20.23 | $ 15.05 | $ 15.63 | $ 13.58 | $ 11.24 |
Income from Investment Operations | | | | | |
Net investment income (loss) B | .08 | .12 | .06 | .06E | .06F |
Net realized and unrealized gain (loss) | 1.25 | 5.65 | .31 | 2.23 | 2.34 |
Total from investment operations | 1.33 | 5.77 | .37 | 2.29 | 2.40 |
Distributions from net investment income | (.06) | (.12) | (.02) | (.11) | (.06) |
Distributions from net realized gain | (1.93) | (.47) | (.93) | (.13) | - |
Total distributions | (1.99) | (.59) | (.95) | (.24) | (.06) |
Redemption fees added to paid in capitalB, H | - | - | - | - | - |
Net asset value, end of period | $ 19.57 | $ 20.23 | $ 15.05 | $ 15.63 | $ 13.58 |
Total ReturnA | 7.08% | 39.54% | 3.59% | 17.02% | 21.42% |
Ratios to Average Net Assets C, G | | | | | |
Expenses before reductions | 1.09% | 1.07% | 1.14% | 1.10% | 1.12% |
Expenses net of fee waivers, if any | 1.07% | 1.07% | 1.14% | 1.10% | 1.12% |
Expenses net of all reductions | 1.07% | 1.06% | 1.14% | 1.10% | 1.12% |
Net investment income (loss) | .40% | .70% | .39% | .39%E | .45%F |
Supplemental Data | | | | | |
Net assets, end of period (000 omitted) | $ 342,500 | $ 359,582 | $ 138,981 | $ 101,565 | $ 78,440 |
Portfolio turnover rateD | 26% I | 29% | 27% | 22% | 49% |
A Total returns would have been lower if certain expenses had not been reduced during the applicable periods shown.
B Calculated based on average shares outstanding during the period.
C Fees and expenses of any underlying Fidelity Central Funds are not included in the Fund's expense ratio. The Fund indirectly bears its proportionate share of the expenses of any underlying Fidelity Central Funds.
D Amount does not include the portfolio activity of any underlying Fidelity Central Funds.
E Investment income per share reflects a large, non-recurring dividend which amounted to $.06 per share. Excluding this non-recurring dividend, the ratio of net investment income (loss) to average net assets would have been .01%.
F Investment income per share reflects a large, non-recurring dividend which amounted to $.03 per share. Excluding this non-recurring dividend, the ratio of net investment income (loss) to average net assets would have been .18%.
G Expense ratios reflect operating expenses of the class. Expenses before reductions do not reflect amounts reimbursed by the investment adviser or reductions from brokerage service arrangements or reductions from other expense offset arrangements and do not represent the amount paid by the class during periods when reimbursements or reductions occur. Expenses net of fee waivers reflect expenses after reimbursement by the investment adviser but prior to reductions from brokerage service arrangements or other expense offset arrangements. Expenses net of all reductions represent the net expenses paid by the class.
H Amount represents less than $.01 per share.
I Portfolio turnover rate excludes securities received or delivered in-kind.
See accompanying notes which are an integral part of the financial statements.
Annual Report
Notes to Financial Statements
For the period ended July 31, 2014
1. Organization.
Fidelity® Small Cap Value Fund (the Fund) is a fund of Fidelity Securities Fund (the Trust) and is authorized to issue an unlimited number of shares. The Trust is registered under the Investment Company Act of 1940, as amended (the 1940 Act), as an open-end management investment company organized as a Massachusetts business trust. The Fund offers Class A, Class T, Class C, Small Cap Value and Institutional Class shares, each of which has equal rights as to assets and voting privileges. Class B shares are closed to new accounts and additional purchases, except for exchanges and reinvestments. Effective after the close of business on March 1, 2013, the Fund's other share classes were closed to new accounts with certain exceptions. The Fund offered Class F shares during the period June 26, 2009 through November 19, 2013 and all outstanding shares were redeemed by November 19, 2013. Each class has exclusive voting rights with respect to matters that affect that class. Class B shares will automatically convert to Class A shares after a holding period of seven years from the initial date of purchase.
2. Investments in Fidelity Central Funds.
The Fund invests in Fidelity Central Funds, which are open-end investment companies generally available only to other investment companies and accounts managed by the investment adviser and its affiliates. The Fund's Schedule of Investments lists each of the Fidelity Central Funds held as of period end, if any, as an investment of the Fund, but does not include the underlying holdings of each Fidelity Central Fund. As an Investing Fund, the Fund indirectly bears its proportionate share of the expenses of the underlying Fidelity Central Funds.
The Money Market Central Funds seek preservation of capital and current income and are managed by Fidelity Investments Money Management, Inc. (FIMM), an affiliate of the investment adviser. Annualized expenses of the Money Market Central Funds as of their most recent shareholder report date are less than .01%.
A complete unaudited list of holdings for each Fidelity Central Fund is available upon request or at the Securities and Exchange Commission (the SEC) website at www.sec.gov. In addition, the financial statements of the Fidelity Central Funds, which are not covered by the Fund's Report of Independent Registered Public Accounting Firm, are available on the SEC website or upon request.
3. Significant Accounting Policies.
The financial statements have been prepared in conformity with accounting principles generally accepted in the United States of America (GAAP), which require management to make certain estimates and assumptions at the date of the financial statements. Actual results could differ from those estimates. Subsequent events, if any, through the date that the financial statements were issued have been evaluated in the preparation of
Annual Report
Notes to Financial Statements - continued
3. Significant Accounting Policies - continued
the financial statements. The following summarizes the significant accounting policies of the Fund:
Investment Valuation. Investments are valued as of 4:00 p.m. Eastern time on the last calendar day of the period. In accordance with valuation policies and procedures approved by the Board of Trustees (the Board), the Fund attempts to obtain prices from one or more third party pricing vendors or brokers to value its investments. When current market prices, quotations or currency exchange rates are not readily available or reliable, investments will be fair valued in good faith by the Fidelity Management & Research Company (FMR) Fair Value Committee (the Committee), in accordance with procedures adopted by the Board. Factors used in determining fair value vary by investment type and may include market or investment specific events. The frequency with which these procedures are used cannot be predicted and they may be utilized to a significant extent. The Committee oversees the Fund's valuation policies and procedures and is responsible for approving and reporting to the Board all fair value determinations.
The Fund categorizes the inputs to valuation techniques used to value its investments into a disclosure hierarchy consisting of three levels as shown below:
Level 1 - quoted prices in active markets for identical investments
Level 2 - other significant observable inputs (including quoted prices for similar investments, interest rates, prepayment speeds, etc.)
Level 3 - unobservable inputs (including the Fund's own assumptions based on the best information available)
Valuation techniques used to value the Fund's investments by major category are as follows:
Equity securities, including restricted securities, for which market quotations are readily available, are valued at the last reported sale price or official closing price as reported by a third party pricing vendor on the primary market or exchange on which they are traded and are categorized as Level 1 in the hierarchy. In the event there were no sales during the day or closing prices are not available, securities are valued at the last quoted bid price or may be valued using the last available price and are generally categorized as Level 2 in the hierarchy. For foreign equity securities, when market or security specific events arise, comparisons to the valuation of American Depositary Receipts (ADRs), futures contracts, Exchange-Traded Funds (ETFs) and certain indexes as well as quoted prices for similar securities may be used and would be categorized as Level 2 in the hierarchy. Utilizing these techniques may result in transfers between Level 1 and Level 2. For equity securities, including restricted securities, where observable inputs are
Annual Report
3. Significant Accounting Policies - continued
Investment Valuation - continued
limited, assumptions about market activity and risk are used and these securities may be categorized as Level 3 in the hierarchy.
Investments in open-end mutual funds, including the Fidelity Central Funds, are valued at their closing net asset value (NAV) each business day and are categorized as Level 1 in the hierarchy.
Changes in valuation techniques may result in transfers in or out of an assigned level within the disclosure hierarchy. The aggregate value of investments by input level, as of July 31, 2014, is included at the end of the Fund's Schedule of Investments.
Foreign Currency. The Fund may use foreign currency contracts to facilitate transactions in foreign-denominated securities. Gains and losses from these transactions may arise from changes in the value of the foreign currency or if the counterparties do not perform under the contracts' terms.
Foreign-denominated assets, including investment securities, and liabilities are translated into U.S. dollars at the exchange rates at period end. Purchases and sales of investment securities, income and dividends received and expenses denominated in foreign currencies are translated into U.S. dollars at the exchange rate in effect on the transaction date.
The effects of exchange rate fluctuations on investments are included with the net realized and unrealized gain (loss) on investment securities. Other foreign currency transactions resulting in realized and unrealized gain (loss) are disclosed separately.
Investment Transactions and Income. For financial reporting purposes, the Fund's investment holdings and NAV include trades executed through the end of the last business day of the period. The NAV per share for processing shareholder transactions is calculated as of the close of business of the New York Stock Exchange (NYSE), normally 4:00 p.m. Eastern time and includes trades executed through the end of the prior business day. Gains and losses on securities sold are determined on the basis of identified cost and may include proceeds received from litigation. Dividend income is recorded on the ex-dividend date, except for certain dividends from foreign securities where the ex-dividend date may have passed, which are recorded as soon as the Fund is informed of the ex-dividend date. Non-cash dividends included in dividend income, if any, are recorded at the fair market value of the securities received. Income and capital gain distributions from Fidelity Central Funds, if any, are recorded on the ex-dividend date. Distributions received on securities that represent a return of capital or capital gain are recorded as a reduction of cost of investments and/or as a realized gain. Subsequent to ex-dividend date the Fund determines the components of these distributions, based
Annual Report
Notes to Financial Statements - continued
3. Significant Accounting Policies - continued
Investment Transactions and Income - continued
upon receipt of tax filings or other correspondence relating to the underlying investment. Interest income is accrued as earned and includes coupon interest and amortization of premium and accretion of discount on debt securities as applicable. Investment income is recorded net of foreign taxes withheld where recovery of such taxes is uncertain.
Class Allocations and Expenses. Investment income, realized and unrealized capital gains and losses, common expenses of the Fund, and certain fund-level expense reductions, if any, are allocated daily on a pro-rata basis to each class based on the relative net assets of each class to the total net assets of the Fund. Each class differs with respect to transfer agent and distribution and service plan fees incurred. Certain expense reductions may also differ by class. For the reporting period, the allocated portion of income and expenses to each class as a percent of its average net assets may vary due to the timing of recording these transactions in relation to fluctuating net assets of the classes. Expenses directly attributable to a fund are charged to that fund. Expenses attributable to more than one fund are allocated among the respective funds on the basis of relative net assets or other appropriate methods. Expense estimates are accrued in the period to which they relate and adjustments are made when actual amounts are known.
Income Tax Information and Distributions to Shareholders. Each year, the Fund intends to qualify as a regulated investment company under Subchapter M of the Internal Revenue Code, including distributing substantially all of its taxable income and realized gains. As a result, no provision for U.S. Federal income taxes is required. As of July 31, 2014, the Fund did not have any unrecognized tax benefits in the financial statements; nor is the Fund aware of any tax positions for which it is reasonably possible that the total amounts of unrecognized tax benefits will significantly change in the next twelve months. The Fund files a U.S. federal tax return, in addition to state and local tax returns as required. The Fund's federal income tax returns are subject to examination by the Internal Revenue Service (IRS) for a period of three fiscal years after they are filed. State and local tax returns may be subject to examination for an additional fiscal year depending on the jurisdiction. Foreign taxes are provided for based on the Fund's understanding of the tax rules and rates that exist in the foreign markets in which it invests.
Distributions are declared and recorded on the ex-dividend date. Income dividends and capital gain distributions are declared separately for each class. Income and capital gain distributions are determined in accordance with income tax regulations, which may differ from GAAP. In addition, the Fund claimed a portion of the payment made to redeeming shareholders as a distribution for income tax purposes.
Annual Report
3. Significant Accounting Policies - continued
Income Tax Information and Distributions to Shareholders - continued
Capital accounts within the financial statements are adjusted for permanent book-tax differences. These adjustments have no impact on net assets or the results of operations.
Capital accounts are not adjusted for temporary book-tax differences which will reverse in a subsequent period.
Book-tax differences are primarily due to in-kind transactions, foreign currency transactions, passive foreign investment companies (PFIC) and losses deferred due to wash sales.
The federal tax cost of investment securities and unrealized appreciation (depreciation) as of period end were as follows:
Gross unrealized appreciation | $ 594,149,641 |
Gross unrealized depreciation | (90,079,013) |
Net unrealized appreciation (depreciation) on securities | $ 504,070,628 |
| |
Tax Cost | $ 2,474,631,628 |
The tax-based components of distributable earnings as of period end were as follows:
Undistributed ordinary income | $ 5,856,882 |
Undistributed long-term capital gain | $ 278,488,755 |
Net unrealized appreciation (depreciation) on securities and other investments | $ 504,070,628 |
The tax character of distributions paid was as follows:
| July 31, 2014 | July 31, 2013 |
Ordinary Income | $ 10,662,065 | $ 21,412,021 |
Long-term Capital Gains | 362,625,476 | 85,195,362 |
Total | $ 373,287,541 | $ 106,607,383 |
Short-Term Trading (Redemption) Fees. Shares held by investors in the Fund less than 90 days may have been subject to a redemption fee equal to 1.50% of the NAV of shares redeemed. All redemption fees, which reduce the proceeds of the shareholder redemption, are retained by the Fund and accounted for as an addition to paid in capital.
4. Purchases and Sales of Investments.
Purchases and sales of securities, other than short-term securities and in-kind transactions, aggregated $854,969,915 and $1,179,251,195, respectively.
Annual Report
Notes to Financial Statements - continued
5. Fees and Other Transactions with Affiliates.
Management Fee. Fidelity Management & Research Company (the investment adviser) and its affiliates provide the Fund with investment management related services for which the Fund pays a monthly management fee. The management fee is the sum of an individual fund fee rate that is based on an annual rate of .45% of the Fund's average net assets and an annualized group fee rate that averaged .25% during the period. The group fee rate is based upon the average net assets of all the mutual funds advised by the investment adviser, including any mutual funds previously advised by the investment adviser that are currently advised by Fidelity SelectCo, LLC, an affiliate of the investment adviser. The group fee rate decreases as assets under management increase and increases as assets under management decrease. In addition, the management fee is subject to a performance adjustment (up to a maximum of ± .20% of the Fund's average net assets over a 36 month performance period). The upward or downward adjustment to the management fee is based on the relative investment performance of Small Cap Value as compared to its benchmark index, the Russell 2000 Value Index, over the same 36 month performance period. For the reporting period, the total annual management fee rate, including the performance adjustment, was .84% of the Fund's average net assets. The performance adjustment included in the management fee rate may be higher or lower than the maximum performance adjustment rate due to the difference between the average net assets for the reporting and performance periods.
During the period, the investment adviser waived a portion of its management fee as described in the Expense Reductions note.
Distribution and Service Plan Fees. In accordance with Rule 12b-1 of the 1940 Act, the Fund has adopted separate Distribution and Service Plans for each class of shares. Certain classes pay Fidelity Distributors Corporation (FDC), an affiliate of the investment adviser, separate Distribution and Service Fees, each of which is based on an annual percentage of each class' average net assets. In addition, FDC may pay financial intermediaries for selling shares of the Fund and providing shareholder support services. For the period, the Distribution and Service Fee rates, total fees and amounts retained by FDC were as follows:
| Distribution
Fee | Service
Fee | Total Fees | Retained
by FDC |
Class A | -% | .25% | $ 698,016 | $ 8,584 |
Class T | .25% | .25% | 546,090 | 860 |
Class B | .75% | .25% | 62,287 | 46,778 |
Class C | .75% | .25% | 761,065 | 76,077 |
| | | $ 2,067,458 | $ 132,299 |
Annual Report
5. Fees and Other Transactions with Affiliates - continued
Sales Load. FDC may receive a front-end sales charge of up to 5.75% for selling Class A shares and 3.50% for selling Class T shares, some of which is paid to financial intermediaries for selling shares of the Fund. Depending on the holding period, FDC may receive contingent deferred sales charges levied on Class A, Class T, Class B, and Class C redemptions. The deferred sales charges range from 5.00% to 1.00% for Class B shares, 1.00% for Class C shares, 1.00% for certain purchases of Class A shares and .25% for certain purchases of Class T shares.
For the period, sales charge amounts retained by FDC were as follows:
| Retained
by FDC |
Class A | $ 12,340 |
Class T | 4,891 |
Class B* | 5,101 |
Class C* | 3,506 |
| $ 25,838 |
* When Class B and Class C shares are initially sold, FDC pays commissions from its own resources to financial intermediaries through which the sales are made.
Transfer Agent Fees. Fidelity Investments Institutional Operations Company, Inc., (FIIOC), an affiliate of the investment adviser, is the transfer, dividend disbursing and shareholder servicing agent for each class of the Fund. FIIOC receives account fees and asset-based fees that vary according to the account size and type of account of the shareholders of the respective classes of the Fund. FIIOC pays for typesetting, printing and mailing of shareholder reports, except proxy statements.
For the period, transfer agent fees for each class were as follows:
| Amount | % of
Average
Net Assets |
Class A | $ 647,648 | .23 |
Class T | 244,503 | .22 |
Class B | 18,830 | .30 |
Class C | 184,822 | .24 |
Small Cap Value | 4,528,423 | .20 |
Institutional Class | 779,838 | .21 |
| $ 6,404,064 | |
Accounting and Security Lending Fees. Fidelity Service Company, Inc. (FSC), an affiliate of the investment adviser, maintains the Fund's accounting records. The accounting fee is based on the level of average net assets for each month. Under a separate contract, FSC administers the security lending program. The security lending fee is based on the number and duration of lending transactions.
Annual Report
Notes to Financial Statements - continued
5. Fees and Other Transactions with Affiliates - continued
Brokerage Commissions. The Fund placed a portion of its portfolio transactions with brokerage firms which are affiliates of the investment adviser. Brokerage commissions are included in net realized gain (loss) and change in net unrealized appreciation (depreciation) in the Statement of Operations. The commissions paid to these affiliated firms were $34,447 for the period.
Interfund Lending Program. Pursuant to an Exemptive Order issued by the SEC, the Fund, along with other registered investment companies having management contracts with FMR or other affiliated entities of FMR, may participate in an interfund lending program. This program provides an alternative credit facility allowing the funds to borrow from, or lend money to, other participating affiliated funds. At period end, there were no interfund loans outstanding. The Fund's activity in this program during the period for which loans were outstanding was as follows:
Borrower or Lender | Average Loan
Balance | Weighted Average
Interest Rate | Interest
Expense |
Borrower | $ 11,791,333 | .33% | $ 652 |
Redemptions In-Kind. During the period, 67,200,853 shares of the Fund held by affiliated entities were redeemed for investments with a value of $1,338,424,445. The net realized gain of $464,750,352 on investments delivered through in-kind redemptions is included in the accompanying Statement of Operations. The amount of in-kind redemptions is included in share transactions in the accompanying Statement of Changes in Net Assets as well as Note 10: Share Transactions. The Fund recognized no gain or loss for federal income tax purposes.
6. Committed Line of Credit.
The Fund participates with other funds managed by the investment adviser or an affiliate in a $4.25 billion credit facility (the "line of credit") to be utilized for temporary or emergency purposes to fund shareholder redemptions or for other short-term liquidity purposes. The Fund has agreed to pay commitment fees on its pro-rata portion of the line of credit, which amounted to $5,913 and is reflected in Miscellaneous expenses on the Statement of Operations. During the period, the Fund did not borrow on this line of credit.
7. Security Lending.
The Fund lends portfolio securities through a lending agent from time to time in order to earn additional income. For equity securities, a lending agent is used and may loan securities to certain qualified borrowers, including Fidelity Capital Markets (FCM), a broker-dealer affiliated with the Fund. On the settlement date of the loan, the Fund
Annual Report
7. Security Lending - continued
receives collateral (in the form of U.S. Treasury obligations, letters of credit and/or cash) against the loaned securities and maintains collateral in an amount not less than 100% of the market value of the loaned securities during the period of the loan. The market value of the loaned securities is determined at the close of business of the Fund and any additional required collateral is delivered to the Fund on the next business day. If the borrower defaults on its obligation to return the securities loaned because of insolvency or other reasons, the Fund may apply collateral received from the borrower against the obligation. The Fund may experience delays and costs in recovering the securities loaned. Any cash collateral received is invested in the Fidelity Securities Lending Cash Central Fund. The value of loaned securities and cash collateral at period end are disclosed on the Fund's Statement of Assets and Liabilities. At period end, there were no security loans outstanding with FCM. Security lending income represents the income earned on investing cash collateral, less rebates paid to borrowers and any lending agent fees associated with the loan, plus any premium payments received for lending certain types of securities. Security lending income is presented in the Statement of Operations as a component of income from Fidelity Central Funds. Total security lending income during the period amounted to $874,417, including $3,386 from securities loaned to FCM.
8. Expense Reductions.
The investment adviser has contractually agreed to waive a portion of the Fund's management fee until May 31, 2015. During the period, this waiver reduced the Fund's management fee by $538,400.
In addition, the investment adviser reimbursed a portion of the Fund's operating expenses during the period in the amount of $44,531.
Commissions paid to certain brokers with whom the investment adviser, or its affiliates, places trades on behalf of the Fund include an amount in addition to trade execution, which may be rebated back to the Fund to offset certain expenses. This amount totaled $48,251 for the period.
Annual Report
Notes to Financial Statements - continued
9. Distributions to Shareholders.
Distributions to shareholders of each class were as follows:
Years ended July 31, | 2014A | 2013 |
From net investment income | | |
Class A | $ 171,608 | $ 785,355 |
Class T | - | 231,402 |
Class B | - | 9,411 |
Class C | - | 90,526 |
Small Cap Value | 7,284,772 | 13,318,853 |
Class F | 2,011,606 | 5,669,081 |
Institutional Class | 1,194,079 | 1,307,393 |
Total | $ 10,662,065 | $ 21,412,021 |
From net realized gain | | |
Class A | $ 26,941,211 | $ 5,001,914 |
Class T | 10,672,388 | 1,871,336 |
Class B | 695,128 | 211,601 |
Class C | 7,761,033 | 1,589,582 |
Small Cap Value | 236,012,007 | 54,759,308 |
Class F | 44,973,770 | 17,097,966 |
Institutional Class | 35,569,940 | 4,663,655 |
Total | $ 362,625,477 | $ 85,195,362 |
A All Class F Shares were redeemed on November 19, 2013.
10. Share Transactions.
Transactions for each class of shares were as follows:
| Shares | Dollars |
Years ended July 31, | 2014A | 2013 | 2014A | 2013 |
Class A | | | | |
Shares sold | 2,364,232 | 6,665,265 | $ 46,165,166 | $ 113,825,347 |
Reinvestment of distributions | 1,371,738 | 357,182 | 25,837,208 | 5,478,656 |
Shares redeemed | (4,138,116) | (3,345,663) | (80,966,690) | (56,976,312) |
Net increase (decrease) | (402,146) | 3,676,784 | $ (8,964,316) | $ 62,327,691 |
Class T | | | | |
Shares sold | 987,146 | 2,420,486 | $ 19,000,773 | $ 41,524,163 |
Reinvestment of distributions | 566,918 | 135,952 | 10,525,159 | 2,060,454 |
Shares redeemed | (1,685,516) | (1,017,057) | (32,399,109) | (17,196,752) |
Net increase (decrease) | (131,452) | 1,539,381 | $ (2,873,177) | $ 26,387,865 |
Annual Report
10. Share Transactions - continued
| Shares | Dollars |
Years ended July 31, | 2014A | 2013 | 2014A | 2013 |
Class B | | | | |
Shares sold | 9,527 | 63,699 | $ 174,532 | $ 1,033,590 |
Reinvestment of distributions | 33,965 | 12,922 | 607,035 | 189,673 |
Shares redeemed | (149,029) | (174,192) | (2,755,578) | (2,861,489) |
Net increase (decrease) | (105,537) | (97,571) | $ (1,974,011) | $ (1,638,226) |
Class C | | | | |
Shares sold | 268,818 | 1,262,288 | $ 4,960,750 | $ 20,129,471 |
Reinvestment of distributions | 378,946 | 98,556 | 6,778,684 | 1,448,319 |
Shares redeemed | (758,615) | (683,043) | (14,057,302) | (11,003,236) |
Net increase (decrease) | (110,851) | 677,801 | $ (2,317,868) | $ 10,574,554 |
Small Cap Value | | | | |
Shares sold | 19,542,379 | 46,643,321 | $ 386,966,432 | $ 815,184,196 |
Reinvestment of distributions | 11,711,859 | 4,065,017 | 222,752,806 | 63,037,497 |
Shares redeemed | (58,131,122)B | (35,306,999) | (1,153,341,425)B | (618,245,939) |
Net increase (decrease) | (26,876,884) | 15,401,339 | $ (543,622,187) | $ 259,975,754 |
Class F | | | | |
Shares sold | 879,716 | 7,943,352 | $ 17,395,091 | $ 133,806,197 |
Reinvestment of distributions | 2,497,893 | 1,465,154 | 46,985,376 | 22,767,047 |
Shares redeemed | (39,476,567)B | (8,168,596) | (787,183,278)B | (151,555,822) |
Net increase (decrease) | (36,098,958) | 1,239,910 | $ (722,802,811) | $ 5,017,422 |
Institutional Class | | | | |
Shares sold | 4,292,555 | 11,988,758 | $ 84,987,281 | $ 206,274,907 |
Reinvestment of distributions | 1,739,424 | 337,968 | 33,193,654 | 5,246,517 |
Shares redeemed | (6,306,791) | (3,783,835) | (125,274,359) | (66,718,093) |
Net increase (decrease) | (274,812) | 8,542,891 | $ (7,093,424) | $ 144,803,331 |
A All Class F Shares were redeemed on November 19, 2013.
B Amount includes in-kind redemptions (see Note 5: Redemptions In-Kind).
Annual Report
Notes to Financial Statements - continued
11. Other.
The Fund's organizational documents provide former and current trustees and officers with a limited indemnification against liabilities arising in connection with the performance of their duties to the Fund. In the normal course of business, the Fund may also enter into contracts that provide general indemnifications. The Fund's maximum exposure under these arrangements is unknown as this would be dependent on future claims that may be made against the Fund. The risk of material loss from such claims is considered remote.
Annual Report
To the Trustees of Fidelity Securities Fund and the Shareholders of Fidelity Small Cap Value Fund:
In our opinion, the accompanying statement of assets and liabilities, including the schedule of investments, and the related statements of operations and of changes in net assets and the financial highlights present fairly, in all material respects, the financial position of Fidelity Small Cap Value Fund (a fund of Fidelity Securities Fund) at July 31, 2014, the results of its operations for the year then ended, the changes in its net assets for each of the two years in the period then ended and the financial highlights for each of the five years in the period then ended, in conformity with accounting principles generally accepted in the United States of America. These financial statements and financial highlights (hereafter referred to as "financial statements") are the responsibility of the Fidelity Small Cap Value Fund's management. Our responsibility is to express an opinion on these financial statements based on our audits. We conducted our audits of these financial statements in accordance with the standards of the Public Company Accounting Oversight Board (United States). Those standards require that we plan and perform the audit to obtain reasonable assurance about whether the financial statements are free of material misstatement. An audit includes examining, on a test basis, evidence supporting the amounts and disclosures in the financial statements, assessing the accounting principles used and significant estimates made by management, and evaluating the overall financial statement presentation. We believe that our audits, which included confirmation of securities at July 31, 2014 by correspondence with the custodian and brokers, provide a reasonable basis for our opinion.
PricewaterhouseCoopers LLP
Boston, Massachusetts
September 12, 2014
Annual Report
The Trustees, Member of the Advisory Board, and officers of the trust and fund, as applicable, are listed below. The Board of Trustees governs the fund and is responsible for protecting the interests of shareholders. The Trustees are experienced executives who meet periodically throughout the year to oversee the fund's activities, review contractual arrangements with companies that provide services to the fund, oversee management of the risks associated with such activities and contractual arrangements, and review the fund's performance. Except for James C. Curvey, each of the Trustees oversees 173 funds. Mr. Curvey oversees 397 funds.
The Trustees hold office without limit in time except that (a) any Trustee may resign; (b) any Trustee may be removed by written instrument, signed by at least two-thirds of the number of Trustees prior to such removal; (c) any Trustee who requests to be retired or who has become incapacitated by illness or injury may be retired by written instrument signed by a majority of the other Trustees; and (d) any Trustee may be removed at any special meeting of shareholders by a two-thirds vote of the outstanding voting securities of the trust. Each Trustee who is not an interested person (as defined in the 1940 Act) of the trust and the fund (Independent Trustee), shall retire not later than the last day of the calendar year in which his or her 75th birthday occurs. The Independent Trustees may waive this mandatory retirement age policy with respect to individual Trustees. The officers and Advisory Board Member hold office without limit in time, except that any officer and Advisory Board Member may resign or may be removed by a vote of a majority of the Trustees at any regular meeting or any special meeting of the Trustees. Except as indicated, each individual has held the office shown or other offices in the same company for the past five years.
Experience, Skills, Attributes, and Qualifications of the Fund's Trustees. The Governance and Nominating Committee has adopted a statement of policy that describes the experience, qualifications, attributes, and skills that are necessary and desirable for potential Independent Trustee candidates (Statement of Policy). The Board believes that each Trustee satisfied at the time he or she was initially elected or appointed a Trustee, and continues to satisfy, the standards contemplated by the Statement of Policy. The Governance and Nominating Committee also engages professional search firms to help identify potential Independent Trustee candidates who have the experience, qualifications, attributes, and skills consistent with the Statement of Policy. From time to time, additional criteria based on the composition and skills of the current Independent Trustees, as well as experience or skills that may be appropriate in light of future changes to board composition, business conditions, and regulatory or other developments, have also been considered by the professional search firms and the Governance and Nominating Committee. In addition, the Board takes into account the Trustees' commitment and participation in Board and committee meetings, as well as their leadership of standing and ad hoc committees throughout their tenure.
In determining that a particular Trustee was and continues to be qualified to serve as a Trustee, the Board has considered a variety of criteria, none of which, in isolation, was controlling. The Board believes that, collectively, the Trustees have balanced and diverse experience, qualifications, attributes, and skills, which allow the Board to operate effectively in governing the fund and protecting the interests of shareholders. Information about the specific experience, skills, attributes, and qualifications of each Trustee, which in each case led to the Board's conclusion that the Trustee should serve (or continue to serve) as a trustee of the fund, is provided below.
Annual Report
Board Structure and Oversight Function. James C. Curvey is an interested person (as defined in the 1940 Act) and currently serves as Chairman. The Trustees have determined that an interested Chairman is appropriate and benefits shareholders because an interested Chairman has a personal and professional stake in the quality and continuity of services provided to the fund. Independent Trustees exercise their informed business judgment to appoint an individual of their choosing to serve as Chairman, regardless of whether the Trustee happens to be independent or a member of management. The Independent Trustees have determined that they can act independently and effectively without having an Independent Trustee serve as Chairman and that a key structural component for assuring that they are in a position to do so is for the Independent Trustees to constitute a substantial majority for the Board. The Independent Trustees also regularly meet in executive session. Ned C. Lautenbach serves as Chairman of the Independent Trustees and as such (i) acts as a liaison between the Independent Trustees and management with respect to matters important to the Independent Trustees and (ii) with management prepares agendas for Board meetings.
Fidelity funds are overseen by different Boards of Trustees. The fund's Board oversees Fidelity's equity and high income funds and another Board oversees Fidelity's investment-grade bond, money market, and asset allocation funds. The asset allocation funds may invest in Fidelity funds overseen by the fund's Board. The use of separate Boards, each with its own committee structure, allows the Trustees of each group of Fidelity funds to focus on the unique issues of the funds they oversee, including common research, investment, and operational issues. On occasion, the separate Boards establish joint committees to address issues of overlapping consequences for the Fidelity funds overseen by each Board.
The Trustees operate using a system of committees to facilitate the timely and efficient consideration of all matters of importance to the Trustees, the fund, and fund shareholders and to facilitate compliance with legal and regulatory requirements and oversight of the fund's activities and associated risks. The Board, acting through its committees, has charged FMR and its affiliates with (i) identifying events or circumstances the occurrence of which could have demonstrably adverse effects on the fund's business and/or reputation; (ii) implementing processes and controls to lessen the possibility that such events or circumstances occur or to mitigate the effects of such events or circumstances if they do occur; and (iii) creating and maintaining a system designed to evaluate continuously business and market conditions in order to facilitate the identification and implementation processes described in (i) and (ii) above. Because the day-to-day operations and activities of the fund are carried out by or through FMR, its affiliates and other service providers, the fund's exposure to risks is mitigated but not eliminated by the processes overseen by the Trustees. While each of the Board's committees has responsibility for overseeing different aspects of the fund's activities, oversight is exercised primarily through the Operations, Audit, and Compliance Committees. In addition, the Independent Trustees have worked with FMR to enhance the Board's oversight of investment and financial risks, legal and regulatory risks, technology risks, and operational risks, including the development of additional risk reporting to the Board. For example, a working group comprised of Independent Trustees and FMR has worked and continues to work to review the Fidelity funds' valuation-related activities, reporting and risk management. Appropriate personnel, including but not limited to the fund's Chief Compliance Officer (CCO), FMR's internal auditor, the independent accountants, the fund's Treasurer and portfolio management personnel, make periodic reports to the Board's committees, as appropriate, including an annual review of FMR's risk management program for the Fidelity funds. The responsibilities of each standing committee, including their oversight responsibilities, are described further under "Standing Committees of the Fund's Trustees."
Annual Report
Trustees and Officers - continued
The fund's Statement of Additional Information (SAI) includes more information about the Trustees. To request a free copy, call Fidelity at 1-877-208-0098.
Interested Trustees*:
Correspondence intended for each Trustee who is an interested person may be sent to Fidelity Investments, 245 Summer Street, Boston, Massachusetts 02210.
Name, Year of Birth; Principal Occupations and Other Relevant Experience+ |
James C. Curvey (1935) |
Year of Election or Appointment: 2007 Trustee Chairman of the Board of Trustees |
| Mr. Curvey also serves as Trustee of other Fidelity funds. Mr. Curvey is a Director of Fidelity Research & Analysis Co. (2009-present), and Vice Chairman (2007-present) and Director of FMR LLC. In addition, Mr. Curvey serves as an Overseer for the Boston Symphony Orchestra and a member of the Trustees of Villanova University. Previously, Mr. Curvey served as a Director of Fidelity Investments Money Management, Inc. (2009-2014), a Director of FMR (2007-2014), a Director of FMR Co., Inc. (2007-2014) and was the Vice Chairman (2006-2007) and Director (2000-2007) of FMR Corp. |
Charles S. Morrison (1960) |
Year of Election or Appointment: 2014 Trustee |
| Mr. Morrison also serves as Trustee of other funds. He serves as President, Asset Management (2014-present) and is an employee of Fidelity Investments. Previously, Mr. Morrison served as Vice President of Fidelity's Fixed Income and Asset Allocation Funds (2012-2014), President, Fixed Income (2011-2014), Vice President of Fidelity's Money Market Funds (2005-2009), President, Money Market Group Leader of FMR (2009), and Senior Vice President, Money Market Group of FMR (2004-2009). Mr. Morrison also served as Vice President of Fidelity's Bond Funds (2002-2005), certain Balanced Funds (2002-2005), and certain Asset Allocation Funds (2002-2007), and as Senior Vice President (2002-2005) of Fidelity's Bond Division. |
* Trustees have been determined to be "Interested Trustees" by virtue of, among other things, their affiliation with the trust or various entities under common control with FMR.
+ The information above includes each Trustee's principal occupation during the last five years and other information relating to the experience, attributes, and skills relevant to each Trustee's qualifications to serve as a Trustee, which led to the conclusion that each Trustee should serve as a Trustee for the fund.
Annual Report
Trustees and Officers - continued
Independent Trustees:
Correspondence intended for each Independent Trustee (that is, the Trustees other than the Interested Trustees) may be sent to Fidelity Investments, P.O. Box 55235, Boston, Massachusetts 02205-5235.
Name, Year of Birth; Principal Occupations and Other Relevant Experience+ |
Dennis J. Dirks (1948) |
Year of Election or Appointment: 2005 Trustee |
| Mr. Dirks also serves as Trustee of other Fidelity funds. Prior to his retirement in May 2003, Mr. Dirks was Chief Operating Officer and a member of the Board of The Depository Trust & Clearing Corporation (DTCC). He also served as President, Chief Operating Officer, and Board member of The Depository Trust Company (DTC) and President and Board member of the National Securities Clearing Corporation (NSCC). In addition, Mr. Dirks served as Chief Executive Officer and Board member of the Government Securities Clearing Corporation, Chief Executive Officer and Board member of the Mortgage-Backed Securities Clearing Corporation, as a Trustee and a member of the Finance Committee of Manhattan College (2005-2008), and as a Trustee and a member of the Finance Committee of AHRC of Nassau County (2006-2008). Mr. Dirks is a member of the Independent Directors Council (IDC) Governing Council (2010-present) and Board of Directors for The Brookville Center for Children's Services, Inc. (2009-present). |
Alan J. Lacy (1953) |
Year of Election or Appointment: 2008 Trustee |
| Mr. Lacy also serves as Trustee of other Fidelity funds. Mr. Lacy serves as Senior Adviser (2007-present) of Oak Hill Capital Partners, L.P. (private equity). Mr. Lacy also served as Chief Executive Officer (2000-2005) and Vice Chairman (2005-2006) of Sears Holdings Corporation and Sears, Roebuck and Co. (retail). In addition, Mr. Lacy serves as a member of the Board of Directors of Dave & Buster's Entertainment, Inc. (restaurant and entertainment complexes, 2010-present), Earth Fare, Inc. (retail grocery, 2012-present), The Hillman Companies, Inc. (hardware wholesalers, 2010-present), and Bristol-Myers Squibb Company (global pharmaceuticals, 2008-present). Mr. Lacy is a member of the Board of Trustees of The National Parks Conservation Association (2006-present). Previously, Mr. Lacy served as Chairman of the Board of Trustees of the National Parks Conservation Association (2008-2011) and as a member of the Board of Directors for the Western Union Company (global money transfer, 2006-2011). |
Ned C. Lautenbach (1944) |
Year of Election or Appointment: 2000 Trustee Chairman of the Independent Trustees |
| Mr. Lautenbach also serves as Trustee of other Fidelity funds. Mr. Lautenbach currently serves as the Lead Director of the Eaton Corporation Board of Directors (diversified industrial, 1997-present). Mr. Lautenbach is Chairman of the Board of Directors of the Philharmonic Center for the Arts in Naples, Florida (2012-present) and a member of the Council on Foreign Relations (1994-present). Previously, Mr. Lautenbach was a Partner/Advisory Partner at Clayton, Dubilier & Rice, LLC (private equity investment, 1998-2010), as well as a Director of Sony Corporation (2006-2007). |
Joseph Mauriello (1944) |
Year of Election or Appointment: 2008 Trustee |
| Mr. Mauriello also serves as Trustee of other Fidelity funds. Prior to his retirement in January 2006, Mr. Mauriello served in numerous senior management positions including Deputy Chairman and Chief Operating Officer (2004-2005), and Vice Chairman of Financial Services (2002-2004) of KPMG LLP US (professional services, 1965-2005). Mr. Mauriello currently serves as a member of the Board of Directors of XL Group plc. (global insurance and re-insurance, 2006-present). Previously, Mr. Mauriello served as a Director of the Hamilton Funds of the Bank of New York (2006-2007) and of Arcadia Resources Inc. (health care services and products, 2007-2012). |
Robert W. Selander (1950) |
Year of Election or Appointment: 2011 Trustee |
| Mr. Selander also serves as Trustee of other Fidelity funds. Previously, Mr. Selander served as a Member of the Advisory Board of other Fidelity funds (2011), and Executive Vice Chairman (2010), Chief Executive Officer (2009-2010), and President and Chief Executive Officer (1997-2009) of Mastercard, Inc. |
Cornelia M. Small (1944) |
Year of Election or Appointment: 2005 Trustee |
| Ms. Small also serves as Trustee of other Fidelity funds. Ms. Small is a member of the Board of Directors (2009-present) and Chair of the Investment Committee (2010-present) of the Teagle Foundation. Ms. Small also serves on the Investment Committee of the Berkshire Taconic Community Foundation (2008-present). Previously, Ms. Small served as Chairperson (2002-2008) and a member of the Investment Committee and Chairperson (2008-2012) and a member of the Board of Trustees of Smith College. In addition, Ms. Small served as Chief Investment Officer, Director of Global Equity Investments, and a member of the Board of Directors of Scudder, Stevens & Clark and Scudder Kemper Investments. |
William S. Stavropoulos (1939) |
Year of Election or Appointment: 2002 Trustee Vice Chairman of the Independent Trustees |
| Mr. Stavropoulos also serves as Trustee of other Fidelity funds. Mr. Stavropoulos serves as President and Founder of the Michigan Baseball Foundation, the Great Lakes Loons (2007-present). Mr. Stavropoulos is Chairman Emeritus of the Board of Directors of The Dow Chemical Company, where he previously served in numerous senior management positions, including President, CEO (1995-2000; 2002-2004), Chairman of the Executive Committee (2000-2006), and as a member of the Board of Directors (1990-2006). Currently, Mr. Stavropoulos is Chairman of the Board of Directors of Univar Inc. (global distributor of commodity and specialty chemicals), a Director of Teradata Corporation (data warehousing and technology solutions), and Maersk Inc. (industrial conglomerate), and a member of the Advisory Board for Metalmark Capital LLC (private equity investment, 2005-present). Mr. Stavropoulos is an operating advisor to Clayton, Dubilier & Rice, LLC (private equity investment). In addition, Mr. Stavropoulos is a member of the University of Notre Dame Advisory Council for the College of Science, a Trustee of the Rollin L. Gerstacker Foundation, and a Director of the Naples Philharmonic Center for the Arts. Previously, Mr. Stavropoulos served as a Director of Chemical Financial Corporation (bank holding company, 1993-2012) and Tyco International, Ltd. (multinational manufacturing and services, 2007-2012). |
David M. Thomas (1949) |
Year of Election or Appointment: 2008 Trustee |
| Mr. Thomas also serves as Trustee of other Fidelity funds. Mr. Thomas serves as Non-Executive Chairman of the Board of Directors of Fortune Brands Home and Security (home and security products, 2011-present), and as a member of the Board of Directors of Interpublic Group of Companies, Inc. (marketing communication, 2004-present). Previously, Mr. Thomas served as Executive Chairman (2005-2006) and Chairman and Chief Executive Officer (2000-2005) of IMS Health, Inc. (pharmaceutical and healthcare information solutions), and a Director of Fortune Brands, Inc. (consumer products, 2000-2011). |
+ The information above includes each Trustee's principal occupation during the last five years and other information relating to the experience, attributes, and skills relevant to each Trustee's qualifications to serve as a Trustee, which led to the conclusion that each Trustee should serve as a Trustee for the fund.
Advisory Board Member and Officers:
Correspondence intended for each officer and Peter S. Lynch may be sent to Fidelity Investments, 245 Summer Street, Boston, Massachusetts 02210. Officers appear below in alphabetical order.
Name, Year of Birth; Principal Occupation |
Peter S. Lynch (1944) |
Year of Election or Appointment: 2003 Member of the Advisory Board |
| Mr. Lynch also serves as Member of the Advisory Board of other Fidelity funds. Mr. Lynch is Vice Chairman and a Director of FMR and FMR Co., Inc. In addition, Mr. Lynch serves as a Trustee of Boston College and as the Chairman of the Inner-City Scholarship Fund. Previously, Mr. Lynch served on the Special Olympics International Board of Directors (1997-2006). |
Elizabeth Paige Baumann (1968) |
Year of Election or Appointment: 2012 Anti-Money Laundering (AML) Officer |
| Ms. Baumann also serves as AML Officer of other funds. She is Chief AML Officer of FMR LLC (2012-present) and is an employee of Fidelity Investments. Previously, Ms. Baumann served as Vice President and Deputy Anti-Money Laundering Officer (2007-2012). |
William C. Coffey (1969) |
Year of Election or Appointment: 2009 Assistant Secretary |
| Mr. Coffey also serves as Assistant Secretary of other funds. He is Senior Vice President and Deputy General Counsel of FMR LLC (2010-present), and is an employee of Fidelity Investments. Previously, Mr. Coffey served as Vice President and Associate General Counsel of FMR LLC (2005-2009). |
Jonathan Davis (1968) |
Year of Election or Appointment: 2010 Assistant Treasurer |
| Mr. Davis also serves as Assistant Treasurer of other funds. Mr. Davis is an employee of Fidelity Investments. Previously, Mr. Davis served as Vice President and Associate General Counsel of FMR LLC (2003-2010). |
Adrien E. Deberghes (1967) |
Year of Election or Appointment: 2008 Deputy Treasurer |
| Mr. Deberghes also serves as an officer of other funds. He is an employee of Fidelity Investments (2008-present). Prior to joining Fidelity Investments, Mr. Deberghes was Senior Vice President of Mutual Fund Administration at State Street Corporation (2007-2008), Senior Director of Mutual Fund Administration at Investors Bank & Trust (2005-2007), and Director of Finance for Dunkin' Brands (2000-2005). |
Stephanie J. Dorsey (1969) |
Year of Election or Appointment: 2010 Assistant Treasurer |
| Ms. Dorsey also serves as an officer of other funds. She is an employee of Fidelity Investments (2008-present) and has served in other fund officer roles. Prior to joining Fidelity Investments, Ms. Dorsey served as Treasurer (2004-2008) of the JPMorgan Mutual Funds and Vice President (2004-2008) of JPMorgan Chase Bank. |
Howard J. Galligan III (1966) |
Year of Election or Appointment: 2014 Chief Financial Officer |
| Mr. Galligan also serves as Chief Financial Officer of other funds. Mr. Galligan serves as President of Fidelity Pricing and Cash Management Services (FPCMS) (2014-present) and as a Director of Strategic Advisers, Inc. (2008-present). Previously, Mr. Galligan served as Chief Administrative Officer of Asset Management (2011-2014) and Chief Operating Officer and Senior Vice President of Investment Support for Strategic Advisers, Inc. (2003-2011). |
Scott C. Goebel (1968) |
Year of Election or Appointment: 2008 Secretary and Chief Legal Officer (CLO) |
| Mr. Goebel serves as Secretary and CLO of other funds. Mr. Goebel also serves as Secretary of Fidelity SelectCo, LLC (2013-present), Fidelity Investments Money Management, Inc. (FIMM) (2010-present) and Fidelity Research and Analysis Company (FRAC) (2010-present); General Counsel, Secretary, and Senior Vice President of FMR (2008-present) and FMR Co., Inc. (2008-present); Chief Legal Officer of Fidelity Management & Research (Hong Kong) Limited (2008-present); and Assistant Secretary of Fidelity Management & Research (Japan) Inc. (2008-present) and Fidelity Management & Research (U.K.) Inc. (2008-present). Previously, Mr. Goebel served as Secretary and CLO of other Fidelity funds (2008-2013), Assistant Secretary of FIMM (2008-2010), FRAC (2008-2010), and certain funds (2007-2008); and as Vice President and Secretary of Fidelity Distributors Corporation (FDC) (2005-2007). Mr. Goebel has been employed by FMR LLC or an affiliate since 2001. |
Thomas C. Hense (1964) |
Year of Election or Appointment: 2008/2010 Vice President |
| Mr. Hense also serves as Vice President of other funds (High Income (2008), Small Cap (2008), and Value (2010) funds). Previously, Mr. Hense served as a portfolio manager for Fidelity's Institutional Money Management Group (Pyramis) (2003-2008). |
Brian B. Hogan (1964) |
Year of Election or Appointment: 2009 Vice President |
| Mr. Hogan also serves as Trustee or Vice President of other funds. Mr. Hogan serves as President of FMR's Equity Division (2009-present). Previously, Mr. Hogan served as Senior Vice President, Equity Research of FMR (2006-2009) and as a portfolio manager. |
Chris Maher (1972) |
Year of Election or Appointment: 2013 Assistant Treasurer |
| Mr. Maher serves as Assistant Treasurer of other funds. Mr. Maher is Vice President of Valuation Oversight and is an employee of Fidelity Investments. Previously, Mr. Maher served as Vice President of Asset Management Compliance (2013), Vice President of FMR's Program Management Group (2010-2013), and Vice President of Valuation Oversight (2008-2010). |
Kenneth B. Robins (1969) |
Year of Election or Appointment: 2008 President and Treasurer |
| Mr. Robins also serves as an officer of other funds. Mr. Robins serves as Executive Vice President of Fidelity Investments Money Management, Inc. (FIMM) (2013-present) and is an employee of Fidelity Investments (2004-present). Previously, Mr. Robins served in other fund officer roles. |
Stephen Sadoski (1971) |
Year of Election or Appointment: 2012 Deputy Treasurer |
| Mr. Sadoski also serves as Deputy Treasurer of other funds. He is an employee of Fidelity Investments (2012-present) and has served in another fund officer role. Prior to joining Fidelity Investments, Mr. Sadoski served as an assistant chief accountant in the Division of Investment Management of the Securities and Exchange Commission (SEC) (2009-2012) and as a senior manager at Deloitte & Touche LLP (1997-2009). |
Stacie M. Smith (1974) |
Year of Election or Appointment: 2013 Deputy Treasurer |
| Ms. Smith also serves as an officer of other funds. She is an employee of Fidelity Investments (2009-present) and has served in other fund officer roles. Prior to joining Fidelity Investments, Ms. Smith served as Senior Audit Manager of Ernst & Young LLP (1996-2009). |
Renee Stagnone (1975) |
Year of Election or Appointment: 2013 Deputy Treasurer |
| Ms. Stagnone also serves as Deputy Treasurer of other funds. Ms. Stagnone is an employee of Fidelity Investments. |
Linda J. Wondrack (1964) |
Year of Election or Appointment: 2014 Chief Compliance Officer |
| Ms. Wondrack also serves as Chief Compliance Officer of other funds. Ms. Wondrack is Executive Vice President and head of the Ethics Office and Asset Management Compliance for Fidelity Investments (2012-present). Ms. Wondrack also serves as Chief Compliance Officer of Fidelity SelectCo, LLC (2014-present); Chief Compliance Officer of Impresa Management LLC (2013-present); and Chief Compliance Officer of FMR Co., Inc., Fidelity Investments Money Management, Inc., Fidelity Management & Research (Japan) Inc., Fidelity Management & Research (U.K.) Inc., Fidelity Management & Research (Hong Kong), Fidelity Management & Research Company, Pyramis Global Advisors, LLC, and Strategic Advisers, Inc., Ballyrock Investment Advisors LLC, and Northern Neck Investors LLC (2012-present). Previously, Ms. Wondrack served as Senior Vice President and Chief Compliance Officer for Columbia Management Investment Advisers, LLC (2005-2012); Chief Compliance Officer for certain funds within the Columbia Family of Funds (2007-2012); and Senior Vice President of Compliance Risk Management at Bank of America (2005-2010). |
Joseph F. Zambello (1957) |
Year of Election or Appointment: 2011 Deputy Treasurer |
| Mr. Zambello also serves as Deputy Treasurer of other funds. Mr. Zambello is an employee of Fidelity Investments. Previously, Mr. Zambello served as Vice President of FMR's Program Management Group (2009-2011) and Vice President of the Transfer Agent Oversight Group (2005-2009). |
Annual Report
The Board of Trustees of Fidelity Small Cap Value Fund voted to pay to shareholders of record at the opening of business, the following distributions per share derived from capital gains realized from sales of portfolio securities, and dividends derived from net investment income:
| Pay Date | Record Date | Dividends | Capital Gains |
Institutional Class | 09/15/14 | 09/12/14 | $0.048 | $1.955 |
The fund hereby designates as a capital gain dividend with respect to the taxable year ended July 31, 2014, $441,012,533, or, if subsequently determined to be different, the net capital gain of such year.
Institutional Class designates 100% of the dividends distributed during the fiscal year as qualifying for the dividends-received deduction for corporate shareholders.
Institutional Class designates 100% of the dividends distributed during the fiscal year as amounts which can be taken into account as a dividend for the purposes of the maximum rate under section 1(h)(11) of the Internal Revenue Code.
The fund will notify shareholders in January 2015 of amounts for use in preparing 2014 income tax returns.
Annual Report
Board Approval of Investment Advisory Contracts and Management Fees
Fidelity Small Cap Value Fund
Each year, the Board of Trustees, including the Independent Trustees (together, the Board), votes on the renewal of the management contract with Fidelity Management & Research Company (FMR) and the sub-advisory agreements (together, the Advisory Contracts) for the fund. The Board, assisted by the advice of fund counsel and Independent Trustees' counsel, requests and considers a broad range of information relevant to the renewal of the Advisory Contracts throughout the year.
The Board meets regularly and, at each of its meetings, covers an extensive agenda of topics and materials and considers factors that are relevant to its annual consideration of the renewal of the fund's Advisory Contracts, including the services and support provided to the fund and its shareholders. The Board has established various standing committees (Committees), each composed of and chaired by Independent Trustees with varying backgrounds, to which the Board has assigned specific subject matter responsibilities in order to enhance effective decision-making by the Board. The Board, acting directly and through its Committees, requests and receives information concerning the annual consideration of the renewal of the fund's Advisory Contracts. The Board also meets as needed to consider matters specifically related to the Board's annual consideration of the renewal of the Advisory Contracts. Members of the Board may also meet with trustees of other Fidelity funds through ad hoc joint committees to discuss certain matters relevant to the Fidelity funds.
At its July 2014 meeting, the Board, including the Independent Trustees, unanimously determined to renew the fund's Advisory Contracts. In reaching its determination, the Board considered all factors it believed relevant, including (i) the nature, extent, and quality of the services to be provided to the fund and its shareholders (including the investment performance of the fund); (ii) the competitiveness of the fund's management fee and total expense ratio relative to peer funds; (iii) the total costs of the services to be provided by and the profits to be realized by Fidelity from its relationship with the fund; (iv) the extent to which economies of scale exist and would be realized as the fund grows; and (v) whether fee levels reflect these economies of scale, if any, for the benefit of fund shareholders. In connection with separate internal corporate reorganizations involving Fidelity Management & Research (U.K.) Inc. (FMR U.K.) and Fidelity Management & Research (Japan) Inc. (FMR Japan), the Board approved certain non-material amendments to the fund's sub-advisory agreements with FMR U.K. and FMR Japan to reflect that, after these reorganizations, FMR Investment Management (UK) Limited and Fidelity Management & Research (Japan) Limited will carry on the business of FMR U.K. and FMR Japan, respectively. The Board noted that no changes to the portfolio managers or to the foreign research or investment advisory services provided to the fund were expected in connection with either reorganization and that the same personnel and resources would continue to be available to the fund at the new entities.
Annual Report
Board Approval of Investment Advisory Contracts and
Management Fees - continued
In considering whether to renew the Advisory Contracts for the fund, the Board reached a determination, with the assistance of fund counsel and Independent Trustees' counsel and through the exercise of its business judgment, that the renewal of the Advisory Contracts was in the best interests of the fund and its shareholders and that the compensation payable under the Advisory Contracts was fair and reasonable. The Board's decision to renew the Advisory Contracts was not based on any single factor, but rather was based on a comprehensive consideration of all the information provided to the Board at its meetings throughout the year. The Board, in reaching its determination to renew the Advisory Contracts, was aware that shareholders of the fund have a broad range of investment choices available to them, including a wide choice among funds offered by Fidelity's competitors, and that the fund's shareholders, who have the opportunity to review and weigh the disclosure provided by the fund in its prospectus and other public disclosures, have chosen to invest in this fund, which is part of the Fidelity family of funds.
Nature, Extent, and Quality of Services Provided. The Board considered Fidelity's staffing as it relates to the fund, including the backgrounds of investment personnel of FMR and the sub-advisers (together, the Investment Advisers), and also considered the fund's investment objective, strategies, and related investment philosophy. The Independent Trustees also had discussions with senior management of Fidelity's investment operations and investment groups. The Board considered the structure of the portfolio manager compensation program and whether this structure provides appropriate incentives to act in the best interests of the fund. Additionally, the Board considered the portfolio managers' investments, if any, in the funds that they manage.
Resources Dedicated to Investment Management and Support Services. The Board and the Fund Oversight and Research Committees reviewed the general qualifications and capabilities of Fidelity's investment staff, including its size, education, experience, and resources, as well as Fidelity's approach to recruiting, training, managing, and compensating investment personnel. The Board noted that Fidelity has continued to increase the resources devoted to non-U.S. offices, including expansion of Fidelity's global investment organization. The Board also noted that Fidelity's analysts have extensive resources, tools and capabilities that allow them to conduct sophisticated quantitative and fundamental analysis, as well as credit analysis of issuers, counterparties and guarantors. Further, the Board believes that Fidelity's investment professionals have sufficient access to global information and data so as to provide competitive investment results over time, and that those professionals also have access to sophisticated tools that permit them to assess portfolio construction and risk and performance attribution characteristics continuously, as well as to transmit new information and research conclusions rapidly around the world. Additionally, in its deliberations, the Board considered Fidelity's trading and risk management capabilities and resources and global compliance infrastructure, which are an integral part of the investment management process.
Annual Report
Shareholder and Administrative Services. The Board considered (i) the nature, extent, quality, and cost of advisory, administrative, and shareholder services performed by the Investment Advisers and their affiliates under the Advisory Contracts and under separate agreements covering transfer agency, pricing and bookkeeping, and securities lending services for the fund; (ii) the nature and extent of the supervision of third party service providers, principally custodians and subcustodians; and (iii) the resources devoted to, and the record of compliance with, the fund's compliance policies and procedures. The Board also reviewed the allocation of fund brokerage, including allocations to brokers affiliated with the Investment Advisers, the use of brokerage commissions to pay fund expenses, and the use of "soft" commission dollars to pay for research services.
The Board noted that the growth of fund assets over time across the complex allows Fidelity to reinvest in the development of services designed to enhance the value or convenience of the Fidelity funds as investment vehicles. These services include 24-hour access to account information and market information through telephone representatives and over the Internet, investor education materials and asset allocation tools, and the expanded availability of Fidelity Investor Centers.
In 2014, the Board formed an ad hoc Committee on Transfer Agency Fees to review the variety of transfer agency fee structures throughout the industry and Fidelity's competitive positioning with respect to industry participants.
Investment in a Large Fund Family. The Board considered the benefits to shareholders of investing in a Fidelity fund, including the benefits of investing in a fund that is part of a large family of funds offering a variety of investment disciplines and providing a large variety of mutual fund investor services. The Board noted that Fidelity had taken, or had made recommendations that resulted in the Fidelity funds taking, a number of actions over the previous year that benefited particular funds, including (i) continuing to dedicate additional resources to investment research and to the support of the senior management team that oversees asset management; (ii) persisting in efforts to enhance Fidelity's global research capabilities; (iii) launching new funds and making other enhancements to meet client needs for income-oriented solutions; (iv) reducing fund expenses for certain index funds; (v) continuing to launch dedicated lower cost underlying funds to meet portfolio construction needs related to expanding underlying fund options for Fidelity funds of funds, specifically for the Freedom Fund product lines; (vi) rationalizing product lines and gaining increased efficiencies through fund mergers; (vii) launching sector-based exchange-traded funds and establishing a new Fidelity adviser to manage sector-based funds and products; (viii) continuing to develop and implement technology to improve security and increase efficiency; (ix) modifying the eligibility criteria for certain share classes to increase their marketability to a portion of the defined contribution plan market; (x) waiving redemption fees for certain qualified fund-of-fund and wrap programs and certain retirement plan transactions; and (xi) launching new Institutional Class shares of certain money market funds to attract and retain assets and to fill a gap in the money market fund lineup.
Annual Report
Board Approval of Investment Advisory Contracts and
Management Fees - continued
Investment Performance. The Board considered whether the fund has operated in accordance with its investment objective, as well as its record of compliance with its investment restrictions and its performance history. The Board noted that there was a portfolio management change for the fund in January 2013 and for a sleeve of the fund in August 2013.
The Board took into account discussions with the Investment Advisers about fund investment performance that occur at Board meetings throughout the year. In this regard the Board noted that as part of regularly scheduled fund reviews and other reports to the Board on fund performance, the Board periodically considers annualized return information for the fund, for different time periods, measured against a securities market index ("benchmark index") and a peer group of funds with similar objectives ("peer group"). In its evaluation of fund investment performance, the Board gave particular attention to information indicating changes in performance of certain Fidelity funds for specific time periods and the Investment Advisers' explanations for any overperformance or underperformance.
In addition to reviewing absolute and relative fund performance, the Independent Trustees periodically consider the appropriateness of fund performance metrics in evaluating the results achieved. In general, the Independent Trustees believe that fund performance should be evaluated based on net performance (after fees and expenses) of both the highest performing and lowest performing classes, where applicable, compared to appropriate benchmark indices, over appropriate time periods which may include full market cycles, and compared to peer groups, as applicable, over the same periods, taking into account relevant factors including the following: general market conditions; issuer-specific information; tactical opportunities for investment; and fund cash flows and other factors.
The Independent Trustees recognize that shareholders evaluate performance on a net basis over their own holding periods, for which one-, three-, and five-year periods are often used as a proxy. For this reason, the performance information reviewed by the Board also included net cumulative calendar year total return information for the fund and an appropriate benchmark index and peer group for the most recent one-, three-, and five-year periods, as shown below. Returns are shown compared to the 25th percentile (top of box, 75% beaten) and 75th percentile (bottom of box, 25% beaten) of the peer universe.
Annual Report
Fidelity Small Cap Value Fund

The Board also considered that the fund's management fee is subject to upward or downward adjustment depending upon whether, and to what extent, the fund's investment performance for the performance period exceeds, or is exceeded by, a securities index, thus leading to a performance adjustment for the same period. The Board noted that the performance adjustment provides FMR with a strong economic incentive to seek to achieve superior performance for the fund's shareholders and helps to more closely align the interests of FMR and the fund's shareholders.
Based on its review, the Board concluded that the nature, extent, and quality of services provided to the fund under the Advisory Contracts should benefit the fund's shareholders.
Competitiveness of Management Fee and Total Expense Ratio. The Board considered the fund's management fee and total expense ratio compared to "mapped groups" of competitive funds and classes. Fidelity creates "mapped groups" by combining similar Lipper investment objective categories that have comparable investment mandates. Combining Lipper investment objective categories aids the Board's management fee and total expense ratio comparisons by broadening the competitive group used for comparison and by reducing the number of universes to which various Fidelity funds are compared.
Management Fee. The Board considered two proprietary management fee comparisons for the 12-month periods shown in the chart below. The group of Lipper funds used by the Board for management fee comparisons is referred to below as the "Total Mapped Group." The Total Mapped Group comparison focuses on a fund's standing in terms of gross management fees before expense reimbursements or caps, and without giving effect to the fund's performance adjustment, relative to the total universe of funds with comparable investment mandates, regardless of whether their management fee structures also are comparable. Funds with comparable investment mandates offer exposure to similar types of securities. Funds with comparable management fee structures have similar management fee contractual arrangements (e.g., flat rate charged for advisory services, all-inclusive fee rate, etc.). "TMG %" represents the percentage of funds in the Total Mapped Group that had management fees that were lower than the fund's. For example, a hypothetical TMG % of 20% would mean that 80% of the funds in the Total Mapped Group had higher, and 20% had lower, management fees than the fund. The fund's actual TMG %s are in the chart below. The "Asset-Size Peer Group" (ASPG) comparison focuses on a fund's standing relative to a subset of non-Fidelity funds within the Total Mapped Group that are similar in size and management fee structure. For example, if a fund is in the first quartile of the ASPG, the fund's management fee ranks in the least expensive or lowest 25% of funds in the ASPG. The ASPG represents at least 15% of the funds in the Total Mapped Group with comparable asset size and management fee structures, subject to a minimum of 50 funds (or all funds in the Total Mapped Group if fewer than 50). Additional information, such as the ASPG quartile in which the fund's management fee rate ranked and the impact of the fund's performance adjustment, is also included in the chart and considered by the Board.
Annual Report
Board Approval of Investment Advisory Contracts and
Management Fees - continued
Fidelity Small Cap Value Fund
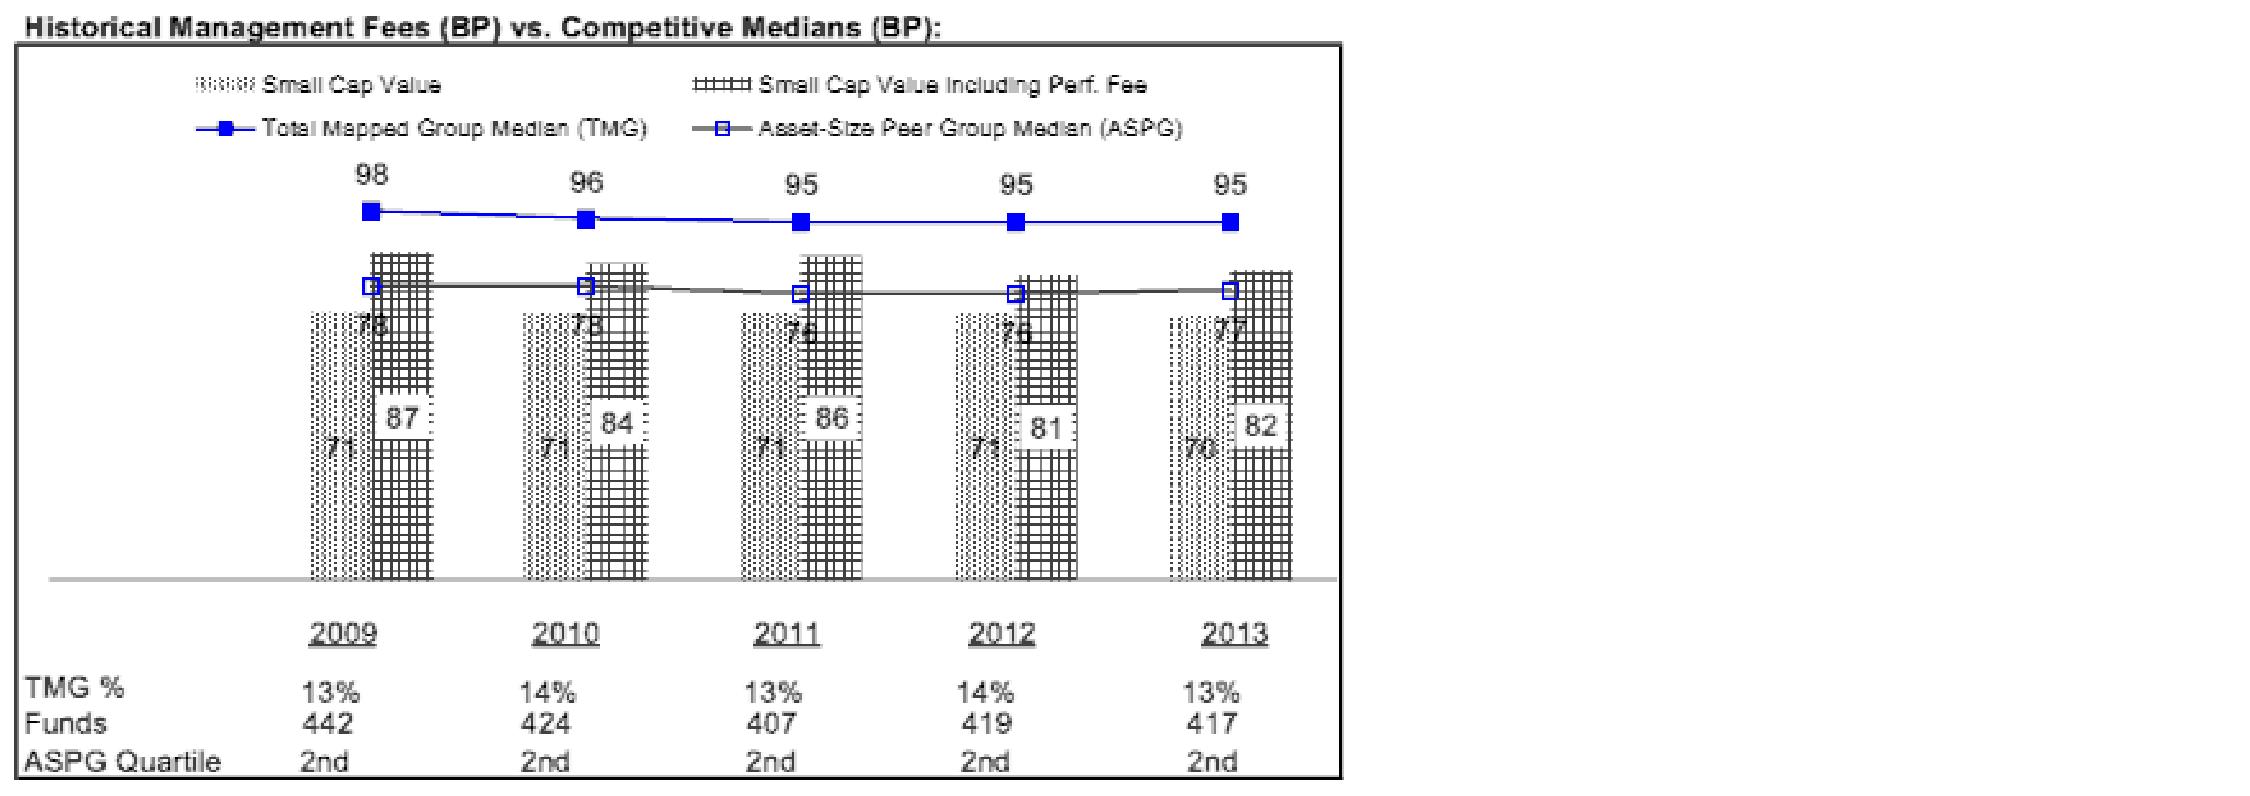
The Board noted that the fund's management fee rate ranked below the median of its Total Mapped Group and below the median of its ASPG for 2013. The Board also noted the effect of the fund's positive performance adjustment on the fund's management fee ranking.
Annual Report
The Board also noted that, in August 2013, the ad hoc Committee on Management Fees was formed to conduct an in-depth review of the management fee rates of Fidelity's active equity mutual funds. The Committee focused on the following areas: (i) standard fee structures; (ii) research consumption and trading evolution; (iii) management fee competitiveness/profitability by category; and (iv) factors that drive institutional pricing.
Based on its review, the Board concluded that the fund's management fee is fair and reasonable in light of the services that the fund receives and the other factors considered.
Total Expense Ratio. In its review of each class's total expense ratio, the Board considered the fund's management fee as well as other fund or class expenses, as applicable, such as transfer agent fees, pricing and bookkeeping fees, fund-paid 12b-1 fees, and custodial, legal, and audit fees. The Board also noted the effects of any waivers and reimbursements on fees and expenses, as well as the impact of the fund's performance adjustment. As part of its review, the Board also considered the current and historical total expense ratios of each class of the fund compared to competitive fund median expenses. Each class of the fund is compared to those funds and classes in the Total Mapped Group (used by the Board for management fee comparisons) that have a similar sales load structure.
The Board also considered that it had approved a transitional management fee adjustment for the fund that will decrease the fund's management fee paid each month through May 31, 2015.
The Board noted that the total expense ratio of each of Class A, Institutional Class, and the retail class ranked below its competitive median for 2013 and the total expense ratio of each of Class T, Class B, and Class C ranked above its competitive median for 2013. The Board considered that, in general, various factors can affect total expense ratios. The Board noted that the total expense ratio of Class T was above the competitive median primarily because of higher 12b-1 fees on Class T as compared to most competitor funds. Class T has a higher 12b-1 fee, but a lower front-end sales charge, than traditionally priced front-end sales charge classes. The Board considered that Class T is primarily sold load-waived in the retirement plan market where its 0.50% 12b-1 fee is comparable to competing no-load, higher 12b-1 fee classes designed specifically for retirement plans. The Board noted that the fund offers multiple classes, each of which has a different sales load and 12b-1 fee structure, and that the multiple structures are intended to offer a range of pricing options for the intermediary market. The Board also noted that the total expense ratios of the classes vary primarily by the level of their 12b-1 fees, although differences in transfer agent fees may also cause expenses to vary from class to class.
Annual Report
Board Approval of Investment Advisory Contracts and
Management Fees - continued
Fees Charged to Other Fidelity Clients. The Board also considered Fidelity fee structures and other information with respect to clients of Fidelity, such as other funds advised or subadvised by Fidelity, pension plan clients, and other institutional clients. The Board noted the findings of the 2013 ad hoc joint committee (created with the board of other Fidelity funds), which reviewed and compared Fidelity's institutional investment advisory business with its business of providing services to the Fidelity funds, including the differences in services provided, fees charged, and costs incurred, as well as competition in their respective marketplaces.
Based on its review of total expense ratios and fees charged to other Fidelity clients, the Board concluded that the total expense ratio of each class of the fund was reasonable, although in some cases above the median of the universe presented for comparison, in light of the services that the fund and its shareholders receive and the other factors considered.
Costs of the Services and Profitability. The Board considered the revenues earned and the expenses incurred by Fidelity in conducting the business of developing, marketing, distributing, managing, administering and servicing the fund and servicing the fund's shareholders. The Board also considered the level of Fidelity's profits in respect of all the Fidelity funds.
On an annual basis, Fidelity presents to the Board Fidelity's profitability for the fund. Fidelity calculates the profitability for each fund, as well as aggregate profitability for groups of Fidelity funds and all Fidelity funds, using a series of detailed revenue and cost allocation methodologies which originate with the books and records of Fidelity on which Fidelity's audited financial statements are based. The Audit Committee of the Board reviews any significant changes from the prior year's methodologies.
PricewaterhouseCoopers LLP (PwC), independent registered public accounting firm and auditor to Fidelity and certain Fidelity funds, has been engaged annually by the Board as part of the Board's assessment of Fidelity's profitability analysis. PwC's engagement includes the review and assessment of the methodologies used by Fidelity in determining the revenues and expenses attributable to Fidelity's mutual fund business, and completion of agreed-upon procedures in respect of the mathematical accuracy of fund profitability and its conformity to established allocation methodologies. After considering PwC's reports issued under the engagement and information provided by Fidelity, the Board concluded that while other allocation methods may also be reasonable, Fidelity's profitability methodologies are reasonable in all material respects.
The Board also reviewed Fidelity's non-fund businesses and fall-out benefits related to the mutual fund business as well as cases where Fidelity's affiliates may benefit from or be related to the fund's business.
Annual Report
The Board considered the costs of the services provided by and the profits realized by Fidelity in connection with the operation of the fund and was satisfied that the profitability was not excessive in the circumstances.
Economies of Scale. The Board considered whether there have been economies of scale in respect of the management of the Fidelity funds, whether the Fidelity funds (including the fund) have appropriately benefited from any such economies of scale, and whether there is potential for realization of any further economies of scale. The Board considered the extent to which the fund will benefit from economies of scale through increased services to the fund, through waivers or reimbursements, or through fee or expense ratio reductions. The Board also noted that in 2013, it and the boards of other Fidelity funds created an ad hoc committee (the Economies of Scale Committee) to analyze whether Fidelity attains economies of scale in respect of the management and servicing of the Fidelity funds, whether the Fidelity funds have appropriately benefited from such economies of scale, and whether there is potential for realization of any further economies of scale.
The Board recognized that the fund's management contract incorporates a "group fee" structure, which provides for lower group fee rates as total group assets increase, and for higher group fee rates as total group assets decrease (with "group assets" defined to include fund assets under FMR's management plus sector fund assets previously under FMR's management and currently managed by Fidelity SelectCo, LLC). FMR calculates the group fee rates based on a tiered asset "breakpoint" schedule that varies based on asset class. The Board considered that the group fee is designed to deliver the benefits of economies of scale to fund shareholders when total Fidelity fund assets increase, even if assets of any particular fund are unchanged or have declined, because some portion of Fidelity's costs are attributable to services provided to all Fidelity funds, and all funds benefit if those costs can be allocated among more assets. The Board considered that although the fund is partially closed to new investors, it continues to incur investment management expenses, and marketing and distribution expenses related to the retention of existing shareholders and assets. The Board concluded that, given the group fee structure, fund shareholders will benefit from lower management fees as group assets increase at the fund complex level, regardless of whether Fidelity achieves any such economies of scale.
The Board concluded, taking into account the analysis of the Economies of Scale Committee, that economies of scale, if any, are being appropriately shared between fund shareholders and Fidelity.
Additional Information Requested by the Board. In order to develop fully the factual basis for consideration of the Fidelity funds' Advisory Contracts, the Board requested and received additional information on certain topics, including: (i) fund performance trends and Fidelity's long-term strategies for certain funds; (ii) Fidelity's strategic marketing and product lineup goals; (iii) the methodology with respect to competitive fund data and peer group classifications; (iv) the arrangements with, and performance of, certain sub-advisers on behalf of the Fidelity funds, as well as certain proposed participating affiliate arrangements; (v) the realization of fall-out benefits in certain Fidelity business units; (vi) Fidelity's group fee structures, including the rationale for the individual fee rates of certain categories of funds and the definition of group assets; (vii) trends regarding industry use of performance fee structures and the performance adjustment methodologies applicable to the Fidelity funds; (viii) additional competitive analysis regarding the total expenses for certain classes; (ix) fund profitability methodology, including Fidelity's cost allocation methodology, and the impact of certain factors on fund profitability results; and (x) the process by which Fidelity determines sub-advisory fees for funds it advises.
Annual Report
Board Approval of Investment Advisory Contracts and
Management Fees - continued
Based on its evaluation of all of the conclusions noted above, and after considering all factors it believed relevant, the Board ultimately concluded that the advisory fee structures are fair and reasonable, and that the fund's Advisory Contracts should be renewed.
Annual Report
Investment Adviser
Fidelity Management & Research Company
Boston, MA
Investment Sub-Advisers
FMR Co., Inc.
Fidelity Management & Research
(U.K.) Inc.
Fidelity Management & Research
(Hong Kong) Limited
Fidelity Management & Research
(Japan) Inc.
General Distributor
Fidelity Distributors Corporation
Smithfield, RI
Transfer and Service Agents
Fidelity Investments Institutional
Operations Company, Inc.
Boston, MA
Fidelity Service Company, Inc.
Boston, MA
Custodian
Citibank, N.A.
New York, NY
(Fidelity Investment logo)(registered trademark)
ASCVI-UANN-0914
1.803743.109
Fidelity®
Small Cap Value
Fund
Annual Report
July 31, 2014
(Fidelity Cover Art)
Contents
Performance | (Click Here) | How the fund has done over time. |
Management's Discussion of Fund Performance | (Click Here) | The Portfolio Managers' review of fund performance and strategy. |
Shareholder Expense Example | (Click Here) | An example of shareholder expenses. |
Investment Changes | (Click Here) | A summary of major shifts in the fund's investments over the past six months. |
Investments | (Click Here) | A complete list of the fund's investments with their market values. |
Financial Statements | (Click Here) | Statements of assets and liabilities, operations, and changes in net assets, as well as financial highlights. |
Notes | (Click Here) | Notes to the financial statements. |
Report of Independent Registered Public Accounting Firm | (Click Here) | |
Trustees and Officers | (Click Here) | |
Distributions | (Click Here) | |
Board Approval of Investment Advisory Contracts and Management Fees | (Click Here) | |
To view a fund's proxy voting guidelines and proxy voting record for the 12-month period ended June 30, visit http://www.fidelity.com/proxyvotingresults or visit the Securities and Exchange Commission's (SEC) web site at http://www.sec.gov. You may also call 1-800-544-8544 to request a free copy of the proxy voting guidelines.
Standard & Poor's, S&P and S&P 500 are registered service marks of The McGraw-Hill Companies, Inc. and have been licensed for use by Fidelity Distributors Corporation.
Other third-party marks appearing herein are the property of their respective owners.
All other marks appearing herein are registered or unregistered trademarks or service marks of FMR LLC or an affiliated company. © 2014 FMR LLC. All rights reserved.
Annual Report
This report and the financial statements contained herein are submitted for the general information of the shareholders of the fund. This report is not authorized for distribution to prospective investors in the fund unless preceded or accompanied by an effective prospectus.
A fund files its complete schedule of portfolio holdings with the SEC for the first and third quarters of each fiscal year on Form N-Q. Forms N-Q are available on the SEC's web site at http://www.sec.gov. A fund's Forms N-Q may be reviewed and copied at the SEC's Public Reference Room in Washington, DC. Information regarding the operation of the SEC's Public Reference Room may be obtained by calling 1-800-SEC-0330. For a complete list of a fund's portfolio holdings, view the most recent holdings listing, semiannual report, or annual report on Fidelity's web site at http://www.fidelity.com, http://www.advisor.fidelity.com, or http://www.401k.com, as applicable.
NOT FDIC INSURED • MAY LOSE VALUE • NO BANK GUARANTEE
Neither the fund nor Fidelity Distributors Corporation is a bank.
Annual Report
Average annual total return reflects the change in the value of an investment, assuming reinvestment of the class' distributions from dividend income and capital gains (the profits earned upon the sale of securities that have grown in value, if any) and assuming a constant rate of performance each year. The $10,000 table and the fund's returns do not reflect the deduction of taxes that a shareholder would pay on fund distributions or the redemption of fund shares. During periods of reimbursement by Fidelity, a fund's total return will be greater than it would be had the reimbursement not occurred. How a fund did yesterday is no guarantee of how it will do tomorrow.
Average Annual Total Returns
Periods ended July 31, 2014 | Past 1
year | Past 5
years | Life of
fundA |
Fidelity® Small Cap Value Fund | 7.12% | 17.07% | 11.28% |
A From November 3, 2004.
$10,000 Over Life of Fund
Let's say hypothetically that $10,000 was invested in Fidelity® Small Cap Value Fund, a class of the fund, on November 3, 2004, when the fund started. The chart shows how the value of your investment would have changed, and also shows how the Russell 2000® Value Index performed over the same period.
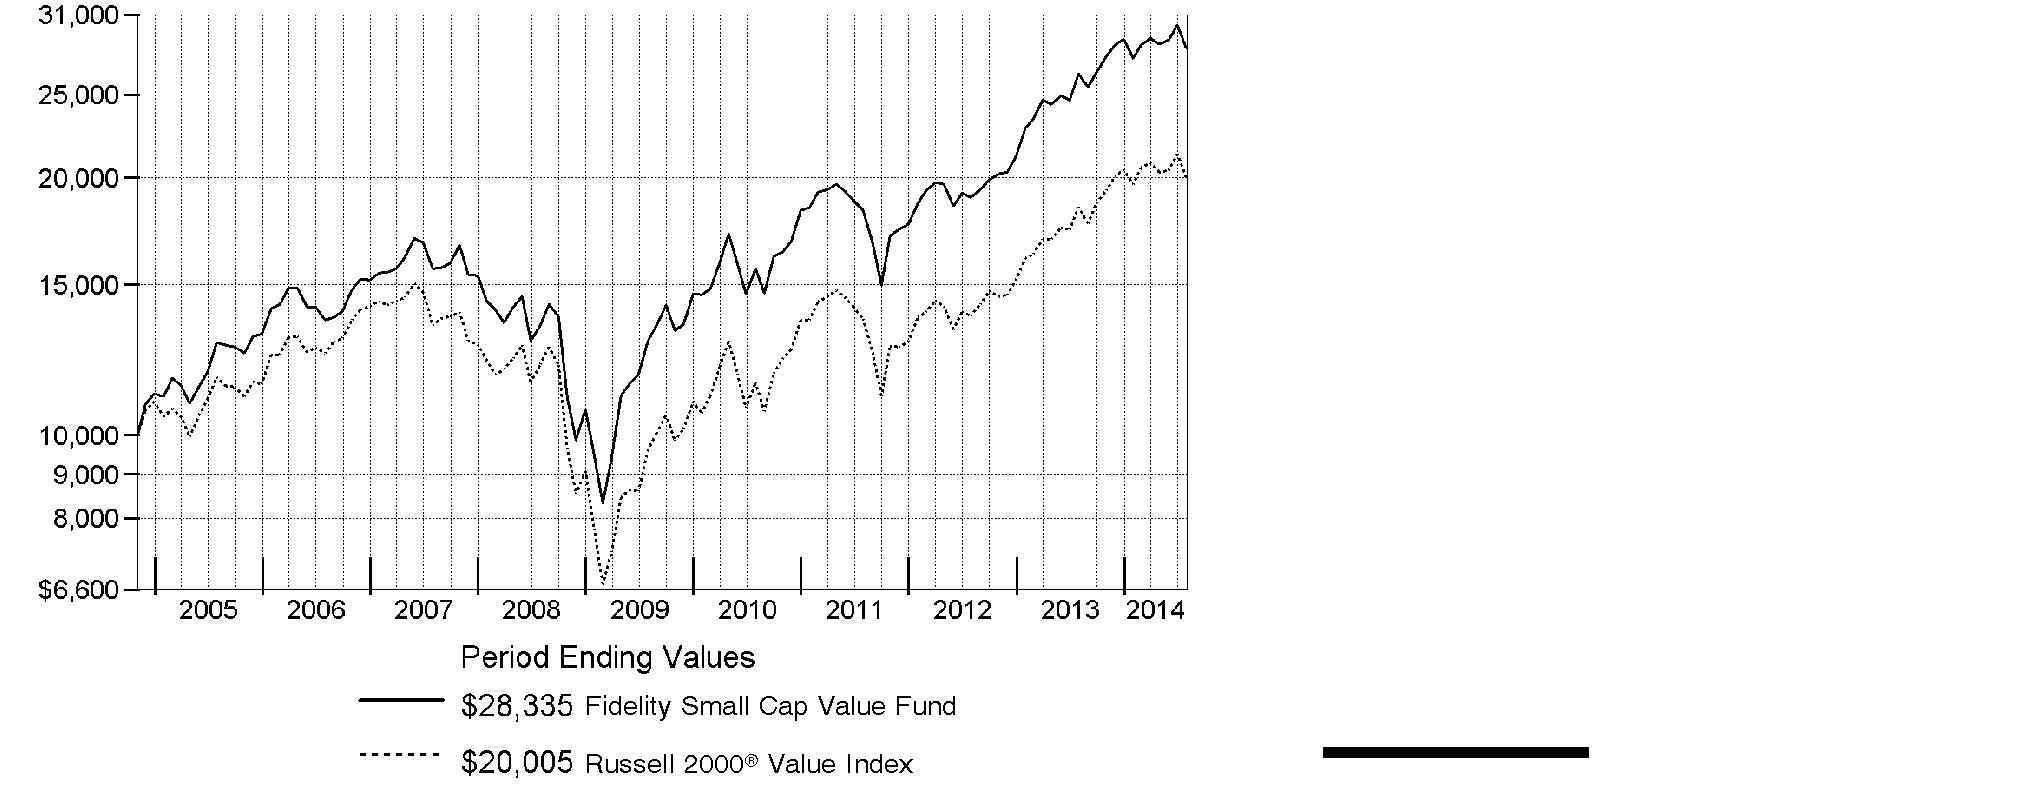
Annual Report
Market Recap: U.S. stocks overcame a slowing economy early in 2014 to post a strong gain for the 12-month period ending July 31, 2014, supported by corporate profits and continued low interest rates. The S&P 500® Index rose 16.94%, reaching an all-time high near period end. The technology-heavy Nasdaq Composite Index® gained 22.00%. The Russell 2000® Index returned 8.56%, reflecting the relatively lackluster performance of small-cap stocks. Information technology (+28%) was the top-performing sector within the S&P 500®, driven by strong semiconductor and computer hardware sales. Materials (+23%) gained amid higher prices for many commodity products. Health care (+21%) rose, driven by gains in pharmaceuticals, biotechnology & life sciences companies. Energy stocks (+19%) advanced in the latter part of the period amid healthy U.S. output and the threat of supply disruptions in Iraq. Conversely, most defensive sectors, including consumer staples, utilities and telecommunication services, lagged the broader market. Volatility remained tame throughout most of the period, with markets supported by declining unemployment, near-record profit margins for companies, muted cost inflation and fairly low corporate debt levels. Geopolitical tension remained a concern at period end, with conflict in Ukraine and strained relations between Russia and the West posing a potential threat to global growth.
Comments from Charles Myers and Derek Janssen, Lead Portfolio Manager and Co-Portfolio Manager, respectively, of Fidelity® Small Cap Value Fund: For the year, the fund's Retail Class shares gained 7.12%, trailing the 8.18% gain of the benchmark Russell 2000® Value Index. The fund was hampered the most by subpar security selection in industrials. Conversely, the fund enjoyed very good results from our picks in information technology. The biggest detractor by far was furniture and appliance rent-to-own business Rent-A-Center, which faced several business challenges during the period. Another notable detractor was Quad/Graphics, a very inexpensively valued commercial printing company. After Quad/Graphics issued a disappointing financial report in November, we reassessed our position in the stock and began to reduce the fund's stake. In contrast, the fund benefited from an out-of-benchmark position in Chemed, which runs two very different businesses - the Roto-Rooter® plumbing service and a network of professionals offering end-of-life hospice care. Chemed's shares rose about 44% during the period. Another boost came from owning energy companies LinnCo and Berry Petroleum, the latter of which was acquired by the former. Chemed and LinnCo were not in the index.
The views expressed above reflect those of the portfolio manager(s) only through the end of the period as stated on the cover of this report and do not necessarily represent the views of Fidelity or any other person in the Fidelity organization. Any such views are subject to change at any time based upon market or other conditions and Fidelity disclaims any responsibility to update such views. These views may not be relied on as investment advice and, because investment decisions for a Fidelity fund are based on numerous factors, may not be relied on as an indication of trading intent on behalf of any Fidelity fund.
Annual Report
Shareholder Expense Example
As a shareholder of the Fund, you incur two types of costs: (1) transaction costs, including sales charges (loads) on purchase payments or redemption proceeds, redemption fees and (2) ongoing costs, including management fees, distribution and/or service (12b-1) fees and other Fund expenses. This Example is intended to help you understand your ongoing costs (in dollars) of investing in the Fund and to compare these costs with the ongoing costs of investing in other mutual funds.
The Example is based on an investment of $1,000 invested at the beginning of the period and held for the entire period (February 1, 2014 to July 31, 2014).
Actual Expenses
The first line of the accompanying table for each class of the Fund provides information about actual account values and actual expenses. You may use the information in this line, together with the amount you invested, to estimate the expenses that you paid over the period. Simply divide your account value by $1,000.00 (for example, an $8,600 account value divided by $1,000.00 = 8.6), then multiply the result by the number in the first line for a class of the Fund under the heading entitled "Expenses Paid During Period" to estimate the expenses you paid on your account during this period. A small balance maintenance fee of $12.00 that is charged once a year may apply for certain accounts with a value of less than $2,000. This fee is not included in the table below. If it was, the estimate of expenses you paid during the period would be higher, and your ending account value lower, by this amount. In addition, the Fund, as a shareholder in the underlying Fidelity Central Funds, will indirectly bear its pro-rata share of the fees and expenses incurred by the underlying Fidelity Central Funds. These fees and expenses are not included in the Fund's annualized expense ratio used to calculate the expense estimate in the table below.
Hypothetical Example for Comparison Purposes
The second line of the accompanying table for each class of the Fund provides information about hypothetical account values and hypothetical expenses based on a Class' actual expense ratio and an assumed rate of return of 5% per year before expenses, which is not the Class' actual return. The hypothetical account values and expenses may not be used to estimate the actual ending account balance or expenses you paid for the period. You may use this information to compare the ongoing costs of investing in the Fund and other funds. To do so, compare this 5% hypothetical example with the 5% hypothetical examples that appear in the shareholder reports of the other funds. A small balance maintenance fee of $12.00 that is charged once a year may apply for certain accounts with a value of less than $2,000. This fee is not included in the table below. If it was, the estimate of expenses you paid during the period would be higher, and your ending account value lower, by this amount. In addition, the Fund, as a shareholder in the underlying Fidelity Central Funds, will indirectly bear its pro-rata share of the fees and expenses incurred by the underlying Fidelity Central Funds. These fees and expenses are not included in the Fund's annualized expense ratio used to calculate the expense estimate in the table below.
Please note that the expenses shown in the table are meant to highlight your ongoing costs only and do not reflect any transaction costs. Therefore, the second line of the table is useful in comparing ongoing costs only, and will not help you determine the relative total costs of owning different funds. In addition, if these transactional costs were included, your costs would have been higher.
Annual Report
Shareholder Expense Example - continued
| Annualized
Expense RatioB | Beginning
Account Value
February 1, 2014 | Ending
Account Value
July 31, 2014 | Expenses Paid
During Period*
February 1, 2014
to July 31, 2014 |
Class A | 1.38% | | | |
Actual | | $ 1,000.00 | $ 1,027.20 | $ 6.94 |
HypotheticalA | | $ 1,000.00 | $ 1,017.95 | $ 6.90 |
Class T | 1.62% | | | |
Actual | | $ 1,000.00 | $ 1,025.90 | $ 8.14 |
HypotheticalA | | $ 1,000.00 | $ 1,016.76 | $ 8.10 |
Class B | 2.21% | | | |
Actual | | $ 1,000.00 | $ 1,023.10 | $ 11.09 |
HypotheticalA | | $ 1,000.00 | $ 1,013.84 | $ 11.04 |
Class C | 2.14% | | | |
Actual | | $ 1,000.00 | $ 1,023.10 | $ 10.73 |
HypotheticalA | | $ 1,000.00 | $ 1,014.18 | $ 10.69 |
Small Cap Value | 1.10% | | | |
Actual | | $ 1,000.00 | $ 1,028.40 | $ 5.53 |
HypotheticalA | | $ 1,000.00 | $ 1,019.34 | $ 5.51 |
Institutional Class | 1.11% | | | |
Actual | | $ 1,000.00 | $ 1,028.40 | $ 5.58 |
HypotheticalA | | $ 1,000.00 | $ 1,019.29 | $ 5.56 |
A 5% return per year before expenses
B Annualized expense ratio reflects expenses net of applicable fee waivers.
* Expenses are equal to each Class' annualized expense ratio, multiplied by the average account value over the period, multiplied by 181/365 (to reflect the one-half year period).
Annual Report
Investment Changes (Unaudited)
Top Ten Stocks as of July 31, 2014 |
| % of fund's
net assets | % of fund's net assets
6 months ago |
Tech Data Corp. | 2.9 | 2.6 |
PacWest Bancorp | 2.9 | 1.8 |
Federated Investors, Inc. Class B (non-vtg.) | 2.9 | 2.9 |
TCF Financial Corp. | 2.8 | 2.8 |
World Fuel Services Corp. | 2.8 | 3.0 |
Endurance Specialty Holdings Ltd. | 2.5 | 2.7 |
First Citizen Bancshares, Inc. | 2.3 | 1.9 |
Ingram Micro, Inc. Class A | 2.3 | 1.9 |
DCT Industrial Trust, Inc. | 2.3 | 2.0 |
Aspen Insurance Holdings Ltd. | 2.3 | 2.1 |
| 26.0 | |
Top Five Market Sectors as of July 31, 2014 |
| % of fund's
net assets | % of fund's net assets
6 months ago |
Financials | 40.8 | 38.9 |
Industrials | 14.3 | 14.8 |
Information Technology | 13.1 | 13.5 |
Consumer Discretionary | 10.4 | 11.9 |
Health Care | 6.6 | 5.5 |
Asset Allocation (% of fund's net assets) |
As of July 31, 2014* | As of January 31, 2014** |
| Stocks 99.5% | | | Stocks 100.0% | |
| Short-Term
Investments and
Net Other Assets (Liabilities) 0.5% | | | Short-Term
Investments and
Net Other Assets (Liabilities) 0.0% | |
* Foreign investments | 8.9% | | ** Foreign investments | 7.5% | |

Annual Report
Investments July 31, 2014
Showing Percentage of Net Assets
Common Stocks - 99.5% |
| Shares | | Value |
CONSUMER DISCRETIONARY - 10.4% |
Auto Components - 0.2% |
Standard Motor Products, Inc. | 143,301 | | $ 5,166,001 |
Diversified Consumer Services - 0.7% |
Regis Corp. | 1,515,900 | | 21,116,487 |
Multiline Retail - 1.9% |
Big Lots, Inc. | 1,212,700 | | 53,055,625 |
Specialty Retail - 7.5% |
Aarons, Inc. Class A | 2,295,100 | | 60,544,738 |
Genesco, Inc. (a) | 617,728 | | 47,114,115 |
Murphy U.S.A., Inc. (a) | 1,060,715 | | 52,420,535 |
Rent-A-Center, Inc. | 1,646,367 | | 39,414,026 |
Tsutsumi Jewelry Co. Ltd. | 520,900 | | 13,304,726 |
| | 212,798,140 |
Textiles, Apparel & Luxury Goods - 0.1% |
Vera Bradley, Inc. (a) | 231,000 | | 4,580,730 |
TOTAL CONSUMER DISCRETIONARY | | 296,716,983 |
CONSUMER STAPLES - 2.7% |
Food Products - 1.5% |
Post Holdings, Inc. (a) | 931,300 | | 41,833,996 |
Tobacco - 1.2% |
Universal Corp. (d) | 660,000 | | 34,273,800 |
TOTAL CONSUMER STAPLES | | 76,107,796 |
ENERGY - 4.8% |
Energy Equipment & Services - 0.4% |
ShawCor Ltd. Class A | 246,000 | | 12,451,727 |
Oil, Gas & Consumable Fuels - 4.4% |
LinnCo LLC (d) | 507,788 | | 14,771,553 |
Northern Oil & Gas, Inc. (a)(d) | 1,958,249 | | 31,508,226 |
World Fuel Services Corp. | 1,823,800 | | 78,332,210 |
| | 124,611,989 |
TOTAL ENERGY | | 137,063,716 |
FINANCIALS - 40.8% |
Banks - 14.4% |
Associated Banc-Corp. | 2,945,300 | | 52,779,776 |
City National Corp. | 840,300 | | 63,232,575 |
Common Stocks - continued |
| Shares | | Value |
FINANCIALS - continued |
Banks - continued |
CVB Financial Corp. | 2,361,688 | | $ 36,110,210 |
First Citizen Bancshares, Inc. | 296,324 | | 65,887,642 |
National Penn Bancshares, Inc. | 2,759,400 | | 28,421,820 |
PacWest Bancorp | 2,004,105 | | 83,511,055 |
TCF Financial Corp. | 5,039,800 | | 79,679,238 |
| | 409,622,316 |
Capital Markets - 3.6% |
Federated Investors, Inc. Class B (non-vtg.) (d) | 2,949,963 | | 83,247,956 |
Waddell & Reed Financial, Inc. Class A | 339,100 | | 17,901,089 |
| | 101,149,045 |
Consumer Finance - 1.9% |
Cash America International, Inc. | 559,700 | | 24,845,083 |
EZCORP, Inc. (non-vtg.) Class A (a) | 1,412,488 | | 13,828,258 |
World Acceptance Corp. (a)(d) | 181,500 | | 14,716,020 |
| | 53,389,361 |
Insurance - 9.4% |
Aspen Insurance Holdings Ltd. | 1,599,400 | | 63,991,994 |
Endurance Specialty Holdings Ltd. | 1,352,400 | | 71,528,436 |
Platinum Underwriters Holdings Ltd. | 1,001,999 | | 58,717,141 |
ProAssurance Corp. | 793,200 | | 34,607,316 |
StanCorp Financial Group, Inc. | 631,300 | | 38,092,642 |
| | 266,937,529 |
Real Estate Investment Trusts - 7.0% |
DCT Industrial Trust, Inc. | 8,229,086 | | 64,433,743 |
Franklin Street Properties Corp. | 3,480,800 | | 42,256,912 |
National Retail Properties, Inc. (d) | 883,400 | | 31,422,538 |
Rouse Properties, Inc. (d)(e) | 3,600,000 | | 61,020,000 |
| | 199,133,193 |
Real Estate Management & Development - 1.1% |
Kennedy Wilson Europe Real Estate PLC | 1,684,900 | | 30,209,829 |
Thrifts & Mortgage Finance - 3.4% |
Astoria Financial Corp. | 3,403,499 | | 43,837,067 |
Washington Federal, Inc. | 2,492,000 | | 52,232,320 |
| | 96,069,387 |
TOTAL FINANCIALS | | 1,156,510,660 |
Common Stocks - continued |
| Shares | | Value |
HEALTH CARE - 6.6% |
Health Care Equipment & Supplies - 2.4% |
Hill-Rom Holdings, Inc. | 773,200 | | $ 30,464,080 |
Integra LifeSciences Holdings Corp. (a) | 809,200 | | 38,372,264 |
| | 68,836,344 |
Health Care Providers & Services - 3.0% |
AmSurg Corp. (a) | 893,800 | | 42,687,888 |
Chemed Corp. (d) | 423,700 | | 43,153,845 |
| | 85,841,733 |
Pharmaceuticals - 1.2% |
Theravance, Inc. (a)(d) | 1,507,033 | | 32,702,616 |
TOTAL HEALTH CARE | | 187,380,693 |
INDUSTRIALS - 14.3% |
Air Freight & Logistics - 0.9% |
Atlas Air Worldwide Holdings, Inc. (a) | 780,133 | | 26,696,151 |
Commercial Services & Supplies - 5.2% |
ACCO Brands Corp. (a)(e) | 7,611,200 | | 50,386,144 |
Knoll, Inc. | 1,269,800 | | 21,345,338 |
Quad/Graphics, Inc. | 1,250,849 | | 26,417,931 |
United Stationers, Inc. | 1,301,398 | | 50,207,935 |
| | 148,357,348 |
Electrical Equipment - 4.4% |
AZZ, Inc. | 770,000 | | 33,602,800 |
EnerSys | 743,700 | | 47,172,891 |
GrafTech International Ltd. (a)(d) | 5,212,200 | | 43,782,480 |
| | 124,558,171 |
Machinery - 1.6% |
Blount International, Inc. (a) | 1,850,200 | | 24,163,612 |
Columbus McKinnon Corp. (NY Shares) | 776,000 | | 18,042,000 |
Mueller Industries, Inc. | 80,000 | | 2,226,400 |
| | 44,432,012 |
Trading Companies & Distributors - 2.2% |
WESCO International, Inc. (a)(d) | 777,933 | | 61,059,961 |
TOTAL INDUSTRIALS | | 405,103,643 |
INFORMATION TECHNOLOGY - 13.1% |
Communications Equipment - 1.5% |
Polycom, Inc. (a) | 3,242,475 | | 41,568,530 |
Common Stocks - continued |
| Shares | | Value |
INFORMATION TECHNOLOGY - continued |
Electronic Equipment & Components - 6.4% |
Ingram Micro, Inc. Class A (a) | 2,248,300 | | $ 64,526,210 |
SYNNEX Corp. (a) | 527,200 | | 34,004,400 |
Tech Data Corp. (a) | 1,336,373 | | 83,910,860 |
| | 182,441,470 |
Internet Software & Services - 1.0% |
j2 Global, Inc. | 574,300 | | 28,094,756 |
IT Services - 2.0% |
CACI International, Inc. Class A (a) | 828,334 | | 57,146,763 |
Software - 2.2% |
SS&C Technologies Holdings, Inc. (a) | 1,418,900 | | 61,452,559 |
TOTAL INFORMATION TECHNOLOGY | | 370,704,078 |
MATERIALS - 3.0% |
Containers & Packaging - 1.3% |
Silgan Holdings, Inc. | 750,000 | | 36,915,000 |
Metals & Mining - 1.7% |
Haynes International, Inc. | 376,903 | | 18,769,769 |
RTI International Metals, Inc. (a) | 1,230,500 | | 30,590,230 |
| | 49,359,999 |
TOTAL MATERIALS | | 86,274,999 |
UTILITIES - 3.8% |
Electric Utilities - 2.8% |
El Paso Electric Co. | 974,121 | | 35,896,359 |
IDACORP, Inc. | 822,000 | | 44,018,100 |
| | 79,914,459 |
Gas Utilities - 1.0% |
Southwest Gas Corp. | 547,656 | | 27,125,402 |
TOTAL UTILITIES | | 107,039,861 |
TOTAL COMMON STOCKS (Cost $2,315,504,569) |
2,822,902,429
|
Money Market Funds - 5.5% |
| Shares | | Value |
Fidelity Cash Central Fund, 0.11% (b) | 10,267,832 | | $ 10,267,832 |
Fidelity Securities Lending Cash Central Fund, 0.11% (b)(c) | 145,531,995 | | 145,531,995 |
TOTAL MONEY MARKET FUNDS (Cost $155,799,827) |
155,799,827
|
TOTAL INVESTMENT PORTFOLIO - 105.0% (Cost $2,471,304,396) | | 2,978,702,256 |
NET OTHER ASSETS (LIABILITIES) - (5.0)% | | (141,148,058) |
NET ASSETS - 100% | $ 2,837,554,198 |
Legend |
(a) Non-income producing |
(b) Affiliated fund that is generally available only to investment companies and other accounts managed by Fidelity Investments. The rate quoted is the annualized seven-day yield of the fund at period end. A complete unaudited listing of the fund's holdings as of its most recent quarter end is available upon request. In addition, each Fidelity Central Fund's financial statements, which are not covered by the Fund's Report of Independent Registered Public Accounting Firm, are available on the SEC's website or upon request. |
(c) Investment made with cash collateral received from securities on loan. |
(d) Security or a portion of the security is on loan at period end. |
(e) Affiliated company |
Affiliated Central Funds |
Information regarding fiscal year to date income earned by the Fund from investments in Fidelity Central Funds is as follows: |
Fund | Income earned |
Fidelity Cash Central Fund | $ 18,564 |
Fidelity Securities Lending Cash Central Fund | 874,417 |
Total | $ 892,981 |
Other Affiliated Issuers |
An affiliated company is a company in which the Fund has ownership of at least 5% of the voting securities. Fiscal year to date transactions with companies which are or were affiliates are as follows: |
Affiliate | Value,
beginning of
period | Purchases | Sales
Proceeds* | Dividend
Income | Value,
end of
period |
ACCO Brands Corp. | $ 70,270,150 | $ 3,955,917 | $ 21,579,480 | $ - | $ 50,386,144 |
Astoria Financial Corp. | 63,439,988 | - | 24,073,100 | 616,420 | - |
Blount International, Inc. | 39,210,500 | - | 14,064,571 | - | - |
CACI International, Inc. Class A | 84,031,458 | - | 31,369,100 | - | - |
Columbus McKinnon Corp. (NY Shares) | 23,226,000 | - | 7,378,820 | 31,040 | - |
Franklin Street Properties Corp. | 63,888,000 | 6,710,106 | 24,031,632 | 2,914,733 | - |
GrafTech International Ltd. | 57,971,680 | - | 28,363,648 | - | - |
HNI Corp. | 97,287,208 | - | 94,962,777 | 1,325,907 | - |
Monotype Imaging Holdings, Inc. | 61,318,401 | - | 69,874,384 | 297,102 | - |
Platinum Underwriters Holdings Ltd. | 85,165,691 | - | 29,187,426 | 360,872 | - |
Quad/Graphics, Inc. | 75,007,000 | - | 34,701,403 | 2,238,965 | - |
Regis Corp. | 57,598,920 | - | 27,623,343 | 337,920 | - |
Rouse Properties, Inc. | - | 62,526,334 | - | 612,000 | 61,020,000 |
RTI International Metals, Inc. | 57,622,000 | - | 22,511,670 | - | - |
Tech Data Corp. | 98,763,117 | 6,654,871 | 38,603,914 | - | - |
Valassis Comm-unications, Inc. | 60,210,064 | 211,335 | 68,200,733 | 1,121,822 | - |
Total | $ 995,010,177 | $ 80,058,563 | $ 536,526,001 | $ 9,856,781 | $ 111,406,144 |
* Includes the value of securities delivered through in-kind transactions. |
Other Information |
The following is a summary of the inputs used, as of July 31, 2014, involving the Fund's assets and liabilities carried at fair value. The inputs or methodology used for valuing securities may not be an indication of the risk associated with investing in those securities. For more information on valuation inputs, and their aggregation into the levels used in the table below, please refer to the Investment Valuation section in the accompanying Notes to Financial Statements. |
Valuation Inputs at Reporting Date: |
Description | Total | Level 1 | Level 2 | Level 3 |
Investments in Securities: | | | | |
Equities: | | | | |
Consumer Discretionary | $ 296,716,983 | $ 283,412,257 | $ 13,304,726 | $ - |
Consumer Staples | 76,107,796 | 76,107,796 | - | - |
Energy | 137,063,716 | 137,063,716 | - | - |
Financials | 1,156,510,660 | 1,156,510,660 | - | - |
Health Care | 187,380,693 | 187,380,693 | - | - |
Industrials | 405,103,643 | 405,103,643 | - | - |
Information Technology | 370,704,078 | 370,704,078 | - | - |
Materials | 86,274,999 | 86,274,999 | - | - |
Utilities | 107,039,861 | 107,039,861 | - | - |
Money Market Funds | 155,799,827 | 155,799,827 | - | - |
Total Investments in Securities: | $ 2,978,702,256 | $ 2,965,397,530 | $ 13,304,726 | $ - |
See accompanying notes which are an integral part of the financial statements.
Annual Report
Statement of Assets and Liabilities
| July 31, 2014 |
| | |
Assets | | |
Investment in securities, at value (including securities loaned of $139,656,509) - See accompanying schedule: Unaffiliated issuers (cost $2,195,838,822) | $ 2,711,496,285 | |
Fidelity Central Funds (cost $155,799,827) | 155,799,827 | |
Other affiliated issuers (cost $119,665,747) | 111,406,144 | |
Total Investments (cost $2,471,304,396) | | $ 2,978,702,256 |
Cash | | 237,291 |
Receivable for investments sold | | 12,220,217 |
Receivable for fund shares sold | | 1,958,797 |
Dividends receivable | | 1,752,464 |
Distributions receivable from Fidelity Central Funds | | 436,344 |
Receivable from investment adviser for expense reductions | | 2,252 |
Other receivables | | 19,623 |
Total assets | | 2,995,329,244 |
| | |
Liabilities | | |
Payable for investments purchased | $ 3,264,421 | |
Payable for fund shares redeemed | 6,046,837 | |
Accrued management fee | 2,105,803 | |
Distribution and service plan fees payable | 166,855 | |
Other affiliated payables | 588,008 | |
Other payables and accrued expenses | 71,127 | |
Collateral on securities loaned, at value | 145,531,995 | |
Total liabilities | | 157,775,046 |
| | |
Net Assets | | $ 2,837,554,198 |
Net Assets consist of: | | |
Paid in capital | | $ 2,049,137,933 |
Undistributed net investment income | | 5,856,882 |
Accumulated undistributed net realized gain (loss) on investments and foreign currency transactions | | 275,161,523 |
Net unrealized appreciation (depreciation) on investments | | 507,397,860 |
Net Assets | | $ 2,837,554,198 |
See accompanying notes which are an integral part of the financial statements.
Annual Report
Statement of Assets and Liabilities - continued
| July 31, 2014 |
| | |
Calculation of Maximum Offering Price Class A:
Net Asset Value and redemption price per share ($258,183,354 ÷ 13,385,509 shares) | | $ 19.29 |
| | |
Maximum offering price per share (100/94.25 of $19.29) | | $ 20.47 |
Class T:
Net Asset Value and redemption price per share ($100,975,244 ÷ 5,321,352 shares) | | $ 18.98 |
| | |
Maximum offering price per share (100/96.50 of $18.98) | | $ 19.67 |
Class B:
Net Asset Value and offering price per share ($4,808,237 ÷ 264,509 shares)A | | $ 18.18 |
| | |
Class C:
Net Asset Value and offering price per share ($70,541,309 ÷ 3,877,443 shares)A | | $ 18.19 |
| | |
Small Cap Value:
Net Asset Value, offering price and redemption price per share ($2,060,546,290 ÷ 105,297,795 shares) | | $ 19.57 |
| | |
Institutional Class:
Net Asset Value, offering price and redemption price per share ($342,499,764 ÷ 17,499,817 shares) | | $ 19.57 |
A Redemption price per share is equal to net asset value less any applicable contingent deferred sales charge.
See accompanying notes which are an integral part of the financial statements.
Annual Report
Financial Statements - continued
Statement of Operations
| Year ended July 31, 2014 |
| | |
Investment Income | | |
Dividends (including $9,856,781 earned from other affiliated issuers) | | $ 48,393,147 |
Interest | | 45 |
Income from Fidelity Central Funds | | 892,981 |
Total income | | 49,286,173 |
| | |
Expenses | | |
Management fee
Basic fee | $ 23,398,200 | |
Performance adjustment | 4,827,948 | |
Transfer agent fees | 6,404,064 | |
Distribution and service plan fees | 2,067,458 | |
Accounting and security lending fees | 952,058 | |
Custodian fees and expenses | 56,759 | |
Independent trustees' compensation | 14,296 | |
Registration fees | 132,108 | |
Audit | 64,853 | |
Legal | 12,312 | |
Interest | 652 | |
Miscellaneous | 33,881 | |
Total expenses before reductions | 37,964,589 | |
Expense reductions | (631,182) | 37,333,407 |
Net investment income (loss) | | 11,952,766 |
Realized and Unrealized Gain (Loss) Net realized gain (loss) on: | | |
Investment securities: | | |
Unaffiliated issuers | 375,645,847 | |
Redemption in-kind with affiliated entities (including gain from Other affiliated issuers of $109,056,467) | 464,750,352 | |
Other affiliated issuers | 85,451,270 | |
Foreign currency transactions | (5,181) | |
Total net realized gain (loss) | | 925,842,288 |
Change in net unrealized appreciation (depreciation) on: Investment securities | (668,247,397) | |
Assets and liabilities in foreign currencies | (1,683) | |
Total change in net unrealized appreciation (depreciation) | | (668,249,080) |
Net gain (loss) | | 257,593,208 |
Net increase (decrease) in net assets resulting from operations | | $ 269,545,974 |
See accompanying notes which are an integral part of the financial statements.
Annual Report
Statement of Changes in Net Assets
| Year ended
July 31,
2014 | Year ended
July 31,
2013 |
Increase (Decrease) in Net Assets | | |
Operations | | |
Net investment income (loss) | $ 11,952,766 | $ 24,107,442 |
Net realized gain (loss) | 925,842,288 | 300,684,864 |
Change in net unrealized appreciation (depreciation) | (668,249,080) | 820,354,516 |
Net increase (decrease) in net assets resulting
from operations | 269,545,974 | 1,145,146,822 |
Distributions to shareholders from net investment income | (10,662,065) | (21,412,021) |
Distributions to shareholders from net realized gain | (362,625,477) | (85,195,362) |
Total distributions | (373,287,542) | (106,607,383) |
Share transactions - net increase (decrease) | (1,289,647,794) | 507,448,391 |
Redemption fees | 536,076 | 726,904 |
Total increase (decrease) in net assets | (1,392,853,286) | 1,546,714,734 |
| | |
Net Assets | | |
Beginning of period | 4,230,407,484 | 2,683,692,750 |
End of period (including undistributed net investment income of $5,856,882 and undistributed net investment income of $6,475,378, respectively) | $ 2,837,554,198 | $ 4,230,407,484 |
See accompanying notes which are an integral part of the financial statements.
Annual Report
Financial Highlights - Class A
Years ended July 31, | 2014 | 2013 | 2012 | 2011 | 2010 |
Selected Per-Share Data | | | | | |
Net asset value, beginning of period | $ 19.96 | $ 14.86 | $ 15.48 | $ 13.45 | $ 11.13 |
Income from Investment Operations | | | | | |
Net investment income (loss) C | .03 | .07 | .01 | .01F | .02G |
Net realized and unrealized gain (loss) | 1.24 | 5.57 | .30 | 2.22 | 2.33 |
Total from investment operations | 1.27 | 5.64 | .31 | 2.23 | 2.35 |
Distributions from net investment income | (.01) | (.07) | (.01) | (.08) | (.03) |
Distributions from net realized gain | (1.93) | (.47) | (.93) | (.12) | - |
Total distributions | (1.94) | (.54) | (.93) J | (.20) | (.03) |
Redemption fees added to paid in capitalC, I | - | - | - | - | - |
Net asset value, end of period | $ 19.29 | $ 19.96 | $ 14.86 | $ 15.48 | $ 13.45 |
Total ReturnA, B | 6.83% | 39.09% | 3.24% | 16.72% | 21.16% |
Ratios to Average Net Assets D, H | | | | | |
Expenses before reductions | 1.36% | 1.36% | 1.44% | 1.44% | 1.47% |
Expenses net of fee waivers, if any | 1.35% | 1.36% | 1.44% | 1.43% | 1.40% |
Expenses net of all reductions | 1.34% | 1.36% | 1.44% | 1.43% | 1.39% |
Net investment income (loss) | .13% | .41% | .09% | .06% F | .17% G |
Supplemental Data | | | | | |
Net assets, end of period (000 omitted) | $ 258,183 | $ 275,265 | $ 150,285 | $ 140,707 | $ 96,994 |
Portfolio turnover rateE | 26% K | 29% | 27% | 22% | 49% |
A Total returns would have been lower if certain expenses had not been reduced during the applicable periods shown.
B Total returns do not include the effect of the sales charges.
C Calculated based on average shares outstanding during the period.
D Fees and expenses of any underlying Fidelity Central Funds are not included in the Fund's expense ratio. The Fund indirectly bears its proportionate share of the expenses of any underlying Fidelity Central Funds.
E Amount does not include the portfolio activity of any underlying Fidelity Central Funds.
F Investment income per share reflects a large, non-recurring dividend which amounted to $.06 per share. Excluding this non-recurring dividend, the ratio of net investment income (loss) to average net assets would have been (.31)%.
G Investment income per share reflects a large, non-recurring dividend which amounted to $.03 per share. Excluding this non-recurring dividend, the ratio of net investment income (loss) to average net assets would have been (.10)%.
H Expense ratios reflect operating expenses of the class. Expenses before reductions do not reflect amounts reimbursed by the investment adviser or reductions from brokerage service arrangements or reductions from other expense offset arrangements and do not represent the amount paid by the class during periods when reimbursements or reductions occur. Expenses net of fee waivers reflect expenses after reimbursement by the investment adviser but prior to reductions from brokerage service arrangements or other expense offset arrangements. Expenses net of all reductions represent the net expenses paid by the class.
I Amount represents less than $.01 per share.
J Total distributions of $.93 per share is comprised of distributions from net investment income of $.006 and distributions from net realized gain of $.925 per share.
K Portfolio turnover rate excludes securities received or delivered in-kind.
See accompanying notes which are an integral part of the financial statements.
Annual Report
Financial Highlights - Class T
Years ended July 31, | 2014 | 2013 | 2012 | 2011 | 2010 |
Selected Per-Share Data | | | | | |
Net asset value, beginning of period | $ 19.70 | $ 14.70 | $ 15.34 | $ 13.34 | $ 11.05 |
Income from Investment Operations | | | | | |
Net investment income (loss) C | (.02) | .03 | (.02) | (.03) F | (.01) G |
Net realized and unrealized gain (loss) | 1.23 | 5.50 | .31 | 2.20 | 2.31 |
Total from investment operations | 1.21 | 5.53 | .29 | 2.17 | 2.30 |
Distributions from net investment income | - | (.06) | - | (.05) | (.01) |
Distributions from net realized gain | (1.93) | (.47) | (.93) | (.12) | - |
Total distributions | (1.93) | (.53) | (.93) | (.17) | (.01) |
Redemption fees added to paid in capitalC, I | - | - | - | - | - |
Net asset value, end of period | $ 18.98 | $ 19.70 | $ 14.70 | $ 15.34 | $ 13.34 |
Total ReturnA, B | 6.58% | 38.70% | 3.08% | 16.36% | 20.87% |
Ratios to Average Net Assets D, H | | | | | |
Expenses before reductions | 1.61% | 1.60% | 1.67% | 1.70% | 1.72% |
Expenses net of fee waivers, if any | 1.59% | 1.60% | 1.67% | 1.69% | 1.65% |
Expenses net of all reductions | 1.59% | 1.59% | 1.67% | 1.69% | 1.64% |
Net investment income (loss) | (.11)% | .18% | (.14)% | (.19)% F | (.08)% G |
Supplemental Data | | | | | |
Net assets, end of period (000 omitted) | $ 100,975 | $ 107,444 | $ 57,514 | $ 55,845 | $ 44,091 |
Portfolio turnover rateE | 26% J | 29% | 27% | 22% | 49% |
A Total returns would have been lower if certain expenses had not been reduced during the applicable periods shown.
B Total returns do not include the effect of the sales charges.
C Calculated based on average shares outstanding during the period.
D Fees and expenses of any underlying Fidelity Central Funds are not included in the Fund's expense ratio. The Fund indirectly bears its proportionate share of the expenses of any underlying Fidelity Central Funds.
E Amount does not include the portfolio activity of any underlying Fidelity Central Funds.
F Investment income per share reflects a large, non-recurring dividend which amounted to $.06 per share. Excluding this non-recurring dividend, the ratio of net investment income (loss) to average net assets would have been (.57)%.
G Investment income per share reflects a large, non-recurring dividend which amounted to $.03 per share. Excluding this non-recurring dividend, the ratio of net investment income (loss) to average net assets would have been (.35)%.
H Expense ratios reflect operating expenses of the class. Expenses before reductions do not reflect amounts reimbursed by the investment adviser or reductions from brokerage service arrangements or reductions from other expense offset arrangements and do not represent the amount paid by the class during periods when reimbursements or reductions occur. Expenses net of fee waivers reflect expenses after reimbursement by the investment adviser but prior to reductions from brokerage service arrangements or other expense offset arrangements. Expenses net of all reductions represent the net expenses paid by the class.
I Amount represents less than $.01 per share.
J Portfolio turnover rate excludes securities received or delivered in-kind.
See accompanying notes which are an integral part of the financial statements.
Annual Report
Financial Highlights - Class B
Years ended July 31, | 2014 | 2013 | 2012 | 2011 | 2010 |
Selected Per-Share Data | | | | | |
Net asset value, beginning of period | $ 19.06 | $ 14.27 | $ 15.00 | $ 13.08 | $ 10.88 |
Income from Investment Operations | | | | | |
Net investment income (loss) C | (.13) | (.06) | (.09) | (.10) F | (.07) G |
Net realized and unrealized gain (loss) | 1.18 | 5.34 | .29 | 2.15 | 2.27 |
Total from investment operations | 1.05 | 5.28 | .20 | 2.05 | 2.20 |
Distributions from net investment income | - | (.02) | - | (.01) | - |
Distributions from net realized gain | (1.93) | (.47) | (.93) | (.12) | - |
Total distributions | (1.93) | (.49) | (.93) | (.13) | - |
Redemption fees added to paid in capitalC, I | - | - | - | - | - |
Net asset value, end of period | $ 18.18 | $ 19.06 | $ 14.27 | $ 15.00 | $ 13.08 |
Total ReturnA, B | 5.92% | 38.07% | 2.51% | 15.80% | 20.22% |
Ratios to Average Net Assets D, H | | | | | |
Expenses before reductions | 2.18% | 2.15% | 2.19% | 2.20% | 2.22% |
Expenses net of fee waivers, if any | 2.17% | 2.15% | 2.19% | 2.19% | 2.15% |
Expenses net of all reductions | 2.16% | 2.14% | 2.19% | 2.19% | 2.14% |
Net investment income (loss) | (.69)% | (.37)% | (.66)% | (.69)% F | (.58)% G |
Supplemental Data | | | | | |
Net assets, end of period (000 omitted) | $ 4,808 | $ 7,052 | $ 6,675 | $ 8,549 | $ 9,747 |
Portfolio turnover rateE | 26% J | 29% | 27% | 22% | 49% |
A Total returns would have been lower if certain expenses had not been reduced during the applicable periods shown.
B Total returns do not include the effect of the contingent deferred sales charge.
C Calculated based on average shares outstanding during the period.
D Fees and expenses of any underlying Fidelity Central Funds are not included in the Fund's expense ratio. The Fund indirectly bears its proportionate share of the expenses of any underlying Fidelity Central Funds.
E Amount does not include the portfolio activity of any underlying Fidelity Central Funds.
F Investment income per share reflects a large, non-recurring dividend which amounted to $.06 per share. Excluding this non-recurring dividend, the ratio of net investment income (loss) to average net assets would have been (1.07)%.
G Investment income per share reflects a large, non-recurring dividend which amounted to $.03 per share. Excluding this non-recurring dividend, the ratio of net investment income (loss) to average net assets would have been (.85)%.
H Expense ratios reflect operating expenses of the class. Expenses before reductions do not reflect amounts reimbursed by the investment adviser or reductions from brokerage service arrangements or reductions from other expense offset arrangements and do not represent the amount paid by the class during periods when reimbursements or reductions occur. Expenses net of fee waivers reflect expenses after reimbursement by the investment adviser but prior to reductions from brokerage service arrangements or other expense offset arrangements. Expenses net of all reductions represent the net expenses paid by the class.
I Amount represents less than $.01 per share.
J Portfolio turnover rate excludes securities received or delivered in-kind.
See accompanying notes which are an integral part of the financial statements.
Annual Report
Financial Highlights - Class C
Years ended July 31, | 2014 | 2013 | 2012 | 2011 | 2010 |
Selected Per-Share Data | | | | | |
Net asset value, beginning of period | $ 19.06 | $ 14.28 | $ 15.01 | $ 13.08 | $ 10.89 |
Income from Investment Operations | | | | | |
Net investment income (loss) C | (.12) | (.06) | (.09) | (.10) F | (.07) G |
Net realized and unrealized gain (loss) | 1.18 | 5.34 | .29 | 2.17 | 2.26 |
Total from investment operations | 1.06 | 5.28 | .20 | 2.07 | 2.19 |
Distributions from net investment income | - | (.03) | - | (.02) | - |
Distributions from net realized gain | (1.93) | (.47) | (.93) | (.12) | - |
Total distributions | (1.93) | (.50) | (.93) | (.14) | - |
Redemption fees added to paid in capitalC, I | - | - | - | - | - |
Net asset value, end of period | $ 18.19 | $ 19.06 | $ 14.28 | $ 15.01 | $ 13.08 |
Total ReturnA, B | 5.97% | 38.00% | 2.52% | 15.91% | 20.11% |
Ratios to Average Net Assets D, H | | | | | |
Expenses before reductions | 2.12% | 2.13% | 2.19% | 2.18% | 2.22% |
Expenses net of fee waivers, if any | 2.11% | 2.13% | 2.19% | 2.18% | 2.15% |
Expenses net of all reductions | 2.10% | 2.12% | 2.19% | 2.18% | 2.14% |
Net investment income (loss) | (.63)% | (.35)% | (.66)% | (.68)% F | (.58)% G |
Supplemental Data | | | | | |
Net assets, end of period (000 omitted) | $ 70,541 | $ 76,018 | $ 47,265 | $ 47,457 | $ 37,346 |
Portfolio turnover rateE | 26% J | 29% | 27% | 22% | 49% |
A Total returns would have been lower if certain expenses had not been reduced during the applicable periods shown.
B Total returns do not include the effect of the contingent deferred sales charge.
C Calculated based on average shares outstanding during the period.
D Fees and expenses of any underlying Fidelity Central Funds are not included in the Fund's expense ratio. The Fund indirectly bears its proportionate share of the expenses of any underlying Fidelity Central Funds.
E Amount does not include the portfolio activity of any underlying Fidelity Central Funds.
F Investment income per share reflects a large, non-recurring dividend which amounted to $.06 per share. Excluding this non-recurring dividend, the ratio of net investment income (loss) to average net assets would have been (1.06)%.
G Investment income per share reflects a large, non-recurring dividend which amounted to $.03 per share. Excluding this non-recurring dividend, the ratio of net investment income (loss) to average net assets would have been (.85)%.
H Expense ratios reflect operating expenses of the class. Expenses before reductions do not reflect amounts reimbursed by the investment adviser or reductions from brokerage service arrangements or reductions from other expense offset arrangements and do not represent the amount paid by the class during periods when reimbursements or reductions occur. Expenses net of fee waivers reflect expenses after reimbursement by the investment adviser but prior to reductions from brokerage service arrangements or other expense offset arrangements. Expenses net of all reductions represent the net expenses paid by the class.
I Amount represents less than $.01 per share.
J Portfolio turnover rate excludes securities received or delivered in-kind.
See accompanying notes which are an integral part of the financial statements.
Annual Report
Financial Highlights - Small Cap Value
Years ended July 31, | 2014 | 2013 | 2012 | 2011 | 2010 |
Selected Per-Share Data | | | | | |
Net asset value, beginning of period | $ 20.22 | $ 15.05 | $ 15.62 | $ 13.56 | $ 11.22 |
Income from Investment Operations | | | | | |
Net investment income (loss)B | .08 | .12 | .06 | .06E | .05F |
Net realized and unrealized gain (loss) | 1.26 | 5.63 | .32 | 2.23 | 2.34 |
Total from investment operations | 1.34 | 5.75 | .38 | 2.29 | 2.39 |
Distributions from net investment income | (.06) | (.11) | (.02) | (.10) | (.05) |
Distributions from net realized gain | (1.93) | (.47) | (.93) | (.13) | - |
Total distributions | (1.99) | (.58) | (.95) | (.23) | (.05) |
Redemption fees added to paid in capitalB, H | - | - | - | - | - |
Net asset value, end of period | $ 19.57 | $ 20.22 | $ 15.05 | $ 15.62 | $ 13.56 |
Total ReturnA | 7.12% | 39.45% | 3.67% | 17.03% | 21.32% |
Ratios to Average Net AssetsC, G | | | | |
Expenses before reductions | 1.08% | 1.07% | 1.13% | 1.13% | 1.18% |
Expenses net of fee waivers, if any | 1.06% | 1.07% | 1.13% | 1.13% | 1.18% |
Expenses net of all reductions | 1.06% | 1.06% | 1.13% | 1.13% | 1.17% |
Net investment income (loss) | .41% | .71% | .41% | .37%E | .39%F |
Supplemental Data | | | | | |
Net assets, end of period (000 omitted) | $ 2,060,546 | $ 2,672,854 | $ 1,756,962 | $ 1,899,805 | $ 1,770,675 |
Portfolio turnover rateD | .26% I | 29% | 27% | 22% | 49% |
A Total returns would have been lower if certain expenses had not been reduced during the applicable periods shown.
B Calculated based on average shares outstanding during the period.
C Fees and expenses of any underlying Fidelity Central Funds are not included in the Fund's expense ratio. The Fund indirectly bears its proportionate share of the expenses of any underlying Fidelity Central Funds.
D Amount does not include the portfolio activity of any underlying Fidelity Central Funds.
E Investment income per share reflects a large, non-recurring dividend which amounted to $.06 per share. Excluding this non-recurring dividend, the ratio of net investment income (loss) to average net assets would have been (.01)%.
F Investment income per share reflects a large, non-recurring dividend which amounted to $.03 per share. Excluding this non-recurring dividend, the ratio of net investment income (loss) to average net assets would have been .12%.
G Expense ratios reflect operating expenses of the class. Expenses before reductions do not reflect amounts reimbursed by the investment adviser or reductions from brokerage service arrangements or reductions from other expense offset arrangements and do not represent the amount paid by the class during periods when reimbursements or reductions occur. Expenses net of fee waivers reflect expenses after reimbursement by the investment adviser but prior to reductions from brokerage service arrangements or other expense offset arrangements. Expenses net of all reductions represent the net expenses paid by the class.
H Amount represents less than $.01 per share.
I Portfolio turnover rate excludes securities received or delivered in-kind.
See accompanying notes which are an integral part of the financial statements.
Annual Report
Financial Highlights - Institutional Class
Years ended July 31, | 2014 | 2013 | 2012 | 2011 | 2010 |
Selected Per-Share Data | | | | | |
Net asset value, beginning of period | $ 20.23 | $ 15.05 | $ 15.63 | $ 13.58 | $ 11.24 |
Income from Investment Operations | | | | | |
Net investment income (loss) B | .08 | .12 | .06 | .06E | .06F |
Net realized and unrealized gain (loss) | 1.25 | 5.65 | .31 | 2.23 | 2.34 |
Total from investment operations | 1.33 | 5.77 | .37 | 2.29 | 2.40 |
Distributions from net investment income | (.06) | (.12) | (.02) | (.11) | (.06) |
Distributions from net realized gain | (1.93) | (.47) | (.93) | (.13) | - |
Total distributions | (1.99) | (.59) | (.95) | (.24) | (.06) |
Redemption fees added to paid in capitalB, H | - | - | - | - | - |
Net asset value, end of period | $ 19.57 | $ 20.23 | $ 15.05 | $ 15.63 | $ 13.58 |
Total ReturnA | 7.08% | 39.54% | 3.59% | 17.02% | 21.42% |
Ratios to Average Net Assets C, G | | | | | |
Expenses before reductions | 1.09% | 1.07% | 1.14% | 1.10% | 1.12% |
Expenses net of fee waivers, if any | 1.07% | 1.07% | 1.14% | 1.10% | 1.12% |
Expenses net of all reductions | 1.07% | 1.06% | 1.14% | 1.10% | 1.12% |
Net investment income (loss) | .40% | .70% | .39% | .39%E | .45%F |
Supplemental Data | | | | | |
Net assets, end of period (000 omitted) | $ 342,500 | $ 359,582 | $ 138,981 | $ 101,565 | $ 78,440 |
Portfolio turnover rateD | 26% I | 29% | 27% | 22% | 49% |
A Total returns would have been lower if certain expenses had not been reduced during the applicable periods shown.
B Calculated based on average shares outstanding during the period.
C Fees and expenses of any underlying Fidelity Central Funds are not included in the Fund's expense ratio. The Fund indirectly bears its proportionate share of the expenses of any underlying Fidelity Central Funds.
D Amount does not include the portfolio activity of any underlying Fidelity Central Funds.
E Investment income per share reflects a large, non-recurring dividend which amounted to $.06 per share. Excluding this non-recurring dividend, the ratio of net investment income (loss) to average net assets would have been .01%.
F Investment income per share reflects a large, non-recurring dividend which amounted to $.03 per share. Excluding this non-recurring dividend, the ratio of net investment income (loss) to average net assets would have been .18%.
G Expense ratios reflect operating expenses of the class. Expenses before reductions do not reflect amounts reimbursed by the investment adviser or reductions from brokerage service arrangements or reductions from other expense offset arrangements and do not represent the amount paid by the class during periods when reimbursements or reductions occur. Expenses net of fee waivers reflect expenses after reimbursement by the investment adviser but prior to reductions from brokerage service arrangements or other expense offset arrangements. Expenses net of all reductions represent the net expenses paid by the class.
H Amount represents less than $.01 per share.
I Portfolio turnover rate excludes securities received or delivered in-kind.
See accompanying notes which are an integral part of the financial statements.
Annual Report
Notes to Financial Statements
For the period ended July 31, 2014
1. Organization.
Fidelity® Small Cap Value Fund (the Fund) is a fund of Fidelity Securities Fund (the Trust) and is authorized to issue an unlimited number of shares. The Trust is registered under the Investment Company Act of 1940, as amended (the 1940 Act), as an open-end management investment company organized as a Massachusetts business trust. The Fund offers Class A, Class T, Class C, Small Cap Value and Institutional Class shares, each of which has equal rights as to assets and voting privileges. Class B shares are closed to new accounts and additional purchases, except for exchanges and reinvestments. Effective after the close of business on March 1, 2013, the Fund's other share classes were closed to new accounts with certain exceptions. The Fund offered Class F shares during the period June 26, 2009 through November 19, 2013 and all outstanding shares were redeemed by November 19, 2013. Each class has exclusive voting rights with respect to matters that affect that class. Class B shares will automatically convert to Class A shares after a holding period of seven years from the initial date of purchase.
2. Investments in Fidelity Central Funds.
The Fund invests in Fidelity Central Funds, which are open-end investment companies generally available only to other investment companies and accounts managed by the investment adviser and its affiliates. The Fund's Schedule of Investments lists each of the Fidelity Central Funds held as of period end, if any, as an investment of the Fund, but does not include the underlying holdings of each Fidelity Central Fund. As an Investing Fund, the Fund indirectly bears its proportionate share of the expenses of the underlying Fidelity Central Funds.
The Money Market Central Funds seek preservation of capital and current income and are managed by Fidelity Investments Money Management, Inc. (FIMM), an affiliate of the investment adviser. Annualized expenses of the Money Market Central Funds as of their most recent shareholder report date are less than .01%.
A complete unaudited list of holdings for each Fidelity Central Fund is available upon request or at the Securities and Exchange Commission (the SEC) website at www.sec.gov. In addition, the financial statements of the Fidelity Central Funds, which are not covered by the Fund's Report of Independent Registered Public Accounting Firm, are available on the SEC website or upon request.
3. Significant Accounting Policies.
The financial statements have been prepared in conformity with accounting principles generally accepted in the United States of America (GAAP), which require management to make certain estimates and assumptions at the date of the financial statements. Actual results could differ from those estimates. Subsequent events, if any, through the date that the financial statements were issued have been evaluated in the preparation of
Annual Report
Notes to Financial Statements - continued
3. Significant Accounting Policies - continued
the financial statements. The following summarizes the significant accounting policies of the Fund:
Investment Valuation. Investments are valued as of 4:00 p.m. Eastern time on the last calendar day of the period. In accordance with valuation policies and procedures approved by the Board of Trustees (the Board), the Fund attempts to obtain prices from one or more third party pricing vendors or brokers to value its investments. When current market prices, quotations or currency exchange rates are not readily available or reliable, investments will be fair valued in good faith by the Fidelity Management & Research Company (FMR) Fair Value Committee (the Committee), in accordance with procedures adopted by the Board. Factors used in determining fair value vary by investment type and may include market or investment specific events. The frequency with which these procedures are used cannot be predicted and they may be utilized to a significant extent. The Committee oversees the Fund's valuation policies and procedures and is responsible for approving and reporting to the Board all fair value determinations.
The Fund categorizes the inputs to valuation techniques used to value its investments into a disclosure hierarchy consisting of three levels as shown below:
Level 1 - quoted prices in active markets for identical investments
Level 2 - other significant observable inputs (including quoted prices for similar investments, interest rates, prepayment speeds, etc.)
Level 3 - unobservable inputs (including the Fund's own assumptions based on the best information available)
Valuation techniques used to value the Fund's investments by major category are as follows:
Equity securities, including restricted securities, for which market quotations are readily available, are valued at the last reported sale price or official closing price as reported by a third party pricing vendor on the primary market or exchange on which they are traded and are categorized as Level 1 in the hierarchy. In the event there were no sales during the day or closing prices are not available, securities are valued at the last quoted bid price or may be valued using the last available price and are generally categorized as Level 2 in the hierarchy. For foreign equity securities, when market or security specific events arise, comparisons to the valuation of American Depositary Receipts (ADRs), futures contracts, Exchange-Traded Funds (ETFs) and certain indexes as well as quoted prices for similar securities may be used and would be categorized as Level 2 in the hierarchy. Utilizing these techniques may result in transfers between Level 1 and Level 2. For equity securities, including restricted securities, where observable inputs are
Annual Report
3. Significant Accounting Policies - continued
Investment Valuation - continued
limited, assumptions about market activity and risk are used and these securities may be categorized as Level 3 in the hierarchy.
Investments in open-end mutual funds, including the Fidelity Central Funds, are valued at their closing net asset value (NAV) each business day and are categorized as Level 1 in the hierarchy.
Changes in valuation techniques may result in transfers in or out of an assigned level within the disclosure hierarchy. The aggregate value of investments by input level, as of July 31, 2014, is included at the end of the Fund's Schedule of Investments.
Foreign Currency. The Fund may use foreign currency contracts to facilitate transactions in foreign-denominated securities. Gains and losses from these transactions may arise from changes in the value of the foreign currency or if the counterparties do not perform under the contracts' terms.
Foreign-denominated assets, including investment securities, and liabilities are translated into U.S. dollars at the exchange rates at period end. Purchases and sales of investment securities, income and dividends received and expenses denominated in foreign currencies are translated into U.S. dollars at the exchange rate in effect on the transaction date.
The effects of exchange rate fluctuations on investments are included with the net realized and unrealized gain (loss) on investment securities. Other foreign currency transactions resulting in realized and unrealized gain (loss) are disclosed separately.
Investment Transactions and Income. For financial reporting purposes, the Fund's investment holdings and NAV include trades executed through the end of the last business day of the period. The NAV per share for processing shareholder transactions is calculated as of the close of business of the New York Stock Exchange (NYSE), normally 4:00 p.m. Eastern time and includes trades executed through the end of the prior business day. Gains and losses on securities sold are determined on the basis of identified cost and may include proceeds received from litigation. Dividend income is recorded on the ex-dividend date, except for certain dividends from foreign securities where the ex-dividend date may have passed, which are recorded as soon as the Fund is informed of the ex-dividend date. Non-cash dividends included in dividend income, if any, are recorded at the fair market value of the securities received. Income and capital gain distributions from Fidelity Central Funds, if any, are recorded on the ex-dividend date. Distributions received on securities that represent a return of capital or capital gain are recorded as a reduction of cost of investments and/or as a realized gain. Subsequent to ex-dividend date the Fund determines the components of these distributions, based
Annual Report
Notes to Financial Statements - continued
3. Significant Accounting Policies - continued
Investment Transactions and Income - continued
upon receipt of tax filings or other correspondence relating to the underlying investment. Interest income is accrued as earned and includes coupon interest and amortization of premium and accretion of discount on debt securities as applicable. Investment income is recorded net of foreign taxes withheld where recovery of such taxes is uncertain.
Class Allocations and Expenses. Investment income, realized and unrealized capital gains and losses, common expenses of the Fund, and certain fund-level expense reductions, if any, are allocated daily on a pro-rata basis to each class based on the relative net assets of each class to the total net assets of the Fund. Each class differs with respect to transfer agent and distribution and service plan fees incurred. Certain expense reductions may also differ by class. For the reporting period, the allocated portion of income and expenses to each class as a percent of its average net assets may vary due to the timing of recording these transactions in relation to fluctuating net assets of the classes. Expenses directly attributable to a fund are charged to that fund. Expenses attributable to more than one fund are allocated among the respective funds on the basis of relative net assets or other appropriate methods. Expense estimates are accrued in the period to which they relate and adjustments are made when actual amounts are known.
Income Tax Information and Distributions to Shareholders. Each year, the Fund intends to qualify as a regulated investment company under Subchapter M of the Internal Revenue Code, including distributing substantially all of its taxable income and realized gains. As a result, no provision for U.S. Federal income taxes is required. As of July 31, 2014, the Fund did not have any unrecognized tax benefits in the financial statements; nor is the Fund aware of any tax positions for which it is reasonably possible that the total amounts of unrecognized tax benefits will significantly change in the next twelve months. The Fund files a U.S. federal tax return, in addition to state and local tax returns as required. The Fund's federal income tax returns are subject to examination by the Internal Revenue Service (IRS) for a period of three fiscal years after they are filed. State and local tax returns may be subject to examination for an additional fiscal year depending on the jurisdiction. Foreign taxes are provided for based on the Fund's understanding of the tax rules and rates that exist in the foreign markets in which it invests.
Distributions are declared and recorded on the ex-dividend date. Income dividends and capital gain distributions are declared separately for each class. Income and capital gain distributions are determined in accordance with income tax regulations, which may differ from GAAP. In addition, the Fund claimed a portion of the payment made to redeeming shareholders as a distribution for income tax purposes.
Annual Report
3. Significant Accounting Policies - continued
Income Tax Information and Distributions to Shareholders - continued
Capital accounts within the financial statements are adjusted for permanent book-tax differences. These adjustments have no impact on net assets or the results of operations.
Capital accounts are not adjusted for temporary book-tax differences which will reverse in a subsequent period.
Book-tax differences are primarily due to in-kind transactions, foreign currency transactions, passive foreign investment companies (PFIC) and losses deferred due to wash sales.
The federal tax cost of investment securities and unrealized appreciation (depreciation) as of period end were as follows:
Gross unrealized appreciation | $ 594,149,641 |
Gross unrealized depreciation | (90,079,013) |
Net unrealized appreciation (depreciation) on securities | $ 504,070,628 |
| |
Tax Cost | $ 2,474,631,628 |
The tax-based components of distributable earnings as of period end were as follows:
Undistributed ordinary income | $ 5,856,882 |
Undistributed long-term capital gain | $ 278,488,755 |
Net unrealized appreciation (depreciation) on securities and other investments | $ 504,070,628 |
The tax character of distributions paid was as follows:
| July 31, 2014 | July 31, 2013 |
Ordinary Income | $ 10,662,065 | $ 21,412,021 |
Long-term Capital Gains | 362,625,476 | 85,195,362 |
Total | $ 373,287,541 | $ 106,607,383 |
Short-Term Trading (Redemption) Fees. Shares held by investors in the Fund less than 90 days may have been subject to a redemption fee equal to 1.50% of the NAV of shares redeemed. All redemption fees, which reduce the proceeds of the shareholder redemption, are retained by the Fund and accounted for as an addition to paid in capital.
4. Purchases and Sales of Investments.
Purchases and sales of securities, other than short-term securities and in-kind transactions, aggregated $854,969,915 and $1,179,251,195, respectively.
Annual Report
Notes to Financial Statements - continued
5. Fees and Other Transactions with Affiliates.
Management Fee. Fidelity Management & Research Company (the investment adviser) and its affiliates provide the Fund with investment management related services for which the Fund pays a monthly management fee. The management fee is the sum of an individual fund fee rate that is based on an annual rate of .45% of the Fund's average net assets and an annualized group fee rate that averaged .25% during the period. The group fee rate is based upon the average net assets of all the mutual funds advised by the investment adviser, including any mutual funds previously advised by the investment adviser that are currently advised by Fidelity SelectCo, LLC, an affiliate of the investment adviser. The group fee rate decreases as assets under management increase and increases as assets under management decrease. In addition, the management fee is subject to a performance adjustment (up to a maximum of ± .20% of the Fund's average net assets over a 36 month performance period). The upward or downward adjustment to the management fee is based on the relative investment performance of Small Cap Value as compared to its benchmark index, the Russell 2000 Value Index, over the same 36 month performance period. For the reporting period, the total annual management fee rate, including the performance adjustment, was .84% of the Fund's average net assets. The performance adjustment included in the management fee rate may be higher or lower than the maximum performance adjustment rate due to the difference between the average net assets for the reporting and performance periods.
During the period, the investment adviser waived a portion of its management fee as described in the Expense Reductions note.
Distribution and Service Plan Fees. In accordance with Rule 12b-1 of the 1940 Act, the Fund has adopted separate Distribution and Service Plans for each class of shares. Certain classes pay Fidelity Distributors Corporation (FDC), an affiliate of the investment adviser, separate Distribution and Service Fees, each of which is based on an annual percentage of each class' average net assets. In addition, FDC may pay financial intermediaries for selling shares of the Fund and providing shareholder support services. For the period, the Distribution and Service Fee rates, total fees and amounts retained by FDC were as follows:
| Distribution
Fee | Service
Fee | Total Fees | Retained
by FDC |
Class A | -% | .25% | $ 698,016 | $ 8,584 |
Class T | .25% | .25% | 546,090 | 860 |
Class B | .75% | .25% | 62,287 | 46,778 |
Class C | .75% | .25% | 761,065 | 76,077 |
| | | $ 2,067,458 | $ 132,299 |
Annual Report
5. Fees and Other Transactions with Affiliates - continued
Sales Load. FDC may receive a front-end sales charge of up to 5.75% for selling Class A shares and 3.50% for selling Class T shares, some of which is paid to financial intermediaries for selling shares of the Fund. Depending on the holding period, FDC may receive contingent deferred sales charges levied on Class A, Class T, Class B, and Class C redemptions. The deferred sales charges range from 5.00% to 1.00% for Class B shares, 1.00% for Class C shares, 1.00% for certain purchases of Class A shares and .25% for certain purchases of Class T shares.
For the period, sales charge amounts retained by FDC were as follows:
| Retained
by FDC |
Class A | $ 12,340 |
Class T | 4,891 |
Class B* | 5,101 |
Class C* | 3,506 |
| $ 25,838 |
* When Class B and Class C shares are initially sold, FDC pays commissions from its own resources to financial intermediaries through which the sales are made.
Transfer Agent Fees. Fidelity Investments Institutional Operations Company, Inc., (FIIOC), an affiliate of the investment adviser, is the transfer, dividend disbursing and shareholder servicing agent for each class of the Fund. FIIOC receives account fees and asset-based fees that vary according to the account size and type of account of the shareholders of the respective classes of the Fund. FIIOC pays for typesetting, printing and mailing of shareholder reports, except proxy statements.
For the period, transfer agent fees for each class were as follows:
| Amount | % of
Average
Net Assets |
Class A | $ 647,648 | .23 |
Class T | 244,503 | .22 |
Class B | 18,830 | .30 |
Class C | 184,822 | .24 |
Small Cap Value | 4,528,423 | .20 |
Institutional Class | 779,838 | .21 |
| $ 6,404,064 | |
Accounting and Security Lending Fees. Fidelity Service Company, Inc. (FSC), an affiliate of the investment adviser, maintains the Fund's accounting records. The accounting fee is based on the level of average net assets for each month. Under a separate contract, FSC administers the security lending program. The security lending fee is based on the number and duration of lending transactions.
Annual Report
Notes to Financial Statements - continued
5. Fees and Other Transactions with Affiliates - continued
Brokerage Commissions. The Fund placed a portion of its portfolio transactions with brokerage firms which are affiliates of the investment adviser. Brokerage commissions are included in net realized gain (loss) and change in net unrealized appreciation (depreciation) in the Statement of Operations. The commissions paid to these affiliated firms were $34,447 for the period.
Interfund Lending Program. Pursuant to an Exemptive Order issued by the SEC, the Fund, along with other registered investment companies having management contracts with FMR or other affiliated entities of FMR, may participate in an interfund lending program. This program provides an alternative credit facility allowing the funds to borrow from, or lend money to, other participating affiliated funds. At period end, there were no interfund loans outstanding. The Fund's activity in this program during the period for which loans were outstanding was as follows:
Borrower or Lender | Average Loan
Balance | Weighted Average
Interest Rate | Interest
Expense |
Borrower | $ 11,791,333 | .33% | $ 652 |
Redemptions In-Kind. During the period, 67,200,853 shares of the Fund held by affiliated entities were redeemed for investments with a value of $1,338,424,445. The net realized gain of $464,750,352 on investments delivered through in-kind redemptions is included in the accompanying Statement of Operations. The amount of in-kind redemptions is included in share transactions in the accompanying Statement of Changes in Net Assets as well as Note 10: Share Transactions. The Fund recognized no gain or loss for federal income tax purposes.
6. Committed Line of Credit.
The Fund participates with other funds managed by the investment adviser or an affiliate in a $4.25 billion credit facility (the "line of credit") to be utilized for temporary or emergency purposes to fund shareholder redemptions or for other short-term liquidity purposes. The Fund has agreed to pay commitment fees on its pro-rata portion of the line of credit, which amounted to $5,913 and is reflected in Miscellaneous expenses on the Statement of Operations. During the period, the Fund did not borrow on this line of credit.
7. Security Lending.
The Fund lends portfolio securities through a lending agent from time to time in order to earn additional income. For equity securities, a lending agent is used and may loan securities to certain qualified borrowers, including Fidelity Capital Markets (FCM), a broker-dealer affiliated with the Fund. On the settlement date of the loan, the Fund
Annual Report
7. Security Lending - continued
receives collateral (in the form of U.S. Treasury obligations, letters of credit and/or cash) against the loaned securities and maintains collateral in an amount not less than 100% of the market value of the loaned securities during the period of the loan. The market value of the loaned securities is determined at the close of business of the Fund and any additional required collateral is delivered to the Fund on the next business day. If the borrower defaults on its obligation to return the securities loaned because of insolvency or other reasons, the Fund may apply collateral received from the borrower against the obligation. The Fund may experience delays and costs in recovering the securities loaned. Any cash collateral received is invested in the Fidelity Securities Lending Cash Central Fund. The value of loaned securities and cash collateral at period end are disclosed on the Fund's Statement of Assets and Liabilities. At period end, there were no security loans outstanding with FCM. Security lending income represents the income earned on investing cash collateral, less rebates paid to borrowers and any lending agent fees associated with the loan, plus any premium payments received for lending certain types of securities. Security lending income is presented in the Statement of Operations as a component of income from Fidelity Central Funds. Total security lending income during the period amounted to $874,417, including $3,386 from securities loaned to FCM.
8. Expense Reductions.
The investment adviser has contractually agreed to waive a portion of the Fund's management fee until May 31, 2015. During the period, this waiver reduced the Fund's management fee by $538,400.
In addition, the investment adviser reimbursed a portion of the Fund's operating expenses during the period in the amount of $44,531.
Commissions paid to certain brokers with whom the investment adviser, or its affiliates, places trades on behalf of the Fund include an amount in addition to trade execution, which may be rebated back to the Fund to offset certain expenses. This amount totaled $48,251 for the period.
Annual Report
Notes to Financial Statements - continued
9. Distributions to Shareholders.
Distributions to shareholders of each class were as follows:
Years ended July 31, | 2014A | 2013 |
From net investment income | | |
Class A | $ 171,608 | $ 785,355 |
Class T | - | 231,402 |
Class B | - | 9,411 |
Class C | - | 90,526 |
Small Cap Value | 7,284,772 | 13,318,853 |
Class F | 2,011,606 | 5,669,081 |
Institutional Class | 1,194,079 | 1,307,393 |
Total | $ 10,662,065 | $ 21,412,021 |
From net realized gain | | |
Class A | $ 26,941,211 | $ 5,001,914 |
Class T | 10,672,388 | 1,871,336 |
Class B | 695,128 | 211,601 |
Class C | 7,761,033 | 1,589,582 |
Small Cap Value | 236,012,007 | 54,759,308 |
Class F | 44,973,770 | 17,097,966 |
Institutional Class | 35,569,940 | 4,663,655 |
Total | $ 362,625,477 | $ 85,195,362 |
A All Class F Shares were redeemed on November 19, 2013.
10. Share Transactions.
Transactions for each class of shares were as follows:
| Shares | Dollars |
Years ended July 31, | 2014A | 2013 | 2014A | 2013 |
Class A | | | | |
Shares sold | 2,364,232 | 6,665,265 | $ 46,165,166 | $ 113,825,347 |
Reinvestment of distributions | 1,371,738 | 357,182 | 25,837,208 | 5,478,656 |
Shares redeemed | (4,138,116) | (3,345,663) | (80,966,690) | (56,976,312) |
Net increase (decrease) | (402,146) | 3,676,784 | $ (8,964,316) | $ 62,327,691 |
Class T | | | | |
Shares sold | 987,146 | 2,420,486 | $ 19,000,773 | $ 41,524,163 |
Reinvestment of distributions | 566,918 | 135,952 | 10,525,159 | 2,060,454 |
Shares redeemed | (1,685,516) | (1,017,057) | (32,399,109) | (17,196,752) |
Net increase (decrease) | (131,452) | 1,539,381 | $ (2,873,177) | $ 26,387,865 |
Annual Report
10. Share Transactions - continued
| Shares | Dollars |
Years ended July 31, | 2014A | 2013 | 2014A | 2013 |
Class B | | | | |
Shares sold | 9,527 | 63,699 | $ 174,532 | $ 1,033,590 |
Reinvestment of distributions | 33,965 | 12,922 | 607,035 | 189,673 |
Shares redeemed | (149,029) | (174,192) | (2,755,578) | (2,861,489) |
Net increase (decrease) | (105,537) | (97,571) | $ (1,974,011) | $ (1,638,226) |
Class C | | | | |
Shares sold | 268,818 | 1,262,288 | $ 4,960,750 | $ 20,129,471 |
Reinvestment of distributions | 378,946 | 98,556 | 6,778,684 | 1,448,319 |
Shares redeemed | (758,615) | (683,043) | (14,057,302) | (11,003,236) |
Net increase (decrease) | (110,851) | 677,801 | $ (2,317,868) | $ 10,574,554 |
Small Cap Value | | | | |
Shares sold | 19,542,379 | 46,643,321 | $ 386,966,432 | $ 815,184,196 |
Reinvestment of distributions | 11,711,859 | 4,065,017 | 222,752,806 | 63,037,497 |
Shares redeemed | (58,131,122)B | (35,306,999) | (1,153,341,425)B | (618,245,939) |
Net increase (decrease) | (26,876,884) | 15,401,339 | $ (543,622,187) | $ 259,975,754 |
Class F | | | | |
Shares sold | 879,716 | 7,943,352 | $ 17,395,091 | $ 133,806,197 |
Reinvestment of distributions | 2,497,893 | 1,465,154 | 46,985,376 | 22,767,047 |
Shares redeemed | (39,476,567)B | (8,168,596) | (787,183,278)B | (151,555,822) |
Net increase (decrease) | (36,098,958) | 1,239,910 | $ (722,802,811) | $ 5,017,422 |
Institutional Class | | | | |
Shares sold | 4,292,555 | 11,988,758 | $ 84,987,281 | $ 206,274,907 |
Reinvestment of distributions | 1,739,424 | 337,968 | 33,193,654 | 5,246,517 |
Shares redeemed | (6,306,791) | (3,783,835) | (125,274,359) | (66,718,093) |
Net increase (decrease) | (274,812) | 8,542,891 | $ (7,093,424) | $ 144,803,331 |
A All Class F Shares were redeemed on November 19, 2013.
B Amount includes in-kind redemptions (see Note 5: Redemptions In-Kind).
Annual Report
Notes to Financial Statements - continued
11. Other.
The Fund's organizational documents provide former and current trustees and officers with a limited indemnification against liabilities arising in connection with the performance of their duties to the Fund. In the normal course of business, the Fund may also enter into contracts that provide general indemnifications. The Fund's maximum exposure under these arrangements is unknown as this would be dependent on future claims that may be made against the Fund. The risk of material loss from such claims is considered remote.
Annual Report
To the Trustees of Fidelity Securities Fund and the Shareholders of Fidelity Small Cap Value Fund:
In our opinion, the accompanying statement of assets and liabilities, including the schedule of investments, and the related statements of operations and of changes in net assets and the financial highlights present fairly, in all material respects, the financial position of Fidelity Small Cap Value Fund (a fund of Fidelity Securities Fund) at July 31, 2014, the results of its operations for the year then ended, the changes in its net assets for each of the two years in the period then ended and the financial highlights for each of the five years in the period then ended, in conformity with accounting principles generally accepted in the United States of America. These financial statements and financial highlights (hereafter referred to as "financial statements") are the responsibility of the Fidelity Small Cap Value Fund's management. Our responsibility is to express an opinion on these financial statements based on our audits. We conducted our audits of these financial statements in accordance with the standards of the Public Company Accounting Oversight Board (United States). Those standards require that we plan and perform the audit to obtain reasonable assurance about whether the financial statements are free of material misstatement. An audit includes examining, on a test basis, evidence supporting the amounts and disclosures in the financial statements, assessing the accounting principles used and significant estimates made by management, and evaluating the overall financial statement presentation. We believe that our audits, which included confirmation of securities at July 31, 2014 by correspondence with the custodian and brokers, provide a reasonable basis for our opinion.
PricewaterhouseCoopers LLP
Boston, Massachusetts
September 12, 2014
Annual Report
The Trustees, Member of the Advisory Board, and officers of the trust and fund, as applicable, are listed below. The Board of Trustees governs the fund and is responsible for protecting the interests of shareholders. The Trustees are experienced executives who meet periodically throughout the year to oversee the fund's activities, review contractual arrangements with companies that provide services to the fund, oversee management of the risks associated with such activities and contractual arrangements, and review the fund's performance. Except for James C. Curvey, each of the Trustees oversees 173 funds. Mr. Curvey oversees 397 funds.
The Trustees hold office without limit in time except that (a) any Trustee may resign; (b) any Trustee may be removed by written instrument, signed by at least two-thirds of the number of Trustees prior to such removal; (c) any Trustee who requests to be retired or who has become incapacitated by illness or injury may be retired by written instrument signed by a majority of the other Trustees; and (d) any Trustee may be removed at any special meeting of shareholders by a two-thirds vote of the outstanding voting securities of the trust. Each Trustee who is not an interested person (as defined in the 1940 Act) of the trust and the fund (Independent Trustee), shall retire not later than the last day of the calendar year in which his or her 75th birthday occurs. The Independent Trustees may waive this mandatory retirement age policy with respect to individual Trustees. The officers and Advisory Board Member hold office without limit in time, except that any officer and Advisory Board Member may resign or may be removed by a vote of a majority of the Trustees at any regular meeting or any special meeting of the Trustees. Except as indicated, each individual has held the office shown or other offices in the same company for the past five years.
Experience, Skills, Attributes, and Qualifications of the Fund's Trustees. The Governance and Nominating Committee has adopted a statement of policy that describes the experience, qualifications, attributes, and skills that are necessary and desirable for potential Independent Trustee candidates (Statement of Policy). The Board believes that each Trustee satisfied at the time he or she was initially elected or appointed a Trustee, and continues to satisfy, the standards contemplated by the Statement of Policy. The Governance and Nominating Committee also engages professional search firms to help identify potential Independent Trustee candidates who have the experience, qualifications, attributes, and skills consistent with the Statement of Policy. From time to time, additional criteria based on the composition and skills of the current Independent Trustees, as well as experience or skills that may be appropriate in light of future changes to board composition, business conditions, and regulatory or other developments, have also been considered by the professional search firms and the Governance and Nominating Committee. In addition, the Board takes into account the Trustees' commitment and participation in Board and committee meetings, as well as their leadership of standing and ad hoc committees throughout their tenure.
In determining that a particular Trustee was and continues to be qualified to serve as a Trustee, the Board has considered a variety of criteria, none of which, in isolation, was controlling. The Board believes that, collectively, the Trustees have balanced and diverse experience, qualifications, attributes, and skills, which allow the Board to operate effectively in governing the fund and protecting the interests of shareholders. Information about the specific experience, skills, attributes, and qualifications of each Trustee, which in each case led to the Board's conclusion that the Trustee should serve (or continue to serve) as a trustee of the fund, is provided below.
Annual Report
Board Structure and Oversight Function. James C. Curvey is an interested person (as defined in the 1940 Act) and currently serves as Chairman. The Trustees have determined that an interested Chairman is appropriate and benefits shareholders because an interested Chairman has a personal and professional stake in the quality and continuity of services provided to the fund. Independent Trustees exercise their informed business judgment to appoint an individual of their choosing to serve as Chairman, regardless of whether the Trustee happens to be independent or a member of management. The Independent Trustees have determined that they can act independently and effectively without having an Independent Trustee serve as Chairman and that a key structural component for assuring that they are in a position to do so is for the Independent Trustees to constitute a substantial majority for the Board. The Independent Trustees also regularly meet in executive session. Ned C. Lautenbach serves as Chairman of the Independent Trustees and as such (i) acts as a liaison between the Independent Trustees and management with respect to matters important to the Independent Trustees and (ii) with management prepares agendas for Board meetings.
Fidelity funds are overseen by different Boards of Trustees. The fund's Board oversees Fidelity's equity and high income funds and another Board oversees Fidelity's investment-grade bond, money market, and asset allocation funds. The asset allocation funds may invest in Fidelity funds overseen by the fund's Board. The use of separate Boards, each with its own committee structure, allows the Trustees of each group of Fidelity funds to focus on the unique issues of the funds they oversee, including common research, investment, and operational issues. On occasion, the separate Boards establish joint committees to address issues of overlapping consequences for the Fidelity funds overseen by each Board.
The Trustees operate using a system of committees to facilitate the timely and efficient consideration of all matters of importance to the Trustees, the fund, and fund shareholders and to facilitate compliance with legal and regulatory requirements and oversight of the fund's activities and associated risks. The Board, acting through its committees, has charged FMR and its affiliates with (i) identifying events or circumstances the occurrence of which could have demonstrably adverse effects on the fund's business and/or reputation; (ii) implementing processes and controls to lessen the possibility that such events or circumstances occur or to mitigate the effects of such events or circumstances if they do occur; and (iii) creating and maintaining a system designed to evaluate continuously business and market conditions in order to facilitate the identification and implementation processes described in (i) and (ii) above. Because the day-to-day operations and activities of the fund are carried out by or through FMR, its affiliates and other service providers, the fund's exposure to risks is mitigated but not eliminated by the processes overseen by the Trustees. While each of the Board's committees has responsibility for overseeing different aspects of the fund's activities, oversight is exercised primarily through the Operations, Audit, and Compliance Committees. In addition, the Independent Trustees have worked with FMR to enhance the Board's oversight of investment and financial risks, legal and regulatory risks, technology risks, and operational risks, including the development of additional risk reporting to the Board. For example, a working group comprised of Independent Trustees and FMR has worked and continues to work to review the Fidelity funds' valuation-related activities, reporting and risk management. Appropriate personnel, including but not limited to the fund's Chief Compliance Officer (CCO), FMR's internal auditor, the independent accountants, the fund's Treasurer and portfolio management personnel, make periodic reports to the Board's committees, as appropriate, including an annual review of FMR's risk management program for the Fidelity funds. The responsibilities of each standing committee, including their oversight responsibilities, are described further under "Standing Committees of the Fund's Trustees."
Annual Report
Trustees and Officers - continued
The fund's Statement of Additional Information (SAI) includes more information about the Trustees. To request a free copy, call Fidelity at 1-800-544-8544.
Interested Trustees*:
Correspondence intended for each Trustee who is an interested person may be sent to Fidelity Investments, 245 Summer Street, Boston, Massachusetts 02210.
Name, Year of Birth; Principal Occupations and Other Relevant Experience+ |
James C. Curvey (1935) |
Year of Election or Appointment: 2007 Trustee Chairman of the Board of Trustees |
| Mr. Curvey also serves as Trustee of other Fidelity funds. Mr. Curvey is a Director of Fidelity Research & Analysis Co. (2009-present), and Vice Chairman (2007-present) and Director of FMR LLC. In addition, Mr. Curvey serves as an Overseer for the Boston Symphony Orchestra and a member of the Trustees of Villanova University. Previously, Mr. Curvey served as a Director of Fidelity Investments Money Management, Inc. (2009-2014), a Director of FMR (2007-2014), a Director of FMR Co., Inc. (2007-2014) and was the Vice Chairman (2006-2007) and Director (2000-2007) of FMR Corp. |
Charles S. Morrison (1960) |
Year of Election or Appointment: 2014 Trustee |
| Mr. Morrison also serves as Trustee of other funds. He serves as President, Asset Management (2014-present) and is an employee of Fidelity Investments. Previously, Mr. Morrison served as Vice President of Fidelity's Fixed Income and Asset Allocation Funds (2012-2014), President, Fixed Income (2011-2014), Vice President of Fidelity's Money Market Funds (2005-2009), President, Money Market Group Leader of FMR (2009), and Senior Vice President, Money Market Group of FMR (2004-2009). Mr. Morrison also served as Vice President of Fidelity's Bond Funds (2002-2005), certain Balanced Funds (2002-2005), and certain Asset Allocation Funds (2002-2007), and as Senior Vice President (2002-2005) of Fidelity's Bond Division. |
* Trustees have been determined to be "Interested Trustees" by virtue of, among other things, their affiliation with the trust or various entities under common control with FMR.
+ The information above includes each Trustee's principal occupation during the last five years and other information relating to the experience, attributes, and skills relevant to each Trustee's qualifications to serve as a Trustee, which led to the conclusion that each Trustee should serve as a Trustee for the fund.
Annual Report
Trustees and Officers - continued
Independent Trustees:
Correspondence intended for each Independent Trustee (that is, the Trustees other than the Interested Trustees) may be sent to Fidelity Investments, P.O. Box 55235, Boston, Massachusetts 02205-5235.
Name, Year of Birth; Principal Occupations and Other Relevant Experience+ |
Dennis J. Dirks (1948) |
Year of Election or Appointment: 2005 Trustee |
| Mr. Dirks also serves as Trustee of other Fidelity funds. Prior to his retirement in May 2003, Mr. Dirks was Chief Operating Officer and a member of the Board of The Depository Trust & Clearing Corporation (DTCC). He also served as President, Chief Operating Officer, and Board member of The Depository Trust Company (DTC) and President and Board member of the National Securities Clearing Corporation (NSCC). In addition, Mr. Dirks served as Chief Executive Officer and Board member of the Government Securities Clearing Corporation, Chief Executive Officer and Board member of the Mortgage-Backed Securities Clearing Corporation, as a Trustee and a member of the Finance Committee of Manhattan College (2005-2008), and as a Trustee and a member of the Finance Committee of AHRC of Nassau County (2006-2008). Mr. Dirks is a member of the Independent Directors Council (IDC) Governing Council (2010-present) and Board of Directors for The Brookville Center for Children's Services, Inc. (2009-present). |
Alan J. Lacy (1953) |
Year of Election or Appointment: 2008 Trustee |
| Mr. Lacy also serves as Trustee of other Fidelity funds. Mr. Lacy serves as Senior Adviser (2007-present) of Oak Hill Capital Partners, L.P. (private equity). Mr. Lacy also served as Chief Executive Officer (2000-2005) and Vice Chairman (2005-2006) of Sears Holdings Corporation and Sears, Roebuck and Co. (retail). In addition, Mr. Lacy serves as a member of the Board of Directors of Dave & Buster's Entertainment, Inc. (restaurant and entertainment complexes, 2010-present), Earth Fare, Inc. (retail grocery, 2012-present), The Hillman Companies, Inc. (hardware wholesalers, 2010-present), and Bristol-Myers Squibb Company (global pharmaceuticals, 2008-present). Mr. Lacy is a member of the Board of Trustees of The National Parks Conservation Association (2006-present). Previously, Mr. Lacy served as Chairman of the Board of Trustees of the National Parks Conservation Association (2008-2011) and as a member of the Board of Directors for the Western Union Company (global money transfer, 2006-2011). |
Ned C. Lautenbach (1944) |
Year of Election or Appointment: 2000 Trustee Chairman of the Independent Trustees |
| Mr. Lautenbach also serves as Trustee of other Fidelity funds. Mr. Lautenbach currently serves as the Lead Director of the Eaton Corporation Board of Directors (diversified industrial, 1997-present). Mr. Lautenbach is Chairman of the Board of Directors of the Philharmonic Center for the Arts in Naples, Florida (2012-present) and a member of the Council on Foreign Relations (1994-present). Previously, Mr. Lautenbach was a Partner/Advisory Partner at Clayton, Dubilier & Rice, LLC (private equity investment, 1998-2010), as well as a Director of Sony Corporation (2006-2007). |
Joseph Mauriello (1944) |
Year of Election or Appointment: 2008 Trustee |
| Mr. Mauriello also serves as Trustee of other Fidelity funds. Prior to his retirement in January 2006, Mr. Mauriello served in numerous senior management positions including Deputy Chairman and Chief Operating Officer (2004-2005), and Vice Chairman of Financial Services (2002-2004) of KPMG LLP US (professional services, 1965-2005). Mr. Mauriello currently serves as a member of the Board of Directors of XL Group plc. (global insurance and re-insurance, 2006-present). Previously, Mr. Mauriello served as a Director of the Hamilton Funds of the Bank of New York (2006-2007) and of Arcadia Resources Inc. (health care services and products, 2007-2012). |
Robert W. Selander (1950) |
Year of Election or Appointment: 2011 Trustee |
| Mr. Selander also serves as Trustee of other Fidelity funds. Previously, Mr. Selander served as a Member of the Advisory Board of other Fidelity funds (2011), and Executive Vice Chairman (2010), Chief Executive Officer (2009-2010), and President and Chief Executive Officer (1997-2009) of Mastercard, Inc. |
Cornelia M. Small (1944) |
Year of Election or Appointment: 2005 Trustee |
| Ms. Small also serves as Trustee of other Fidelity funds. Ms. Small is a member of the Board of Directors (2009-present) and Chair of the Investment Committee (2010-present) of the Teagle Foundation. Ms. Small also serves on the Investment Committee of the Berkshire Taconic Community Foundation (2008-present). Previously, Ms. Small served as Chairperson (2002-2008) and a member of the Investment Committee and Chairperson (2008-2012) and a member of the Board of Trustees of Smith College. In addition, Ms. Small served as Chief Investment Officer, Director of Global Equity Investments, and a member of the Board of Directors of Scudder, Stevens & Clark and Scudder Kemper Investments. |
William S. Stavropoulos (1939) |
Year of Election or Appointment: 2002 Trustee Vice Chairman of the Independent Trustees |
| Mr. Stavropoulos also serves as Trustee of other Fidelity funds. Mr. Stavropoulos serves as President and Founder of the Michigan Baseball Foundation, the Great Lakes Loons (2007-present). Mr. Stavropoulos is Chairman Emeritus of the Board of Directors of The Dow Chemical Company, where he previously served in numerous senior management positions, including President, CEO (1995-2000; 2002-2004), Chairman of the Executive Committee (2000-2006), and as a member of the Board of Directors (1990-2006). Currently, Mr. Stavropoulos is Chairman of the Board of Directors of Univar Inc. (global distributor of commodity and specialty chemicals), a Director of Teradata Corporation (data warehousing and technology solutions), and Maersk Inc. (industrial conglomerate), and a member of the Advisory Board for Metalmark Capital LLC (private equity investment, 2005-present). Mr. Stavropoulos is an operating advisor to Clayton, Dubilier & Rice, LLC (private equity investment). In addition, Mr. Stavropoulos is a member of the University of Notre Dame Advisory Council for the College of Science, a Trustee of the Rollin L. Gerstacker Foundation, and a Director of the Naples Philharmonic Center for the Arts. Previously, Mr. Stavropoulos served as a Director of Chemical Financial Corporation (bank holding company, 1993-2012) and Tyco International, Ltd. (multinational manufacturing and services, 2007-2012). |
David M. Thomas (1949) |
Year of Election or Appointment: 2008 Trustee |
| Mr. Thomas also serves as Trustee of other Fidelity funds. Mr. Thomas serves as Non-Executive Chairman of the Board of Directors of Fortune Brands Home and Security (home and security products, 2011-present), and as a member of the Board of Directors of Interpublic Group of Companies, Inc. (marketing communication, 2004-present). Previously, Mr. Thomas served as Executive Chairman (2005-2006) and Chairman and Chief Executive Officer (2000-2005) of IMS Health, Inc. (pharmaceutical and healthcare information solutions), and a Director of Fortune Brands, Inc. (consumer products, 2000-2011). |
+ The information above includes each Trustee's principal occupation during the last five years and other information relating to the experience, attributes, and skills relevant to each Trustee's qualifications to serve as a Trustee, which led to the conclusion that each Trustee should serve as a Trustee for the fund.
Advisory Board Member and Officers:
Correspondence intended for each officer and Peter S. Lynch may be sent to Fidelity Investments, 245 Summer Street, Boston, Massachusetts 02210. Officers appear below in alphabetical order.
Name, Year of Birth; Principal Occupation |
Peter S. Lynch (1944) |
Year of Election or Appointment: 2003 Member of the Advisory Board |
| Mr. Lynch also serves as Member of the Advisory Board of other Fidelity funds. Mr. Lynch is Vice Chairman and a Director of FMR and FMR Co., Inc. In addition, Mr. Lynch serves as a Trustee of Boston College and as the Chairman of the Inner-City Scholarship Fund. Previously, Mr. Lynch served on the Special Olympics International Board of Directors (1997-2006). |
Elizabeth Paige Baumann (1968) |
Year of Election or Appointment: 2012 Anti-Money Laundering (AML) Officer |
| Ms. Baumann also serves as AML Officer of other funds. She is Chief AML Officer of FMR LLC (2012-present) and is an employee of Fidelity Investments. Previously, Ms. Baumann served as Vice President and Deputy Anti-Money Laundering Officer (2007-2012). |
William C. Coffey (1969) |
Year of Election or Appointment: 2009 Assistant Secretary |
| Mr. Coffey also serves as Assistant Secretary of other funds. He is Senior Vice President and Deputy General Counsel of FMR LLC (2010-present), and is an employee of Fidelity Investments. Previously, Mr. Coffey served as Vice President and Associate General Counsel of FMR LLC (2005-2009). |
Jonathan Davis (1968) |
Year of Election or Appointment: 2010 Assistant Treasurer |
| Mr. Davis also serves as Assistant Treasurer of other funds. Mr. Davis is an employee of Fidelity Investments. Previously, Mr. Davis served as Vice President and Associate General Counsel of FMR LLC (2003-2010). |
Adrien E. Deberghes (1967) |
Year of Election or Appointment: 2008 Deputy Treasurer |
| Mr. Deberghes also serves as an officer of other funds. He is an employee of Fidelity Investments (2008-present). Prior to joining Fidelity Investments, Mr. Deberghes was Senior Vice President of Mutual Fund Administration at State Street Corporation (2007-2008), Senior Director of Mutual Fund Administration at Investors Bank & Trust (2005-2007), and Director of Finance for Dunkin' Brands (2000-2005). |
Stephanie J. Dorsey (1969) |
Year of Election or Appointment: 2010 Assistant Treasurer |
| Ms. Dorsey also serves as an officer of other funds. She is an employee of Fidelity Investments (2008-present) and has served in other fund officer roles. Prior to joining Fidelity Investments, Ms. Dorsey served as Treasurer (2004-2008) of the JPMorgan Mutual Funds and Vice President (2004-2008) of JPMorgan Chase Bank. |
Howard J. Galligan III (1966) |
Year of Election or Appointment: 2014 Chief Financial Officer |
| Mr. Galligan also serves as Chief Financial Officer of other funds. Mr. Galligan serves as President of Fidelity Pricing and Cash Management Services (FPCMS) (2014-present) and as a Director of Strategic Advisers, Inc. (2008-present). Previously, Mr. Galligan served as Chief Administrative Officer of Asset Management (2011-2014) and Chief Operating Officer and Senior Vice President of Investment Support for Strategic Advisers, Inc. (2003-2011). |
Scott C. Goebel (1968) |
Year of Election or Appointment: 2008 Secretary and Chief Legal Officer (CLO) |
| Mr. Goebel serves as Secretary and CLO of other funds. Mr. Goebel also serves as Secretary of Fidelity SelectCo, LLC (2013-present), Fidelity Investments Money Management, Inc. (FIMM) (2010-present) and Fidelity Research and Analysis Company (FRAC) (2010-present); General Counsel, Secretary, and Senior Vice President of FMR (2008-present) and FMR Co., Inc. (2008-present); Chief Legal Officer of Fidelity Management & Research (Hong Kong) Limited (2008-present); and Assistant Secretary of Fidelity Management & Research (Japan) Inc. (2008-present) and Fidelity Management & Research (U.K.) Inc. (2008-present). Previously, Mr. Goebel served as Secretary and CLO of other Fidelity funds (2008-2013), Assistant Secretary of FIMM (2008-2010), FRAC (2008-2010), and certain funds (2007-2008); and as Vice President and Secretary of Fidelity Distributors Corporation (FDC) (2005-2007). Mr. Goebel has been employed by FMR LLC or an affiliate since 2001. |
Thomas C. Hense (1964) |
Year of Election or Appointment: 2008/2010 Vice President |
| Mr. Hense also serves as Vice President of other funds (High Income (2008), Small Cap (2008), and Value (2010) funds). Previously, Mr. Hense served as a portfolio manager for Fidelity's Institutional Money Management Group (Pyramis) (2003-2008). |
Brian B. Hogan (1964) |
Year of Election or Appointment: 2009 Vice President |
| Mr. Hogan also serves as Trustee or Vice President of other funds. Mr. Hogan serves as President of FMR's Equity Division (2009-present). Previously, Mr. Hogan served as Senior Vice President, Equity Research of FMR (2006-2009) and as a portfolio manager. |
Chris Maher (1972) |
Year of Election or Appointment: 2013 Assistant Treasurer |
| Mr. Maher serves as Assistant Treasurer of other funds. Mr. Maher is Vice President of Valuation Oversight and is an employee of Fidelity Investments. Previously, Mr. Maher served as Vice President of Asset Management Compliance (2013), Vice President of FMR's Program Management Group (2010-2013), and Vice President of Valuation Oversight (2008-2010). |
Kenneth B. Robins (1969) |
Year of Election or Appointment: 2008 President and Treasurer |
| Mr. Robins also serves as an officer of other funds. Mr. Robins serves as Executive Vice President of Fidelity Investments Money Management, Inc. (FIMM) (2013-present) and is an employee of Fidelity Investments (2004-present). Previously, Mr. Robins served in other fund officer roles. |
Stephen Sadoski (1971) |
Year of Election or Appointment: 2012 Deputy Treasurer |
| Mr. Sadoski also serves as Deputy Treasurer of other funds. He is an employee of Fidelity Investments (2012-present) and has served in another fund officer role. Prior to joining Fidelity Investments, Mr. Sadoski served as an assistant chief accountant in the Division of Investment Management of the Securities and Exchange Commission (SEC) (2009-2012) and as a senior manager at Deloitte & Touche LLP (1997-2009). |
Stacie M. Smith (1974) |
Year of Election or Appointment: 2013 Deputy Treasurer |
| Ms. Smith also serves as an officer of other funds. She is an employee of Fidelity Investments (2009-present) and has served in other fund officer roles. Prior to joining Fidelity Investments, Ms. Smith served as Senior Audit Manager of Ernst & Young LLP (1996-2009). |
Renee Stagnone (1975) |
Year of Election or Appointment: 2013 Deputy Treasurer |
| Ms. Stagnone also serves as Deputy Treasurer of other funds. Ms. Stagnone is an employee of Fidelity Investments. |
Linda J. Wondrack (1964) |
Year of Election or Appointment: 2014 Chief Compliance Officer |
| Ms. Wondrack also serves as Chief Compliance Officer of other funds. Ms. Wondrack is Executive Vice President and head of the Ethics Office and Asset Management Compliance for Fidelity Investments (2012-present). Ms. Wondrack also serves as Chief Compliance Officer of Fidelity SelectCo, LLC (2014-present); Chief Compliance Officer of Impresa Management LLC (2013-present); and Chief Compliance Officer of FMR Co., Inc., Fidelity Investments Money Management, Inc., Fidelity Management & Research (Japan) Inc., Fidelity Management & Research (U.K.) Inc., Fidelity Management & Research (Hong Kong), Fidelity Management & Research Company, Pyramis Global Advisors, LLC, and Strategic Advisers, Inc., Ballyrock Investment Advisors LLC, and Northern Neck Investors LLC (2012-present). Previously, Ms. Wondrack served as Senior Vice President and Chief Compliance Officer for Columbia Management Investment Advisers, LLC (2005-2012); Chief Compliance Officer for certain funds within the Columbia Family of Funds (2007-2012); and Senior Vice President of Compliance Risk Management at Bank of America (2005-2010). |
Joseph F. Zambello (1957) |
Year of Election or Appointment: 2011 Deputy Treasurer |
| Mr. Zambello also serves as Deputy Treasurer of other funds. Mr. Zambello is an employee of Fidelity Investments. Previously, Mr. Zambello served as Vice President of FMR's Program Management Group (2009-2011) and Vice President of the Transfer Agent Oversight Group (2005-2009). |
Annual Report
The Board of Trustees of Fidelity Small Cap Value Fund voted to pay on September 15, 2014 to shareholders of record at the opening of business on September 12, 2014, a distribution of $1.955 per share derived from capital gains realized from sales of portfolio securities and a dividend of $0.049 per share from net investment income.
The fund hereby designates as a capital gain dividend with respect to the taxable year ended July 31, 2014, $441,012,533, or, if subsequently determined to be different, the net capital gain of such year.
The fund designates 100% of the dividends distributed during the fiscal year as qualifying for the dividends-received deduction for corporate shareholders.
The fund designates 100% of the dividends distributed during the fiscal year as amounts which can be taken into account as a dividend for the purposes of the maximum rate under section 1(h)(11) of the Internal Revenue Code.
The fund will notify shareholders in January 2015 of amounts for use in preparing 2014 income tax returns.
Annual Report
Board Approval of Investment Advisory Contracts and Management Fees
Fidelity Small Cap Value Fund
Each year, the Board of Trustees, including the Independent Trustees (together, the Board), votes on the renewal of the management contract with Fidelity Management & Research Company (FMR) and the sub-advisory agreements (together, the Advisory Contracts) for the fund. The Board, assisted by the advice of fund counsel and Independent Trustees' counsel, requests and considers a broad range of information relevant to the renewal of the Advisory Contracts throughout the year.
The Board meets regularly and, at each of its meetings, covers an extensive agenda of topics and materials and considers factors that are relevant to its annual consideration of the renewal of the fund's Advisory Contracts, including the services and support provided to the fund and its shareholders. The Board has established various standing committees (Committees), each composed of and chaired by Independent Trustees with varying backgrounds, to which the Board has assigned specific subject matter responsibilities in order to enhance effective decision-making by the Board. The Board, acting directly and through its Committees, requests and receives information concerning the annual consideration of the renewal of the fund's Advisory Contracts. The Board also meets as needed to consider matters specifically related to the Board's annual consideration of the renewal of the Advisory Contracts. Members of the Board may also meet with trustees of other Fidelity funds through ad hoc joint committees to discuss certain matters relevant to the Fidelity funds.
At its July 2014 meeting, the Board, including the Independent Trustees, unanimously determined to renew the fund's Advisory Contracts. In reaching its determination, the Board considered all factors it believed relevant, including (i) the nature, extent, and quality of the services to be provided to the fund and its shareholders (including the investment performance of the fund); (ii) the competitiveness of the fund's management fee and total expense ratio relative to peer funds; (iii) the total costs of the services to be provided by and the profits to be realized by Fidelity from its relationship with the fund; (iv) the extent to which economies of scale exist and would be realized as the fund grows; and (v) whether fee levels reflect these economies of scale, if any, for the benefit of fund shareholders. In connection with separate internal corporate reorganizations involving Fidelity Management & Research (U.K.) Inc. (FMR U.K.) and Fidelity Management & Research (Japan) Inc. (FMR Japan), the Board approved certain non-material amendments to the fund's sub-advisory agreements with FMR U.K. and FMR Japan to reflect that, after these reorganizations, FMR Investment Management (UK) Limited and Fidelity Management & Research (Japan) Limited will carry on the business of FMR U.K. and FMR Japan, respectively. The Board noted that no changes to the portfolio managers or to the foreign research or investment advisory services provided to the fund were expected in connection with either reorganization and that the same personnel and resources would continue to be available to the fund at the new entities.
Annual Report
Board Approval of Investment Advisory Contracts and
Management Fees - continued
In considering whether to renew the Advisory Contracts for the fund, the Board reached a determination, with the assistance of fund counsel and Independent Trustees' counsel and through the exercise of its business judgment, that the renewal of the Advisory Contracts was in the best interests of the fund and its shareholders and that the compensation payable under the Advisory Contracts was fair and reasonable. The Board's decision to renew the Advisory Contracts was not based on any single factor, but rather was based on a comprehensive consideration of all the information provided to the Board at its meetings throughout the year. The Board, in reaching its determination to renew the Advisory Contracts, was aware that shareholders of the fund have a broad range of investment choices available to them, including a wide choice among funds offered by Fidelity's competitors, and that the fund's shareholders, who have the opportunity to review and weigh the disclosure provided by the fund in its prospectus and other public disclosures, have chosen to invest in this fund, which is part of the Fidelity family of funds.
Nature, Extent, and Quality of Services Provided. The Board considered Fidelity's staffing as it relates to the fund, including the backgrounds of investment personnel of FMR and the sub-advisers (together, the Investment Advisers), and also considered the fund's investment objective, strategies, and related investment philosophy. The Independent Trustees also had discussions with senior management of Fidelity's investment operations and investment groups. The Board considered the structure of the portfolio manager compensation program and whether this structure provides appropriate incentives to act in the best interests of the fund. Additionally, the Board considered the portfolio managers' investments, if any, in the funds that they manage.
Resources Dedicated to Investment Management and Support Services. The Board and the Fund Oversight and Research Committees reviewed the general qualifications and capabilities of Fidelity's investment staff, including its size, education, experience, and resources, as well as Fidelity's approach to recruiting, training, managing, and compensating investment personnel. The Board noted that Fidelity has continued to increase the resources devoted to non-U.S. offices, including expansion of Fidelity's global investment organization. The Board also noted that Fidelity's analysts have extensive resources, tools and capabilities that allow them to conduct sophisticated quantitative and fundamental analysis, as well as credit analysis of issuers, counterparties and guarantors. Further, the Board believes that Fidelity's investment professionals have sufficient access to global information and data so as to provide competitive investment results over time, and that those professionals also have access to sophisticated tools that permit them to assess portfolio construction and risk and performance attribution characteristics continuously, as well as to transmit new information and research conclusions rapidly around the world. Additionally, in its deliberations, the Board considered Fidelity's trading and risk management capabilities and resources and global compliance infrastructure, which are an integral part of the investment management process.
Annual Report
Shareholder and Administrative Services. The Board considered (i) the nature, extent, quality, and cost of advisory, administrative, and shareholder services performed by the Investment Advisers and their affiliates under the Advisory Contracts and under separate agreements covering transfer agency, pricing and bookkeeping, and securities lending services for the fund; (ii) the nature and extent of the supervision of third party service providers, principally custodians and subcustodians; and (iii) the resources devoted to, and the record of compliance with, the fund's compliance policies and procedures. The Board also reviewed the allocation of fund brokerage, including allocations to brokers affiliated with the Investment Advisers, the use of brokerage commissions to pay fund expenses, and the use of "soft" commission dollars to pay for research services.
The Board noted that the growth of fund assets over time across the complex allows Fidelity to reinvest in the development of services designed to enhance the value or convenience of the Fidelity funds as investment vehicles. These services include 24-hour access to account information and market information through telephone representatives and over the Internet, investor education materials and asset allocation tools, and the expanded availability of Fidelity Investor Centers.
In 2014, the Board formed an ad hoc Committee on Transfer Agency Fees to review the variety of transfer agency fee structures throughout the industry and Fidelity's competitive positioning with respect to industry participants.
Investment in a Large Fund Family. The Board considered the benefits to shareholders of investing in a Fidelity fund, including the benefits of investing in a fund that is part of a large family of funds offering a variety of investment disciplines and providing a large variety of mutual fund investor services. The Board noted that Fidelity had taken, or had made recommendations that resulted in the Fidelity funds taking, a number of actions over the previous year that benefited particular funds, including (i) continuing to dedicate additional resources to investment research and to the support of the senior management team that oversees asset management; (ii) persisting in efforts to enhance Fidelity's global research capabilities; (iii) launching new funds and making other enhancements to meet client needs for income-oriented solutions; (iv) reducing fund expenses for certain index funds; (v) continuing to launch dedicated lower cost underlying funds to meet portfolio construction needs related to expanding underlying fund options for Fidelity funds of funds, specifically for the Freedom Fund product lines; (vi) rationalizing product lines and gaining increased efficiencies through fund mergers; (vii) launching sector-based exchange-traded funds and establishing a new Fidelity adviser to manage sector-based funds and products; (viii) continuing to develop and implement technology to improve security and increase efficiency; (ix) modifying the eligibility criteria for certain share classes to increase their marketability to a portion of the defined contribution plan market; (x) waiving redemption fees for certain qualified fund-of-fund and wrap programs and certain retirement plan transactions; and (xi) launching new Institutional Class shares of certain money market funds to attract and retain assets and to fill a gap in the money market fund lineup.
Annual Report
Board Approval of Investment Advisory Contracts and
Management Fees - continued
Investment Performance. The Board considered whether the fund has operated in accordance with its investment objective, as well as its record of compliance with its investment restrictions and its performance history. The Board noted that there was a portfolio management change for the fund in January 2013 and for a sleeve of the fund in August 2013.
The Board took into account discussions with the Investment Advisers about fund investment performance that occur at Board meetings throughout the year. In this regard the Board noted that as part of regularly scheduled fund reviews and other reports to the Board on fund performance, the Board periodically considers annualized return information for the fund, for different time periods, measured against a securities market index ("benchmark index") and a peer group of funds with similar objectives ("peer group"). In its evaluation of fund investment performance, the Board gave particular attention to information indicating changes in performance of certain Fidelity funds for specific time periods and the Investment Advisers' explanations for any overperformance or underperformance.
In addition to reviewing absolute and relative fund performance, the Independent Trustees periodically consider the appropriateness of fund performance metrics in evaluating the results achieved. In general, the Independent Trustees believe that fund performance should be evaluated based on net performance (after fees and expenses) of both the highest performing and lowest performing classes, where applicable, compared to appropriate benchmark indices, over appropriate time periods which may include full market cycles, and compared to peer groups, as applicable, over the same periods, taking into account relevant factors including the following: general market conditions; issuer-specific information; tactical opportunities for investment; and fund cash flows and other factors.
The Independent Trustees recognize that shareholders evaluate performance on a net basis over their own holding periods, for which one-, three-, and five-year periods are often used as a proxy. For this reason, the performance information reviewed by the Board also included net cumulative calendar year total return information for the fund and an appropriate benchmark index and peer group for the most recent one-, three-, and five-year periods, as shown below. Returns are shown compared to the 25th percentile (top of box, 75% beaten) and 75th percentile (bottom of box, 25% beaten) of the peer universe.
Annual Report
Fidelity Small Cap Value Fund

The Board also considered that the fund's management fee is subject to upward or downward adjustment depending upon whether, and to what extent, the fund's investment performance for the performance period exceeds, or is exceeded by, a securities index, thus leading to a performance adjustment for the same period. The Board noted that the performance adjustment provides FMR with a strong economic incentive to seek to achieve superior performance for the fund's shareholders and helps to more closely align the interests of FMR and the fund's shareholders.
Based on its review, the Board concluded that the nature, extent, and quality of services provided to the fund under the Advisory Contracts should benefit the fund's shareholders.
Competitiveness of Management Fee and Total Expense Ratio. The Board considered the fund's management fee and total expense ratio compared to "mapped groups" of competitive funds and classes. Fidelity creates "mapped groups" by combining similar Lipper investment objective categories that have comparable investment mandates. Combining Lipper investment objective categories aids the Board's management fee and total expense ratio comparisons by broadening the competitive group used for comparison and by reducing the number of universes to which various Fidelity funds are compared.
Management Fee. The Board considered two proprietary management fee comparisons for the 12-month periods shown in the chart below. The group of Lipper funds used by the Board for management fee comparisons is referred to below as the "Total Mapped Group." The Total Mapped Group comparison focuses on a fund's standing in terms of gross management fees before expense reimbursements or caps, and without giving effect to the fund's performance adjustment, relative to the total universe of funds with comparable investment mandates, regardless of whether their management fee structures also are comparable. Funds with comparable investment mandates offer exposure to similar types of securities. Funds with comparable management fee structures have similar management fee contractual arrangements (e.g., flat rate charged for advisory services, all-inclusive fee rate, etc.). "TMG %" represents the percentage of funds in the Total Mapped Group that had management fees that were lower than the fund's. For example, a hypothetical TMG % of 20% would mean that 80% of the funds in the Total Mapped Group had higher, and 20% had lower, management fees than the fund. The fund's actual TMG %s are in the chart below. The "Asset-Size Peer Group" (ASPG) comparison focuses on a fund's standing relative to a subset of non-Fidelity funds within the Total Mapped Group that are similar in size and management fee structure. For example, if a fund is in the first quartile of the ASPG, the fund's management fee ranks in the least expensive or lowest 25% of funds in the ASPG. The ASPG represents at least 15% of the funds in the Total Mapped Group with comparable asset size and management fee structures, subject to a minimum of 50 funds (or all funds in the Total Mapped Group if fewer than 50). Additional information, such as the ASPG quartile in which the fund's management fee rate ranked and the impact of the fund's performance adjustment, is also included in the chart and considered by the Board.
Annual Report
Board Approval of Investment Advisory Contracts and
Management Fees - continued
Fidelity Small Cap Value Fund

The Board noted that the fund's management fee rate ranked below the median of its Total Mapped Group and below the median of its ASPG for 2013. The Board also noted the effect of the fund's positive performance adjustment on the fund's management fee ranking.
Annual Report
The Board also noted that, in August 2013, the ad hoc Committee on Management Fees was formed to conduct an in-depth review of the management fee rates of Fidelity's active equity mutual funds. The Committee focused on the following areas: (i) standard fee structures; (ii) research consumption and trading evolution; (iii) management fee competitiveness/profitability by category; and (iv) factors that drive institutional pricing.
Based on its review, the Board concluded that the fund's management fee is fair and reasonable in light of the services that the fund receives and the other factors considered.
Total Expense Ratio. In its review of each class's total expense ratio, the Board considered the fund's management fee as well as other fund or class expenses, as applicable, such as transfer agent fees, pricing and bookkeeping fees, fund-paid 12b-1 fees, and custodial, legal, and audit fees. The Board also noted the effects of any waivers and reimbursements on fees and expenses, as well as the impact of the fund's performance adjustment. As part of its review, the Board also considered the current and historical total expense ratios of each class of the fund compared to competitive fund median expenses. Each class of the fund is compared to those funds and classes in the Total Mapped Group (used by the Board for management fee comparisons) that have a similar sales load structure.
The Board also considered that it had approved a transitional management fee adjustment for the fund that will decrease the fund's management fee paid each month through May 31, 2015.
The Board noted that the total expense ratio of each of Class A, Institutional Class, and the retail class ranked below its competitive median for 2013 and the total expense ratio of each of Class T, Class B, and Class C ranked above its competitive median for 2013. The Board considered that, in general, various factors can affect total expense ratios. The Board noted that the total expense ratio of Class T was above the competitive median primarily because of higher 12b-1 fees on Class T as compared to most competitor funds. Class T has a higher 12b-1 fee, but a lower front-end sales charge, than traditionally priced front-end sales charge classes. The Board considered that Class T is primarily sold load-waived in the retirement plan market where its 0.50% 12b-1 fee is comparable to competing no-load, higher 12b-1 fee classes designed specifically for retirement plans. The Board noted that the fund offers multiple classes, each of which has a different sales load and 12b-1 fee structure, and that the multiple structures are intended to offer a range of pricing options for the intermediary market. The Board also noted that the total expense ratios of the classes vary primarily by the level of their 12b-1 fees, although differences in transfer agent fees may also cause expenses to vary from class to class.
Annual Report
Board Approval of Investment Advisory Contracts and
Management Fees - continued
Fees Charged to Other Fidelity Clients. The Board also considered Fidelity fee structures and other information with respect to clients of Fidelity, such as other funds advised or subadvised by Fidelity, pension plan clients, and other institutional clients. The Board noted the findings of the 2013 ad hoc joint committee (created with the board of other Fidelity funds), which reviewed and compared Fidelity's institutional investment advisory business with its business of providing services to the Fidelity funds, including the differences in services provided, fees charged, and costs incurred, as well as competition in their respective marketplaces.
Based on its review of total expense ratios and fees charged to other Fidelity clients, the Board concluded that the total expense ratio of each class of the fund was reasonable, although in some cases above the median of the universe presented for comparison, in light of the services that the fund and its shareholders receive and the other factors considered.
Costs of the Services and Profitability. The Board considered the revenues earned and the expenses incurred by Fidelity in conducting the business of developing, marketing, distributing, managing, administering and servicing the fund and servicing the fund's shareholders. The Board also considered the level of Fidelity's profits in respect of all the Fidelity funds.
On an annual basis, Fidelity presents to the Board Fidelity's profitability for the fund. Fidelity calculates the profitability for each fund, as well as aggregate profitability for groups of Fidelity funds and all Fidelity funds, using a series of detailed revenue and cost allocation methodologies which originate with the books and records of Fidelity on which Fidelity's audited financial statements are based. The Audit Committee of the Board reviews any significant changes from the prior year's methodologies.
PricewaterhouseCoopers LLP (PwC), independent registered public accounting firm and auditor to Fidelity and certain Fidelity funds, has been engaged annually by the Board as part of the Board's assessment of Fidelity's profitability analysis. PwC's engagement includes the review and assessment of the methodologies used by Fidelity in determining the revenues and expenses attributable to Fidelity's mutual fund business, and completion of agreed-upon procedures in respect of the mathematical accuracy of fund profitability and its conformity to established allocation methodologies. After considering PwC's reports issued under the engagement and information provided by Fidelity, the Board concluded that while other allocation methods may also be reasonable, Fidelity's profitability methodologies are reasonable in all material respects.
The Board also reviewed Fidelity's non-fund businesses and fall-out benefits related to the mutual fund business as well as cases where Fidelity's affiliates may benefit from or be related to the fund's business.
Annual Report
The Board considered the costs of the services provided by and the profits realized by Fidelity in connection with the operation of the fund and was satisfied that the profitability was not excessive in the circumstances.
Economies of Scale. The Board considered whether there have been economies of scale in respect of the management of the Fidelity funds, whether the Fidelity funds (including the fund) have appropriately benefited from any such economies of scale, and whether there is potential for realization of any further economies of scale. The Board considered the extent to which the fund will benefit from economies of scale through increased services to the fund, through waivers or reimbursements, or through fee or expense ratio reductions. The Board also noted that in 2013, it and the boards of other Fidelity funds created an ad hoc committee (the Economies of Scale Committee) to analyze whether Fidelity attains economies of scale in respect of the management and servicing of the Fidelity funds, whether the Fidelity funds have appropriately benefited from such economies of scale, and whether there is potential for realization of any further economies of scale.
The Board recognized that the fund's management contract incorporates a "group fee" structure, which provides for lower group fee rates as total group assets increase, and for higher group fee rates as total group assets decrease (with "group assets" defined to include fund assets under FMR's management plus sector fund assets previously under FMR's management and currently managed by Fidelity SelectCo, LLC). FMR calculates the group fee rates based on a tiered asset "breakpoint" schedule that varies based on asset class. The Board considered that the group fee is designed to deliver the benefits of economies of scale to fund shareholders when total Fidelity fund assets increase, even if assets of any particular fund are unchanged or have declined, because some portion of Fidelity's costs are attributable to services provided to all Fidelity funds, and all funds benefit if those costs can be allocated among more assets. The Board considered that although the fund is partially closed to new investors, it continues to incur investment management expenses, and marketing and distribution expenses related to the retention of existing shareholders and assets. The Board concluded that, given the group fee structure, fund shareholders will benefit from lower management fees as group assets increase at the fund complex level, regardless of whether Fidelity achieves any such economies of scale.
The Board concluded, taking into account the analysis of the Economies of Scale Committee, that economies of scale, if any, are being appropriately shared between fund shareholders and Fidelity.
Additional Information Requested by the Board. In order to develop fully the factual basis for consideration of the Fidelity funds' Advisory Contracts, the Board requested and received additional information on certain topics, including: (i) fund performance trends and Fidelity's long-term strategies for certain funds; (ii) Fidelity's strategic marketing and product lineup goals; (iii) the methodology with respect to competitive fund data and peer group classifications; (iv) the arrangements with, and performance of, certain sub-advisers on behalf of the Fidelity funds, as well as certain proposed participating affiliate arrangements; (v) the realization of fall-out benefits in certain Fidelity business units; (vi) Fidelity's group fee structures, including the rationale for the individual fee rates of certain categories of funds and the definition of group assets; (vii) trends regarding industry use of performance fee structures and the performance adjustment methodologies applicable to the Fidelity funds; (viii) additional competitive analysis regarding the total expenses for certain classes; (ix) fund profitability methodology, including Fidelity's cost allocation methodology, and the impact of certain factors on fund profitability results; and (x) the process by which Fidelity determines sub-advisory fees for funds it advises.
Annual Report
Board Approval of Investment Advisory Contracts and
Management Fees - continued
Based on its evaluation of all of the conclusions noted above, and after considering all factors it believed relevant, the Board ultimately concluded that the advisory fee structures are fair and reasonable, and that the fund's Advisory Contracts should be renewed.
Annual Report
Investment Adviser
Fidelity Management & Research Company
Boston, MA
Investment Sub-Advisers
FMR Co., Inc.
Fidelity Management & Research
(U.K.) Inc.
Fidelity Management & Research
(Hong Kong) Limited
Fidelity Management & Research
(Japan) Inc.
General Distributor
Fidelity Distributors Corporation
Smithfield, RI
Transfer and Service Agents
Fidelity Investments Institutional
Operations Company, Inc.
Boston, MA
Fidelity Service Company, Inc.
Boston, MA
Custodian
Citibank, N.A.
New York, NY
The Fidelity Telephone Connection
Mutual Fund 24-Hour Service
Exchanges/Redemptions
and Account Assistance 1-800-544-6666
Product Information 1-800-544-6666
Retirement Accounts 1-800-544-4774
(8 a.m. - 9 p.m.)
TDD Service 1-800-544-0118
for the deaf and hearing impaired
(9 a.m. - 9 p.m. Eastern time)
Fidelity Automated Service
Telephone (FAST®)
1-800-544-5555
Automated line for quickest service
(Fidelity Investment logo)(registered trademark)
Corporate Headquarters
245 Summer St., Boston, MA 02210
www.fidelity.com
SCV-UANN-0914
1.803705.109
Fidelity®
Real Estate Income
Fund
Annual Report
July 31, 2014
(Fidelity Cover Art)
Contents
Performance | (Click Here) | How the fund has done over time. |
Management's Discussion of Fund Performance | (Click Here) | The Portfolio Manager's review of fund performance and strategy. |
Shareholder Expense Example | (Click Here) | An example of shareholder expenses. |
Investment Changes | (Click Here) | A summary of major shifts in the fund's investments over the past six months. |
Investments | (Click Here) | A complete list of the fund's investments with their market values. |
Financial Statements | (Click Here) | Statements of assets and liabilities, operations, and changes in net assets, as well as financial highlights. |
Notes | (Click Here) | Notes to the financial statements. |
Report of Independent Registered Public Accounting Firm | (Click Here) | |
Trustees and Officers | (Click Here) | |
Distributions | (Click Here) | |
Board Approval of Investment Advisory Contracts and Management Fees | (Click Here) | |
To view a fund's proxy voting guidelines and proxy voting record for the 12-month period ended June 30, visit http://www.fidelity.com/proxyvotingresults or visit the Securities and Exchange Commission's (SEC) web site at http://www.sec.gov. You may also call 1-800-544-8544 to request a free copy of the proxy voting guidelines.
Standard & Poor's, S&P and S&P 500 are registered service marks of The McGraw-Hill Companies, Inc. and have been licensed for use by Fidelity Distributors Corporation.
Other third-party marks appearing herein are the property of their respective owners.
All other marks appearing herein are registered or unregistered trademarks or service marks of FMR LLC or an affiliated company. © 2014 FMR LLC. All rights reserved.
Annual Report
This report and the financial statements contained herein are submitted for the general information of the shareholders of the fund. This report is not authorized for distribution to prospective investors in the fund unless preceded or accompanied by an effective prospectus.
A fund files its complete schedule of portfolio holdings with the SEC for the first and third quarters of each fiscal year on Form N-Q. Forms N-Q are available on the SEC's web site at http://www.sec.gov. A fund's Forms N-Q may be reviewed and copied at the SEC's Public Reference Room in Washington, DC. Information regarding the operation of the SEC's Public Reference Room may be obtained by calling 1-800-SEC-0330. For a complete list of a fund's portfolio holdings, view the most recent holdings listing, semiannual report, or annual report on Fidelity's web site at http://www.fidelity.com, http://www.advisor.fidelity.com, or http://www.401k.com, as applicable.
NOT FDIC INSURED • MAY LOSE VALUE • NO BANK GUARANTEE
Neither the fund nor Fidelity Distributors Corporation is a bank.
Annual Report
Average annual total return reflects the change in the value of an investment, assuming reinvestment of the class' distributions from dividend income and capital gains (the profits earned upon the sale of securities that have grown in value, if any) and assuming a constant rate of performance each year. The $10,000 table and the fund's returns do not reflect the deduction of taxes that a shareholder would pay on fund distributions or the redemption of fund shares. During periods of reimbursement by Fidelity, a fund's total return will be greater than it would be had the reimbursement not occurred. How a fund did yesterday is no guarantee of how it will do tomorrow.
Average Annual Total Returns
Periods ended July 31, 2014 | Past 1
year | Past 5
years | Past 10 years |
Fidelity® Real Estate Income Fund | 8.78% | 14.33% | 7.23% |
$10,000 Over 10 Years
Let's say hypothetically that $10,000 was invested in Fidelity® Real Estate Income Fund, a class of the fund, on July 31, 2004. The chart shows how the value of your investment would have changed, and also shows how the S&P 500® Index performed over the same period.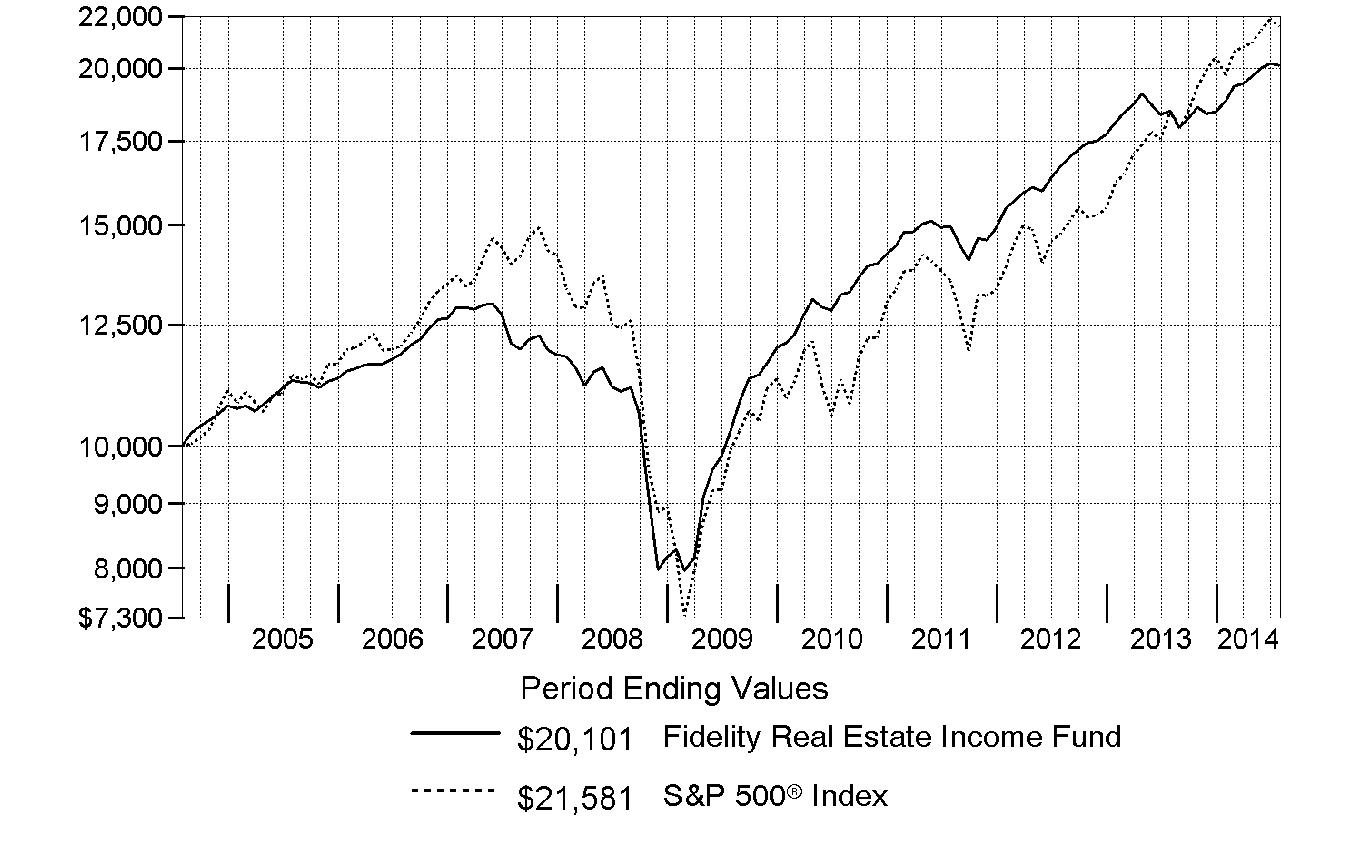
Annual Report
Market Recap: The fundamental backdrop for commercial real estate remained solid throughout the 12 months ending July 31, 2014. Continued favorable demand across most sectors and geographic markets, along with limited new construction, led to rising occupancies. In turn, this led to gently rising rents and cash flow for real estate owners, including real estate investment trusts (REITs). Investors' continued search for yield in a low-interest-rate environment - rates ended the 12-month period roughly at their starting point - helped further boost the performance of multiple types of real estate securities. For the full 12 months, REIT stocks, as measured by the FTSE® NAREIT® All REITs Index, gained 12.90%, with the vast majority of that increase coming in the second half of the period. The MSCI REIT Preferred Index, which reflects the performance of real estate preferred stocks, added 9.62%. On the fixed-income side, The BofA Merrill LynchSM US Real Estate Index - a market-capitalization-weighted measure of investment-grade corporate debt in the domestic real estate sector - advanced 6.67%, benefiting partly from narrowing credit spreads that helped compensate for rising interest rates in the first half of the 12-month period. In comparison, the S&P 500® Index, a proxy for the broad U.S. stock market, was up 16.94%.
Comments from Mark Snyderman, Portfolio Manager of Fidelity® Real Estate Income Fund: For the year, the fund's Retail Class shares gained 8.78%, which I consider a good absolute return for a 12-month period. In comparison, however, the Fidelity Real Estate Income Composite IndexSM - a 40/40/20 blend of the MSCI REIT Preferred Index, The BofA Merrill LynchSM US Real Estate Index and the FTSE® NAREIT® All REITs Index, respectively - added 9.17%. Most of the categories in which the fund invests did well. The fund's REIT common stock holdings essentially matched the 13% gain in the FTSE® NAREIT® index. Its preferred stocks added about 11%, outpacing the MSCI preferred stock index. On the portfolio's fixed-income side, the fund did particularly well with its commercial mortgage backed securities investments, which rose roughly 11%, compared with approximately 7% for the BofA Merrill Lynch real estate bond index. The fund's high-yield real estate bond picks modestly outpaced this measure, while its investment-grade bonds lagged. Meanwhile, the fund was hampered by a cash position of 8%, on average. I like to hold enough cash to take advantage of attractive buying opportunities when others must sell; unfortunately, the size of the portfolio's stake here was a drag on results in a rising market during the period.
The views expressed above reflect those of the portfolio manager(s) only through the end of the period as stated on the cover of this report and do not necessarily represent the views of Fidelity or any other person in the Fidelity organization. Any such views are subject to change at any time based upon market or other conditions and Fidelity disclaims any responsibility to update such views. These views may not be relied on as investment advice and, because investment decisions for a Fidelity fund are based on numerous factors, may not be relied on as an indication of trading intent on behalf of any Fidelity fund.
Annual Report
Shareholder Expense Example
As a shareholder of the Fund, you incur two types of costs: (1) transaction costs, including sales charges (loads) on purchase payments or redemption proceeds, redemption fees and (2) ongoing costs, including management fees, distribution and/or service (12b-1) fees and other Fund expenses. This Example is intended to help you understand your ongoing costs (in dollars) of investing in the Fund and to compare these costs with the ongoing costs of investing in other mutual funds.
The Example is based on an investment of $1,000 invested at the beginning of the period and held for the entire period (February 1, 2014 to July 31, 2014).
Actual Expenses
The first line of the accompanying table for each class of the Fund provides information about actual account values and actual expenses. You may use the information in this line, together with the amount you invested, to estimate the expenses that you paid over the period. Simply divide your account value by $1,000.00 (for example, an $8,600 account value divided by $1,000.00 = 8.6), then multiply the result by the number in the first line for a class of the Fund under the heading entitled "Expenses Paid During Period" to estimate the expenses you paid on your account during this period. A small balance maintenance fee of $12.00 that is charged once a year may apply for certain accounts with a value of less than $2,000. This fee is not included in the table below. If it was, the estimate of expenses you paid during the period would be higher, and your ending account value lower, by this amount. In addition, the Fund, as a shareholder in the underlying Fidelity Central Funds, will indirectly bear its pro-rata share of the fees and expenses incurred by the underlying Fidelity Central Funds. These fees and expenses are not included in the Fund's annualized expense ratio used to calculate the expense estimate in the table below.
Hypothetical Example for Comparison Purposes
The second line of the accompanying table for each class of the Fund provides information about hypothetical account values and hypothetical expenses based on a Class' actual expense ratio and an assumed rate of return of 5% per year before expenses, which is not the Class' actual return. The hypothetical account values and expenses may not be used to estimate the actual ending account balance or expenses you paid for the period. You may use this information to compare the ongoing costs of investing in the Fund and other funds. To do so, compare this 5% hypothetical example with the 5% hypothetical examples that appear in the shareholder reports of the other funds. A small balance maintenance fee of $12.00 that is charged once a year may apply for certain accounts with a value of less than $2,000. This fee is not included in the table below. If it was, the estimate of expenses you paid during the period would be higher, and your ending account value lower, by this amount. In addition, the Fund, as a shareholder in the underlying Fidelity Central Funds, will indirectly bear its pro-rata share of the fees and expenses incurred by the underlying Fidelity Central Funds. These fees and expenses are not included in the Fund's annualized expense ratio used to calculate the expense estimate in the table below.
Please note that the expenses shown in the table are meant to highlight your ongoing costs only and do not reflect any transaction costs. Therefore, the second line of the table is useful in comparing ongoing costs only, and will not help you determine the relative total costs of owning different funds. In addition, if these transactional costs were included, your costs would have been higher.
Annual Report
Shareholder Expense Example - continued
| Annualized
Expense RatioB | Beginning
Account Value
February 1, 2014 | Ending
Account Value
July 31, 2014 | Expenses Paid
During Period*
February 1, 2014
to July 31, 2014 |
Class A | 1.05% | | | |
Actual | | $ 1,000.00 | $ 1,065.30 | $ 5.38 |
HypotheticalA | | $ 1,000.00 | $ 1,019.59 | $ 5.26 |
Class T | 1.08% | | | |
Actual | | $ 1,000.00 | $ 1,065.10 | $ 5.53 |
HypotheticalA | | $ 1,000.00 | $ 1,019.44 | $ 5.41 |
Class C | 1.79% | | | |
Actual | | $ 1,000.00 | $ 1,061.70 | $ 9.15 |
HypotheticalA | | $ 1,000.00 | $ 1,015.92 | $ 8.95 |
Real Estate Income | .83% | | | |
Actual | | $ 1,000.00 | $ 1,066.80 | $ 4.25 |
HypotheticalA | | $ 1,000.00 | $ 1,020.68 | $ 4.16 |
Institutional Class | .78% | | | |
Actual | | $ 1,000.00 | $ 1,066.30 | $ 4.00 |
HypotheticalA | | $ 1,000.00 | $ 1,020.93 | $ 3.91 |
A 5% return per year before expenses
B Annualized expense ratio reflects expenses net of applicable fee waivers.
* Expenses are equal to each Class' annualized expense ratio, multiplied by the average account value over the period, multiplied by 181/365 (to reflect the one-half year period).
Annual Report
Investment Changes (Unaudited)
Top Five Stocks as of July 31, 2014 |
| % of fund's
net assets | % of fund's net assets
6 months ago |
MFA Financial, Inc. | 3.2 | 3.0 |
Equity Lifestyle Properties, Inc. | 2.7 | 2.7 |
Acadia Realty Trust (SBI) | 2.4 | 2.2 |
Ventas, Inc. | 1.6 | 1.7 |
Lexington Corporate Properties Trust | 1.1 | 1.0 |
| 11.0 | |
Top 5 Bonds as of July 31, 2014 |
| % of fund's
net assets | % of fund's net assets
6 months ago |
Realogy Group LLC Tranche B, term loan 3.75% 3/5/20 | 0.9 | 0.8 |
Standard Pacific Corp. 8.375% 5/15/18 | 0.8 | 0.9 |
Annaly Capital Management, Inc. 5% 5/15/15 | 0.8 | 0.9 |
Hilton Worldwide Finance, LLC Tranche B, term loan 3.5% 10/25/20 | 0.7 | 0.3 |
iStar Financial, Inc. 5.875% 3/15/16 | 0.7 | 1.0 |
| 3.9 | |
Top Five REIT Sectors as of July 31, 2014 |
| % of fund's
net assets | % of fund's net assets
6 months ago |
REITs - Mortgage | 17.3 | 16.0 |
REITs - Management/Investment | 9.0 | 8.9 |
REITs - Health Care Facilities | 6.9 | 6.1 |
REITs - Shopping Centers | 6.3 | 6.1 |
REITs - Apartments | 4.9 | 5.0 |
Asset Allocation (% of fund's net assets) |
As of July 31, 2014* | As of January 31, 2014** |
 | Common Stocks 31.4% | | | Common Stocks 31.6% | |
 | Preferred Stocks 16.7% | | | Preferred Stocks 14.5% | |
 | Bonds 32.8% | | | Bonds 34.3% | |
 | Convertible
Securities 4.5% | | | Convertible
Securities 4.0% | |
 | Other Investments 7.8% | | | Other Investments 8.6% | |
 | Short-Term
Investments and
Net Other Assets
(Liabilities) 6.8% | | | Short-Term
Investments and
Net Other Assets
(Liabilities) 7.0% | |
* Foreign investments | 2.6% | | ** Foreign investments | 3.2% | |

Annual Report
Investments July 31, 2014
Showing Percentage of Net Assets
Common Stocks - 31.4% |
| Shares | | Value |
CONSUMER DISCRETIONARY - 0.2% |
Household Durables - 0.2% |
Stanley Martin Communities LLC Class B (a)(m) | 4,620 | | $ 6,928,291 |
Media - 0.0% |
New Media Investment Group, Inc. | 2 | | 30 |
TOTAL CONSUMER DISCRETIONARY | | 6,928,321 |
FINANCIALS - 31.0% |
Capital Markets - 0.5% |
Ellington Financial LLC | 950,100 | | 22,517,370 |
Real Estate Investment Trusts - 29.8% |
Acadia Realty Trust (SBI) (g) | 3,500,149 | | 98,809,206 |
AG Mortgage Investment Trust, Inc. | 781,700 | | 14,336,378 |
American Tower Corp. | 184,300 | | 17,396,077 |
Annaly Capital Management, Inc. | 826,600 | | 9,175,260 |
Anworth Mortgage Asset Corp. | 1,572,210 | | 7,986,827 |
Apartment Investment & Management Co. Class A | 1,268,100 | | 43,343,658 |
Arbor Realty Trust, Inc. (g) | 3,068,975 | | 21,697,653 |
Associated Estates Realty Corp. | 224,208 | | 3,961,755 |
AvalonBay Communities, Inc. | 191,400 | | 28,342,512 |
BioMed Realty Trust, Inc. | 1,058,200 | | 22,751,300 |
Blackstone Mortgage Trust, Inc. | 75,200 | | 2,140,944 |
Boardwalk (REIT) | 126,200 | | 7,511,698 |
Canadian (REIT) | 131,600 | | 5,524,219 |
CBL & Associates Properties, Inc. | 2,202,873 | | 41,193,725 |
Cedar Shopping Centers, Inc. | 1,208,910 | | 7,616,133 |
Chambers Street Properties | 1,457,593 | | 11,340,074 |
Chartwell Retirement Residence | 459,700 | | 4,553,364 |
Chartwell Retirement Residence (a)(h) | 78,500 | | 777,548 |
CYS Investments, Inc. | 2,094,739 | | 18,601,282 |
Douglas Emmett, Inc. | 689,600 | | 19,646,704 |
Dynex Capital, Inc. | 1,989,943 | | 16,516,527 |
EastGroup Properties, Inc. | 101,500 | | 6,329,540 |
Ellington Residential Mortgage REIT | 260,000 | | 4,238,000 |
Equity Lifestyle Properties, Inc. | 2,511,560 | | 111,236,992 |
Equity Residential (SBI) | 306,700 | | 19,828,155 |
Excel Trust, Inc. | 1,742,628 | | 22,567,033 |
Extra Space Storage, Inc. | 155,200 | | 8,028,496 |
First Potomac Realty Trust | 1,381,615 | | 18,223,502 |
Five Oaks Investment Corp. | 400,000 | | 4,424,000 |
H&R REIT/H&R Finance Trust | 375,100 | | 7,957,136 |
Hatteras Financial Corp. | 685,100 | | 13,119,665 |
Common Stocks - continued |
| Shares | | Value |
FINANCIALS - continued |
Real Estate Investment Trusts - continued |
Highwoods Properties, Inc. (SBI) | 139,400 | | $ 5,864,558 |
Lexington Corporate Properties Trust | 4,174,382 | | 45,667,739 |
Liberty Property Trust (SBI) | 192,300 | | 6,763,191 |
LTC Properties, Inc. | 452,913 | | 17,360,155 |
MFA Financial, Inc. | 16,292,993 | | 132,624,945 |
Mid-America Apartment Communities, Inc. | 612,400 | | 42,819,008 |
Monmouth Real Estate Investment Corp. Class A (f) | 1,197,173 | | 12,306,938 |
National Retail Properties, Inc. | 232,200 | | 8,259,354 |
Newcastle Investment Corp. | 4,850,400 | | 21,681,288 |
NorthStar Realty Finance Corp. | 377,400 | | 6,076,140 |
Piedmont Office Realty Trust, Inc. Class A | 850,200 | | 16,536,390 |
Potlatch Corp. | 40,500 | | 1,672,650 |
Prologis, Inc. | 499,487 | | 20,384,064 |
Redwood Trust, Inc. (f) | 555,100 | | 10,535,798 |
Select Income (REIT) | 456,300 | | 12,662,325 |
Senior Housing Properties Trust (SBI) | 1,562,300 | | 35,714,178 |
Simon Property Group, Inc. | 171,600 | | 28,861,404 |
Stag Industrial, Inc. | 321,769 | | 7,349,204 |
Terreno Realty Corp. | 1,484,064 | | 27,751,997 |
Two Harbors Investment Corp. | 1,721,280 | | 17,608,694 |
Ventas, Inc. | 1,025,546 | | 65,122,171 |
Washington Prime Group, Inc. (a) | 442,350 | | 8,355,992 |
Washington REIT (SBI) | 426,700 | | 11,572,104 |
Weyerhaeuser Co. (f) | 741,400 | | 23,220,648 |
WP Carey, Inc. | 597,900 | | 39,299,967 |
| | 1,245,246,265 |
Real Estate Management & Development - 0.7% |
Brookfield Asset Management, Inc. Class A | 257,600 | | 11,491,415 |
Kennedy-Wilson Holdings, Inc. | 664,021 | | 15,538,091 |
| | 27,029,506 |
TOTAL FINANCIALS | | 1,294,793,141 |
Common Stocks - continued |
| Shares | | Value |
MATERIALS - 0.2% |
Paper & Forest Products - 0.2% |
West Fraser Timber Co. Ltd. | 231,400 | | $ 10,541,237 |
TOTAL COMMON STOCKS (Cost $1,148,245,642) |
1,312,262,699
|
Preferred Stocks - 17.6% |
| | | |
Convertible Preferred Stocks - 0.9% |
FINANCIALS - 0.9% |
Real Estate Investment Trusts - 0.9% |
Alexandria Real Estate Equities, Inc. Series D 7.00% | 195,000 | | 5,313,750 |
Excel Trust, Inc. 7.00% (h) | 248,200 | | 6,515,250 |
Health Care REIT, Inc. Series I, 6.50% | 46,800 | | 2,737,800 |
Lexington Corporate Properties Trust Series C, 6.50% | 396,880 | | 18,712,892 |
Ramco-Gershenson Properties Trust (SBI) Series D, 7.25% | 40,000 | | 2,451,600 |
Weyerhaeuser Co. Series A, 6.375% | 20,000 | | 1,080,624 |
| | 36,811,916 |
Nonconvertible Preferred Stocks - 16.7% |
CONSUMER DISCRETIONARY - 0.1% |
Hotels, Restaurants & Leisure - 0.1% |
Red Lion Hotels Capital Trust 9.50% | 143,030 | | 3,727,362 |
FINANCIALS - 16.6% |
Capital Markets - 0.1% |
Arlington Asset Investment Corp. 6.625% | 182,517 | | 4,409,611 |
Real Estate Investment Trusts - 16.3% |
AG Mortgage Investment Trust, Inc. 8.00% | 461,387 | | 11,082,516 |
Alexandria Real Estate Equities, Inc. Series E, 6.45% | 145,913 | | 3,687,222 |
American Capital Agency Corp.: | | | |
8.00% | 200,000 | | 5,170,000 |
Series B, 7.75% | 360,200 | | 8,785,278 |
American Capital Mortgage Investment Corp. Series A, 8.125% | 248,636 | | 6,243,250 |
American Home Mortgage Investment Corp.: | | | |
Series A, 9.375% (a) | 120,300 | | 12 |
Series B, 9.25% (a) | 124,100 | | 12 |
American Homes 4 Rent: | | | |
Series A, 5.00% | 224,979 | | 5,579,479 |
Series B, 5.00% | 149,525 | | 3,645,420 |
Preferred Stocks - continued |
| Shares | | Value |
Nonconvertible Preferred Stocks - continued |
FINANCIALS - continued |
Real Estate Investment Trusts - continued |
American Homes 4 Rent: - continued | | | |
Series C, 5.50% | 485,000 | | $ 12,008,600 |
American Realty Capital Properties, Inc. Series F, 6.70% | 300,409 | | 6,984,509 |
Annaly Capital Management, Inc.: | | | |
Series A, 7.875% | 134,900 | | 3,419,715 |
Series C, 7.625% | 162,837 | | 3,974,851 |
Series D, 7.50% | 310,731 | | 7,497,939 |
Anworth Mortgage Asset Corp. Series A, 8.625% | 309,630 | | 7,836,735 |
Apollo Commercial Real Estate Finance, Inc. Series A, 8.625% | 375,101 | | 9,876,409 |
Apollo Residential Mortgage, Inc. Series A, 8.00% | 279,276 | | 6,758,479 |
Arbor Realty Trust, Inc.: | | | |
7.375% (a)(g) | 330,605 | | 8,162,637 |
Series A, 8.25% (g) | 189,089 | | 4,727,225 |
Series B, 7.75% (g) | 240,000 | | 5,882,400 |
Series C, 8.50% (g) | 100,000 | | 2,525,000 |
Armour Residential REIT, Inc. Series B, 7.875% | 153,654 | | 3,727,646 |
Ashford Hospitality Trust, Inc.: | | | |
Series D, 8.45% | 47,000 | | 1,200,850 |
Series E, 9.00% | 140,751 | | 3,814,352 |
Boston Properties, Inc. 5.25% | 10,915 | | 256,503 |
Brandywine Realty Trust Series E, 6.90% | 95,000 | | 2,512,750 |
Campus Crest Communities, Inc. Series A, 8.00% | 248,431 | | 6,372,255 |
Capstead Mortgage Corp. Series E, 7.50% | 202,984 | | 4,885,622 |
CBL & Associates Properties, Inc.: | | | |
Series D, 7.375% | 289,876 | | 7,261,394 |
Series E, 6.625% | 197,063 | | 4,812,278 |
Cedar Shopping Centers, Inc. Series B, 7.25% | 399,750 | | 10,185,630 |
CenterPoint Properties Trust Series D, 5.377% | 3,575 | | 2,609,750 |
Chesapeake Lodging Trust Series A, 7.75% | 266,916 | | 6,985,192 |
Colony Financial, Inc.: | | | |
Series A, 8.50% | 282,171 | | 7,378,772 |
Series B, 7.50% | 80,000 | | 1,944,800 |
CommonWealth REIT: | | | |
7.50% | 93,300 | | 1,893,057 |
Series E, 7.25% | 648,952 | | 16,846,794 |
Coresite Realty Corp. Series A, 7.25% | 369,799 | | 9,481,646 |
Corporate Office Properties Trust Series L, 7.375% | 161,840 | | 4,212,695 |
CubeSmart Series A, 7.75% | 40,000 | | 1,065,200 |
Preferred Stocks - continued |
| Shares | | Value |
Nonconvertible Preferred Stocks - continued |
FINANCIALS - continued |
Real Estate Investment Trusts - continued |
CYS Investments, Inc.: | | | |
Series A, 7.75% | 117,824 | | $ 2,880,797 |
Series B, 7.50% | 446,667 | | 10,527,941 |
DDR Corp.: | | | |
Series J, 6.50% | 340,721 | | 8,575,948 |
Series K, 6.25% | 228,888 | | 5,594,023 |
Digital Realty Trust, Inc.: | | | |
Series E, 7.00% | 219,819 | | 5,585,601 |
Series G, 5.875% | 145,444 | | 3,217,221 |
Series H, 7.375% | 50,000 | | 1,277,500 |
Duke Realty LP Series L, 6.60% | 10,666 | | 270,383 |
DuPont Fabros Technology, Inc. Series B, 7.625% | 381,202 | | 9,686,343 |
Dynex Capital, Inc.: | | | |
Series A, 8.50% | 362,932 | | 9,073,300 |
Series B, 7.625% | 252,120 | | 6,048,359 |
Equity Lifestyle Properties, Inc. Series C, 6.75% | 950,148 | | 24,504,317 |
Essex Property Trust, Inc. Series H, 7.125% | 40,000 | | 1,068,000 |
Excel Trust, Inc. Series B, 8.125% | 400,000 | | 10,428,000 |
First Potomac Realty Trust 7.75% | 415,296 | | 10,859,990 |
Five Oaks Investment Corp. Series A, 8.75% | 100,000 | | 2,517,000 |
General Growth Properties, Inc. Series A, 6.375% | 166,463 | | 4,028,405 |
Gladstone Commercial Corp. Series C, 7.125% | 232,238 | | 5,996,385 |
Glimcher Realty Trust: | | | |
6.875% | 256,115 | | 6,472,026 |
Series G, 8.125% | 109,192 | | 2,759,282 |
Series H, 7.50% | 198,527 | | 5,360,229 |
Hatteras Financial Corp. Series A, 7.625% | 353,288 | | 8,372,926 |
Health Care REIT, Inc. Series J, 6.50% | 81,600 | | 2,098,752 |
Hersha Hospitality Trust: | | | |
Series B, 8.00% | 162,538 | | 4,320,260 |
Series C, 6.875% | 50,000 | | 1,267,000 |
Hospitality Properties Trust Series D, 7.125% | 40,800 | | 1,039,584 |
Hudson Pacific Properties, Inc. 8.375% | 394,069 | | 10,442,829 |
Inland Real Estate Corp. Series A, 8.125% | 423,500 | | 11,032,175 |
Invesco Mortgage Capital, Inc. Series A, 7.75% | 123,342 | | 3,004,611 |
Investors Real Estate Trust Series B, 7.95% | 126,572 | | 3,319,984 |
iStar Financial, Inc.: | | | |
Series E, 7.875% | 188,696 | | 4,692,870 |
Series F, 7.80% | 393,843 | | 9,727,922 |
Preferred Stocks - continued |
| Shares | | Value |
Nonconvertible Preferred Stocks - continued |
FINANCIALS - continued |
Real Estate Investment Trusts - continued |
Kilroy Realty Corp.: | | | |
Series G, 6.875% | 46,760 | | $ 1,212,954 |
Series H, 6.375% | 143,296 | | 3,540,844 |
Kite Realty Group Trust 8.25% | 96,100 | | 2,499,561 |
LaSalle Hotel Properties: | | | |
Series H, 7.50% | 141,308 | | 3,710,748 |
Series I, 6.375% | 354,698 | | 8,828,433 |
LBA Realty Fund II: | | | |
Series A, 8.75% (a) | 69,000 | | 3,122,250 |
Series B, 7.625% | 31,240 | | 687,280 |
MFA Financial, Inc.: | | | |
8.00% | 538,930 | | 13,850,501 |
Series B, 7.50% | 592,024 | | 14,196,736 |
Monmouth Real Estate Investment Corp.: | | | |
Series A, 7.625% | 80,000 | | 2,042,400 |
Series B, 7.875% | 95,000 | | 2,493,750 |
National Retail Properties, Inc.: | | | |
5.70% | 376,404 | | 8,819,146 |
Series D, 6.625% | 222,138 | | 5,586,771 |
New York Mortgage Trust, Inc. Series B, 7.75% | 171,101 | | 4,055,094 |
NorthStar Realty Finance Corp.: | | | |
Series B, 8.25% | 225,708 | | 5,642,700 |
Series C, 8.875% | 275,338 | | 7,032,133 |
Series D, 8.50% | 207,301 | | 5,207,401 |
Series E, 8.75% | 313,780 | | 7,916,669 |
Pebblebrook Hotel Trust: | | | |
Series A, 7.875% | 412,000 | | 10,835,600 |
Series B, 8.00% | 185,085 | | 4,919,559 |
Series C, 6.50% | 178,160 | | 4,373,828 |
Pennsylvania (REIT) 7.375% | 100,510 | | 2,591,148 |
Prologis, Inc. Series Q, 8.54% | 94,446 | | 6,133,087 |
PS Business Parks, Inc.: | | | |
Series R, 6.875% | 116,903 | | 3,003,238 |
Series S, 6.45% | 39,500 | | 977,625 |
Series T, 6.00% | 198,004 | | 4,702,595 |
Series U, 5.75% | 600 | | 13,770 |
RAIT Financial Trust 7.625% | 216,190 | | 5,316,112 |
Regency Centers Corp.: | | | |
Series 6, 6.625% | 87,261 | | 2,260,060 |
Preferred Stocks - continued |
| Shares | | Value |
Nonconvertible Preferred Stocks - continued |
FINANCIALS - continued |
Real Estate Investment Trusts - continued |
Regency Centers Corp.: - continued | | | |
Series 7, 6.00% | 123,000 | | $ 2,955,690 |
Resource Capital Corp. 8.625% | 117,847 | | 2,873,110 |
Retail Properties America, Inc. 7.00% | 394,411 | | 9,907,604 |
Sabra Health Care REIT, Inc. Series A, 7.125% | 298,123 | | 7,763,123 |
Saul Centers, Inc.: | | | |
Series A, 8.00% | 38,072 | | 989,872 |
Series C, 6.875% | 315,478 | | 7,886,950 |
Senior Housing Properties Trust 5.625% | 283,543 | | 6,544,172 |
Stag Industrial, Inc.: | | | |
Series A, 9.00% | 280,000 | | 7,761,600 |
Series B, 6.625% | 80,300 | | 1,989,031 |
Strategic Hotel & Resorts, Inc. Series B, 8.25% | 80,000 | | 2,044,800 |
Summit Hotel Properties, Inc.: | | | |
Series A, 9.25% | 138,340 | | 3,804,350 |
Series B, 7.875% | 190,173 | | 4,954,007 |
Series C, 7.125% | 153,212 | | 3,851,750 |
Sun Communities, Inc. Series A, 7.125% | 375,000 | | 9,626,250 |
Sunstone Hotel Investors, Inc. Series D, 8.00% | 129,723 | | 3,458,415 |
Taubman Centers, Inc. Series K, 6.25% | 96,120 | | 2,354,940 |
Terreno Realty Corp. Series A, 7.75% | 213,690 | | 5,528,160 |
UMH Properties, Inc. Series A, 8.25% | 600,000 | | 15,840,000 |
Urstadt Biddle Properties, Inc. Series F, 7.125% | 210,000 | | 5,344,500 |
Vornado Realty LP 7.875% | 54,682 | | 1,392,204 |
Weingarten Realty Investors (SBI) Series F, 6.50% | 49,813 | | 1,255,786 |
Winthrop Realty Trust 7.75% | 379,600 | | 9,774,700 |
| | 680,817,844 |
Real Estate Management & Development - 0.2% |
Kennedy-Wilson, Inc. 7.75% | 321,574 | | 8,200,137 |
TOTAL FINANCIALS | | 693,427,592 |
TOTAL NONCONVERTIBLE PREFERRED STOCKS | | 697,154,954 |
TOTAL PREFERRED STOCKS (Cost $716,293,737) |
733,966,870
|
Corporate Bonds - 20.9% |
| Principal
Amount (e) | | Value |
Convertible Bonds - 3.6% |
CONSUMER DISCRETIONARY - 0.1% |
Hotels, Restaurants & Leisure - 0.1% |
Morgans Hotel Group Co. 2.375% 10/15/14 | | $ 4,510,000 | | $ 4,476,175 |
FINANCIALS - 3.5% |
Consumer Finance - 0.0% |
Zais Financial Partners LP 8% 11/15/16 (h) | | 2,000,000 | | 2,062,714 |
Diversified Financial Services - 0.6% |
IAS Operating Partnership LP 5% 3/15/18 (h) | | 25,380,000 | | 24,877,578 |
Real Estate Investment Trusts - 2.8% |
Annaly Capital Management, Inc. 5% 5/15/15 | | 31,396,000 | | 31,906,185 |
Apollo Commercial Real Estate Finance, Inc. 5.5% 3/15/19 | | 3,980,000 | | 4,223,974 |
Ares Commercial Real Estate Corp. 7% 12/15/15 | | 14,700,000 | | 15,214,500 |
Blackstone Mortgage Trust, Inc. 5.25% 12/1/18 | | 5,750,000 | | 6,156,525 |
Campus Crest Communities Operating Partnership LP 4.75% 10/15/18 (h) | | 9,000,000 | | 8,797,500 |
Colony Financial, Inc.: | | | | |
3.875% 1/15/21 | | 9,910,000 | | 10,052,456 |
5% 4/15/23 | | 9,000,000 | | 9,364,500 |
PennyMac Corp. 5.375% 5/1/20 | | 6,000,000 | | 5,950,476 |
RAIT Financial Trust 4% 10/1/33 | | 11,000,000 | | 10,518,750 |
Redwood Trust, Inc. 4.625% 4/15/18 | | 8,500,000 | | 8,755,000 |
Spirit Realty Capital, Inc. 3.75% 5/15/21 | | 4,800,000 | | 4,854,000 |
| | 115,793,866 |
Real Estate Management & Development - 0.1% |
Forest City Enterprises, Inc. 3.625% 8/15/20 | | 2,000,000 | | 2,090,000 |
Grubb & Ellis Co. 7.95% 5/1/15 (d)(h) | | 5,500,000 | | 1 |
| | 2,090,001 |
TOTAL FINANCIALS | | 144,824,159 |
TOTAL CONVERTIBLE BONDS | | 149,300,334 |
Nonconvertible Bonds - 17.3% |
CONSUMER DISCRETIONARY - 5.3% |
Hotels, Restaurants & Leisure - 0.7% |
FelCor Lodging LP: | | | | |
5.625% 3/1/23 | | 2,000,000 | | 2,000,000 |
6.75% 6/1/19 | | 5,875,000 | | 6,139,375 |
Corporate Bonds - continued |
| Principal
Amount (e) | | Value |
Nonconvertible Bonds - continued |
CONSUMER DISCRETIONARY - continued |
Hotels, Restaurants & Leisure - continued |
Hilton Worldwide Finance LLC/Hilton Worldwide Finance Corp. 5.625% 10/15/21 (h) | | $ 4,000,000 | | $ 4,190,000 |
Paris Las Vegas Holding LLC/Harrah's Las Vegas LLC/Flamingo Las Vegas Holdings, Inc. 8% 10/1/20 (h) | | 4,500,000 | | 4,612,500 |
Playa Resorts Holding BV 8% 8/15/20 (h) | | 1,230,000 | | 1,297,650 |
RHP Hotel Properties LP/RHP Finance Co. 5% 4/15/21 | | 2,000,000 | | 1,985,000 |
Times Square Hotel Trust 8.528% 8/1/26 (h) | | 8,328,905 | | 10,443,093 |
| | 30,667,618 |
Household Durables - 4.6% |
Ashton Woods U.S.A. LLC/Ashton Woods Finance Co. 6.875% 2/15/21 (h) | | 10,500,000 | | 10,237,500 |
Brookfield Residential Properties, Inc./Brookfield Residential U.S. Corp. 6.125% 7/1/22 (h) | | 1,000,000 | | 1,025,000 |
Brookfield Residential Properties, Inc. 6.5% 12/15/20 (h) | | 1,615,000 | | 1,693,731 |
D.R. Horton, Inc.: | | | | |
4.375% 9/15/22 | | 4,175,000 | | 4,112,375 |
4.75% 5/15/17 | | 2,000,000 | | 2,095,000 |
5.75% 8/15/23 | | 2,510,000 | | 2,648,050 |
KB Home: | | | | |
8% 3/15/20 | | 8,465,000 | | 9,586,613 |
9.1% 9/15/17 | | 4,985,000 | | 5,782,600 |
Lennar Corp.: | | | | |
4.125% 12/1/18 | | 5,520,000 | | 5,547,600 |
4.5% 6/15/19 | | 1,830,000 | | 1,830,000 |
5.6% 5/31/15 | | 6,000,000 | | 6,186,300 |
6.5% 4/15/16 | | 4,000,000 | | 4,250,000 |
6.95% 6/1/18 | | 14,280,000 | | 15,904,350 |
M/I Homes, Inc. 8.625% 11/15/18 | | 26,055,000 | | 27,390,319 |
Meritage Homes Corp.: | | | | |
7% 4/1/22 | | 7,525,000 | | 8,221,063 |
7.15% 4/15/20 | | 7,060,000 | | 7,783,650 |
Ryland Group, Inc.: | | | | |
6.625% 5/1/20 | | 1,555,000 | | 1,663,850 |
8.4% 5/15/17 | | 5,420,000 | | 6,233,000 |
Standard Pacific Corp.: | | | | |
7% 8/15/15 | | 4,000,000 | | 4,170,000 |
8.375% 5/15/18 | | 28,983,000 | | 33,257,993 |
Corporate Bonds - continued |
| Principal
Amount (e) | | Value |
Nonconvertible Bonds - continued |
CONSUMER DISCRETIONARY - continued |
Household Durables - continued |
Standard Pacific Corp.: - continued | | | | |
10.75% 9/15/16 | | $ 8,415,000 | | $ 9,761,400 |
Toll Brothers Finance Corp. 5.875% 2/15/22 | | 1,550,000 | | 1,662,375 |
WCI Communities, Inc. 6.875% 8/15/21 (h) | | 1,845,000 | | 1,891,125 |
William Lyon Homes, Inc.: | | | | |
7% 8/15/22 (h)(i) | | 2,505,000 | | 2,505,000 |
8.5% 11/15/20 | | 15,550,000 | | 17,143,875 |
| | 192,582,769 |
TOTAL CONSUMER DISCRETIONARY | | 223,250,387 |
CONSUMER STAPLES - 0.0% |
Food & Staples Retailing - 0.0% |
Ahold Lease Series 2001 A1 pass thru trust certificates 7.82% 1/2/20 | | 759,804 | | 852,880 |
FINANCIALS - 11.1% |
Diversified Financial Services - 0.4% |
Cantor Commercial Real Estate Co. LP/CCRE Finance Corp. 7.75% 2/15/18 (h) | | 4,755,000 | | 5,087,850 |
Icahn Enterprises LP/Icahn Enterprises Finance Corp.: | | | | |
5.875% 2/1/22 | | 3,680,000 | | 3,751,300 |
6% 8/1/20 | | 6,000,000 | | 6,255,000 |
| | 15,094,150 |
Real Estate Investment Trusts - 7.4% |
American Campus Communities Operating Partnership LP 4.125% 7/1/24 | | 2,000,000 | | 2,006,580 |
American Tower Corp. 3.4% 2/15/19 | | 1,000,000 | | 1,036,709 |
Camden Property Trust 5% 6/15/15 | | 1,100,000 | | 1,141,236 |
CBL & Associates LP 5.25% 12/1/23 | | 1,000,000 | | 1,065,829 |
Commercial Net Lease Realty, Inc. 6.15% 12/15/15 | | 2,526,000 | | 2,700,178 |
Crown Castle International Corp. 5.25% 1/15/23 | | 4,000,000 | | 4,040,000 |
CTR Partnership LP / CareTrust Capital Corp. 5.875% 6/1/21 (h) | | 2,300,000 | | 2,305,750 |
CubeSmart LP 4.8% 7/15/22 | | 2,000,000 | | 2,137,444 |
DDR Corp.: | | | | |
5.5% 5/1/15 | | 4,000,000 | | 4,134,580 |
7.5% 4/1/17 | | 6,000,000 | | 6,878,238 |
7.5% 7/15/18 | | 8,756,000 | | 10,375,028 |
Corporate Bonds - continued |
| Principal
Amount (e) | | Value |
Nonconvertible Bonds - continued |
FINANCIALS - continued |
Real Estate Investment Trusts - continued |
DDR Corp.: - continued | | | | |
7.875% 9/1/20 | | $ 4,637,000 | | $ 5,824,128 |
9.625% 3/15/16 | | 3,836,000 | | 4,356,265 |
DuPont Fabros Technology LP 5.875% 9/15/21 | | 1,000,000 | | 1,020,000 |
Equity One, Inc.: | | | | |
5.375% 10/15/15 | | 3,500,000 | | 3,677,632 |
6.25% 1/15/17 | | 3,000,000 | | 3,312,594 |
Equity Residential 5.125% 3/15/16 | | 7,201,000 | | 7,694,859 |
HCP, Inc. 3.75% 2/1/16 | | 10,000,000 | | 10,430,250 |
Health Care Property Investors, Inc.: | | | | |
5.625% 5/1/17 | | 2,980,000 | | 3,309,528 |
6% 3/1/15 | | 1,000,000 | | 1,030,515 |
6% 1/30/17 | | 2,383,000 | | 2,650,163 |
7.072% 6/8/15 | | 1,500,000 | | 1,579,319 |
Health Care REIT, Inc.: | | | | |
3.625% 3/15/16 | | 14,685,000 | | 15,309,994 |
4.125% 4/1/19 | | 2,000,000 | | 2,150,084 |
6.2% 6/1/16 | | 2,750,000 | | 3,002,469 |
Healthcare Realty Trust, Inc.: | | | | |
3.75% 4/15/23 | | 4,022,000 | | 3,924,535 |
5.75% 1/15/21 | | 3,095,000 | | 3,494,862 |
6.5% 1/17/17 | | 2,875,000 | | 3,207,048 |
Highwoods/Forsyth LP: | | | | |
3.625% 1/15/23 | | 1,607,000 | | 1,580,740 |
5.85% 3/15/17 | | 2,800,000 | | 3,097,450 |
Hospitality Properties Trust: | | | | |
5% 8/15/22 | | 3,177,000 | | 3,351,433 |
5.625% 3/15/17 | | 915,000 | | 996,299 |
HRPT Properties Trust: | | | | |
5.75% 11/1/15 | | 4,826,000 | | 4,968,541 |
6.25% 8/15/16 | | 9,675,000 | | 10,297,228 |
6.25% 6/15/17 | | 1,055,000 | | 1,127,346 |
6.65% 1/15/18 | | 4,246,000 | | 4,616,816 |
iStar Financial, Inc.: | | | | |
3.875% 7/1/16 | | 2,855,000 | | 2,876,413 |
4% 11/1/17 | | 15,000,000 | | 14,775,000 |
5% 7/1/19 | | 15,000,000 | | 14,775,000 |
5.85% 3/15/17 | | 3,587,000 | | 3,766,350 |
5.875% 3/15/16 | | 27,070,000 | | 28,423,500 |
Corporate Bonds - continued |
| Principal
Amount (e) | | Value |
Nonconvertible Bonds - continued |
FINANCIALS - continued |
Real Estate Investment Trusts - continued |
iStar Financial, Inc.: - continued | | | | |
6.05% 4/15/15 | | $ 14,630,000 | | $ 14,959,175 |
7.125% 2/15/18 | | 5,725,000 | | 6,183,000 |
9% 6/1/17 | | 9,175,000 | | 10,390,688 |
MPT Operating Partnership LP/MPT Finance Corp.: | | | | |
6.375% 2/15/22 | | 3,610,000 | | 3,844,650 |
6.875% 5/1/21 | | 2,000,000 | | 2,150,000 |
National Retail Properties, Inc. 3.3% 4/15/23 | | 2,000,000 | | 1,931,756 |
Nationwide Health Properties, Inc. 6% 5/20/15 | | 5,670,000 | | 5,902,805 |
Omega Healthcare Investors, Inc.: | | | | |
4.95% 4/1/24 (h) | | 2,898,000 | | 2,979,144 |
6.75% 10/15/22 | | 2,115,000 | | 2,273,625 |
7.5% 2/15/20 | | 1,000,000 | | 1,063,750 |
Potlatch Corp. 7.5% 11/1/19 | | 1,000,000 | | 1,160,000 |
Prologis LP 7.625% 7/1/17 | | 4,690,000 | | 5,237,229 |
Reckson Operating Partnership LP/SL Green Realty Corp./SL Green Operating Partnership LP 7.75% 3/15/20 | | 2,000,000 | | 2,389,382 |
Senior Housing Properties Trust: | | | | |
3.25% 5/1/19 | | 2,882,000 | | 2,911,846 |
4.3% 1/15/16 | | 5,000,000 | | 5,165,360 |
4.75% 5/1/24 | | 3,988,000 | | 4,062,923 |
6.75% 4/15/20 | | 13,624,000 | | 15,635,202 |
6.75% 12/15/21 | | 8,000,000 | | 9,316,872 |
United Dominion Realty Trust, Inc.: | | | | |
5.25% 1/15/15 | | 1,000,000 | | 1,020,666 |
5.25% 1/15/16 | | 4,000,000 | | 4,236,568 |
| | 311,262,574 |
Real Estate Management & Development - 3.2% |
BioMed Realty LP 3.85% 4/15/16 | | 2,000,000 | | 2,089,560 |
Brandywine Operating Partnership LP 7.5% 5/15/15 | | 1,000,000 | | 1,049,968 |
CBRE Group, Inc.: | | | | |
5% 3/15/23 | | 6,020,000 | | 5,989,900 |
6.625% 10/15/20 | | 1,205,000 | | 1,263,744 |
Corporate Office Properties LP 3.6% 5/15/23 | | 5,000,000 | | 4,783,790 |
ERP Operating LP 5.25% 9/15/14 | | 4,815,000 | | 4,839,759 |
Excel Trust LP 4.625% 5/15/24 | | 2,403,000 | | 2,447,780 |
Forestar U.S.A. Real Estate Group 8.5% 6/1/22 (h) | | 10,515,000 | | 10,935,600 |
Corporate Bonds - continued |
| Principal
Amount (e) | | Value |
Nonconvertible Bonds - continued |
FINANCIALS - continued |
Real Estate Management & Development - continued |
Host Hotels & Resorts LP 5.25% 3/15/22 | | $ 2,000,000 | | $ 2,210,924 |
Howard Hughes Corp. 6.875% 10/1/21 (h) | | 9,715,000 | | 10,225,038 |
Hunt Companies, Inc. 9.625% 3/1/21 (h) | | 4,100,000 | | 4,305,000 |
Kennedy-Wilson, Inc.: | | | | |
5.875% 4/1/24 | | 2,610,000 | | 2,616,525 |
8.75% 4/1/19 | | 20,410,000 | | 21,864,213 |
Mid-America Apartments LP: | | | | |
3.75% 6/15/24 | | 1,663,000 | | 1,640,892 |
6.05% 9/1/16 | | 2,500,000 | | 2,725,500 |
Realogy Corp. 7.875% 2/15/19 (h) | | 7,085,000 | | 7,474,675 |
Realogy Group LLC/Realogy Co.-Issuer Corp. 4.5% 4/15/19 (h) | | 4,805,000 | | 4,660,850 |
Regency Centers LP: | | | | |
5.25% 8/1/15 | | 4,509,000 | | 4,707,265 |
5.875% 6/15/17 | | 400,000 | | 447,284 |
Taylor Morrison Communities, Inc./Monarch Communities, Inc.: | | | | |
5.25% 4/15/21 (h) | | 2,000,000 | | 1,970,000 |
5.625% 3/1/24 (h) | | 2,270,000 | | 2,224,600 |
Ventas Realty LP 1.55% 9/26/16 | | 7,000,000 | | 7,058,863 |
Ventas Realty LP/Ventas Capital Corp.: | | | | |
2.7% 4/1/20 | | 3,000,000 | | 2,963,976 |
3.125% 11/30/15 | | 13,807,000 | | 14,222,563 |
4% 4/30/19 | | 2,262,000 | | 2,420,869 |
Wells Operating Partnership II LP 5.875% 4/1/18 | | 3,000,000 | | 3,138,420 |
Weyerhaeuser Real Estate Co. 5.875% 6/15/24 (h) | | 1,890,000 | | 1,918,350 |
| | 132,195,908 |
Thrifts & Mortgage Finance - 0.1% |
Ocwen Financial Corp. 6.625% 5/15/19 (h) | | 4,005,000 | | 4,095,113 |
Wrightwood Capital LLC 1.9% 4/20/20 (d) | | 110,410 | | 500,156 |
| | 4,595,269 |
TOTAL FINANCIALS | | 463,147,901 |
Corporate Bonds - continued |
| Principal
Amount (e) | | Value |
Nonconvertible Bonds - continued |
HEALTH CARE - 0.6% |
Health Care Equipment & Supplies - 0.3% |
Aviv Healthcare Properties LP/Aviv Healthcare Capital Corp.: | | | | |
6% 10/15/21 | | $ 1,370,000 | | $ 1,438,500 |
7.75% 2/15/19 | | 10,410,000 | | 10,930,500 |
| | 12,369,000 |
Health Care Providers & Services - 0.3% |
Sabra Health Care LP/Sabra Capital Corp.: | | | | |
5.375% 6/1/23 | | 2,795,000 | | 2,788,013 |
5.5% 2/1/21 | | 9,070,000 | | 9,296,750 |
| | 12,084,763 |
TOTAL HEALTH CARE | | 24,453,763 |
INDUSTRIALS - 0.2% |
Commercial Services & Supplies - 0.1% |
Iron Mountain, Inc. 5.75% 8/15/24 | | 4,235,000 | | 4,235,000 |
Industrial Conglomerates - 0.1% |
Ladder Capital Finance Holdings LLLP/Ladder Capital Finance Corp. 7.375% 10/1/17 | | 3,050,000 | | 3,255,875 |
TOTAL INDUSTRIALS | | 7,490,875 |
INFORMATION TECHNOLOGY - 0.1% |
Internet Software & Services - 0.1% |
CyrusOne LP/CyrusOne Finance Corp. 6.375% 11/15/22 | | 3,000,000 | | 3,165,000 |
TOTAL NONCONVERTIBLE BONDS | | 722,360,806 |
TOTAL CORPORATE BONDS (Cost $832,223,479) |
871,661,140
|
Asset-Backed Securities - 2.2% |
|
Capital Trust RE CDO Ltd.: | | | | |
Series 2005-1A Class D, 1.6562% 3/20/50 (h)(j) | | 2,250,000 | | 95,625 |
Series 2005-3A Class A2, 5.16% 6/25/35 (h) | | 12,158 | | 11,915 |
CapitalSource Real Estate Loan Trust Series 2006-1A Class A2A, 0.4836% 1/20/37 (h)(j) | | 81,455 | | 79,826 |
Asset-Backed Securities - continued |
| Principal
Amount (e) | | Value |
CapLease CDO Ltd. Series 2005-1A Class A, 4.926% 1/29/40 (h) | | $ 910,893 | | $ 901,784 |
CBRE Realty Finance CDO LLC Series 2007-1A Class A1, 0.4821% 4/7/52 (h)(j) | | 686,542 | | 665,946 |
Conseco Finance Securitizations Corp. Series 2002-2 Class M2, 9.163% 3/1/33 (j) | | 500,000 | | 432,715 |
Crest Clarendon Street Ltd./Crest Clarendon Corp. Series 2002-1A Class D, 9% 12/28/35 (h) | | 573,683 | | 389,875 |
Crest Dartmouth Street Ltd./Crest Dartmouth Street Corp. Series 2003-1A Class D, 9% 6/28/38 (h) | | 346,972 | | 348,533 |
Deutsche Financial Capital Securitization LLC Series 1997-I Class M, 7.275% 9/15/27 | | 7,913,633 | | 7,729,380 |
Fairfield Street Solar Corp. Series 2004-1A Class E1, 3.5944% 11/28/39 (h)(j) | | 609,640 | | 61 |
Green Tree Financial Corp.: | | | | |
Series 1996-4 Class M1, 7.75% 6/15/27 | | 1,788,179 | | 1,774,707 |
Series 1997-3 Class M1, 7.53% 3/15/28 | | 6,996,415 | | 6,027,164 |
GSR Mortgage Loan Trust Series 2005-HE3 Class B3, 3.905% 6/25/35 (j)(m) | | 212,276 | | 4,647 |
Guggenheim Structured Real Estate Funding Ltd./Guggenheim Structured Real Estate Funding LLC Series 2005-2A: | | | | |
Class D, 1.705% 8/26/30 (h)(j) | | 89,648 | | 88,527 |
Class E, 2.155% 8/26/30 (h)(j) | | 1,420,000 | | 972,700 |
HLSS Servicer Advance Receivables Backed Notes Series 2013-T2 Class D2, 2.388% 5/16/44 (h) | | 3,000,000 | | 2,998,195 |
Invitation Homes Trust Series 2014-SFR1 Class E, 3.4062% 6/17/31 (h)(j) | | 10,000,000 | | 9,999,935 |
Lehman ABS Manufactured Housing Contract Trust Series 2001-B Class M2, 7.17% 4/15/40 | | 1,012,616 | | 494,533 |
Merit Securities Corp. Series 13 Class M1, 7.688% 12/28/33 (j) | | 1,923,000 | | 2,043,059 |
Mesa West Capital CDO Ltd. Series 2007-1A: | | | | |
Class A1, 0.415% 2/25/47 (h)(j) | | 1,617,882 | | 1,601,703 |
Class A2, 0.445% 2/25/47 (h)(j) | | 21,240,000 | | 20,655,900 |
N-Star Real Estate CDO Ltd. Series 1A Class C1B, 7.696% 8/28/38 (h) | | 899,989 | | 917,989 |
Taberna Preferred Funding III Ltd. Series 2005-3A Class D, 2.8729% 2/5/36 (h)(j) | | 3,803,196 | | 380 |
Wachovia Ltd./Wachovia LLC: | | | | |
Series 2006-1 Class 1ML, 5.7326% 9/25/26 (h)(j) | | 2,000,000 | | 1,400,000 |
Series 2006-1A: | | | | |
Class B, 0.5926% 9/25/26 (h)(j) | | 2,240,259 | | 2,199,934 |
Class C, 0.7626% 9/25/26 (h)(j) | | 7,030,000 | | 6,868,310 |
Asset-Backed Securities - continued |
| Principal
Amount (e) | | Value |
Wachovia Ltd./Wachovia LLC: - continued | | | | |
Series 2006-1A: | | | | |
Class D, 0.8626% 9/25/26 (h)(j) | | $ 2,080,000 | | $ 1,977,040 |
Class E, 0.9626% 9/25/26 (h)(j) | | 2,780,000 | | 2,621,540 |
Class F, 1.3826% 9/25/26 (h)(j) | | 3,483,000 | | 3,230,483 |
Class G, 1.5826% 9/25/26 (h)(j) | | 1,599,000 | | 1,475,877 |
Class H, 1.8826% 9/25/26 (h)(j) | | 1,535,000 | | 1,412,968 |
Class J, 2.9826% 9/25/26 (h)(j) | | 1,500,000 | | 1,392,000 |
Class K, 3.4826% 9/25/26 (h)(j) | | 2,475,000 | | 2,229,975 |
Class L, 4.2326% 9/25/26 (h)(j) | | 1,500,000 | | 1,370,250 |
Wrightwood Capital Real Estate CDO Ltd. Series 2005-1A: | | | | |
Class A1, 0.547% 11/21/40 (h)(j) | | 6,037,856 | | 5,705,774 |
Class F, 2.177% 11/21/40 (h)(j) | | 250,000 | | 29,275 |
TOTAL ASSET-BACKED SECURITIES (Cost $93,851,617) |
90,148,525
|
Collateralized Mortgage Obligations - 0.3% |
|
Private Sponsor - 0.3% |
Countrywide Home Loans, Inc.: | | | | |
Series 2002-38 Class B3, 5% 2/25/18 (h) | | 41,113 | | 173 |
Series 2002-R2 Class 2B3, 3.664% 7/25/33 (h)(j) | | 181,238 | | 53,428 |
Series 2003-R3 Class B2, 5.5% 11/25/33 (h) | | 1,086,466 | | 131,471 |
Series 2004-R1 Class 1B3, 5.0042% 11/25/34 (h)(j) | | 38,272 | | 2,747 |
FREMF Mortgage Trust: | | | | |
Series 2010-K6 Class B, 5.5329% 12/25/46 (h)(j) | | 4,500,000 | | 4,975,830 |
Series 2010-K7 Class B, 5.618% 4/25/20 (h)(j) | | 3,200,000 | | 3,574,253 |
Merrill Lynch Mortgage Investors Trust Series 1998-C3 Class F, 6% 12/15/30 (h) | | 1,388,624 | | 1,453,435 |
RESI Finance LP/RESI Finance DE Corp. floater Series 2003-B Class B9, 12.1025% 7/10/35 (h)(j) | | 155,567 | | 172,384 |
Residential Funding Securities Corp. Series 2002-RM1 Class BI1, 5.5% 12/25/17 (h) | | 15,441 | | 13,851 |
RESIX Finance Ltd. floater: | | | | |
Series 2003-D Class B8, 6.6525% 12/10/35 (h)(j) | | 169,695 | | 40,277 |
Series 2004-A Class B7, 4.4025% 2/10/36 (h)(j) | | 178,210 | | 48,248 |
Series 2004-B Class B7, 4.1525% 2/10/36 (h)(j) | | 224,769 | | 82,416 |
TOTAL PRIVATE SPONSOR | | 10,548,513 |
Collateralized Mortgage Obligations - continued |
| Principal
Amount (e) | | Value |
U.S. Government Agency - 0.0% |
Fannie Mae REMIC Trust: | | | | |
Series 2001-W3 subordinate REMIC pass thru certificates, Class B3, 7% 9/25/41 (m) | | $ 113,309 | | $ 37,591 |
Series 2002-W1 subordinate REMIC pass thru certificates, Class 3B3, 3.1641% 2/25/42 (h)(j) | | 85,297 | | 47,472 |
Series 2003-W1 subordinate REMIC pass thru certificates, Class B3, 4.5664% 12/25/42 (j)(m) | | 184,544 | | 30,990 |
Series 2003-W10 subordinate REMIC pass thru certificates, Class 2B3, 3.095% 6/25/43 (h)(j) | | 125,783 | | 52,539 |
Series 2003-W4 subordinate REMIC pass thru certificates, Class 2B3, 3.0288% 10/25/42 (h)(j) | | 51,657 | | 26,741 |
TOTAL U.S. GOVERNMENT AGENCY | | 195,333 |
TOTAL COLLATERALIZED MORTGAGE OBLIGATIONS (Cost $10,579,057) |
10,743,846
|
Commercial Mortgage Securities - 13.0% |
|
ACGS Series 2004-1 Class P, 7.4605% 8/1/19 (m) | | 1,607,561 | | 1,595,253 |
Americold LLC Trust Series 2010-ARTA Class D, 7.443% 1/14/29 (h) | | 2,000,000 | | 2,278,707 |
Banc of America Commercial Mortgage Trust: | | | | |
Series 2005-1 Class CJ, 5.4665% 11/10/42 (j) | | 3,580,000 | | 3,660,768 |
Series 2005-5 Class D, 5.3884% 10/10/45 (j) | | 4,000,000 | | 4,046,484 |
Series 2005-6 Class AJ, 5.3495% 9/10/47 (j) | | 5,000,000 | | 5,242,815 |
Banc of America Large Loan, Inc. floater Series 2005-MIB1 Class K, 2.152% 3/15/22 (h)(j) | | 760,684 | | 670,139 |
Banc of America REMIC Trust Series 2012-CLMZ Class A, 7.652% 8/15/17 (h)(j) | | 4,900,000 | | 4,908,330 |
Bear Stearns Commercial Mortgage Securities, Inc. Series 2006-PW11 Class AJ, 5.6047% 3/11/39 (j) | | 5,700,000 | | 5,877,419 |
Bear Stearns Commercial Mortgage Securities Trust Series 2006-T22 Class B, 5.7569% 4/12/38 (h)(j) | | 2,520,000 | | 2,677,709 |
Boca Hotel Portfolio Trust Series 2013-BOCA Class E, 3.902% 8/15/26 (h)(j) | | 2,500,000 | | 2,502,910 |
CGBAM Commercial Mortgage Trust floater Series 2014-HD Class E, 3.1518% 2/15/31 (h)(j) | | 5,769,000 | | 5,776,904 |
Citigroup Commercial Mortgage Trust Series 2013-GC15 Class D, 5.277% 9/10/46 (h)(j) | | 2,750,000 | | 2,736,311 |
COMM Mortgage Trust: | | | | |
sequential payer Series 2013-LC6 Class E, 3.5% 1/10/46 (h) | | 4,300,000 | | 3,445,349 |
Commercial Mortgage Securities - continued |
| Principal
Amount (e) | | Value |
COMM Mortgage Trust: - continued | | | | |
Series 2012-CR5 Class D, 4.4798% 12/10/45 (h)(j) | | $ 2,000,000 | | $ 2,000,636 |
Series 2013-CR10 Class D, 4.958% 8/10/46 (h)(j) | | 2,000,000 | | 1,956,635 |
Series 2013-CR12 Class D, 5.2553% 10/10/46 (h)(j) | | 3,000,000 | | 2,952,387 |
Series 2013-CR9 Class D, 4.4022% 7/10/45 (h)(j) | | 4,255,000 | | 3,991,662 |
Series 2013-LC6 Class D, 4.4319% 1/10/46 (h)(j) | | 3,870,000 | | 3,677,173 |
Series 2014-UBS2 Class D, 5.1831% 3/10/47 (h)(j) | | 3,713,000 | | 3,559,040 |
Commercial Mortgage Acceptance Corp. Series 1998-C2 Class J, 5.44% 9/15/30 (h) | | 2,646,159 | | 2,558,931 |
Commercial Mortgage Trust pass-thru certificates: | | | | |
Series 2005-C6 Class AJ, 5.209% 6/10/44 (j) | | 5,000,000 | | 5,175,945 |
Series 2012-CR1: | | | | |
Class C, 5.5464% 5/15/45 (j) | | 1,000,000 | | 1,105,871 |
Class D, 5.5464% 5/15/45 (h)(j) | | 5,550,000 | | 5,676,374 |
Series 2012-CR2: | | | | |
Class D, 5.0196% 8/15/45 (h)(j) | | 4,500,000 | | 4,670,199 |
Class E, 5.0196% 8/15/45 (h)(j) | | 6,000,000 | | 5,986,944 |
Series 2012-LC4: | | | | |
Class C, 5.8228% 12/10/44 (j) | | 2,000,000 | | 2,235,678 |
Class D, 5.8228% 12/10/44 (h)(j) | | 8,000,000 | | 8,410,016 |
Credit Suisse First Boston Mortgage Securities Corp.: | | | | |
Series 1998-C1 Class F, 6% 5/17/40 (h) | | 1,530,094 | | 1,669,010 |
Series 1998-C2 Class F, 6.75% 11/15/30 (h) | | 2,149,220 | | 2,223,860 |
DBUBS Mortgage Trust Series 2011-LC1A: | | | | |
Class E, 5.7302% 11/10/46 (h)(j) | | 12,490,000 | | 13,439,265 |
Class G, 4.652% 11/10/46 (h) | | 9,843,000 | | 8,454,793 |
Deutsche Mortgage & Asset Receiving Corp. Series 1998-C1 Class J, 6.22% 6/15/31 | | 51,442 | | 51,391 |
Extended Stay America Trust Series 2013-ESH7 Class C7, 3.9017% 12/5/31 (h) | | 500,000 | | 510,914 |
Freddie Mac: | | | | |
pass-thru certificates: | | | | |
Series K011 Class X3, 2.6622% 12/25/43 (j)(k) | | 12,206,096 | | 1,735,585 |
Series K012 Class X3, 2.366% 1/25/41 (j)(k) | | 21,072,886 | | 2,683,801 |
Series K013 Class X3, 2.8852% 1/25/43 (j)(k) | | 14,360,000 | | 2,250,959 |
Series KAIV Class X2, 3.6147% 6/25/46 (j)(k) | | 7,430,000 | | 1,445,962 |
G-Force LLC sequential payer Series 2005-RRA Class A2, 4.83% 8/22/36 (h) | | 10,247 | | 10,247 |
GMAC Commercial Mortgage Securities, Inc.: | | | | |
Series 1997-C2 Class G, 6.75% 4/15/29 (j) | | 716,241 | | 776,204 |
Series 2000-C1 Class K, 7% 3/15/33 | | 16,103 | | 16,280 |
GP Portfolio Trust Series 2014-GPP Class E, 4.002% 2/15/27 (h)(j) | | 2,823,000 | | 2,825,965 |
Commercial Mortgage Securities - continued |
| Principal
Amount (e) | | Value |
Greenwich Capital Commercial Funding Corp. Series 2006-GG7 Class A4, 6.0146% 7/10/38 (j) | | $ 7,954,707 | | $ 8,516,715 |
GS Mortgage Securities Corp. II Series 2010-C1: | | | | |
Class D, 6.169% 8/10/43 (h)(j) | | 4,000,000 | | 4,438,020 |
Class E, 4% 8/10/43 (h) | | 3,770,000 | | 3,362,169 |
GS Mortgage Securities Trust: | | | | |
Series 2010-C2 Class D, 5.3978% 12/10/43 (h)(j) | | 3,000,000 | | 3,132,480 |
Series 2011-GC5: | | | | |
Class C, 5.4738% 8/10/44 (h)(j) | | 9,000,000 | | 9,939,294 |
Class D, 5.4738% 8/10/44 (h)(j) | | 4,000,000 | | 4,192,568 |
Class E, 5.4738% 8/10/44 (h)(j) | | 4,049,000 | | 3,825,924 |
Series 2012-GC6 Class C, 5.8259% 1/10/45 (h)(j) | | 3,600,000 | | 4,029,503 |
Series 2012-GCJ7: | | | | |
Class C, 5.9067% 5/10/45 (j) | | 6,500,000 | | 7,266,509 |
Class D, 5.9067% 5/10/45 (h)(j) | | 3,000,000 | | 3,173,227 |
Class E, 5% 5/10/45 (h) | | 6,920,000 | | 6,344,347 |
Series 2012-GCJ9 Class D, 4.858% 11/10/45 (h)(j) | | 2,000,000 | | 1,998,964 |
Series 2013-GC16 Class D, 5.323% 11/10/46 (h)(j) | | 3,250,000 | | 3,296,098 |
Hilton U.S.A. Trust: | | | | |
floater Series 2014-ORL Class E, 3.5534% 7/15/29 (h)(j) | | 4,000,000 | | 4,003,809 |
Series 2013-HLT Class EFX, 5.6086% 11/5/30 (h)(j) | | 3,000,000 | | 3,087,078 |
Invitation Homes Trust floater Series 2013-SFR1: | | | | |
Class E, 2.9% 12/17/30 (h)(j) | | 1,500,000 | | 1,470,293 |
Class F, 3.9% 12/17/30 (h)(j) | | 1,750,000 | | 1,730,195 |
JPMorgan Chase Commercial Mortgage Securities Corp.: | | | | |
Series 2003-C1 Class F, 6.1573% 1/12/37 (h)(j) | | 1,000,000 | | 1,009,209 |
Series 2009-IWST: | | | | |
Class C, 7.6935% 12/5/27 (h)(j) | | 3,000,000 | | 3,682,794 |
Class D, 7.6935% 12/5/27 (h)(j) | | 9,550,000 | | 11,648,374 |
Series 2010-CNTM Class MZ, 8.5% 8/5/20 (h) | | 9,000,000 | | 9,389,840 |
Series 2010-CNTR: | | | | |
Class D, 6.3899% 8/5/32 (h)(j) | | 4,500,000 | | 5,104,256 |
Class XB, 1.1366% 8/5/32 (h)(j)(k) | | 32,655,000 | | 1,341,921 |
Series 2012-CBX Class C, 5.358% 6/15/45 (j) | | 4,530,000 | | 4,947,000 |
JPMorgan Chase Commercial Mortgage Securities Trust: | | | | |
floater: | | | | |
Series 2013-JWMZ Class M, 6.152% 4/15/18 (h)(j) | | 2,143,851 | | 2,157,968 |
Series 2013-JWRZ Class E, 3.892% 4/15/30 (h)(j) | | 3,400,000 | | 3,393,597 |
Series 2014-FBLU Class E, 3.6518% 12/15/28 (h)(j) | | 2,000,000 | | 2,000,802 |
Commercial Mortgage Securities - continued |
| Principal
Amount (e) | | Value |
JPMorgan Chase Commercial Mortgage Securities Trust: - continued | | | | |
floater: | | | | |
Series 2014-INN: | | | | |
Class E, 3.751% 6/15/29 (h)(j) | | $ 6,593,000 | | $ 6,597,068 |
Class F, 4.152% 6/15/29 (h)(j) | | 6,593,000 | | 6,599,179 |
Series 2005-LDP5 Class AJ, 5.5262% 12/15/44 (j) | | 3,470,000 | | 3,618,426 |
Series 2011-C4 Class F, 3.873% 7/15/46 (h) | | 1,400,000 | | 1,271,725 |
Series 2011-C5 Class C, 5.5023% 8/15/46 (h)(j) | | 6,525,375 | | 7,267,878 |
Series 2013-LC11 Class D, 4.383% 4/15/46 (j) | | 3,750,000 | | 3,521,536 |
JPMorgan Commercial Mortgage Finance Corp. Series 1999-C8 Class H, 6% 7/15/31 (h) | | 1,393,719 | | 1,280,411 |
LB Commercial Conduit Mortgage Trust Series 1998-C4 Class G, 5.6% 10/15/35 (h) | | 116,194 | | 116,431 |
LB-UBS Commercial Mortgage Trust: | | | | |
sequential payer: | | | | |
Series 2005-C3 Class AJ, 4.843% 7/15/40 | | 6,620,000 | | 6,779,933 |
Series 2005-C7 Class AJ, 5.323% 11/15/40 (j) | | 8,000,000 | | 8,349,352 |
Series 2006-C7 Class AM, 5.378% 11/15/38 | | 2,040,000 | | 2,198,657 |
Series 2004-C7 Class E, 4.918% 10/15/36 | | 5,120,000 | | 5,153,408 |
Series 2005-C1 Class E, 4.924% 2/15/40 | | 4,000,000 | | 4,033,100 |
Series 2006-C4: | | | | |
Class A4, 6.0294% 6/15/38 (j) | | 4,841,683 | | 5,200,742 |
Class AJ, 6.0494% 6/15/38 (j) | | 7,005,000 | | 7,430,533 |
Class AM, 6.0494% 6/15/38 (j) | | 6,700,000 | | 7,234,218 |
LSTAR Commercial Mortgage Trust: | | | | |
Series 2011-1: | | | | |
Class B, 5.3288% 6/25/43 (h)(j) | | 3,548,171 | | 3,555,950 |
Class D, 5.3288% 6/25/43 (h)(j) | | 4,699,000 | | 4,745,468 |
Series 2014-2: | | | | |
Class D, 5.319% 1/20/41 (h)(j) | | 3,000,000 | | 2,849,709 |
Class E, 5.319% 1/20/41 (h)(j) | | 4,800,000 | | 3,957,715 |
Mach One Trust LLC Series 2004-1A Class H, 6.2679% 5/28/40 (h)(j) | | 2,840,000 | | 2,918,100 |
Merrill Lynch Financial Asset, Inc. Series 2005-CA16: | | | | |
Class F, 4.384% 7/12/37 | CAD | 710,000 | | 636,044 |
Class G, 4.384% 7/12/37 | CAD | 355,000 | | 315,222 |
Class H, 4.384% 7/12/37 | CAD | 236,000 | | 207,720 |
Class J, 4.384% 7/12/37 | CAD | 355,000 | | 309,736 |
Class K, 4.384% 7/12/37 | CAD | 355,000 | | 307,048 |
Class L, 4.384% 7/12/37 | CAD | 236,000 | | 202,359 |
Class M, 4.384% 7/12/37 | CAD | 995,000 | | 809,979 |
Merrill Lynch Mortgage Investors Trust Series 1999-C1 Class G, 6.71% 11/15/31 (h) | | 401,475 | | 289,062 |
Commercial Mortgage Securities - continued |
| Principal
Amount (e) | | Value |
Merrill Lynch Mortgage Trust Series 2006-C1 Class AM, 5.8624% 5/12/39 (j) | | $ 1,200,000 | | $ 1,283,813 |
Mezz Capital Commercial Mortgage Trust: | | | | |
sequential payer: | | | | |
Series 2004-C1 Class A, 4.836% 1/15/37 (h) | | 59,543 | | 59,543 |
Series 2004-C2 Class A, 5.318% 10/15/40 (h) | | 4,709,155 | | 4,709,155 |
Series 2004-C1 Class IO, 8.9139% 1/15/37 (h)(j)(k) | | 436,614 | | 13,317 |
Morgan Stanley BAML Trust: | | | | |
Series 2012-C6 Class D, 4.8181% 11/15/45 (h)(j) | | 2,000,000 | | 2,041,958 |
Series 2013-C12 Class D, 4.935% 10/15/46 (h) | | 3,250,000 | | 3,158,717 |
Series 2013-C13 Class D, 5.0592% 11/15/46 (h)(j) | | 3,100,000 | | 3,027,383 |
Series 2013-C7 Class E, 4.4423% 2/15/46 (h)(j) | | 1,000,000 | | 874,622 |
Series 2013-C9 Class D, 4.2984% 5/15/46 (h)(j) | | 5,000,000 | | 4,676,130 |
Morgan Stanley Capital I Trust: | | | | |
sequential payer: | | | | |
Series 2006-HQ10 Class AM, 5.36% 11/12/41 | | 8,200,000 | | 8,866,619 |
Series 2012-C4 Class E, 5.7094% 3/15/45 (h)(j) | | 5,630,000 | | 5,791,632 |
Series 1997-RR Class F, 7.4306% 4/30/39 (h)(j) | | 869,355 | | 919,343 |
Series 1998-CF1 Class G, 7.35% 7/15/32 (h) | | 2,639,941 | | 2,147,478 |
Series 2005-HQ5 Class B, 5.272% 1/14/42 | | 2,000,000 | | 2,034,836 |
Series 2005-HQ6 Class AJ, 5.073% 8/13/42 (j) | | 2,500,000 | | 2,577,703 |
Series 2006-IQ12 Class AMFX, 5.37% 12/15/43 | | 7,500,000 | | 8,090,333 |
Series 2011-C1 Class C, 5.4187% 9/15/47 (h)(j) | | 4,000,000 | | 4,427,369 |
Series 2011-C2: | | | | |
Class D, 5.4817% 6/15/44 (h)(j) | | 4,610,000 | | 4,990,459 |
Class E, 5.4817% 6/15/44 (h)(j) | | 9,600,000 | | 10,101,341 |
Class F, 5.4817% 6/15/44 (h)(j) | | 4,440,000 | | 4,216,291 |
Class XB, 0.534% 6/15/44 (h)(j)(k) | | 63,708,222 | | 1,791,029 |
Series 2011-C3: | | | | |
Class C, 5.3556% 7/15/49 (h)(j) | | 2,000,000 | | 2,184,086 |
Class D, 5.3556% 7/15/49 (h)(j) | | 7,400,000 | | 7,862,056 |
Series 2012-C4 Class D, 5.7094% 3/15/45 (h)(j) | | 6,310,000 | | 6,797,296 |
Providence Place Group Ltd. Partnership Series 2000-C1 Class A2, 7.75% 7/20/28 (h) | | 4,240,047 | | 5,447,612 |
RBSCF Trust Series 2010-MB1 Class D, 4.9832% 4/15/24 (h)(j) | | 9,049,000 | | 9,205,756 |
SCG Trust Series 2013-SRP1 Class D, 3.4955% 11/15/26 (h)(j) | | 1,000,000 | | 972,044 |
TIAA Seasoned Commercial Mortgage Trust sequential payer Series 2007-C4 Class AJ, 5.5645% 8/15/39 (j) | | 2,080,000 | | 2,189,859 |
TimberStar Trust I Series 2006-1 Class F, 7.5296% 10/15/36 (h) | | 10,630,000 | | 11,253,120 |
Commercial Mortgage Securities - continued |
| Principal
Amount (e) | | Value |
UBS Commercial Mortgage Trust: | | | | |
Series 2007-FL1 Class F, 0.727% 7/15/24 (h)(j) | | $ 1,200,000 | | $ 1,199,038 |
Series 2012-C1 Class D, 5.7194% 5/10/45 (h)(j) | | 2,000,000 | | 2,081,394 |
UBS-Barclays Commercial Mortgage Trust sequential payer Series 2012-C3 Class A1, 0.726% 8/10/49 | | 2,643,138 | | 2,622,908 |
UBS-Citigroup Commercial Mortgage Trust Series 2011-C1 Class B, 6.0705% 1/10/45 (h)(j) | | 3,000,000 | | 3,477,570 |
Vornado DP LLC Series 2010-VNO Class D, 6.3555% 9/13/28 (h) | | 2,540,000 | | 2,932,115 |
Wachovia Bank Commercial Mortgage Trust: | | | | |
Series 2004-C10 Class E, 4.931% 2/15/41 | | 1,716,408 | | 1,717,802 |
Series 2004-C11: | | | | |
Class D, 5.5428% 1/15/41 (j) | | 5,177,000 | | 5,474,186 |
Class E, 5.5928% 1/15/41 (j) | | 3,785,000 | | 3,996,351 |
Series 2004-C12 Class D, 5.6311% 7/15/41 (j) | | 1,364,882 | | 1,368,222 |
Wells Fargo Commercial Mortgage Trust Series 2012-LC5 Class D, 4.9376% 10/15/45 (h)(j) | | 9,999,000 | | 9,932,877 |
WF-RBS Commercial Mortgage Trust: | | | | |
Series 2011-C3: | | | | |
Class C, 5.335% 3/15/44 (h) | | 4,900,000 | | 5,374,271 |
Class D, 5.723% 3/15/44 (h)(j) | | 1,000,000 | | 1,060,813 |
Class E, 5% 3/15/44 (h) | | 3,000,000 | | 2,799,111 |
Series 2011-C5 Class F, 5.25% 11/15/44 (h)(j) | | 3,000,000 | | 2,792,028 |
Series 2012-C10 Class E, 4.6077% 12/15/45 (h)(j) | | 4,090,000 | | 3,546,050 |
Series 2012-C7: | | | | |
Class D, 5.0019% 6/15/45 (h)(j) | | 2,380,000 | | 2,477,927 |
Class F, 4.5% 6/15/45 (h) | | 2,000,000 | | 1,750,684 |
Series 2013-C11: | | | | |
Class D, 4.3224% 3/15/45 (h)(j) | | 5,830,000 | | 5,505,759 |
Class E, 4.3224% 3/15/45 (h)(j) | | 4,780,000 | | 4,065,256 |
Series 2013-C13 Class D, 4.2791% 5/15/45 (h)(j) | | 4,000,000 | | 3,722,676 |
TOTAL COMMERCIAL MORTGAGE SECURITIES (Cost $491,817,896) |
543,318,426
|
Bank Loan Obligations - 7.8% |
|
CONSUMER DISCRETIONARY - 2.8% |
Hotels, Restaurants & Leisure - 2.4% |
BRE Select Hotels Corp. 5.892% 5/9/18 (j) | | 12,102,193 | | 12,102,193 |
Caesars Entertainment Resort Properties LLC Tranche B 1LN, term loan 7% 10/11/20 (j) | | 11,442,500 | | 11,413,894 |
Bank Loan Obligations - continued |
| Principal
Amount (e) | | Value |
CONSUMER DISCRETIONARY - continued |
Hotels, Restaurants & Leisure - continued |
Caesars Growth Properties Holdings, LLC Tranche 1LN, term loan 6.25% 5/8/21 (j) | | $ 9,290,000 | | $ 9,290,000 |
Cedar Fair LP Tranche B, term loan 3.25% 3/6/20 (j) | | 2,760,267 | | 2,763,718 |
CityCenter Holdings LLC Tranche B, term loan 4.25% 10/16/20 (j) | | 1,632,130 | | 1,628,050 |
Cooper Hotel Group 12% 11/6/17 | | 13,277,241 | | 13,941,103 |
Four Seasons Holdings, Inc. Tranche 2LN, term loan 6.25% 12/27/20 (j) | | 510,000 | | 512,550 |
Hilton Worldwide Finance, LLC Tranche B, term loan 3.5% 10/25/20 (j) | | 28,862,492 | | 28,718,179 |
La Quinta Intermediate Holdings LLC Tranche B LN, Tranche B, term loan 4% 4/14/21 (j) | | 8,181,000 | | 8,099,190 |
Playa Resorts Holding BV Tranche B, term loan 4% 8/9/19 (j) | | 6,982,412 | | 7,008,596 |
Ryman Hospitality Properties, Inc. Tranche B, term loan 3.75% 1/15/21 (j) | | 2,290,000 | | 2,301,450 |
| | 97,778,923 |
Media - 0.2% |
CBS Outdoor Americas Capital LLC/CBS Outdoor Americas Capital Corp. Tranche B, term loan 3% 1/31/21 (j) | | 8,295,000 | | 8,232,788 |
Multiline Retail - 0.1% |
JC Penney Corp., Inc. Tranche B, term loan 6% 5/22/18 (j) | | 3,499,650 | | 3,531,532 |
Specialty Retail - 0.1% |
The Pep Boys - Manny, Moe & Jack Tranche B, term loan 4.25% 10/11/18 (j) | | 5,274,675 | | 5,281,268 |
TOTAL CONSUMER DISCRETIONARY | | 114,824,511 |
CONSUMER STAPLES - 0.1% |
Food & Staples Retailing - 0.1% |
Albertson's LLC Tranche B 2LN, term loan 4.75% 3/21/19 (j) | | 5,123,347 | | 5,116,943 |
ENERGY - 0.4% |
Oil, Gas & Consumable Fuels - 0.4% |
Panda Sherman Power, LLC term loan 9% 9/14/18 (j) | | 7,200,000 | | 7,344,000 |
Panda Temple Power, LLC term loan 7.25% 4/3/19 (j) | | 8,580,000 | | 8,794,500 |
| | 16,138,500 |
Bank Loan Obligations - continued |
| Principal
Amount (e) | | Value |
FINANCIALS - 2.3% |
Diversified Financial Services - 0.9% |
Blackstone 9.98% 10/1/17 | | $ 17,203,421 | | $ 17,547,489 |
Calpine Construction Finance Co. LP Tranche B 2LN, term loan 3.25% 1/31/22 (j) | | 7,380,609 | | 7,256,098 |
Pilot Travel Centers LLC: | | | | |
Tranche B 2LN, term loan 4.25% 8/7/19 (j) | | 7,117,435 | | 7,144,481 |
Tranche B, term loan 3.75% 3/30/18 (j) | | 6,566,411 | | 6,549,995 |
| | 38,498,063 |
Real Estate Investment Trusts - 0.2% |
Starwood Property Trust, Inc. Tranche B, term loan 3.5% 4/17/20 (j) | | 8,933,487 | | 8,899,986 |
Real Estate Management & Development - 1.1% |
CBRE Group, Inc. Tranche B, term loan 2.9015% 3/28/21 (j) | | 4,468,437 | | 4,446,095 |
CityCenter 8.74% 7/10/15 (j) | | 3,307,347 | | 3,307,347 |
Realogy Corp. Credit-Linked Deposit 4.4463% 10/10/16 (j) | | 647,237 | | 646,428 |
Realogy Group LLC Tranche B, term loan 3.75% 3/5/20 (j) | | 38,799,180 | | 38,411,188 |
| | 46,811,058 |
Thrifts & Mortgage Finance - 0.1% |
Ocwen Loan Servicing, LLC Tranche B, term loan 5% 2/15/18 (j) | | 1,942,912 | | 1,942,912 |
TOTAL FINANCIALS | | 96,152,019 |
HEALTH CARE - 0.5% |
Health Care Providers & Services - 0.5% |
Community Health Systems, Inc.: | | | | |
Tranche D, term loan 4.25% 1/27/21 (j) | | 2,100,608 | | 2,105,860 |
Tranche E, term loan 3.4776% 1/25/17 (j) | | 788,123 | | 789,108 |
ESH Hospitality, Inc. Tranche B, term loan 5% 6/24/19 (j) | | 11,310,000 | | 11,437,238 |
Skilled Healthcare Group, Inc. term loan 7% 4/9/16 (j) | | 7,040,067 | | 7,022,467 |
| | 21,354,673 |
INDUSTRIALS - 0.4% |
Commercial Services & Supplies - 0.1% |
Lineage Logistics Holdings, LLC. Tranche B, term loan 4.5% 4/7/21 (j) | | 3,990,000 | | 3,950,100 |
Bank Loan Obligations - continued |
| Principal
Amount (e) | | Value |
INDUSTRIALS - continued |
Construction & Engineering - 0.3% |
Drumm Investors LLC Tranche B, term loan 6.75% 5/4/18 (j) | | $ 11,686,667 | | $ 11,672,059 |
TOTAL INDUSTRIALS | | 15,622,159 |
TELECOMMUNICATION SERVICES - 0.6% |
Wireless Telecommunication Services - 0.6% |
Crown Castle Operating Co.: | | | | |
Tranche A, term loan 1.905% 1/31/19 (j) | | 4,553,273 | | 4,519,123 |
Tranche B 2LN, term loan 3% 1/31/21 (j) | | 9,121,019 | | 9,121,019 |
SBA Senior Finance II, LLC term loan 3.25% 3/24/21 (j) | | 11,565,000 | | 11,420,438 |
| | 25,060,580 |
UTILITIES - 0.7% |
Electric Utilities - 0.4% |
Bayonne Energy Center, LLC Tranche B, term loan 6/30/21 (l) | | 1,555,000 | | 1,564,719 |
EquiPower Resources Holdings LLC: | | | | |
Tranche B 1LN, term loan 4.25% 12/21/18 (j) | | 4,974,619 | | 4,987,056 |
Tranche C, term loan 4.25% 12/31/19 (j) | | 1,148,814 | | 1,151,686 |
Essential Power LLC Tranche B, term loan 4.75% 8/8/19 (j) | | 3,397,816 | | 3,414,806 |
La Frontera Generation, LLC Tranche B, term loan 4.5% 9/30/20 (j) | | 6,634,947 | | 6,660,160 |
| | 17,778,427 |
Independent Power Producers & Energy Traders - 0.3% |
Calpine Corp. Tranche B 4LN, term loan 4% 10/31/20 (j) | | 1,990,000 | | 1,990,000 |
Tempus Public Foundation Generation Holdings LLC Tranche B, term loan 4.75% 12/31/17 (j) | | 9,904,975 | | 9,533,538 |
| | 11,523,538 |
TOTAL UTILITIES | | 29,301,965 |
TOTAL BANK LOAN OBLIGATIONS (Cost $323,405,617) |
323,571,350
|
Preferred Securities - 0.0% |
| Principal
Amount (e) | | Value |
FINANCIALS - 0.0% |
Diversified Financial Services - 0.0% |
Crest Clarendon Street 2002-1 Ltd. Series 2002-1A Class PS, 12/28/35 (h) | | $ 500,000 | | $ 25,000 |
Crest Dartmouth Street 2003 1 Ltd. Series 2003-1A Class PS, 6/28/38 (h) | | 1,220,000 | | 905,362 |
| | 930,362 |
TOTAL PREFERRED SECURITIES (Cost $1,297,346) |
930,362
|
Money Market Funds - 7.2% |
| Shares | | |
Fidelity Cash Central Fund, 0.11% (b) | 276,650,517 | | 276,650,517 |
Fidelity Securities Lending Cash Central Fund, 0.11% (b)(c) | 25,440,125 | | 25,440,125 |
TOTAL MONEY MARKET FUNDS (Cost $302,090,642) |
302,090,642
|
TOTAL INVESTMENT PORTFOLIO - 100.4% (Cost $3,919,805,033) | | 4,188,693,860 |
NET OTHER ASSETS (LIABILITIES) - (0.4)% | | (14,717,180) |
NET ASSETS - 100% | $ 4,173,976,680 |
Currency Abbreviations |
CAD | - | Canadian dollar |
Legend |
(a) Non-income producing |
(b) Affiliated fund that is generally available only to investment companies and other accounts managed by Fidelity Investments. The rate quoted is the annualized seven-day yield of the fund at period end. A complete unaudited listing of the fund's holdings as of its most recent quarter end is available upon request. In addition, each Fidelity Central Fund's financial statements, which are not covered by the Fund's Report of Independent Registered Public Accounting Firm, are available on the SEC's website or upon request. |
(c) Investment made with cash collateral received from securities on loan. |
(d) Non-income producing - Security is in default. |
(e) Amount is stated in United States dollars unless otherwise noted. |
(f) Security or a portion of the security is on loan at period end. |
(g) Affiliated company |
(h) Security exempt from registration under Rule 144A of the Securities Act of 1933. These securities may be resold in transactions exempt from registration, normally to qualified institutional buyers. At the end of the period, the value of these securities amounted to $610,513,249 or 14.6% of net assets. |
(i) Security or a portion of the security purchased on a delayed delivery or when-issued basis. |
(j) Coupon rates for floating and adjustable rate securities reflect the rates in effect at period end. |
(k) Security represents right to receive monthly interest payments on an underlying pool of mortgages or assets. Principal shown is the outstanding par amount of the pool as of the end of the period. |
(l) The coupon rate will be determined upon settlement of the loan after period end. |
(m) Restricted securities - Investment in securities not registered under the Securities Act of 1933 (excluding 144A issues). At the end of the period, the value of restricted securities (excluding 144A issues) amounted to $8,596,772 or 0.2% of net assets. |
Additional information on each restricted holding is as follows: |
Security | Acquisition Date | Acquisition Cost |
ACGS Series 2004-1 Class P, 7.4605% 8/1/19 | 2/17/11 | $ 1,556,705 |
Fannie Mae REMIC Trust Series 2001-W3 subordinate REMIC pass thru certificates, Class B3, 7% 9/25/41 | 5/21/03 | $ 98,189 |
Fannie Mae REMIC Trust Series 2003-W1 subordinate REMIC pass thru certificates, Class B3, 4.5664% 12/25/42 | 3/25/03 | $ 109,726 |
GSR Mortgage Loan Trust Series 2005-HE3 Class B3, 3.905% 6/25/35 | 6/3/05 | $ 187,271 |
Stanley Martin Communities LLC Class B | 8/3/05 - 3/1/07 | $ 4,244,574 |
Affiliated Central Funds |
Information regarding fiscal year to date income earned by the Fund from investments in Fidelity Central Funds is as follows: |
Fund | Income earned |
Fidelity Cash Central Fund | $ 269,973 |
Fidelity Securities Lending Cash Central Fund | 69,287 |
Total | $ 339,260 |
Other Affiliated Issuers |
An affiliated company is a company in which the Fund has ownership of at least 5% of the voting securities. Fiscal year to date transactions with companies which are or were affiliates are as follows: |
Affiliate | Value,
beginning of
period | Purchases | Sales
Proceeds | Dividend
Income | Value,
end of
period |
Acadia Realty Trust (SBI) | $ 67,194,255 | $ 23,354,610 | $ - | $ 2,449,846 | $ 98,809,206 |
Arbor Realty Trust, Inc. | 21,107,288 | 1,885,885 | - | 1,477,398 | 21,697,653 |
Arbor Realty Trust, Inc. 7.375% | - | 8,259,665 | - | 154,098 | 8,162,637 |
Arbor Realty Trust, Inc. Series A, 8.25% | 4,748,025 | - | - | 389,996 | 4,727,225 |
Arbor Realty Trust, Inc. Series B, 7.75% | 5,901,600 | - | - | 493,422 | 5,882,400 |
Arbor Realty Trust, Inc. Series C, 8.50% | - | 2,500,000 | - | 55,490 | 2,525,000 |
Terreno Realty Corp. | 22,091,704 | 4,979,683 | - | 529,220 | - |
Terreno Realty Corp. Series A, 7.75% | 5,523,887 | - | - | 414,024 | - |
Total | $ 126,566,759 | $ 40,979,843 | $ - | $ 5,963,494 | $ 141,804,121 |
Other Information |
The following is a summary of the inputs used, as of July 31, 2014, involving the Fund's assets and liabilities carried at fair value. The inputs or methodology used for valuing securities may not be an indication of the risk associated with investing in those securities. For more information on valuation inputs, and their aggregation into the levels used in the tables below, please refer to the Investment Valuation section in the accompanying Notes to Financial Statements. |
Valuation Inputs at Reporting Date: |
Description | Total | Level 1 | Level 2 | Level 3 |
Investments in Securities: | | | | |
Equities: | | | | |
Consumer Discretionary | $ 10,655,683 | $ 3,727,392 | $ - | $ 6,928,291 |
Financials | 2,025,032,649 | 1,995,068,514 | 27,354,361 | 2,609,774 |
Materials | 10,541,237 | 10,541,237 | - | - |
Corporate Bonds | 871,661,140 | - | 871,160,983 | 500,157 |
Asset-Backed Securities | 90,148,525 | - | 81,964,524 | 8,184,001 |
Collateralized Mortgage Obligations | 10,743,846 | - | 10,017,369 | 726,477 |
Commercial Mortgage Securities | 543,318,426 | - | 532,005,572 | 11,312,854 |
Bank Loan Obligations | 323,571,350 | - | 276,160,668 | 47,410,682 |
Preferred Securities | 930,362 | - | - | 930,362 |
Money Market Funds | 302,090,642 | 302,090,642 | - | - |
Total Investments in Securities: | $ 4,188,693,860 | $ 2,311,427,785 | $ 1,798,663,477 | $ 78,602,598 |
Valuation Inputs at Reporting Date: |
The following is a reconciliation of Investments in Securities for which Level 3 inputs were used in determining value: |
Investments in Securities: | |
Bank Loan Obligations | |
Beginning Balance | $ 105,573,756 |
Net Realized Gain (Loss) on Investment Securities | 289,125 |
Net Unrealized Gain (Loss) on Investment Securities | (866,510) |
Cost of Purchases | - |
Proceeds of Sales | (58,246,664) |
Amortization/Accretion | 140,775 |
Transfers into Level 3 | 520,200 |
Transfers out of Level 3 | - |
Ending Balance | $ 47,410,682 |
The change in unrealized gain (loss) for the period attributable to Level 3 securities held at July 31, 2014 | $ (413,512) |
Other Investments in Securities | |
Beginning Balance | $ 53,636,499 |
Net Realized Gain (Loss) on Investment Securities | (4,200,658) |
Net Unrealized Gain (Loss) on Investment Securities | 9,034,288 |
Cost of Purchases | 169,932 |
Proceeds of Sales | (23,014,379) |
Amortization/Accretion | 1,379,987 |
Transfers into Level 3 | - |
Transfers out of Level 3 | (5,813,753) |
Ending Balance | $ 31,191,916 |
The change in unrealized gain (loss) for the period attributable to Level 3 securities held at July 31, 2014 | $ 4,647,489 |
The information used in the above reconciliations represents fiscal year to date activity for any Investments in Securities identified as using Level 3 inputs at either the beginning or the end of the current fiscal period. Transfers in or out of Level 3 represent the beginning value of any Security or Instrument where a change in the pricing level occurred from the beginning to the end of the period. The cost of purchases and the proceeds of sales may include securities received or delivered through corporate actions or exchanges. Realized and unrealized gains (losses) disclosed in the reconciliations are included in Net Gain (Loss) on the Fund's Statement of Operations. |
Other Information |
The composition of credit quality ratings as a percentage of net assets is as follows (Unaudited): |
U.S. Government and U.S. Government Agency Obligations | 0.4% |
AAA,AA,A | 4.6% |
BBB | 11.3% |
BB | 9.1% |
B | 11.4% |
CCC,CC,C | 1.0% |
D | 0.0% |
Not Rated | 6.4% |
Equities | 49.0% |
Short-Term Investments and Net Other Assets | 6.8% |
| 100.0% |
We have used ratings from Moody's Investors Service, Inc. Where Moody's® ratings are not available, we have used S&P® ratings. All ratings are as of the date indicated and do not reflect subsequent changes. |
See accompanying notes which are an integral part of the financial statements.
Annual Report
Statement of Assets and Liabilities
| July 31, 2014 |
| | |
Assets | | |
Investment in securities, at value (including securities loaned of $24,482,448) - See accompanying schedule: Unaffiliated issuers (cost $3,496,917,698) | $ 3,744,799,097 | |
Fidelity Central Funds (cost $302,090,642) | 302,090,642 | |
Other affiliated issuers (cost $120,796,693) | 141,804,121 | |
Total Investments (cost $3,919,805,033) | | $ 4,188,693,860 |
Cash | | 2,277,247 |
Receivable for investments sold | | 10,882,971 |
Receivable for fund shares sold | | 6,965,247 |
Dividends receivable | | 2,319,908 |
Interest receivable | | 17,945,180 |
Distributions receivable from Fidelity Central Funds | | 33,222 |
Receivable from investment adviser for expense reductions | | 931 |
Other receivables | | 14,103 |
Total assets | | 4,229,132,669 |
| | |
Liabilities | | |
Payable for investments purchased
Regular delivery | $ 19,236,871 | |
Delayed delivery | 2,505,000 | |
Payable for fund shares redeemed | 4,769,953 | |
Accrued management fee | 1,934,696 | |
Distribution and service plan fees payable | 305,492 | |
Other affiliated payables | 869,606 | |
Other payables and accrued expenses | 94,246 | |
Collateral on securities loaned, at value | 25,440,125 | |
Total liabilities | | 55,155,989 |
| | |
Net Assets | | $ 4,173,976,680 |
Net Assets consist of: | | |
Paid in capital | | $ 3,809,242,280 |
Undistributed net investment income | | 34,654,174 |
Accumulated undistributed net realized gain (loss) on investments and foreign currency transactions | | 61,167,863 |
Net unrealized appreciation (depreciation) on investments and assets and liabilities in foreign currencies | | 268,912,363 |
Net Assets | | $ 4,173,976,680 |
See accompanying notes which are an integral part of the financial statements.
Annual Report
Financial Statements - continued
Statement of Assets and Liabilities - continued
| July 31, 2014 |
| | |
Calculation of Maximum Offering Price Class A:
Net Asset Value and redemption price per share ($442,271,076 ÷ 37,302,014 shares) | | $ 11.86 |
| | |
Maximum offering price per share (100/96.00 of $11.86) | | $ 12.35 |
Class T:
Net Asset Value and redemption price per share ($48,163,837 ÷ 4,060,118 shares) | | $ 11.86 |
| | |
Maximum offering price per share (100/96.00 of $11.86) | | $ 12.35 |
Class C:
Net Asset Value and offering price per share ($246,305,622 ÷ 20,927,526 shares)A | | $ 11.77 |
| | |
Real Estate Income:
Net Asset Value, offering price and redemption price per share ($2,627,381,994 ÷ 220,647,573 shares) | | $ 11.91 |
| | |
Institutional Class:
Net Asset Value, offering price and redemption price per share ($809,854,151 ÷ 68,165,791 shares) | | $ 11.88 |
A Redemption price per share is equal to net asset value less any applicable contingent deferred sales charge.
See accompanying notes which are an integral part of the financial statements.
Annual Report
Statement of Operations
| Year ended July 31, 2014 |
| | |
Investment Income | | |
Dividends (including $5,963,494 earned from other affiliated issuers) | | $ 90,314,113 |
Interest | | 114,777,571 |
Income from Fidelity Central Funds | | 339,260 |
Total income | | 205,430,944 |
| | |
Expenses | | |
Management fee | $ 21,222,992 | |
Transfer agent fees | 8,548,801 | |
Distribution and service plan fees | 3,173,091 | |
Accounting and security lending fees | 1,324,787 | |
Custodian fees and expenses | 58,383 | |
Independent trustees' compensation | 15,901 | |
Registration fees | 199,090 | |
Audit | 172,246 | |
Legal | 12,720 | |
Miscellaneous | 35,095 | |
Total expenses before reductions | 34,763,106 | |
Expense reductions | (73,686) | 34,689,420 |
Net investment income (loss) | | 170,741,524 |
Realized and Unrealized Gain (Loss) Net realized gain (loss) on: | | |
Investment securities: | | |
Unaffiliated issuers | 105,441,630 | |
Other affiliated issuers | 442,084 | |
Foreign currency transactions | 662 | |
Total net realized gain (loss) | | 105,884,376 |
Change in net unrealized appreciation (depreciation) on: Investment securities | 30,350,617 | |
Assets and liabilities in foreign currencies | (1,671) | |
Total change in net unrealized appreciation (depreciation) | | 30,348,946 |
Net gain (loss) | | 136,233,322 |
Net increase (decrease) in net assets resulting from operations | | $ 306,974,846 |
See accompanying notes which are an integral part of the financial statements.
Annual Report
Financial Statements - continued
Statement of Changes in Net Assets
| Year ended
July 31,
2014 | Year ended
July 31,
2013 |
Increase (Decrease) in Net Assets | | |
Operations | | |
Net investment income (loss) | $ 170,741,524 | $ 172,485,619 |
Net realized gain (loss) | 105,884,376 | 73,494,885 |
Change in net unrealized appreciation (depreciation) | 30,348,946 | 61,789,333 |
Net increase (decrease) in net assets resulting
from operations | 306,974,846 | 307,769,837 |
Distributions to shareholders from net investment income | (172,155,251) | (159,910,438) |
Distributions to shareholders from net realized gain | (78,297,244) | (51,534,162) |
Total distributions | (250,452,495) | (211,444,600) |
Share transactions - net increase (decrease) | (6,051,637) | 1,340,100,515 |
Redemption fees | 438,384 | 782,946 |
Total increase (decrease) in net assets | 50,909,098 | 1,437,208,698 |
| | |
Net Assets | | |
Beginning of period | 4,123,067,582 | 2,685,858,884 |
End of period (including undistributed net investment income of $34,654,174 and undistributed net investment income of $39,267,501, respectively) | $ 4,173,976,680 | $ 4,123,067,582 |
See accompanying notes which are an integral part of the financial statements.
Annual Report
Financial Highlights - Class A
Years ended July 31, | 2014 | 2013 | 2012 | 2011 | 2010 H |
Selected Per-Share Data | | | | | |
Net asset value, beginning of period | $ 11.67 | $ 11.26 | $ 10.73 | $ 9.94 | $ 9.95 |
Income from Investment Operations | | | | | |
Net investment income (loss) E | .49 | .54 | .52 | .53 | .18 |
Net realized and unrealized gain (loss) | .44 | .60 | .61 | .76 | (.04) |
Total from investment operations | .93 | 1.14 | 1.13 | 1.29 | .14 |
Distributions from net investment income | (.50) | (.53) | (.51) | (.50) | (.15) |
Distributions from net realized gain | (.24) | (.20) | (.10) | - | - |
Total distributions | (.74) | (.73) | (.60) K | (.50) | (.15) |
Redemption fees added to paid in capital E, J | - | - | - | - | - |
Net asset value, end of period | $ 11.86 | $ 11.67 | $ 11.26 | $ 10.73 | $ 9.94 |
Total ReturnB, C, D | 8.49% | 10.45% | 11.24% | 13.27% | 1.46% |
Ratios to Average Net Assets F, I | | | | | |
Expenses before reductions | 1.06% | 1.08% | 1.12% | 1.13% | 1.09%A |
Expenses net of fee waivers, if any | 1.05% | 1.08% | 1.12% | 1.13% | 1.09%A |
Expenses net of all reductions | 1.05% | 1.07% | 1.11% | 1.12% | 1.09%A |
Net investment income (loss) | 4.28% | 4.62% | 4.89% | 5.00% | 6.23%A |
Supplemental Data | | | | | |
Net assets, end of period (000 omitted) | $ 442,271 | $ 378,269 | $ 137,352 | $ 60,283 | $ 3,830 |
Portfolio turnover rateG | 29% | 26% | 27% | 25% | 28% |
A Annualized
B Total returns for periods of less than one year are not annualized.
C Total returns would have been lower if certain expenses had not been reduced during the applicable periods shown.
D Total returns do not include the effect of the sales charges.
E Calculated based on average shares outstanding during the period.
F Fees and expenses of any underlying Fidelity Central Funds are not included in the Fund's expense ratio. The Fund indirectly bears its proportionate share of the expenses of any underlying Fidelity Central Funds.
G Amount does not include the portfolio activity of any underlying Fidelity Central Funds.
H For the period April 14, 2010 (commencement of sale of shares) to July 31, 2010.
I Expense ratios reflect operating expenses of the class. Expenses before reductions do not reflect amounts reimbursed by the investment adviser or reductions from brokerage service arrangements or reductions from other expense offset arrangements and do not represent the amount paid by the class during periods when reimbursements or reductions occur. Expense ratios before reductions for start-up periods may not be representative of longer-term operating periods. Expenses net of fee waivers reflect expenses after reimbursement by the investment adviser but prior to reductions from brokerage service arrangements or other expense offset arrangements. Expenses net of all reductions represent the net expenses paid by the class.
J Amount represents less than $.01 per share.
K Total distributions of $.60 per share is comprised of distributions from net investment income of $.505 and distributions from net realized gain of $.097 per share.
See accompanying notes which are an integral part of the financial statements.
Annual Report
Financial Highlights - Class T
Years ended July 31, | 2014 | 2013 | 2012 | 2011 | 2010 H |
Selected Per-Share Data | | | | | |
Net asset value, beginning of period | $ 11.67 | $ 11.26 | $ 10.72 | $ 9.94 | $ 9.95 |
Income from Investment Operations | | | | | |
Net investment income (loss) E | .49 | .54 | .52 | .52 | .17 |
Net realized and unrealized gain (loss) | .43 | .60 | .62 | .76 | (.03) |
Total from investment operations | .92 | 1.14 | 1.14 | 1.28 | .14 |
Distributions from net investment income | (.50) | (.53) | (.50) | (.50) | (.15) |
Distributions from net realized gain | (.24) | (.20) | (.10) | - | - |
Total distributions | (.73)K | (.73) | (.60) | (.50) | (.15) |
Redemption fees added to paid in capital E, J | - | - | - | - | - |
Net asset value, end of period | $ 11.86 | $ 11.67 | $ 11.26 | $ 10.72 | $ 9.94 |
Total ReturnB, C, D | 8.44% | 10.42% | 11.33% | 13.11% | 1.45% |
Ratios to Average Net Assets F, I | | | | | |
Expenses before reductions | 1.08% | 1.08% | 1.11% | 1.16% | 1.17%A |
Expenses net of fee waivers, if any | 1.08% | 1.08% | 1.11% | 1.16% | 1.17%A |
Expenses net of all reductions | 1.07% | 1.08% | 1.11% | 1.16% | 1.17%A |
Net investment income (loss) | 4.26% | 4.61% | 4.90% | 4.96% | 5.92%A |
Supplemental Data | | | | | |
Net assets, end of period (000 omitted) | $ 48,164 | $ 46,198 | $ 26,143 | $ 7,626 | $ 862 |
Portfolio turnover rateG | 29% | 26% | 27% | 25% | 28% |
A Annualized
B Total returns for periods of less than one year are not annualized.
C Total returns would have been lower if certain expenses had not been reduced during the applicable periods shown.
D Total returns do not include the effect of the sales charges.
E Calculated based on average shares outstanding during the period.
F Fees and expenses of any underlying Fidelity Central Funds are not included in the Fund's expense ratio. The Fund indirectly bears its proportionate share of the expenses of any underlying Fidelity Central Funds.
G Amount does not include the portfolio activity of any underlying Fidelity Central Funds.
H For the period April 14, 2010 (commencement of sale of shares) to July 31, 2010.
I Expense ratios reflect operating expenses of the class. Expenses before reductions do not reflect amounts reimbursed by the investment adviser or reductions from brokerage service arrangements or reductions from other expense offset arrangements and do not represent the amount paid by the class during periods when reimbursements or reductions occur. Expense ratios before reductions for start-up periods may not be representative of longer-term operating periods. Expenses net of fee waivers reflect expenses after reimbursement by the investment adviser but prior to reductions from brokerage service arrangements or other expense offset arrangements. Expenses net of all reductions represent the net expenses paid by the class.
J Amount represents less than $.01 per share.
K Total distributions of $.73 per share is comprised of distributions from net investment income of $.496 and distributions from net realized gain of $.236 per share.
See accompanying notes which are an integral part of the financial statements.
Annual Report
Financial Highlights - Class C
Years ended July 31, | 2014 | 2013 | 2012 | 2011 | 2010 H |
Selected Per-Share Data | | | | | |
Net asset value, beginning of period | $ 11.59 | $ 11.20 | $ 10.67 | $ 9.93 | $ 9.95 |
Income from Investment Operations | | | | | |
Net investment income (loss) E | .40 | .45 | .44 | .45 | .15 |
Net realized and unrealized gain (loss) | .43 | .60 | .62 | .74 | (.03) |
Total from investment operations | .83 | 1.05 | 1.06 | 1.19 | .12 |
Distributions from net investment income | (.42) | (.46) | (.43) | (.45) | (.14) |
Distributions from net realized gain | (.24) | (.20) | (.10) | - | - |
Total distributions | (.65) K | (.66) | (.53) | (.45) | (.14) |
Redemption fees added to paid in capital E, J | - | - | - | - | - |
Net asset value, end of period | $ 11.77 | $ 11.59 | $ 11.20 | $ 10.67 | $ 9.93 |
Total ReturnB, C, D | 7.66% | 9.66% | 10.49% | 12.25% | 1.29% |
Ratios to Average Net Assets F, I | | | | | |
Expenses before reductions | 1.79% | 1.81% | 1.87% | 1.89% | 1.86%A |
Expenses net of fee waivers, if any | 1.79% | 1.81% | 1.87% | 1.89% | 1.86%A |
Expenses net of all reductions | 1.79% | 1.81% | 1.87% | 1.89% | 1.86%A |
Net investment income (loss) | 3.54% | 3.88% | 4.14% | 4.23% | 5.21%A |
Supplemental Data | | | | | |
Net assets, end of period (000 omitted) | $ 246,306 | $ 204,012 | $ 52,780 | $ 21,555 | $ 836 |
Portfolio turnover rateG | 29% | 26% | 27% | 25% | 28% |
A Annualized
B Total returns for periods of less than one year are not annualized.
C Total returns would have been lower if certain expenses had not been reduced during the applicable periods shown.
D Total returns do not include the effect of the contingent deferred sales charge.
E Calculated based on average shares outstanding during the period.
F Fees and expenses of any underlying Fidelity Central Funds are not included in the Fund's expense ratio. The Fund indirectly bears its proportionate share of the expenses of any underlying Fidelity Central Funds.
G Amount does not include the portfolio activity of any underlying Fidelity Central Funds.
H For the period April 14, 2010 (commencement of sale of shares) to July 31, 2010.
I Expense ratios reflect operating expenses of the class. Expenses before reductions do not reflect amounts reimbursed by the investment adviser or reductions from brokerage service arrangements or reductions from other expense offset arrangements and do not represent the amount paid by the class during periods when reimbursements or reductions occur. Expense ratios before reductions for start-up periods may not be representative of longer-term operating periods. Expenses net of fee waivers reflect expenses after reimbursement by the investment adviser but prior to reductions from brokerage service arrangements or other expense offset arrangements. Expenses net of all reductions represent the net expenses paid by the class.
J Amount represents less than $.01 per share.
K Total distributions of $.65 per share is comprised of distributions from net investment income of $.417 and distributions from net realized gain of $.236 per share.
See accompanying notes which are an integral part of the financial statements.
Annual Report
Financial Highlights - Real Estate Income
Years ended July 31, | 2014 | 2013 | 2012 | 2011 | 2010 |
Selected Per-Share Data | | | | | |
Net asset value, beginning of period | $ 11.71 | $ 11.29 | $ 10.75 | $ 9.95 | $ 8.21 |
Income from Investment Operations | | | | | |
Net investment income (loss) B | .52 | .57 | .54 | .55 | .53 |
Net realized and unrealized gain (loss) | .44 | .60 | .62 | .76 | 1.73 |
Total from investment operations | .96 | 1.17 | 1.16 | 1.31 | 2.26 |
Distributions from net investment income | (.53) | (.55) | (.52) | (.51) | (.52) |
Distributions from net realized gain | (.24) | (.20) | (.10) | - | - |
Total distributions | (.76) G | (.75) | (.62) | (.51) | (.52) |
Redemption fees added to paid in capital B, F | - | - | - | - | - |
Net asset value, end of period | $ 11.91 | $ 11.71 | $ 11.29 | $ 10.75 | $ 9.95 |
Total ReturnA | 8.78% | 10.71% | 11.50% | 13.41% | 28.29% |
Ratios to Average Net Assets C, E | | | | | |
Expenses before reductions | .83% | .84% | .90% | .92% | .97% |
Expenses net of fee waivers, if any | .83% | .84% | .89% | .92% | .96% |
Expenses net of all reductions | .83% | .84% | .89% | .92% | .96% |
Net investment income (loss) | 4.50% | 4.85% | 5.12% | 5.21% | 5.60% |
Supplemental Data | | | | | |
Net assets, end of period (000 omitted) | $ 2,627,382 | $ 2,884,545 | $ 2,252,149 | $ 1,660,063 | $ 1,030,393 |
Portfolio turnover rateD | 29% | 26% | 27% | 25% | 28% |
A Total returns would have been lower if certain expenses had not been reduced during the applicable periods shown.
B Calculated based on average shares outstanding during the period.
C Fees and expenses of any underlying Fidelity Central Funds are not included in the Fund's expense ratio. The Fund indirectly bears its proportionate share of the expenses of any underlying Fidelity Central Funds.
D Amount does not include the portfolio activity of any underlying Fidelity Central Funds.
E Expense ratios reflect operating expenses of the class. Expenses before reductions do not reflect amounts reimbursed by the investment adviser or reductions from brokerage service arrangements or reductions from other expense offset arrangements and do not represent the amount paid by the class during periods when reimbursements or reductions occur. Expenses net of fee waivers reflect expenses after reimbursement by the investment adviser but prior to reductions from brokerage service arrangements or other expense offset arrangements. Expenses net of all reductions represent the net expenses paid by the class.
F Amount represents less than $.01 per share.
G Total distributions of $.76 per share is comprised of distributions from net investment income of $.525 and distributions from net realized gain of $.236 per share.
See accompanying notes which are an integral part of the financial statements.
Annual Report
Financial Highlights - Institutional Class
Years ended July 31, | 2014 | 2013 | 2012 | 2011 | 2010 G |
Selected Per-Share Data | | | | | |
Net asset value, beginning of period | $ 11.69 | $ 11.28 | $ 10.74 | $ 9.95 | $ 9.95 |
Income from Investment Operations | | | | | |
Net investment income (loss) D | .52 | .57 | .55 | .55 | .19 |
Net realized and unrealized gain (loss) | .44 | .60 | .62 | .76 | (.04) |
Total from investment operations | .96 | 1.17 | 1.17 | 1.31 | .15 |
Distributions from net investment income | (.53) | (.56) | (.53) | (.52) | (.15) |
Distributions from net realized gain | (.24) | (.20) | (.10) | - | - |
Total distributions | (.77) | (.76) | (.63) | (.52) | (.15) |
Redemption fees added to paid in capital D, I | - | - | - | - | - |
Net asset value, end of period | $ 11.88 | $ 11.69 | $ 11.28 | $ 10.74 | $ 9.95 |
Total ReturnB, C | 8.76% | 10.72% | 11.62% | 13.44% | 1.58% |
Ratios to Average Net Assets E, H | | | | | |
Expenses before reductions | .78% | .80% | .84% | .89% | .85%A |
Expenses net of fee waivers, if any | .78% | .80% | .84% | .89% | .85%A |
Expenses net of all reductions | .78% | .80% | .84% | .89% | .85%A |
Net investment income (loss) | 4.55% | 4.89% | 5.17% | 5.24% | 6.70%A |
Supplemental Data | | | | | |
Net assets, end of period (000 omitted) | $ 809,854 | $ 610,045 | $ 217,435 | $ 43,282 | $ 2,930 |
Portfolio turnover rateF | 29% | 26% | 27% | 25% | 28% |
A Annualized
B Total returns for periods of less than one year are not annualized.
C Total returns would have been lower if certain expenses had not been reduced during the applicable periods shown.
D Calculated based on average shares outstanding during the period.
E Fees and expenses of any underlying Fidelity Central Funds are not included in the Fund's expense ratio. The Fund indirectly bears its proportionate share of the expenses of any underlying Fidelity Central Funds.
F Amount does not include the portfolio activity of any underlying Fidelity Central Funds.
G For the period April 14, 2010 (commencement of sale of shares) to July 31, 2010.
H Expense ratios reflect operating expenses of the class. Expenses before reductions do not reflect amounts reimbursed by the investment adviser or reductions from brokerage service arrangements or reductions from other expense offset arrangements and do not represent the amount paid by the class during periods when reimbursements or reductions occur. Expense ratios before reductions for start-up periods may not be representative of longer-term operating periods. Expenses net of fee waivers reflect expenses after reimbursement by the investment adviser but prior to reductions from brokerage service arrangements or other expense offset arrangements. Expenses net of all reductions represent the net expenses paid by the class.
I Amount represents less than $.01 per share.
See accompanying notes which are an integral part of the financial statements.
Annual Report
Notes to Financial Statements
For the period ended July 31, 2014
1. Organization.
Fidelity Real Estate Income Fund (the Fund) is a fund of Fidelity Securities Fund (the Trust) and is authorized to issue an unlimited number of shares. The Trust is registered under the Investment Company Act of 1940, as amended (the 1940 Act), as an open-end management investment company organized as a Massachusetts business trust. The Fund offers Class A, Class T, Class C, Real Estate Income and Institutional Class shares, each of which has equal rights as to assets and voting privileges. Each class has exclusive voting rights with respect to matters that affect that class.
2. Investments in Fidelity Central Funds.
The Fund invests in Fidelity Central Funds, which are open-end investment companies generally available only to other investment companies and accounts managed by the investment adviser and its affiliates. The Fund's Schedule of Investments lists each of the Fidelity Central Funds held as of period end, if any, as an investment of the Fund, but does not include the underlying holdings of each Fidelity Central Fund. As an Investing Fund, the Fund indirectly bears its proportionate share of the expenses of the underlying Fidelity Central Funds.
The Money Market Central Funds seek preservation of capital and current income and are managed by Fidelity Investments Money Management, Inc. (FIMM), an affiliate of the investment adviser. Annualized expenses of the Money Market Central Funds as of their most recent shareholder report date are less than .01%.
A complete unaudited list of holdings for each Fidelity Central Fund is available upon request or at the Securities and Exchange Commission (the SEC) website at www.sec.gov. In addition, the financial statements of the Fidelity Central Funds, which are not covered by the Fund's Report of Independent Registered Public Accounting Firm, are available on the SEC website or upon request.
3. Significant Accounting Policies.
The financial statements have been prepared in conformity with accounting principles generally accepted in the United States of America (GAAP), which require management to make certain estimates and assumptions at the date of the financial statements. Actual results could differ from those estimates. Subsequent events, if any, through the date that the financial statements were issued have been evaluated in the preparation of the financial statements. The following summarizes the significant accounting policies of the Fund:
Investment Valuation. Investments are valued as of 4:00 p.m. Eastern time on the last calendar day of the period. In accordance with valuation policies and procedures approved by the Board of Trustees (the Board), the Fund attempts to obtain prices from
Annual Report
3. Significant Accounting Policies - continued
Investment Valuation - continued
one or more third party pricing vendors or brokers to value its investments. When current market prices, quotations or currency exchange rates are not readily available or reliable, investments will be fair valued in good faith by the Fidelity Management & Research Company (FMR) Fair Value Committee (the Committee), in accordance with procedures adopted by the Board. Factors used in determining fair value vary by investment type and may include market or investment specific events, changes in interest rates and credit quality. The frequency with which these procedures are used cannot be predicted and they may be utilized to a significant extent. The Committee oversees the Fund's valuation policies and procedures and is responsible for approving and reporting to the Board all fair value determinations.
The Fund categorizes the inputs to valuation techniques used to value its investments into a disclosure hierarchy consisting of three levels as shown below:
Level 1 - quoted prices in active markets for identical investments
Level 2 - other significant observable inputs (including quoted prices for similar investments, interest rates, prepayment speeds, etc.)
Level 3 - unobservable inputs (including the Fund's own assumptions based on the best information available)
Valuation techniques used to value the Fund's investments by major category are as follows:
Equity securities, including restricted securities, for which market quotations are readily available, are valued at the last reported sale price or official closing price as reported by a third party pricing vendor on the primary market or exchange on which they are traded and are categorized as Level 1 in the hierarchy. In the event there were no sales during the day or closing prices are not available, securities are valued at the last quoted bid price or may be valued using the last available price and are generally categorized as Level 2 in the hierarchy. For foreign equity securities, when market or security specific events arise, comparisons to the valuation of American Depositary Receipts (ADRs), futures contracts, Exchange-Traded Funds (ETFs) and certain indexes as well as quoted prices for similar securities may be used and would be categorized as Level 2 in the hierarchy. Utilizing these techniques may result in transfers between Level 1 and Level 2. For equity securities, including restricted securities, where observable inputs are limited, assumptions about market activity and risk are used and these securities may be categorized as Level 3 in the hierarchy.
Annual Report
Notes to Financial Statements - continued
3. Significant Accounting Policies - continued
Investment Valuation - continued
Debt securities, including restricted securities, are valued based on evaluated prices received from third party pricing vendors or from brokers who make markets in such securities. Corporate bonds, bank loan obligations and preferred securities are valued by pricing vendors who utilize matrix pricing which considers yield or price of bonds of comparable quality, coupon, maturity and type or by broker-supplied prices. Asset backed securities, collateralized mortgage obligations and commercial mortgage securities are valued by pricing vendors who utilize matrix pricing which considers prepayment speed assumptions, attributes of the collateral, yield or price of bonds of comparable quality, coupon, maturity and type or by broker-supplied prices. When independent prices are unavailable or unreliable, debt securities may be valued utilizing pricing methodologies which consider similar factors that would be used by third party pricing vendors. Debt securities are generally categorized as Level 2 in the hierarchy but may be Level 3 depending on the circumstances.
Investments in open-end mutual funds, including the Fidelity Central Funds, are valued at their closing net asset value (NAV) each business day and are categorized as Level 1 in the hierarchy.
The following provides information on Level 3 securities held by the Fund that were valued at period end based on unobservable inputs. These amounts exclude valuations provided by a broker.
Annual Report
3. Significant Accounting Policies - continued
Investment Valuation - continued
Asset Type | Fair Value at
07/31/14 | Valuation
Technique(s) | Unobservable
Input | Amount or Range/
Weighted
Average | Impact to
Valuation
from an
Increase in
Input* |
Asset-Backed Securities | $ 7,282,217 | Discounted cash flow | Yield | 3.0% - 10.4% / 4.5% | Decrease |
| | Expected distribution | Recovery rate | 0.0% | Increase |
Bank Loan
Obligations | $46,898,132 | Discounted cash flow | Yield | 2.1% - 10.5% / 6.1% | Decrease |
Collateralized Mortgage
Obligations | $ 726,477 | Discounted cash flow | Yield | 4.1% - 40.0% / 11.1% | Decrease |
Commercial Mortgage Securities | $ 6,929,493 | Discounted cash flow | Yield | 2.1% - 10.4% / 2.1% | Decrease |
| | Market comparable | Spread | 13.0% | Decrease |
Common Stocks | $ 6,928,291 | Adjusted book value | Book value
multiple | 1.3 | Increase |
Corporate Bonds | $ 500,157 | Discounted cash flow | Discount rate | 20.0% | Decrease |
| | Expected distribution | Recovery rate | 0.0% | Increase |
Preferred
Securities | $ 905,362 | Discounted cash flow | Yield | 13.0% | Decrease |
* Represents the expected directional change in the fair value of the Level 3 investments that would result from an increase in the corresponding input. A decrease to the unobservable input would have the opposite effect. Significant changes in these inputs could result in significantly higher or lower fair value measurements.
Changes in valuation techniques may result in transfers in or out of an assigned level within the disclosure hierarchy. The aggregate value of investments by input level, as of July 31, 2014, as well as a roll forward of Level 3 investments, is included at the end of the Fund's Schedule of Investments.
Foreign Currency. The Fund may use foreign currency contracts to facilitate transactions in foreign-denominated securities. Gains and losses from these transactions may arise from changes in the value of the foreign currency or if the counterparties do not perform under the contracts' terms.
Foreign-denominated assets, including investment securities, and liabilities are translated into U.S. dollars at the exchange rates at period end. Purchases and sales of investment securities, income and dividends received and expenses denominated in foreign currencies are translated into U.S. dollars at the exchange rate in effect on the transaction date.
The effects of exchange rate fluctuations on investments are included with the net realized and unrealized gain (loss) on investment securities. Other foreign currency transactions resulting in realized and unrealized gain (loss) are disclosed separately.
Annual Report
Notes to Financial Statements - continued
3. Significant Accounting Policies - continued
Investment Transactions and Income. For financial reporting purposes, the Fund's investment holdings and NAV include trades executed through the end of the last business day of the period. The NAV per share for processing shareholder transactions is calculated as of the close of business of the New York Stock Exchange (NYSE), normally 4:00 p.m. Eastern time and includes trades executed through the end of the prior business day. Gains and losses on securities sold are determined on the basis of identified cost. Dividend income is recorded on the ex-dividend date, except for certain dividends from foreign securities where the ex-dividend date may have passed, which are recorded as soon as the Fund is informed of the ex-dividend date. Non-cash dividends included in dividend income, if any, are recorded at the fair market value of the securities received. Income and capital gain distributions from Fidelity Central Funds, if any, are recorded on the ex-dividend date. Distributions received on securities that represent a return of capital or capital gain are recorded as a reduction of cost of investments and/or as a realized gain. Subsequent to ex-dividend date the Fund determines the components of these distributions, based upon receipt of tax filings or other correspondence relating to the underlying investment. Interest income is accrued as earned and includes coupon interest and amortization of premium and accretion of discount on debt securities as applicable. For certain lower credit quality securitized assets that have contractual cash flows (for example, asset backed securities, collateralized mortgage obligations and commercial mortgage-backed securities), changes in estimated cash flows are periodically evaluated and the estimated yield is adjusted on a prospective basis, resulting in increases or decreases to Interest Income in the accompanying Statement of Operations. Investment income is recorded net of foreign taxes withheld where recovery of such taxes is uncertain. Debt obligations may be placed on non-accrual status and related interest income may be reduced by ceasing current accruals and writing off interest receivables when the collection of all or a portion of interest has become doubtful based on consistently applied procedures. A debt obligation is removed from non-accrual status when the issuer resumes interest payments or when collectability of interest is reasonably assured.
Class Allocations and Expenses. Investment income, realized and unrealized capital gains and losses, common expenses of the Fund, and certain fund-level expense reductions, if any, are allocated daily on a pro-rata basis to each class based on the relative net assets of each class to the total net assets of the Fund. Each class differs with respect to transfer agent and distribution and service plan fees incurred. Certain expense reductions may also differ by class. For the reporting period, the allocated portion of income and expenses to each class as a percent of its average net assets may vary due to the timing of recording these transactions in relation to fluctuating net assets of the classes. Expenses directly attributable to a fund are charged to that fund. Expenses attributable
Annual Report
3. Significant Accounting Policies - continued
Class Allocations and Expenses - continued
to more than one fund are allocated among the respective funds on the basis of relative net assets or other appropriate methods. Expense estimates are accrued in the period to which they relate and adjustments are made when actual amounts are known.
Income Tax Information and Distributions to Shareholders. Each year, the Fund intends to qualify as a regulated investment company under Subchapter M of the Internal Revenue Code, including distributing substantially all of its taxable income and realized gains. As a result, no provision for U.S. Federal income taxes is required. As of July 31, 2014, the Fund did not have any unrecognized tax benefits in the financial statements; nor is the Fund aware of any tax positions for which it is reasonably possible that the total amounts of unrecognized tax benefits will significantly change in the next twelve months. The Fund files a U.S. federal tax return, in addition to state and local tax returns as required. The Fund's federal income tax returns are subject to examination by the Internal Revenue Service (IRS) for a period of three fiscal years after they are filed. State and local tax returns may be subject to examination for an additional fiscal year depending on the jurisdiction. Foreign taxes are provided for based on the Fund's understanding of the tax rules and rates that exist in the foreign markets in which it invests.
Distributions are declared and recorded on the ex-dividend date. Income dividends and capital gain distributions are declared separately for each class. Income and capital gain distributions are determined in accordance with income tax regulations, which may differ from GAAP. In addition, the Fund claimed a portion of the payment made to redeeming shareholders as a distribution for income tax purposes.
Capital accounts within the financial statements are adjusted for permanent book-tax differences. These adjustments have no impact on net assets or the results of operations. Capital accounts are not adjusted for temporary book-tax differences which will reverse in a subsequent period.
Book-tax differences are primarily due to foreign currency transactions, passive foreign investment companies (PFIC), market discount, partnerships, equity-debt classifications and losses deferred due to wash sales.
Annual Report
Notes to Financial Statements - continued
3. Significant Accounting Policies - continued
Income Tax Information and Distributions to Shareholders - continued
The federal tax cost of investment securities and unrealized appreciation (depreciation) as of period end were as follows:
Gross unrealized appreciation | $ 331,991,084 |
Gross unrealized depreciation | (67,454,992) |
Net unrealized appreciation (depreciation) on securities | $ 264,536,092 |
| |
Tax Cost | $ 3,924,157,768 |
The tax-based components of distributable earnings as of period end were as follows:
Undistributed ordinary income | $ 39,196,788 |
Undistributed long-term capital gain | $ 61,346,649 |
Net unrealized appreciation (depreciation) on securities and other investments | $ 264,559,628 |
The tax character of distributions paid was as follows:
| July 31, 2014 | July 31, 2013 |
Ordinary Income | $ 185,363,562 | $ 170,384,735 |
Long-term Capital Gains | 65,088,933 | 41,059,865 |
Total | $ 250,452,495 | $ 211,444,600 |
Short-Term Trading (Redemption) Fees. Shares held by investors in the Fund less than 90 days may have been subject to a redemption fee equal to .75% of the NAV of shares redeemed. All redemption fees, which reduce the proceeds of the shareholder redemption, are retained by the Fund and accounted for as an addition to paid in capital.
Delayed Delivery Transactions and When-Issued Securities. During the period, the Fund transacted in securities on a delayed delivery or when-issued basis. Payment and delivery may take place after the customary settlement period for that security. The price of the underlying securities and the date when the securities will be delivered and paid for are fixed at the time the transaction is negotiated. The securities purchased on a delayed delivery or when-issued basis are identified as such in the Fund's Schedule of Investments. The Fund may receive compensation for interest forgone in the purchase of a delayed delivery or when-issued security. With respect to purchase commitments, the Fund identifies securities as segregated in its records with a value at least equal to the amount of the commitment. Losses may arise due to changes in the value of the underlying securities or if the counterparty does not perform under the contract's terms, or if the issuer does not issue the securities due to political, economic, or other factors.
Annual Report
3. Significant Accounting Policies - continued
Restricted Securities. The Fund may invest in securities that are subject to legal or contractual restrictions on resale. These securities generally may be resold in transactions exempt from registration or to the public if the securities are registered. Disposal of these securities may involve time-consuming negotiations and expense, and prompt sale at an acceptable price may be difficult. Information regarding restricted securities is included at the end of the Fund's Schedule of Investments.
Loans and Other Direct Debt Instruments. The Fund invests in direct debt instruments which are interests in amounts owed to lenders by corporate or other borrowers. These instruments may be in the form of loans, trade claims or other receivables and may include standby financing commitments such as revolving credit facilities that obligate the Fund to supply additional cash to the borrower on demand. Loans may be acquired through assignment or participation, or may be made directly to a borrower. The Fund did not have any unfunded loan commitments, which are contractual obligations for future funding, at period end.
4. Purchases and Sales of Investments.
Purchases and sales of securities, other than short-term securities and U.S. government securities, aggregated $1,052,015,263 and $1,138,541,279, respectively.
5. Fees and Other Transactions with Affiliates.
Management Fee. Fidelity Management & Research Company (the investment adviser) and its affiliates provide the Fund with investment management related services for which the Fund pays a monthly management fee. The management fee is the sum of an individual fund fee rate that is based on an annual rate of .30% of the Fund's average net assets and an annualized group fee rate that averaged .25% during the period. The group fee rate is based upon the average net assets of all the mutual funds advised by the investment adviser, including any mutual funds previously advised by the investment adviser that are currently advised by Fidelity SelectCo, LLC, an affiliate of the investment adviser. The group fee rate decreases as assets under management increase and increases as assets under management decrease. For the reporting period, the total annual management fee rate was .55% of the Fund's average net assets.
Distribution and Service Plan Fees. In accordance with Rule 12b-1 of the 1940 Act, the Fund has adopted separate Distribution and Service Plans for each class of shares. Certain classes pay Fidelity Distributors Corporation (FDC), an affiliate of the investment adviser, separate Distribution and Service Fees, each of which is based on an annual percentage of each class' average net assets. In addition, FDC may pay financial intermediaries for selling shares of the Fund and providing shareholder support services.
Annual Report
Notes to Financial Statements - continued
5. Fees and Other Transactions with Affiliates - continued
Distribution and Service Plan Fees - continued
For the period, the Distribution and Service Fee rates, total fees and amounts retained by FDC were as follows:
| Distribution
Fee | Service
Fee | Total Fees | Retained
by FDC |
Class A | -% | .25% | $ 967,235 | $ 25,663 |
Class T | -% | .25% | 108,744 | 40 |
Class C | .75% | .25% | 2,097,112 | 927,749 |
| | | $ 3,173,091 | $ 953,452 |
Sales Load. FDC may receive a front-end sales charge of up to 4.00% for selling Class A shares and Class T shares, some of which is paid to financial intermediaries for selling shares of the Fund. Depending on the holding period, FDC may receive contingent deferred sales charges levied on Class A, Class T and Class C redemptions. The deferred sales charges range from 1.00% for Class C shares, 1.00% for certain purchases of Class A shares and .25% for certain purchases of Class T shares.
For the period, sales charge amounts retained by FDC were as follows:
| Retained
by FDC |
Class A | $ 109,599 |
Class T | 12,563 |
Class C* | 74,180 |
| $ 196,342 |
* When Class C shares are initially sold, FDC pays commissions from its own resources to financial intermediaries through which the sales are made.
Transfer Agent Fees. Fidelity Investments Institutional Operations Company, Inc., (FIIOC), an affiliate of the investment adviser, is the transfer, dividend disbursing and shareholder servicing agent for each class of the Fund. FIIOC receives account fees and asset-based fees that vary according to the account size and type of account of the shareholders of the respective classes of the Fund. FIIOC pays for typesetting, printing and mailing of shareholder reports, except proxy statements.
For the period, transfer agent fees for each class were as follows:
| Amount | % of
Average
Net Assets |
Class A | $ 805,109 | .21 |
Class T | 99,408 | .23 |
Class C | 404,930 | .19 |
Real Estate Income | 6,054,879 | .23 |
Institutional Class | 1,184,475 | .19 |
| $ 8,548,801 | |
Annual Report
5. Fees and Other Transactions with Affiliates - continued
Accounting and Security Lending Fees. Fidelity Service Company, Inc. (FSC), an affiliate of the investment adviser, maintains the Fund's accounting records. The accounting fee is based on the level of average net assets for each month. Under a separate contract, FSC administers the security lending program. The security lending fee is based on the number and duration of lending transactions.
Brokerage Commissions. The Fund placed a portion of its portfolio transactions with brokerage firms which are affiliates of the investment adviser. Brokerage commissions are included in net realized gain (loss) and change in net unrealized appreciation (depreciation) in the Statement of Operations. The commissions paid to these affiliated firms were $26,723 for the period.
6. Committed Line of Credit.
The Fund participates with other funds managed by the investment adviser or an affiliate in a $4.25 billion credit facility (the "line of credit") to be utilized for temporary or emergency purposes to fund shareholder redemptions or for other short-term liquidity purposes. The Fund has agreed to pay commitment fees on its pro-rata portion of the line of credit, which amounted to $6,555 and is reflected in Miscellaneous expenses on the Statement of Operations. During the period, the Fund did not borrow on this line of credit.
7. Security Lending.
The Fund lends portfolio securities through a lending agent from time to time in order to earn additional income. For equity securities, a lending agent is used and may loan securities to certain qualified borrowers, including Fidelity Capital Markets (FCM), a broker-dealer affiliated with the Fund. On the settlement date of the loan, the Fund receives collateral (in the form of U.S. Treasury obligations, letters of credit and/or cash) against the loaned securities and maintains collateral in an amount not less than 100% of the market value of the loaned securities during the period of the loan. The market value of the loaned securities is determined at the close of business of the Fund and any additional required collateral is delivered to the Fund on the next business day. If the borrower defaults on its obligation to return the securities loaned because of insolvency or other reasons, the Fund may apply collateral received from the borrower against the obligation. The Fund may experience delays and costs in recovering the securities loaned. Any cash collateral received is invested in the Fidelity Securities Lending Cash Central Fund. The value of loaned securities and cash collateral at period end are disclosed on the Fund's Statement of Assets and Liabilities. At period end, there were no security loans outstanding with FCM. Security lending income represents the income
Annual Report
Notes to Financial Statements - continued
7. Security Lending - continued
earned on investing cash collateral, less rebates paid to borrowers and any lending agent fees associated with the loan, plus any premium payments received for lending certain types of securities. Security lending income is presented in the Statement of Operations as a component of income from Fidelity Central Funds. Total security lending income during the period amounted to $69,287, including $155 from securities loaned to FCM.
8. Expense Reductions.
Commissions paid to certain brokers with whom the investment adviser, or its affiliates, places trades on behalf of the Fund include an amount in addition to trade execution, which may be rebated back to the Fund to offset certain expenses. This amount totaled $51,646 for the period. In addition, through arrangements with the Fund's custodian, credits realized as a result of uninvested cash balances were used to reduce the Fund's expenses. During the period, these credits reduced the Fund's custody expenses by $1,517.
In addition, the investment adviser reimbursed a portion of the Fund's operating expenses during the period in the amount of $20,523.
9. Distributions to Shareholders.
Distributions to shareholders of each class were as follows:
Years ended July 31, | 2014 | 2013 |
From net investment income | | |
Class A | $ 16,638,771 | $ 10,238,777 |
Class T | 1,842,576 | 1,523,114 |
Class C | 7,530,932 | 4,241,554 |
Real Estate Income | 117,401,887 | 126,726,805 |
Institutional Class | 28,741,085 | 17,180,188 |
Total | $ 172,155,251 | $ 159,910,438 |
From net realized gain | | |
Class A | $ 7,591,572 | $ 2,837,075 |
Class T | 874,881 | 506,062 |
Class C | 4,152,718 | 1,181,312 |
Real Estate Income | 53,508,422 | 42,729,814 |
Institutional Class | 12,169,651 | 4,279,899 |
Total | $ 78,297,244 | $ 51,534,162 |
Annual Report
10. Share Transactions.
Transactions for each class of shares were as follows:
| Shares | Dollars |
Years ended July 31, | 2014 | 2013 | 2014 | 2013 |
Class A | | | | |
Shares sold | 18,815,698 | 25,244,691 | $ 217,399,754 | $ 296,851,509 |
Reinvestment of distributions | 1,805,230 | 900,102 | 20,178,624 | 10,299,964 |
Shares redeemed | (15,738,034) | (5,925,325) | (180,458,692) | (69,436,144) |
Net increase (decrease) | 4,882,894 | 20,219,468 | $ 57,119,686 | $ 237,715,329 |
Class T | | | | |
Shares sold | 1,270,924 | 2,730,063 | $ 14,645,845 | $ 31,978,463 |
Reinvestment of distributions | 211,146 | 132,742 | 2,357,016 | 1,515,681 |
Shares redeemed | (1,380,258) | (1,226,451) | (15,703,373) | (14,137,454) |
Net increase (decrease) | 101,812 | 1,636,354 | $ 1,299,488 | $ 19,356,690 |
Class C | | | | |
Shares sold | 9,015,535 | 14,157,408 | $ 103,482,191 | $ 165,598,758 |
Reinvestment of distributions | 813,525 | 375,304 | 9,012,478 | 4,279,651 |
Shares redeemed | (6,508,928) | (1,637,958) | (73,908,752) | (19,029,492) |
Net increase (decrease) | 3,320,132 | 12,894,754 | $ 38,585,917 | $ 150,848,917 |
Real Estate Income | | | | |
Shares sold | 61,717,695 | 123,727,906 | $ 711,894,953 | $ 1,450,014,694 |
Reinvestment of distributions | 13,609,464 | 13,299,047 | 152,306,330 | 151,923,311 |
Shares redeemed | (100,931,769) | (90,180,888) | (1,156,054,958) | (1,057,830,249) |
Net increase (decrease) | (25,604,610) | 46,846,065 | $ (291,853,675) | $ 544,107,756 |
Institutional Class | | | | |
Shares sold | 40,192,476 | 42,960,747 | $ 465,679,843 | $ 506,030,603 |
Reinvestment of distributions | 2,412,058 | 1,337,082 | 27,006,597 | 15,315,413 |
Shares redeemed | (26,626,486) | (11,392,454) | (303,889,493) | (133,274,193) |
Net increase (decrease) | 15,978,048 | 32,905,375 | $ 188,796,947 | $ 388,071,823 |
Annual Report
Notes to Financial Statements - continued
11. Other.
The Fund's organizational documents provide former and current trustees and officers with a limited indemnification against liabilities arising in connection with the performance of their duties to the Fund. In the normal course of business, the Fund may also enter into contracts that provide general indemnifications. The Fund's maximum exposure under these arrangements is unknown as this would be dependent on future claims that may be made against the Fund. The risk of material loss from such claims is considered remote.
Annual Report
To the Trustees of Fidelity Securities Fund and Shareholders of Fidelity Real Estate Income Fund:
We have audited the accompanying statement of assets and liabilities of Fidelity Real Estate Income Fund (the Fund), a fund of Fidelity Securities Fund, including the schedule of investments, as of July 31, 2014, and the related statement of operations for the year then ended, the statement of changes in net assets for each of the two years in the period then ended, and the financial highlights for each of the five years in the period then ended. These financial statements and financial highlights are the responsibility of the Fund's management. Our responsibility is to express an opinion on these financial statements and financial highlights based on our audits.
We conducted our audits in accordance with the standards of the Public Company Accounting Oversight Board (United States). Those standards require that we plan and perform the audit to obtain reasonable assurance about whether the financial statements and financial highlights are free of material misstatement. The Fund is not required to have, nor were we engaged to perform, an audit of its internal control over financial reporting. Our audits included consideration of internal control over financial reporting as a basis for designing audit procedures that are appropriate in the circumstances, but not for the purpose of expressing an opinion on the effectiveness of the Fund's internal control over financial reporting. Accordingly, we express no such opinion. An audit also includes examining, on a test basis, evidence supporting the amounts and disclosures in the financial statements, assessing the accounting principles used and significant estimates made by management, as well as evaluating the overall financial statement presentation. Our procedures included confirmation of securities owned as of July 31, 2014, by correspondence with the custodians and brokers; where replies were not received from brokers, we performed other auditing procedures. We believe that our audits provide a reasonable basis for our opinion.
In our opinion, the financial statements and financial highlights referred to above present fairly, in all material respects, the financial position of Fidelity Real Estate Income Fund as of July 31, 2014, the results of its operations for the year then ended, the changes in its net assets for each of the two years in the period then ended, and the financial highlights for each of the five years in the period then ended, in conformity with accounting principles generally accepted in the United States of America.
DELOITTE & TOUCHE LLP
Boston, Massachusetts
September 19, 2014
Annual Report
The Trustees, Member of the Advisory Board, and officers of the trust and fund, as applicable, are listed below. The Board of Trustees governs the fund and is responsible for protecting the interests of shareholders. The Trustees are experienced executives who meet periodically throughout the year to oversee the fund's activities, review contractual arrangements with companies that provide services to the fund, oversee management of the risks associated with such activities and contractual arrangements, and review the fund's performance. Except for James C. Curvey, each of the Trustees oversees 173 funds. Mr. Curvey oversees 397 funds.
The Trustees hold office without limit in time except that (a) any Trustee may resign; (b) any Trustee may be removed by written instrument, signed by at least two-thirds of the number of Trustees prior to such removal; (c) any Trustee who requests to be retired or who has become incapacitated by illness or injury may be retired by written instrument signed by a majority of the other Trustees; and (d) any Trustee may be removed at any special meeting of shareholders by a two-thirds vote of the outstanding voting securities of the trust. Each Trustee who is not an interested person (as defined in the 1940 Act) of the trust and the fund (Independent Trustee), shall retire not later than the last day of the calendar year in which his or her 75th birthday occurs. The Independent Trustees may waive this mandatory retirement age policy with respect to individual Trustees. The officers and Advisory Board Member hold office without limit in time, except that any officer and Advisory Board Member may resign or may be removed by a vote of a majority of the Trustees at any regular meeting or any special meeting of the Trustees. Except as indicated, each individual has held the office shown or other offices in the same company for the past five years.
Experience, Skills, Attributes, and Qualifications of the Fund's Trustees. The Governance and Nominating Committee has adopted a statement of policy that describes the experience, qualifications, attributes, and skills that are necessary and desirable for potential Independent Trustee candidates (Statement of Policy). The Board believes that each Trustee satisfied at the time he or she was initially elected or appointed a Trustee, and continues to satisfy, the standards contemplated by the Statement of Policy. The Governance and Nominating Committee also engages professional search firms to help identify potential Independent Trustee candidates who have the experience, qualifications, attributes, and skills consistent with the Statement of Policy. From time to time, additional criteria based on the composition and skills of the current Independent Trustees, as well as experience or skills that may be appropriate in light of future changes to board composition, business conditions, and regulatory or other developments, have also been considered by the professional search firms and the Governance and Nominating Committee. In addition, the Board takes into account the Trustees' commitment and participation in Board and committee meetings, as well as their leadership of standing and ad hoc committees throughout their tenure.
In determining that a particular Trustee was and continues to be qualified to serve as a Trustee, the Board has considered a variety of criteria, none of which, in isolation, was controlling. The Board believes that, collectively, the Trustees have balanced and diverse experience, qualifications, attributes, and skills, which allow the Board to operate effectively in governing the fund and protecting the interests of shareholders. Information about the specific experience, skills, attributes, and qualifications of each Trustee, which in each case led to the Board's conclusion that the Trustee should serve (or continue to serve) as a trustee of the fund, is provided below.
Annual Report
Board Structure and Oversight Function. James C. Curvey is an interested person (as defined in the 1940 Act) and currently serves as Chairman. The Trustees have determined that an interested Chairman is appropriate and benefits shareholders because an interested Chairman has a personal and professional stake in the quality and continuity of services provided to the fund. Independent Trustees exercise their informed business judgment to appoint an individual of their choosing to serve as Chairman, regardless of whether the Trustee happens to be independent or a member of management. The Independent Trustees have determined that they can act independently and effectively without having an Independent Trustee serve as Chairman and that a key structural component for assuring that they are in a position to do so is for the Independent Trustees to constitute a substantial majority for the Board. The Independent Trustees also regularly meet in executive session. Ned C. Lautenbach serves as Chairman of the Independent Trustees and as such (i) acts as a liaison between the Independent Trustees and management with respect to matters important to the Independent Trustees and (ii) with management prepares agendas for Board meetings.
Fidelity funds are overseen by different Boards of Trustees. The fund's Board oversees Fidelity's equity and high income funds and another Board oversees Fidelity's investment-grade bond, money market, and asset allocation funds. The asset allocation funds may invest in Fidelity funds overseen by the fund's Board. The use of separate Boards, each with its own committee structure, allows the Trustees of each group of Fidelity funds to focus on the unique issues of the funds they oversee, including common research, investment, and operational issues. On occasion, the separate Boards establish joint committees to address issues of overlapping consequences for the Fidelity funds overseen by each Board.
The Trustees operate using a system of committees to facilitate the timely and efficient consideration of all matters of importance to the Trustees, the fund, and fund shareholders and to facilitate compliance with legal and regulatory requirements and oversight of the fund's activities and associated risks. The Board, acting through its committees, has charged FMR and its affiliates with (i) identifying events or circumstances the occurrence of which could have demonstrably adverse effects on the fund's business and/or reputation; (ii) implementing processes and controls to lessen the possibility that such events or circumstances occur or to mitigate the effects of such events or circumstances if they do occur; and (iii) creating and maintaining a system designed to evaluate continuously business and market conditions in order to facilitate the identification and implementation processes described in (i) and (ii) above. Because the day-to-day operations and activities of the fund are carried out by or through FMR, its affiliates and other service providers, the fund's exposure to risks is mitigated but not eliminated by the processes overseen by the Trustees. While each of the Board's committees has responsibility for overseeing different aspects of the fund's activities, oversight is exercised primarily through the Operations, Audit, and Compliance Committees. In addition, the Independent Trustees have worked with FMR to enhance the Board's oversight of investment and financial risks, legal and regulatory risks, technology risks, and operational risks, including the development of additional risk reporting to the Board. For example, a working group comprised of Independent Trustees and FMR has worked and continues to work to review the Fidelity funds' valuation-related activities, reporting and risk management. Appropriate personnel, including but not limited to the fund's Chief Compliance Officer (CCO), FMR's internal auditor, the independent accountants, the fund's Treasurer and portfolio management personnel, make periodic reports to the Board's committees, as appropriate, including an annual review of FMR's risk management program for the Fidelity funds. The responsibilities of each standing committee, including their oversight responsibilities, are described further under "Standing Committees of the Fund's Trustees."
Annual Report
Trustees and Officers - continued
The fund's Statement of Additional Information (SAI) includes more information about the Trustees. To request a free copy, call Fidelity at 1-800-544-8544.
Interested Trustees*:
Correspondence intended for each Trustee who is an interested person may be sent to Fidelity Investments, 245 Summer Street, Boston, Massachusetts 02210.
Name, Year of Birth; Principal Occupations and Other Relevant Experience+ |
James C. Curvey (1935) |
Year of Election or Appointment: 2007 Trustee Chairman of the Board of Trustees |
| Mr. Curvey also serves as Trustee of other Fidelity funds. Mr. Curvey is a Director of Fidelity Research & Analysis Co. (2009-present), and Vice Chairman (2007-present) and Director of FMR LLC. In addition, Mr. Curvey serves as an Overseer for the Boston Symphony Orchestra and a member of the Trustees of Villanova University. Previously, Mr. Curvey served as a Director of Fidelity Investments Money Management, Inc. (2009-2014), a Director of FMR (2007-2014), a Director of FMR Co., Inc. (2007-2014) and was the Vice Chairman (2006-2007) and Director (2000-2007) of FMR Corp. |
Charles S. Morrison (1960) |
Year of Election or Appointment: 2014 Trustee |
| Mr. Morrison also serves as Trustee of other funds. He serves as President, Asset Management (2014-present) and is an employee of Fidelity Investments. Previously, Mr. Morrison served as Vice President of Fidelity's Fixed Income and Asset Allocation Funds (2012-2014), President, Fixed Income (2011-2014), Vice President of Fidelity's Money Market Funds (2005-2009), President, Money Market Group Leader of FMR (2009), and Senior Vice President, Money Market Group of FMR (2004-2009). Mr. Morrison also served as Vice President of Fidelity's Bond Funds (2002-2005), certain Balanced Funds (2002-2005), and certain Asset Allocation Funds (2002-2007), and as Senior Vice President (2002-2005) of Fidelity's Bond Division. |
* Trustees have been determined to be "Interested Trustees" by virtue of, among other things, their affiliation with the trust or various entities under common control with FMR.
+ The information above includes each Trustee's principal occupation during the last five years and other information relating to the experience, attributes, and skills relevant to each Trustee's qualifications to serve as a Trustee, which led to the conclusion that each Trustee should serve as a Trustee for the fund.
Annual Report
Trustees and Officers - continued
Independent Trustees:
Correspondence intended for each Independent Trustee (that is, the Trustees other than the Interested Trustees) may be sent to Fidelity Investments, P.O. Box 55235, Boston, Massachusetts 02205-5235.
Name, Year of Birth; Principal Occupations and Other Relevant Experience+ |
Dennis J. Dirks (1948) |
Year of Election or Appointment: 2005 Trustee |
| Mr. Dirks also serves as Trustee of other Fidelity funds. Prior to his retirement in May 2003, Mr. Dirks was Chief Operating Officer and a member of the Board of The Depository Trust & Clearing Corporation (DTCC). He also served as President, Chief Operating Officer, and Board member of The Depository Trust Company (DTC) and President and Board member of the National Securities Clearing Corporation (NSCC). In addition, Mr. Dirks served as Chief Executive Officer and Board member of the Government Securities Clearing Corporation, Chief Executive Officer and Board member of the Mortgage-Backed Securities Clearing Corporation, as a Trustee and a member of the Finance Committee of Manhattan College (2005-2008), and as a Trustee and a member of the Finance Committee of AHRC of Nassau County (2006-2008). Mr. Dirks is a member of the Independent Directors Council (IDC) Governing Council (2010-present) and Board of Directors for The Brookville Center for Children's Services, Inc. (2009-present). |
Alan J. Lacy (1953) |
Year of Election or Appointment: 2008 Trustee |
| Mr. Lacy also serves as Trustee of other Fidelity funds. Mr. Lacy serves as Senior Adviser (2007-present) of Oak Hill Capital Partners, L.P. (private equity). Mr. Lacy also served as Chief Executive Officer (2000-2005) and Vice Chairman (2005-2006) of Sears Holdings Corporation and Sears, Roebuck and Co. (retail). In addition, Mr. Lacy serves as a member of the Board of Directors of Dave & Buster's Entertainment, Inc. (restaurant and entertainment complexes, 2010-present), Earth Fare, Inc. (retail grocery, 2012-present), The Hillman Companies, Inc. (hardware wholesalers, 2010-present), and Bristol-Myers Squibb Company (global pharmaceuticals, 2008-present). Mr. Lacy is a member of the Board of Trustees of The National Parks Conservation Association (2006-present). Previously, Mr. Lacy served as Chairman of the Board of Trustees of the National Parks Conservation Association (2008-2011) and as a member of the Board of Directors for the Western Union Company (global money transfer, 2006-2011). |
Ned C. Lautenbach (1944) |
Year of Election or Appointment: 2000 Trustee Chairman of the Independent Trustees |
| Mr. Lautenbach also serves as Trustee of other Fidelity funds. Mr. Lautenbach currently serves as the Lead Director of the Eaton Corporation Board of Directors (diversified industrial, 1997-present). Mr. Lautenbach is Chairman of the Board of Directors of the Philharmonic Center for the Arts in Naples, Florida (2012-present) and a member of the Council on Foreign Relations (1994-present). Previously, Mr. Lautenbach was a Partner/Advisory Partner at Clayton, Dubilier & Rice, LLC (private equity investment, 1998-2010), as well as a Director of Sony Corporation (2006-2007). |
Joseph Mauriello (1944) |
Year of Election or Appointment: 2008 Trustee |
| Mr. Mauriello also serves as Trustee of other Fidelity funds. Prior to his retirement in January 2006, Mr. Mauriello served in numerous senior management positions including Deputy Chairman and Chief Operating Officer (2004-2005), and Vice Chairman of Financial Services (2002-2004) of KPMG LLP US (professional services, 1965-2005). Mr. Mauriello currently serves as a member of the Board of Directors of XL Group plc. (global insurance and re-insurance, 2006-present). Previously, Mr. Mauriello served as a Director of the Hamilton Funds of the Bank of New York (2006-2007) and of Arcadia Resources Inc. (health care services and products, 2007-2012). |
Robert W. Selander (1950) |
Year of Election or Appointment: 2011 Trustee |
| Mr. Selander also serves as Trustee of other Fidelity funds. Previously, Mr. Selander served as a Member of the Advisory Board of other Fidelity funds (2011), and Executive Vice Chairman (2010), Chief Executive Officer (2009-2010), and President and Chief Executive Officer (1997-2009) of Mastercard, Inc. |
Cornelia M. Small (1944) |
Year of Election or Appointment: 2005 Trustee |
| Ms. Small also serves as Trustee of other Fidelity funds. Ms. Small is a member of the Board of Directors (2009-present) and Chair of the Investment Committee (2010-present) of the Teagle Foundation. Ms. Small also serves on the Investment Committee of the Berkshire Taconic Community Foundation (2008-present). Previously, Ms. Small served as Chairperson (2002-2008) and a member of the Investment Committee and Chairperson (2008-2012) and a member of the Board of Trustees of Smith College. In addition, Ms. Small served as Chief Investment Officer, Director of Global Equity Investments, and a member of the Board of Directors of Scudder, Stevens & Clark and Scudder Kemper Investments. |
William S. Stavropoulos (1939) |
Year of Election or Appointment: 2002 Trustee Vice Chairman of the Independent Trustees |
| Mr. Stavropoulos also serves as Trustee of other Fidelity funds. Mr. Stavropoulos serves as President and Founder of the Michigan Baseball Foundation, the Great Lakes Loons (2007-present). Mr. Stavropoulos is Chairman Emeritus of the Board of Directors of The Dow Chemical Company, where he previously served in numerous senior management positions, including President, CEO (1995-2000; 2002-2004), Chairman of the Executive Committee (2000-2006), and as a member of the Board of Directors (1990-2006). Currently, Mr. Stavropoulos is Chairman of the Board of Directors of Univar Inc. (global distributor of commodity and specialty chemicals), a Director of Teradata Corporation (data warehousing and technology solutions), and Maersk Inc. (industrial conglomerate), and a member of the Advisory Board for Metalmark Capital LLC (private equity investment, 2005-present). Mr. Stavropoulos is an operating advisor to Clayton, Dubilier & Rice, LLC (private equity investment). In addition, Mr. Stavropoulos is a member of the University of Notre Dame Advisory Council for the College of Science, a Trustee of the Rollin L. Gerstacker Foundation, and a Director of the Naples Philharmonic Center for the Arts. Previously, Mr. Stavropoulos served as a Director of Chemical Financial Corporation (bank holding company, 1993-2012) and Tyco International, Ltd. (multinational manufacturing and services, 2007-2012). |
David M. Thomas (1949) |
Year of Election or Appointment: 2008 Trustee |
| Mr. Thomas also serves as Trustee of other Fidelity funds. Mr. Thomas serves as Non-Executive Chairman of the Board of Directors of Fortune Brands Home and Security (home and security products, 2011-present), and as a member of the Board of Directors of Interpublic Group of Companies, Inc. (marketing communication, 2004-present). Previously, Mr. Thomas served as Executive Chairman (2005-2006) and Chairman and Chief Executive Officer (2000-2005) of IMS Health, Inc. (pharmaceutical and healthcare information solutions), and a Director of Fortune Brands, Inc. (consumer products, 2000-2011). |
+ The information above includes each Trustee's principal occupation during the last five years and other information relating to the experience, attributes, and skills relevant to each Trustee's qualifications to serve as a Trustee, which led to the conclusion that each Trustee should serve as a Trustee for the fund.
Advisory Board Member and Officers:
Correspondence intended for each officer and Peter S. Lynch may be sent to Fidelity Investments, 245 Summer Street, Boston, Massachusetts 02210. Officers appear below in alphabetical order.
Name, Year of Birth; Principal Occupation |
Peter S. Lynch (1944) |
Year of Election or Appointment: 2003 Member of the Advisory Board |
| Mr. Lynch also serves as Member of the Advisory Board of other Fidelity funds. Mr. Lynch is Vice Chairman and a Director of FMR and FMR Co., Inc. In addition, Mr. Lynch serves as a Trustee of Boston College and as the Chairman of the Inner-City Scholarship Fund. Previously, Mr. Lynch served on the Special Olympics International Board of Directors (1997-2006). |
Christopher S. Bartel (1971) |
Year of Election or Appointment: 2009 Vice President |
| Mr. Bartel also serves as Vice President of other funds. Mr. Bartel serves as a Director, President, and Chief Executive Officer of Fidelity Management & Research (Japan) Inc. (2012-present), a Director of Fidelity Management & Research (Hong Kong) (2012-present), and Senior Vice President of Global Equity Research (2010-present). Previously, Mr. Bartel served as Senior Vice President of Equity Research (2009-2010), Managing Director of Research (2006-2009), and an analyst and portfolio manager (2000-2006). |
Elizabeth Paige Baumann (1968) |
Year of Election or Appointment: 2012 Anti-Money Laundering (AML) Officer |
| Ms. Baumann also serves as AML Officer of other funds. She is Chief AML Officer of FMR LLC (2012-present) and is an employee of Fidelity Investments. Previously, Ms. Baumann served as Vice President and Deputy Anti-Money Laundering Officer (2007-2012). |
William C. Coffey (1969) |
Year of Election or Appointment: 2009 Assistant Secretary |
| Mr. Coffey also serves as Assistant Secretary of other funds. He is Senior Vice President and Deputy General Counsel of FMR LLC (2010-present), and is an employee of Fidelity Investments. Previously, Mr. Coffey served as Vice President and Associate General Counsel of FMR LLC (2005-2009). |
Jonathan Davis (1968) |
Year of Election or Appointment: 2010 Assistant Treasurer |
| Mr. Davis also serves as Assistant Treasurer of other funds. Mr. Davis is an employee of Fidelity Investments. Previously, Mr. Davis served as Vice President and Associate General Counsel of FMR LLC (2003-2010). |
Adrien E. Deberghes (1967) |
Year of Election or Appointment: 2008 Deputy Treasurer |
| Mr. Deberghes also serves as an officer of other funds. He is an employee of Fidelity Investments (2008-present). Prior to joining Fidelity Investments, Mr. Deberghes was Senior Vice President of Mutual Fund Administration at State Street Corporation (2007-2008), Senior Director of Mutual Fund Administration at Investors Bank & Trust (2005-2007), and Director of Finance for Dunkin' Brands (2000-2005). |
Stephanie J. Dorsey (1969) |
Year of Election or Appointment: 2010 Assistant Treasurer |
| Ms. Dorsey also serves as an officer of other funds. She is an employee of Fidelity Investments (2008-present) and has served in other fund officer roles. Prior to joining Fidelity Investments, Ms. Dorsey served as Treasurer (2004-2008) of the JPMorgan Mutual Funds and Vice President (2004-2008) of JPMorgan Chase Bank. |
Howard J. Galligan III (1966) |
Year of Election or Appointment: 2014 Chief Financial Officer |
| Mr. Galligan also serves as Chief Financial Officer of other funds. Mr. Galligan serves as President of Fidelity Pricing and Cash Management Services (FPCMS) (2014-present) and as a Director of Strategic Advisers, Inc. (2008-present). Previously, Mr. Galligan served as Chief Administrative Officer of Asset Management (2011-2014) and Chief Operating Officer and Senior Vice President of Investment Support for Strategic Advisers, Inc. (2003-2011). |
Scott C. Goebel (1968) |
Year of Election or Appointment: 2008 Secretary and Chief Legal Officer (CLO) |
| Mr. Goebel serves as Secretary and CLO of other funds. Mr. Goebel also serves as Secretary of Fidelity SelectCo, LLC (2013-present), Fidelity Investments Money Management, Inc. (FIMM) (2010-present) and Fidelity Research and Analysis Company (FRAC) (2010-present); General Counsel, Secretary, and Senior Vice President of FMR (2008-present) and FMR Co., Inc. (2008-present); Chief Legal Officer of Fidelity Management & Research (Hong Kong) Limited (2008-present); and Assistant Secretary of Fidelity Management & Research (Japan) Inc. (2008-present) and Fidelity Management & Research (U.K.) Inc. (2008-present). Previously, Mr. Goebel served as Secretary and CLO of other Fidelity funds (2008-2013), Assistant Secretary of FIMM (2008-2010), FRAC (2008-2010), and certain funds (2007-2008); and as Vice President and Secretary of Fidelity Distributors Corporation (FDC) (2005-2007). Mr. Goebel has been employed by FMR LLC or an affiliate since 2001. |
Brian B. Hogan (1964) |
Year of Election or Appointment: 2009 Vice President |
| Mr. Hogan also serves as Trustee or Vice President of other funds. Mr. Hogan serves as President of FMR's Equity Division (2009-present). Previously, Mr. Hogan served as Senior Vice President, Equity Research of FMR (2006-2009) and as a portfolio manager. |
Chris Maher (1972) |
Year of Election or Appointment: 2013 Assistant Treasurer |
| Mr. Maher serves as Assistant Treasurer of other funds. Mr. Maher is Vice President of Valuation Oversight and is an employee of Fidelity Investments. Previously, Mr. Maher served as Vice President of Asset Management Compliance (2013), Vice President of FMR's Program Management Group (2010-2013), and Vice President of Valuation Oversight (2008-2010). |
Kenneth B. Robins (1969) |
Year of Election or Appointment: 2008 President and Treasurer |
| Mr. Robins also serves as an officer of other funds. Mr. Robins serves as Executive Vice President of Fidelity Investments Money Management, Inc. (FIMM) (2013-present) and is an employee of Fidelity Investments (2004-present). Previously, Mr. Robins served in other fund officer roles. |
Stephen Sadoski (1971) |
Year of Election or Appointment: 2012 Deputy Treasurer |
| Mr. Sadoski also serves as Deputy Treasurer of other funds. He is an employee of Fidelity Investments (2012-present) and has served in another fund officer role. Prior to joining Fidelity Investments, Mr. Sadoski served as an assistant chief accountant in the Division of Investment Management of the Securities and Exchange Commission (SEC) (2009-2012) and as a senior manager at Deloitte & Touche LLP (1997-2009). |
Stacie M. Smith (1974) |
Year of Election or Appointment: 2013 Deputy Treasurer |
| Ms. Smith also serves as an officer of other funds. She is an employee of Fidelity Investments (2009-present) and has served in other fund officer roles. Prior to joining Fidelity Investments, Ms. Smith served as Senior Audit Manager of Ernst & Young LLP (1996-2009). |
Renee Stagnone (1975) |
Year of Election or Appointment: 2013 Deputy Treasurer |
| Ms. Stagnone also serves as Deputy Treasurer of other funds. Ms. Stagnone is an employee of Fidelity Investments. |
Linda J. Wondrack (1964) |
Year of Election or Appointment: 2014 Chief Compliance Officer |
| Ms. Wondrack also serves as Chief Compliance Officer of other funds. Ms. Wondrack is Executive Vice President and head of the Ethics Office and Asset Management Compliance for Fidelity Investments (2012-present). Ms. Wondrack also serves as Chief Compliance Officer of Fidelity SelectCo, LLC (2014-present); Chief Compliance Officer of Impresa Management LLC (2013-present); and Chief Compliance Officer of FMR Co., Inc., Fidelity Investments Money Management, Inc., Fidelity Management & Research (Japan) Inc., Fidelity Management & Research (U.K.) Inc., Fidelity Management & Research (Hong Kong), Fidelity Management & Research Company, Pyramis Global Advisors, LLC, and Strategic Advisers, Inc., Ballyrock Investment Advisors LLC, and Northern Neck Investors LLC (2012-present). Previously, Ms. Wondrack served as Senior Vice President and Chief Compliance Officer for Columbia Management Investment Advisers, LLC (2005-2012); Chief Compliance Officer for certain funds within the Columbia Family of Funds (2007-2012); and Senior Vice President of Compliance Risk Management at Bank of America (2005-2010). |
Joseph F. Zambello (1957) |
Year of Election or Appointment: 2011 Deputy Treasurer |
| Mr. Zambello also serves as Deputy Treasurer of other funds. Mr. Zambello is an employee of Fidelity Investments. Previously, Mr. Zambello served as Vice President of FMR's Program Management Group (2009-2011) and Vice President of the Transfer Agent Oversight Group (2005-2009). |
Annual Report
The Board of Trustees of Fidelity Real Estate Income Fund voted to pay on September 8, 2014, to shareholders of record at the opening of business on September 5, 2014, a distribution of $0.182 per share derived from capital gains realized from sales of portfolio securities and a dividend of $0.131 per share from net investment income.
The fund hereby designates as a capital gain dividend with respect to the taxable year ended July 31, 2014, $93,876,025, or, if subsequently determined to be different, the net capital gain of such year.
A total of 0.04% of the dividends distributed during the fiscal year was derived from interest on U.S. Government securities which is generally exempt from state income tax.
The fund will notify shareholders in January 2015 of amounts for use in preparing 2014 income tax returns.
Annual Report
Board Approval of Investment Advisory Contracts and Management Fees
Fidelity Real Estate Income Fund
Each year, the Board of Trustees, including the Independent Trustees (together, the Board), votes on the renewal of the management contract with Fidelity Management & Research Company (FMR) and the sub-advisory agreements (together, the Advisory Contracts) for the fund. The Board, assisted by the advice of fund counsel and Independent Trustees' counsel, requests and considers a broad range of information relevant to the renewal of the Advisory Contracts throughout the year.
The Board meets regularly and, at each of its meetings, covers an extensive agenda of topics and materials and considers factors that are relevant to its annual consideration of the renewal of the fund's Advisory Contracts, including the services and support provided to the fund and its shareholders. The Board has established various standing committees (Committees), each composed of and chaired by Independent Trustees with varying backgrounds, to which the Board has assigned specific subject matter responsibilities in order to enhance effective decision-making by the Board. The Board, acting directly and through its Committees, requests and receives information concerning the annual consideration of the renewal of the fund's Advisory Contracts. The Board also meets as needed to consider matters specifically related to the Board's annual consideration of the renewal of the Advisory Contracts. Members of the Board may also meet with trustees of other Fidelity funds through ad hoc joint committees to discuss certain matters relevant to the Fidelity funds.
At its July 2014 meeting, the Board, including the Independent Trustees, unanimously determined to renew the fund's Advisory Contracts. In reaching its determination, the Board considered all factors it believed relevant, including (i) the nature, extent, and quality of the services to be provided to the fund and its shareholders (including the investment performance of the fund); (ii) the competitiveness of the fund's management fee and total expense ratio relative to peer funds; (iii) the total costs of the services to be provided by and the profits to be realized by Fidelity from its relationship with the fund; (iv) the extent to which economies of scale exist and would be realized as the fund grows; and (v) whether fee levels reflect these economies of scale, if any, for the benefit of fund shareholders. In connection with separate internal corporate reorganizations involving Fidelity Management & Research (U.K.) Inc. (FMR U.K.) and Fidelity Management & Research (Japan) Inc. (FMR Japan), the Board approved certain non-material amendments to the fund's sub-advisory agreements with FMR U.K. and FMR Japan to reflect that, after these reorganizations, FMR Investment Management (UK) Limited and Fidelity Management & Research (Japan) Limited will carry on the business of FMR U.K. and FMR Japan, respectively. The Board noted that no changes to the portfolio managers or to the foreign research or investment advisory services provided to the fund were expected in connection with either reorganization and that the same personnel and resources would continue to be available to the fund at the new entities.
Annual Report
In considering whether to renew the Advisory Contracts for the fund, the Board reached a determination, with the assistance of fund counsel and Independent Trustees' counsel and through the exercise of its business judgment, that the renewal of the Advisory Contracts was in the best interests of the fund and its shareholders and that the compensation payable under the Advisory Contracts was fair and reasonable. The Board's decision to renew the Advisory Contracts was not based on any single factor, but rather was based on a comprehensive consideration of all the information provided to the Board at its meetings throughout the year. The Board, in reaching its determination to renew the Advisory Contracts, was aware that shareholders of the fund have a broad range of investment choices available to them, including a wide choice among funds offered by Fidelity's competitors, and that the fund's shareholders, who have the opportunity to review and weigh the disclosure provided by the fund in its prospectus and other public disclosures, have chosen to invest in this fund, which is part of the Fidelity family of funds.
Nature, Extent, and Quality of Services Provided. The Board considered Fidelity's staffing as it relates to the fund, including the backgrounds of investment personnel of FMR and the sub-advisers (together, the Investment Advisers), and also considered the fund's investment objective, strategies, and related investment philosophy. The Independent Trustees also had discussions with senior management of Fidelity's investment operations and investment groups. The Board considered the structure of the portfolio manager compensation program and whether this structure provides appropriate incentives to act in the best interests of the fund. Additionally, the Board considered the portfolio managers' investments, if any, in the funds that they manage.
Resources Dedicated to Investment Management and Support Services. The Board and the Fund Oversight and Research Committees reviewed the general qualifications and capabilities of Fidelity's investment staff, including its size, education, experience, and resources, as well as Fidelity's approach to recruiting, training, managing, and compensating investment personnel. The Board noted that Fidelity has continued to increase the resources devoted to non-U.S. offices, including expansion of Fidelity's global investment organization. The Board also noted that Fidelity's analysts have extensive resources, tools and capabilities that allow them to conduct sophisticated quantitative and fundamental analysis, as well as credit analysis of issuers, counterparties and guarantors. Further, the Board believes that Fidelity's investment professionals have sufficient access to global information and data so as to provide competitive investment results over time, and that those professionals also have access to sophisticated tools that permit them to assess portfolio construction and risk and performance attribution characteristics continuously, as well as to transmit new information and research conclusions rapidly around the world. Additionally, in its deliberations, the Board considered Fidelity's trading and risk management capabilities and resources and global compliance infrastructure, which are an integral part of the investment management process.
Annual Report
Board Approval of Investment Advisory Contracts and
Management Fees - continued
Shareholder and Administrative Services. The Board considered (i) the nature, extent, quality, and cost of advisory, administrative, and shareholder services performed by the Investment Advisers and their affiliates under the Advisory Contracts and under separate agreements covering transfer agency, pricing and bookkeeping, and securities lending services for the fund; (ii) the nature and extent of the supervision of third party service providers, principally custodians and subcustodians; and (iii) the resources devoted to, and the record of compliance with, the fund's compliance policies and procedures. The Board also reviewed the allocation of fund brokerage, including allocations to brokers affiliated with the Investment Advisers, the use of brokerage commissions to pay fund expenses, and the use of "soft" commission dollars to pay for research services.
The Board noted that the growth of fund assets over time across the complex allows Fidelity to reinvest in the development of services designed to enhance the value or convenience of the Fidelity funds as investment vehicles. These services include 24-hour access to account information and market information through telephone representatives and over the Internet, investor education materials and asset allocation tools, and the expanded availability of Fidelity Investor Centers.
In 2014, the Board formed an ad hoc Committee on Transfer Agency Fees to review the variety of transfer agency fee structures throughout the industry and Fidelity's competitive positioning with respect to industry participants.
Investment in a Large Fund Family. The Board considered the benefits to shareholders of investing in a Fidelity fund, including the benefits of investing in a fund that is part of a large family of funds offering a variety of investment disciplines and providing a large variety of mutual fund investor services. The Board noted that Fidelity had taken, or had made recommendations that resulted in the Fidelity funds taking, a number of actions over the previous year that benefited particular funds, including (i) continuing to dedicate additional resources to investment research and to the support of the senior management team that oversees asset management; (ii) persisting in efforts to enhance Fidelity's global research capabilities; (iii) launching new funds and making other enhancements to meet client needs for income-oriented solutions; (iv) reducing fund expenses for certain index funds; (v) continuing to launch dedicated lower cost underlying funds to meet portfolio construction needs related to expanding underlying fund options for Fidelity funds of funds, specifically for the Freedom Fund product lines; (vi) rationalizing product lines and gaining increased efficiencies through fund mergers; (vii) launching sector-based exchange-traded funds and establishing a new Fidelity adviser to manage sector-based funds and products; (viii) continuing to develop and implement technology to improve security and increase efficiency; (ix) modifying the eligibility criteria for certain share classes to increase their marketability to a portion of the defined contribution plan market; (x) waiving redemption fees for certain qualified fund-of-fund and wrap programs and certain retirement plan transactions; and (xi) launching new Institutional Class shares of certain money market funds to attract and retain assets and to fill a gap in the money market fund lineup.
Annual Report
Investment Performance. The Board considered whether the fund has operated in accordance with its investment objective, as well as its record of compliance with its investment restrictions and its performance history.
The Board took into account discussions with the Investment Advisers about fund investment performance that occur at Board meetings throughout the year. In this regard the Board noted that as part of regularly scheduled fund reviews and other reports to the Board on fund performance, the Board periodically considers annualized return information for the fund, for different time periods, measured against a securities market index ("benchmark index") and a peer group of funds with similar objectives ("peer group"). In its evaluation of fund investment performance, the Board gave particular attention to information indicating changes in performance of certain Fidelity funds for specific time periods and the Investment Advisers' explanations for any overperformance or underperformance.
In addition to reviewing absolute and relative fund performance, the Independent Trustees periodically consider the appropriateness of fund performance metrics in evaluating the results achieved. In general, the Independent Trustees believe that fund performance should be evaluated based on net performance (after fees and expenses) of both the highest performing and lowest performing classes, where applicable, compared to appropriate benchmark indices, over appropriate time periods which may include full market cycles, and compared to peer groups, as applicable, over the same periods, taking into account relevant factors including the following: general market conditions; issuer-specific information; tactical opportunities for investment; and fund cash flows and other factors.
The Independent Trustees recognize that shareholders evaluate performance on a net basis over their own holding periods, for which one-, three-, and five-year periods are often used as a proxy. For this reason, the performance information reviewed by the Board also included net cumulative calendar year total return information for the fund and an appropriate benchmark index and peer group for the most recent one-, three-, and five-year periods, as shown below. Returns are shown compared to the 25th percentile (top of box, 75% beaten) and 75th percentile (bottom of box, 25% beaten) of the peer universe.
Annual Report
Board Approval of Investment Advisory Contracts and
Management Fees - continued
Fidelity Real Estate Income Fund
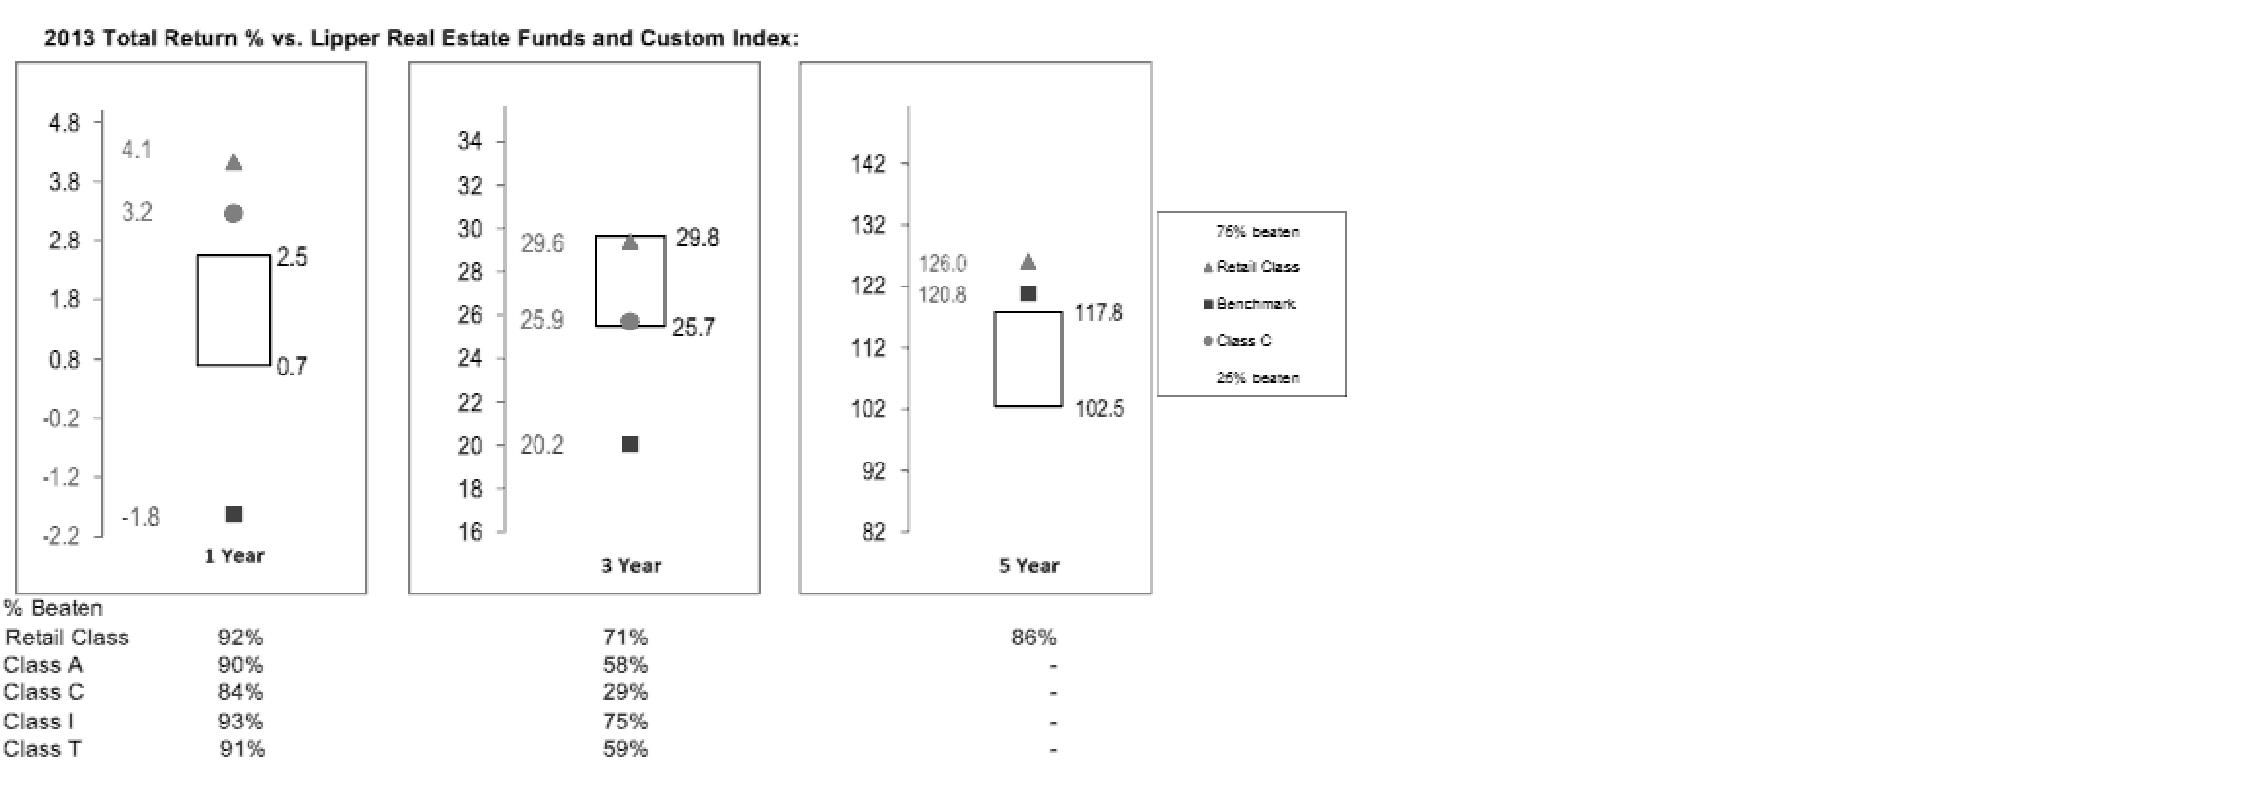
Based on its review, the Board concluded that the nature, extent, and quality of services provided to the fund under the Advisory Contracts should benefit the fund's shareholders.
Competitiveness of Management Fee and Total Expense Ratio. The Board considered the fund's management fee and total expense ratio compared to "mapped groups" of competitive funds and classes. Fidelity creates "mapped groups" by combining similar Lipper investment objective categories that have comparable investment mandates. Combining Lipper investment objective categories aids the Board's management fee and total expense ratio comparisons by broadening the competitive group used for comparison and by reducing the number of universes to which various Fidelity funds are compared.
Management Fee. The Board considered two proprietary management fee comparisons for the 12-month periods shown in the chart below. The group of Lipper funds used by the Board for management fee comparisons is referred to below as the "Total Mapped Group." The Total Mapped Group is broader than the Lipper peer group used by the Board for performance comparisons because the Total Mapped Group combines several Lipper investment objective categories while the Lipper peer group does not. The Total Mapped Group comparison focuses on a fund's standing in terms of gross management fees before expense reimbursements or caps relative to the total universe of funds with comparable investment mandates, regardless of whether their management fee structures also are comparable. Funds with comparable investment mandates offer exposure to similar types of securities. Funds with comparable management fee structures have similar management fee contractual arrangements (e.g., flat rate charged for advisory services, all-inclusive fee rate, etc.). "TMG %" represents the percentage of funds in the Total Mapped Group that had management fees that were lower than the fund's. For example, a hypothetical TMG % of 20% would mean that 80% of the funds in the Total Mapped Group had higher, and 20% had lower, management fees than the fund. The fund's actual TMG %s are in the chart below. The "Asset-Size Peer Group" (ASPG) comparison focuses on a fund's standing relative to a subset of non-Fidelity funds within the Total Mapped Group that are similar in size and management fee structure. For example, if a fund is in the first quartile of the ASPG, the fund's management fee ranks in the least expensive or lowest 25% of funds in the ASPG. The ASPG represents at least 15% of the funds in the Total Mapped Group with comparable asset size and management fee structures, subject to a minimum of 50 funds (or all funds in the Total Mapped Group if fewer than 50). Additional information, such as the ASPG quartile in which the fund's management fee rate ranked, is also included in the chart and considered by the Board.
Annual Report
Fidelity Real Estate Income Fund

The Board noted that the fund's management fee rate ranked below the median of its Total Mapped Group and below the median of its ASPG for 2013.
The Board also noted that, in August 2013, the ad hoc Committee on Management Fees was formed to conduct an in-depth review of the management fee rates of Fidelity's active equity mutual funds. The Committee focused on the following areas: (i) standard fee structures; (ii) research consumption and trading evolution; (iii) management fee competitiveness/profitability by category; and (iv) factors that drive institutional pricing.
Based on its review, the Board concluded that the fund's management fee is fair and reasonable in light of the services that the fund receives and the other factors considered.
Annual Report
Board Approval of Investment Advisory Contracts and
Management Fees - continued
Total Expense Ratio. In its review of each class's total expense ratio, the Board considered the fund's management fee as well as other fund or class expenses, as applicable, such as transfer agent fees, pricing and bookkeeping fees, fund-paid 12b-1 fees, and custodial, legal, and audit fees. The Board also noted the effects of any waivers and reimbursements on fees and expenses. As part of its review, the Board also considered the current and historical total expense ratios of each class of the fund compared to competitive fund median expenses. Each class of the fund is compared to those funds and classes in the Total Mapped Group (used by the Board for management fee comparisons) that have a similar sales load structure.
The Board noted that the total expense ratio of each class ranked below its competitive median for 2013.
Fees Charged to Other Fidelity Clients. The Board also considered Fidelity fee structures and other information with respect to clients of Fidelity, such as other funds advised or subadvised by Fidelity, pension plan clients, and other institutional clients. The Board noted the findings of the 2013 ad hoc joint committee (created with the board of other Fidelity funds), which reviewed and compared Fidelity's institutional investment advisory business with its business of providing services to the Fidelity funds, including the differences in services provided, fees charged, and costs incurred, as well as competition in their respective marketplaces.
Based on its review of total expense ratios and fees charged to other Fidelity clients, the Board concluded that the total expense ratio of each class of the fund was reasonable in light of the services that the fund and its shareholders receive and the other factors considered.
Costs of the Services and Profitability. The Board considered the revenues earned and the expenses incurred by Fidelity in conducting the business of developing, marketing, distributing, managing, administering and servicing the fund and servicing the fund's shareholders. The Board also considered the level of Fidelity's profits in respect of all the Fidelity funds.
On an annual basis, Fidelity presents to the Board Fidelity's profitability for the fund. Fidelity calculates the profitability for each fund, as well as aggregate profitability for groups of Fidelity funds and all Fidelity funds, using a series of detailed revenue and cost allocation methodologies which originate with the books and records of Fidelity on which Fidelity's audited financial statements are based. The Audit Committee of the Board reviews any significant changes from the prior year's methodologies.
PricewaterhouseCoopers LLP (PwC), independent registered public accounting firm and auditor to Fidelity and certain Fidelity funds, has been engaged annually by the Board as part of the Board's assessment of Fidelity's profitability analysis. PwC's engagement includes the review and assessment of the methodologies used by Fidelity in determining the revenues and expenses attributable to Fidelity's mutual fund business, and completion of agreed-upon procedures in respect of the mathematical accuracy of fund profitability and its conformity to established allocation methodologies. After considering PwC's reports issued under the engagement and information provided by Fidelity, the Board concluded that while other allocation methods may also be reasonable, Fidelity's profitability methodologies are reasonable in all material respects.
Annual Report
The Board also reviewed Fidelity's non-fund businesses and fall-out benefits related to the mutual fund business as well as cases where Fidelity's affiliates may benefit from or be related to the fund's business.
The Board considered the costs of the services provided by and the profits realized by Fidelity in connection with the operation of the fund and was satisfied that the profitability was not excessive in the circumstances.
Economies of Scale. The Board considered whether there have been economies of scale in respect of the management of the Fidelity funds, whether the Fidelity funds (including the fund) have appropriately benefited from any such economies of scale, and whether there is potential for realization of any further economies of scale. The Board considered the extent to which the fund will benefit from economies of scale through increased services to the fund, through waivers or reimbursements, or through fee or expense ratio reductions. The Board also noted that in 2013, it and the boards of other Fidelity funds created an ad hoc committee (the Economies of Scale Committee) to analyze whether Fidelity attains economies of scale in respect of the management and servicing of the Fidelity funds, whether the Fidelity funds have appropriately benefited from such economies of scale, and whether there is potential for realization of any further economies of scale.
The Board recognized that the fund's management contract incorporates a "group fee" structure, which provides for lower group fee rates as total group assets increase, and for higher group fee rates as total group assets decrease (with "group assets" defined to include fund assets under FMR's management plus sector fund assets previously under FMR's management and currently managed by Fidelity SelectCo, LLC). FMR calculates the group fee rates based on a tiered asset "breakpoint" schedule that varies based on asset class. The Board considered that the group fee is designed to deliver the benefits of economies of scale to fund shareholders when total Fidelity fund assets increase, even if assets of any particular fund are unchanged or have declined, because some portion of Fidelity's costs are attributable to services provided to all Fidelity funds, and all funds benefit if those costs can be allocated among more assets. The Board concluded that, given the group fee structure, fund shareholders will benefit from lower management fees as group assets increase at the fund complex level, regardless of whether Fidelity achieves any such economies of scale.
Annual Report
Board Approval of Investment Advisory Contracts and
Management Fees - continued
The Board concluded, taking into account the analysis of the Economies of Scale Committee, that economies of scale, if any, are being appropriately shared between fund shareholders and Fidelity.
Additional Information Requested by the Board. In order to develop fully the factual basis for consideration of the Fidelity funds' Advisory Contracts, the Board requested and received additional information on certain topics, including: (i) fund performance trends and Fidelity's long-term strategies for certain funds; (ii) Fidelity's strategic marketing and product lineup goals; (iii) the methodology with respect to competitive fund data and peer group classifications; (iv) the arrangements with, and performance of, certain sub-advisers on behalf of the Fidelity funds, as well as certain proposed participating affiliate arrangements; (v) the realization of fall-out benefits in certain Fidelity business units; (vi) Fidelity's group fee structures, including the rationale for the individual fee rates of certain categories of funds and the definition of group assets; (vii) trends regarding industry use of performance fee structures and the performance adjustment methodologies applicable to the Fidelity funds; (viii) additional competitive analysis regarding the total expenses for certain classes; (ix) fund profitability methodology, including Fidelity's cost allocation methodology, and the impact of certain factors on fund profitability results; and (x) the process by which Fidelity determines sub-advisory fees for funds it advises.
Based on its evaluation of all of the conclusions noted above, and after considering all factors it believed relevant, the Board ultimately concluded that the advisory fee structures are fair and reasonable, and that the fund's Advisory Contracts should be renewed.
Annual Report
Investment Adviser
Fidelity Management & Research Company
Boston, MA
Investment Sub-Advisers
FMR Co., Inc.
Fidelity Management & Research
(U.K.) Inc.
Fidelity Management & Research
(Hong Kong) Limited
Fidelity Management & Research
(Japan) Inc.
General Distributor
Fidelity Distributors Corporation
Smithfield, RI
Transfer and Service Agents
Fidelity Investments Institutional
Operations Company, Inc.
Boston, MA
Fidelity Service Company, Inc.
Boston, MA
Custodian
Citibank, N.A.
New York, NY
The Fidelity Telephone Connection
Mutual Fund 24-Hour Service
Exchanges/Redemptions
and Account Assistance 1-800-544-6666
Product Information 1-800-544-6666
Retirement Accounts 1-800-544-4774
(8 a.m. - 9 p.m.)
TDD Service 1-800-544-0118
for the deaf and hearing impaired
(9 a.m. - 9 p.m. Eastern time)
Fidelity Automated Service
Telephone (FAST®)
1-800-544-5555
Automated line for quickest service
(Fidelity Investment logo)(registered trademark)
Corporate Headquarters
245 Summer St., Boston, MA 02210
www.fidelity.com
REI-UANN-0914
1.789710.111
(Fidelity Investment logo)(registered trademark)
Fidelity Advisor®
Real Estate Income
Fund - Institutional Class
Annual Report
July 31, 2014
(Fidelity Cover Art)
Institutional Class
is a class of Fidelity®
Real Estate Income Fund
Contents
Performance | (Click Here) | How the fund has done over time. |
Management's Discussion of Fund Performance | (Click Here) | The Portfolio Manager's review of fund performance and strategy. |
Shareholder Expense Example | (Click Here) | An example of shareholder expenses. |
Investment Changes | (Click Here) | A summary of major shifts in the fund's investments over the past six months. |
Investments | (Click Here) | A complete list of the fund's investments with their market values. |
Financial Statements | (Click Here) | Statements of assets and liabilities, operations, and changes in net assets, as well as financial highlights. |
Notes | (Click Here) | Notes to the financial statements. |
Report of Independent Registered Public Accounting Firm | (Click Here) | |
Trustees and Officers | (Click Here) | |
Distributions | (Click Here) | |
Board Approval of Investment Advisory Contracts and Management Fees | (Click Here) | |
To view a fund's proxy voting guidelines and proxy voting record for the 12-month period ended June 30, visit http://www.fidelity.com/proxyvotingresults or visit the Securities and Exchange Commission's (SEC) web site at http://www.sec.gov. You may also call 1-877-208-0098 to request a free copy of the proxy voting guidelines.
Standard & Poor's, S&P and S&P 500 are registered service marks of The McGraw-Hill Companies, Inc. and have been licensed for use by Fidelity Distributors Corporation.
Other third-party marks appearing herein are the property of their respective owners.
All other marks appearing herein are registered or unregistered trademarks or service marks of FMR LLC or an affiliated company. © 2014 FMR LLC. All rights reserved.
Annual Report
This report and the financial statements contained herein are submitted for the general information of the shareholders of the fund. This report is not authorized for distribution to prospective investors in the fund unless preceded or accompanied by an effective prospectus.
A fund files its complete schedule of portfolio holdings with the SEC for the first and third quarters of each fiscal year on Form N-Q. Forms N-Q are available on the SEC's web site at http://www.sec.gov. A fund's Forms N-Q may be reviewed and copied at the SEC's Public Reference Room in Washington, DC. Information regarding the operation of the SEC's Public Reference Room may be obtained by calling 1-800-SEC-0330. For a complete list of a fund's portfolio holdings, view the most recent holdings listing, semiannual report, or annual report on Fidelity's web site at http://www.fidelity.com, http://www.advisor.fidelity.com, or http://www.401k.com, as applicable.
NOT FDIC INSURED • MAY LOSE VALUE • NO BANK GUARANTEE
Neither the fund nor Fidelity Distributors Corporation is a bank.
Annual Report
Average annual total return reflects the change in the value of an investment, assuming reinvestment of the class' distributions from dividend income and capital gains (the profits earned upon the sale of securities that have grown in value, if any) and assuming a constant rate of performance each year. The $10,000 table and the fund's returns do not reflect the deduction of taxes that a shareholder would pay on fund distributions or the redemption of fund shares. During periods of reimbursement by Fidelity, a fund's total return will be greater than it would be had the reimbursement not occurred. How a fund did yesterday is no guarantee of how it will do tomorrow.
Average Annual Total Returns
Periods ended July 31, 2014 | Past 1
year | Past 5
years | Past 10
years |
Institutional ClassA | 8.76% | 14.37% | 7.25% |
A The initial offering of Institutional Class shares took place on April 14, 2010. Returns prior to April 14, 2010 are those of Fidelity® Real Estate Income Fund, the original class of the fund.
$10,000 Over 10 Years
Let's say hypothetically that $10,000 was invested in Fidelity Advisor® Real Estate Income Fund - Institutional Class on July 31, 2004. The chart shows how the value of your investment would have changed, and also shows how the S&P 500® Index performed over the same period. See footnote A above for additional information regarding the performance of Institutional Class.
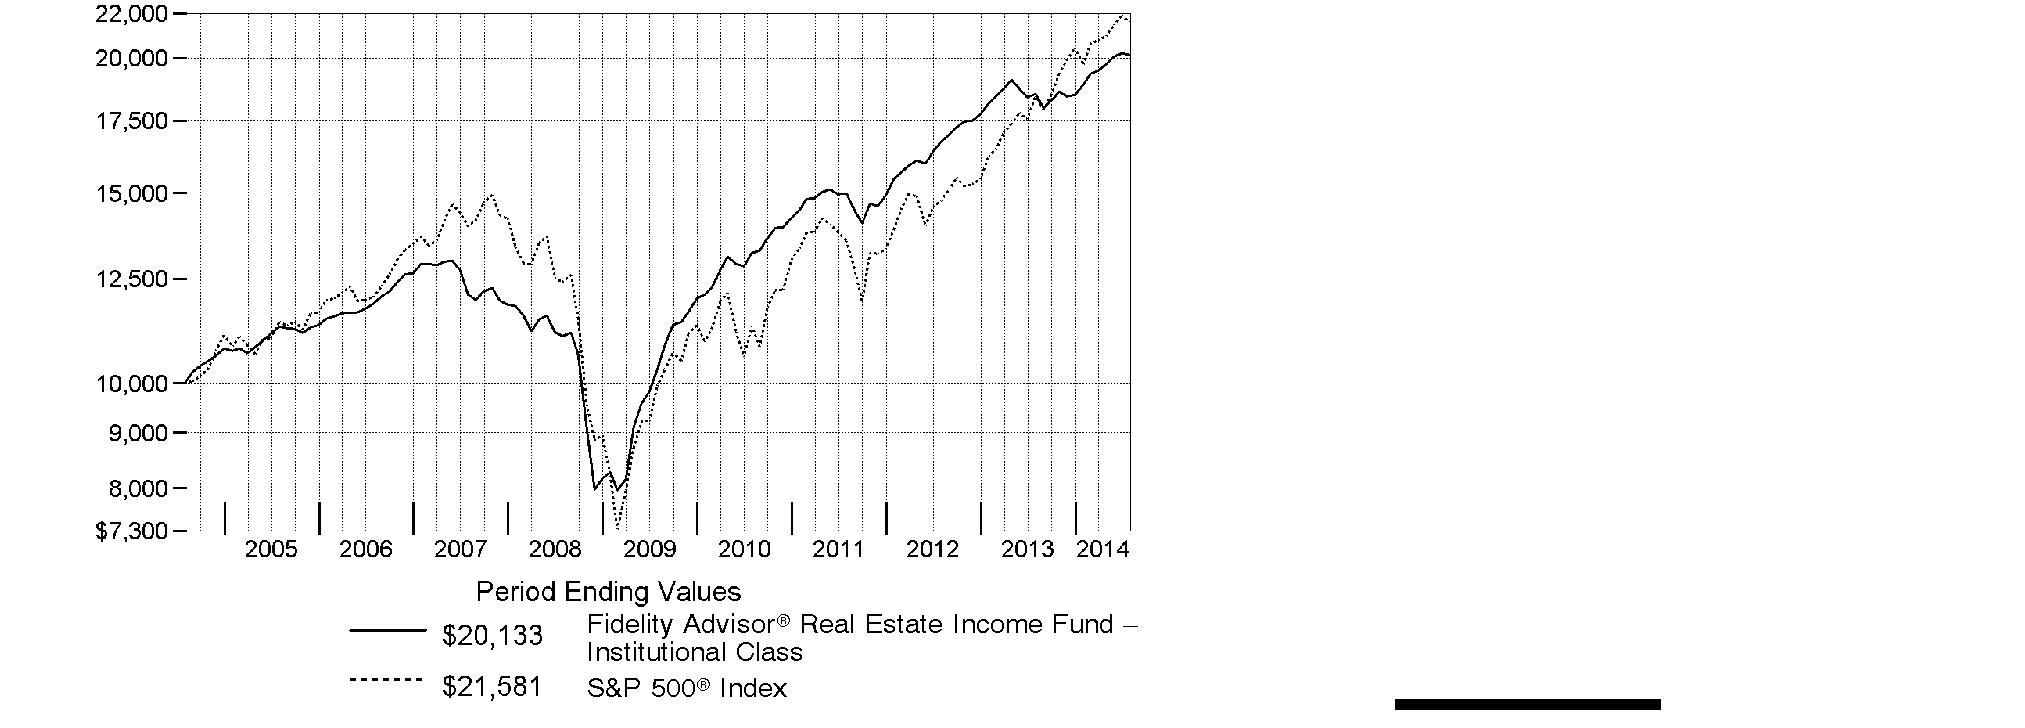
Annual Report
Market Recap: The fundamental backdrop for commercial real estate remained solid throughout the 12 months ending July 31, 2014. Continued favorable demand across most sectors and geographic markets, along with limited new construction, led to rising occupancies. In turn, this led to gently rising rents and cash flow for real estate owners, including real estate investment trusts (REITs). Investors' continued search for yield in a low-interest-rate environment - rates ended the 12-month period roughly at their starting point - helped further boost the performance of multiple types of real estate securities. For the full 12 months, REIT stocks, as measured by the FTSE® NAREIT® All REITs Index, gained 12.90%, with the vast majority of that increase coming in the second half of the period. The MSCI REIT Preferred Index, which reflects the performance of real estate preferred stocks, added 9.62%. On the fixed-income side, The BofA Merrill LynchSM US Real Estate Index - a market-capitalization-weighted measure of investment-grade corporate debt in the domestic real estate sector - advanced 6.67%, benefiting partly from narrowing credit spreads that helped compensate for rising interest rates in the first half of the 12-month period. In comparison, the S&P 500® Index, a proxy for the broad U.S. stock market, was up 16.94%.
Comments from Mark Snyderman, Portfolio Manager of Fidelity Advisor® Real Estate Income Fund: For the year, the fund's Institutional Class shares gained 8.76%, which I consider a good absolute return for a 12-month period. In comparison, however, the Fidelity Real Estate Income Composite IndexSM - a 40/40/20 blend of the MSCI REIT Preferred Index, The BofA Merrill LynchSM US Real Estate Index and the FTSE® NAREIT® All REITs Index, respectively - added 9.17%. Most of the categories in which the fund invests did well. The fund's REIT common stock holdings essentially matched the 13% gain in the FTSE® NAREIT® index. Its preferred stocks added about 11%, outpacing the MSCI preferred stock index. On the portfolio's fixed-income side, the fund did particularly well with its commercial mortgage backed securities investments, which rose roughly 11%, compared with approximately 7% for the BofA Merrill Lynch real estate bond index. The fund's high-yield real estate bond picks modestly outpaced this measure, while its investment-grade bonds lagged. Meanwhile, the fund was hampered by a cash position of 8%, on average. I like to hold enough cash to take advantage of attractive buying opportunities when others must sell; unfortunately, the size of the portfolio's stake here was a drag on results in a rising market during the period.
The views expressed above reflect those of the portfolio manager(s) only through the end of the period as stated on the cover of this report and do not necessarily represent the views of Fidelity or any other person in the Fidelity organization. Any such views are subject to change at any time based upon market or other conditions and Fidelity disclaims any responsibility to update such views. These views may not be relied on as investment advice and, because investment decisions for a Fidelity fund are based on numerous factors, may not be relied on as an indication of trading intent on behalf of any Fidelity fund.
Annual Report
Shareholder Expense Example
As a shareholder of the Fund, you incur two types of costs: (1) transaction costs, including sales charges (loads) on purchase payments or redemption proceeds, redemption fees and (2) ongoing costs, including management fees, distribution and/or service (12b-1) fees and other Fund expenses. This Example is intended to help you understand your ongoing costs (in dollars) of investing in the Fund and to compare these costs with the ongoing costs of investing in other mutual funds.
The Example is based on an investment of $1,000 invested at the beginning of the period and held for the entire period (February 1, 2014 to July 31, 2014).
Actual Expenses
The first line of the accompanying table for each class of the Fund provides information about actual account values and actual expenses. You may use the information in this line, together with the amount you invested, to estimate the expenses that you paid over the period. Simply divide your account value by $1,000.00 (for example, an $8,600 account value divided by $1,000.00 = 8.6), then multiply the result by the number in the first line for a class of the Fund under the heading entitled "Expenses Paid During Period" to estimate the expenses you paid on your account during this period. A small balance maintenance fee of $12.00 that is charged once a year may apply for certain accounts with a value of less than $2,000. This fee is not included in the table below. If it was, the estimate of expenses you paid during the period would be higher, and your ending account value lower, by this amount. In addition, the Fund, as a shareholder in the underlying Fidelity Central Funds, will indirectly bear its pro-rata share of the fees and expenses incurred by the underlying Fidelity Central Funds. These fees and expenses are not included in the Fund's annualized expense ratio used to calculate the expense estimate in the table below.
Hypothetical Example for Comparison Purposes
The second line of the accompanying table for each class of the Fund provides information about hypothetical account values and hypothetical expenses based on a Class' actual expense ratio and an assumed rate of return of 5% per year before expenses, which is not the Class' actual return. The hypothetical account values and expenses may not be used to estimate the actual ending account balance or expenses you paid for the period. You may use this information to compare the ongoing costs of investing in the Fund and other funds. To do so, compare this 5% hypothetical example with the 5% hypothetical examples that appear in the shareholder reports of the other funds. A small balance maintenance fee of $12.00 that is charged once a year may apply for certain accounts with a value of less than $2,000. This fee is not included in the table below. If it was, the estimate of expenses you paid during the period would be higher, and your ending account value lower, by this amount. In addition, the Fund, as a shareholder in the underlying Fidelity Central Funds, will indirectly bear its pro-rata share of the fees and expenses incurred by the underlying Fidelity Central Funds. These fees and expenses are not included in the Fund's annualized expense ratio used to calculate the expense estimate in the table below.
Please note that the expenses shown in the table are meant to highlight your ongoing costs only and do not reflect any transaction costs. Therefore, the second line of the table is useful in comparing ongoing costs only, and will not help you determine the relative total costs of owning different funds. In addition, if these transactional costs were included, your costs would have been higher.
Annual Report
| Annualized
Expense RatioB | Beginning
Account Value
February 1, 2014 | Ending
Account Value
July 31, 2014 | Expenses Paid
During Period*
February 1, 2014
to July 31, 2014 |
Class A | 1.05% | | | |
Actual | | $ 1,000.00 | $ 1,065.30 | $ 5.38 |
HypotheticalA | | $ 1,000.00 | $ 1,019.59 | $ 5.26 |
Class T | 1.08% | | | |
Actual | | $ 1,000.00 | $ 1,065.10 | $ 5.53 |
HypotheticalA | | $ 1,000.00 | $ 1,019.44 | $ 5.41 |
Class C | 1.79% | | | |
Actual | | $ 1,000.00 | $ 1,061.70 | $ 9.15 |
HypotheticalA | | $ 1,000.00 | $ 1,015.92 | $ 8.95 |
Real Estate Income | .83% | | | |
Actual | | $ 1,000.00 | $ 1,066.80 | $ 4.25 |
HypotheticalA | | $ 1,000.00 | $ 1,020.68 | $ 4.16 |
Institutional Class | .78% | | | |
Actual | | $ 1,000.00 | $ 1,066.30 | $ 4.00 |
HypotheticalA | | $ 1,000.00 | $ 1,020.93 | $ 3.91 |
A 5% return per year before expenses
B Annualized expense ratio reflects expenses net of applicable fee waivers.
* Expenses are equal to each Class' annualized expense ratio, multiplied by the average account value over the period, multiplied by 181/365 (to reflect the one-half year period).
Annual Report
Investment Changes (Unaudited)
Top Five Stocks as of July 31, 2014 |
| % of fund's
net assets | % of fund's net assets
6 months ago |
MFA Financial, Inc. | 3.2 | 3.0 |
Equity Lifestyle Properties, Inc. | 2.7 | 2.7 |
Acadia Realty Trust (SBI) | 2.4 | 2.2 |
Ventas, Inc. | 1.6 | 1.7 |
Lexington Corporate Properties Trust | 1.1 | 1.0 |
| 11.0 | |
Top 5 Bonds as of July 31, 2014 |
| % of fund's
net assets | % of fund's net assets
6 months ago |
Realogy Group LLC Tranche B, term loan 3.75% 3/5/20 | 0.9 | 0.8 |
Standard Pacific Corp. 8.375% 5/15/18 | 0.8 | 0.9 |
Annaly Capital Management, Inc. 5% 5/15/15 | 0.8 | 0.9 |
Hilton Worldwide Finance, LLC Tranche B, term loan 3.5% 10/25/20 | 0.7 | 0.3 |
iStar Financial, Inc. 5.875% 3/15/16 | 0.7 | 1.0 |
| 3.9 | |
Top Five REIT Sectors as of July 31, 2014 |
| % of fund's
net assets | % of fund's net assets
6 months ago |
REITs - Mortgage | 17.3 | 16.0 |
REITs - Management/Investment | 9.0 | 8.9 |
REITs - Health Care Facilities | 6.9 | 6.1 |
REITs - Shopping Centers | 6.3 | 6.1 |
REITs - Apartments | 4.9 | 5.0 |
Asset Allocation (% of fund's net assets) |
As of July 31, 2014* | As of January 31, 2014** |
| Common Stocks 31.4% | | | Common Stocks 31.6% | |
| Preferred Stocks 16.7% | | | Preferred Stocks 14.5% | |
| Bonds 32.8% | | | Bonds 34.3% | |
| Convertible
Securities 4.5% | | | Convertible
Securities 4.0% | |
| Other Investments 7.8% | | | Other Investments 8.6% | |
| Short-Term
Investments and
Net Other Assets
(Liabilities) 6.8% | | | Short-Term
Investments and
Net Other Assets
(Liabilities) 7.0% | |
* Foreign investments | 2.6% | | ** Foreign investments | 3.2% | |

Annual Report
Investments July 31, 2014
Showing Percentage of Net Assets
Common Stocks - 31.4% |
| Shares | | Value |
CONSUMER DISCRETIONARY - 0.2% |
Household Durables - 0.2% |
Stanley Martin Communities LLC Class B (a)(m) | 4,620 | | $ 6,928,291 |
Media - 0.0% |
New Media Investment Group, Inc. | 2 | | 30 |
TOTAL CONSUMER DISCRETIONARY | | 6,928,321 |
FINANCIALS - 31.0% |
Capital Markets - 0.5% |
Ellington Financial LLC | 950,100 | | 22,517,370 |
Real Estate Investment Trusts - 29.8% |
Acadia Realty Trust (SBI) (g) | 3,500,149 | | 98,809,206 |
AG Mortgage Investment Trust, Inc. | 781,700 | | 14,336,378 |
American Tower Corp. | 184,300 | | 17,396,077 |
Annaly Capital Management, Inc. | 826,600 | | 9,175,260 |
Anworth Mortgage Asset Corp. | 1,572,210 | | 7,986,827 |
Apartment Investment & Management Co. Class A | 1,268,100 | | 43,343,658 |
Arbor Realty Trust, Inc. (g) | 3,068,975 | | 21,697,653 |
Associated Estates Realty Corp. | 224,208 | | 3,961,755 |
AvalonBay Communities, Inc. | 191,400 | | 28,342,512 |
BioMed Realty Trust, Inc. | 1,058,200 | | 22,751,300 |
Blackstone Mortgage Trust, Inc. | 75,200 | | 2,140,944 |
Boardwalk (REIT) | 126,200 | | 7,511,698 |
Canadian (REIT) | 131,600 | | 5,524,219 |
CBL & Associates Properties, Inc. | 2,202,873 | | 41,193,725 |
Cedar Shopping Centers, Inc. | 1,208,910 | | 7,616,133 |
Chambers Street Properties | 1,457,593 | | 11,340,074 |
Chartwell Retirement Residence | 459,700 | | 4,553,364 |
Chartwell Retirement Residence (a)(h) | 78,500 | | 777,548 |
CYS Investments, Inc. | 2,094,739 | | 18,601,282 |
Douglas Emmett, Inc. | 689,600 | | 19,646,704 |
Dynex Capital, Inc. | 1,989,943 | | 16,516,527 |
EastGroup Properties, Inc. | 101,500 | | 6,329,540 |
Ellington Residential Mortgage REIT | 260,000 | | 4,238,000 |
Equity Lifestyle Properties, Inc. | 2,511,560 | | 111,236,992 |
Equity Residential (SBI) | 306,700 | | 19,828,155 |
Excel Trust, Inc. | 1,742,628 | | 22,567,033 |
Extra Space Storage, Inc. | 155,200 | | 8,028,496 |
First Potomac Realty Trust | 1,381,615 | | 18,223,502 |
Five Oaks Investment Corp. | 400,000 | | 4,424,000 |
H&R REIT/H&R Finance Trust | 375,100 | | 7,957,136 |
Hatteras Financial Corp. | 685,100 | | 13,119,665 |
Common Stocks - continued |
| Shares | | Value |
FINANCIALS - continued |
Real Estate Investment Trusts - continued |
Highwoods Properties, Inc. (SBI) | 139,400 | | $ 5,864,558 |
Lexington Corporate Properties Trust | 4,174,382 | | 45,667,739 |
Liberty Property Trust (SBI) | 192,300 | | 6,763,191 |
LTC Properties, Inc. | 452,913 | | 17,360,155 |
MFA Financial, Inc. | 16,292,993 | | 132,624,945 |
Mid-America Apartment Communities, Inc. | 612,400 | | 42,819,008 |
Monmouth Real Estate Investment Corp. Class A (f) | 1,197,173 | | 12,306,938 |
National Retail Properties, Inc. | 232,200 | | 8,259,354 |
Newcastle Investment Corp. | 4,850,400 | | 21,681,288 |
NorthStar Realty Finance Corp. | 377,400 | | 6,076,140 |
Piedmont Office Realty Trust, Inc. Class A | 850,200 | | 16,536,390 |
Potlatch Corp. | 40,500 | | 1,672,650 |
Prologis, Inc. | 499,487 | | 20,384,064 |
Redwood Trust, Inc. (f) | 555,100 | | 10,535,798 |
Select Income (REIT) | 456,300 | | 12,662,325 |
Senior Housing Properties Trust (SBI) | 1,562,300 | | 35,714,178 |
Simon Property Group, Inc. | 171,600 | | 28,861,404 |
Stag Industrial, Inc. | 321,769 | | 7,349,204 |
Terreno Realty Corp. | 1,484,064 | | 27,751,997 |
Two Harbors Investment Corp. | 1,721,280 | | 17,608,694 |
Ventas, Inc. | 1,025,546 | | 65,122,171 |
Washington Prime Group, Inc. (a) | 442,350 | | 8,355,992 |
Washington REIT (SBI) | 426,700 | | 11,572,104 |
Weyerhaeuser Co. (f) | 741,400 | | 23,220,648 |
WP Carey, Inc. | 597,900 | | 39,299,967 |
| | 1,245,246,265 |
Real Estate Management & Development - 0.7% |
Brookfield Asset Management, Inc. Class A | 257,600 | | 11,491,415 |
Kennedy-Wilson Holdings, Inc. | 664,021 | | 15,538,091 |
| | 27,029,506 |
TOTAL FINANCIALS | | 1,294,793,141 |
Common Stocks - continued |
| Shares | | Value |
MATERIALS - 0.2% |
Paper & Forest Products - 0.2% |
West Fraser Timber Co. Ltd. | 231,400 | | $ 10,541,237 |
TOTAL COMMON STOCKS (Cost $1,148,245,642) |
1,312,262,699
|
Preferred Stocks - 17.6% |
| | | |
Convertible Preferred Stocks - 0.9% |
FINANCIALS - 0.9% |
Real Estate Investment Trusts - 0.9% |
Alexandria Real Estate Equities, Inc. Series D 7.00% | 195,000 | | 5,313,750 |
Excel Trust, Inc. 7.00% (h) | 248,200 | | 6,515,250 |
Health Care REIT, Inc. Series I, 6.50% | 46,800 | | 2,737,800 |
Lexington Corporate Properties Trust Series C, 6.50% | 396,880 | | 18,712,892 |
Ramco-Gershenson Properties Trust (SBI) Series D, 7.25% | 40,000 | | 2,451,600 |
Weyerhaeuser Co. Series A, 6.375% | 20,000 | | 1,080,624 |
| | 36,811,916 |
Nonconvertible Preferred Stocks - 16.7% |
CONSUMER DISCRETIONARY - 0.1% |
Hotels, Restaurants & Leisure - 0.1% |
Red Lion Hotels Capital Trust 9.50% | 143,030 | | 3,727,362 |
FINANCIALS - 16.6% |
Capital Markets - 0.1% |
Arlington Asset Investment Corp. 6.625% | 182,517 | | 4,409,611 |
Real Estate Investment Trusts - 16.3% |
AG Mortgage Investment Trust, Inc. 8.00% | 461,387 | | 11,082,516 |
Alexandria Real Estate Equities, Inc. Series E, 6.45% | 145,913 | | 3,687,222 |
American Capital Agency Corp.: | | | |
8.00% | 200,000 | | 5,170,000 |
Series B, 7.75% | 360,200 | | 8,785,278 |
American Capital Mortgage Investment Corp. Series A, 8.125% | 248,636 | | 6,243,250 |
American Home Mortgage Investment Corp.: | | | |
Series A, 9.375% (a) | 120,300 | | 12 |
Series B, 9.25% (a) | 124,100 | | 12 |
American Homes 4 Rent: | | | |
Series A, 5.00% | 224,979 | | 5,579,479 |
Series B, 5.00% | 149,525 | | 3,645,420 |
Preferred Stocks - continued |
| Shares | | Value |
Nonconvertible Preferred Stocks - continued |
FINANCIALS - continued |
Real Estate Investment Trusts - continued |
American Homes 4 Rent: - continued | | | |
Series C, 5.50% | 485,000 | | $ 12,008,600 |
American Realty Capital Properties, Inc. Series F, 6.70% | 300,409 | | 6,984,509 |
Annaly Capital Management, Inc.: | | | |
Series A, 7.875% | 134,900 | | 3,419,715 |
Series C, 7.625% | 162,837 | | 3,974,851 |
Series D, 7.50% | 310,731 | | 7,497,939 |
Anworth Mortgage Asset Corp. Series A, 8.625% | 309,630 | | 7,836,735 |
Apollo Commercial Real Estate Finance, Inc. Series A, 8.625% | 375,101 | | 9,876,409 |
Apollo Residential Mortgage, Inc. Series A, 8.00% | 279,276 | | 6,758,479 |
Arbor Realty Trust, Inc.: | | | |
7.375% (a)(g) | 330,605 | | 8,162,637 |
Series A, 8.25% (g) | 189,089 | | 4,727,225 |
Series B, 7.75% (g) | 240,000 | | 5,882,400 |
Series C, 8.50% (g) | 100,000 | | 2,525,000 |
Armour Residential REIT, Inc. Series B, 7.875% | 153,654 | | 3,727,646 |
Ashford Hospitality Trust, Inc.: | | | |
Series D, 8.45% | 47,000 | | 1,200,850 |
Series E, 9.00% | 140,751 | | 3,814,352 |
Boston Properties, Inc. 5.25% | 10,915 | | 256,503 |
Brandywine Realty Trust Series E, 6.90% | 95,000 | | 2,512,750 |
Campus Crest Communities, Inc. Series A, 8.00% | 248,431 | | 6,372,255 |
Capstead Mortgage Corp. Series E, 7.50% | 202,984 | | 4,885,622 |
CBL & Associates Properties, Inc.: | | | |
Series D, 7.375% | 289,876 | | 7,261,394 |
Series E, 6.625% | 197,063 | | 4,812,278 |
Cedar Shopping Centers, Inc. Series B, 7.25% | 399,750 | | 10,185,630 |
CenterPoint Properties Trust Series D, 5.377% | 3,575 | | 2,609,750 |
Chesapeake Lodging Trust Series A, 7.75% | 266,916 | | 6,985,192 |
Colony Financial, Inc.: | | | |
Series A, 8.50% | 282,171 | | 7,378,772 |
Series B, 7.50% | 80,000 | | 1,944,800 |
CommonWealth REIT: | | | |
7.50% | 93,300 | | 1,893,057 |
Series E, 7.25% | 648,952 | | 16,846,794 |
Coresite Realty Corp. Series A, 7.25% | 369,799 | | 9,481,646 |
Corporate Office Properties Trust Series L, 7.375% | 161,840 | | 4,212,695 |
CubeSmart Series A, 7.75% | 40,000 | | 1,065,200 |
Preferred Stocks - continued |
| Shares | | Value |
Nonconvertible Preferred Stocks - continued |
FINANCIALS - continued |
Real Estate Investment Trusts - continued |
CYS Investments, Inc.: | | | |
Series A, 7.75% | 117,824 | | $ 2,880,797 |
Series B, 7.50% | 446,667 | | 10,527,941 |
DDR Corp.: | | | |
Series J, 6.50% | 340,721 | | 8,575,948 |
Series K, 6.25% | 228,888 | | 5,594,023 |
Digital Realty Trust, Inc.: | | | |
Series E, 7.00% | 219,819 | | 5,585,601 |
Series G, 5.875% | 145,444 | | 3,217,221 |
Series H, 7.375% | 50,000 | | 1,277,500 |
Duke Realty LP Series L, 6.60% | 10,666 | | 270,383 |
DuPont Fabros Technology, Inc. Series B, 7.625% | 381,202 | | 9,686,343 |
Dynex Capital, Inc.: | | | |
Series A, 8.50% | 362,932 | | 9,073,300 |
Series B, 7.625% | 252,120 | | 6,048,359 |
Equity Lifestyle Properties, Inc. Series C, 6.75% | 950,148 | | 24,504,317 |
Essex Property Trust, Inc. Series H, 7.125% | 40,000 | | 1,068,000 |
Excel Trust, Inc. Series B, 8.125% | 400,000 | | 10,428,000 |
First Potomac Realty Trust 7.75% | 415,296 | | 10,859,990 |
Five Oaks Investment Corp. Series A, 8.75% | 100,000 | | 2,517,000 |
General Growth Properties, Inc. Series A, 6.375% | 166,463 | | 4,028,405 |
Gladstone Commercial Corp. Series C, 7.125% | 232,238 | | 5,996,385 |
Glimcher Realty Trust: | | | |
6.875% | 256,115 | | 6,472,026 |
Series G, 8.125% | 109,192 | | 2,759,282 |
Series H, 7.50% | 198,527 | | 5,360,229 |
Hatteras Financial Corp. Series A, 7.625% | 353,288 | | 8,372,926 |
Health Care REIT, Inc. Series J, 6.50% | 81,600 | | 2,098,752 |
Hersha Hospitality Trust: | | | |
Series B, 8.00% | 162,538 | | 4,320,260 |
Series C, 6.875% | 50,000 | | 1,267,000 |
Hospitality Properties Trust Series D, 7.125% | 40,800 | | 1,039,584 |
Hudson Pacific Properties, Inc. 8.375% | 394,069 | | 10,442,829 |
Inland Real Estate Corp. Series A, 8.125% | 423,500 | | 11,032,175 |
Invesco Mortgage Capital, Inc. Series A, 7.75% | 123,342 | | 3,004,611 |
Investors Real Estate Trust Series B, 7.95% | 126,572 | | 3,319,984 |
iStar Financial, Inc.: | | | |
Series E, 7.875% | 188,696 | | 4,692,870 |
Series F, 7.80% | 393,843 | | 9,727,922 |
Preferred Stocks - continued |
| Shares | | Value |
Nonconvertible Preferred Stocks - continued |
FINANCIALS - continued |
Real Estate Investment Trusts - continued |
Kilroy Realty Corp.: | | | |
Series G, 6.875% | 46,760 | | $ 1,212,954 |
Series H, 6.375% | 143,296 | | 3,540,844 |
Kite Realty Group Trust 8.25% | 96,100 | | 2,499,561 |
LaSalle Hotel Properties: | | | |
Series H, 7.50% | 141,308 | | 3,710,748 |
Series I, 6.375% | 354,698 | | 8,828,433 |
LBA Realty Fund II: | | | |
Series A, 8.75% (a) | 69,000 | | 3,122,250 |
Series B, 7.625% | 31,240 | | 687,280 |
MFA Financial, Inc.: | | | |
8.00% | 538,930 | | 13,850,501 |
Series B, 7.50% | 592,024 | | 14,196,736 |
Monmouth Real Estate Investment Corp.: | | | |
Series A, 7.625% | 80,000 | | 2,042,400 |
Series B, 7.875% | 95,000 | | 2,493,750 |
National Retail Properties, Inc.: | | | |
5.70% | 376,404 | | 8,819,146 |
Series D, 6.625% | 222,138 | | 5,586,771 |
New York Mortgage Trust, Inc. Series B, 7.75% | 171,101 | | 4,055,094 |
NorthStar Realty Finance Corp.: | | | |
Series B, 8.25% | 225,708 | | 5,642,700 |
Series C, 8.875% | 275,338 | | 7,032,133 |
Series D, 8.50% | 207,301 | | 5,207,401 |
Series E, 8.75% | 313,780 | | 7,916,669 |
Pebblebrook Hotel Trust: | | | |
Series A, 7.875% | 412,000 | | 10,835,600 |
Series B, 8.00% | 185,085 | | 4,919,559 |
Series C, 6.50% | 178,160 | | 4,373,828 |
Pennsylvania (REIT) 7.375% | 100,510 | | 2,591,148 |
Prologis, Inc. Series Q, 8.54% | 94,446 | | 6,133,087 |
PS Business Parks, Inc.: | | | |
Series R, 6.875% | 116,903 | | 3,003,238 |
Series S, 6.45% | 39,500 | | 977,625 |
Series T, 6.00% | 198,004 | | 4,702,595 |
Series U, 5.75% | 600 | | 13,770 |
RAIT Financial Trust 7.625% | 216,190 | | 5,316,112 |
Regency Centers Corp.: | | | |
Series 6, 6.625% | 87,261 | | 2,260,060 |
Preferred Stocks - continued |
| Shares | | Value |
Nonconvertible Preferred Stocks - continued |
FINANCIALS - continued |
Real Estate Investment Trusts - continued |
Regency Centers Corp.: - continued | | | |
Series 7, 6.00% | 123,000 | | $ 2,955,690 |
Resource Capital Corp. 8.625% | 117,847 | | 2,873,110 |
Retail Properties America, Inc. 7.00% | 394,411 | | 9,907,604 |
Sabra Health Care REIT, Inc. Series A, 7.125% | 298,123 | | 7,763,123 |
Saul Centers, Inc.: | | | |
Series A, 8.00% | 38,072 | | 989,872 |
Series C, 6.875% | 315,478 | | 7,886,950 |
Senior Housing Properties Trust 5.625% | 283,543 | | 6,544,172 |
Stag Industrial, Inc.: | | | |
Series A, 9.00% | 280,000 | | 7,761,600 |
Series B, 6.625% | 80,300 | | 1,989,031 |
Strategic Hotel & Resorts, Inc. Series B, 8.25% | 80,000 | | 2,044,800 |
Summit Hotel Properties, Inc.: | | | |
Series A, 9.25% | 138,340 | | 3,804,350 |
Series B, 7.875% | 190,173 | | 4,954,007 |
Series C, 7.125% | 153,212 | | 3,851,750 |
Sun Communities, Inc. Series A, 7.125% | 375,000 | | 9,626,250 |
Sunstone Hotel Investors, Inc. Series D, 8.00% | 129,723 | | 3,458,415 |
Taubman Centers, Inc. Series K, 6.25% | 96,120 | | 2,354,940 |
Terreno Realty Corp. Series A, 7.75% | 213,690 | | 5,528,160 |
UMH Properties, Inc. Series A, 8.25% | 600,000 | | 15,840,000 |
Urstadt Biddle Properties, Inc. Series F, 7.125% | 210,000 | | 5,344,500 |
Vornado Realty LP 7.875% | 54,682 | | 1,392,204 |
Weingarten Realty Investors (SBI) Series F, 6.50% | 49,813 | | 1,255,786 |
Winthrop Realty Trust 7.75% | 379,600 | | 9,774,700 |
| | 680,817,844 |
Real Estate Management & Development - 0.2% |
Kennedy-Wilson, Inc. 7.75% | 321,574 | | 8,200,137 |
TOTAL FINANCIALS | | 693,427,592 |
TOTAL NONCONVERTIBLE PREFERRED STOCKS | | 697,154,954 |
TOTAL PREFERRED STOCKS (Cost $716,293,737) |
733,966,870
|
Corporate Bonds - 20.9% |
| Principal
Amount (e) | | Value |
Convertible Bonds - 3.6% |
CONSUMER DISCRETIONARY - 0.1% |
Hotels, Restaurants & Leisure - 0.1% |
Morgans Hotel Group Co. 2.375% 10/15/14 | | $ 4,510,000 | | $ 4,476,175 |
FINANCIALS - 3.5% |
Consumer Finance - 0.0% |
Zais Financial Partners LP 8% 11/15/16 (h) | | 2,000,000 | | 2,062,714 |
Diversified Financial Services - 0.6% |
IAS Operating Partnership LP 5% 3/15/18 (h) | | 25,380,000 | | 24,877,578 |
Real Estate Investment Trusts - 2.8% |
Annaly Capital Management, Inc. 5% 5/15/15 | | 31,396,000 | | 31,906,185 |
Apollo Commercial Real Estate Finance, Inc. 5.5% 3/15/19 | | 3,980,000 | | 4,223,974 |
Ares Commercial Real Estate Corp. 7% 12/15/15 | | 14,700,000 | | 15,214,500 |
Blackstone Mortgage Trust, Inc. 5.25% 12/1/18 | | 5,750,000 | | 6,156,525 |
Campus Crest Communities Operating Partnership LP 4.75% 10/15/18 (h) | | 9,000,000 | | 8,797,500 |
Colony Financial, Inc.: | | | | |
3.875% 1/15/21 | | 9,910,000 | | 10,052,456 |
5% 4/15/23 | | 9,000,000 | | 9,364,500 |
PennyMac Corp. 5.375% 5/1/20 | | 6,000,000 | | 5,950,476 |
RAIT Financial Trust 4% 10/1/33 | | 11,000,000 | | 10,518,750 |
Redwood Trust, Inc. 4.625% 4/15/18 | | 8,500,000 | | 8,755,000 |
Spirit Realty Capital, Inc. 3.75% 5/15/21 | | 4,800,000 | | 4,854,000 |
| | 115,793,866 |
Real Estate Management & Development - 0.1% |
Forest City Enterprises, Inc. 3.625% 8/15/20 | | 2,000,000 | | 2,090,000 |
Grubb & Ellis Co. 7.95% 5/1/15 (d)(h) | | 5,500,000 | | 1 |
| | 2,090,001 |
TOTAL FINANCIALS | | 144,824,159 |
TOTAL CONVERTIBLE BONDS | | 149,300,334 |
Nonconvertible Bonds - 17.3% |
CONSUMER DISCRETIONARY - 5.3% |
Hotels, Restaurants & Leisure - 0.7% |
FelCor Lodging LP: | | | | |
5.625% 3/1/23 | | 2,000,000 | | 2,000,000 |
6.75% 6/1/19 | | 5,875,000 | | 6,139,375 |
Corporate Bonds - continued |
| Principal
Amount (e) | | Value |
Nonconvertible Bonds - continued |
CONSUMER DISCRETIONARY - continued |
Hotels, Restaurants & Leisure - continued |
Hilton Worldwide Finance LLC/Hilton Worldwide Finance Corp. 5.625% 10/15/21 (h) | | $ 4,000,000 | | $ 4,190,000 |
Paris Las Vegas Holding LLC/Harrah's Las Vegas LLC/Flamingo Las Vegas Holdings, Inc. 8% 10/1/20 (h) | | 4,500,000 | | 4,612,500 |
Playa Resorts Holding BV 8% 8/15/20 (h) | | 1,230,000 | | 1,297,650 |
RHP Hotel Properties LP/RHP Finance Co. 5% 4/15/21 | | 2,000,000 | | 1,985,000 |
Times Square Hotel Trust 8.528% 8/1/26 (h) | | 8,328,905 | | 10,443,093 |
| | 30,667,618 |
Household Durables - 4.6% |
Ashton Woods U.S.A. LLC/Ashton Woods Finance Co. 6.875% 2/15/21 (h) | | 10,500,000 | | 10,237,500 |
Brookfield Residential Properties, Inc./Brookfield Residential U.S. Corp. 6.125% 7/1/22 (h) | | 1,000,000 | | 1,025,000 |
Brookfield Residential Properties, Inc. 6.5% 12/15/20 (h) | | 1,615,000 | | 1,693,731 |
D.R. Horton, Inc.: | | | | |
4.375% 9/15/22 | | 4,175,000 | | 4,112,375 |
4.75% 5/15/17 | | 2,000,000 | | 2,095,000 |
5.75% 8/15/23 | | 2,510,000 | | 2,648,050 |
KB Home: | | | | |
8% 3/15/20 | | 8,465,000 | | 9,586,613 |
9.1% 9/15/17 | | 4,985,000 | | 5,782,600 |
Lennar Corp.: | | | | |
4.125% 12/1/18 | | 5,520,000 | | 5,547,600 |
4.5% 6/15/19 | | 1,830,000 | | 1,830,000 |
5.6% 5/31/15 | | 6,000,000 | | 6,186,300 |
6.5% 4/15/16 | | 4,000,000 | | 4,250,000 |
6.95% 6/1/18 | | 14,280,000 | | 15,904,350 |
M/I Homes, Inc. 8.625% 11/15/18 | | 26,055,000 | | 27,390,319 |
Meritage Homes Corp.: | | | | |
7% 4/1/22 | | 7,525,000 | | 8,221,063 |
7.15% 4/15/20 | | 7,060,000 | | 7,783,650 |
Ryland Group, Inc.: | | | | |
6.625% 5/1/20 | | 1,555,000 | | 1,663,850 |
8.4% 5/15/17 | | 5,420,000 | | 6,233,000 |
Standard Pacific Corp.: | | | | |
7% 8/15/15 | | 4,000,000 | | 4,170,000 |
8.375% 5/15/18 | | 28,983,000 | | 33,257,993 |
Corporate Bonds - continued |
| Principal
Amount (e) | | Value |
Nonconvertible Bonds - continued |
CONSUMER DISCRETIONARY - continued |
Household Durables - continued |
Standard Pacific Corp.: - continued | | | | |
10.75% 9/15/16 | | $ 8,415,000 | | $ 9,761,400 |
Toll Brothers Finance Corp. 5.875% 2/15/22 | | 1,550,000 | | 1,662,375 |
WCI Communities, Inc. 6.875% 8/15/21 (h) | | 1,845,000 | | 1,891,125 |
William Lyon Homes, Inc.: | | | | |
7% 8/15/22 (h)(i) | | 2,505,000 | | 2,505,000 |
8.5% 11/15/20 | | 15,550,000 | | 17,143,875 |
| | 192,582,769 |
TOTAL CONSUMER DISCRETIONARY | | 223,250,387 |
CONSUMER STAPLES - 0.0% |
Food & Staples Retailing - 0.0% |
Ahold Lease Series 2001 A1 pass thru trust certificates 7.82% 1/2/20 | | 759,804 | | 852,880 |
FINANCIALS - 11.1% |
Diversified Financial Services - 0.4% |
Cantor Commercial Real Estate Co. LP/CCRE Finance Corp. 7.75% 2/15/18 (h) | | 4,755,000 | | 5,087,850 |
Icahn Enterprises LP/Icahn Enterprises Finance Corp.: | | | | |
5.875% 2/1/22 | | 3,680,000 | | 3,751,300 |
6% 8/1/20 | | 6,000,000 | | 6,255,000 |
| | 15,094,150 |
Real Estate Investment Trusts - 7.4% |
American Campus Communities Operating Partnership LP 4.125% 7/1/24 | | 2,000,000 | | 2,006,580 |
American Tower Corp. 3.4% 2/15/19 | | 1,000,000 | | 1,036,709 |
Camden Property Trust 5% 6/15/15 | | 1,100,000 | | 1,141,236 |
CBL & Associates LP 5.25% 12/1/23 | | 1,000,000 | | 1,065,829 |
Commercial Net Lease Realty, Inc. 6.15% 12/15/15 | | 2,526,000 | | 2,700,178 |
Crown Castle International Corp. 5.25% 1/15/23 | | 4,000,000 | | 4,040,000 |
CTR Partnership LP / CareTrust Capital Corp. 5.875% 6/1/21 (h) | | 2,300,000 | | 2,305,750 |
CubeSmart LP 4.8% 7/15/22 | | 2,000,000 | | 2,137,444 |
DDR Corp.: | | | | |
5.5% 5/1/15 | | 4,000,000 | | 4,134,580 |
7.5% 4/1/17 | | 6,000,000 | | 6,878,238 |
7.5% 7/15/18 | | 8,756,000 | | 10,375,028 |
Corporate Bonds - continued |
| Principal
Amount (e) | | Value |
Nonconvertible Bonds - continued |
FINANCIALS - continued |
Real Estate Investment Trusts - continued |
DDR Corp.: - continued | | | | |
7.875% 9/1/20 | | $ 4,637,000 | | $ 5,824,128 |
9.625% 3/15/16 | | 3,836,000 | | 4,356,265 |
DuPont Fabros Technology LP 5.875% 9/15/21 | | 1,000,000 | | 1,020,000 |
Equity One, Inc.: | | | | |
5.375% 10/15/15 | | 3,500,000 | | 3,677,632 |
6.25% 1/15/17 | | 3,000,000 | | 3,312,594 |
Equity Residential 5.125% 3/15/16 | | 7,201,000 | | 7,694,859 |
HCP, Inc. 3.75% 2/1/16 | | 10,000,000 | | 10,430,250 |
Health Care Property Investors, Inc.: | | | | |
5.625% 5/1/17 | | 2,980,000 | | 3,309,528 |
6% 3/1/15 | | 1,000,000 | | 1,030,515 |
6% 1/30/17 | | 2,383,000 | | 2,650,163 |
7.072% 6/8/15 | | 1,500,000 | | 1,579,319 |
Health Care REIT, Inc.: | | | | |
3.625% 3/15/16 | | 14,685,000 | | 15,309,994 |
4.125% 4/1/19 | | 2,000,000 | | 2,150,084 |
6.2% 6/1/16 | | 2,750,000 | | 3,002,469 |
Healthcare Realty Trust, Inc.: | | | | |
3.75% 4/15/23 | | 4,022,000 | | 3,924,535 |
5.75% 1/15/21 | | 3,095,000 | | 3,494,862 |
6.5% 1/17/17 | | 2,875,000 | | 3,207,048 |
Highwoods/Forsyth LP: | | | | |
3.625% 1/15/23 | | 1,607,000 | | 1,580,740 |
5.85% 3/15/17 | | 2,800,000 | | 3,097,450 |
Hospitality Properties Trust: | | | | |
5% 8/15/22 | | 3,177,000 | | 3,351,433 |
5.625% 3/15/17 | | 915,000 | | 996,299 |
HRPT Properties Trust: | | | | |
5.75% 11/1/15 | | 4,826,000 | | 4,968,541 |
6.25% 8/15/16 | | 9,675,000 | | 10,297,228 |
6.25% 6/15/17 | | 1,055,000 | | 1,127,346 |
6.65% 1/15/18 | | 4,246,000 | | 4,616,816 |
iStar Financial, Inc.: | | | | |
3.875% 7/1/16 | | 2,855,000 | | 2,876,413 |
4% 11/1/17 | | 15,000,000 | | 14,775,000 |
5% 7/1/19 | | 15,000,000 | | 14,775,000 |
5.85% 3/15/17 | | 3,587,000 | | 3,766,350 |
5.875% 3/15/16 | | 27,070,000 | | 28,423,500 |
Corporate Bonds - continued |
| Principal
Amount (e) | | Value |
Nonconvertible Bonds - continued |
FINANCIALS - continued |
Real Estate Investment Trusts - continued |
iStar Financial, Inc.: - continued | | | | |
6.05% 4/15/15 | | $ 14,630,000 | | $ 14,959,175 |
7.125% 2/15/18 | | 5,725,000 | | 6,183,000 |
9% 6/1/17 | | 9,175,000 | | 10,390,688 |
MPT Operating Partnership LP/MPT Finance Corp.: | | | | |
6.375% 2/15/22 | | 3,610,000 | | 3,844,650 |
6.875% 5/1/21 | | 2,000,000 | | 2,150,000 |
National Retail Properties, Inc. 3.3% 4/15/23 | | 2,000,000 | | 1,931,756 |
Nationwide Health Properties, Inc. 6% 5/20/15 | | 5,670,000 | | 5,902,805 |
Omega Healthcare Investors, Inc.: | | | | |
4.95% 4/1/24 (h) | | 2,898,000 | | 2,979,144 |
6.75% 10/15/22 | | 2,115,000 | | 2,273,625 |
7.5% 2/15/20 | | 1,000,000 | | 1,063,750 |
Potlatch Corp. 7.5% 11/1/19 | | 1,000,000 | | 1,160,000 |
Prologis LP 7.625% 7/1/17 | | 4,690,000 | | 5,237,229 |
Reckson Operating Partnership LP/SL Green Realty Corp./SL Green Operating Partnership LP 7.75% 3/15/20 | | 2,000,000 | | 2,389,382 |
Senior Housing Properties Trust: | | | | |
3.25% 5/1/19 | | 2,882,000 | | 2,911,846 |
4.3% 1/15/16 | | 5,000,000 | | 5,165,360 |
4.75% 5/1/24 | | 3,988,000 | | 4,062,923 |
6.75% 4/15/20 | | 13,624,000 | | 15,635,202 |
6.75% 12/15/21 | | 8,000,000 | | 9,316,872 |
United Dominion Realty Trust, Inc.: | | | | |
5.25% 1/15/15 | | 1,000,000 | | 1,020,666 |
5.25% 1/15/16 | | 4,000,000 | | 4,236,568 |
| | 311,262,574 |
Real Estate Management & Development - 3.2% |
BioMed Realty LP 3.85% 4/15/16 | | 2,000,000 | | 2,089,560 |
Brandywine Operating Partnership LP 7.5% 5/15/15 | | 1,000,000 | | 1,049,968 |
CBRE Group, Inc.: | | | | |
5% 3/15/23 | | 6,020,000 | | 5,989,900 |
6.625% 10/15/20 | | 1,205,000 | | 1,263,744 |
Corporate Office Properties LP 3.6% 5/15/23 | | 5,000,000 | | 4,783,790 |
ERP Operating LP 5.25% 9/15/14 | | 4,815,000 | | 4,839,759 |
Excel Trust LP 4.625% 5/15/24 | | 2,403,000 | | 2,447,780 |
Forestar U.S.A. Real Estate Group 8.5% 6/1/22 (h) | | 10,515,000 | | 10,935,600 |
Corporate Bonds - continued |
| Principal
Amount (e) | | Value |
Nonconvertible Bonds - continued |
FINANCIALS - continued |
Real Estate Management & Development - continued |
Host Hotels & Resorts LP 5.25% 3/15/22 | | $ 2,000,000 | | $ 2,210,924 |
Howard Hughes Corp. 6.875% 10/1/21 (h) | | 9,715,000 | | 10,225,038 |
Hunt Companies, Inc. 9.625% 3/1/21 (h) | | 4,100,000 | | 4,305,000 |
Kennedy-Wilson, Inc.: | | | | |
5.875% 4/1/24 | | 2,610,000 | | 2,616,525 |
8.75% 4/1/19 | | 20,410,000 | | 21,864,213 |
Mid-America Apartments LP: | | | | |
3.75% 6/15/24 | | 1,663,000 | | 1,640,892 |
6.05% 9/1/16 | | 2,500,000 | | 2,725,500 |
Realogy Corp. 7.875% 2/15/19 (h) | | 7,085,000 | | 7,474,675 |
Realogy Group LLC/Realogy Co.-Issuer Corp. 4.5% 4/15/19 (h) | | 4,805,000 | | 4,660,850 |
Regency Centers LP: | | | | |
5.25% 8/1/15 | | 4,509,000 | | 4,707,265 |
5.875% 6/15/17 | | 400,000 | | 447,284 |
Taylor Morrison Communities, Inc./Monarch Communities, Inc.: | | | | |
5.25% 4/15/21 (h) | | 2,000,000 | | 1,970,000 |
5.625% 3/1/24 (h) | | 2,270,000 | | 2,224,600 |
Ventas Realty LP 1.55% 9/26/16 | | 7,000,000 | | 7,058,863 |
Ventas Realty LP/Ventas Capital Corp.: | | | | |
2.7% 4/1/20 | | 3,000,000 | | 2,963,976 |
3.125% 11/30/15 | | 13,807,000 | | 14,222,563 |
4% 4/30/19 | | 2,262,000 | | 2,420,869 |
Wells Operating Partnership II LP 5.875% 4/1/18 | | 3,000,000 | | 3,138,420 |
Weyerhaeuser Real Estate Co. 5.875% 6/15/24 (h) | | 1,890,000 | | 1,918,350 |
| | 132,195,908 |
Thrifts & Mortgage Finance - 0.1% |
Ocwen Financial Corp. 6.625% 5/15/19 (h) | | 4,005,000 | | 4,095,113 |
Wrightwood Capital LLC 1.9% 4/20/20 (d) | | 110,410 | | 500,156 |
| | 4,595,269 |
TOTAL FINANCIALS | | 463,147,901 |
Corporate Bonds - continued |
| Principal
Amount (e) | | Value |
Nonconvertible Bonds - continued |
HEALTH CARE - 0.6% |
Health Care Equipment & Supplies - 0.3% |
Aviv Healthcare Properties LP/Aviv Healthcare Capital Corp.: | | | | |
6% 10/15/21 | | $ 1,370,000 | | $ 1,438,500 |
7.75% 2/15/19 | | 10,410,000 | | 10,930,500 |
| | 12,369,000 |
Health Care Providers & Services - 0.3% |
Sabra Health Care LP/Sabra Capital Corp.: | | | | |
5.375% 6/1/23 | | 2,795,000 | | 2,788,013 |
5.5% 2/1/21 | | 9,070,000 | | 9,296,750 |
| | 12,084,763 |
TOTAL HEALTH CARE | | 24,453,763 |
INDUSTRIALS - 0.2% |
Commercial Services & Supplies - 0.1% |
Iron Mountain, Inc. 5.75% 8/15/24 | | 4,235,000 | | 4,235,000 |
Industrial Conglomerates - 0.1% |
Ladder Capital Finance Holdings LLLP/Ladder Capital Finance Corp. 7.375% 10/1/17 | | 3,050,000 | | 3,255,875 |
TOTAL INDUSTRIALS | | 7,490,875 |
INFORMATION TECHNOLOGY - 0.1% |
Internet Software & Services - 0.1% |
CyrusOne LP/CyrusOne Finance Corp. 6.375% 11/15/22 | | 3,000,000 | | 3,165,000 |
TOTAL NONCONVERTIBLE BONDS | | 722,360,806 |
TOTAL CORPORATE BONDS (Cost $832,223,479) |
871,661,140
|
Asset-Backed Securities - 2.2% |
|
Capital Trust RE CDO Ltd.: | | | | |
Series 2005-1A Class D, 1.6562% 3/20/50 (h)(j) | | 2,250,000 | | 95,625 |
Series 2005-3A Class A2, 5.16% 6/25/35 (h) | | 12,158 | | 11,915 |
CapitalSource Real Estate Loan Trust Series 2006-1A Class A2A, 0.4836% 1/20/37 (h)(j) | | 81,455 | | 79,826 |
Asset-Backed Securities - continued |
| Principal
Amount (e) | | Value |
CapLease CDO Ltd. Series 2005-1A Class A, 4.926% 1/29/40 (h) | | $ 910,893 | | $ 901,784 |
CBRE Realty Finance CDO LLC Series 2007-1A Class A1, 0.4821% 4/7/52 (h)(j) | | 686,542 | | 665,946 |
Conseco Finance Securitizations Corp. Series 2002-2 Class M2, 9.163% 3/1/33 (j) | | 500,000 | | 432,715 |
Crest Clarendon Street Ltd./Crest Clarendon Corp. Series 2002-1A Class D, 9% 12/28/35 (h) | | 573,683 | | 389,875 |
Crest Dartmouth Street Ltd./Crest Dartmouth Street Corp. Series 2003-1A Class D, 9% 6/28/38 (h) | | 346,972 | | 348,533 |
Deutsche Financial Capital Securitization LLC Series 1997-I Class M, 7.275% 9/15/27 | | 7,913,633 | | 7,729,380 |
Fairfield Street Solar Corp. Series 2004-1A Class E1, 3.5944% 11/28/39 (h)(j) | | 609,640 | | 61 |
Green Tree Financial Corp.: | | | | |
Series 1996-4 Class M1, 7.75% 6/15/27 | | 1,788,179 | | 1,774,707 |
Series 1997-3 Class M1, 7.53% 3/15/28 | | 6,996,415 | | 6,027,164 |
GSR Mortgage Loan Trust Series 2005-HE3 Class B3, 3.905% 6/25/35 (j)(m) | | 212,276 | | 4,647 |
Guggenheim Structured Real Estate Funding Ltd./Guggenheim Structured Real Estate Funding LLC Series 2005-2A: | | | | |
Class D, 1.705% 8/26/30 (h)(j) | | 89,648 | | 88,527 |
Class E, 2.155% 8/26/30 (h)(j) | | 1,420,000 | | 972,700 |
HLSS Servicer Advance Receivables Backed Notes Series 2013-T2 Class D2, 2.388% 5/16/44 (h) | | 3,000,000 | | 2,998,195 |
Invitation Homes Trust Series 2014-SFR1 Class E, 3.4062% 6/17/31 (h)(j) | | 10,000,000 | | 9,999,935 |
Lehman ABS Manufactured Housing Contract Trust Series 2001-B Class M2, 7.17% 4/15/40 | | 1,012,616 | | 494,533 |
Merit Securities Corp. Series 13 Class M1, 7.688% 12/28/33 (j) | | 1,923,000 | | 2,043,059 |
Mesa West Capital CDO Ltd. Series 2007-1A: | | | | |
Class A1, 0.415% 2/25/47 (h)(j) | | 1,617,882 | | 1,601,703 |
Class A2, 0.445% 2/25/47 (h)(j) | | 21,240,000 | | 20,655,900 |
N-Star Real Estate CDO Ltd. Series 1A Class C1B, 7.696% 8/28/38 (h) | | 899,989 | | 917,989 |
Taberna Preferred Funding III Ltd. Series 2005-3A Class D, 2.8729% 2/5/36 (h)(j) | | 3,803,196 | | 380 |
Wachovia Ltd./Wachovia LLC: | | | | |
Series 2006-1 Class 1ML, 5.7326% 9/25/26 (h)(j) | | 2,000,000 | | 1,400,000 |
Series 2006-1A: | | | | |
Class B, 0.5926% 9/25/26 (h)(j) | | 2,240,259 | | 2,199,934 |
Class C, 0.7626% 9/25/26 (h)(j) | | 7,030,000 | | 6,868,310 |
Asset-Backed Securities - continued |
| Principal
Amount (e) | | Value |
Wachovia Ltd./Wachovia LLC: - continued | | | | |
Series 2006-1A: | | | | |
Class D, 0.8626% 9/25/26 (h)(j) | | $ 2,080,000 | | $ 1,977,040 |
Class E, 0.9626% 9/25/26 (h)(j) | | 2,780,000 | | 2,621,540 |
Class F, 1.3826% 9/25/26 (h)(j) | | 3,483,000 | | 3,230,483 |
Class G, 1.5826% 9/25/26 (h)(j) | | 1,599,000 | | 1,475,877 |
Class H, 1.8826% 9/25/26 (h)(j) | | 1,535,000 | | 1,412,968 |
Class J, 2.9826% 9/25/26 (h)(j) | | 1,500,000 | | 1,392,000 |
Class K, 3.4826% 9/25/26 (h)(j) | | 2,475,000 | | 2,229,975 |
Class L, 4.2326% 9/25/26 (h)(j) | | 1,500,000 | | 1,370,250 |
Wrightwood Capital Real Estate CDO Ltd. Series 2005-1A: | | | | |
Class A1, 0.547% 11/21/40 (h)(j) | | 6,037,856 | | 5,705,774 |
Class F, 2.177% 11/21/40 (h)(j) | | 250,000 | | 29,275 |
TOTAL ASSET-BACKED SECURITIES (Cost $93,851,617) |
90,148,525
|
Collateralized Mortgage Obligations - 0.3% |
|
Private Sponsor - 0.3% |
Countrywide Home Loans, Inc.: | | | | |
Series 2002-38 Class B3, 5% 2/25/18 (h) | | 41,113 | | 173 |
Series 2002-R2 Class 2B3, 3.664% 7/25/33 (h)(j) | | 181,238 | | 53,428 |
Series 2003-R3 Class B2, 5.5% 11/25/33 (h) | | 1,086,466 | | 131,471 |
Series 2004-R1 Class 1B3, 5.0042% 11/25/34 (h)(j) | | 38,272 | | 2,747 |
FREMF Mortgage Trust: | | | | |
Series 2010-K6 Class B, 5.5329% 12/25/46 (h)(j) | | 4,500,000 | | 4,975,830 |
Series 2010-K7 Class B, 5.618% 4/25/20 (h)(j) | | 3,200,000 | | 3,574,253 |
Merrill Lynch Mortgage Investors Trust Series 1998-C3 Class F, 6% 12/15/30 (h) | | 1,388,624 | | 1,453,435 |
RESI Finance LP/RESI Finance DE Corp. floater Series 2003-B Class B9, 12.1025% 7/10/35 (h)(j) | | 155,567 | | 172,384 |
Residential Funding Securities Corp. Series 2002-RM1 Class BI1, 5.5% 12/25/17 (h) | | 15,441 | | 13,851 |
RESIX Finance Ltd. floater: | | | | |
Series 2003-D Class B8, 6.6525% 12/10/35 (h)(j) | | 169,695 | | 40,277 |
Series 2004-A Class B7, 4.4025% 2/10/36 (h)(j) | | 178,210 | | 48,248 |
Series 2004-B Class B7, 4.1525% 2/10/36 (h)(j) | | 224,769 | | 82,416 |
TOTAL PRIVATE SPONSOR | | 10,548,513 |
Collateralized Mortgage Obligations - continued |
| Principal
Amount (e) | | Value |
U.S. Government Agency - 0.0% |
Fannie Mae REMIC Trust: | | | | |
Series 2001-W3 subordinate REMIC pass thru certificates, Class B3, 7% 9/25/41 (m) | | $ 113,309 | | $ 37,591 |
Series 2002-W1 subordinate REMIC pass thru certificates, Class 3B3, 3.1641% 2/25/42 (h)(j) | | 85,297 | | 47,472 |
Series 2003-W1 subordinate REMIC pass thru certificates, Class B3, 4.5664% 12/25/42 (j)(m) | | 184,544 | | 30,990 |
Series 2003-W10 subordinate REMIC pass thru certificates, Class 2B3, 3.095% 6/25/43 (h)(j) | | 125,783 | | 52,539 |
Series 2003-W4 subordinate REMIC pass thru certificates, Class 2B3, 3.0288% 10/25/42 (h)(j) | | 51,657 | | 26,741 |
TOTAL U.S. GOVERNMENT AGENCY | | 195,333 |
TOTAL COLLATERALIZED MORTGAGE OBLIGATIONS (Cost $10,579,057) |
10,743,846
|
Commercial Mortgage Securities - 13.0% |
|
ACGS Series 2004-1 Class P, 7.4605% 8/1/19 (m) | | 1,607,561 | | 1,595,253 |
Americold LLC Trust Series 2010-ARTA Class D, 7.443% 1/14/29 (h) | | 2,000,000 | | 2,278,707 |
Banc of America Commercial Mortgage Trust: | | | | |
Series 2005-1 Class CJ, 5.4665% 11/10/42 (j) | | 3,580,000 | | 3,660,768 |
Series 2005-5 Class D, 5.3884% 10/10/45 (j) | | 4,000,000 | | 4,046,484 |
Series 2005-6 Class AJ, 5.3495% 9/10/47 (j) | | 5,000,000 | | 5,242,815 |
Banc of America Large Loan, Inc. floater Series 2005-MIB1 Class K, 2.152% 3/15/22 (h)(j) | | 760,684 | | 670,139 |
Banc of America REMIC Trust Series 2012-CLMZ Class A, 7.652% 8/15/17 (h)(j) | | 4,900,000 | | 4,908,330 |
Bear Stearns Commercial Mortgage Securities, Inc. Series 2006-PW11 Class AJ, 5.6047% 3/11/39 (j) | | 5,700,000 | | 5,877,419 |
Bear Stearns Commercial Mortgage Securities Trust Series 2006-T22 Class B, 5.7569% 4/12/38 (h)(j) | | 2,520,000 | | 2,677,709 |
Boca Hotel Portfolio Trust Series 2013-BOCA Class E, 3.902% 8/15/26 (h)(j) | | 2,500,000 | | 2,502,910 |
CGBAM Commercial Mortgage Trust floater Series 2014-HD Class E, 3.1518% 2/15/31 (h)(j) | | 5,769,000 | | 5,776,904 |
Citigroup Commercial Mortgage Trust Series 2013-GC15 Class D, 5.277% 9/10/46 (h)(j) | | 2,750,000 | | 2,736,311 |
COMM Mortgage Trust: | | | | |
sequential payer Series 2013-LC6 Class E, 3.5% 1/10/46 (h) | | 4,300,000 | | 3,445,349 |
Commercial Mortgage Securities - continued |
| Principal
Amount (e) | | Value |
COMM Mortgage Trust: - continued | | | | |
Series 2012-CR5 Class D, 4.4798% 12/10/45 (h)(j) | | $ 2,000,000 | | $ 2,000,636 |
Series 2013-CR10 Class D, 4.958% 8/10/46 (h)(j) | | 2,000,000 | | 1,956,635 |
Series 2013-CR12 Class D, 5.2553% 10/10/46 (h)(j) | | 3,000,000 | | 2,952,387 |
Series 2013-CR9 Class D, 4.4022% 7/10/45 (h)(j) | | 4,255,000 | | 3,991,662 |
Series 2013-LC6 Class D, 4.4319% 1/10/46 (h)(j) | | 3,870,000 | | 3,677,173 |
Series 2014-UBS2 Class D, 5.1831% 3/10/47 (h)(j) | | 3,713,000 | | 3,559,040 |
Commercial Mortgage Acceptance Corp. Series 1998-C2 Class J, 5.44% 9/15/30 (h) | | 2,646,159 | | 2,558,931 |
Commercial Mortgage Trust pass-thru certificates: | | | | |
Series 2005-C6 Class AJ, 5.209% 6/10/44 (j) | | 5,000,000 | | 5,175,945 |
Series 2012-CR1: | | | | |
Class C, 5.5464% 5/15/45 (j) | | 1,000,000 | | 1,105,871 |
Class D, 5.5464% 5/15/45 (h)(j) | | 5,550,000 | | 5,676,374 |
Series 2012-CR2: | | | | |
Class D, 5.0196% 8/15/45 (h)(j) | | 4,500,000 | | 4,670,199 |
Class E, 5.0196% 8/15/45 (h)(j) | | 6,000,000 | | 5,986,944 |
Series 2012-LC4: | | | | |
Class C, 5.8228% 12/10/44 (j) | | 2,000,000 | | 2,235,678 |
Class D, 5.8228% 12/10/44 (h)(j) | | 8,000,000 | | 8,410,016 |
Credit Suisse First Boston Mortgage Securities Corp.: | | | | |
Series 1998-C1 Class F, 6% 5/17/40 (h) | | 1,530,094 | | 1,669,010 |
Series 1998-C2 Class F, 6.75% 11/15/30 (h) | | 2,149,220 | | 2,223,860 |
DBUBS Mortgage Trust Series 2011-LC1A: | | | | |
Class E, 5.7302% 11/10/46 (h)(j) | | 12,490,000 | | 13,439,265 |
Class G, 4.652% 11/10/46 (h) | | 9,843,000 | | 8,454,793 |
Deutsche Mortgage & Asset Receiving Corp. Series 1998-C1 Class J, 6.22% 6/15/31 | | 51,442 | | 51,391 |
Extended Stay America Trust Series 2013-ESH7 Class C7, 3.9017% 12/5/31 (h) | | 500,000 | | 510,914 |
Freddie Mac: | | | | |
pass-thru certificates: | | | | |
Series K011 Class X3, 2.6622% 12/25/43 (j)(k) | | 12,206,096 | | 1,735,585 |
Series K012 Class X3, 2.366% 1/25/41 (j)(k) | | 21,072,886 | | 2,683,801 |
Series K013 Class X3, 2.8852% 1/25/43 (j)(k) | | 14,360,000 | | 2,250,959 |
Series KAIV Class X2, 3.6147% 6/25/46 (j)(k) | | 7,430,000 | | 1,445,962 |
G-Force LLC sequential payer Series 2005-RRA Class A2, 4.83% 8/22/36 (h) | | 10,247 | | 10,247 |
GMAC Commercial Mortgage Securities, Inc.: | | | | |
Series 1997-C2 Class G, 6.75% 4/15/29 (j) | | 716,241 | | 776,204 |
Series 2000-C1 Class K, 7% 3/15/33 | | 16,103 | | 16,280 |
GP Portfolio Trust Series 2014-GPP Class E, 4.002% 2/15/27 (h)(j) | | 2,823,000 | | 2,825,965 |
Commercial Mortgage Securities - continued |
| Principal
Amount (e) | | Value |
Greenwich Capital Commercial Funding Corp. Series 2006-GG7 Class A4, 6.0146% 7/10/38 (j) | | $ 7,954,707 | | $ 8,516,715 |
GS Mortgage Securities Corp. II Series 2010-C1: | | | | |
Class D, 6.169% 8/10/43 (h)(j) | | 4,000,000 | | 4,438,020 |
Class E, 4% 8/10/43 (h) | | 3,770,000 | | 3,362,169 |
GS Mortgage Securities Trust: | | | | |
Series 2010-C2 Class D, 5.3978% 12/10/43 (h)(j) | | 3,000,000 | | 3,132,480 |
Series 2011-GC5: | | | | |
Class C, 5.4738% 8/10/44 (h)(j) | | 9,000,000 | | 9,939,294 |
Class D, 5.4738% 8/10/44 (h)(j) | | 4,000,000 | | 4,192,568 |
Class E, 5.4738% 8/10/44 (h)(j) | | 4,049,000 | | 3,825,924 |
Series 2012-GC6 Class C, 5.8259% 1/10/45 (h)(j) | | 3,600,000 | | 4,029,503 |
Series 2012-GCJ7: | | | | |
Class C, 5.9067% 5/10/45 (j) | | 6,500,000 | | 7,266,509 |
Class D, 5.9067% 5/10/45 (h)(j) | | 3,000,000 | | 3,173,227 |
Class E, 5% 5/10/45 (h) | | 6,920,000 | | 6,344,347 |
Series 2012-GCJ9 Class D, 4.858% 11/10/45 (h)(j) | | 2,000,000 | | 1,998,964 |
Series 2013-GC16 Class D, 5.323% 11/10/46 (h)(j) | | 3,250,000 | | 3,296,098 |
Hilton U.S.A. Trust: | | | | |
floater Series 2014-ORL Class E, 3.5534% 7/15/29 (h)(j) | | 4,000,000 | | 4,003,809 |
Series 2013-HLT Class EFX, 5.6086% 11/5/30 (h)(j) | | 3,000,000 | | 3,087,078 |
Invitation Homes Trust floater Series 2013-SFR1: | | | | |
Class E, 2.9% 12/17/30 (h)(j) | | 1,500,000 | | 1,470,293 |
Class F, 3.9% 12/17/30 (h)(j) | | 1,750,000 | | 1,730,195 |
JPMorgan Chase Commercial Mortgage Securities Corp.: | | | | |
Series 2003-C1 Class F, 6.1573% 1/12/37 (h)(j) | | 1,000,000 | | 1,009,209 |
Series 2009-IWST: | | | | |
Class C, 7.6935% 12/5/27 (h)(j) | | 3,000,000 | | 3,682,794 |
Class D, 7.6935% 12/5/27 (h)(j) | | 9,550,000 | | 11,648,374 |
Series 2010-CNTM Class MZ, 8.5% 8/5/20 (h) | | 9,000,000 | | 9,389,840 |
Series 2010-CNTR: | | | | |
Class D, 6.3899% 8/5/32 (h)(j) | | 4,500,000 | | 5,104,256 |
Class XB, 1.1366% 8/5/32 (h)(j)(k) | | 32,655,000 | | 1,341,921 |
Series 2012-CBX Class C, 5.358% 6/15/45 (j) | | 4,530,000 | | 4,947,000 |
JPMorgan Chase Commercial Mortgage Securities Trust: | | | | |
floater: | | | | |
Series 2013-JWMZ Class M, 6.152% 4/15/18 (h)(j) | | 2,143,851 | | 2,157,968 |
Series 2013-JWRZ Class E, 3.892% 4/15/30 (h)(j) | | 3,400,000 | | 3,393,597 |
Series 2014-FBLU Class E, 3.6518% 12/15/28 (h)(j) | | 2,000,000 | | 2,000,802 |
Commercial Mortgage Securities - continued |
| Principal
Amount (e) | | Value |
JPMorgan Chase Commercial Mortgage Securities Trust: - continued | | | | |
floater: | | | | |
Series 2014-INN: | | | | |
Class E, 3.751% 6/15/29 (h)(j) | | $ 6,593,000 | | $ 6,597,068 |
Class F, 4.152% 6/15/29 (h)(j) | | 6,593,000 | | 6,599,179 |
Series 2005-LDP5 Class AJ, 5.5262% 12/15/44 (j) | | 3,470,000 | | 3,618,426 |
Series 2011-C4 Class F, 3.873% 7/15/46 (h) | | 1,400,000 | | 1,271,725 |
Series 2011-C5 Class C, 5.5023% 8/15/46 (h)(j) | | 6,525,375 | | 7,267,878 |
Series 2013-LC11 Class D, 4.383% 4/15/46 (j) | | 3,750,000 | | 3,521,536 |
JPMorgan Commercial Mortgage Finance Corp. Series 1999-C8 Class H, 6% 7/15/31 (h) | | 1,393,719 | | 1,280,411 |
LB Commercial Conduit Mortgage Trust Series 1998-C4 Class G, 5.6% 10/15/35 (h) | | 116,194 | | 116,431 |
LB-UBS Commercial Mortgage Trust: | | | | |
sequential payer: | | | | |
Series 2005-C3 Class AJ, 4.843% 7/15/40 | | 6,620,000 | | 6,779,933 |
Series 2005-C7 Class AJ, 5.323% 11/15/40 (j) | | 8,000,000 | | 8,349,352 |
Series 2006-C7 Class AM, 5.378% 11/15/38 | | 2,040,000 | | 2,198,657 |
Series 2004-C7 Class E, 4.918% 10/15/36 | | 5,120,000 | | 5,153,408 |
Series 2005-C1 Class E, 4.924% 2/15/40 | | 4,000,000 | | 4,033,100 |
Series 2006-C4: | | | | |
Class A4, 6.0294% 6/15/38 (j) | | 4,841,683 | | 5,200,742 |
Class AJ, 6.0494% 6/15/38 (j) | | 7,005,000 | | 7,430,533 |
Class AM, 6.0494% 6/15/38 (j) | | 6,700,000 | | 7,234,218 |
LSTAR Commercial Mortgage Trust: | | | | |
Series 2011-1: | | | | |
Class B, 5.3288% 6/25/43 (h)(j) | | 3,548,171 | | 3,555,950 |
Class D, 5.3288% 6/25/43 (h)(j) | | 4,699,000 | | 4,745,468 |
Series 2014-2: | | | | |
Class D, 5.319% 1/20/41 (h)(j) | | 3,000,000 | | 2,849,709 |
Class E, 5.319% 1/20/41 (h)(j) | | 4,800,000 | | 3,957,715 |
Mach One Trust LLC Series 2004-1A Class H, 6.2679% 5/28/40 (h)(j) | | 2,840,000 | | 2,918,100 |
Merrill Lynch Financial Asset, Inc. Series 2005-CA16: | | | | |
Class F, 4.384% 7/12/37 | CAD | 710,000 | | 636,044 |
Class G, 4.384% 7/12/37 | CAD | 355,000 | | 315,222 |
Class H, 4.384% 7/12/37 | CAD | 236,000 | | 207,720 |
Class J, 4.384% 7/12/37 | CAD | 355,000 | | 309,736 |
Class K, 4.384% 7/12/37 | CAD | 355,000 | | 307,048 |
Class L, 4.384% 7/12/37 | CAD | 236,000 | | 202,359 |
Class M, 4.384% 7/12/37 | CAD | 995,000 | | 809,979 |
Merrill Lynch Mortgage Investors Trust Series 1999-C1 Class G, 6.71% 11/15/31 (h) | | 401,475 | | 289,062 |
Commercial Mortgage Securities - continued |
| Principal
Amount (e) | | Value |
Merrill Lynch Mortgage Trust Series 2006-C1 Class AM, 5.8624% 5/12/39 (j) | | $ 1,200,000 | | $ 1,283,813 |
Mezz Capital Commercial Mortgage Trust: | | | | |
sequential payer: | | | | |
Series 2004-C1 Class A, 4.836% 1/15/37 (h) | | 59,543 | | 59,543 |
Series 2004-C2 Class A, 5.318% 10/15/40 (h) | | 4,709,155 | | 4,709,155 |
Series 2004-C1 Class IO, 8.9139% 1/15/37 (h)(j)(k) | | 436,614 | | 13,317 |
Morgan Stanley BAML Trust: | | | | |
Series 2012-C6 Class D, 4.8181% 11/15/45 (h)(j) | | 2,000,000 | | 2,041,958 |
Series 2013-C12 Class D, 4.935% 10/15/46 (h) | | 3,250,000 | | 3,158,717 |
Series 2013-C13 Class D, 5.0592% 11/15/46 (h)(j) | | 3,100,000 | | 3,027,383 |
Series 2013-C7 Class E, 4.4423% 2/15/46 (h)(j) | | 1,000,000 | | 874,622 |
Series 2013-C9 Class D, 4.2984% 5/15/46 (h)(j) | | 5,000,000 | | 4,676,130 |
Morgan Stanley Capital I Trust: | | | | |
sequential payer: | | | | |
Series 2006-HQ10 Class AM, 5.36% 11/12/41 | | 8,200,000 | | 8,866,619 |
Series 2012-C4 Class E, 5.7094% 3/15/45 (h)(j) | | 5,630,000 | | 5,791,632 |
Series 1997-RR Class F, 7.4306% 4/30/39 (h)(j) | | 869,355 | | 919,343 |
Series 1998-CF1 Class G, 7.35% 7/15/32 (h) | | 2,639,941 | | 2,147,478 |
Series 2005-HQ5 Class B, 5.272% 1/14/42 | | 2,000,000 | | 2,034,836 |
Series 2005-HQ6 Class AJ, 5.073% 8/13/42 (j) | | 2,500,000 | | 2,577,703 |
Series 2006-IQ12 Class AMFX, 5.37% 12/15/43 | | 7,500,000 | | 8,090,333 |
Series 2011-C1 Class C, 5.4187% 9/15/47 (h)(j) | | 4,000,000 | | 4,427,369 |
Series 2011-C2: | | | | |
Class D, 5.4817% 6/15/44 (h)(j) | | 4,610,000 | | 4,990,459 |
Class E, 5.4817% 6/15/44 (h)(j) | | 9,600,000 | | 10,101,341 |
Class F, 5.4817% 6/15/44 (h)(j) | | 4,440,000 | | 4,216,291 |
Class XB, 0.534% 6/15/44 (h)(j)(k) | | 63,708,222 | | 1,791,029 |
Series 2011-C3: | | | | |
Class C, 5.3556% 7/15/49 (h)(j) | | 2,000,000 | | 2,184,086 |
Class D, 5.3556% 7/15/49 (h)(j) | | 7,400,000 | | 7,862,056 |
Series 2012-C4 Class D, 5.7094% 3/15/45 (h)(j) | | 6,310,000 | | 6,797,296 |
Providence Place Group Ltd. Partnership Series 2000-C1 Class A2, 7.75% 7/20/28 (h) | | 4,240,047 | | 5,447,612 |
RBSCF Trust Series 2010-MB1 Class D, 4.9832% 4/15/24 (h)(j) | | 9,049,000 | | 9,205,756 |
SCG Trust Series 2013-SRP1 Class D, 3.4955% 11/15/26 (h)(j) | | 1,000,000 | | 972,044 |
TIAA Seasoned Commercial Mortgage Trust sequential payer Series 2007-C4 Class AJ, 5.5645% 8/15/39 (j) | | 2,080,000 | | 2,189,859 |
TimberStar Trust I Series 2006-1 Class F, 7.5296% 10/15/36 (h) | | 10,630,000 | | 11,253,120 |
Commercial Mortgage Securities - continued |
| Principal
Amount (e) | | Value |
UBS Commercial Mortgage Trust: | | | | |
Series 2007-FL1 Class F, 0.727% 7/15/24 (h)(j) | | $ 1,200,000 | | $ 1,199,038 |
Series 2012-C1 Class D, 5.7194% 5/10/45 (h)(j) | | 2,000,000 | | 2,081,394 |
UBS-Barclays Commercial Mortgage Trust sequential payer Series 2012-C3 Class A1, 0.726% 8/10/49 | | 2,643,138 | | 2,622,908 |
UBS-Citigroup Commercial Mortgage Trust Series 2011-C1 Class B, 6.0705% 1/10/45 (h)(j) | | 3,000,000 | | 3,477,570 |
Vornado DP LLC Series 2010-VNO Class D, 6.3555% 9/13/28 (h) | | 2,540,000 | | 2,932,115 |
Wachovia Bank Commercial Mortgage Trust: | | | | |
Series 2004-C10 Class E, 4.931% 2/15/41 | | 1,716,408 | | 1,717,802 |
Series 2004-C11: | | | | |
Class D, 5.5428% 1/15/41 (j) | | 5,177,000 | | 5,474,186 |
Class E, 5.5928% 1/15/41 (j) | | 3,785,000 | | 3,996,351 |
Series 2004-C12 Class D, 5.6311% 7/15/41 (j) | | 1,364,882 | | 1,368,222 |
Wells Fargo Commercial Mortgage Trust Series 2012-LC5 Class D, 4.9376% 10/15/45 (h)(j) | | 9,999,000 | | 9,932,877 |
WF-RBS Commercial Mortgage Trust: | | | | |
Series 2011-C3: | | | | |
Class C, 5.335% 3/15/44 (h) | | 4,900,000 | | 5,374,271 |
Class D, 5.723% 3/15/44 (h)(j) | | 1,000,000 | | 1,060,813 |
Class E, 5% 3/15/44 (h) | | 3,000,000 | | 2,799,111 |
Series 2011-C5 Class F, 5.25% 11/15/44 (h)(j) | | 3,000,000 | | 2,792,028 |
Series 2012-C10 Class E, 4.6077% 12/15/45 (h)(j) | | 4,090,000 | | 3,546,050 |
Series 2012-C7: | | | | |
Class D, 5.0019% 6/15/45 (h)(j) | | 2,380,000 | | 2,477,927 |
Class F, 4.5% 6/15/45 (h) | | 2,000,000 | | 1,750,684 |
Series 2013-C11: | | | | |
Class D, 4.3224% 3/15/45 (h)(j) | | 5,830,000 | | 5,505,759 |
Class E, 4.3224% 3/15/45 (h)(j) | | 4,780,000 | | 4,065,256 |
Series 2013-C13 Class D, 4.2791% 5/15/45 (h)(j) | | 4,000,000 | | 3,722,676 |
TOTAL COMMERCIAL MORTGAGE SECURITIES (Cost $491,817,896) |
543,318,426
|
Bank Loan Obligations - 7.8% |
|
CONSUMER DISCRETIONARY - 2.8% |
Hotels, Restaurants & Leisure - 2.4% |
BRE Select Hotels Corp. 5.892% 5/9/18 (j) | | 12,102,193 | | 12,102,193 |
Caesars Entertainment Resort Properties LLC Tranche B 1LN, term loan 7% 10/11/20 (j) | | 11,442,500 | | 11,413,894 |
Bank Loan Obligations - continued |
| Principal
Amount (e) | | Value |
CONSUMER DISCRETIONARY - continued |
Hotels, Restaurants & Leisure - continued |
Caesars Growth Properties Holdings, LLC Tranche 1LN, term loan 6.25% 5/8/21 (j) | | $ 9,290,000 | | $ 9,290,000 |
Cedar Fair LP Tranche B, term loan 3.25% 3/6/20 (j) | | 2,760,267 | | 2,763,718 |
CityCenter Holdings LLC Tranche B, term loan 4.25% 10/16/20 (j) | | 1,632,130 | | 1,628,050 |
Cooper Hotel Group 12% 11/6/17 | | 13,277,241 | | 13,941,103 |
Four Seasons Holdings, Inc. Tranche 2LN, term loan 6.25% 12/27/20 (j) | | 510,000 | | 512,550 |
Hilton Worldwide Finance, LLC Tranche B, term loan 3.5% 10/25/20 (j) | | 28,862,492 | | 28,718,179 |
La Quinta Intermediate Holdings LLC Tranche B LN, Tranche B, term loan 4% 4/14/21 (j) | | 8,181,000 | | 8,099,190 |
Playa Resorts Holding BV Tranche B, term loan 4% 8/9/19 (j) | | 6,982,412 | | 7,008,596 |
Ryman Hospitality Properties, Inc. Tranche B, term loan 3.75% 1/15/21 (j) | | 2,290,000 | | 2,301,450 |
| | 97,778,923 |
Media - 0.2% |
CBS Outdoor Americas Capital LLC/CBS Outdoor Americas Capital Corp. Tranche B, term loan 3% 1/31/21 (j) | | 8,295,000 | | 8,232,788 |
Multiline Retail - 0.1% |
JC Penney Corp., Inc. Tranche B, term loan 6% 5/22/18 (j) | | 3,499,650 | | 3,531,532 |
Specialty Retail - 0.1% |
The Pep Boys - Manny, Moe & Jack Tranche B, term loan 4.25% 10/11/18 (j) | | 5,274,675 | | 5,281,268 |
TOTAL CONSUMER DISCRETIONARY | | 114,824,511 |
CONSUMER STAPLES - 0.1% |
Food & Staples Retailing - 0.1% |
Albertson's LLC Tranche B 2LN, term loan 4.75% 3/21/19 (j) | | 5,123,347 | | 5,116,943 |
ENERGY - 0.4% |
Oil, Gas & Consumable Fuels - 0.4% |
Panda Sherman Power, LLC term loan 9% 9/14/18 (j) | | 7,200,000 | | 7,344,000 |
Panda Temple Power, LLC term loan 7.25% 4/3/19 (j) | | 8,580,000 | | 8,794,500 |
| | 16,138,500 |
Bank Loan Obligations - continued |
| Principal
Amount (e) | | Value |
FINANCIALS - 2.3% |
Diversified Financial Services - 0.9% |
Blackstone 9.98% 10/1/17 | | $ 17,203,421 | | $ 17,547,489 |
Calpine Construction Finance Co. LP Tranche B 2LN, term loan 3.25% 1/31/22 (j) | | 7,380,609 | | 7,256,098 |
Pilot Travel Centers LLC: | | | | |
Tranche B 2LN, term loan 4.25% 8/7/19 (j) | | 7,117,435 | | 7,144,481 |
Tranche B, term loan 3.75% 3/30/18 (j) | | 6,566,411 | | 6,549,995 |
| | 38,498,063 |
Real Estate Investment Trusts - 0.2% |
Starwood Property Trust, Inc. Tranche B, term loan 3.5% 4/17/20 (j) | | 8,933,487 | | 8,899,986 |
Real Estate Management & Development - 1.1% |
CBRE Group, Inc. Tranche B, term loan 2.9015% 3/28/21 (j) | | 4,468,437 | | 4,446,095 |
CityCenter 8.74% 7/10/15 (j) | | 3,307,347 | | 3,307,347 |
Realogy Corp. Credit-Linked Deposit 4.4463% 10/10/16 (j) | | 647,237 | | 646,428 |
Realogy Group LLC Tranche B, term loan 3.75% 3/5/20 (j) | | 38,799,180 | | 38,411,188 |
| | 46,811,058 |
Thrifts & Mortgage Finance - 0.1% |
Ocwen Loan Servicing, LLC Tranche B, term loan 5% 2/15/18 (j) | | 1,942,912 | | 1,942,912 |
TOTAL FINANCIALS | | 96,152,019 |
HEALTH CARE - 0.5% |
Health Care Providers & Services - 0.5% |
Community Health Systems, Inc.: | | | | |
Tranche D, term loan 4.25% 1/27/21 (j) | | 2,100,608 | | 2,105,860 |
Tranche E, term loan 3.4776% 1/25/17 (j) | | 788,123 | | 789,108 |
ESH Hospitality, Inc. Tranche B, term loan 5% 6/24/19 (j) | | 11,310,000 | | 11,437,238 |
Skilled Healthcare Group, Inc. term loan 7% 4/9/16 (j) | | 7,040,067 | | 7,022,467 |
| | 21,354,673 |
INDUSTRIALS - 0.4% |
Commercial Services & Supplies - 0.1% |
Lineage Logistics Holdings, LLC. Tranche B, term loan 4.5% 4/7/21 (j) | | 3,990,000 | | 3,950,100 |
Bank Loan Obligations - continued |
| Principal
Amount (e) | | Value |
INDUSTRIALS - continued |
Construction & Engineering - 0.3% |
Drumm Investors LLC Tranche B, term loan 6.75% 5/4/18 (j) | | $ 11,686,667 | | $ 11,672,059 |
TOTAL INDUSTRIALS | | 15,622,159 |
TELECOMMUNICATION SERVICES - 0.6% |
Wireless Telecommunication Services - 0.6% |
Crown Castle Operating Co.: | | | | |
Tranche A, term loan 1.905% 1/31/19 (j) | | 4,553,273 | | 4,519,123 |
Tranche B 2LN, term loan 3% 1/31/21 (j) | | 9,121,019 | | 9,121,019 |
SBA Senior Finance II, LLC term loan 3.25% 3/24/21 (j) | | 11,565,000 | | 11,420,438 |
| | 25,060,580 |
UTILITIES - 0.7% |
Electric Utilities - 0.4% |
Bayonne Energy Center, LLC Tranche B, term loan 6/30/21 (l) | | 1,555,000 | | 1,564,719 |
EquiPower Resources Holdings LLC: | | | | |
Tranche B 1LN, term loan 4.25% 12/21/18 (j) | | 4,974,619 | | 4,987,056 |
Tranche C, term loan 4.25% 12/31/19 (j) | | 1,148,814 | | 1,151,686 |
Essential Power LLC Tranche B, term loan 4.75% 8/8/19 (j) | | 3,397,816 | | 3,414,806 |
La Frontera Generation, LLC Tranche B, term loan 4.5% 9/30/20 (j) | | 6,634,947 | | 6,660,160 |
| | 17,778,427 |
Independent Power Producers & Energy Traders - 0.3% |
Calpine Corp. Tranche B 4LN, term loan 4% 10/31/20 (j) | | 1,990,000 | | 1,990,000 |
Tempus Public Foundation Generation Holdings LLC Tranche B, term loan 4.75% 12/31/17 (j) | | 9,904,975 | | 9,533,538 |
| | 11,523,538 |
TOTAL UTILITIES | | 29,301,965 |
TOTAL BANK LOAN OBLIGATIONS (Cost $323,405,617) |
323,571,350
|
Preferred Securities - 0.0% |
| Principal
Amount (e) | | Value |
FINANCIALS - 0.0% |
Diversified Financial Services - 0.0% |
Crest Clarendon Street 2002-1 Ltd. Series 2002-1A Class PS, 12/28/35 (h) | | $ 500,000 | | $ 25,000 |
Crest Dartmouth Street 2003 1 Ltd. Series 2003-1A Class PS, 6/28/38 (h) | | 1,220,000 | | 905,362 |
| | 930,362 |
TOTAL PREFERRED SECURITIES (Cost $1,297,346) |
930,362
|
Money Market Funds - 7.2% |
| Shares | | |
Fidelity Cash Central Fund, 0.11% (b) | 276,650,517 | | 276,650,517 |
Fidelity Securities Lending Cash Central Fund, 0.11% (b)(c) | 25,440,125 | | 25,440,125 |
TOTAL MONEY MARKET FUNDS (Cost $302,090,642) |
302,090,642
|
TOTAL INVESTMENT PORTFOLIO - 100.4% (Cost $3,919,805,033) | | 4,188,693,860 |
NET OTHER ASSETS (LIABILITIES) - (0.4)% | | (14,717,180) |
NET ASSETS - 100% | $ 4,173,976,680 |
Currency Abbreviations |
CAD | - | Canadian dollar |
Legend |
(a) Non-income producing |
(b) Affiliated fund that is generally available only to investment companies and other accounts managed by Fidelity Investments. The rate quoted is the annualized seven-day yield of the fund at period end. A complete unaudited listing of the fund's holdings as of its most recent quarter end is available upon request. In addition, each Fidelity Central Fund's financial statements, which are not covered by the Fund's Report of Independent Registered Public Accounting Firm, are available on the SEC's website or upon request. |
(c) Investment made with cash collateral received from securities on loan. |
(d) Non-income producing - Security is in default. |
(e) Amount is stated in United States dollars unless otherwise noted. |
(f) Security or a portion of the security is on loan at period end. |
(g) Affiliated company |
(h) Security exempt from registration under Rule 144A of the Securities Act of 1933. These securities may be resold in transactions exempt from registration, normally to qualified institutional buyers. At the end of the period, the value of these securities amounted to $610,513,249 or 14.6% of net assets. |
(i) Security or a portion of the security purchased on a delayed delivery or when-issued basis. |
(j) Coupon rates for floating and adjustable rate securities reflect the rates in effect at period end. |
(k) Security represents right to receive monthly interest payments on an underlying pool of mortgages or assets. Principal shown is the outstanding par amount of the pool as of the end of the period. |
(l) The coupon rate will be determined upon settlement of the loan after period end. |
(m) Restricted securities - Investment in securities not registered under the Securities Act of 1933 (excluding 144A issues). At the end of the period, the value of restricted securities (excluding 144A issues) amounted to $8,596,772 or 0.2% of net assets. |
Additional information on each restricted holding is as follows: |
Security | Acquisition Date | Acquisition Cost |
ACGS Series 2004-1 Class P, 7.4605% 8/1/19 | 2/17/11 | $ 1,556,705 |
Fannie Mae REMIC Trust Series 2001-W3 subordinate REMIC pass thru certificates, Class B3, 7% 9/25/41 | 5/21/03 | $ 98,189 |
Fannie Mae REMIC Trust Series 2003-W1 subordinate REMIC pass thru certificates, Class B3, 4.5664% 12/25/42 | 3/25/03 | $ 109,726 |
GSR Mortgage Loan Trust Series 2005-HE3 Class B3, 3.905% 6/25/35 | 6/3/05 | $ 187,271 |
Stanley Martin Communities LLC Class B | 8/3/05 - 3/1/07 | $ 4,244,574 |
Affiliated Central Funds |
Information regarding fiscal year to date income earned by the Fund from investments in Fidelity Central Funds is as follows: |
Fund | Income earned |
Fidelity Cash Central Fund | $ 269,973 |
Fidelity Securities Lending Cash Central Fund | 69,287 |
Total | $ 339,260 |
Other Affiliated Issuers |
An affiliated company is a company in which the Fund has ownership of at least 5% of the voting securities. Fiscal year to date transactions with companies which are or were affiliates are as follows: |
Affiliate | Value,
beginning of
period | Purchases | Sales
Proceeds | Dividend
Income | Value,
end of
period |
Acadia Realty Trust (SBI) | $ 67,194,255 | $ 23,354,610 | $ - | $ 2,449,846 | $ 98,809,206 |
Arbor Realty Trust, Inc. | 21,107,288 | 1,885,885 | - | 1,477,398 | 21,697,653 |
Arbor Realty Trust, Inc. 7.375% | - | 8,259,665 | - | 154,098 | 8,162,637 |
Arbor Realty Trust, Inc. Series A, 8.25% | 4,748,025 | - | - | 389,996 | 4,727,225 |
Arbor Realty Trust, Inc. Series B, 7.75% | 5,901,600 | - | - | 493,422 | 5,882,400 |
Arbor Realty Trust, Inc. Series C, 8.50% | - | 2,500,000 | - | 55,490 | 2,525,000 |
Terreno Realty Corp. | 22,091,704 | 4,979,683 | - | 529,220 | - |
Terreno Realty Corp. Series A, 7.75% | 5,523,887 | - | - | 414,024 | - |
Total | $ 126,566,759 | $ 40,979,843 | $ - | $ 5,963,494 | $ 141,804,121 |
Other Information |
The following is a summary of the inputs used, as of July 31, 2014, involving the Fund's assets and liabilities carried at fair value. The inputs or methodology used for valuing securities may not be an indication of the risk associated with investing in those securities. For more information on valuation inputs, and their aggregation into the levels used in the tables below, please refer to the Investment Valuation section in the accompanying Notes to Financial Statements. |
Valuation Inputs at Reporting Date: |
Description | Total | Level 1 | Level 2 | Level 3 |
Investments in Securities: | | | | |
Equities: | | | | |
Consumer Discretionary | $ 10,655,683 | $ 3,727,392 | $ - | $ 6,928,291 |
Financials | 2,025,032,649 | 1,995,068,514 | 27,354,361 | 2,609,774 |
Materials | 10,541,237 | 10,541,237 | - | - |
Corporate Bonds | 871,661,140 | - | 871,160,983 | 500,157 |
Asset-Backed Securities | 90,148,525 | - | 81,964,524 | 8,184,001 |
Collateralized Mortgage Obligations | 10,743,846 | - | 10,017,369 | 726,477 |
Commercial Mortgage Securities | 543,318,426 | - | 532,005,572 | 11,312,854 |
Bank Loan Obligations | 323,571,350 | - | 276,160,668 | 47,410,682 |
Preferred Securities | 930,362 | - | - | 930,362 |
Money Market Funds | 302,090,642 | 302,090,642 | - | - |
Total Investments in Securities: | $ 4,188,693,860 | $ 2,311,427,785 | $ 1,798,663,477 | $ 78,602,598 |
Valuation Inputs at Reporting Date: |
The following is a reconciliation of Investments in Securities for which Level 3 inputs were used in determining value: |
Investments in Securities: | |
Bank Loan Obligations | |
Beginning Balance | $ 105,573,756 |
Net Realized Gain (Loss) on Investment Securities | 289,125 |
Net Unrealized Gain (Loss) on Investment Securities | (866,510) |
Cost of Purchases | - |
Proceeds of Sales | (58,246,664) |
Amortization/Accretion | 140,775 |
Transfers into Level 3 | 520,200 |
Transfers out of Level 3 | - |
Ending Balance | $ 47,410,682 |
The change in unrealized gain (loss) for the period attributable to Level 3 securities held at July 31, 2014 | $ (413,512) |
Other Investments in Securities | |
Beginning Balance | $ 53,636,499 |
Net Realized Gain (Loss) on Investment Securities | (4,200,658) |
Net Unrealized Gain (Loss) on Investment Securities | 9,034,288 |
Cost of Purchases | 169,932 |
Proceeds of Sales | (23,014,379) |
Amortization/Accretion | 1,379,987 |
Transfers into Level 3 | - |
Transfers out of Level 3 | (5,813,753) |
Ending Balance | $ 31,191,916 |
The change in unrealized gain (loss) for the period attributable to Level 3 securities held at July 31, 2014 | $ 4,647,489 |
The information used in the above reconciliations represents fiscal year to date activity for any Investments in Securities identified as using Level 3 inputs at either the beginning or the end of the current fiscal period. Transfers in or out of Level 3 represent the beginning value of any Security or Instrument where a change in the pricing level occurred from the beginning to the end of the period. The cost of purchases and the proceeds of sales may include securities received or delivered through corporate actions or exchanges. Realized and unrealized gains (losses) disclosed in the reconciliations are included in Net Gain (Loss) on the Fund's Statement of Operations. |
Other Information |
The composition of credit quality ratings as a percentage of net assets is as follows (Unaudited): |
U.S. Government and U.S. Government Agency Obligations | 0.4% |
AAA,AA,A | 4.6% |
BBB | 11.3% |
BB | 9.1% |
B | 11.4% |
CCC,CC,C | 1.0% |
D | 0.0% |
Not Rated | 6.4% |
Equities | 49.0% |
Short-Term Investments and Net Other Assets | 6.8% |
| 100.0% |
We have used ratings from Moody's Investors Service, Inc. Where Moody's® ratings are not available, we have used S&P® ratings. All ratings are as of the date indicated and do not reflect subsequent changes. |
See accompanying notes which are an integral part of the financial statements.
Annual Report
Statement of Assets and Liabilities
| July 31, 2014 |
| | |
Assets | | |
Investment in securities, at value (including securities loaned of $24,482,448) - See accompanying schedule: Unaffiliated issuers (cost $3,496,917,698) | $ 3,744,799,097 | |
Fidelity Central Funds (cost $302,090,642) | 302,090,642 | |
Other affiliated issuers (cost $120,796,693) | 141,804,121 | |
Total Investments (cost $3,919,805,033) | | $ 4,188,693,860 |
Cash | | 2,277,247 |
Receivable for investments sold | | 10,882,971 |
Receivable for fund shares sold | | 6,965,247 |
Dividends receivable | | 2,319,908 |
Interest receivable | | 17,945,180 |
Distributions receivable from Fidelity Central Funds | | 33,222 |
Receivable from investment adviser for expense reductions | | 931 |
Other receivables | | 14,103 |
Total assets | | 4,229,132,669 |
| | |
Liabilities | | |
Payable for investments purchased
Regular delivery | $ 19,236,871 | |
Delayed delivery | 2,505,000 | |
Payable for fund shares redeemed | 4,769,953 | |
Accrued management fee | 1,934,696 | |
Distribution and service plan fees payable | 305,492 | |
Other affiliated payables | 869,606 | |
Other payables and accrued expenses | 94,246 | |
Collateral on securities loaned, at value | 25,440,125 | |
Total liabilities | | 55,155,989 |
| | |
Net Assets | | $ 4,173,976,680 |
Net Assets consist of: | | |
Paid in capital | | $ 3,809,242,280 |
Undistributed net investment income | | 34,654,174 |
Accumulated undistributed net realized gain (loss) on investments and foreign currency transactions | | 61,167,863 |
Net unrealized appreciation (depreciation) on investments and assets and liabilities in foreign currencies | | 268,912,363 |
Net Assets | | $ 4,173,976,680 |
See accompanying notes which are an integral part of the financial statements.
Annual Report
Statement of Assets and Liabilities - continued
| July 31, 2014 |
| | |
Calculation of Maximum Offering Price Class A:
Net Asset Value and redemption price per share ($442,271,076 ÷ 37,302,014 shares) | | $ 11.86 |
| | |
Maximum offering price per share (100/96.00 of $11.86) | | $ 12.35 |
Class T:
Net Asset Value and redemption price per share ($48,163,837 ÷ 4,060,118 shares) | | $ 11.86 |
| | |
Maximum offering price per share (100/96.00 of $11.86) | | $ 12.35 |
Class C:
Net Asset Value and offering price per share ($246,305,622 ÷ 20,927,526 shares)A | | $ 11.77 |
| | |
Real Estate Income:
Net Asset Value, offering price and redemption price per share ($2,627,381,994 ÷ 220,647,573 shares) | | $ 11.91 |
| | |
Institutional Class:
Net Asset Value, offering price and redemption price per share ($809,854,151 ÷ 68,165,791 shares) | | $ 11.88 |
A Redemption price per share is equal to net asset value less any applicable contingent deferred sales charge.
See accompanying notes which are an integral part of the financial statements.
Annual Report
Financial Statements - continued
Statement of Operations
| Year ended July 31, 2014 |
| | |
Investment Income | | |
Dividends (including $5,963,494 earned from other affiliated issuers) | | $ 90,314,113 |
Interest | | 114,777,571 |
Income from Fidelity Central Funds | | 339,260 |
Total income | | 205,430,944 |
| | |
Expenses | | |
Management fee | $ 21,222,992 | |
Transfer agent fees | 8,548,801 | |
Distribution and service plan fees | 3,173,091 | |
Accounting and security lending fees | 1,324,787 | |
Custodian fees and expenses | 58,383 | |
Independent trustees' compensation | 15,901 | |
Registration fees | 199,090 | |
Audit | 172,246 | |
Legal | 12,720 | |
Miscellaneous | 35,095 | |
Total expenses before reductions | 34,763,106 | |
Expense reductions | (73,686) | 34,689,420 |
Net investment income (loss) | | 170,741,524 |
Realized and Unrealized Gain (Loss) Net realized gain (loss) on: | | |
Investment securities: | | |
Unaffiliated issuers | 105,441,630 | |
Other affiliated issuers | 442,084 | |
Foreign currency transactions | 662 | |
Total net realized gain (loss) | | 105,884,376 |
Change in net unrealized appreciation (depreciation) on: Investment securities | 30,350,617 | |
Assets and liabilities in foreign currencies | (1,671) | |
Total change in net unrealized appreciation (depreciation) | | 30,348,946 |
Net gain (loss) | | 136,233,322 |
Net increase (decrease) in net assets resulting from operations | | $ 306,974,846 |
See accompanying notes which are an integral part of the financial statements.
Annual Report
Statement of Changes in Net Assets
| Year ended
July 31,
2014 | Year ended
July 31,
2013 |
Increase (Decrease) in Net Assets | | |
Operations | | |
Net investment income (loss) | $ 170,741,524 | $ 172,485,619 |
Net realized gain (loss) | 105,884,376 | 73,494,885 |
Change in net unrealized appreciation (depreciation) | 30,348,946 | 61,789,333 |
Net increase (decrease) in net assets resulting
from operations | 306,974,846 | 307,769,837 |
Distributions to shareholders from net investment income | (172,155,251) | (159,910,438) |
Distributions to shareholders from net realized gain | (78,297,244) | (51,534,162) |
Total distributions | (250,452,495) | (211,444,600) |
Share transactions - net increase (decrease) | (6,051,637) | 1,340,100,515 |
Redemption fees | 438,384 | 782,946 |
Total increase (decrease) in net assets | 50,909,098 | 1,437,208,698 |
| | |
Net Assets | | |
Beginning of period | 4,123,067,582 | 2,685,858,884 |
End of period (including undistributed net investment income of $34,654,174 and undistributed net investment income of $39,267,501, respectively) | $ 4,173,976,680 | $ 4,123,067,582 |
See accompanying notes which are an integral part of the financial statements.
Annual Report
Financial Highlights - Class A
Years ended July 31, | 2014 | 2013 | 2012 | 2011 | 2010 H |
Selected Per-Share Data | | | | | |
Net asset value, beginning of period | $ 11.67 | $ 11.26 | $ 10.73 | $ 9.94 | $ 9.95 |
Income from Investment Operations | | | | | |
Net investment income (loss) E | .49 | .54 | .52 | .53 | .18 |
Net realized and unrealized gain (loss) | .44 | .60 | .61 | .76 | (.04) |
Total from investment operations | .93 | 1.14 | 1.13 | 1.29 | .14 |
Distributions from net investment income | (.50) | (.53) | (.51) | (.50) | (.15) |
Distributions from net realized gain | (.24) | (.20) | (.10) | - | - |
Total distributions | (.74) | (.73) | (.60) K | (.50) | (.15) |
Redemption fees added to paid in capital E, J | - | - | - | - | - |
Net asset value, end of period | $ 11.86 | $ 11.67 | $ 11.26 | $ 10.73 | $ 9.94 |
Total ReturnB, C, D | 8.49% | 10.45% | 11.24% | 13.27% | 1.46% |
Ratios to Average Net Assets F, I | | | | | |
Expenses before reductions | 1.06% | 1.08% | 1.12% | 1.13% | 1.09%A |
Expenses net of fee waivers, if any | 1.05% | 1.08% | 1.12% | 1.13% | 1.09%A |
Expenses net of all reductions | 1.05% | 1.07% | 1.11% | 1.12% | 1.09%A |
Net investment income (loss) | 4.28% | 4.62% | 4.89% | 5.00% | 6.23%A |
Supplemental Data | | | | | |
Net assets, end of period (000 omitted) | $ 442,271 | $ 378,269 | $ 137,352 | $ 60,283 | $ 3,830 |
Portfolio turnover rateG | 29% | 26% | 27% | 25% | 28% |
A Annualized
B Total returns for periods of less than one year are not annualized.
C Total returns would have been lower if certain expenses had not been reduced during the applicable periods shown.
D Total returns do not include the effect of the sales charges.
E Calculated based on average shares outstanding during the period.
F Fees and expenses of any underlying Fidelity Central Funds are not included in the Fund's expense ratio. The Fund indirectly bears its proportionate share of the expenses of any underlying Fidelity Central Funds.
G Amount does not include the portfolio activity of any underlying Fidelity Central Funds.
H For the period April 14, 2010 (commencement of sale of shares) to July 31, 2010.
I Expense ratios reflect operating expenses of the class. Expenses before reductions do not reflect amounts reimbursed by the investment adviser or reductions from brokerage service arrangements or reductions from other expense offset arrangements and do not represent the amount paid by the class during periods when reimbursements or reductions occur. Expense ratios before reductions for start-up periods may not be representative of longer-term operating periods. Expenses net of fee waivers reflect expenses after reimbursement by the investment adviser but prior to reductions from brokerage service arrangements or other expense offset arrangements. Expenses net of all reductions represent the net expenses paid by the class.
J Amount represents less than $.01 per share.
K Total distributions of $.60 per share is comprised of distributions from net investment income of $.505 and distributions from net realized gain of $.097 per share.
See accompanying notes which are an integral part of the financial statements.
Annual Report
Financial Highlights - Class T
Years ended July 31, | 2014 | 2013 | 2012 | 2011 | 2010 H |
Selected Per-Share Data | | | | | |
Net asset value, beginning of period | $ 11.67 | $ 11.26 | $ 10.72 | $ 9.94 | $ 9.95 |
Income from Investment Operations | | | | | |
Net investment income (loss) E | .49 | .54 | .52 | .52 | .17 |
Net realized and unrealized gain (loss) | .43 | .60 | .62 | .76 | (.03) |
Total from investment operations | .92 | 1.14 | 1.14 | 1.28 | .14 |
Distributions from net investment income | (.50) | (.53) | (.50) | (.50) | (.15) |
Distributions from net realized gain | (.24) | (.20) | (.10) | - | - |
Total distributions | (.73)K | (.73) | (.60) | (.50) | (.15) |
Redemption fees added to paid in capital E, J | - | - | - | - | - |
Net asset value, end of period | $ 11.86 | $ 11.67 | $ 11.26 | $ 10.72 | $ 9.94 |
Total ReturnB, C, D | 8.44% | 10.42% | 11.33% | 13.11% | 1.45% |
Ratios to Average Net Assets F, I | | | | | |
Expenses before reductions | 1.08% | 1.08% | 1.11% | 1.16% | 1.17%A |
Expenses net of fee waivers, if any | 1.08% | 1.08% | 1.11% | 1.16% | 1.17%A |
Expenses net of all reductions | 1.07% | 1.08% | 1.11% | 1.16% | 1.17%A |
Net investment income (loss) | 4.26% | 4.61% | 4.90% | 4.96% | 5.92%A |
Supplemental Data | | | | | |
Net assets, end of period (000 omitted) | $ 48,164 | $ 46,198 | $ 26,143 | $ 7,626 | $ 862 |
Portfolio turnover rateG | 29% | 26% | 27% | 25% | 28% |
A Annualized
B Total returns for periods of less than one year are not annualized.
C Total returns would have been lower if certain expenses had not been reduced during the applicable periods shown.
D Total returns do not include the effect of the sales charges.
E Calculated based on average shares outstanding during the period.
F Fees and expenses of any underlying Fidelity Central Funds are not included in the Fund's expense ratio. The Fund indirectly bears its proportionate share of the expenses of any underlying Fidelity Central Funds.
G Amount does not include the portfolio activity of any underlying Fidelity Central Funds.
H For the period April 14, 2010 (commencement of sale of shares) to July 31, 2010.
I Expense ratios reflect operating expenses of the class. Expenses before reductions do not reflect amounts reimbursed by the investment adviser or reductions from brokerage service arrangements or reductions from other expense offset arrangements and do not represent the amount paid by the class during periods when reimbursements or reductions occur. Expense ratios before reductions for start-up periods may not be representative of longer-term operating periods. Expenses net of fee waivers reflect expenses after reimbursement by the investment adviser but prior to reductions from brokerage service arrangements or other expense offset arrangements. Expenses net of all reductions represent the net expenses paid by the class.
J Amount represents less than $.01 per share.
K Total distributions of $.73 per share is comprised of distributions from net investment income of $.496 and distributions from net realized gain of $.236 per share.
See accompanying notes which are an integral part of the financial statements.
Annual Report
Financial Highlights - Class C
Years ended July 31, | 2014 | 2013 | 2012 | 2011 | 2010 H |
Selected Per-Share Data | | | | | |
Net asset value, beginning of period | $ 11.59 | $ 11.20 | $ 10.67 | $ 9.93 | $ 9.95 |
Income from Investment Operations | | | | | |
Net investment income (loss) E | .40 | .45 | .44 | .45 | .15 |
Net realized and unrealized gain (loss) | .43 | .60 | .62 | .74 | (.03) |
Total from investment operations | .83 | 1.05 | 1.06 | 1.19 | .12 |
Distributions from net investment income | (.42) | (.46) | (.43) | (.45) | (.14) |
Distributions from net realized gain | (.24) | (.20) | (.10) | - | - |
Total distributions | (.65) K | (.66) | (.53) | (.45) | (.14) |
Redemption fees added to paid in capital E, J | - | - | - | - | - |
Net asset value, end of period | $ 11.77 | $ 11.59 | $ 11.20 | $ 10.67 | $ 9.93 |
Total ReturnB, C, D | 7.66% | 9.66% | 10.49% | 12.25% | 1.29% |
Ratios to Average Net Assets F, I | | | | | |
Expenses before reductions | 1.79% | 1.81% | 1.87% | 1.89% | 1.86%A |
Expenses net of fee waivers, if any | 1.79% | 1.81% | 1.87% | 1.89% | 1.86%A |
Expenses net of all reductions | 1.79% | 1.81% | 1.87% | 1.89% | 1.86%A |
Net investment income (loss) | 3.54% | 3.88% | 4.14% | 4.23% | 5.21%A |
Supplemental Data | | | | | |
Net assets, end of period (000 omitted) | $ 246,306 | $ 204,012 | $ 52,780 | $ 21,555 | $ 836 |
Portfolio turnover rateG | 29% | 26% | 27% | 25% | 28% |
A Annualized
B Total returns for periods of less than one year are not annualized.
C Total returns would have been lower if certain expenses had not been reduced during the applicable periods shown.
D Total returns do not include the effect of the contingent deferred sales charge.
E Calculated based on average shares outstanding during the period.
F Fees and expenses of any underlying Fidelity Central Funds are not included in the Fund's expense ratio. The Fund indirectly bears its proportionate share of the expenses of any underlying Fidelity Central Funds.
G Amount does not include the portfolio activity of any underlying Fidelity Central Funds.
H For the period April 14, 2010 (commencement of sale of shares) to July 31, 2010.
I Expense ratios reflect operating expenses of the class. Expenses before reductions do not reflect amounts reimbursed by the investment adviser or reductions from brokerage service arrangements or reductions from other expense offset arrangements and do not represent the amount paid by the class during periods when reimbursements or reductions occur. Expense ratios before reductions for start-up periods may not be representative of longer-term operating periods. Expenses net of fee waivers reflect expenses after reimbursement by the investment adviser but prior to reductions from brokerage service arrangements or other expense offset arrangements. Expenses net of all reductions represent the net expenses paid by the class.
J Amount represents less than $.01 per share.
K Total distributions of $.65 per share is comprised of distributions from net investment income of $.417 and distributions from net realized gain of $.236 per share.
See accompanying notes which are an integral part of the financial statements.
Annual Report
Financial Highlights - Real Estate Income
Years ended July 31, | 2014 | 2013 | 2012 | 2011 | 2010 |
Selected Per-Share Data | | | | | |
Net asset value, beginning of period | $ 11.71 | $ 11.29 | $ 10.75 | $ 9.95 | $ 8.21 |
Income from Investment Operations | | | | | |
Net investment income (loss) B | .52 | .57 | .54 | .55 | .53 |
Net realized and unrealized gain (loss) | .44 | .60 | .62 | .76 | 1.73 |
Total from investment operations | .96 | 1.17 | 1.16 | 1.31 | 2.26 |
Distributions from net investment income | (.53) | (.55) | (.52) | (.51) | (.52) |
Distributions from net realized gain | (.24) | (.20) | (.10) | - | - |
Total distributions | (.76) G | (.75) | (.62) | (.51) | (.52) |
Redemption fees added to paid in capital B, F | - | - | - | - | - |
Net asset value, end of period | $ 11.91 | $ 11.71 | $ 11.29 | $ 10.75 | $ 9.95 |
Total ReturnA | 8.78% | 10.71% | 11.50% | 13.41% | 28.29% |
Ratios to Average Net Assets C, E | | | | | |
Expenses before reductions | .83% | .84% | .90% | .92% | .97% |
Expenses net of fee waivers, if any | .83% | .84% | .89% | .92% | .96% |
Expenses net of all reductions | .83% | .84% | .89% | .92% | .96% |
Net investment income (loss) | 4.50% | 4.85% | 5.12% | 5.21% | 5.60% |
Supplemental Data | | | | | |
Net assets, end of period (000 omitted) | $ 2,627,382 | $ 2,884,545 | $ 2,252,149 | $ 1,660,063 | $ 1,030,393 |
Portfolio turnover rateD | 29% | 26% | 27% | 25% | 28% |
A Total returns would have been lower if certain expenses had not been reduced during the applicable periods shown.
B Calculated based on average shares outstanding during the period.
C Fees and expenses of any underlying Fidelity Central Funds are not included in the Fund's expense ratio. The Fund indirectly bears its proportionate share of the expenses of any underlying Fidelity Central Funds.
D Amount does not include the portfolio activity of any underlying Fidelity Central Funds.
E Expense ratios reflect operating expenses of the class. Expenses before reductions do not reflect amounts reimbursed by the investment adviser or reductions from brokerage service arrangements or reductions from other expense offset arrangements and do not represent the amount paid by the class during periods when reimbursements or reductions occur. Expenses net of fee waivers reflect expenses after reimbursement by the investment adviser but prior to reductions from brokerage service arrangements or other expense offset arrangements. Expenses net of all reductions represent the net expenses paid by the class.
F Amount represents less than $.01 per share.
G Total distributions of $.76 per share is comprised of distributions from net investment income of $.525 and distributions from net realized gain of $.236 per share.
See accompanying notes which are an integral part of the financial statements.
Annual Report
Financial Highlights - Institutional Class
Years ended July 31, | 2014 | 2013 | 2012 | 2011 | 2010 G |
Selected Per-Share Data | | | | | |
Net asset value, beginning of period | $ 11.69 | $ 11.28 | $ 10.74 | $ 9.95 | $ 9.95 |
Income from Investment Operations | | | | | |
Net investment income (loss) D | .52 | .57 | .55 | .55 | .19 |
Net realized and unrealized gain (loss) | .44 | .60 | .62 | .76 | (.04) |
Total from investment operations | .96 | 1.17 | 1.17 | 1.31 | .15 |
Distributions from net investment income | (.53) | (.56) | (.53) | (.52) | (.15) |
Distributions from net realized gain | (.24) | (.20) | (.10) | - | - |
Total distributions | (.77) | (.76) | (.63) | (.52) | (.15) |
Redemption fees added to paid in capital D, I | - | - | - | - | - |
Net asset value, end of period | $ 11.88 | $ 11.69 | $ 11.28 | $ 10.74 | $ 9.95 |
Total ReturnB, C | 8.76% | 10.72% | 11.62% | 13.44% | 1.58% |
Ratios to Average Net Assets E, H | | | | | |
Expenses before reductions | .78% | .80% | .84% | .89% | .85%A |
Expenses net of fee waivers, if any | .78% | .80% | .84% | .89% | .85%A |
Expenses net of all reductions | .78% | .80% | .84% | .89% | .85%A |
Net investment income (loss) | 4.55% | 4.89% | 5.17% | 5.24% | 6.70%A |
Supplemental Data | | | | | |
Net assets, end of period (000 omitted) | $ 809,854 | $ 610,045 | $ 217,435 | $ 43,282 | $ 2,930 |
Portfolio turnover rateF | 29% | 26% | 27% | 25% | 28% |
A Annualized
B Total returns for periods of less than one year are not annualized.
C Total returns would have been lower if certain expenses had not been reduced during the applicable periods shown.
D Calculated based on average shares outstanding during the period.
E Fees and expenses of any underlying Fidelity Central Funds are not included in the Fund's expense ratio. The Fund indirectly bears its proportionate share of the expenses of any underlying Fidelity Central Funds.
F Amount does not include the portfolio activity of any underlying Fidelity Central Funds.
G For the period April 14, 2010 (commencement of sale of shares) to July 31, 2010.
H Expense ratios reflect operating expenses of the class. Expenses before reductions do not reflect amounts reimbursed by the investment adviser or reductions from brokerage service arrangements or reductions from other expense offset arrangements and do not represent the amount paid by the class during periods when reimbursements or reductions occur. Expense ratios before reductions for start-up periods may not be representative of longer-term operating periods. Expenses net of fee waivers reflect expenses after reimbursement by the investment adviser but prior to reductions from brokerage service arrangements or other expense offset arrangements. Expenses net of all reductions represent the net expenses paid by the class.
I Amount represents less than $.01 per share.
See accompanying notes which are an integral part of the financial statements.
Annual Report
Notes to Financial Statements
For the period ended July 31, 2014
1. Organization.
Fidelity Real Estate Income Fund (the Fund) is a fund of Fidelity Securities Fund (the Trust) and is authorized to issue an unlimited number of shares. The Trust is registered under the Investment Company Act of 1940, as amended (the 1940 Act), as an open-end management investment company organized as a Massachusetts business trust. The Fund offers Class A, Class T, Class C, Real Estate Income and Institutional Class shares, each of which has equal rights as to assets and voting privileges. Each class has exclusive voting rights with respect to matters that affect that class.
2. Investments in Fidelity Central Funds.
The Fund invests in Fidelity Central Funds, which are open-end investment companies generally available only to other investment companies and accounts managed by the investment adviser and its affiliates. The Fund's Schedule of Investments lists each of the Fidelity Central Funds held as of period end, if any, as an investment of the Fund, but does not include the underlying holdings of each Fidelity Central Fund. As an Investing Fund, the Fund indirectly bears its proportionate share of the expenses of the underlying Fidelity Central Funds.
The Money Market Central Funds seek preservation of capital and current income and are managed by Fidelity Investments Money Management, Inc. (FIMM), an affiliate of the investment adviser. Annualized expenses of the Money Market Central Funds as of their most recent shareholder report date are less than .01%.
A complete unaudited list of holdings for each Fidelity Central Fund is available upon request or at the Securities and Exchange Commission (the SEC) website at www.sec.gov. In addition, the financial statements of the Fidelity Central Funds, which are not covered by the Fund's Report of Independent Registered Public Accounting Firm, are available on the SEC website or upon request.
3. Significant Accounting Policies.
The financial statements have been prepared in conformity with accounting principles generally accepted in the United States of America (GAAP), which require management to make certain estimates and assumptions at the date of the financial statements. Actual results could differ from those estimates. Subsequent events, if any, through the date that the financial statements were issued have been evaluated in the preparation of the financial statements. The following summarizes the significant accounting policies of the Fund:
Investment Valuation. Investments are valued as of 4:00 p.m. Eastern time on the last calendar day of the period. In accordance with valuation policies and procedures approved by the Board of Trustees (the Board), the Fund attempts to obtain prices from
Annual Report
Notes to Financial Statements - continued
3. Significant Accounting Policies - continued
Investment Valuation - continued
one or more third party pricing vendors or brokers to value its investments. When current market prices, quotations or currency exchange rates are not readily available or reliable, investments will be fair valued in good faith by the Fidelity Management & Research Company (FMR) Fair Value Committee (the Committee), in accordance with procedures adopted by the Board. Factors used in determining fair value vary by investment type and may include market or investment specific events, changes in interest rates and credit quality. The frequency with which these procedures are used cannot be predicted and they may be utilized to a significant extent. The Committee oversees the Fund's valuation policies and procedures and is responsible for approving and reporting to the Board all fair value determinations.
The Fund categorizes the inputs to valuation techniques used to value its investments into a disclosure hierarchy consisting of three levels as shown below:
Level 1 - quoted prices in active markets for identical investments
Level 2 - other significant observable inputs (including quoted prices for similar investments, interest rates, prepayment speeds, etc.)
Level 3 - unobservable inputs (including the Fund's own assumptions based on the best information available)
Valuation techniques used to value the Fund's investments by major category are as follows:
Equity securities, including restricted securities, for which market quotations are readily available, are valued at the last reported sale price or official closing price as reported by a third party pricing vendor on the primary market or exchange on which they are traded and are categorized as Level 1 in the hierarchy. In the event there were no sales during the day or closing prices are not available, securities are valued at the last quoted bid price or may be valued using the last available price and are generally categorized as Level 2 in the hierarchy. For foreign equity securities, when market or security specific events arise, comparisons to the valuation of American Depositary Receipts (ADRs), futures contracts, Exchange-Traded Funds (ETFs) and certain indexes as well as quoted prices for similar securities may be used and would be categorized as Level 2 in the hierarchy. Utilizing these techniques may result in transfers between Level 1 and Level 2. For equity securities, including restricted securities, where observable inputs are limited, assumptions about market activity and risk are used and these securities may be categorized as Level 3 in the hierarchy.
Annual Report
3. Significant Accounting Policies - continued
Investment Valuation - continued
Debt securities, including restricted securities, are valued based on evaluated prices received from third party pricing vendors or from brokers who make markets in such securities. Corporate bonds, bank loan obligations and preferred securities are valued by pricing vendors who utilize matrix pricing which considers yield or price of bonds of comparable quality, coupon, maturity and type or by broker-supplied prices. Asset backed securities, collateralized mortgage obligations and commercial mortgage securities are valued by pricing vendors who utilize matrix pricing which considers prepayment speed assumptions, attributes of the collateral, yield or price of bonds of comparable quality, coupon, maturity and type or by broker-supplied prices. When independent prices are unavailable or unreliable, debt securities may be valued utilizing pricing methodologies which consider similar factors that would be used by third party pricing vendors. Debt securities are generally categorized as Level 2 in the hierarchy but may be Level 3 depending on the circumstances.
Investments in open-end mutual funds, including the Fidelity Central Funds, are valued at their closing net asset value (NAV) each business day and are categorized as Level 1 in the hierarchy.
The following provides information on Level 3 securities held by the Fund that were valued at period end based on unobservable inputs. These amounts exclude valuations provided by a broker.
Annual Report
Notes to Financial Statements - continued
3. Significant Accounting Policies - continued
Investment Valuation - continued
Asset Type | Fair Value at
07/31/14 | Valuation
Technique(s) | Unobservable
Input | Amount or Range/
Weighted
Average | Impact to
Valuation
from an
Increase in
Input* |
Asset-Backed Securities | $ 7,282,217 | Discounted cash flow | Yield | 3.0% - 10.4% / 4.5% | Decrease |
| | Expected distribution | Recovery rate | 0.0% | Increase |
Bank Loan
Obligations | $46,898,132 | Discounted cash flow | Yield | 2.1% - 10.5% / 6.1% | Decrease |
Collateralized Mortgage
Obligations | $ 726,477 | Discounted cash flow | Yield | 4.1% - 40.0% / 11.1% | Decrease |
Commercial Mortgage Securities | $ 6,929,493 | Discounted cash flow | Yield | 2.1% - 10.4% / 2.1% | Decrease |
| | Market comparable | Spread | 13.0% | Decrease |
Common Stocks | $ 6,928,291 | Adjusted book value | Book value
multiple | 1.3 | Increase |
Corporate Bonds | $ 500,157 | Discounted cash flow | Discount rate | 20.0% | Decrease |
| | Expected distribution | Recovery rate | 0.0% | Increase |
Preferred
Securities | $ 905,362 | Discounted cash flow | Yield | 13.0% | Decrease |
* Represents the expected directional change in the fair value of the Level 3 investments that would result from an increase in the corresponding input. A decrease to the unobservable input would have the opposite effect. Significant changes in these inputs could result in significantly higher or lower fair value measurements.
Changes in valuation techniques may result in transfers in or out of an assigned level within the disclosure hierarchy. The aggregate value of investments by input level, as of July 31, 2014, as well as a roll forward of Level 3 investments, is included at the end of the Fund's Schedule of Investments.
Foreign Currency. The Fund may use foreign currency contracts to facilitate transactions in foreign-denominated securities. Gains and losses from these transactions may arise from changes in the value of the foreign currency or if the counterparties do not perform under the contracts' terms.
Foreign-denominated assets, including investment securities, and liabilities are translated into U.S. dollars at the exchange rates at period end. Purchases and sales of investment securities, income and dividends received and expenses denominated in foreign currencies are translated into U.S. dollars at the exchange rate in effect on the transaction date.
The effects of exchange rate fluctuations on investments are included with the net realized and unrealized gain (loss) on investment securities. Other foreign currency transactions resulting in realized and unrealized gain (loss) are disclosed separately.
Annual Report
3. Significant Accounting Policies - continued
Investment Transactions and Income. For financial reporting purposes, the Fund's investment holdings and NAV include trades executed through the end of the last business day of the period. The NAV per share for processing shareholder transactions is calculated as of the close of business of the New York Stock Exchange (NYSE), normally 4:00 p.m. Eastern time and includes trades executed through the end of the prior business day. Gains and losses on securities sold are determined on the basis of identified cost. Dividend income is recorded on the ex-dividend date, except for certain dividends from foreign securities where the ex-dividend date may have passed, which are recorded as soon as the Fund is informed of the ex-dividend date. Non-cash dividends included in dividend income, if any, are recorded at the fair market value of the securities received. Income and capital gain distributions from Fidelity Central Funds, if any, are recorded on the ex-dividend date. Distributions received on securities that represent a return of capital or capital gain are recorded as a reduction of cost of investments and/or as a realized gain. Subsequent to ex-dividend date the Fund determines the components of these distributions, based upon receipt of tax filings or other correspondence relating to the underlying investment. Interest income is accrued as earned and includes coupon interest and amortization of premium and accretion of discount on debt securities as applicable. For certain lower credit quality securitized assets that have contractual cash flows (for example, asset backed securities, collateralized mortgage obligations and commercial mortgage-backed securities), changes in estimated cash flows are periodically evaluated and the estimated yield is adjusted on a prospective basis, resulting in increases or decreases to Interest Income in the accompanying Statement of Operations. Investment income is recorded net of foreign taxes withheld where recovery of such taxes is uncertain. Debt obligations may be placed on non-accrual status and related interest income may be reduced by ceasing current accruals and writing off interest receivables when the collection of all or a portion of interest has become doubtful based on consistently applied procedures. A debt obligation is removed from non-accrual status when the issuer resumes interest payments or when collectability of interest is reasonably assured.
Class Allocations and Expenses. Investment income, realized and unrealized capital gains and losses, common expenses of the Fund, and certain fund-level expense reductions, if any, are allocated daily on a pro-rata basis to each class based on the relative net assets of each class to the total net assets of the Fund. Each class differs with respect to transfer agent and distribution and service plan fees incurred. Certain expense reductions may also differ by class. For the reporting period, the allocated portion of income and expenses to each class as a percent of its average net assets may vary due to the timing of recording these transactions in relation to fluctuating net assets of the classes. Expenses directly attributable to a fund are charged to that fund. Expenses attributable
Annual Report
Notes to Financial Statements - continued
3. Significant Accounting Policies - continued
Class Allocations and Expenses - continued
to more than one fund are allocated among the respective funds on the basis of relative net assets or other appropriate methods. Expense estimates are accrued in the period to which they relate and adjustments are made when actual amounts are known.
Income Tax Information and Distributions to Shareholders. Each year, the Fund intends to qualify as a regulated investment company under Subchapter M of the Internal Revenue Code, including distributing substantially all of its taxable income and realized gains. As a result, no provision for U.S. Federal income taxes is required. As of July 31, 2014, the Fund did not have any unrecognized tax benefits in the financial statements; nor is the Fund aware of any tax positions for which it is reasonably possible that the total amounts of unrecognized tax benefits will significantly change in the next twelve months. The Fund files a U.S. federal tax return, in addition to state and local tax returns as required. The Fund's federal income tax returns are subject to examination by the Internal Revenue Service (IRS) for a period of three fiscal years after they are filed. State and local tax returns may be subject to examination for an additional fiscal year depending on the jurisdiction. Foreign taxes are provided for based on the Fund's understanding of the tax rules and rates that exist in the foreign markets in which it invests.
Distributions are declared and recorded on the ex-dividend date. Income dividends and capital gain distributions are declared separately for each class. Income and capital gain distributions are determined in accordance with income tax regulations, which may differ from GAAP. In addition, the Fund claimed a portion of the payment made to redeeming shareholders as a distribution for income tax purposes.
Capital accounts within the financial statements are adjusted for permanent book-tax differences. These adjustments have no impact on net assets or the results of operations. Capital accounts are not adjusted for temporary book-tax differences which will reverse in a subsequent period.
Book-tax differences are primarily due to foreign currency transactions, passive foreign investment companies (PFIC), market discount, partnerships, equity-debt classifications and losses deferred due to wash sales.
Annual Report
3. Significant Accounting Policies - continued
Income Tax Information and Distributions to Shareholders - continued
The federal tax cost of investment securities and unrealized appreciation (depreciation) as of period end were as follows:
Gross unrealized appreciation | $ 331,991,084 |
Gross unrealized depreciation | (67,454,992) |
Net unrealized appreciation (depreciation) on securities | $ 264,536,092 |
| |
Tax Cost | $ 3,924,157,768 |
The tax-based components of distributable earnings as of period end were as follows:
Undistributed ordinary income | $ 39,196,788 |
Undistributed long-term capital gain | $ 61,346,649 |
Net unrealized appreciation (depreciation) on securities and other investments | $ 264,559,628 |
The tax character of distributions paid was as follows:
| July 31, 2014 | July 31, 2013 |
Ordinary Income | $ 185,363,562 | $ 170,384,735 |
Long-term Capital Gains | 65,088,933 | 41,059,865 |
Total | $ 250,452,495 | $ 211,444,600 |
Short-Term Trading (Redemption) Fees. Shares held by investors in the Fund less than 90 days may have been subject to a redemption fee equal to .75% of the NAV of shares redeemed. All redemption fees, which reduce the proceeds of the shareholder redemption, are retained by the Fund and accounted for as an addition to paid in capital.
Delayed Delivery Transactions and When-Issued Securities. During the period, the Fund transacted in securities on a delayed delivery or when-issued basis. Payment and delivery may take place after the customary settlement period for that security. The price of the underlying securities and the date when the securities will be delivered and paid for are fixed at the time the transaction is negotiated. The securities purchased on a delayed delivery or when-issued basis are identified as such in the Fund's Schedule of Investments. The Fund may receive compensation for interest forgone in the purchase of a delayed delivery or when-issued security. With respect to purchase commitments, the Fund identifies securities as segregated in its records with a value at least equal to the amount of the commitment. Losses may arise due to changes in the value of the underlying securities or if the counterparty does not perform under the contract's terms, or if the issuer does not issue the securities due to political, economic, or other factors.
Annual Report
Notes to Financial Statements - continued
3. Significant Accounting Policies - continued
Restricted Securities. The Fund may invest in securities that are subject to legal or contractual restrictions on resale. These securities generally may be resold in transactions exempt from registration or to the public if the securities are registered. Disposal of these securities may involve time-consuming negotiations and expense, and prompt sale at an acceptable price may be difficult. Information regarding restricted securities is included at the end of the Fund's Schedule of Investments.
Loans and Other Direct Debt Instruments. The Fund invests in direct debt instruments which are interests in amounts owed to lenders by corporate or other borrowers. These instruments may be in the form of loans, trade claims or other receivables and may include standby financing commitments such as revolving credit facilities that obligate the Fund to supply additional cash to the borrower on demand. Loans may be acquired through assignment or participation, or may be made directly to a borrower. The Fund did not have any unfunded loan commitments, which are contractual obligations for future funding, at period end.
4. Purchases and Sales of Investments.
Purchases and sales of securities, other than short-term securities and U.S. government securities, aggregated $1,052,015,263 and $1,138,541,279, respectively.
5. Fees and Other Transactions with Affiliates.
Management Fee. Fidelity Management & Research Company (the investment adviser) and its affiliates provide the Fund with investment management related services for which the Fund pays a monthly management fee. The management fee is the sum of an individual fund fee rate that is based on an annual rate of .30% of the Fund's average net assets and an annualized group fee rate that averaged .25% during the period. The group fee rate is based upon the average net assets of all the mutual funds advised by the investment adviser, including any mutual funds previously advised by the investment adviser that are currently advised by Fidelity SelectCo, LLC, an affiliate of the investment adviser. The group fee rate decreases as assets under management increase and increases as assets under management decrease. For the reporting period, the total annual management fee rate was .55% of the Fund's average net assets.
Distribution and Service Plan Fees. In accordance with Rule 12b-1 of the 1940 Act, the Fund has adopted separate Distribution and Service Plans for each class of shares. Certain classes pay Fidelity Distributors Corporation (FDC), an affiliate of the investment adviser, separate Distribution and Service Fees, each of which is based on an annual percentage of each class' average net assets. In addition, FDC may pay financial intermediaries for selling shares of the Fund and providing shareholder support services.
Annual Report
5. Fees and Other Transactions with Affiliates - continued
Distribution and Service Plan Fees - continued
For the period, the Distribution and Service Fee rates, total fees and amounts retained by FDC were as follows:
| Distribution
Fee | Service
Fee | Total Fees | Retained
by FDC |
Class A | -% | .25% | $ 967,235 | $ 25,663 |
Class T | -% | .25% | 108,744 | 40 |
Class C | .75% | .25% | 2,097,112 | 927,749 |
| | | $ 3,173,091 | $ 953,452 |
Sales Load. FDC may receive a front-end sales charge of up to 4.00% for selling Class A shares and Class T shares, some of which is paid to financial intermediaries for selling shares of the Fund. Depending on the holding period, FDC may receive contingent deferred sales charges levied on Class A, Class T and Class C redemptions. The deferred sales charges range from 1.00% for Class C shares, 1.00% for certain purchases of Class A shares and .25% for certain purchases of Class T shares.
For the period, sales charge amounts retained by FDC were as follows:
| Retained
by FDC |
Class A | $ 109,599 |
Class T | 12,563 |
Class C* | 74,180 |
| $ 196,342 |
* When Class C shares are initially sold, FDC pays commissions from its own resources to financial intermediaries through which the sales are made.
Transfer Agent Fees. Fidelity Investments Institutional Operations Company, Inc., (FIIOC), an affiliate of the investment adviser, is the transfer, dividend disbursing and shareholder servicing agent for each class of the Fund. FIIOC receives account fees and asset-based fees that vary according to the account size and type of account of the shareholders of the respective classes of the Fund. FIIOC pays for typesetting, printing and mailing of shareholder reports, except proxy statements.
For the period, transfer agent fees for each class were as follows:
| Amount | % of
Average
Net Assets |
Class A | $ 805,109 | .21 |
Class T | 99,408 | .23 |
Class C | 404,930 | .19 |
Real Estate Income | 6,054,879 | .23 |
Institutional Class | 1,184,475 | .19 |
| $ 8,548,801 | |
Annual Report
Notes to Financial Statements - continued
5. Fees and Other Transactions with Affiliates - continued
Accounting and Security Lending Fees. Fidelity Service Company, Inc. (FSC), an affiliate of the investment adviser, maintains the Fund's accounting records. The accounting fee is based on the level of average net assets for each month. Under a separate contract, FSC administers the security lending program. The security lending fee is based on the number and duration of lending transactions.
Brokerage Commissions. The Fund placed a portion of its portfolio transactions with brokerage firms which are affiliates of the investment adviser. Brokerage commissions are included in net realized gain (loss) and change in net unrealized appreciation (depreciation) in the Statement of Operations. The commissions paid to these affiliated firms were $26,723 for the period.
6. Committed Line of Credit.
The Fund participates with other funds managed by the investment adviser or an affiliate in a $4.25 billion credit facility (the "line of credit") to be utilized for temporary or emergency purposes to fund shareholder redemptions or for other short-term liquidity purposes. The Fund has agreed to pay commitment fees on its pro-rata portion of the line of credit, which amounted to $6,555 and is reflected in Miscellaneous expenses on the Statement of Operations. During the period, the Fund did not borrow on this line of credit.
7. Security Lending.
The Fund lends portfolio securities through a lending agent from time to time in order to earn additional income. For equity securities, a lending agent is used and may loan securities to certain qualified borrowers, including Fidelity Capital Markets (FCM), a broker-dealer affiliated with the Fund. On the settlement date of the loan, the Fund receives collateral (in the form of U.S. Treasury obligations, letters of credit and/or cash) against the loaned securities and maintains collateral in an amount not less than 100% of the market value of the loaned securities during the period of the loan. The market value of the loaned securities is determined at the close of business of the Fund and any additional required collateral is delivered to the Fund on the next business day. If the borrower defaults on its obligation to return the securities loaned because of insolvency or other reasons, the Fund may apply collateral received from the borrower against the obligation. The Fund may experience delays and costs in recovering the securities loaned. Any cash collateral received is invested in the Fidelity Securities Lending Cash Central Fund. The value of loaned securities and cash collateral at period end are disclosed on the Fund's Statement of Assets and Liabilities. At period end, there were no security loans outstanding with FCM. Security lending income represents the income
Annual Report
7. Security Lending - continued
earned on investing cash collateral, less rebates paid to borrowers and any lending agent fees associated with the loan, plus any premium payments received for lending certain types of securities. Security lending income is presented in the Statement of Operations as a component of income from Fidelity Central Funds. Total security lending income during the period amounted to $69,287, including $155 from securities loaned to FCM.
8. Expense Reductions.
Commissions paid to certain brokers with whom the investment adviser, or its affiliates, places trades on behalf of the Fund include an amount in addition to trade execution, which may be rebated back to the Fund to offset certain expenses. This amount totaled $51,646 for the period. In addition, through arrangements with the Fund's custodian, credits realized as a result of uninvested cash balances were used to reduce the Fund's expenses. During the period, these credits reduced the Fund's custody expenses by $1,517.
In addition, the investment adviser reimbursed a portion of the Fund's operating expenses during the period in the amount of $20,523.
9. Distributions to Shareholders.
Distributions to shareholders of each class were as follows:
Years ended July 31, | 2014 | 2013 |
From net investment income | | |
Class A | $ 16,638,771 | $ 10,238,777 |
Class T | 1,842,576 | 1,523,114 |
Class C | 7,530,932 | 4,241,554 |
Real Estate Income | 117,401,887 | 126,726,805 |
Institutional Class | 28,741,085 | 17,180,188 |
Total | $ 172,155,251 | $ 159,910,438 |
From net realized gain | | |
Class A | $ 7,591,572 | $ 2,837,075 |
Class T | 874,881 | 506,062 |
Class C | 4,152,718 | 1,181,312 |
Real Estate Income | 53,508,422 | 42,729,814 |
Institutional Class | 12,169,651 | 4,279,899 |
Total | $ 78,297,244 | $ 51,534,162 |
Annual Report
Notes to Financial Statements - continued
10. Share Transactions.
Transactions for each class of shares were as follows:
| Shares | Dollars |
Years ended July 31, | 2014 | 2013 | 2014 | 2013 |
Class A | | | | |
Shares sold | 18,815,698 | 25,244,691 | $ 217,399,754 | $ 296,851,509 |
Reinvestment of distributions | 1,805,230 | 900,102 | 20,178,624 | 10,299,964 |
Shares redeemed | (15,738,034) | (5,925,325) | (180,458,692) | (69,436,144) |
Net increase (decrease) | 4,882,894 | 20,219,468 | $ 57,119,686 | $ 237,715,329 |
Class T | | | | |
Shares sold | 1,270,924 | 2,730,063 | $ 14,645,845 | $ 31,978,463 |
Reinvestment of distributions | 211,146 | 132,742 | 2,357,016 | 1,515,681 |
Shares redeemed | (1,380,258) | (1,226,451) | (15,703,373) | (14,137,454) |
Net increase (decrease) | 101,812 | 1,636,354 | $ 1,299,488 | $ 19,356,690 |
Class C | | | | |
Shares sold | 9,015,535 | 14,157,408 | $ 103,482,191 | $ 165,598,758 |
Reinvestment of distributions | 813,525 | 375,304 | 9,012,478 | 4,279,651 |
Shares redeemed | (6,508,928) | (1,637,958) | (73,908,752) | (19,029,492) |
Net increase (decrease) | 3,320,132 | 12,894,754 | $ 38,585,917 | $ 150,848,917 |
Real Estate Income | | | | |
Shares sold | 61,717,695 | 123,727,906 | $ 711,894,953 | $ 1,450,014,694 |
Reinvestment of distributions | 13,609,464 | 13,299,047 | 152,306,330 | 151,923,311 |
Shares redeemed | (100,931,769) | (90,180,888) | (1,156,054,958) | (1,057,830,249) |
Net increase (decrease) | (25,604,610) | 46,846,065 | $ (291,853,675) | $ 544,107,756 |
Institutional Class | | | | |
Shares sold | 40,192,476 | 42,960,747 | $ 465,679,843 | $ 506,030,603 |
Reinvestment of distributions | 2,412,058 | 1,337,082 | 27,006,597 | 15,315,413 |
Shares redeemed | (26,626,486) | (11,392,454) | (303,889,493) | (133,274,193) |
Net increase (decrease) | 15,978,048 | 32,905,375 | $ 188,796,947 | $ 388,071,823 |
Annual Report
11. Other.
The Fund's organizational documents provide former and current trustees and officers with a limited indemnification against liabilities arising in connection with the performance of their duties to the Fund. In the normal course of business, the Fund may also enter into contracts that provide general indemnifications. The Fund's maximum exposure under these arrangements is unknown as this would be dependent on future claims that may be made against the Fund. The risk of material loss from such claims is considered remote.
Annual Report
To the Trustees of Fidelity Securities Fund and Shareholders of Fidelity Real Estate Income Fund:
We have audited the accompanying statement of assets and liabilities of Fidelity Real Estate Income Fund (the Fund), a fund of Fidelity Securities Fund, including the schedule of investments, as of July 31, 2014, and the related statement of operations for the year then ended, the statement of changes in net assets for each of the two years in the period then ended, and the financial highlights for each of the five years in the period then ended. These financial statements and financial highlights are the responsibility of the Fund's management. Our responsibility is to express an opinion on these financial statements and financial highlights based on our audits.
We conducted our audits in accordance with the standards of the Public Company Accounting Oversight Board (United States). Those standards require that we plan and perform the audit to obtain reasonable assurance about whether the financial statements and financial highlights are free of material misstatement. The Fund is not required to have, nor were we engaged to perform, an audit of its internal control over financial reporting. Our audits included consideration of internal control over financial reporting as a basis for designing audit procedures that are appropriate in the circumstances, but not for the purpose of expressing an opinion on the effectiveness of the Fund's internal control over financial reporting. Accordingly, we express no such opinion. An audit also includes examining, on a test basis, evidence supporting the amounts and disclosures in the financial statements, assessing the accounting principles used and significant estimates made by management, as well as evaluating the overall financial statement presentation. Our procedures included confirmation of securities owned as of July 31, 2014, by correspondence with the custodians and brokers; where replies were not received from brokers, we performed other auditing procedures. We believe that our audits provide a reasonable basis for our opinion.
In our opinion, the financial statements and financial highlights referred to above present fairly, in all material respects, the financial position of Fidelity Real Estate Income Fund as of July 31, 2014, the results of its operations for the year then ended, the changes in its net assets for each of the two years in the period then ended, and the financial highlights for each of the five years in the period then ended, in conformity with accounting principles generally accepted in the United States of America.
DELOITTE & TOUCHE LLP
Boston, Massachusetts
September 19, 2014
Annual Report
The Trustees, Member of the Advisory Board, and officers of the trust and fund, as applicable, are listed below. The Board of Trustees governs the fund and is responsible for protecting the interests of shareholders. The Trustees are experienced executives who meet periodically throughout the year to oversee the fund's activities, review contractual arrangements with companies that provide services to the fund, oversee management of the risks associated with such activities and contractual arrangements, and review the fund's performance. Except for James C. Curvey, each of the Trustees oversees 173 funds. Mr. Curvey oversees 397 funds.
The Trustees hold office without limit in time except that (a) any Trustee may resign; (b) any Trustee may be removed by written instrument, signed by at least two-thirds of the number of Trustees prior to such removal; (c) any Trustee who requests to be retired or who has become incapacitated by illness or injury may be retired by written instrument signed by a majority of the other Trustees; and (d) any Trustee may be removed at any special meeting of shareholders by a two-thirds vote of the outstanding voting securities of the trust. Each Trustee who is not an interested person (as defined in the 1940 Act) of the trust and the fund (Independent Trustee), shall retire not later than the last day of the calendar year in which his or her 75th birthday occurs. The Independent Trustees may waive this mandatory retirement age policy with respect to individual Trustees. The officers and Advisory Board Member hold office without limit in time, except that any officer and Advisory Board Member may resign or may be removed by a vote of a majority of the Trustees at any regular meeting or any special meeting of the Trustees. Except as indicated, each individual has held the office shown or other offices in the same company for the past five years.
Experience, Skills, Attributes, and Qualifications of the Fund's Trustees. The Governance and Nominating Committee has adopted a statement of policy that describes the experience, qualifications, attributes, and skills that are necessary and desirable for potential Independent Trustee candidates (Statement of Policy). The Board believes that each Trustee satisfied at the time he or she was initially elected or appointed a Trustee, and continues to satisfy, the standards contemplated by the Statement of Policy. The Governance and Nominating Committee also engages professional search firms to help identify potential Independent Trustee candidates who have the experience, qualifications, attributes, and skills consistent with the Statement of Policy. From time to time, additional criteria based on the composition and skills of the current Independent Trustees, as well as experience or skills that may be appropriate in light of future changes to board composition, business conditions, and regulatory or other developments, have also been considered by the professional search firms and the Governance and Nominating Committee. In addition, the Board takes into account the Trustees' commitment and participation in Board and committee meetings, as well as their leadership of standing and ad hoc committees throughout their tenure.
In determining that a particular Trustee was and continues to be qualified to serve as a Trustee, the Board has considered a variety of criteria, none of which, in isolation, was controlling. The Board believes that, collectively, the Trustees have balanced and diverse experience, qualifications, attributes, and skills, which allow the Board to operate effectively in governing the fund and protecting the interests of shareholders. Information about the specific experience, skills, attributes, and qualifications of each Trustee, which in each case led to the Board's conclusion that the Trustee should serve (or continue to serve) as a trustee of the fund, is provided below.
Annual Report
Trustees and Officers - continued
Board Structure and Oversight Function. James C. Curvey is an interested person (as defined in the 1940 Act) and currently serves as Chairman. The Trustees have determined that an interested Chairman is appropriate and benefits shareholders because an interested Chairman has a personal and professional stake in the quality and continuity of services provided to the fund. Independent Trustees exercise their informed business judgment to appoint an individual of their choosing to serve as Chairman, regardless of whether the Trustee happens to be independent or a member of management. The Independent Trustees have determined that they can act independently and effectively without having an Independent Trustee serve as Chairman and that a key structural component for assuring that they are in a position to do so is for the Independent Trustees to constitute a substantial majority for the Board. The Independent Trustees also regularly meet in executive session. Ned C. Lautenbach serves as Chairman of the Independent Trustees and as such (i) acts as a liaison between the Independent Trustees and management with respect to matters important to the Independent Trustees and (ii) with management prepares agendas for Board meetings.
Fidelity funds are overseen by different Boards of Trustees. The fund's Board oversees Fidelity's equity and high income funds and another Board oversees Fidelity's investment-grade bond, money market, and asset allocation funds. The asset allocation funds may invest in Fidelity funds overseen by the fund's Board. The use of separate Boards, each with its own committee structure, allows the Trustees of each group of Fidelity funds to focus on the unique issues of the funds they oversee, including common research, investment, and operational issues. On occasion, the separate Boards establish joint committees to address issues of overlapping consequences for the Fidelity funds overseen by each Board.
The Trustees operate using a system of committees to facilitate the timely and efficient consideration of all matters of importance to the Trustees, the fund, and fund shareholders and to facilitate compliance with legal and regulatory requirements and oversight of the fund's activities and associated risks. The Board, acting through its committees, has charged FMR and its affiliates with (i) identifying events or circumstances the occurrence of which could have demonstrably adverse effects on the fund's business and/or reputation; (ii) implementing processes and controls to lessen the possibility that such events or circumstances occur or to mitigate the effects of such events or circumstances if they do occur; and (iii) creating and maintaining a system designed to evaluate continuously business and market conditions in order to facilitate the identification and implementation processes described in (i) and (ii) above. Because the day-to-day operations and activities of the fund are carried out by or through FMR, its affiliates and other service providers, the fund's exposure to risks is mitigated but not eliminated by the processes overseen by the Trustees. While each of the Board's committees has responsibility for overseeing different aspects of the fund's activities, oversight is exercised primarily through the Operations, Audit, and Compliance Committees. In addition, the Independent Trustees have worked with FMR to enhance the Board's oversight of investment and financial risks, legal and regulatory risks, technology risks, and operational risks, including the development of additional risk reporting to the Board. For example, a working group comprised of Independent Trustees and FMR has worked and continues to work to review the Fidelity funds' valuation-related activities, reporting and risk management. Appropriate personnel, including but not limited to the fund's Chief Compliance Officer (CCO), FMR's internal auditor, the independent accountants, the fund's Treasurer and portfolio management personnel, make periodic reports to the Board's committees, as appropriate, including an annual review of FMR's risk management program for the Fidelity funds. The responsibilities of each standing committee, including their oversight responsibilities, are described further under "Standing Committees of the Fund's Trustees."
Annual Report
The fund's Statement of Additional Information (SAI) includes more information about the Trustees. To request a free copy, call Fidelity at 1-877-208-0098.
Interested Trustees*:
Correspondence intended for each Trustee who is an interested person may be sent to Fidelity Investments, 245 Summer Street, Boston, Massachusetts 02210.
Name, Year of Birth; Principal Occupations and Other Relevant Experience+ |
James C. Curvey (1935) |
Year of Election or Appointment: 2007 Trustee Chairman of the Board of Trustees |
| Mr. Curvey also serves as Trustee of other Fidelity funds. Mr. Curvey is a Director of Fidelity Research & Analysis Co. (2009-present), and Vice Chairman (2007-present) and Director of FMR LLC. In addition, Mr. Curvey serves as an Overseer for the Boston Symphony Orchestra and a member of the Trustees of Villanova University. Previously, Mr. Curvey served as a Director of Fidelity Investments Money Management, Inc. (2009-2014), a Director of FMR (2007-2014), a Director of FMR Co., Inc. (2007-2014) and was the Vice Chairman (2006-2007) and Director (2000-2007) of FMR Corp. |
Charles S. Morrison (1960) |
Year of Election or Appointment: 2014 Trustee |
| Mr. Morrison also serves as Trustee of other funds. He serves as President, Asset Management (2014-present) and is an employee of Fidelity Investments. Previously, Mr. Morrison served as Vice President of Fidelity's Fixed Income and Asset Allocation Funds (2012-2014), President, Fixed Income (2011-2014), Vice President of Fidelity's Money Market Funds (2005-2009), President, Money Market Group Leader of FMR (2009), and Senior Vice President, Money Market Group of FMR (2004-2009). Mr. Morrison also served as Vice President of Fidelity's Bond Funds (2002-2005), certain Balanced Funds (2002-2005), and certain Asset Allocation Funds (2002-2007), and as Senior Vice President (2002-2005) of Fidelity's Bond Division. |
* Trustees have been determined to be "Interested Trustees" by virtue of, among other things, their affiliation with the trust or various entities under common control with FMR.
+ The information above includes each Trustee's principal occupation during the last five years and other information relating to the experience, attributes, and skills relevant to each Trustee's qualifications to serve as a Trustee, which led to the conclusion that each Trustee should serve as a Trustee for the fund.
Annual Report
Independent Trustees:
Correspondence intended for each Independent Trustee (that is, the Trustees other than the Interested Trustees) may be sent to Fidelity Investments, P.O. Box 55235, Boston, Massachusetts 02205-5235.
Name, Year of Birth; Principal Occupations and Other Relevant Experience+ |
Dennis J. Dirks (1948) |
Year of Election or Appointment: 2005 Trustee |
| Mr. Dirks also serves as Trustee of other Fidelity funds. Prior to his retirement in May 2003, Mr. Dirks was Chief Operating Officer and a member of the Board of The Depository Trust & Clearing Corporation (DTCC). He also served as President, Chief Operating Officer, and Board member of The Depository Trust Company (DTC) and President and Board member of the National Securities Clearing Corporation (NSCC). In addition, Mr. Dirks served as Chief Executive Officer and Board member of the Government Securities Clearing Corporation, Chief Executive Officer and Board member of the Mortgage-Backed Securities Clearing Corporation, as a Trustee and a member of the Finance Committee of Manhattan College (2005-2008), and as a Trustee and a member of the Finance Committee of AHRC of Nassau County (2006-2008). Mr. Dirks is a member of the Independent Directors Council (IDC) Governing Council (2010-present) and Board of Directors for The Brookville Center for Children's Services, Inc. (2009-present). |
Alan J. Lacy (1953) |
Year of Election or Appointment: 2008 Trustee |
| Mr. Lacy also serves as Trustee of other Fidelity funds. Mr. Lacy serves as Senior Adviser (2007-present) of Oak Hill Capital Partners, L.P. (private equity). Mr. Lacy also served as Chief Executive Officer (2000-2005) and Vice Chairman (2005-2006) of Sears Holdings Corporation and Sears, Roebuck and Co. (retail). In addition, Mr. Lacy serves as a member of the Board of Directors of Dave & Buster's Entertainment, Inc. (restaurant and entertainment complexes, 2010-present), Earth Fare, Inc. (retail grocery, 2012-present), The Hillman Companies, Inc. (hardware wholesalers, 2010-present), and Bristol-Myers Squibb Company (global pharmaceuticals, 2008-present). Mr. Lacy is a member of the Board of Trustees of The National Parks Conservation Association (2006-present). Previously, Mr. Lacy served as Chairman of the Board of Trustees of the National Parks Conservation Association (2008-2011) and as a member of the Board of Directors for the Western Union Company (global money transfer, 2006-2011). |
Ned C. Lautenbach (1944) |
Year of Election or Appointment: 2000 Trustee Chairman of the Independent Trustees |
| Mr. Lautenbach also serves as Trustee of other Fidelity funds. Mr. Lautenbach currently serves as the Lead Director of the Eaton Corporation Board of Directors (diversified industrial, 1997-present). Mr. Lautenbach is Chairman of the Board of Directors of the Philharmonic Center for the Arts in Naples, Florida (2012-present) and a member of the Council on Foreign Relations (1994-present). Previously, Mr. Lautenbach was a Partner/Advisory Partner at Clayton, Dubilier & Rice, LLC (private equity investment, 1998-2010), as well as a Director of Sony Corporation (2006-2007). |
Joseph Mauriello (1944) |
Year of Election or Appointment: 2008 Trustee |
| Mr. Mauriello also serves as Trustee of other Fidelity funds. Prior to his retirement in January 2006, Mr. Mauriello served in numerous senior management positions including Deputy Chairman and Chief Operating Officer (2004-2005), and Vice Chairman of Financial Services (2002-2004) of KPMG LLP US (professional services, 1965-2005). Mr. Mauriello currently serves as a member of the Board of Directors of XL Group plc. (global insurance and re-insurance, 2006-present). Previously, Mr. Mauriello served as a Director of the Hamilton Funds of the Bank of New York (2006-2007) and of Arcadia Resources Inc. (health care services and products, 2007-2012). |
Robert W. Selander (1950) |
Year of Election or Appointment: 2011 Trustee |
| Mr. Selander also serves as Trustee of other Fidelity funds. Previously, Mr. Selander served as a Member of the Advisory Board of other Fidelity funds (2011), and Executive Vice Chairman (2010), Chief Executive Officer (2009-2010), and President and Chief Executive Officer (1997-2009) of Mastercard, Inc. |
Cornelia M. Small (1944) |
Year of Election or Appointment: 2005 Trustee |
| Ms. Small also serves as Trustee of other Fidelity funds. Ms. Small is a member of the Board of Directors (2009-present) and Chair of the Investment Committee (2010-present) of the Teagle Foundation. Ms. Small also serves on the Investment Committee of the Berkshire Taconic Community Foundation (2008-present). Previously, Ms. Small served as Chairperson (2002-2008) and a member of the Investment Committee and Chairperson (2008-2012) and a member of the Board of Trustees of Smith College. In addition, Ms. Small served as Chief Investment Officer, Director of Global Equity Investments, and a member of the Board of Directors of Scudder, Stevens & Clark and Scudder Kemper Investments. |
William S. Stavropoulos (1939) |
Year of Election or Appointment: 2002 Trustee Vice Chairman of the Independent Trustees |
| Mr. Stavropoulos also serves as Trustee of other Fidelity funds. Mr. Stavropoulos serves as President and Founder of the Michigan Baseball Foundation, the Great Lakes Loons (2007-present). Mr. Stavropoulos is Chairman Emeritus of the Board of Directors of The Dow Chemical Company, where he previously served in numerous senior management positions, including President, CEO (1995-2000; 2002-2004), Chairman of the Executive Committee (2000-2006), and as a member of the Board of Directors (1990-2006). Currently, Mr. Stavropoulos is Chairman of the Board of Directors of Univar Inc. (global distributor of commodity and specialty chemicals), a Director of Teradata Corporation (data warehousing and technology solutions), and Maersk Inc. (industrial conglomerate), and a member of the Advisory Board for Metalmark Capital LLC (private equity investment, 2005-present). Mr. Stavropoulos is an operating advisor to Clayton, Dubilier & Rice, LLC (private equity investment). In addition, Mr. Stavropoulos is a member of the University of Notre Dame Advisory Council for the College of Science, a Trustee of the Rollin L. Gerstacker Foundation, and a Director of the Naples Philharmonic Center for the Arts. Previously, Mr. Stavropoulos served as a Director of Chemical Financial Corporation (bank holding company, 1993-2012) and Tyco International, Ltd. (multinational manufacturing and services, 2007-2012). |
David M. Thomas (1949) |
Year of Election or Appointment: 2008 Trustee |
| Mr. Thomas also serves as Trustee of other Fidelity funds. Mr. Thomas serves as Non-Executive Chairman of the Board of Directors of Fortune Brands Home and Security (home and security products, 2011-present), and as a member of the Board of Directors of Interpublic Group of Companies, Inc. (marketing communication, 2004-present). Previously, Mr. Thomas served as Executive Chairman (2005-2006) and Chairman and Chief Executive Officer (2000-2005) of IMS Health, Inc. (pharmaceutical and healthcare information solutions), and a Director of Fortune Brands, Inc. (consumer products, 2000-2011). |
+ The information above includes each Trustee's principal occupation during the last five years and other information relating to the experience, attributes, and skills relevant to each Trustee's qualifications to serve as a Trustee, which led to the conclusion that each Trustee should serve as a Trustee for the fund.
Advisory Board Member and Officers:
Correspondence intended for each officer and Peter S. Lynch may be sent to Fidelity Investments, 245 Summer Street, Boston, Massachusetts 02210. Officers appear below in alphabetical order.
Name, Year of Birth; Principal Occupation |
Peter S. Lynch (1944) |
Year of Election or Appointment: 2003 Member of the Advisory Board |
| Mr. Lynch also serves as Member of the Advisory Board of other Fidelity funds. Mr. Lynch is Vice Chairman and a Director of FMR and FMR Co., Inc. In addition, Mr. Lynch serves as a Trustee of Boston College and as the Chairman of the Inner-City Scholarship Fund. Previously, Mr. Lynch served on the Special Olympics International Board of Directors (1997-2006). |
Christopher S. Bartel (1971) |
Year of Election or Appointment: 2009 Vice President |
| Mr. Bartel also serves as Vice President of other funds. Mr. Bartel serves as a Director, President, and Chief Executive Officer of Fidelity Management & Research (Japan) Inc. (2012-present), a Director of Fidelity Management & Research (Hong Kong) (2012-present), and Senior Vice President of Global Equity Research (2010-present). Previously, Mr. Bartel served as Senior Vice President of Equity Research (2009-2010), Managing Director of Research (2006-2009), and an analyst and portfolio manager (2000-2006). |
Elizabeth Paige Baumann (1968) |
Year of Election or Appointment: 2012 Anti-Money Laundering (AML) Officer |
| Ms. Baumann also serves as AML Officer of other funds. She is Chief AML Officer of FMR LLC (2012-present) and is an employee of Fidelity Investments. Previously, Ms. Baumann served as Vice President and Deputy Anti-Money Laundering Officer (2007-2012). |
William C. Coffey (1969) |
Year of Election or Appointment: 2009 Assistant Secretary |
| Mr. Coffey also serves as Assistant Secretary of other funds. He is Senior Vice President and Deputy General Counsel of FMR LLC (2010-present), and is an employee of Fidelity Investments. Previously, Mr. Coffey served as Vice President and Associate General Counsel of FMR LLC (2005-2009). |
Jonathan Davis (1968) |
Year of Election or Appointment: 2010 Assistant Treasurer |
| Mr. Davis also serves as Assistant Treasurer of other funds. Mr. Davis is an employee of Fidelity Investments. Previously, Mr. Davis served as Vice President and Associate General Counsel of FMR LLC (2003-2010). |
Adrien E. Deberghes (1967) |
Year of Election or Appointment: 2008 Deputy Treasurer |
| Mr. Deberghes also serves as an officer of other funds. He is an employee of Fidelity Investments (2008-present). Prior to joining Fidelity Investments, Mr. Deberghes was Senior Vice President of Mutual Fund Administration at State Street Corporation (2007-2008), Senior Director of Mutual Fund Administration at Investors Bank & Trust (2005-2007), and Director of Finance for Dunkin' Brands (2000-2005). |
Stephanie J. Dorsey (1969) |
Year of Election or Appointment: 2010 Assistant Treasurer |
| Ms. Dorsey also serves as an officer of other funds. She is an employee of Fidelity Investments (2008-present) and has served in other fund officer roles. Prior to joining Fidelity Investments, Ms. Dorsey served as Treasurer (2004-2008) of the JPMorgan Mutual Funds and Vice President (2004-2008) of JPMorgan Chase Bank. |
Howard J. Galligan III (1966) |
Year of Election or Appointment: 2014 Chief Financial Officer |
| Mr. Galligan also serves as Chief Financial Officer of other funds. Mr. Galligan serves as President of Fidelity Pricing and Cash Management Services (FPCMS) (2014-present) and as a Director of Strategic Advisers, Inc. (2008-present). Previously, Mr. Galligan served as Chief Administrative Officer of Asset Management (2011-2014) and Chief Operating Officer and Senior Vice President of Investment Support for Strategic Advisers, Inc. (2003-2011). |
Scott C. Goebel (1968) |
Year of Election or Appointment: 2008 Secretary and Chief Legal Officer (CLO) |
| Mr. Goebel serves as Secretary and CLO of other funds. Mr. Goebel also serves as Secretary of Fidelity SelectCo, LLC (2013-present), Fidelity Investments Money Management, Inc. (FIMM) (2010-present) and Fidelity Research and Analysis Company (FRAC) (2010-present); General Counsel, Secretary, and Senior Vice President of FMR (2008-present) and FMR Co., Inc. (2008-present); Chief Legal Officer of Fidelity Management & Research (Hong Kong) Limited (2008-present); and Assistant Secretary of Fidelity Management & Research (Japan) Inc. (2008-present) and Fidelity Management & Research (U.K.) Inc. (2008-present). Previously, Mr. Goebel served as Secretary and CLO of other Fidelity funds (2008-2013), Assistant Secretary of FIMM (2008-2010), FRAC (2008-2010), and certain funds (2007-2008); and as Vice President and Secretary of Fidelity Distributors Corporation (FDC) (2005-2007). Mr. Goebel has been employed by FMR LLC or an affiliate since 2001. |
Brian B. Hogan (1964) |
Year of Election or Appointment: 2009 Vice President |
| Mr. Hogan also serves as Trustee or Vice President of other funds. Mr. Hogan serves as President of FMR's Equity Division (2009-present). Previously, Mr. Hogan served as Senior Vice President, Equity Research of FMR (2006-2009) and as a portfolio manager. |
Chris Maher (1972) |
Year of Election or Appointment: 2013 Assistant Treasurer |
| Mr. Maher serves as Assistant Treasurer of other funds. Mr. Maher is Vice President of Valuation Oversight and is an employee of Fidelity Investments. Previously, Mr. Maher served as Vice President of Asset Management Compliance (2013), Vice President of FMR's Program Management Group (2010-2013), and Vice President of Valuation Oversight (2008-2010). |
Kenneth B. Robins (1969) |
Year of Election or Appointment: 2008 President and Treasurer |
| Mr. Robins also serves as an officer of other funds. Mr. Robins serves as Executive Vice President of Fidelity Investments Money Management, Inc. (FIMM) (2013-present) and is an employee of Fidelity Investments (2004-present). Previously, Mr. Robins served in other fund officer roles. |
Stephen Sadoski (1971) |
Year of Election or Appointment: 2012 Deputy Treasurer |
| Mr. Sadoski also serves as Deputy Treasurer of other funds. He is an employee of Fidelity Investments (2012-present) and has served in another fund officer role. Prior to joining Fidelity Investments, Mr. Sadoski served as an assistant chief accountant in the Division of Investment Management of the Securities and Exchange Commission (SEC) (2009-2012) and as a senior manager at Deloitte & Touche LLP (1997-2009). |
Stacie M. Smith (1974) |
Year of Election or Appointment: 2013 Deputy Treasurer |
| Ms. Smith also serves as an officer of other funds. She is an employee of Fidelity Investments (2009-present) and has served in other fund officer roles. Prior to joining Fidelity Investments, Ms. Smith served as Senior Audit Manager of Ernst & Young LLP (1996-2009). |
Renee Stagnone (1975) |
Year of Election or Appointment: 2013 Deputy Treasurer |
| Ms. Stagnone also serves as Deputy Treasurer of other funds. Ms. Stagnone is an employee of Fidelity Investments. |
Linda J. Wondrack (1964) |
Year of Election or Appointment: 2014 Chief Compliance Officer |
| Ms. Wondrack also serves as Chief Compliance Officer of other funds. Ms. Wondrack is Executive Vice President and head of the Ethics Office and Asset Management Compliance for Fidelity Investments (2012-present). Ms. Wondrack also serves as Chief Compliance Officer of Fidelity SelectCo, LLC (2014-present); Chief Compliance Officer of Impresa Management LLC (2013-present); and Chief Compliance Officer of FMR Co., Inc., Fidelity Investments Money Management, Inc., Fidelity Management & Research (Japan) Inc., Fidelity Management & Research (U.K.) Inc., Fidelity Management & Research (Hong Kong), Fidelity Management & Research Company, Pyramis Global Advisors, LLC, and Strategic Advisers, Inc., Ballyrock Investment Advisors LLC, and Northern Neck Investors LLC (2012-present). Previously, Ms. Wondrack served as Senior Vice President and Chief Compliance Officer for Columbia Management Investment Advisers, LLC (2005-2012); Chief Compliance Officer for certain funds within the Columbia Family of Funds (2007-2012); and Senior Vice President of Compliance Risk Management at Bank of America (2005-2010). |
Joseph F. Zambello (1957) |
Year of Election or Appointment: 2011 Deputy Treasurer |
| Mr. Zambello also serves as Deputy Treasurer of other funds. Mr. Zambello is an employee of Fidelity Investments. Previously, Mr. Zambello served as Vice President of FMR's Program Management Group (2009-2011) and Vice President of the Transfer Agent Oversight Group (2005-2009). |
Annual Report
The Board of Trustees of Fidelity Advisor Real Estate Income Fund voted to pay to shareholders of record at the opening of business, the following distributions per share derived from capital gains realized from sales of portfolio securities, and dividends derived from net investment income:
| Pay Date | Record Date | Dividends | Capital Gains |
Institutional Class | 09/08/14 | 09/05/14 | $0.133 | $0.182 |
The fund hereby designates as a capital gain dividend with respect to the taxable year ended July 31, 2014, $93,876,025, or, if subsequently determined to be different, the net capital gain of such year.
A total of 0.04% of the dividends distributed during the fiscal year was derived from interest on U.S. Government securities which is generally exempt from state income tax.
The fund will notify shareholders in January 2015 of amounts for use in preparing 2014 income tax returns.
Annual Report
Board Approval of Investment Advisory Contracts and Management Fees
Fidelity Real Estate Income Fund
Each year, the Board of Trustees, including the Independent Trustees (together, the Board), votes on the renewal of the management contract with Fidelity Management & Research Company (FMR) and the sub-advisory agreements (together, the Advisory Contracts) for the fund. The Board, assisted by the advice of fund counsel and Independent Trustees' counsel, requests and considers a broad range of information relevant to the renewal of the Advisory Contracts throughout the year.
The Board meets regularly and, at each of its meetings, covers an extensive agenda of topics and materials and considers factors that are relevant to its annual consideration of the renewal of the fund's Advisory Contracts, including the services and support provided to the fund and its shareholders. The Board has established various standing committees (Committees), each composed of and chaired by Independent Trustees with varying backgrounds, to which the Board has assigned specific subject matter responsibilities in order to enhance effective decision-making by the Board. The Board, acting directly and through its Committees, requests and receives information concerning the annual consideration of the renewal of the fund's Advisory Contracts. The Board also meets as needed to consider matters specifically related to the Board's annual consideration of the renewal of the Advisory Contracts. Members of the Board may also meet with trustees of other Fidelity funds through ad hoc joint committees to discuss certain matters relevant to the Fidelity funds.
At its July 2014 meeting, the Board, including the Independent Trustees, unanimously determined to renew the fund's Advisory Contracts. In reaching its determination, the Board considered all factors it believed relevant, including (i) the nature, extent, and quality of the services to be provided to the fund and its shareholders (including the investment performance of the fund); (ii) the competitiveness of the fund's management fee and total expense ratio relative to peer funds; (iii) the total costs of the services to be provided by and the profits to be realized by Fidelity from its relationship with the fund; (iv) the extent to which economies of scale exist and would be realized as the fund grows; and (v) whether fee levels reflect these economies of scale, if any, for the benefit of fund shareholders. In connection with separate internal corporate reorganizations involving Fidelity Management & Research (U.K.) Inc. (FMR U.K.) and Fidelity Management & Research (Japan) Inc. (FMR Japan), the Board approved certain non-material amendments to the fund's sub-advisory agreements with FMR U.K. and FMR Japan to reflect that, after these reorganizations, FMR Investment Management (UK) Limited and Fidelity Management & Research (Japan) Limited will carry on the business of FMR U.K. and FMR Japan, respectively. The Board noted that no changes to the portfolio managers or to the foreign research or investment advisory services provided to the fund were expected in connection with either reorganization and that the same personnel and resources would continue to be available to the fund at the new entities.
Annual Report
Board Approval of Investment Advisory Contracts and
Management Fees - continued
In considering whether to renew the Advisory Contracts for the fund, the Board reached a determination, with the assistance of fund counsel and Independent Trustees' counsel and through the exercise of its business judgment, that the renewal of the Advisory Contracts was in the best interests of the fund and its shareholders and that the compensation payable under the Advisory Contracts was fair and reasonable. The Board's decision to renew the Advisory Contracts was not based on any single factor, but rather was based on a comprehensive consideration of all the information provided to the Board at its meetings throughout the year. The Board, in reaching its determination to renew the Advisory Contracts, was aware that shareholders of the fund have a broad range of investment choices available to them, including a wide choice among funds offered by Fidelity's competitors, and that the fund's shareholders, who have the opportunity to review and weigh the disclosure provided by the fund in its prospectus and other public disclosures, have chosen to invest in this fund, which is part of the Fidelity family of funds.
Nature, Extent, and Quality of Services Provided. The Board considered Fidelity's staffing as it relates to the fund, including the backgrounds of investment personnel of FMR and the sub-advisers (together, the Investment Advisers), and also considered the fund's investment objective, strategies, and related investment philosophy. The Independent Trustees also had discussions with senior management of Fidelity's investment operations and investment groups. The Board considered the structure of the portfolio manager compensation program and whether this structure provides appropriate incentives to act in the best interests of the fund. Additionally, the Board considered the portfolio managers' investments, if any, in the funds that they manage.
Resources Dedicated to Investment Management and Support Services. The Board and the Fund Oversight and Research Committees reviewed the general qualifications and capabilities of Fidelity's investment staff, including its size, education, experience, and resources, as well as Fidelity's approach to recruiting, training, managing, and compensating investment personnel. The Board noted that Fidelity has continued to increase the resources devoted to non-U.S. offices, including expansion of Fidelity's global investment organization. The Board also noted that Fidelity's analysts have extensive resources, tools and capabilities that allow them to conduct sophisticated quantitative and fundamental analysis, as well as credit analysis of issuers, counterparties and guarantors. Further, the Board believes that Fidelity's investment professionals have sufficient access to global information and data so as to provide competitive investment results over time, and that those professionals also have access to sophisticated tools that permit them to assess portfolio construction and risk and performance attribution characteristics continuously, as well as to transmit new information and research conclusions rapidly around the world. Additionally, in its deliberations, the Board considered Fidelity's trading and risk management capabilities and resources and global compliance infrastructure, which are an integral part of the investment management process.
Annual Report
Shareholder and Administrative Services. The Board considered (i) the nature, extent, quality, and cost of advisory, administrative, and shareholder services performed by the Investment Advisers and their affiliates under the Advisory Contracts and under separate agreements covering transfer agency, pricing and bookkeeping, and securities lending services for the fund; (ii) the nature and extent of the supervision of third party service providers, principally custodians and subcustodians; and (iii) the resources devoted to, and the record of compliance with, the fund's compliance policies and procedures. The Board also reviewed the allocation of fund brokerage, including allocations to brokers affiliated with the Investment Advisers, the use of brokerage commissions to pay fund expenses, and the use of "soft" commission dollars to pay for research services.
The Board noted that the growth of fund assets over time across the complex allows Fidelity to reinvest in the development of services designed to enhance the value or convenience of the Fidelity funds as investment vehicles. These services include 24-hour access to account information and market information through telephone representatives and over the Internet, investor education materials and asset allocation tools, and the expanded availability of Fidelity Investor Centers.
In 2014, the Board formed an ad hoc Committee on Transfer Agency Fees to review the variety of transfer agency fee structures throughout the industry and Fidelity's competitive positioning with respect to industry participants.
Investment in a Large Fund Family. The Board considered the benefits to shareholders of investing in a Fidelity fund, including the benefits of investing in a fund that is part of a large family of funds offering a variety of investment disciplines and providing a large variety of mutual fund investor services. The Board noted that Fidelity had taken, or had made recommendations that resulted in the Fidelity funds taking, a number of actions over the previous year that benefited particular funds, including (i) continuing to dedicate additional resources to investment research and to the support of the senior management team that oversees asset management; (ii) persisting in efforts to enhance Fidelity's global research capabilities; (iii) launching new funds and making other enhancements to meet client needs for income-oriented solutions; (iv) reducing fund expenses for certain index funds; (v) continuing to launch dedicated lower cost underlying funds to meet portfolio construction needs related to expanding underlying fund options for Fidelity funds of funds, specifically for the Freedom Fund product lines; (vi) rationalizing product lines and gaining increased efficiencies through fund mergers; (vii) launching sector-based exchange-traded funds and establishing a new Fidelity adviser to manage sector-based funds and products; (viii) continuing to develop and implement technology to improve security and increase efficiency; (ix) modifying the eligibility criteria for certain share classes to increase their marketability to a portion of the defined contribution plan market; (x) waiving redemption fees for certain qualified fund-of-fund and wrap programs and certain retirement plan transactions; and (xi) launching new Institutional Class shares of certain money market funds to attract and retain assets and to fill a gap in the money market fund lineup.
Annual Report
Board Approval of Investment Advisory Contracts and
Management Fees - continued
Investment Performance. The Board considered whether the fund has operated in accordance with its investment objective, as well as its record of compliance with its investment restrictions and its performance history.
The Board took into account discussions with the Investment Advisers about fund investment performance that occur at Board meetings throughout the year. In this regard the Board noted that as part of regularly scheduled fund reviews and other reports to the Board on fund performance, the Board periodically considers annualized return information for the fund, for different time periods, measured against a securities market index ("benchmark index") and a peer group of funds with similar objectives ("peer group"). In its evaluation of fund investment performance, the Board gave particular attention to information indicating changes in performance of certain Fidelity funds for specific time periods and the Investment Advisers' explanations for any overperformance or underperformance.
In addition to reviewing absolute and relative fund performance, the Independent Trustees periodically consider the appropriateness of fund performance metrics in evaluating the results achieved. In general, the Independent Trustees believe that fund performance should be evaluated based on net performance (after fees and expenses) of both the highest performing and lowest performing classes, where applicable, compared to appropriate benchmark indices, over appropriate time periods which may include full market cycles, and compared to peer groups, as applicable, over the same periods, taking into account relevant factors including the following: general market conditions; issuer-specific information; tactical opportunities for investment; and fund cash flows and other factors.
The Independent Trustees recognize that shareholders evaluate performance on a net basis over their own holding periods, for which one-, three-, and five-year periods are often used as a proxy. For this reason, the performance information reviewed by the Board also included net cumulative calendar year total return information for the fund and an appropriate benchmark index and peer group for the most recent one-, three-, and five-year periods, as shown below. Returns are shown compared to the 25th percentile (top of box, 75% beaten) and 75th percentile (bottom of box, 25% beaten) of the peer universe.
Annual Report
Fidelity Real Estate Income Fund

Based on its review, the Board concluded that the nature, extent, and quality of services provided to the fund under the Advisory Contracts should benefit the fund's shareholders.
Competitiveness of Management Fee and Total Expense Ratio. The Board considered the fund's management fee and total expense ratio compared to "mapped groups" of competitive funds and classes. Fidelity creates "mapped groups" by combining similar Lipper investment objective categories that have comparable investment mandates. Combining Lipper investment objective categories aids the Board's management fee and total expense ratio comparisons by broadening the competitive group used for comparison and by reducing the number of universes to which various Fidelity funds are compared.
Management Fee. The Board considered two proprietary management fee comparisons for the 12-month periods shown in the chart below. The group of Lipper funds used by the Board for management fee comparisons is referred to below as the "Total Mapped Group." The Total Mapped Group is broader than the Lipper peer group used by the Board for performance comparisons because the Total Mapped Group combines several Lipper investment objective categories while the Lipper peer group does not. The Total Mapped Group comparison focuses on a fund's standing in terms of gross management fees before expense reimbursements or caps relative to the total universe of funds with comparable investment mandates, regardless of whether their management fee structures also are comparable. Funds with comparable investment mandates offer exposure to similar types of securities. Funds with comparable management fee structures have similar management fee contractual arrangements (e.g., flat rate charged for advisory services, all-inclusive fee rate, etc.). "TMG %" represents the percentage of funds in the Total Mapped Group that had management fees that were lower than the fund's. For example, a hypothetical TMG % of 20% would mean that 80% of the funds in the Total Mapped Group had higher, and 20% had lower, management fees than the fund. The fund's actual TMG %s are in the chart below. The "Asset-Size Peer Group" (ASPG) comparison focuses on a fund's standing relative to a subset of non-Fidelity funds within the Total Mapped Group that are similar in size and management fee structure. For example, if a fund is in the first quartile of the ASPG, the fund's management fee ranks in the least expensive or lowest 25% of funds in the ASPG. The ASPG represents at least 15% of the funds in the Total Mapped Group with comparable asset size and management fee structures, subject to a minimum of 50 funds (or all funds in the Total Mapped Group if fewer than 50). Additional information, such as the ASPG quartile in which the fund's management fee rate ranked, is also included in the chart and considered by the Board.
Annual Report
Board Approval of Investment Advisory Contracts and
Management Fees - continued
Fidelity Real Estate Income Fund
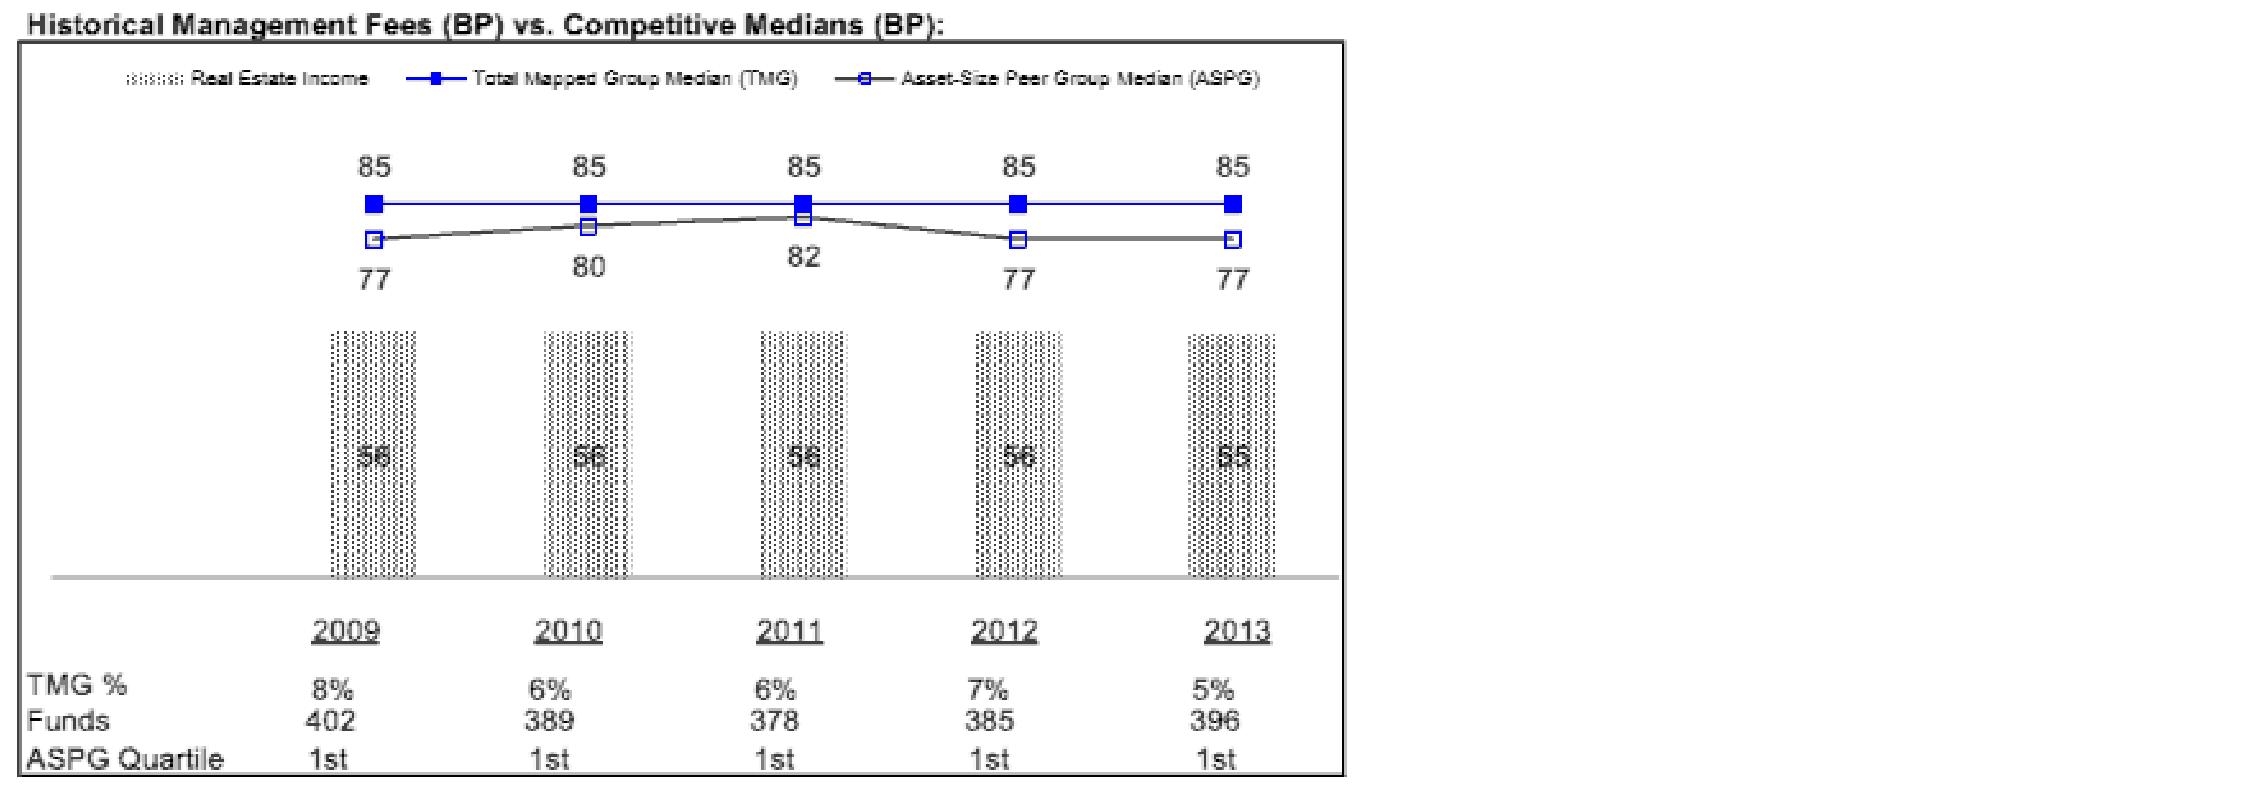
The Board noted that the fund's management fee rate ranked below the median of its Total Mapped Group and below the median of its ASPG for 2013.
The Board also noted that, in August 2013, the ad hoc Committee on Management Fees was formed to conduct an in-depth review of the management fee rates of Fidelity's active equity mutual funds. The Committee focused on the following areas: (i) standard fee structures; (ii) research consumption and trading evolution; (iii) management fee competitiveness/profitability by category; and (iv) factors that drive institutional pricing.
Based on its review, the Board concluded that the fund's management fee is fair and reasonable in light of the services that the fund receives and the other factors considered.
Annual Report
Total Expense Ratio. In its review of each class's total expense ratio, the Board considered the fund's management fee as well as other fund or class expenses, as applicable, such as transfer agent fees, pricing and bookkeeping fees, fund-paid 12b-1 fees, and custodial, legal, and audit fees. The Board also noted the effects of any waivers and reimbursements on fees and expenses. As part of its review, the Board also considered the current and historical total expense ratios of each class of the fund compared to competitive fund median expenses. Each class of the fund is compared to those funds and classes in the Total Mapped Group (used by the Board for management fee comparisons) that have a similar sales load structure.
The Board noted that the total expense ratio of each class ranked below its competitive median for 2013.
Fees Charged to Other Fidelity Clients. The Board also considered Fidelity fee structures and other information with respect to clients of Fidelity, such as other funds advised or subadvised by Fidelity, pension plan clients, and other institutional clients. The Board noted the findings of the 2013 ad hoc joint committee (created with the board of other Fidelity funds), which reviewed and compared Fidelity's institutional investment advisory business with its business of providing services to the Fidelity funds, including the differences in services provided, fees charged, and costs incurred, as well as competition in their respective marketplaces.
Based on its review of total expense ratios and fees charged to other Fidelity clients, the Board concluded that the total expense ratio of each class of the fund was reasonable in light of the services that the fund and its shareholders receive and the other factors considered.
Costs of the Services and Profitability. The Board considered the revenues earned and the expenses incurred by Fidelity in conducting the business of developing, marketing, distributing, managing, administering and servicing the fund and servicing the fund's shareholders. The Board also considered the level of Fidelity's profits in respect of all the Fidelity funds.
On an annual basis, Fidelity presents to the Board Fidelity's profitability for the fund. Fidelity calculates the profitability for each fund, as well as aggregate profitability for groups of Fidelity funds and all Fidelity funds, using a series of detailed revenue and cost allocation methodologies which originate with the books and records of Fidelity on which Fidelity's audited financial statements are based. The Audit Committee of the Board reviews any significant changes from the prior year's methodologies.
PricewaterhouseCoopers LLP (PwC), independent registered public accounting firm and auditor to Fidelity and certain Fidelity funds, has been engaged annually by the Board as part of the Board's assessment of Fidelity's profitability analysis. PwC's engagement includes the review and assessment of the methodologies used by Fidelity in determining the revenues and expenses attributable to Fidelity's mutual fund business, and completion of agreed-upon procedures in respect of the mathematical accuracy of fund profitability and its conformity to established allocation methodologies. After considering PwC's reports issued under the engagement and information provided by Fidelity, the Board concluded that while other allocation methods may also be reasonable, Fidelity's profitability methodologies are reasonable in all material respects.
Annual Report
Board Approval of Investment Advisory Contracts and
Management Fees - continued
The Board also reviewed Fidelity's non-fund businesses and fall-out benefits related to the mutual fund business as well as cases where Fidelity's affiliates may benefit from or be related to the fund's business.
The Board considered the costs of the services provided by and the profits realized by Fidelity in connection with the operation of the fund and was satisfied that the profitability was not excessive in the circumstances.
Economies of Scale. The Board considered whether there have been economies of scale in respect of the management of the Fidelity funds, whether the Fidelity funds (including the fund) have appropriately benefited from any such economies of scale, and whether there is potential for realization of any further economies of scale. The Board considered the extent to which the fund will benefit from economies of scale through increased services to the fund, through waivers or reimbursements, or through fee or expense ratio reductions. The Board also noted that in 2013, it and the boards of other Fidelity funds created an ad hoc committee (the Economies of Scale Committee) to analyze whether Fidelity attains economies of scale in respect of the management and servicing of the Fidelity funds, whether the Fidelity funds have appropriately benefited from such economies of scale, and whether there is potential for realization of any further economies of scale.
The Board recognized that the fund's management contract incorporates a "group fee" structure, which provides for lower group fee rates as total group assets increase, and for higher group fee rates as total group assets decrease (with "group assets" defined to include fund assets under FMR's management plus sector fund assets previously under FMR's management and currently managed by Fidelity SelectCo, LLC). FMR calculates the group fee rates based on a tiered asset "breakpoint" schedule that varies based on asset class. The Board considered that the group fee is designed to deliver the benefits of economies of scale to fund shareholders when total Fidelity fund assets increase, even if assets of any particular fund are unchanged or have declined, because some portion of Fidelity's costs are attributable to services provided to all Fidelity funds, and all funds benefit if those costs can be allocated among more assets. The Board concluded that, given the group fee structure, fund shareholders will benefit from lower management fees as group assets increase at the fund complex level, regardless of whether Fidelity achieves any such economies of scale.
Annual Report
The Board concluded, taking into account the analysis of the Economies of Scale Committee, that economies of scale, if any, are being appropriately shared between fund shareholders and Fidelity.
Additional Information Requested by the Board. In order to develop fully the factual basis for consideration of the Fidelity funds' Advisory Contracts, the Board requested and received additional information on certain topics, including: (i) fund performance trends and Fidelity's long-term strategies for certain funds; (ii) Fidelity's strategic marketing and product lineup goals; (iii) the methodology with respect to competitive fund data and peer group classifications; (iv) the arrangements with, and performance of, certain sub-advisers on behalf of the Fidelity funds, as well as certain proposed participating affiliate arrangements; (v) the realization of fall-out benefits in certain Fidelity business units; (vi) Fidelity's group fee structures, including the rationale for the individual fee rates of certain categories of funds and the definition of group assets; (vii) trends regarding industry use of performance fee structures and the performance adjustment methodologies applicable to the Fidelity funds; (viii) additional competitive analysis regarding the total expenses for certain classes; (ix) fund profitability methodology, including Fidelity's cost allocation methodology, and the impact of certain factors on fund profitability results; and (x) the process by which Fidelity determines sub-advisory fees for funds it advises.
Based on its evaluation of all of the conclusions noted above, and after considering all factors it believed relevant, the Board ultimately concluded that the advisory fee structures are fair and reasonable, and that the fund's Advisory Contracts should be renewed.
Annual Report
Investment Adviser
Fidelity Management & Research Company
Boston, MA
Investment Sub-Advisers
FMR Co., Inc.
Fidelity Management & Research
(Hong Kong) Limited
Fidelity Management & Research
(Japan) Inc.
Fidelity Management & Research
(U.K.) Inc.
General Distributor
Fidelity Distributors Corporation
Smithfield, RI
Transfer and Service Agents
Fidelity Investments Institutional
Operations Company, Inc.
Boston, MA
Fidelity Service Company, Inc.
Boston, MA
Custodian
Citibank, N.A.
New York, NY
(Fidelity Investment logo)(registered trademark)
REII-UANN-0914
1.907540.104
(Fidelity Investment logo)(registered trademark)
Fidelity Advisor®
Real Estate Income
Fund - Class A, Class T, and Class C
Annual Report
July 31, 2014
(Fidelity Cover Art)
Class A, Class T, and
Class C are classes of Fidelity® Real Estate Income Fund
Contents
Performance | (Click Here) | How the fund has done over time. |
Management's Discussion of Fund Performance | (Click Here) | The Portfolio Manager's review of fund performance and strategy. |
Shareholder Expense Example | (Click Here) | An example of shareholder expenses. |
Investment Changes | (Click Here) | A summary of major shifts in the fund's investments over the past six months. |
Investments | (Click Here) | A complete list of the fund's investments with their market values. |
Financial Statements | (Click Here) | Statements of assets and liabilities, operations, and changes in net assets, as well as financial highlights. |
Notes | (Click Here) | Notes to the financial statements. |
Report of Independent Registered Public Accounting Firm | (Click Here) | |
Trustees and Officers | (Click Here) | |
Distributions | (Click Here) | |
Board Approval of Investment Advisory Contracts and Management Fees | (Click Here) | |
To view a fund's proxy voting guidelines and proxy voting record for the 12-month period ended June 30, visit http://www.fidelity.com/proxyvotingresults or visit the Securities and Exchange Commission's (SEC) web site at http://www.sec.gov. You may also call 1-877-208-0098 to request a free copy of the proxy voting guidelines.
Standard & Poor's, S&P and S&P 500 are registered service marks of The McGraw-Hill Companies, Inc. and have been licensed for use by Fidelity Distributors Corporation.
Other third-party marks appearing herein are the property of their respective owners.
All other marks appearing herein are registered or unregistered trademarks or service marks of FMR LLC or an affiliated company. © 2014 FMR LLC. All rights reserved.
Annual Report
This report and the financial statements contained herein are submitted for the general information of the shareholders of the fund. This report is not authorized for distribution to prospective investors in the fund unless preceded or accompanied by an effective prospectus.
A fund files its complete schedule of portfolio holdings with the SEC for the first and third quarters of each fiscal year on Form N-Q. Forms N-Q are available on the SEC's web site at http://www.sec.gov. A fund's Forms N-Q may be reviewed and copied at the SEC's Public Reference Room in Washington, DC. Information regarding the operation of the SEC's Public Reference Room may be obtained by calling 1-800-SEC-0330. For a complete list of a fund's portfolio holdings, view the most recent holdings listing, semiannual report, or annual report on Fidelity's web site at http://www.fidelity.com, http://www.advisor.fidelity.com, or http://www.401k.com, as applicable.
NOT FDIC INSURED • MAY LOSE VALUE • NO BANK GUARANTEE
Neither the fund nor Fidelity Distributors Corporation is a bank.
Annual Report
Average annual total return reflects the change in the value of an investment, assuming reinvestment of the class' distributions from dividend income and capital gains (the profits earned upon the sale of securities that have grown in value, if any) and assuming a constant rate of performance each year. The $10,000 table and the fund's returns do not reflect the deduction of taxes that a shareholder would pay on fund distributions or the redemption of fund shares. During periods of reimbursement by Fidelity, a fund's total return will be greater than it would be had the reimbursement not occurred. How a fund did yesterday is no guarantee of how it will do tomorrow.
Average Annual Total Returns
Periods ended July 31, 2014 | Past 1
year | Past 5
years | Past 10
years |
Class A (incl. 4.00% sales charge) A | 4.15% | 13.19% | 6.69% |
Class T (incl. 4.00% sales charge) B | 4.11% | 13.16% | 6.68% |
Class C (incl. contingent deferred sales charge)C | 6.66% | 13.38% | 6.78% |
A Class A shares bear a 0.25% 12b-1 fee. The initial offering of Class A shares took place on April 14, 2010. Returns prior to April 14, 2010 are those of Fidelity® Real Estate Income Fund, the original class of the fund, which has no 12b-1 fee. Had Class A's 12b-1 fee been reflected, returns prior to April 14, 2010 would have been lower.
B Class T shares bear a 0.25% 12b-1 fee. The initial offering of Class T shares took place on April 14, 2010. Returns prior to April 14, 2010 are those of Fidelity® Real Estate Income Fund, the original class of the fund, which has no 12b-1 fee. Had Class T's 12b-1 fee been reflected, returns prior to April 14, 2010 would have been lower.
C Class C shares bear a 1.00% 12b-1 fee. The initial offering of Class C shares took place on April 14, 2010. Returns prior to April 14, 2010 are those of Fidelity Real Estate Income Fund, the original class of the fund, which has no 12b-1 fee. Had Class C's 12b-1 fee been reflected, returns prior to April 14, 2010 would have been lower. Class C shares' contingent deferred sales charges included in the past one year, past five years, and past ten years total return figures are 1%, 0%, and 0%, respectively.
Annual Report
$10,000 Over 10 Years
Let's say hypothetically that $10,000 was invested in Fidelity Advisor® Real Estate Income Fund - Class A on July 31, 2004, and the current 4.00% sales charge was paid. The chart shows how the value of your investment would have changed, and also shows how the S&P 500® Index performed over the same period. See footnote A on the previous page for additional information regarding the performance of Class A.

Annual Report
Market Recap: The fundamental backdrop for commercial real estate remained solid throughout the 12 months ending July 31, 2014. Continued favorable demand across most sectors and geographic markets, along with limited new construction, led to rising occupancies. In turn, this led to gently rising rents and cash flow for real estate owners, including real estate investment trusts (REITs). Investors' continued search for yield in a low-interest-rate environment - rates ended the 12-month period roughly at their starting point - helped further boost the performance of multiple types of real estate securities. For the full 12 months, REIT stocks, as measured by the FTSE® NAREIT® All REITs Index, gained 12.90%, with the vast majority of that increase coming in the second half of the period. The MSCI REIT Preferred Index, which reflects the performance of real estate preferred stocks, added 9.62%. On the fixed-income side, The BofA Merrill LynchSM US Real Estate Index - a market-capitalization-weighted measure of investment-grade corporate debt in the domestic real estate sector - advanced 6.67%, benefiting partly from narrowing credit spreads that helped compensate for rising interest rates in the first half of the 12-month period. In comparison, the S&P 500® Index, a proxy for the broad U.S. stock market, was up 16.94%.
Comments from Mark Snyderman, Portfolio Manager of Fidelity Advisor® Real Estate Income Fund: For the year, the fund's Class A, Class T and Class C shares returned 8.49%, 8.44% and 7.66%, respectively (excluding sales charges), which I consider good absolute returns for a 12-month period. In comparison, however, the Fidelity Real Estate Income Composite IndexSM - a 40/40/20 blend of the MSCI REIT Preferred Index, The BofA Merrill LynchSM US Real Estate Index and the FTSE® NAREIT® All REITs Index, respectively - added 9.17%. Most of the categories in which the fund invests did well. The fund's REIT common stock holdings essentially matched the 13% gain in the FTSE® NAREIT® index. Its preferred stocks added about 11%, outpacing the MSCI preferred stock index. On the portfolio's fixed-income side, the fund did particularly well with its commercial mortgage backed securities investments, which rose roughly 11%, compared with approximately 7% for the BofA Merrill Lynch real estate bond index. The fund's high-yield real estate bond picks modestly outpaced this measure, while its investment-grade bonds lagged. Meanwhile, the fund was hampered by a cash position of 8%, on average. I like to hold enough cash to take advantage of attractive buying opportunities when others must sell; unfortunately, the size of the portfolio's stake here was a drag on results in a rising market during the period.
The views expressed above reflect those of the portfolio manager(s) only through the end of the period as stated on the cover of this report and do not necessarily represent the views of Fidelity or any other person in the Fidelity organization. Any such views are subject to change at any time based upon market or other conditions and Fidelity disclaims any responsibility to update such views. These views may not be relied on as investment advice and, because investment decisions for a Fidelity fund are based on numerous factors, may not be relied on as an indication of trading intent on behalf of any Fidelity fund.
Annual Report
Shareholder Expense Example
As a shareholder of the Fund, you incur two types of costs: (1) transaction costs, including sales charges (loads) on purchase payments or redemption proceeds, redemption fees and (2) ongoing costs, including management fees, distribution and/or service (12b-1) fees and other Fund expenses. This Example is intended to help you understand your ongoing costs (in dollars) of investing in the Fund and to compare these costs with the ongoing costs of investing in other mutual funds.
The Example is based on an investment of $1,000 invested at the beginning of the period and held for the entire period (February 1, 2014 to July 31, 2014).
Actual Expenses
The first line of the accompanying table for each class of the Fund provides information about actual account values and actual expenses. You may use the information in this line, together with the amount you invested, to estimate the expenses that you paid over the period. Simply divide your account value by $1,000.00 (for example, an $8,600 account value divided by $1,000.00 = 8.6), then multiply the result by the number in the first line for a class of the Fund under the heading entitled "Expenses Paid During Period" to estimate the expenses you paid on your account during this period. A small balance maintenance fee of $12.00 that is charged once a year may apply for certain accounts with a value of less than $2,000. This fee is not included in the table below. If it was, the estimate of expenses you paid during the period would be higher, and your ending account value lower, by this amount. In addition, the Fund, as a shareholder in the underlying Fidelity Central Funds, will indirectly bear its pro-rata share of the fees and expenses incurred by the underlying Fidelity Central Funds. These fees and expenses are not included in the Fund's annualized expense ratio used to calculate the expense estimate in the table below.
Hypothetical Example for Comparison Purposes
The second line of the accompanying table for each class of the Fund provides information about hypothetical account values and hypothetical expenses based on a Class' actual expense ratio and an assumed rate of return of 5% per year before expenses, which is not the Class' actual return. The hypothetical account values and expenses may not be used to estimate the actual ending account balance or expenses you paid for the period. You may use this information to compare the ongoing costs of investing in the Fund and other funds. To do so, compare this 5% hypothetical example with the 5% hypothetical examples that appear in the shareholder reports of the other funds. A small balance maintenance fee of $12.00 that is charged once a year may apply for certain accounts with a value of less than $2,000. This fee is not included in the table below. If it was, the estimate of expenses you paid during the period would be higher, and your ending account value lower, by this amount. In addition, the Fund, as a shareholder in the underlying Fidelity Central Funds, will indirectly bear its pro-rata share of the fees and expenses incurred by the underlying Fidelity Central Funds. These fees and expenses are not included in the Fund's annualized expense ratio used to calculate the expense estimate in the table below.
Please note that the expenses shown in the table are meant to highlight your ongoing costs only and do not reflect any transaction costs. Therefore, the second line of the table is useful in comparing ongoing costs only, and will not help you determine the relative total costs of owning different funds. In addition, if these transactional costs were included, your costs would have been higher.
Annual Report
| Annualized
Expense RatioB | Beginning
Account Value
February 1, 2014 | Ending
Account Value
July 31, 2014 | Expenses Paid
During Period*
February 1, 2014
to July 31, 2014 |
Class A | 1.05% | | | |
Actual | | $ 1,000.00 | $ 1,065.30 | $ 5.38 |
HypotheticalA | | $ 1,000.00 | $ 1,019.59 | $ 5.26 |
Class T | 1.08% | | | |
Actual | | $ 1,000.00 | $ 1,065.10 | $ 5.53 |
HypotheticalA | | $ 1,000.00 | $ 1,019.44 | $ 5.41 |
Class C | 1.79% | | | |
Actual | | $ 1,000.00 | $ 1,061.70 | $ 9.15 |
HypotheticalA | | $ 1,000.00 | $ 1,015.92 | $ 8.95 |
Real Estate Income | .83% | | | |
Actual | | $ 1,000.00 | $ 1,066.80 | $ 4.25 |
HypotheticalA | | $ 1,000.00 | $ 1,020.68 | $ 4.16 |
Institutional Class | .78% | | | |
Actual | | $ 1,000.00 | $ 1,066.30 | $ 4.00 |
HypotheticalA | | $ 1,000.00 | $ 1,020.93 | $ 3.91 |
A 5% return per year before expenses
B Annualized expense ratio reflects expenses net of applicable fee waivers.
* Expenses are equal to each Class' annualized expense ratio, multiplied by the average account value over the period, multiplied by 181/365 (to reflect the one-half year period).
Annual Report
Investment Changes (Unaudited)
Top Five Stocks as of July 31, 2014 |
| % of fund's
net assets | % of fund's net assets
6 months ago |
MFA Financial, Inc. | 3.2 | 3.0 |
Equity Lifestyle Properties, Inc. | 2.7 | 2.7 |
Acadia Realty Trust (SBI) | 2.4 | 2.2 |
Ventas, Inc. | 1.6 | 1.7 |
Lexington Corporate Properties Trust | 1.1 | 1.0 |
| 11.0 | |
Top 5 Bonds as of July 31, 2014 |
| % of fund's
net assets | % of fund's net assets
6 months ago |
Realogy Group LLC Tranche B, term loan 3.75% 3/5/20 | 0.9 | 0.8 |
Standard Pacific Corp. 8.375% 5/15/18 | 0.8 | 0.9 |
Annaly Capital Management, Inc. 5% 5/15/15 | 0.8 | 0.9 |
Hilton Worldwide Finance, LLC Tranche B, term loan 3.5% 10/25/20 | 0.7 | 0.3 |
iStar Financial, Inc. 5.875% 3/15/16 | 0.7 | 1.0 |
| 3.9 | |
Top Five REIT Sectors as of July 31, 2014 |
| % of fund's
net assets | % of fund's net assets
6 months ago |
REITs - Mortgage | 17.3 | 16.0 |
REITs - Management/Investment | 9.0 | 8.9 |
REITs - Health Care Facilities | 6.9 | 6.1 |
REITs - Shopping Centers | 6.3 | 6.1 |
REITs - Apartments | 4.9 | 5.0 |
Asset Allocation (% of fund's net assets) |
As of July 31, 2014* | As of January 31, 2014** |
| Common Stocks 31.4% | | | Common Stocks 31.6% | |
| Preferred Stocks 16.7% | | | Preferred Stocks 14.5% | |
| Bonds 32.8% | | | Bonds 34.3% | |
| Convertible
Securities 4.5% | | | Convertible
Securities 4.0% | |
| Other Investments 7.8% | | | Other Investments 8.6% | |
| Short-Term
Investments and
Net Other Assets
(Liabilities) 6.8% | | | Short-Term
Investments and
Net Other Assets
(Liabilities) 7.0% | |
* Foreign investments | 2.6% | | ** Foreign investments | 3.2% | |

Annual Report
Investments July 31, 2014
Showing Percentage of Net Assets
Common Stocks - 31.4% |
| Shares | | Value |
CONSUMER DISCRETIONARY - 0.2% |
Household Durables - 0.2% |
Stanley Martin Communities LLC Class B (a)(m) | 4,620 | | $ 6,928,291 |
Media - 0.0% |
New Media Investment Group, Inc. | 2 | | 30 |
TOTAL CONSUMER DISCRETIONARY | | 6,928,321 |
FINANCIALS - 31.0% |
Capital Markets - 0.5% |
Ellington Financial LLC | 950,100 | | 22,517,370 |
Real Estate Investment Trusts - 29.8% |
Acadia Realty Trust (SBI) (g) | 3,500,149 | | 98,809,206 |
AG Mortgage Investment Trust, Inc. | 781,700 | | 14,336,378 |
American Tower Corp. | 184,300 | | 17,396,077 |
Annaly Capital Management, Inc. | 826,600 | | 9,175,260 |
Anworth Mortgage Asset Corp. | 1,572,210 | | 7,986,827 |
Apartment Investment & Management Co. Class A | 1,268,100 | | 43,343,658 |
Arbor Realty Trust, Inc. (g) | 3,068,975 | | 21,697,653 |
Associated Estates Realty Corp. | 224,208 | | 3,961,755 |
AvalonBay Communities, Inc. | 191,400 | | 28,342,512 |
BioMed Realty Trust, Inc. | 1,058,200 | | 22,751,300 |
Blackstone Mortgage Trust, Inc. | 75,200 | | 2,140,944 |
Boardwalk (REIT) | 126,200 | | 7,511,698 |
Canadian (REIT) | 131,600 | | 5,524,219 |
CBL & Associates Properties, Inc. | 2,202,873 | | 41,193,725 |
Cedar Shopping Centers, Inc. | 1,208,910 | | 7,616,133 |
Chambers Street Properties | 1,457,593 | | 11,340,074 |
Chartwell Retirement Residence | 459,700 | | 4,553,364 |
Chartwell Retirement Residence (a)(h) | 78,500 | | 777,548 |
CYS Investments, Inc. | 2,094,739 | | 18,601,282 |
Douglas Emmett, Inc. | 689,600 | | 19,646,704 |
Dynex Capital, Inc. | 1,989,943 | | 16,516,527 |
EastGroup Properties, Inc. | 101,500 | | 6,329,540 |
Ellington Residential Mortgage REIT | 260,000 | | 4,238,000 |
Equity Lifestyle Properties, Inc. | 2,511,560 | | 111,236,992 |
Equity Residential (SBI) | 306,700 | | 19,828,155 |
Excel Trust, Inc. | 1,742,628 | | 22,567,033 |
Extra Space Storage, Inc. | 155,200 | | 8,028,496 |
First Potomac Realty Trust | 1,381,615 | | 18,223,502 |
Five Oaks Investment Corp. | 400,000 | | 4,424,000 |
H&R REIT/H&R Finance Trust | 375,100 | | 7,957,136 |
Hatteras Financial Corp. | 685,100 | | 13,119,665 |
Common Stocks - continued |
| Shares | | Value |
FINANCIALS - continued |
Real Estate Investment Trusts - continued |
Highwoods Properties, Inc. (SBI) | 139,400 | | $ 5,864,558 |
Lexington Corporate Properties Trust | 4,174,382 | | 45,667,739 |
Liberty Property Trust (SBI) | 192,300 | | 6,763,191 |
LTC Properties, Inc. | 452,913 | | 17,360,155 |
MFA Financial, Inc. | 16,292,993 | | 132,624,945 |
Mid-America Apartment Communities, Inc. | 612,400 | | 42,819,008 |
Monmouth Real Estate Investment Corp. Class A (f) | 1,197,173 | | 12,306,938 |
National Retail Properties, Inc. | 232,200 | | 8,259,354 |
Newcastle Investment Corp. | 4,850,400 | | 21,681,288 |
NorthStar Realty Finance Corp. | 377,400 | | 6,076,140 |
Piedmont Office Realty Trust, Inc. Class A | 850,200 | | 16,536,390 |
Potlatch Corp. | 40,500 | | 1,672,650 |
Prologis, Inc. | 499,487 | | 20,384,064 |
Redwood Trust, Inc. (f) | 555,100 | | 10,535,798 |
Select Income (REIT) | 456,300 | | 12,662,325 |
Senior Housing Properties Trust (SBI) | 1,562,300 | | 35,714,178 |
Simon Property Group, Inc. | 171,600 | | 28,861,404 |
Stag Industrial, Inc. | 321,769 | | 7,349,204 |
Terreno Realty Corp. | 1,484,064 | | 27,751,997 |
Two Harbors Investment Corp. | 1,721,280 | | 17,608,694 |
Ventas, Inc. | 1,025,546 | | 65,122,171 |
Washington Prime Group, Inc. (a) | 442,350 | | 8,355,992 |
Washington REIT (SBI) | 426,700 | | 11,572,104 |
Weyerhaeuser Co. (f) | 741,400 | | 23,220,648 |
WP Carey, Inc. | 597,900 | | 39,299,967 |
| | 1,245,246,265 |
Real Estate Management & Development - 0.7% |
Brookfield Asset Management, Inc. Class A | 257,600 | | 11,491,415 |
Kennedy-Wilson Holdings, Inc. | 664,021 | | 15,538,091 |
| | 27,029,506 |
TOTAL FINANCIALS | | 1,294,793,141 |
Common Stocks - continued |
| Shares | | Value |
MATERIALS - 0.2% |
Paper & Forest Products - 0.2% |
West Fraser Timber Co. Ltd. | 231,400 | | $ 10,541,237 |
TOTAL COMMON STOCKS (Cost $1,148,245,642) |
1,312,262,699
|
Preferred Stocks - 17.6% |
| | | |
Convertible Preferred Stocks - 0.9% |
FINANCIALS - 0.9% |
Real Estate Investment Trusts - 0.9% |
Alexandria Real Estate Equities, Inc. Series D 7.00% | 195,000 | | 5,313,750 |
Excel Trust, Inc. 7.00% (h) | 248,200 | | 6,515,250 |
Health Care REIT, Inc. Series I, 6.50% | 46,800 | | 2,737,800 |
Lexington Corporate Properties Trust Series C, 6.50% | 396,880 | | 18,712,892 |
Ramco-Gershenson Properties Trust (SBI) Series D, 7.25% | 40,000 | | 2,451,600 |
Weyerhaeuser Co. Series A, 6.375% | 20,000 | | 1,080,624 |
| | 36,811,916 |
Nonconvertible Preferred Stocks - 16.7% |
CONSUMER DISCRETIONARY - 0.1% |
Hotels, Restaurants & Leisure - 0.1% |
Red Lion Hotels Capital Trust 9.50% | 143,030 | | 3,727,362 |
FINANCIALS - 16.6% |
Capital Markets - 0.1% |
Arlington Asset Investment Corp. 6.625% | 182,517 | | 4,409,611 |
Real Estate Investment Trusts - 16.3% |
AG Mortgage Investment Trust, Inc. 8.00% | 461,387 | | 11,082,516 |
Alexandria Real Estate Equities, Inc. Series E, 6.45% | 145,913 | | 3,687,222 |
American Capital Agency Corp.: | | | |
8.00% | 200,000 | | 5,170,000 |
Series B, 7.75% | 360,200 | | 8,785,278 |
American Capital Mortgage Investment Corp. Series A, 8.125% | 248,636 | | 6,243,250 |
American Home Mortgage Investment Corp.: | | | |
Series A, 9.375% (a) | 120,300 | | 12 |
Series B, 9.25% (a) | 124,100 | | 12 |
American Homes 4 Rent: | | | |
Series A, 5.00% | 224,979 | | 5,579,479 |
Series B, 5.00% | 149,525 | | 3,645,420 |
Preferred Stocks - continued |
| Shares | | Value |
Nonconvertible Preferred Stocks - continued |
FINANCIALS - continued |
Real Estate Investment Trusts - continued |
American Homes 4 Rent: - continued | | | |
Series C, 5.50% | 485,000 | | $ 12,008,600 |
American Realty Capital Properties, Inc. Series F, 6.70% | 300,409 | | 6,984,509 |
Annaly Capital Management, Inc.: | | | |
Series A, 7.875% | 134,900 | | 3,419,715 |
Series C, 7.625% | 162,837 | | 3,974,851 |
Series D, 7.50% | 310,731 | | 7,497,939 |
Anworth Mortgage Asset Corp. Series A, 8.625% | 309,630 | | 7,836,735 |
Apollo Commercial Real Estate Finance, Inc. Series A, 8.625% | 375,101 | | 9,876,409 |
Apollo Residential Mortgage, Inc. Series A, 8.00% | 279,276 | | 6,758,479 |
Arbor Realty Trust, Inc.: | | | |
7.375% (a)(g) | 330,605 | | 8,162,637 |
Series A, 8.25% (g) | 189,089 | | 4,727,225 |
Series B, 7.75% (g) | 240,000 | | 5,882,400 |
Series C, 8.50% (g) | 100,000 | | 2,525,000 |
Armour Residential REIT, Inc. Series B, 7.875% | 153,654 | | 3,727,646 |
Ashford Hospitality Trust, Inc.: | | | |
Series D, 8.45% | 47,000 | | 1,200,850 |
Series E, 9.00% | 140,751 | | 3,814,352 |
Boston Properties, Inc. 5.25% | 10,915 | | 256,503 |
Brandywine Realty Trust Series E, 6.90% | 95,000 | | 2,512,750 |
Campus Crest Communities, Inc. Series A, 8.00% | 248,431 | | 6,372,255 |
Capstead Mortgage Corp. Series E, 7.50% | 202,984 | | 4,885,622 |
CBL & Associates Properties, Inc.: | | | |
Series D, 7.375% | 289,876 | | 7,261,394 |
Series E, 6.625% | 197,063 | | 4,812,278 |
Cedar Shopping Centers, Inc. Series B, 7.25% | 399,750 | | 10,185,630 |
CenterPoint Properties Trust Series D, 5.377% | 3,575 | | 2,609,750 |
Chesapeake Lodging Trust Series A, 7.75% | 266,916 | | 6,985,192 |
Colony Financial, Inc.: | | | |
Series A, 8.50% | 282,171 | | 7,378,772 |
Series B, 7.50% | 80,000 | | 1,944,800 |
CommonWealth REIT: | | | |
7.50% | 93,300 | | 1,893,057 |
Series E, 7.25% | 648,952 | | 16,846,794 |
Coresite Realty Corp. Series A, 7.25% | 369,799 | | 9,481,646 |
Corporate Office Properties Trust Series L, 7.375% | 161,840 | | 4,212,695 |
CubeSmart Series A, 7.75% | 40,000 | | 1,065,200 |
Preferred Stocks - continued |
| Shares | | Value |
Nonconvertible Preferred Stocks - continued |
FINANCIALS - continued |
Real Estate Investment Trusts - continued |
CYS Investments, Inc.: | | | |
Series A, 7.75% | 117,824 | | $ 2,880,797 |
Series B, 7.50% | 446,667 | | 10,527,941 |
DDR Corp.: | | | |
Series J, 6.50% | 340,721 | | 8,575,948 |
Series K, 6.25% | 228,888 | | 5,594,023 |
Digital Realty Trust, Inc.: | | | |
Series E, 7.00% | 219,819 | | 5,585,601 |
Series G, 5.875% | 145,444 | | 3,217,221 |
Series H, 7.375% | 50,000 | | 1,277,500 |
Duke Realty LP Series L, 6.60% | 10,666 | | 270,383 |
DuPont Fabros Technology, Inc. Series B, 7.625% | 381,202 | | 9,686,343 |
Dynex Capital, Inc.: | | | |
Series A, 8.50% | 362,932 | | 9,073,300 |
Series B, 7.625% | 252,120 | | 6,048,359 |
Equity Lifestyle Properties, Inc. Series C, 6.75% | 950,148 | | 24,504,317 |
Essex Property Trust, Inc. Series H, 7.125% | 40,000 | | 1,068,000 |
Excel Trust, Inc. Series B, 8.125% | 400,000 | | 10,428,000 |
First Potomac Realty Trust 7.75% | 415,296 | | 10,859,990 |
Five Oaks Investment Corp. Series A, 8.75% | 100,000 | | 2,517,000 |
General Growth Properties, Inc. Series A, 6.375% | 166,463 | | 4,028,405 |
Gladstone Commercial Corp. Series C, 7.125% | 232,238 | | 5,996,385 |
Glimcher Realty Trust: | | | |
6.875% | 256,115 | | 6,472,026 |
Series G, 8.125% | 109,192 | | 2,759,282 |
Series H, 7.50% | 198,527 | | 5,360,229 |
Hatteras Financial Corp. Series A, 7.625% | 353,288 | | 8,372,926 |
Health Care REIT, Inc. Series J, 6.50% | 81,600 | | 2,098,752 |
Hersha Hospitality Trust: | | | |
Series B, 8.00% | 162,538 | | 4,320,260 |
Series C, 6.875% | 50,000 | | 1,267,000 |
Hospitality Properties Trust Series D, 7.125% | 40,800 | | 1,039,584 |
Hudson Pacific Properties, Inc. 8.375% | 394,069 | | 10,442,829 |
Inland Real Estate Corp. Series A, 8.125% | 423,500 | | 11,032,175 |
Invesco Mortgage Capital, Inc. Series A, 7.75% | 123,342 | | 3,004,611 |
Investors Real Estate Trust Series B, 7.95% | 126,572 | | 3,319,984 |
iStar Financial, Inc.: | | | |
Series E, 7.875% | 188,696 | | 4,692,870 |
Series F, 7.80% | 393,843 | | 9,727,922 |
Preferred Stocks - continued |
| Shares | | Value |
Nonconvertible Preferred Stocks - continued |
FINANCIALS - continued |
Real Estate Investment Trusts - continued |
Kilroy Realty Corp.: | | | |
Series G, 6.875% | 46,760 | | $ 1,212,954 |
Series H, 6.375% | 143,296 | | 3,540,844 |
Kite Realty Group Trust 8.25% | 96,100 | | 2,499,561 |
LaSalle Hotel Properties: | | | |
Series H, 7.50% | 141,308 | | 3,710,748 |
Series I, 6.375% | 354,698 | | 8,828,433 |
LBA Realty Fund II: | | | |
Series A, 8.75% (a) | 69,000 | | 3,122,250 |
Series B, 7.625% | 31,240 | | 687,280 |
MFA Financial, Inc.: | | | |
8.00% | 538,930 | | 13,850,501 |
Series B, 7.50% | 592,024 | | 14,196,736 |
Monmouth Real Estate Investment Corp.: | | | |
Series A, 7.625% | 80,000 | | 2,042,400 |
Series B, 7.875% | 95,000 | | 2,493,750 |
National Retail Properties, Inc.: | | | |
5.70% | 376,404 | | 8,819,146 |
Series D, 6.625% | 222,138 | | 5,586,771 |
New York Mortgage Trust, Inc. Series B, 7.75% | 171,101 | | 4,055,094 |
NorthStar Realty Finance Corp.: | | | |
Series B, 8.25% | 225,708 | | 5,642,700 |
Series C, 8.875% | 275,338 | | 7,032,133 |
Series D, 8.50% | 207,301 | | 5,207,401 |
Series E, 8.75% | 313,780 | | 7,916,669 |
Pebblebrook Hotel Trust: | | | |
Series A, 7.875% | 412,000 | | 10,835,600 |
Series B, 8.00% | 185,085 | | 4,919,559 |
Series C, 6.50% | 178,160 | | 4,373,828 |
Pennsylvania (REIT) 7.375% | 100,510 | | 2,591,148 |
Prologis, Inc. Series Q, 8.54% | 94,446 | | 6,133,087 |
PS Business Parks, Inc.: | | | |
Series R, 6.875% | 116,903 | | 3,003,238 |
Series S, 6.45% | 39,500 | | 977,625 |
Series T, 6.00% | 198,004 | | 4,702,595 |
Series U, 5.75% | 600 | | 13,770 |
RAIT Financial Trust 7.625% | 216,190 | | 5,316,112 |
Regency Centers Corp.: | | | |
Series 6, 6.625% | 87,261 | | 2,260,060 |
Preferred Stocks - continued |
| Shares | | Value |
Nonconvertible Preferred Stocks - continued |
FINANCIALS - continued |
Real Estate Investment Trusts - continued |
Regency Centers Corp.: - continued | | | |
Series 7, 6.00% | 123,000 | | $ 2,955,690 |
Resource Capital Corp. 8.625% | 117,847 | | 2,873,110 |
Retail Properties America, Inc. 7.00% | 394,411 | | 9,907,604 |
Sabra Health Care REIT, Inc. Series A, 7.125% | 298,123 | | 7,763,123 |
Saul Centers, Inc.: | | | |
Series A, 8.00% | 38,072 | | 989,872 |
Series C, 6.875% | 315,478 | | 7,886,950 |
Senior Housing Properties Trust 5.625% | 283,543 | | 6,544,172 |
Stag Industrial, Inc.: | | | |
Series A, 9.00% | 280,000 | | 7,761,600 |
Series B, 6.625% | 80,300 | | 1,989,031 |
Strategic Hotel & Resorts, Inc. Series B, 8.25% | 80,000 | | 2,044,800 |
Summit Hotel Properties, Inc.: | | | |
Series A, 9.25% | 138,340 | | 3,804,350 |
Series B, 7.875% | 190,173 | | 4,954,007 |
Series C, 7.125% | 153,212 | | 3,851,750 |
Sun Communities, Inc. Series A, 7.125% | 375,000 | | 9,626,250 |
Sunstone Hotel Investors, Inc. Series D, 8.00% | 129,723 | | 3,458,415 |
Taubman Centers, Inc. Series K, 6.25% | 96,120 | | 2,354,940 |
Terreno Realty Corp. Series A, 7.75% | 213,690 | | 5,528,160 |
UMH Properties, Inc. Series A, 8.25% | 600,000 | | 15,840,000 |
Urstadt Biddle Properties, Inc. Series F, 7.125% | 210,000 | | 5,344,500 |
Vornado Realty LP 7.875% | 54,682 | | 1,392,204 |
Weingarten Realty Investors (SBI) Series F, 6.50% | 49,813 | | 1,255,786 |
Winthrop Realty Trust 7.75% | 379,600 | | 9,774,700 |
| | 680,817,844 |
Real Estate Management & Development - 0.2% |
Kennedy-Wilson, Inc. 7.75% | 321,574 | | 8,200,137 |
TOTAL FINANCIALS | | 693,427,592 |
TOTAL NONCONVERTIBLE PREFERRED STOCKS | | 697,154,954 |
TOTAL PREFERRED STOCKS (Cost $716,293,737) |
733,966,870
|
Corporate Bonds - 20.9% |
| Principal
Amount (e) | | Value |
Convertible Bonds - 3.6% |
CONSUMER DISCRETIONARY - 0.1% |
Hotels, Restaurants & Leisure - 0.1% |
Morgans Hotel Group Co. 2.375% 10/15/14 | | $ 4,510,000 | | $ 4,476,175 |
FINANCIALS - 3.5% |
Consumer Finance - 0.0% |
Zais Financial Partners LP 8% 11/15/16 (h) | | 2,000,000 | | 2,062,714 |
Diversified Financial Services - 0.6% |
IAS Operating Partnership LP 5% 3/15/18 (h) | | 25,380,000 | | 24,877,578 |
Real Estate Investment Trusts - 2.8% |
Annaly Capital Management, Inc. 5% 5/15/15 | | 31,396,000 | | 31,906,185 |
Apollo Commercial Real Estate Finance, Inc. 5.5% 3/15/19 | | 3,980,000 | | 4,223,974 |
Ares Commercial Real Estate Corp. 7% 12/15/15 | | 14,700,000 | | 15,214,500 |
Blackstone Mortgage Trust, Inc. 5.25% 12/1/18 | | 5,750,000 | | 6,156,525 |
Campus Crest Communities Operating Partnership LP 4.75% 10/15/18 (h) | | 9,000,000 | | 8,797,500 |
Colony Financial, Inc.: | | | | |
3.875% 1/15/21 | | 9,910,000 | | 10,052,456 |
5% 4/15/23 | | 9,000,000 | | 9,364,500 |
PennyMac Corp. 5.375% 5/1/20 | | 6,000,000 | | 5,950,476 |
RAIT Financial Trust 4% 10/1/33 | | 11,000,000 | | 10,518,750 |
Redwood Trust, Inc. 4.625% 4/15/18 | | 8,500,000 | | 8,755,000 |
Spirit Realty Capital, Inc. 3.75% 5/15/21 | | 4,800,000 | | 4,854,000 |
| | 115,793,866 |
Real Estate Management & Development - 0.1% |
Forest City Enterprises, Inc. 3.625% 8/15/20 | | 2,000,000 | | 2,090,000 |
Grubb & Ellis Co. 7.95% 5/1/15 (d)(h) | | 5,500,000 | | 1 |
| | 2,090,001 |
TOTAL FINANCIALS | | 144,824,159 |
TOTAL CONVERTIBLE BONDS | | 149,300,334 |
Nonconvertible Bonds - 17.3% |
CONSUMER DISCRETIONARY - 5.3% |
Hotels, Restaurants & Leisure - 0.7% |
FelCor Lodging LP: | | | | |
5.625% 3/1/23 | | 2,000,000 | | 2,000,000 |
6.75% 6/1/19 | | 5,875,000 | | 6,139,375 |
Corporate Bonds - continued |
| Principal
Amount (e) | | Value |
Nonconvertible Bonds - continued |
CONSUMER DISCRETIONARY - continued |
Hotels, Restaurants & Leisure - continued |
Hilton Worldwide Finance LLC/Hilton Worldwide Finance Corp. 5.625% 10/15/21 (h) | | $ 4,000,000 | | $ 4,190,000 |
Paris Las Vegas Holding LLC/Harrah's Las Vegas LLC/Flamingo Las Vegas Holdings, Inc. 8% 10/1/20 (h) | | 4,500,000 | | 4,612,500 |
Playa Resorts Holding BV 8% 8/15/20 (h) | | 1,230,000 | | 1,297,650 |
RHP Hotel Properties LP/RHP Finance Co. 5% 4/15/21 | | 2,000,000 | | 1,985,000 |
Times Square Hotel Trust 8.528% 8/1/26 (h) | | 8,328,905 | | 10,443,093 |
| | 30,667,618 |
Household Durables - 4.6% |
Ashton Woods U.S.A. LLC/Ashton Woods Finance Co. 6.875% 2/15/21 (h) | | 10,500,000 | | 10,237,500 |
Brookfield Residential Properties, Inc./Brookfield Residential U.S. Corp. 6.125% 7/1/22 (h) | | 1,000,000 | | 1,025,000 |
Brookfield Residential Properties, Inc. 6.5% 12/15/20 (h) | | 1,615,000 | | 1,693,731 |
D.R. Horton, Inc.: | | | | |
4.375% 9/15/22 | | 4,175,000 | | 4,112,375 |
4.75% 5/15/17 | | 2,000,000 | | 2,095,000 |
5.75% 8/15/23 | | 2,510,000 | | 2,648,050 |
KB Home: | | | | |
8% 3/15/20 | | 8,465,000 | | 9,586,613 |
9.1% 9/15/17 | | 4,985,000 | | 5,782,600 |
Lennar Corp.: | | | | |
4.125% 12/1/18 | | 5,520,000 | | 5,547,600 |
4.5% 6/15/19 | | 1,830,000 | | 1,830,000 |
5.6% 5/31/15 | | 6,000,000 | | 6,186,300 |
6.5% 4/15/16 | | 4,000,000 | | 4,250,000 |
6.95% 6/1/18 | | 14,280,000 | | 15,904,350 |
M/I Homes, Inc. 8.625% 11/15/18 | | 26,055,000 | | 27,390,319 |
Meritage Homes Corp.: | | | | |
7% 4/1/22 | | 7,525,000 | | 8,221,063 |
7.15% 4/15/20 | | 7,060,000 | | 7,783,650 |
Ryland Group, Inc.: | | | | |
6.625% 5/1/20 | | 1,555,000 | | 1,663,850 |
8.4% 5/15/17 | | 5,420,000 | | 6,233,000 |
Standard Pacific Corp.: | | | | |
7% 8/15/15 | | 4,000,000 | | 4,170,000 |
8.375% 5/15/18 | | 28,983,000 | | 33,257,993 |
Corporate Bonds - continued |
| Principal
Amount (e) | | Value |
Nonconvertible Bonds - continued |
CONSUMER DISCRETIONARY - continued |
Household Durables - continued |
Standard Pacific Corp.: - continued | | | | |
10.75% 9/15/16 | | $ 8,415,000 | | $ 9,761,400 |
Toll Brothers Finance Corp. 5.875% 2/15/22 | | 1,550,000 | | 1,662,375 |
WCI Communities, Inc. 6.875% 8/15/21 (h) | | 1,845,000 | | 1,891,125 |
William Lyon Homes, Inc.: | | | | |
7% 8/15/22 (h)(i) | | 2,505,000 | | 2,505,000 |
8.5% 11/15/20 | | 15,550,000 | | 17,143,875 |
| | 192,582,769 |
TOTAL CONSUMER DISCRETIONARY | | 223,250,387 |
CONSUMER STAPLES - 0.0% |
Food & Staples Retailing - 0.0% |
Ahold Lease Series 2001 A1 pass thru trust certificates 7.82% 1/2/20 | | 759,804 | | 852,880 |
FINANCIALS - 11.1% |
Diversified Financial Services - 0.4% |
Cantor Commercial Real Estate Co. LP/CCRE Finance Corp. 7.75% 2/15/18 (h) | | 4,755,000 | | 5,087,850 |
Icahn Enterprises LP/Icahn Enterprises Finance Corp.: | | | | |
5.875% 2/1/22 | | 3,680,000 | | 3,751,300 |
6% 8/1/20 | | 6,000,000 | | 6,255,000 |
| | 15,094,150 |
Real Estate Investment Trusts - 7.4% |
American Campus Communities Operating Partnership LP 4.125% 7/1/24 | | 2,000,000 | | 2,006,580 |
American Tower Corp. 3.4% 2/15/19 | | 1,000,000 | | 1,036,709 |
Camden Property Trust 5% 6/15/15 | | 1,100,000 | | 1,141,236 |
CBL & Associates LP 5.25% 12/1/23 | | 1,000,000 | | 1,065,829 |
Commercial Net Lease Realty, Inc. 6.15% 12/15/15 | | 2,526,000 | | 2,700,178 |
Crown Castle International Corp. 5.25% 1/15/23 | | 4,000,000 | | 4,040,000 |
CTR Partnership LP / CareTrust Capital Corp. 5.875% 6/1/21 (h) | | 2,300,000 | | 2,305,750 |
CubeSmart LP 4.8% 7/15/22 | | 2,000,000 | | 2,137,444 |
DDR Corp.: | | | | |
5.5% 5/1/15 | | 4,000,000 | | 4,134,580 |
7.5% 4/1/17 | | 6,000,000 | | 6,878,238 |
7.5% 7/15/18 | | 8,756,000 | | 10,375,028 |
Corporate Bonds - continued |
| Principal
Amount (e) | | Value |
Nonconvertible Bonds - continued |
FINANCIALS - continued |
Real Estate Investment Trusts - continued |
DDR Corp.: - continued | | | | |
7.875% 9/1/20 | | $ 4,637,000 | | $ 5,824,128 |
9.625% 3/15/16 | | 3,836,000 | | 4,356,265 |
DuPont Fabros Technology LP 5.875% 9/15/21 | | 1,000,000 | | 1,020,000 |
Equity One, Inc.: | | | | |
5.375% 10/15/15 | | 3,500,000 | | 3,677,632 |
6.25% 1/15/17 | | 3,000,000 | | 3,312,594 |
Equity Residential 5.125% 3/15/16 | | 7,201,000 | | 7,694,859 |
HCP, Inc. 3.75% 2/1/16 | | 10,000,000 | | 10,430,250 |
Health Care Property Investors, Inc.: | | | | |
5.625% 5/1/17 | | 2,980,000 | | 3,309,528 |
6% 3/1/15 | | 1,000,000 | | 1,030,515 |
6% 1/30/17 | | 2,383,000 | | 2,650,163 |
7.072% 6/8/15 | | 1,500,000 | | 1,579,319 |
Health Care REIT, Inc.: | | | | |
3.625% 3/15/16 | | 14,685,000 | | 15,309,994 |
4.125% 4/1/19 | | 2,000,000 | | 2,150,084 |
6.2% 6/1/16 | | 2,750,000 | | 3,002,469 |
Healthcare Realty Trust, Inc.: | | | | |
3.75% 4/15/23 | | 4,022,000 | | 3,924,535 |
5.75% 1/15/21 | | 3,095,000 | | 3,494,862 |
6.5% 1/17/17 | | 2,875,000 | | 3,207,048 |
Highwoods/Forsyth LP: | | | | |
3.625% 1/15/23 | | 1,607,000 | | 1,580,740 |
5.85% 3/15/17 | | 2,800,000 | | 3,097,450 |
Hospitality Properties Trust: | | | | |
5% 8/15/22 | | 3,177,000 | | 3,351,433 |
5.625% 3/15/17 | | 915,000 | | 996,299 |
HRPT Properties Trust: | | | | |
5.75% 11/1/15 | | 4,826,000 | | 4,968,541 |
6.25% 8/15/16 | | 9,675,000 | | 10,297,228 |
6.25% 6/15/17 | | 1,055,000 | | 1,127,346 |
6.65% 1/15/18 | | 4,246,000 | | 4,616,816 |
iStar Financial, Inc.: | | | | |
3.875% 7/1/16 | | 2,855,000 | | 2,876,413 |
4% 11/1/17 | | 15,000,000 | | 14,775,000 |
5% 7/1/19 | | 15,000,000 | | 14,775,000 |
5.85% 3/15/17 | | 3,587,000 | | 3,766,350 |
5.875% 3/15/16 | | 27,070,000 | | 28,423,500 |
Corporate Bonds - continued |
| Principal
Amount (e) | | Value |
Nonconvertible Bonds - continued |
FINANCIALS - continued |
Real Estate Investment Trusts - continued |
iStar Financial, Inc.: - continued | | | | |
6.05% 4/15/15 | | $ 14,630,000 | | $ 14,959,175 |
7.125% 2/15/18 | | 5,725,000 | | 6,183,000 |
9% 6/1/17 | | 9,175,000 | | 10,390,688 |
MPT Operating Partnership LP/MPT Finance Corp.: | | | | |
6.375% 2/15/22 | | 3,610,000 | | 3,844,650 |
6.875% 5/1/21 | | 2,000,000 | | 2,150,000 |
National Retail Properties, Inc. 3.3% 4/15/23 | | 2,000,000 | | 1,931,756 |
Nationwide Health Properties, Inc. 6% 5/20/15 | | 5,670,000 | | 5,902,805 |
Omega Healthcare Investors, Inc.: | | | | |
4.95% 4/1/24 (h) | | 2,898,000 | | 2,979,144 |
6.75% 10/15/22 | | 2,115,000 | | 2,273,625 |
7.5% 2/15/20 | | 1,000,000 | | 1,063,750 |
Potlatch Corp. 7.5% 11/1/19 | | 1,000,000 | | 1,160,000 |
Prologis LP 7.625% 7/1/17 | | 4,690,000 | | 5,237,229 |
Reckson Operating Partnership LP/SL Green Realty Corp./SL Green Operating Partnership LP 7.75% 3/15/20 | | 2,000,000 | | 2,389,382 |
Senior Housing Properties Trust: | | | | |
3.25% 5/1/19 | | 2,882,000 | | 2,911,846 |
4.3% 1/15/16 | | 5,000,000 | | 5,165,360 |
4.75% 5/1/24 | | 3,988,000 | | 4,062,923 |
6.75% 4/15/20 | | 13,624,000 | | 15,635,202 |
6.75% 12/15/21 | | 8,000,000 | | 9,316,872 |
United Dominion Realty Trust, Inc.: | | | | |
5.25% 1/15/15 | | 1,000,000 | | 1,020,666 |
5.25% 1/15/16 | | 4,000,000 | | 4,236,568 |
| | 311,262,574 |
Real Estate Management & Development - 3.2% |
BioMed Realty LP 3.85% 4/15/16 | | 2,000,000 | | 2,089,560 |
Brandywine Operating Partnership LP 7.5% 5/15/15 | | 1,000,000 | | 1,049,968 |
CBRE Group, Inc.: | | | | |
5% 3/15/23 | | 6,020,000 | | 5,989,900 |
6.625% 10/15/20 | | 1,205,000 | | 1,263,744 |
Corporate Office Properties LP 3.6% 5/15/23 | | 5,000,000 | | 4,783,790 |
ERP Operating LP 5.25% 9/15/14 | | 4,815,000 | | 4,839,759 |
Excel Trust LP 4.625% 5/15/24 | | 2,403,000 | | 2,447,780 |
Forestar U.S.A. Real Estate Group 8.5% 6/1/22 (h) | | 10,515,000 | | 10,935,600 |
Corporate Bonds - continued |
| Principal
Amount (e) | | Value |
Nonconvertible Bonds - continued |
FINANCIALS - continued |
Real Estate Management & Development - continued |
Host Hotels & Resorts LP 5.25% 3/15/22 | | $ 2,000,000 | | $ 2,210,924 |
Howard Hughes Corp. 6.875% 10/1/21 (h) | | 9,715,000 | | 10,225,038 |
Hunt Companies, Inc. 9.625% 3/1/21 (h) | | 4,100,000 | | 4,305,000 |
Kennedy-Wilson, Inc.: | | | | |
5.875% 4/1/24 | | 2,610,000 | | 2,616,525 |
8.75% 4/1/19 | | 20,410,000 | | 21,864,213 |
Mid-America Apartments LP: | | | | |
3.75% 6/15/24 | | 1,663,000 | | 1,640,892 |
6.05% 9/1/16 | | 2,500,000 | | 2,725,500 |
Realogy Corp. 7.875% 2/15/19 (h) | | 7,085,000 | | 7,474,675 |
Realogy Group LLC/Realogy Co.-Issuer Corp. 4.5% 4/15/19 (h) | | 4,805,000 | | 4,660,850 |
Regency Centers LP: | | | | |
5.25% 8/1/15 | | 4,509,000 | | 4,707,265 |
5.875% 6/15/17 | | 400,000 | | 447,284 |
Taylor Morrison Communities, Inc./Monarch Communities, Inc.: | | | | |
5.25% 4/15/21 (h) | | 2,000,000 | | 1,970,000 |
5.625% 3/1/24 (h) | | 2,270,000 | | 2,224,600 |
Ventas Realty LP 1.55% 9/26/16 | | 7,000,000 | | 7,058,863 |
Ventas Realty LP/Ventas Capital Corp.: | | | | |
2.7% 4/1/20 | | 3,000,000 | | 2,963,976 |
3.125% 11/30/15 | | 13,807,000 | | 14,222,563 |
4% 4/30/19 | | 2,262,000 | | 2,420,869 |
Wells Operating Partnership II LP 5.875% 4/1/18 | | 3,000,000 | | 3,138,420 |
Weyerhaeuser Real Estate Co. 5.875% 6/15/24 (h) | | 1,890,000 | | 1,918,350 |
| | 132,195,908 |
Thrifts & Mortgage Finance - 0.1% |
Ocwen Financial Corp. 6.625% 5/15/19 (h) | | 4,005,000 | | 4,095,113 |
Wrightwood Capital LLC 1.9% 4/20/20 (d) | | 110,410 | | 500,156 |
| | 4,595,269 |
TOTAL FINANCIALS | | 463,147,901 |
Corporate Bonds - continued |
| Principal
Amount (e) | | Value |
Nonconvertible Bonds - continued |
HEALTH CARE - 0.6% |
Health Care Equipment & Supplies - 0.3% |
Aviv Healthcare Properties LP/Aviv Healthcare Capital Corp.: | | | | |
6% 10/15/21 | | $ 1,370,000 | | $ 1,438,500 |
7.75% 2/15/19 | | 10,410,000 | | 10,930,500 |
| | 12,369,000 |
Health Care Providers & Services - 0.3% |
Sabra Health Care LP/Sabra Capital Corp.: | | | | |
5.375% 6/1/23 | | 2,795,000 | | 2,788,013 |
5.5% 2/1/21 | | 9,070,000 | | 9,296,750 |
| | 12,084,763 |
TOTAL HEALTH CARE | | 24,453,763 |
INDUSTRIALS - 0.2% |
Commercial Services & Supplies - 0.1% |
Iron Mountain, Inc. 5.75% 8/15/24 | | 4,235,000 | | 4,235,000 |
Industrial Conglomerates - 0.1% |
Ladder Capital Finance Holdings LLLP/Ladder Capital Finance Corp. 7.375% 10/1/17 | | 3,050,000 | | 3,255,875 |
TOTAL INDUSTRIALS | | 7,490,875 |
INFORMATION TECHNOLOGY - 0.1% |
Internet Software & Services - 0.1% |
CyrusOne LP/CyrusOne Finance Corp. 6.375% 11/15/22 | | 3,000,000 | | 3,165,000 |
TOTAL NONCONVERTIBLE BONDS | | 722,360,806 |
TOTAL CORPORATE BONDS (Cost $832,223,479) |
871,661,140
|
Asset-Backed Securities - 2.2% |
|
Capital Trust RE CDO Ltd.: | | | | |
Series 2005-1A Class D, 1.6562% 3/20/50 (h)(j) | | 2,250,000 | | 95,625 |
Series 2005-3A Class A2, 5.16% 6/25/35 (h) | | 12,158 | | 11,915 |
CapitalSource Real Estate Loan Trust Series 2006-1A Class A2A, 0.4836% 1/20/37 (h)(j) | | 81,455 | | 79,826 |
Asset-Backed Securities - continued |
| Principal
Amount (e) | | Value |
CapLease CDO Ltd. Series 2005-1A Class A, 4.926% 1/29/40 (h) | | $ 910,893 | | $ 901,784 |
CBRE Realty Finance CDO LLC Series 2007-1A Class A1, 0.4821% 4/7/52 (h)(j) | | 686,542 | | 665,946 |
Conseco Finance Securitizations Corp. Series 2002-2 Class M2, 9.163% 3/1/33 (j) | | 500,000 | | 432,715 |
Crest Clarendon Street Ltd./Crest Clarendon Corp. Series 2002-1A Class D, 9% 12/28/35 (h) | | 573,683 | | 389,875 |
Crest Dartmouth Street Ltd./Crest Dartmouth Street Corp. Series 2003-1A Class D, 9% 6/28/38 (h) | | 346,972 | | 348,533 |
Deutsche Financial Capital Securitization LLC Series 1997-I Class M, 7.275% 9/15/27 | | 7,913,633 | | 7,729,380 |
Fairfield Street Solar Corp. Series 2004-1A Class E1, 3.5944% 11/28/39 (h)(j) | | 609,640 | | 61 |
Green Tree Financial Corp.: | | | | |
Series 1996-4 Class M1, 7.75% 6/15/27 | | 1,788,179 | | 1,774,707 |
Series 1997-3 Class M1, 7.53% 3/15/28 | | 6,996,415 | | 6,027,164 |
GSR Mortgage Loan Trust Series 2005-HE3 Class B3, 3.905% 6/25/35 (j)(m) | | 212,276 | | 4,647 |
Guggenheim Structured Real Estate Funding Ltd./Guggenheim Structured Real Estate Funding LLC Series 2005-2A: | | | | |
Class D, 1.705% 8/26/30 (h)(j) | | 89,648 | | 88,527 |
Class E, 2.155% 8/26/30 (h)(j) | | 1,420,000 | | 972,700 |
HLSS Servicer Advance Receivables Backed Notes Series 2013-T2 Class D2, 2.388% 5/16/44 (h) | | 3,000,000 | | 2,998,195 |
Invitation Homes Trust Series 2014-SFR1 Class E, 3.4062% 6/17/31 (h)(j) | | 10,000,000 | | 9,999,935 |
Lehman ABS Manufactured Housing Contract Trust Series 2001-B Class M2, 7.17% 4/15/40 | | 1,012,616 | | 494,533 |
Merit Securities Corp. Series 13 Class M1, 7.688% 12/28/33 (j) | | 1,923,000 | | 2,043,059 |
Mesa West Capital CDO Ltd. Series 2007-1A: | | | | |
Class A1, 0.415% 2/25/47 (h)(j) | | 1,617,882 | | 1,601,703 |
Class A2, 0.445% 2/25/47 (h)(j) | | 21,240,000 | | 20,655,900 |
N-Star Real Estate CDO Ltd. Series 1A Class C1B, 7.696% 8/28/38 (h) | | 899,989 | | 917,989 |
Taberna Preferred Funding III Ltd. Series 2005-3A Class D, 2.8729% 2/5/36 (h)(j) | | 3,803,196 | | 380 |
Wachovia Ltd./Wachovia LLC: | | | | |
Series 2006-1 Class 1ML, 5.7326% 9/25/26 (h)(j) | | 2,000,000 | | 1,400,000 |
Series 2006-1A: | | | | |
Class B, 0.5926% 9/25/26 (h)(j) | | 2,240,259 | | 2,199,934 |
Class C, 0.7626% 9/25/26 (h)(j) | | 7,030,000 | | 6,868,310 |
Asset-Backed Securities - continued |
| Principal
Amount (e) | | Value |
Wachovia Ltd./Wachovia LLC: - continued | | | | |
Series 2006-1A: | | | | |
Class D, 0.8626% 9/25/26 (h)(j) | | $ 2,080,000 | | $ 1,977,040 |
Class E, 0.9626% 9/25/26 (h)(j) | | 2,780,000 | | 2,621,540 |
Class F, 1.3826% 9/25/26 (h)(j) | | 3,483,000 | | 3,230,483 |
Class G, 1.5826% 9/25/26 (h)(j) | | 1,599,000 | | 1,475,877 |
Class H, 1.8826% 9/25/26 (h)(j) | | 1,535,000 | | 1,412,968 |
Class J, 2.9826% 9/25/26 (h)(j) | | 1,500,000 | | 1,392,000 |
Class K, 3.4826% 9/25/26 (h)(j) | | 2,475,000 | | 2,229,975 |
Class L, 4.2326% 9/25/26 (h)(j) | | 1,500,000 | | 1,370,250 |
Wrightwood Capital Real Estate CDO Ltd. Series 2005-1A: | | | | |
Class A1, 0.547% 11/21/40 (h)(j) | | 6,037,856 | | 5,705,774 |
Class F, 2.177% 11/21/40 (h)(j) | | 250,000 | | 29,275 |
TOTAL ASSET-BACKED SECURITIES (Cost $93,851,617) |
90,148,525
|
Collateralized Mortgage Obligations - 0.3% |
|
Private Sponsor - 0.3% |
Countrywide Home Loans, Inc.: | | | | |
Series 2002-38 Class B3, 5% 2/25/18 (h) | | 41,113 | | 173 |
Series 2002-R2 Class 2B3, 3.664% 7/25/33 (h)(j) | | 181,238 | | 53,428 |
Series 2003-R3 Class B2, 5.5% 11/25/33 (h) | | 1,086,466 | | 131,471 |
Series 2004-R1 Class 1B3, 5.0042% 11/25/34 (h)(j) | | 38,272 | | 2,747 |
FREMF Mortgage Trust: | | | | |
Series 2010-K6 Class B, 5.5329% 12/25/46 (h)(j) | | 4,500,000 | | 4,975,830 |
Series 2010-K7 Class B, 5.618% 4/25/20 (h)(j) | | 3,200,000 | | 3,574,253 |
Merrill Lynch Mortgage Investors Trust Series 1998-C3 Class F, 6% 12/15/30 (h) | | 1,388,624 | | 1,453,435 |
RESI Finance LP/RESI Finance DE Corp. floater Series 2003-B Class B9, 12.1025% 7/10/35 (h)(j) | | 155,567 | | 172,384 |
Residential Funding Securities Corp. Series 2002-RM1 Class BI1, 5.5% 12/25/17 (h) | | 15,441 | | 13,851 |
RESIX Finance Ltd. floater: | | | | |
Series 2003-D Class B8, 6.6525% 12/10/35 (h)(j) | | 169,695 | | 40,277 |
Series 2004-A Class B7, 4.4025% 2/10/36 (h)(j) | | 178,210 | | 48,248 |
Series 2004-B Class B7, 4.1525% 2/10/36 (h)(j) | | 224,769 | | 82,416 |
TOTAL PRIVATE SPONSOR | | 10,548,513 |
Collateralized Mortgage Obligations - continued |
| Principal
Amount (e) | | Value |
U.S. Government Agency - 0.0% |
Fannie Mae REMIC Trust: | | | | |
Series 2001-W3 subordinate REMIC pass thru certificates, Class B3, 7% 9/25/41 (m) | | $ 113,309 | | $ 37,591 |
Series 2002-W1 subordinate REMIC pass thru certificates, Class 3B3, 3.1641% 2/25/42 (h)(j) | | 85,297 | | 47,472 |
Series 2003-W1 subordinate REMIC pass thru certificates, Class B3, 4.5664% 12/25/42 (j)(m) | | 184,544 | | 30,990 |
Series 2003-W10 subordinate REMIC pass thru certificates, Class 2B3, 3.095% 6/25/43 (h)(j) | | 125,783 | | 52,539 |
Series 2003-W4 subordinate REMIC pass thru certificates, Class 2B3, 3.0288% 10/25/42 (h)(j) | | 51,657 | | 26,741 |
TOTAL U.S. GOVERNMENT AGENCY | | 195,333 |
TOTAL COLLATERALIZED MORTGAGE OBLIGATIONS (Cost $10,579,057) |
10,743,846
|
Commercial Mortgage Securities - 13.0% |
|
ACGS Series 2004-1 Class P, 7.4605% 8/1/19 (m) | | 1,607,561 | | 1,595,253 |
Americold LLC Trust Series 2010-ARTA Class D, 7.443% 1/14/29 (h) | | 2,000,000 | | 2,278,707 |
Banc of America Commercial Mortgage Trust: | | | | |
Series 2005-1 Class CJ, 5.4665% 11/10/42 (j) | | 3,580,000 | | 3,660,768 |
Series 2005-5 Class D, 5.3884% 10/10/45 (j) | | 4,000,000 | | 4,046,484 |
Series 2005-6 Class AJ, 5.3495% 9/10/47 (j) | | 5,000,000 | | 5,242,815 |
Banc of America Large Loan, Inc. floater Series 2005-MIB1 Class K, 2.152% 3/15/22 (h)(j) | | 760,684 | | 670,139 |
Banc of America REMIC Trust Series 2012-CLMZ Class A, 7.652% 8/15/17 (h)(j) | | 4,900,000 | | 4,908,330 |
Bear Stearns Commercial Mortgage Securities, Inc. Series 2006-PW11 Class AJ, 5.6047% 3/11/39 (j) | | 5,700,000 | | 5,877,419 |
Bear Stearns Commercial Mortgage Securities Trust Series 2006-T22 Class B, 5.7569% 4/12/38 (h)(j) | | 2,520,000 | | 2,677,709 |
Boca Hotel Portfolio Trust Series 2013-BOCA Class E, 3.902% 8/15/26 (h)(j) | | 2,500,000 | | 2,502,910 |
CGBAM Commercial Mortgage Trust floater Series 2014-HD Class E, 3.1518% 2/15/31 (h)(j) | | 5,769,000 | | 5,776,904 |
Citigroup Commercial Mortgage Trust Series 2013-GC15 Class D, 5.277% 9/10/46 (h)(j) | | 2,750,000 | | 2,736,311 |
COMM Mortgage Trust: | | | | |
sequential payer Series 2013-LC6 Class E, 3.5% 1/10/46 (h) | | 4,300,000 | | 3,445,349 |
Commercial Mortgage Securities - continued |
| Principal
Amount (e) | | Value |
COMM Mortgage Trust: - continued | | | | |
Series 2012-CR5 Class D, 4.4798% 12/10/45 (h)(j) | | $ 2,000,000 | | $ 2,000,636 |
Series 2013-CR10 Class D, 4.958% 8/10/46 (h)(j) | | 2,000,000 | | 1,956,635 |
Series 2013-CR12 Class D, 5.2553% 10/10/46 (h)(j) | | 3,000,000 | | 2,952,387 |
Series 2013-CR9 Class D, 4.4022% 7/10/45 (h)(j) | | 4,255,000 | | 3,991,662 |
Series 2013-LC6 Class D, 4.4319% 1/10/46 (h)(j) | | 3,870,000 | | 3,677,173 |
Series 2014-UBS2 Class D, 5.1831% 3/10/47 (h)(j) | | 3,713,000 | | 3,559,040 |
Commercial Mortgage Acceptance Corp. Series 1998-C2 Class J, 5.44% 9/15/30 (h) | | 2,646,159 | | 2,558,931 |
Commercial Mortgage Trust pass-thru certificates: | | | | |
Series 2005-C6 Class AJ, 5.209% 6/10/44 (j) | | 5,000,000 | | 5,175,945 |
Series 2012-CR1: | | | | |
Class C, 5.5464% 5/15/45 (j) | | 1,000,000 | | 1,105,871 |
Class D, 5.5464% 5/15/45 (h)(j) | | 5,550,000 | | 5,676,374 |
Series 2012-CR2: | | | | |
Class D, 5.0196% 8/15/45 (h)(j) | | 4,500,000 | | 4,670,199 |
Class E, 5.0196% 8/15/45 (h)(j) | | 6,000,000 | | 5,986,944 |
Series 2012-LC4: | | | | |
Class C, 5.8228% 12/10/44 (j) | | 2,000,000 | | 2,235,678 |
Class D, 5.8228% 12/10/44 (h)(j) | | 8,000,000 | | 8,410,016 |
Credit Suisse First Boston Mortgage Securities Corp.: | | | | |
Series 1998-C1 Class F, 6% 5/17/40 (h) | | 1,530,094 | | 1,669,010 |
Series 1998-C2 Class F, 6.75% 11/15/30 (h) | | 2,149,220 | | 2,223,860 |
DBUBS Mortgage Trust Series 2011-LC1A: | | | | |
Class E, 5.7302% 11/10/46 (h)(j) | | 12,490,000 | | 13,439,265 |
Class G, 4.652% 11/10/46 (h) | | 9,843,000 | | 8,454,793 |
Deutsche Mortgage & Asset Receiving Corp. Series 1998-C1 Class J, 6.22% 6/15/31 | | 51,442 | | 51,391 |
Extended Stay America Trust Series 2013-ESH7 Class C7, 3.9017% 12/5/31 (h) | | 500,000 | | 510,914 |
Freddie Mac: | | | | |
pass-thru certificates: | | | | |
Series K011 Class X3, 2.6622% 12/25/43 (j)(k) | | 12,206,096 | | 1,735,585 |
Series K012 Class X3, 2.366% 1/25/41 (j)(k) | | 21,072,886 | | 2,683,801 |
Series K013 Class X3, 2.8852% 1/25/43 (j)(k) | | 14,360,000 | | 2,250,959 |
Series KAIV Class X2, 3.6147% 6/25/46 (j)(k) | | 7,430,000 | | 1,445,962 |
G-Force LLC sequential payer Series 2005-RRA Class A2, 4.83% 8/22/36 (h) | | 10,247 | | 10,247 |
GMAC Commercial Mortgage Securities, Inc.: | | | | |
Series 1997-C2 Class G, 6.75% 4/15/29 (j) | | 716,241 | | 776,204 |
Series 2000-C1 Class K, 7% 3/15/33 | | 16,103 | | 16,280 |
GP Portfolio Trust Series 2014-GPP Class E, 4.002% 2/15/27 (h)(j) | | 2,823,000 | | 2,825,965 |
Commercial Mortgage Securities - continued |
| Principal
Amount (e) | | Value |
Greenwich Capital Commercial Funding Corp. Series 2006-GG7 Class A4, 6.0146% 7/10/38 (j) | | $ 7,954,707 | | $ 8,516,715 |
GS Mortgage Securities Corp. II Series 2010-C1: | | | | |
Class D, 6.169% 8/10/43 (h)(j) | | 4,000,000 | | 4,438,020 |
Class E, 4% 8/10/43 (h) | | 3,770,000 | | 3,362,169 |
GS Mortgage Securities Trust: | | | | |
Series 2010-C2 Class D, 5.3978% 12/10/43 (h)(j) | | 3,000,000 | | 3,132,480 |
Series 2011-GC5: | | | | |
Class C, 5.4738% 8/10/44 (h)(j) | | 9,000,000 | | 9,939,294 |
Class D, 5.4738% 8/10/44 (h)(j) | | 4,000,000 | | 4,192,568 |
Class E, 5.4738% 8/10/44 (h)(j) | | 4,049,000 | | 3,825,924 |
Series 2012-GC6 Class C, 5.8259% 1/10/45 (h)(j) | | 3,600,000 | | 4,029,503 |
Series 2012-GCJ7: | | | | |
Class C, 5.9067% 5/10/45 (j) | | 6,500,000 | | 7,266,509 |
Class D, 5.9067% 5/10/45 (h)(j) | | 3,000,000 | | 3,173,227 |
Class E, 5% 5/10/45 (h) | | 6,920,000 | | 6,344,347 |
Series 2012-GCJ9 Class D, 4.858% 11/10/45 (h)(j) | | 2,000,000 | | 1,998,964 |
Series 2013-GC16 Class D, 5.323% 11/10/46 (h)(j) | | 3,250,000 | | 3,296,098 |
Hilton U.S.A. Trust: | | | | |
floater Series 2014-ORL Class E, 3.5534% 7/15/29 (h)(j) | | 4,000,000 | | 4,003,809 |
Series 2013-HLT Class EFX, 5.6086% 11/5/30 (h)(j) | | 3,000,000 | | 3,087,078 |
Invitation Homes Trust floater Series 2013-SFR1: | | | | |
Class E, 2.9% 12/17/30 (h)(j) | | 1,500,000 | | 1,470,293 |
Class F, 3.9% 12/17/30 (h)(j) | | 1,750,000 | | 1,730,195 |
JPMorgan Chase Commercial Mortgage Securities Corp.: | | | | |
Series 2003-C1 Class F, 6.1573% 1/12/37 (h)(j) | | 1,000,000 | | 1,009,209 |
Series 2009-IWST: | | | | |
Class C, 7.6935% 12/5/27 (h)(j) | | 3,000,000 | | 3,682,794 |
Class D, 7.6935% 12/5/27 (h)(j) | | 9,550,000 | | 11,648,374 |
Series 2010-CNTM Class MZ, 8.5% 8/5/20 (h) | | 9,000,000 | | 9,389,840 |
Series 2010-CNTR: | | | | |
Class D, 6.3899% 8/5/32 (h)(j) | | 4,500,000 | | 5,104,256 |
Class XB, 1.1366% 8/5/32 (h)(j)(k) | | 32,655,000 | | 1,341,921 |
Series 2012-CBX Class C, 5.358% 6/15/45 (j) | | 4,530,000 | | 4,947,000 |
JPMorgan Chase Commercial Mortgage Securities Trust: | | | | |
floater: | | | | |
Series 2013-JWMZ Class M, 6.152% 4/15/18 (h)(j) | | 2,143,851 | | 2,157,968 |
Series 2013-JWRZ Class E, 3.892% 4/15/30 (h)(j) | | 3,400,000 | | 3,393,597 |
Series 2014-FBLU Class E, 3.6518% 12/15/28 (h)(j) | | 2,000,000 | | 2,000,802 |
Commercial Mortgage Securities - continued |
| Principal
Amount (e) | | Value |
JPMorgan Chase Commercial Mortgage Securities Trust: - continued | | | | |
floater: | | | | |
Series 2014-INN: | | | | |
Class E, 3.751% 6/15/29 (h)(j) | | $ 6,593,000 | | $ 6,597,068 |
Class F, 4.152% 6/15/29 (h)(j) | | 6,593,000 | | 6,599,179 |
Series 2005-LDP5 Class AJ, 5.5262% 12/15/44 (j) | | 3,470,000 | | 3,618,426 |
Series 2011-C4 Class F, 3.873% 7/15/46 (h) | | 1,400,000 | | 1,271,725 |
Series 2011-C5 Class C, 5.5023% 8/15/46 (h)(j) | | 6,525,375 | | 7,267,878 |
Series 2013-LC11 Class D, 4.383% 4/15/46 (j) | | 3,750,000 | | 3,521,536 |
JPMorgan Commercial Mortgage Finance Corp. Series 1999-C8 Class H, 6% 7/15/31 (h) | | 1,393,719 | | 1,280,411 |
LB Commercial Conduit Mortgage Trust Series 1998-C4 Class G, 5.6% 10/15/35 (h) | | 116,194 | | 116,431 |
LB-UBS Commercial Mortgage Trust: | | | | |
sequential payer: | | | | |
Series 2005-C3 Class AJ, 4.843% 7/15/40 | | 6,620,000 | | 6,779,933 |
Series 2005-C7 Class AJ, 5.323% 11/15/40 (j) | | 8,000,000 | | 8,349,352 |
Series 2006-C7 Class AM, 5.378% 11/15/38 | | 2,040,000 | | 2,198,657 |
Series 2004-C7 Class E, 4.918% 10/15/36 | | 5,120,000 | | 5,153,408 |
Series 2005-C1 Class E, 4.924% 2/15/40 | | 4,000,000 | | 4,033,100 |
Series 2006-C4: | | | | |
Class A4, 6.0294% 6/15/38 (j) | | 4,841,683 | | 5,200,742 |
Class AJ, 6.0494% 6/15/38 (j) | | 7,005,000 | | 7,430,533 |
Class AM, 6.0494% 6/15/38 (j) | | 6,700,000 | | 7,234,218 |
LSTAR Commercial Mortgage Trust: | | | | |
Series 2011-1: | | | | |
Class B, 5.3288% 6/25/43 (h)(j) | | 3,548,171 | | 3,555,950 |
Class D, 5.3288% 6/25/43 (h)(j) | | 4,699,000 | | 4,745,468 |
Series 2014-2: | | | | |
Class D, 5.319% 1/20/41 (h)(j) | | 3,000,000 | | 2,849,709 |
Class E, 5.319% 1/20/41 (h)(j) | | 4,800,000 | | 3,957,715 |
Mach One Trust LLC Series 2004-1A Class H, 6.2679% 5/28/40 (h)(j) | | 2,840,000 | | 2,918,100 |
Merrill Lynch Financial Asset, Inc. Series 2005-CA16: | | | | |
Class F, 4.384% 7/12/37 | CAD | 710,000 | | 636,044 |
Class G, 4.384% 7/12/37 | CAD | 355,000 | | 315,222 |
Class H, 4.384% 7/12/37 | CAD | 236,000 | | 207,720 |
Class J, 4.384% 7/12/37 | CAD | 355,000 | | 309,736 |
Class K, 4.384% 7/12/37 | CAD | 355,000 | | 307,048 |
Class L, 4.384% 7/12/37 | CAD | 236,000 | | 202,359 |
Class M, 4.384% 7/12/37 | CAD | 995,000 | | 809,979 |
Merrill Lynch Mortgage Investors Trust Series 1999-C1 Class G, 6.71% 11/15/31 (h) | | 401,475 | | 289,062 |
Commercial Mortgage Securities - continued |
| Principal
Amount (e) | | Value |
Merrill Lynch Mortgage Trust Series 2006-C1 Class AM, 5.8624% 5/12/39 (j) | | $ 1,200,000 | | $ 1,283,813 |
Mezz Capital Commercial Mortgage Trust: | | | | |
sequential payer: | | | | |
Series 2004-C1 Class A, 4.836% 1/15/37 (h) | | 59,543 | | 59,543 |
Series 2004-C2 Class A, 5.318% 10/15/40 (h) | | 4,709,155 | | 4,709,155 |
Series 2004-C1 Class IO, 8.9139% 1/15/37 (h)(j)(k) | | 436,614 | | 13,317 |
Morgan Stanley BAML Trust: | | | | |
Series 2012-C6 Class D, 4.8181% 11/15/45 (h)(j) | | 2,000,000 | | 2,041,958 |
Series 2013-C12 Class D, 4.935% 10/15/46 (h) | | 3,250,000 | | 3,158,717 |
Series 2013-C13 Class D, 5.0592% 11/15/46 (h)(j) | | 3,100,000 | | 3,027,383 |
Series 2013-C7 Class E, 4.4423% 2/15/46 (h)(j) | | 1,000,000 | | 874,622 |
Series 2013-C9 Class D, 4.2984% 5/15/46 (h)(j) | | 5,000,000 | | 4,676,130 |
Morgan Stanley Capital I Trust: | | | | |
sequential payer: | | | | |
Series 2006-HQ10 Class AM, 5.36% 11/12/41 | | 8,200,000 | | 8,866,619 |
Series 2012-C4 Class E, 5.7094% 3/15/45 (h)(j) | | 5,630,000 | | 5,791,632 |
Series 1997-RR Class F, 7.4306% 4/30/39 (h)(j) | | 869,355 | | 919,343 |
Series 1998-CF1 Class G, 7.35% 7/15/32 (h) | | 2,639,941 | | 2,147,478 |
Series 2005-HQ5 Class B, 5.272% 1/14/42 | | 2,000,000 | | 2,034,836 |
Series 2005-HQ6 Class AJ, 5.073% 8/13/42 (j) | | 2,500,000 | | 2,577,703 |
Series 2006-IQ12 Class AMFX, 5.37% 12/15/43 | | 7,500,000 | | 8,090,333 |
Series 2011-C1 Class C, 5.4187% 9/15/47 (h)(j) | | 4,000,000 | | 4,427,369 |
Series 2011-C2: | | | | |
Class D, 5.4817% 6/15/44 (h)(j) | | 4,610,000 | | 4,990,459 |
Class E, 5.4817% 6/15/44 (h)(j) | | 9,600,000 | | 10,101,341 |
Class F, 5.4817% 6/15/44 (h)(j) | | 4,440,000 | | 4,216,291 |
Class XB, 0.534% 6/15/44 (h)(j)(k) | | 63,708,222 | | 1,791,029 |
Series 2011-C3: | | | | |
Class C, 5.3556% 7/15/49 (h)(j) | | 2,000,000 | | 2,184,086 |
Class D, 5.3556% 7/15/49 (h)(j) | | 7,400,000 | | 7,862,056 |
Series 2012-C4 Class D, 5.7094% 3/15/45 (h)(j) | | 6,310,000 | | 6,797,296 |
Providence Place Group Ltd. Partnership Series 2000-C1 Class A2, 7.75% 7/20/28 (h) | | 4,240,047 | | 5,447,612 |
RBSCF Trust Series 2010-MB1 Class D, 4.9832% 4/15/24 (h)(j) | | 9,049,000 | | 9,205,756 |
SCG Trust Series 2013-SRP1 Class D, 3.4955% 11/15/26 (h)(j) | | 1,000,000 | | 972,044 |
TIAA Seasoned Commercial Mortgage Trust sequential payer Series 2007-C4 Class AJ, 5.5645% 8/15/39 (j) | | 2,080,000 | | 2,189,859 |
TimberStar Trust I Series 2006-1 Class F, 7.5296% 10/15/36 (h) | | 10,630,000 | | 11,253,120 |
Commercial Mortgage Securities - continued |
| Principal
Amount (e) | | Value |
UBS Commercial Mortgage Trust: | | | | |
Series 2007-FL1 Class F, 0.727% 7/15/24 (h)(j) | | $ 1,200,000 | | $ 1,199,038 |
Series 2012-C1 Class D, 5.7194% 5/10/45 (h)(j) | | 2,000,000 | | 2,081,394 |
UBS-Barclays Commercial Mortgage Trust sequential payer Series 2012-C3 Class A1, 0.726% 8/10/49 | | 2,643,138 | | 2,622,908 |
UBS-Citigroup Commercial Mortgage Trust Series 2011-C1 Class B, 6.0705% 1/10/45 (h)(j) | | 3,000,000 | | 3,477,570 |
Vornado DP LLC Series 2010-VNO Class D, 6.3555% 9/13/28 (h) | | 2,540,000 | | 2,932,115 |
Wachovia Bank Commercial Mortgage Trust: | | | | |
Series 2004-C10 Class E, 4.931% 2/15/41 | | 1,716,408 | | 1,717,802 |
Series 2004-C11: | | | | |
Class D, 5.5428% 1/15/41 (j) | | 5,177,000 | | 5,474,186 |
Class E, 5.5928% 1/15/41 (j) | | 3,785,000 | | 3,996,351 |
Series 2004-C12 Class D, 5.6311% 7/15/41 (j) | | 1,364,882 | | 1,368,222 |
Wells Fargo Commercial Mortgage Trust Series 2012-LC5 Class D, 4.9376% 10/15/45 (h)(j) | | 9,999,000 | | 9,932,877 |
WF-RBS Commercial Mortgage Trust: | | | | |
Series 2011-C3: | | | | |
Class C, 5.335% 3/15/44 (h) | | 4,900,000 | | 5,374,271 |
Class D, 5.723% 3/15/44 (h)(j) | | 1,000,000 | | 1,060,813 |
Class E, 5% 3/15/44 (h) | | 3,000,000 | | 2,799,111 |
Series 2011-C5 Class F, 5.25% 11/15/44 (h)(j) | | 3,000,000 | | 2,792,028 |
Series 2012-C10 Class E, 4.6077% 12/15/45 (h)(j) | | 4,090,000 | | 3,546,050 |
Series 2012-C7: | | | | |
Class D, 5.0019% 6/15/45 (h)(j) | | 2,380,000 | | 2,477,927 |
Class F, 4.5% 6/15/45 (h) | | 2,000,000 | | 1,750,684 |
Series 2013-C11: | | | | |
Class D, 4.3224% 3/15/45 (h)(j) | | 5,830,000 | | 5,505,759 |
Class E, 4.3224% 3/15/45 (h)(j) | | 4,780,000 | | 4,065,256 |
Series 2013-C13 Class D, 4.2791% 5/15/45 (h)(j) | | 4,000,000 | | 3,722,676 |
TOTAL COMMERCIAL MORTGAGE SECURITIES (Cost $491,817,896) |
543,318,426
|
Bank Loan Obligations - 7.8% |
|
CONSUMER DISCRETIONARY - 2.8% |
Hotels, Restaurants & Leisure - 2.4% |
BRE Select Hotels Corp. 5.892% 5/9/18 (j) | | 12,102,193 | | 12,102,193 |
Caesars Entertainment Resort Properties LLC Tranche B 1LN, term loan 7% 10/11/20 (j) | | 11,442,500 | | 11,413,894 |
Bank Loan Obligations - continued |
| Principal
Amount (e) | | Value |
CONSUMER DISCRETIONARY - continued |
Hotels, Restaurants & Leisure - continued |
Caesars Growth Properties Holdings, LLC Tranche 1LN, term loan 6.25% 5/8/21 (j) | | $ 9,290,000 | | $ 9,290,000 |
Cedar Fair LP Tranche B, term loan 3.25% 3/6/20 (j) | | 2,760,267 | | 2,763,718 |
CityCenter Holdings LLC Tranche B, term loan 4.25% 10/16/20 (j) | | 1,632,130 | | 1,628,050 |
Cooper Hotel Group 12% 11/6/17 | | 13,277,241 | | 13,941,103 |
Four Seasons Holdings, Inc. Tranche 2LN, term loan 6.25% 12/27/20 (j) | | 510,000 | | 512,550 |
Hilton Worldwide Finance, LLC Tranche B, term loan 3.5% 10/25/20 (j) | | 28,862,492 | | 28,718,179 |
La Quinta Intermediate Holdings LLC Tranche B LN, Tranche B, term loan 4% 4/14/21 (j) | | 8,181,000 | | 8,099,190 |
Playa Resorts Holding BV Tranche B, term loan 4% 8/9/19 (j) | | 6,982,412 | | 7,008,596 |
Ryman Hospitality Properties, Inc. Tranche B, term loan 3.75% 1/15/21 (j) | | 2,290,000 | | 2,301,450 |
| | 97,778,923 |
Media - 0.2% |
CBS Outdoor Americas Capital LLC/CBS Outdoor Americas Capital Corp. Tranche B, term loan 3% 1/31/21 (j) | | 8,295,000 | | 8,232,788 |
Multiline Retail - 0.1% |
JC Penney Corp., Inc. Tranche B, term loan 6% 5/22/18 (j) | | 3,499,650 | | 3,531,532 |
Specialty Retail - 0.1% |
The Pep Boys - Manny, Moe & Jack Tranche B, term loan 4.25% 10/11/18 (j) | | 5,274,675 | | 5,281,268 |
TOTAL CONSUMER DISCRETIONARY | | 114,824,511 |
CONSUMER STAPLES - 0.1% |
Food & Staples Retailing - 0.1% |
Albertson's LLC Tranche B 2LN, term loan 4.75% 3/21/19 (j) | | 5,123,347 | | 5,116,943 |
ENERGY - 0.4% |
Oil, Gas & Consumable Fuels - 0.4% |
Panda Sherman Power, LLC term loan 9% 9/14/18 (j) | | 7,200,000 | | 7,344,000 |
Panda Temple Power, LLC term loan 7.25% 4/3/19 (j) | | 8,580,000 | | 8,794,500 |
| | 16,138,500 |
Bank Loan Obligations - continued |
| Principal
Amount (e) | | Value |
FINANCIALS - 2.3% |
Diversified Financial Services - 0.9% |
Blackstone 9.98% 10/1/17 | | $ 17,203,421 | | $ 17,547,489 |
Calpine Construction Finance Co. LP Tranche B 2LN, term loan 3.25% 1/31/22 (j) | | 7,380,609 | | 7,256,098 |
Pilot Travel Centers LLC: | | | | |
Tranche B 2LN, term loan 4.25% 8/7/19 (j) | | 7,117,435 | | 7,144,481 |
Tranche B, term loan 3.75% 3/30/18 (j) | | 6,566,411 | | 6,549,995 |
| | 38,498,063 |
Real Estate Investment Trusts - 0.2% |
Starwood Property Trust, Inc. Tranche B, term loan 3.5% 4/17/20 (j) | | 8,933,487 | | 8,899,986 |
Real Estate Management & Development - 1.1% |
CBRE Group, Inc. Tranche B, term loan 2.9015% 3/28/21 (j) | | 4,468,437 | | 4,446,095 |
CityCenter 8.74% 7/10/15 (j) | | 3,307,347 | | 3,307,347 |
Realogy Corp. Credit-Linked Deposit 4.4463% 10/10/16 (j) | | 647,237 | | 646,428 |
Realogy Group LLC Tranche B, term loan 3.75% 3/5/20 (j) | | 38,799,180 | | 38,411,188 |
| | 46,811,058 |
Thrifts & Mortgage Finance - 0.1% |
Ocwen Loan Servicing, LLC Tranche B, term loan 5% 2/15/18 (j) | | 1,942,912 | | 1,942,912 |
TOTAL FINANCIALS | | 96,152,019 |
HEALTH CARE - 0.5% |
Health Care Providers & Services - 0.5% |
Community Health Systems, Inc.: | | | | |
Tranche D, term loan 4.25% 1/27/21 (j) | | 2,100,608 | | 2,105,860 |
Tranche E, term loan 3.4776% 1/25/17 (j) | | 788,123 | | 789,108 |
ESH Hospitality, Inc. Tranche B, term loan 5% 6/24/19 (j) | | 11,310,000 | | 11,437,238 |
Skilled Healthcare Group, Inc. term loan 7% 4/9/16 (j) | | 7,040,067 | | 7,022,467 |
| | 21,354,673 |
INDUSTRIALS - 0.4% |
Commercial Services & Supplies - 0.1% |
Lineage Logistics Holdings, LLC. Tranche B, term loan 4.5% 4/7/21 (j) | | 3,990,000 | | 3,950,100 |
Bank Loan Obligations - continued |
| Principal
Amount (e) | | Value |
INDUSTRIALS - continued |
Construction & Engineering - 0.3% |
Drumm Investors LLC Tranche B, term loan 6.75% 5/4/18 (j) | | $ 11,686,667 | | $ 11,672,059 |
TOTAL INDUSTRIALS | | 15,622,159 |
TELECOMMUNICATION SERVICES - 0.6% |
Wireless Telecommunication Services - 0.6% |
Crown Castle Operating Co.: | | | | |
Tranche A, term loan 1.905% 1/31/19 (j) | | 4,553,273 | | 4,519,123 |
Tranche B 2LN, term loan 3% 1/31/21 (j) | | 9,121,019 | | 9,121,019 |
SBA Senior Finance II, LLC term loan 3.25% 3/24/21 (j) | | 11,565,000 | | 11,420,438 |
| | 25,060,580 |
UTILITIES - 0.7% |
Electric Utilities - 0.4% |
Bayonne Energy Center, LLC Tranche B, term loan 6/30/21 (l) | | 1,555,000 | | 1,564,719 |
EquiPower Resources Holdings LLC: | | | | |
Tranche B 1LN, term loan 4.25% 12/21/18 (j) | | 4,974,619 | | 4,987,056 |
Tranche C, term loan 4.25% 12/31/19 (j) | | 1,148,814 | | 1,151,686 |
Essential Power LLC Tranche B, term loan 4.75% 8/8/19 (j) | | 3,397,816 | | 3,414,806 |
La Frontera Generation, LLC Tranche B, term loan 4.5% 9/30/20 (j) | | 6,634,947 | | 6,660,160 |
| | 17,778,427 |
Independent Power Producers & Energy Traders - 0.3% |
Calpine Corp. Tranche B 4LN, term loan 4% 10/31/20 (j) | | 1,990,000 | | 1,990,000 |
Tempus Public Foundation Generation Holdings LLC Tranche B, term loan 4.75% 12/31/17 (j) | | 9,904,975 | | 9,533,538 |
| | 11,523,538 |
TOTAL UTILITIES | | 29,301,965 |
TOTAL BANK LOAN OBLIGATIONS (Cost $323,405,617) |
323,571,350
|
Preferred Securities - 0.0% |
| Principal
Amount (e) | | Value |
FINANCIALS - 0.0% |
Diversified Financial Services - 0.0% |
Crest Clarendon Street 2002-1 Ltd. Series 2002-1A Class PS, 12/28/35 (h) | | $ 500,000 | | $ 25,000 |
Crest Dartmouth Street 2003 1 Ltd. Series 2003-1A Class PS, 6/28/38 (h) | | 1,220,000 | | 905,362 |
| | 930,362 |
TOTAL PREFERRED SECURITIES (Cost $1,297,346) |
930,362
|
Money Market Funds - 7.2% |
| Shares | | |
Fidelity Cash Central Fund, 0.11% (b) | 276,650,517 | | 276,650,517 |
Fidelity Securities Lending Cash Central Fund, 0.11% (b)(c) | 25,440,125 | | 25,440,125 |
TOTAL MONEY MARKET FUNDS (Cost $302,090,642) |
302,090,642
|
TOTAL INVESTMENT PORTFOLIO - 100.4% (Cost $3,919,805,033) | | 4,188,693,860 |
NET OTHER ASSETS (LIABILITIES) - (0.4)% | | (14,717,180) |
NET ASSETS - 100% | $ 4,173,976,680 |
Currency Abbreviations |
CAD | - | Canadian dollar |
Legend |
(a) Non-income producing |
(b) Affiliated fund that is generally available only to investment companies and other accounts managed by Fidelity Investments. The rate quoted is the annualized seven-day yield of the fund at period end. A complete unaudited listing of the fund's holdings as of its most recent quarter end is available upon request. In addition, each Fidelity Central Fund's financial statements, which are not covered by the Fund's Report of Independent Registered Public Accounting Firm, are available on the SEC's website or upon request. |
(c) Investment made with cash collateral received from securities on loan. |
(d) Non-income producing - Security is in default. |
(e) Amount is stated in United States dollars unless otherwise noted. |
(f) Security or a portion of the security is on loan at period end. |
(g) Affiliated company |
(h) Security exempt from registration under Rule 144A of the Securities Act of 1933. These securities may be resold in transactions exempt from registration, normally to qualified institutional buyers. At the end of the period, the value of these securities amounted to $610,513,249 or 14.6% of net assets. |
(i) Security or a portion of the security purchased on a delayed delivery or when-issued basis. |
(j) Coupon rates for floating and adjustable rate securities reflect the rates in effect at period end. |
(k) Security represents right to receive monthly interest payments on an underlying pool of mortgages or assets. Principal shown is the outstanding par amount of the pool as of the end of the period. |
(l) The coupon rate will be determined upon settlement of the loan after period end. |
(m) Restricted securities - Investment in securities not registered under the Securities Act of 1933 (excluding 144A issues). At the end of the period, the value of restricted securities (excluding 144A issues) amounted to $8,596,772 or 0.2% of net assets. |
Additional information on each restricted holding is as follows: |
Security | Acquisition Date | Acquisition Cost |
ACGS Series 2004-1 Class P, 7.4605% 8/1/19 | 2/17/11 | $ 1,556,705 |
Fannie Mae REMIC Trust Series 2001-W3 subordinate REMIC pass thru certificates, Class B3, 7% 9/25/41 | 5/21/03 | $ 98,189 |
Fannie Mae REMIC Trust Series 2003-W1 subordinate REMIC pass thru certificates, Class B3, 4.5664% 12/25/42 | 3/25/03 | $ 109,726 |
GSR Mortgage Loan Trust Series 2005-HE3 Class B3, 3.905% 6/25/35 | 6/3/05 | $ 187,271 |
Stanley Martin Communities LLC Class B | 8/3/05 - 3/1/07 | $ 4,244,574 |
Affiliated Central Funds |
Information regarding fiscal year to date income earned by the Fund from investments in Fidelity Central Funds is as follows: |
Fund | Income earned |
Fidelity Cash Central Fund | $ 269,973 |
Fidelity Securities Lending Cash Central Fund | 69,287 |
Total | $ 339,260 |
Other Affiliated Issuers |
An affiliated company is a company in which the Fund has ownership of at least 5% of the voting securities. Fiscal year to date transactions with companies which are or were affiliates are as follows: |
Affiliate | Value,
beginning of
period | Purchases | Sales
Proceeds | Dividend
Income | Value,
end of
period |
Acadia Realty Trust (SBI) | $ 67,194,255 | $ 23,354,610 | $ - | $ 2,449,846 | $ 98,809,206 |
Arbor Realty Trust, Inc. | 21,107,288 | 1,885,885 | - | 1,477,398 | 21,697,653 |
Arbor Realty Trust, Inc. 7.375% | - | 8,259,665 | - | 154,098 | 8,162,637 |
Arbor Realty Trust, Inc. Series A, 8.25% | 4,748,025 | - | - | 389,996 | 4,727,225 |
Arbor Realty Trust, Inc. Series B, 7.75% | 5,901,600 | - | - | 493,422 | 5,882,400 |
Arbor Realty Trust, Inc. Series C, 8.50% | - | 2,500,000 | - | 55,490 | 2,525,000 |
Terreno Realty Corp. | 22,091,704 | 4,979,683 | - | 529,220 | - |
Terreno Realty Corp. Series A, 7.75% | 5,523,887 | - | - | 414,024 | - |
Total | $ 126,566,759 | $ 40,979,843 | $ - | $ 5,963,494 | $ 141,804,121 |
Other Information |
The following is a summary of the inputs used, as of July 31, 2014, involving the Fund's assets and liabilities carried at fair value. The inputs or methodology used for valuing securities may not be an indication of the risk associated with investing in those securities. For more information on valuation inputs, and their aggregation into the levels used in the tables below, please refer to the Investment Valuation section in the accompanying Notes to Financial Statements. |
Valuation Inputs at Reporting Date: |
Description | Total | Level 1 | Level 2 | Level 3 |
Investments in Securities: | | | | |
Equities: | | | | |
Consumer Discretionary | $ 10,655,683 | $ 3,727,392 | $ - | $ 6,928,291 |
Financials | 2,025,032,649 | 1,995,068,514 | 27,354,361 | 2,609,774 |
Materials | 10,541,237 | 10,541,237 | - | - |
Corporate Bonds | 871,661,140 | - | 871,160,983 | 500,157 |
Asset-Backed Securities | 90,148,525 | - | 81,964,524 | 8,184,001 |
Collateralized Mortgage Obligations | 10,743,846 | - | 10,017,369 | 726,477 |
Commercial Mortgage Securities | 543,318,426 | - | 532,005,572 | 11,312,854 |
Bank Loan Obligations | 323,571,350 | - | 276,160,668 | 47,410,682 |
Preferred Securities | 930,362 | - | - | 930,362 |
Money Market Funds | 302,090,642 | 302,090,642 | - | - |
Total Investments in Securities: | $ 4,188,693,860 | $ 2,311,427,785 | $ 1,798,663,477 | $ 78,602,598 |
Valuation Inputs at Reporting Date: |
The following is a reconciliation of Investments in Securities for which Level 3 inputs were used in determining value: |
Investments in Securities: | |
Bank Loan Obligations | |
Beginning Balance | $ 105,573,756 |
Net Realized Gain (Loss) on Investment Securities | 289,125 |
Net Unrealized Gain (Loss) on Investment Securities | (866,510) |
Cost of Purchases | - |
Proceeds of Sales | (58,246,664) |
Amortization/Accretion | 140,775 |
Transfers into Level 3 | 520,200 |
Transfers out of Level 3 | - |
Ending Balance | $ 47,410,682 |
The change in unrealized gain (loss) for the period attributable to Level 3 securities held at July 31, 2014 | $ (413,512) |
Other Investments in Securities | |
Beginning Balance | $ 53,636,499 |
Net Realized Gain (Loss) on Investment Securities | (4,200,658) |
Net Unrealized Gain (Loss) on Investment Securities | 9,034,288 |
Cost of Purchases | 169,932 |
Proceeds of Sales | (23,014,379) |
Amortization/Accretion | 1,379,987 |
Transfers into Level 3 | - |
Transfers out of Level 3 | (5,813,753) |
Ending Balance | $ 31,191,916 |
The change in unrealized gain (loss) for the period attributable to Level 3 securities held at July 31, 2014 | $ 4,647,489 |
The information used in the above reconciliations represents fiscal year to date activity for any Investments in Securities identified as using Level 3 inputs at either the beginning or the end of the current fiscal period. Transfers in or out of Level 3 represent the beginning value of any Security or Instrument where a change in the pricing level occurred from the beginning to the end of the period. The cost of purchases and the proceeds of sales may include securities received or delivered through corporate actions or exchanges. Realized and unrealized gains (losses) disclosed in the reconciliations are included in Net Gain (Loss) on the Fund's Statement of Operations. |
Other Information |
The composition of credit quality ratings as a percentage of net assets is as follows (Unaudited): |
U.S. Government and U.S. Government Agency Obligations | 0.4% |
AAA,AA,A | 4.6% |
BBB | 11.3% |
BB | 9.1% |
B | 11.4% |
CCC,CC,C | 1.0% |
D | 0.0% |
Not Rated | 6.4% |
Equities | 49.0% |
Short-Term Investments and Net Other Assets | 6.8% |
| 100.0% |
We have used ratings from Moody's Investors Service, Inc. Where Moody's® ratings are not available, we have used S&P® ratings. All ratings are as of the date indicated and do not reflect subsequent changes. |
See accompanying notes which are an integral part of the financial statements.
Annual Report
Statement of Assets and Liabilities
| July 31, 2014 |
| | |
Assets | | |
Investment in securities, at value (including securities loaned of $24,482,448) - See accompanying schedule: Unaffiliated issuers (cost $3,496,917,698) | $ 3,744,799,097 | |
Fidelity Central Funds (cost $302,090,642) | 302,090,642 | |
Other affiliated issuers (cost $120,796,693) | 141,804,121 | |
Total Investments (cost $3,919,805,033) | | $ 4,188,693,860 |
Cash | | 2,277,247 |
Receivable for investments sold | | 10,882,971 |
Receivable for fund shares sold | | 6,965,247 |
Dividends receivable | | 2,319,908 |
Interest receivable | | 17,945,180 |
Distributions receivable from Fidelity Central Funds | | 33,222 |
Receivable from investment adviser for expense reductions | | 931 |
Other receivables | | 14,103 |
Total assets | | 4,229,132,669 |
| | |
Liabilities | | |
Payable for investments purchased
Regular delivery | $ 19,236,871 | |
Delayed delivery | 2,505,000 | |
Payable for fund shares redeemed | 4,769,953 | |
Accrued management fee | 1,934,696 | |
Distribution and service plan fees payable | 305,492 | |
Other affiliated payables | 869,606 | |
Other payables and accrued expenses | 94,246 | |
Collateral on securities loaned, at value | 25,440,125 | |
Total liabilities | | 55,155,989 |
| | |
Net Assets | | $ 4,173,976,680 |
Net Assets consist of: | | |
Paid in capital | | $ 3,809,242,280 |
Undistributed net investment income | | 34,654,174 |
Accumulated undistributed net realized gain (loss) on investments and foreign currency transactions | | 61,167,863 |
Net unrealized appreciation (depreciation) on investments and assets and liabilities in foreign currencies | | 268,912,363 |
Net Assets | | $ 4,173,976,680 |
See accompanying notes which are an integral part of the financial statements.
Annual Report
Statement of Assets and Liabilities - continued
| July 31, 2014 |
| | |
Calculation of Maximum Offering Price Class A:
Net Asset Value and redemption price per share ($442,271,076 ÷ 37,302,014 shares) | | $ 11.86 |
| | |
Maximum offering price per share (100/96.00 of $11.86) | | $ 12.35 |
Class T:
Net Asset Value and redemption price per share ($48,163,837 ÷ 4,060,118 shares) | | $ 11.86 |
| | |
Maximum offering price per share (100/96.00 of $11.86) | | $ 12.35 |
Class C:
Net Asset Value and offering price per share ($246,305,622 ÷ 20,927,526 shares)A | | $ 11.77 |
| | |
Real Estate Income:
Net Asset Value, offering price and redemption price per share ($2,627,381,994 ÷ 220,647,573 shares) | | $ 11.91 |
| | |
Institutional Class:
Net Asset Value, offering price and redemption price per share ($809,854,151 ÷ 68,165,791 shares) | | $ 11.88 |
A Redemption price per share is equal to net asset value less any applicable contingent deferred sales charge.
See accompanying notes which are an integral part of the financial statements.
Annual Report
Financial Statements - continued
Statement of Operations
| Year ended July 31, 2014 |
| | |
Investment Income | | |
Dividends (including $5,963,494 earned from other affiliated issuers) | | $ 90,314,113 |
Interest | | 114,777,571 |
Income from Fidelity Central Funds | | 339,260 |
Total income | | 205,430,944 |
| | |
Expenses | | |
Management fee | $ 21,222,992 | |
Transfer agent fees | 8,548,801 | |
Distribution and service plan fees | 3,173,091 | |
Accounting and security lending fees | 1,324,787 | |
Custodian fees and expenses | 58,383 | |
Independent trustees' compensation | 15,901 | |
Registration fees | 199,090 | |
Audit | 172,246 | |
Legal | 12,720 | |
Miscellaneous | 35,095 | |
Total expenses before reductions | 34,763,106 | |
Expense reductions | (73,686) | 34,689,420 |
Net investment income (loss) | | 170,741,524 |
Realized and Unrealized Gain (Loss) Net realized gain (loss) on: | | |
Investment securities: | | |
Unaffiliated issuers | 105,441,630 | |
Other affiliated issuers | 442,084 | |
Foreign currency transactions | 662 | |
Total net realized gain (loss) | | 105,884,376 |
Change in net unrealized appreciation (depreciation) on: Investment securities | 30,350,617 | |
Assets and liabilities in foreign currencies | (1,671) | |
Total change in net unrealized appreciation (depreciation) | | 30,348,946 |
Net gain (loss) | | 136,233,322 |
Net increase (decrease) in net assets resulting from operations | | $ 306,974,846 |
See accompanying notes which are an integral part of the financial statements.
Annual Report
Statement of Changes in Net Assets
| Year ended
July 31,
2014 | Year ended
July 31,
2013 |
Increase (Decrease) in Net Assets | | |
Operations | | |
Net investment income (loss) | $ 170,741,524 | $ 172,485,619 |
Net realized gain (loss) | 105,884,376 | 73,494,885 |
Change in net unrealized appreciation (depreciation) | 30,348,946 | 61,789,333 |
Net increase (decrease) in net assets resulting
from operations | 306,974,846 | 307,769,837 |
Distributions to shareholders from net investment income | (172,155,251) | (159,910,438) |
Distributions to shareholders from net realized gain | (78,297,244) | (51,534,162) |
Total distributions | (250,452,495) | (211,444,600) |
Share transactions - net increase (decrease) | (6,051,637) | 1,340,100,515 |
Redemption fees | 438,384 | 782,946 |
Total increase (decrease) in net assets | 50,909,098 | 1,437,208,698 |
| | |
Net Assets | | |
Beginning of period | 4,123,067,582 | 2,685,858,884 |
End of period (including undistributed net investment income of $34,654,174 and undistributed net investment income of $39,267,501, respectively) | $ 4,173,976,680 | $ 4,123,067,582 |
See accompanying notes which are an integral part of the financial statements.
Annual Report
Financial Highlights - Class A
Years ended July 31, | 2014 | 2013 | 2012 | 2011 | 2010 H |
Selected Per-Share Data | | | | | |
Net asset value, beginning of period | $ 11.67 | $ 11.26 | $ 10.73 | $ 9.94 | $ 9.95 |
Income from Investment Operations | | | | | |
Net investment income (loss) E | .49 | .54 | .52 | .53 | .18 |
Net realized and unrealized gain (loss) | .44 | .60 | .61 | .76 | (.04) |
Total from investment operations | .93 | 1.14 | 1.13 | 1.29 | .14 |
Distributions from net investment income | (.50) | (.53) | (.51) | (.50) | (.15) |
Distributions from net realized gain | (.24) | (.20) | (.10) | - | - |
Total distributions | (.74) | (.73) | (.60) K | (.50) | (.15) |
Redemption fees added to paid in capital E, J | - | - | - | - | - |
Net asset value, end of period | $ 11.86 | $ 11.67 | $ 11.26 | $ 10.73 | $ 9.94 |
Total ReturnB, C, D | 8.49% | 10.45% | 11.24% | 13.27% | 1.46% |
Ratios to Average Net Assets F, I | | | | | |
Expenses before reductions | 1.06% | 1.08% | 1.12% | 1.13% | 1.09%A |
Expenses net of fee waivers, if any | 1.05% | 1.08% | 1.12% | 1.13% | 1.09%A |
Expenses net of all reductions | 1.05% | 1.07% | 1.11% | 1.12% | 1.09%A |
Net investment income (loss) | 4.28% | 4.62% | 4.89% | 5.00% | 6.23%A |
Supplemental Data | | | | | |
Net assets, end of period (000 omitted) | $ 442,271 | $ 378,269 | $ 137,352 | $ 60,283 | $ 3,830 |
Portfolio turnover rateG | 29% | 26% | 27% | 25% | 28% |
A Annualized
B Total returns for periods of less than one year are not annualized.
C Total returns would have been lower if certain expenses had not been reduced during the applicable periods shown.
D Total returns do not include the effect of the sales charges.
E Calculated based on average shares outstanding during the period.
F Fees and expenses of any underlying Fidelity Central Funds are not included in the Fund's expense ratio. The Fund indirectly bears its proportionate share of the expenses of any underlying Fidelity Central Funds.
G Amount does not include the portfolio activity of any underlying Fidelity Central Funds.
H For the period April 14, 2010 (commencement of sale of shares) to July 31, 2010.
I Expense ratios reflect operating expenses of the class. Expenses before reductions do not reflect amounts reimbursed by the investment adviser or reductions from brokerage service arrangements or reductions from other expense offset arrangements and do not represent the amount paid by the class during periods when reimbursements or reductions occur. Expense ratios before reductions for start-up periods may not be representative of longer-term operating periods. Expenses net of fee waivers reflect expenses after reimbursement by the investment adviser but prior to reductions from brokerage service arrangements or other expense offset arrangements. Expenses net of all reductions represent the net expenses paid by the class.
J Amount represents less than $.01 per share.
K Total distributions of $.60 per share is comprised of distributions from net investment income of $.505 and distributions from net realized gain of $.097 per share.
See accompanying notes which are an integral part of the financial statements.
Annual Report
Financial Highlights - Class T
Years ended July 31, | 2014 | 2013 | 2012 | 2011 | 2010 H |
Selected Per-Share Data | | | | | |
Net asset value, beginning of period | $ 11.67 | $ 11.26 | $ 10.72 | $ 9.94 | $ 9.95 |
Income from Investment Operations | | | | | |
Net investment income (loss) E | .49 | .54 | .52 | .52 | .17 |
Net realized and unrealized gain (loss) | .43 | .60 | .62 | .76 | (.03) |
Total from investment operations | .92 | 1.14 | 1.14 | 1.28 | .14 |
Distributions from net investment income | (.50) | (.53) | (.50) | (.50) | (.15) |
Distributions from net realized gain | (.24) | (.20) | (.10) | - | - |
Total distributions | (.73)K | (.73) | (.60) | (.50) | (.15) |
Redemption fees added to paid in capital E, J | - | - | - | - | - |
Net asset value, end of period | $ 11.86 | $ 11.67 | $ 11.26 | $ 10.72 | $ 9.94 |
Total ReturnB, C, D | 8.44% | 10.42% | 11.33% | 13.11% | 1.45% |
Ratios to Average Net Assets F, I | | | | | |
Expenses before reductions | 1.08% | 1.08% | 1.11% | 1.16% | 1.17%A |
Expenses net of fee waivers, if any | 1.08% | 1.08% | 1.11% | 1.16% | 1.17%A |
Expenses net of all reductions | 1.07% | 1.08% | 1.11% | 1.16% | 1.17%A |
Net investment income (loss) | 4.26% | 4.61% | 4.90% | 4.96% | 5.92%A |
Supplemental Data | | | | | |
Net assets, end of period (000 omitted) | $ 48,164 | $ 46,198 | $ 26,143 | $ 7,626 | $ 862 |
Portfolio turnover rateG | 29% | 26% | 27% | 25% | 28% |
A Annualized
B Total returns for periods of less than one year are not annualized.
C Total returns would have been lower if certain expenses had not been reduced during the applicable periods shown.
D Total returns do not include the effect of the sales charges.
E Calculated based on average shares outstanding during the period.
F Fees and expenses of any underlying Fidelity Central Funds are not included in the Fund's expense ratio. The Fund indirectly bears its proportionate share of the expenses of any underlying Fidelity Central Funds.
G Amount does not include the portfolio activity of any underlying Fidelity Central Funds.
H For the period April 14, 2010 (commencement of sale of shares) to July 31, 2010.
I Expense ratios reflect operating expenses of the class. Expenses before reductions do not reflect amounts reimbursed by the investment adviser or reductions from brokerage service arrangements or reductions from other expense offset arrangements and do not represent the amount paid by the class during periods when reimbursements or reductions occur. Expense ratios before reductions for start-up periods may not be representative of longer-term operating periods. Expenses net of fee waivers reflect expenses after reimbursement by the investment adviser but prior to reductions from brokerage service arrangements or other expense offset arrangements. Expenses net of all reductions represent the net expenses paid by the class.
J Amount represents less than $.01 per share.
K Total distributions of $.73 per share is comprised of distributions from net investment income of $.496 and distributions from net realized gain of $.236 per share.
See accompanying notes which are an integral part of the financial statements.
Annual Report
Financial Highlights - Class C
Years ended July 31, | 2014 | 2013 | 2012 | 2011 | 2010 H |
Selected Per-Share Data | | | | | |
Net asset value, beginning of period | $ 11.59 | $ 11.20 | $ 10.67 | $ 9.93 | $ 9.95 |
Income from Investment Operations | | | | | |
Net investment income (loss) E | .40 | .45 | .44 | .45 | .15 |
Net realized and unrealized gain (loss) | .43 | .60 | .62 | .74 | (.03) |
Total from investment operations | .83 | 1.05 | 1.06 | 1.19 | .12 |
Distributions from net investment income | (.42) | (.46) | (.43) | (.45) | (.14) |
Distributions from net realized gain | (.24) | (.20) | (.10) | - | - |
Total distributions | (.65) K | (.66) | (.53) | (.45) | (.14) |
Redemption fees added to paid in capital E, J | - | - | - | - | - |
Net asset value, end of period | $ 11.77 | $ 11.59 | $ 11.20 | $ 10.67 | $ 9.93 |
Total ReturnB, C, D | 7.66% | 9.66% | 10.49% | 12.25% | 1.29% |
Ratios to Average Net Assets F, I | | | | | |
Expenses before reductions | 1.79% | 1.81% | 1.87% | 1.89% | 1.86%A |
Expenses net of fee waivers, if any | 1.79% | 1.81% | 1.87% | 1.89% | 1.86%A |
Expenses net of all reductions | 1.79% | 1.81% | 1.87% | 1.89% | 1.86%A |
Net investment income (loss) | 3.54% | 3.88% | 4.14% | 4.23% | 5.21%A |
Supplemental Data | | | | | |
Net assets, end of period (000 omitted) | $ 246,306 | $ 204,012 | $ 52,780 | $ 21,555 | $ 836 |
Portfolio turnover rateG | 29% | 26% | 27% | 25% | 28% |
A Annualized
B Total returns for periods of less than one year are not annualized.
C Total returns would have been lower if certain expenses had not been reduced during the applicable periods shown.
D Total returns do not include the effect of the contingent deferred sales charge.
E Calculated based on average shares outstanding during the period.
F Fees and expenses of any underlying Fidelity Central Funds are not included in the Fund's expense ratio. The Fund indirectly bears its proportionate share of the expenses of any underlying Fidelity Central Funds.
G Amount does not include the portfolio activity of any underlying Fidelity Central Funds.
H For the period April 14, 2010 (commencement of sale of shares) to July 31, 2010.
I Expense ratios reflect operating expenses of the class. Expenses before reductions do not reflect amounts reimbursed by the investment adviser or reductions from brokerage service arrangements or reductions from other expense offset arrangements and do not represent the amount paid by the class during periods when reimbursements or reductions occur. Expense ratios before reductions for start-up periods may not be representative of longer-term operating periods. Expenses net of fee waivers reflect expenses after reimbursement by the investment adviser but prior to reductions from brokerage service arrangements or other expense offset arrangements. Expenses net of all reductions represent the net expenses paid by the class.
J Amount represents less than $.01 per share.
K Total distributions of $.65 per share is comprised of distributions from net investment income of $.417 and distributions from net realized gain of $.236 per share.
See accompanying notes which are an integral part of the financial statements.
Annual Report
Financial Highlights - Real Estate Income
Years ended July 31, | 2014 | 2013 | 2012 | 2011 | 2010 |
Selected Per-Share Data | | | | | |
Net asset value, beginning of period | $ 11.71 | $ 11.29 | $ 10.75 | $ 9.95 | $ 8.21 |
Income from Investment Operations | | | | | |
Net investment income (loss) B | .52 | .57 | .54 | .55 | .53 |
Net realized and unrealized gain (loss) | .44 | .60 | .62 | .76 | 1.73 |
Total from investment operations | .96 | 1.17 | 1.16 | 1.31 | 2.26 |
Distributions from net investment income | (.53) | (.55) | (.52) | (.51) | (.52) |
Distributions from net realized gain | (.24) | (.20) | (.10) | - | - |
Total distributions | (.76) G | (.75) | (.62) | (.51) | (.52) |
Redemption fees added to paid in capital B, F | - | - | - | - | - |
Net asset value, end of period | $ 11.91 | $ 11.71 | $ 11.29 | $ 10.75 | $ 9.95 |
Total ReturnA | 8.78% | 10.71% | 11.50% | 13.41% | 28.29% |
Ratios to Average Net Assets C, E | | | | | |
Expenses before reductions | .83% | .84% | .90% | .92% | .97% |
Expenses net of fee waivers, if any | .83% | .84% | .89% | .92% | .96% |
Expenses net of all reductions | .83% | .84% | .89% | .92% | .96% |
Net investment income (loss) | 4.50% | 4.85% | 5.12% | 5.21% | 5.60% |
Supplemental Data | | | | | |
Net assets, end of period (000 omitted) | $ 2,627,382 | $ 2,884,545 | $ 2,252,149 | $ 1,660,063 | $ 1,030,393 |
Portfolio turnover rateD | 29% | 26% | 27% | 25% | 28% |
A Total returns would have been lower if certain expenses had not been reduced during the applicable periods shown.
B Calculated based on average shares outstanding during the period.
C Fees and expenses of any underlying Fidelity Central Funds are not included in the Fund's expense ratio. The Fund indirectly bears its proportionate share of the expenses of any underlying Fidelity Central Funds.
D Amount does not include the portfolio activity of any underlying Fidelity Central Funds.
E Expense ratios reflect operating expenses of the class. Expenses before reductions do not reflect amounts reimbursed by the investment adviser or reductions from brokerage service arrangements or reductions from other expense offset arrangements and do not represent the amount paid by the class during periods when reimbursements or reductions occur. Expenses net of fee waivers reflect expenses after reimbursement by the investment adviser but prior to reductions from brokerage service arrangements or other expense offset arrangements. Expenses net of all reductions represent the net expenses paid by the class.
F Amount represents less than $.01 per share.
G Total distributions of $.76 per share is comprised of distributions from net investment income of $.525 and distributions from net realized gain of $.236 per share.
See accompanying notes which are an integral part of the financial statements.
Annual Report
Financial Highlights - Institutional Class
Years ended July 31, | 2014 | 2013 | 2012 | 2011 | 2010 G |
Selected Per-Share Data | | | | | |
Net asset value, beginning of period | $ 11.69 | $ 11.28 | $ 10.74 | $ 9.95 | $ 9.95 |
Income from Investment Operations | | | | | |
Net investment income (loss) D | .52 | .57 | .55 | .55 | .19 |
Net realized and unrealized gain (loss) | .44 | .60 | .62 | .76 | (.04) |
Total from investment operations | .96 | 1.17 | 1.17 | 1.31 | .15 |
Distributions from net investment income | (.53) | (.56) | (.53) | (.52) | (.15) |
Distributions from net realized gain | (.24) | (.20) | (.10) | - | - |
Total distributions | (.77) | (.76) | (.63) | (.52) | (.15) |
Redemption fees added to paid in capital D, I | - | - | - | - | - |
Net asset value, end of period | $ 11.88 | $ 11.69 | $ 11.28 | $ 10.74 | $ 9.95 |
Total ReturnB, C | 8.76% | 10.72% | 11.62% | 13.44% | 1.58% |
Ratios to Average Net Assets E, H | | | | | |
Expenses before reductions | .78% | .80% | .84% | .89% | .85%A |
Expenses net of fee waivers, if any | .78% | .80% | .84% | .89% | .85%A |
Expenses net of all reductions | .78% | .80% | .84% | .89% | .85%A |
Net investment income (loss) | 4.55% | 4.89% | 5.17% | 5.24% | 6.70%A |
Supplemental Data | | | | | |
Net assets, end of period (000 omitted) | $ 809,854 | $ 610,045 | $ 217,435 | $ 43,282 | $ 2,930 |
Portfolio turnover rateF | 29% | 26% | 27% | 25% | 28% |
A Annualized
B Total returns for periods of less than one year are not annualized.
C Total returns would have been lower if certain expenses had not been reduced during the applicable periods shown.
D Calculated based on average shares outstanding during the period.
E Fees and expenses of any underlying Fidelity Central Funds are not included in the Fund's expense ratio. The Fund indirectly bears its proportionate share of the expenses of any underlying Fidelity Central Funds.
F Amount does not include the portfolio activity of any underlying Fidelity Central Funds.
G For the period April 14, 2010 (commencement of sale of shares) to July 31, 2010.
H Expense ratios reflect operating expenses of the class. Expenses before reductions do not reflect amounts reimbursed by the investment adviser or reductions from brokerage service arrangements or reductions from other expense offset arrangements and do not represent the amount paid by the class during periods when reimbursements or reductions occur. Expense ratios before reductions for start-up periods may not be representative of longer-term operating periods. Expenses net of fee waivers reflect expenses after reimbursement by the investment adviser but prior to reductions from brokerage service arrangements or other expense offset arrangements. Expenses net of all reductions represent the net expenses paid by the class.
I Amount represents less than $.01 per share.
See accompanying notes which are an integral part of the financial statements.
Annual Report
Notes to Financial Statements
For the period ended July 31, 2014
1. Organization.
Fidelity Real Estate Income Fund (the Fund) is a fund of Fidelity Securities Fund (the Trust) and is authorized to issue an unlimited number of shares. The Trust is registered under the Investment Company Act of 1940, as amended (the 1940 Act), as an open-end management investment company organized as a Massachusetts business trust. The Fund offers Class A, Class T, Class C, Real Estate Income and Institutional Class shares, each of which has equal rights as to assets and voting privileges. Each class has exclusive voting rights with respect to matters that affect that class.
2. Investments in Fidelity Central Funds.
The Fund invests in Fidelity Central Funds, which are open-end investment companies generally available only to other investment companies and accounts managed by the investment adviser and its affiliates. The Fund's Schedule of Investments lists each of the Fidelity Central Funds held as of period end, if any, as an investment of the Fund, but does not include the underlying holdings of each Fidelity Central Fund. As an Investing Fund, the Fund indirectly bears its proportionate share of the expenses of the underlying Fidelity Central Funds.
The Money Market Central Funds seek preservation of capital and current income and are managed by Fidelity Investments Money Management, Inc. (FIMM), an affiliate of the investment adviser. Annualized expenses of the Money Market Central Funds as of their most recent shareholder report date are less than .01%.
A complete unaudited list of holdings for each Fidelity Central Fund is available upon request or at the Securities and Exchange Commission (the SEC) website at www.sec.gov. In addition, the financial statements of the Fidelity Central Funds, which are not covered by the Fund's Report of Independent Registered Public Accounting Firm, are available on the SEC website or upon request.
3. Significant Accounting Policies.
The financial statements have been prepared in conformity with accounting principles generally accepted in the United States of America (GAAP), which require management to make certain estimates and assumptions at the date of the financial statements. Actual results could differ from those estimates. Subsequent events, if any, through the date that the financial statements were issued have been evaluated in the preparation of the financial statements. The following summarizes the significant accounting policies of the Fund:
Investment Valuation. Investments are valued as of 4:00 p.m. Eastern time on the last calendar day of the period. In accordance with valuation policies and procedures approved by the Board of Trustees (the Board), the Fund attempts to obtain prices from
Annual Report
Notes to Financial Statements - continued
3. Significant Accounting Policies - continued
Investment Valuation - continued
one or more third party pricing vendors or brokers to value its investments. When current market prices, quotations or currency exchange rates are not readily available or reliable, investments will be fair valued in good faith by the Fidelity Management & Research Company (FMR) Fair Value Committee (the Committee), in accordance with procedures adopted by the Board. Factors used in determining fair value vary by investment type and may include market or investment specific events, changes in interest rates and credit quality. The frequency with which these procedures are used cannot be predicted and they may be utilized to a significant extent. The Committee oversees the Fund's valuation policies and procedures and is responsible for approving and reporting to the Board all fair value determinations.
The Fund categorizes the inputs to valuation techniques used to value its investments into a disclosure hierarchy consisting of three levels as shown below:
Level 1 - quoted prices in active markets for identical investments
Level 2 - other significant observable inputs (including quoted prices for similar investments, interest rates, prepayment speeds, etc.)
Level 3 - unobservable inputs (including the Fund's own assumptions based on the best information available)
Valuation techniques used to value the Fund's investments by major category are as follows:
Equity securities, including restricted securities, for which market quotations are readily available, are valued at the last reported sale price or official closing price as reported by a third party pricing vendor on the primary market or exchange on which they are traded and are categorized as Level 1 in the hierarchy. In the event there were no sales during the day or closing prices are not available, securities are valued at the last quoted bid price or may be valued using the last available price and are generally categorized as Level 2 in the hierarchy. For foreign equity securities, when market or security specific events arise, comparisons to the valuation of American Depositary Receipts (ADRs), futures contracts, Exchange-Traded Funds (ETFs) and certain indexes as well as quoted prices for similar securities may be used and would be categorized as Level 2 in the hierarchy. Utilizing these techniques may result in transfers between Level 1 and Level 2. For equity securities, including restricted securities, where observable inputs are limited, assumptions about market activity and risk are used and these securities may be categorized as Level 3 in the hierarchy.
Annual Report
3. Significant Accounting Policies - continued
Investment Valuation - continued
Debt securities, including restricted securities, are valued based on evaluated prices received from third party pricing vendors or from brokers who make markets in such securities. Corporate bonds, bank loan obligations and preferred securities are valued by pricing vendors who utilize matrix pricing which considers yield or price of bonds of comparable quality, coupon, maturity and type or by broker-supplied prices. Asset backed securities, collateralized mortgage obligations and commercial mortgage securities are valued by pricing vendors who utilize matrix pricing which considers prepayment speed assumptions, attributes of the collateral, yield or price of bonds of comparable quality, coupon, maturity and type or by broker-supplied prices. When independent prices are unavailable or unreliable, debt securities may be valued utilizing pricing methodologies which consider similar factors that would be used by third party pricing vendors. Debt securities are generally categorized as Level 2 in the hierarchy but may be Level 3 depending on the circumstances.
Investments in open-end mutual funds, including the Fidelity Central Funds, are valued at their closing net asset value (NAV) each business day and are categorized as Level 1 in the hierarchy.
The following provides information on Level 3 securities held by the Fund that were valued at period end based on unobservable inputs. These amounts exclude valuations provided by a broker.
Annual Report
Notes to Financial Statements - continued
3. Significant Accounting Policies - continued
Investment Valuation - continued
Asset Type | Fair Value at
07/31/14 | Valuation
Technique(s) | Unobservable
Input | Amount or Range/
Weighted
Average | Impact to
Valuation
from an
Increase in
Input* |
Asset-Backed Securities | $ 7,282,217 | Discounted cash flow | Yield | 3.0% - 10.4% / 4.5% | Decrease |
| | Expected distribution | Recovery rate | 0.0% | Increase |
Bank Loan
Obligations | $46,898,132 | Discounted cash flow | Yield | 2.1% - 10.5% / 6.1% | Decrease |
Collateralized Mortgage
Obligations | $ 726,477 | Discounted cash flow | Yield | 4.1% - 40.0% / 11.1% | Decrease |
Commercial Mortgage Securities | $ 6,929,493 | Discounted cash flow | Yield | 2.1% - 10.4% / 2.1% | Decrease |
| | Market comparable | Spread | 13.0% | Decrease |
Common Stocks | $ 6,928,291 | Adjusted book value | Book value
multiple | 1.3 | Increase |
Corporate Bonds | $ 500,157 | Discounted cash flow | Discount rate | 20.0% | Decrease |
| | Expected distribution | Recovery rate | 0.0% | Increase |
Preferred
Securities | $ 905,362 | Discounted cash flow | Yield | 13.0% | Decrease |
* Represents the expected directional change in the fair value of the Level 3 investments that would result from an increase in the corresponding input. A decrease to the unobservable input would have the opposite effect. Significant changes in these inputs could result in significantly higher or lower fair value measurements.
Changes in valuation techniques may result in transfers in or out of an assigned level within the disclosure hierarchy. The aggregate value of investments by input level, as of July 31, 2014, as well as a roll forward of Level 3 investments, is included at the end of the Fund's Schedule of Investments.
Foreign Currency. The Fund may use foreign currency contracts to facilitate transactions in foreign-denominated securities. Gains and losses from these transactions may arise from changes in the value of the foreign currency or if the counterparties do not perform under the contracts' terms.
Foreign-denominated assets, including investment securities, and liabilities are translated into U.S. dollars at the exchange rates at period end. Purchases and sales of investment securities, income and dividends received and expenses denominated in foreign currencies are translated into U.S. dollars at the exchange rate in effect on the transaction date.
The effects of exchange rate fluctuations on investments are included with the net realized and unrealized gain (loss) on investment securities. Other foreign currency transactions resulting in realized and unrealized gain (loss) are disclosed separately.
Annual Report
3. Significant Accounting Policies - continued
Investment Transactions and Income. For financial reporting purposes, the Fund's investment holdings and NAV include trades executed through the end of the last business day of the period. The NAV per share for processing shareholder transactions is calculated as of the close of business of the New York Stock Exchange (NYSE), normally 4:00 p.m. Eastern time and includes trades executed through the end of the prior business day. Gains and losses on securities sold are determined on the basis of identified cost. Dividend income is recorded on the ex-dividend date, except for certain dividends from foreign securities where the ex-dividend date may have passed, which are recorded as soon as the Fund is informed of the ex-dividend date. Non-cash dividends included in dividend income, if any, are recorded at the fair market value of the securities received. Income and capital gain distributions from Fidelity Central Funds, if any, are recorded on the ex-dividend date. Distributions received on securities that represent a return of capital or capital gain are recorded as a reduction of cost of investments and/or as a realized gain. Subsequent to ex-dividend date the Fund determines the components of these distributions, based upon receipt of tax filings or other correspondence relating to the underlying investment. Interest income is accrued as earned and includes coupon interest and amortization of premium and accretion of discount on debt securities as applicable. For certain lower credit quality securitized assets that have contractual cash flows (for example, asset backed securities, collateralized mortgage obligations and commercial mortgage-backed securities), changes in estimated cash flows are periodically evaluated and the estimated yield is adjusted on a prospective basis, resulting in increases or decreases to Interest Income in the accompanying Statement of Operations. Investment income is recorded net of foreign taxes withheld where recovery of such taxes is uncertain. Debt obligations may be placed on non-accrual status and related interest income may be reduced by ceasing current accruals and writing off interest receivables when the collection of all or a portion of interest has become doubtful based on consistently applied procedures. A debt obligation is removed from non-accrual status when the issuer resumes interest payments or when collectability of interest is reasonably assured.
Class Allocations and Expenses. Investment income, realized and unrealized capital gains and losses, common expenses of the Fund, and certain fund-level expense reductions, if any, are allocated daily on a pro-rata basis to each class based on the relative net assets of each class to the total net assets of the Fund. Each class differs with respect to transfer agent and distribution and service plan fees incurred. Certain expense reductions may also differ by class. For the reporting period, the allocated portion of income and expenses to each class as a percent of its average net assets may vary due to the timing of recording these transactions in relation to fluctuating net assets of the classes. Expenses directly attributable to a fund are charged to that fund. Expenses attributable
Annual Report
Notes to Financial Statements - continued
3. Significant Accounting Policies - continued
Class Allocations and Expenses - continued
to more than one fund are allocated among the respective funds on the basis of relative net assets or other appropriate methods. Expense estimates are accrued in the period to which they relate and adjustments are made when actual amounts are known.
Income Tax Information and Distributions to Shareholders. Each year, the Fund intends to qualify as a regulated investment company under Subchapter M of the Internal Revenue Code, including distributing substantially all of its taxable income and realized gains. As a result, no provision for U.S. Federal income taxes is required. As of July 31, 2014, the Fund did not have any unrecognized tax benefits in the financial statements; nor is the Fund aware of any tax positions for which it is reasonably possible that the total amounts of unrecognized tax benefits will significantly change in the next twelve months. The Fund files a U.S. federal tax return, in addition to state and local tax returns as required. The Fund's federal income tax returns are subject to examination by the Internal Revenue Service (IRS) for a period of three fiscal years after they are filed. State and local tax returns may be subject to examination for an additional fiscal year depending on the jurisdiction. Foreign taxes are provided for based on the Fund's understanding of the tax rules and rates that exist in the foreign markets in which it invests.
Distributions are declared and recorded on the ex-dividend date. Income dividends and capital gain distributions are declared separately for each class. Income and capital gain distributions are determined in accordance with income tax regulations, which may differ from GAAP. In addition, the Fund claimed a portion of the payment made to redeeming shareholders as a distribution for income tax purposes.
Capital accounts within the financial statements are adjusted for permanent book-tax differences. These adjustments have no impact on net assets or the results of operations. Capital accounts are not adjusted for temporary book-tax differences which will reverse in a subsequent period.
Book-tax differences are primarily due to foreign currency transactions, passive foreign investment companies (PFIC), market discount, partnerships, equity-debt classifications and losses deferred due to wash sales.
Annual Report
3. Significant Accounting Policies - continued
Income Tax Information and Distributions to Shareholders - continued
The federal tax cost of investment securities and unrealized appreciation (depreciation) as of period end were as follows:
Gross unrealized appreciation | $ 331,991,084 |
Gross unrealized depreciation | (67,454,992) |
Net unrealized appreciation (depreciation) on securities | $ 264,536,092 |
| |
Tax Cost | $ 3,924,157,768 |
The tax-based components of distributable earnings as of period end were as follows:
Undistributed ordinary income | $ 39,196,788 |
Undistributed long-term capital gain | $ 61,346,649 |
Net unrealized appreciation (depreciation) on securities and other investments | $ 264,559,628 |
The tax character of distributions paid was as follows:
| July 31, 2014 | July 31, 2013 |
Ordinary Income | $ 185,363,562 | $ 170,384,735 |
Long-term Capital Gains | 65,088,933 | 41,059,865 |
Total | $ 250,452,495 | $ 211,444,600 |
Short-Term Trading (Redemption) Fees. Shares held by investors in the Fund less than 90 days may have been subject to a redemption fee equal to .75% of the NAV of shares redeemed. All redemption fees, which reduce the proceeds of the shareholder redemption, are retained by the Fund and accounted for as an addition to paid in capital.
Delayed Delivery Transactions and When-Issued Securities. During the period, the Fund transacted in securities on a delayed delivery or when-issued basis. Payment and delivery may take place after the customary settlement period for that security. The price of the underlying securities and the date when the securities will be delivered and paid for are fixed at the time the transaction is negotiated. The securities purchased on a delayed delivery or when-issued basis are identified as such in the Fund's Schedule of Investments. The Fund may receive compensation for interest forgone in the purchase of a delayed delivery or when-issued security. With respect to purchase commitments, the Fund identifies securities as segregated in its records with a value at least equal to the amount of the commitment. Losses may arise due to changes in the value of the underlying securities or if the counterparty does not perform under the contract's terms, or if the issuer does not issue the securities due to political, economic, or other factors.
Annual Report
Notes to Financial Statements - continued
3. Significant Accounting Policies - continued
Restricted Securities. The Fund may invest in securities that are subject to legal or contractual restrictions on resale. These securities generally may be resold in transactions exempt from registration or to the public if the securities are registered. Disposal of these securities may involve time-consuming negotiations and expense, and prompt sale at an acceptable price may be difficult. Information regarding restricted securities is included at the end of the Fund's Schedule of Investments.
Loans and Other Direct Debt Instruments. The Fund invests in direct debt instruments which are interests in amounts owed to lenders by corporate or other borrowers. These instruments may be in the form of loans, trade claims or other receivables and may include standby financing commitments such as revolving credit facilities that obligate the Fund to supply additional cash to the borrower on demand. Loans may be acquired through assignment or participation, or may be made directly to a borrower. The Fund did not have any unfunded loan commitments, which are contractual obligations for future funding, at period end.
4. Purchases and Sales of Investments.
Purchases and sales of securities, other than short-term securities and U.S. government securities, aggregated $1,052,015,263 and $1,138,541,279, respectively.
5. Fees and Other Transactions with Affiliates.
Management Fee. Fidelity Management & Research Company (the investment adviser) and its affiliates provide the Fund with investment management related services for which the Fund pays a monthly management fee. The management fee is the sum of an individual fund fee rate that is based on an annual rate of .30% of the Fund's average net assets and an annualized group fee rate that averaged .25% during the period. The group fee rate is based upon the average net assets of all the mutual funds advised by the investment adviser, including any mutual funds previously advised by the investment adviser that are currently advised by Fidelity SelectCo, LLC, an affiliate of the investment adviser. The group fee rate decreases as assets under management increase and increases as assets under management decrease. For the reporting period, the total annual management fee rate was .55% of the Fund's average net assets.
Distribution and Service Plan Fees. In accordance with Rule 12b-1 of the 1940 Act, the Fund has adopted separate Distribution and Service Plans for each class of shares. Certain classes pay Fidelity Distributors Corporation (FDC), an affiliate of the investment adviser, separate Distribution and Service Fees, each of which is based on an annual percentage of each class' average net assets. In addition, FDC may pay financial intermediaries for selling shares of the Fund and providing shareholder support services.
Annual Report
5. Fees and Other Transactions with Affiliates - continued
Distribution and Service Plan Fees - continued
For the period, the Distribution and Service Fee rates, total fees and amounts retained by FDC were as follows:
| Distribution
Fee | Service
Fee | Total Fees | Retained
by FDC |
Class A | -% | .25% | $ 967,235 | $ 25,663 |
Class T | -% | .25% | 108,744 | 40 |
Class C | .75% | .25% | 2,097,112 | 927,749 |
| | | $ 3,173,091 | $ 953,452 |
Sales Load. FDC may receive a front-end sales charge of up to 4.00% for selling Class A shares and Class T shares, some of which is paid to financial intermediaries for selling shares of the Fund. Depending on the holding period, FDC may receive contingent deferred sales charges levied on Class A, Class T and Class C redemptions. The deferred sales charges range from 1.00% for Class C shares, 1.00% for certain purchases of Class A shares and .25% for certain purchases of Class T shares.
For the period, sales charge amounts retained by FDC were as follows:
| Retained
by FDC |
Class A | $ 109,599 |
Class T | 12,563 |
Class C* | 74,180 |
| $ 196,342 |
* When Class C shares are initially sold, FDC pays commissions from its own resources to financial intermediaries through which the sales are made.
Transfer Agent Fees. Fidelity Investments Institutional Operations Company, Inc., (FIIOC), an affiliate of the investment adviser, is the transfer, dividend disbursing and shareholder servicing agent for each class of the Fund. FIIOC receives account fees and asset-based fees that vary according to the account size and type of account of the shareholders of the respective classes of the Fund. FIIOC pays for typesetting, printing and mailing of shareholder reports, except proxy statements.
For the period, transfer agent fees for each class were as follows:
| Amount | % of
Average
Net Assets |
Class A | $ 805,109 | .21 |
Class T | 99,408 | .23 |
Class C | 404,930 | .19 |
Real Estate Income | 6,054,879 | .23 |
Institutional Class | 1,184,475 | .19 |
| $ 8,548,801 | |
Annual Report
Notes to Financial Statements - continued
5. Fees and Other Transactions with Affiliates - continued
Accounting and Security Lending Fees. Fidelity Service Company, Inc. (FSC), an affiliate of the investment adviser, maintains the Fund's accounting records. The accounting fee is based on the level of average net assets for each month. Under a separate contract, FSC administers the security lending program. The security lending fee is based on the number and duration of lending transactions.
Brokerage Commissions. The Fund placed a portion of its portfolio transactions with brokerage firms which are affiliates of the investment adviser. Brokerage commissions are included in net realized gain (loss) and change in net unrealized appreciation (depreciation) in the Statement of Operations. The commissions paid to these affiliated firms were $26,723 for the period.
6. Committed Line of Credit.
The Fund participates with other funds managed by the investment adviser or an affiliate in a $4.25 billion credit facility (the "line of credit") to be utilized for temporary or emergency purposes to fund shareholder redemptions or for other short-term liquidity purposes. The Fund has agreed to pay commitment fees on its pro-rata portion of the line of credit, which amounted to $6,555 and is reflected in Miscellaneous expenses on the Statement of Operations. During the period, the Fund did not borrow on this line of credit.
7. Security Lending.
The Fund lends portfolio securities through a lending agent from time to time in order to earn additional income. For equity securities, a lending agent is used and may loan securities to certain qualified borrowers, including Fidelity Capital Markets (FCM), a broker-dealer affiliated with the Fund. On the settlement date of the loan, the Fund receives collateral (in the form of U.S. Treasury obligations, letters of credit and/or cash) against the loaned securities and maintains collateral in an amount not less than 100% of the market value of the loaned securities during the period of the loan. The market value of the loaned securities is determined at the close of business of the Fund and any additional required collateral is delivered to the Fund on the next business day. If the borrower defaults on its obligation to return the securities loaned because of insolvency or other reasons, the Fund may apply collateral received from the borrower against the obligation. The Fund may experience delays and costs in recovering the securities loaned. Any cash collateral received is invested in the Fidelity Securities Lending Cash Central Fund. The value of loaned securities and cash collateral at period end are disclosed on the Fund's Statement of Assets and Liabilities. At period end, there were no security loans outstanding with FCM. Security lending income represents the income
Annual Report
7. Security Lending - continued
earned on investing cash collateral, less rebates paid to borrowers and any lending agent fees associated with the loan, plus any premium payments received for lending certain types of securities. Security lending income is presented in the Statement of Operations as a component of income from Fidelity Central Funds. Total security lending income during the period amounted to $69,287, including $155 from securities loaned to FCM.
8. Expense Reductions.
Commissions paid to certain brokers with whom the investment adviser, or its affiliates, places trades on behalf of the Fund include an amount in addition to trade execution, which may be rebated back to the Fund to offset certain expenses. This amount totaled $51,646 for the period. In addition, through arrangements with the Fund's custodian, credits realized as a result of uninvested cash balances were used to reduce the Fund's expenses. During the period, these credits reduced the Fund's custody expenses by $1,517.
In addition, the investment adviser reimbursed a portion of the Fund's operating expenses during the period in the amount of $20,523.
9. Distributions to Shareholders.
Distributions to shareholders of each class were as follows:
Years ended July 31, | 2014 | 2013 |
From net investment income | | |
Class A | $ 16,638,771 | $ 10,238,777 |
Class T | 1,842,576 | 1,523,114 |
Class C | 7,530,932 | 4,241,554 |
Real Estate Income | 117,401,887 | 126,726,805 |
Institutional Class | 28,741,085 | 17,180,188 |
Total | $ 172,155,251 | $ 159,910,438 |
From net realized gain | | |
Class A | $ 7,591,572 | $ 2,837,075 |
Class T | 874,881 | 506,062 |
Class C | 4,152,718 | 1,181,312 |
Real Estate Income | 53,508,422 | 42,729,814 |
Institutional Class | 12,169,651 | 4,279,899 |
Total | $ 78,297,244 | $ 51,534,162 |
Annual Report
Notes to Financial Statements - continued
10. Share Transactions.
Transactions for each class of shares were as follows:
| Shares | Dollars |
Years ended July 31, | 2014 | 2013 | 2014 | 2013 |
Class A | | | | |
Shares sold | 18,815,698 | 25,244,691 | $ 217,399,754 | $ 296,851,509 |
Reinvestment of distributions | 1,805,230 | 900,102 | 20,178,624 | 10,299,964 |
Shares redeemed | (15,738,034) | (5,925,325) | (180,458,692) | (69,436,144) |
Net increase (decrease) | 4,882,894 | 20,219,468 | $ 57,119,686 | $ 237,715,329 |
Class T | | | | |
Shares sold | 1,270,924 | 2,730,063 | $ 14,645,845 | $ 31,978,463 |
Reinvestment of distributions | 211,146 | 132,742 | 2,357,016 | 1,515,681 |
Shares redeemed | (1,380,258) | (1,226,451) | (15,703,373) | (14,137,454) |
Net increase (decrease) | 101,812 | 1,636,354 | $ 1,299,488 | $ 19,356,690 |
Class C | | | | |
Shares sold | 9,015,535 | 14,157,408 | $ 103,482,191 | $ 165,598,758 |
Reinvestment of distributions | 813,525 | 375,304 | 9,012,478 | 4,279,651 |
Shares redeemed | (6,508,928) | (1,637,958) | (73,908,752) | (19,029,492) |
Net increase (decrease) | 3,320,132 | 12,894,754 | $ 38,585,917 | $ 150,848,917 |
Real Estate Income | | | | |
Shares sold | 61,717,695 | 123,727,906 | $ 711,894,953 | $ 1,450,014,694 |
Reinvestment of distributions | 13,609,464 | 13,299,047 | 152,306,330 | 151,923,311 |
Shares redeemed | (100,931,769) | (90,180,888) | (1,156,054,958) | (1,057,830,249) |
Net increase (decrease) | (25,604,610) | 46,846,065 | $ (291,853,675) | $ 544,107,756 |
Institutional Class | | | | |
Shares sold | 40,192,476 | 42,960,747 | $ 465,679,843 | $ 506,030,603 |
Reinvestment of distributions | 2,412,058 | 1,337,082 | 27,006,597 | 15,315,413 |
Shares redeemed | (26,626,486) | (11,392,454) | (303,889,493) | (133,274,193) |
Net increase (decrease) | 15,978,048 | 32,905,375 | $ 188,796,947 | $ 388,071,823 |
Annual Report
11. Other.
The Fund's organizational documents provide former and current trustees and officers with a limited indemnification against liabilities arising in connection with the performance of their duties to the Fund. In the normal course of business, the Fund may also enter into contracts that provide general indemnifications. The Fund's maximum exposure under these arrangements is unknown as this would be dependent on future claims that may be made against the Fund. The risk of material loss from such claims is considered remote.
Annual Report
To the Trustees of Fidelity Securities Fund and Shareholders of Fidelity Real Estate Income Fund:
We have audited the accompanying statement of assets and liabilities of Fidelity Real Estate Income Fund (the Fund), a fund of Fidelity Securities Fund, including the schedule of investments, as of July 31, 2014, and the related statement of operations for the year then ended, the statement of changes in net assets for each of the two years in the period then ended, and the financial highlights for each of the five years in the period then ended. These financial statements and financial highlights are the responsibility of the Fund's management. Our responsibility is to express an opinion on these financial statements and financial highlights based on our audits.
We conducted our audits in accordance with the standards of the Public Company Accounting Oversight Board (United States). Those standards require that we plan and perform the audit to obtain reasonable assurance about whether the financial statements and financial highlights are free of material misstatement. The Fund is not required to have, nor were we engaged to perform, an audit of its internal control over financial reporting. Our audits included consideration of internal control over financial reporting as a basis for designing audit procedures that are appropriate in the circumstances, but not for the purpose of expressing an opinion on the effectiveness of the Fund's internal control over financial reporting. Accordingly, we express no such opinion. An audit also includes examining, on a test basis, evidence supporting the amounts and disclosures in the financial statements, assessing the accounting principles used and significant estimates made by management, as well as evaluating the overall financial statement presentation. Our procedures included confirmation of securities owned as of July 31, 2014, by correspondence with the custodians and brokers; where replies were not received from brokers, we performed other auditing procedures. We believe that our audits provide a reasonable basis for our opinion.
In our opinion, the financial statements and financial highlights referred to above present fairly, in all material respects, the financial position of Fidelity Real Estate Income Fund as of July 31, 2014, the results of its operations for the year then ended, the changes in its net assets for each of the two years in the period then ended, and the financial highlights for each of the five years in the period then ended, in conformity with accounting principles generally accepted in the United States of America.
DELOITTE & TOUCHE LLP
Boston, Massachusetts
September 19, 2014
Annual Report
The Trustees, Member of the Advisory Board, and officers of the trust and fund, as applicable, are listed below. The Board of Trustees governs the fund and is responsible for protecting the interests of shareholders. The Trustees are experienced executives who meet periodically throughout the year to oversee the fund's activities, review contractual arrangements with companies that provide services to the fund, oversee management of the risks associated with such activities and contractual arrangements, and review the fund's performance. Except for James C. Curvey, each of the Trustees oversees 173 funds. Mr. Curvey oversees 397 funds.
The Trustees hold office without limit in time except that (a) any Trustee may resign; (b) any Trustee may be removed by written instrument, signed by at least two-thirds of the number of Trustees prior to such removal; (c) any Trustee who requests to be retired or who has become incapacitated by illness or injury may be retired by written instrument signed by a majority of the other Trustees; and (d) any Trustee may be removed at any special meeting of shareholders by a two-thirds vote of the outstanding voting securities of the trust. Each Trustee who is not an interested person (as defined in the 1940 Act) of the trust and the fund (Independent Trustee), shall retire not later than the last day of the calendar year in which his or her 75th birthday occurs. The Independent Trustees may waive this mandatory retirement age policy with respect to individual Trustees. The officers and Advisory Board Member hold office without limit in time, except that any officer and Advisory Board Member may resign or may be removed by a vote of a majority of the Trustees at any regular meeting or any special meeting of the Trustees. Except as indicated, each individual has held the office shown or other offices in the same company for the past five years.
Experience, Skills, Attributes, and Qualifications of the Fund's Trustees. The Governance and Nominating Committee has adopted a statement of policy that describes the experience, qualifications, attributes, and skills that are necessary and desirable for potential Independent Trustee candidates (Statement of Policy). The Board believes that each Trustee satisfied at the time he or she was initially elected or appointed a Trustee, and continues to satisfy, the standards contemplated by the Statement of Policy. The Governance and Nominating Committee also engages professional search firms to help identify potential Independent Trustee candidates who have the experience, qualifications, attributes, and skills consistent with the Statement of Policy. From time to time, additional criteria based on the composition and skills of the current Independent Trustees, as well as experience or skills that may be appropriate in light of future changes to board composition, business conditions, and regulatory or other developments, have also been considered by the professional search firms and the Governance and Nominating Committee. In addition, the Board takes into account the Trustees' commitment and participation in Board and committee meetings, as well as their leadership of standing and ad hoc committees throughout their tenure.
In determining that a particular Trustee was and continues to be qualified to serve as a Trustee, the Board has considered a variety of criteria, none of which, in isolation, was controlling. The Board believes that, collectively, the Trustees have balanced and diverse experience, qualifications, attributes, and skills, which allow the Board to operate effectively in governing the fund and protecting the interests of shareholders. Information about the specific experience, skills, attributes, and qualifications of each Trustee, which in each case led to the Board's conclusion that the Trustee should serve (or continue to serve) as a trustee of the fund, is provided below.
Annual Report
Trustees and Officers - continued
Board Structure and Oversight Function. James C. Curvey is an interested person (as defined in the 1940 Act) and currently serves as Chairman. The Trustees have determined that an interested Chairman is appropriate and benefits shareholders because an interested Chairman has a personal and professional stake in the quality and continuity of services provided to the fund. Independent Trustees exercise their informed business judgment to appoint an individual of their choosing to serve as Chairman, regardless of whether the Trustee happens to be independent or a member of management. The Independent Trustees have determined that they can act independently and effectively without having an Independent Trustee serve as Chairman and that a key structural component for assuring that they are in a position to do so is for the Independent Trustees to constitute a substantial majority for the Board. The Independent Trustees also regularly meet in executive session. Ned C. Lautenbach serves as Chairman of the Independent Trustees and as such (i) acts as a liaison between the Independent Trustees and management with respect to matters important to the Independent Trustees and (ii) with management prepares agendas for Board meetings.
Fidelity funds are overseen by different Boards of Trustees. The fund's Board oversees Fidelity's equity and high income funds and another Board oversees Fidelity's investment-grade bond, money market, and asset allocation funds. The asset allocation funds may invest in Fidelity funds overseen by the fund's Board. The use of separate Boards, each with its own committee structure, allows the Trustees of each group of Fidelity funds to focus on the unique issues of the funds they oversee, including common research, investment, and operational issues. On occasion, the separate Boards establish joint committees to address issues of overlapping consequences for the Fidelity funds overseen by each Board.
The Trustees operate using a system of committees to facilitate the timely and efficient consideration of all matters of importance to the Trustees, the fund, and fund shareholders and to facilitate compliance with legal and regulatory requirements and oversight of the fund's activities and associated risks. The Board, acting through its committees, has charged FMR and its affiliates with (i) identifying events or circumstances the occurrence of which could have demonstrably adverse effects on the fund's business and/or reputation; (ii) implementing processes and controls to lessen the possibility that such events or circumstances occur or to mitigate the effects of such events or circumstances if they do occur; and (iii) creating and maintaining a system designed to evaluate continuously business and market conditions in order to facilitate the identification and implementation processes described in (i) and (ii) above. Because the day-to-day operations and activities of the fund are carried out by or through FMR, its affiliates and other service providers, the fund's exposure to risks is mitigated but not eliminated by the processes overseen by the Trustees. While each of the Board's committees has responsibility for overseeing different aspects of the fund's activities, oversight is exercised primarily through the Operations, Audit, and Compliance Committees. In addition, the Independent Trustees have worked with FMR to enhance the Board's oversight of investment and financial risks, legal and regulatory risks, technology risks, and operational risks, including the development of additional risk reporting to the Board. For example, a working group comprised of Independent Trustees and FMR has worked and continues to work to review the Fidelity funds' valuation-related activities, reporting and risk management. Appropriate personnel, including but not limited to the fund's Chief Compliance Officer (CCO), FMR's internal auditor, the independent accountants, the fund's Treasurer and portfolio management personnel, make periodic reports to the Board's committees, as appropriate, including an annual review of FMR's risk management program for the Fidelity funds. The responsibilities of each standing committee, including their oversight responsibilities, are described further under "Standing Committees of the Fund's Trustees."
Annual Report
The fund's Statement of Additional Information (SAI) includes more information about the Trustees. To request a free copy, call Fidelity at 1-877-208-0098.
Interested Trustees*:
Correspondence intended for each Trustee who is an interested person may be sent to Fidelity Investments, 245 Summer Street, Boston, Massachusetts 02210.
Name, Year of Birth; Principal Occupations and Other Relevant Experience+ |
James C. Curvey (1935) |
Year of Election or Appointment: 2007 Trustee Chairman of the Board of Trustees |
| Mr. Curvey also serves as Trustee of other Fidelity funds. Mr. Curvey is a Director of Fidelity Research & Analysis Co. (2009-present), and Vice Chairman (2007-present) and Director of FMR LLC. In addition, Mr. Curvey serves as an Overseer for the Boston Symphony Orchestra and a member of the Trustees of Villanova University. Previously, Mr. Curvey served as a Director of Fidelity Investments Money Management, Inc. (2009-2014), a Director of FMR (2007-2014), a Director of FMR Co., Inc. (2007-2014) and was the Vice Chairman (2006-2007) and Director (2000-2007) of FMR Corp. |
Charles S. Morrison (1960) |
Year of Election or Appointment: 2014 Trustee |
| Mr. Morrison also serves as Trustee of other funds. He serves as President, Asset Management (2014-present) and is an employee of Fidelity Investments. Previously, Mr. Morrison served as Vice President of Fidelity's Fixed Income and Asset Allocation Funds (2012-2014), President, Fixed Income (2011-2014), Vice President of Fidelity's Money Market Funds (2005-2009), President, Money Market Group Leader of FMR (2009), and Senior Vice President, Money Market Group of FMR (2004-2009). Mr. Morrison also served as Vice President of Fidelity's Bond Funds (2002-2005), certain Balanced Funds (2002-2005), and certain Asset Allocation Funds (2002-2007), and as Senior Vice President (2002-2005) of Fidelity's Bond Division. |
* Trustees have been determined to be "Interested Trustees" by virtue of, among other things, their affiliation with the trust or various entities under common control with FMR.
+ The information above includes each Trustee's principal occupation during the last five years and other information relating to the experience, attributes, and skills relevant to each Trustee's qualifications to serve as a Trustee, which led to the conclusion that each Trustee should serve as a Trustee for the fund.
Annual Report
Independent Trustees:
Correspondence intended for each Independent Trustee (that is, the Trustees other than the Interested Trustees) may be sent to Fidelity Investments, P.O. Box 55235, Boston, Massachusetts 02205-5235.
Name, Year of Birth; Principal Occupations and Other Relevant Experience+ |
Dennis J. Dirks (1948) |
Year of Election or Appointment: 2005 Trustee |
| Mr. Dirks also serves as Trustee of other Fidelity funds. Prior to his retirement in May 2003, Mr. Dirks was Chief Operating Officer and a member of the Board of The Depository Trust & Clearing Corporation (DTCC). He also served as President, Chief Operating Officer, and Board member of The Depository Trust Company (DTC) and President and Board member of the National Securities Clearing Corporation (NSCC). In addition, Mr. Dirks served as Chief Executive Officer and Board member of the Government Securities Clearing Corporation, Chief Executive Officer and Board member of the Mortgage-Backed Securities Clearing Corporation, as a Trustee and a member of the Finance Committee of Manhattan College (2005-2008), and as a Trustee and a member of the Finance Committee of AHRC of Nassau County (2006-2008). Mr. Dirks is a member of the Independent Directors Council (IDC) Governing Council (2010-present) and Board of Directors for The Brookville Center for Children's Services, Inc. (2009-present). |
Alan J. Lacy (1953) |
Year of Election or Appointment: 2008 Trustee |
| Mr. Lacy also serves as Trustee of other Fidelity funds. Mr. Lacy serves as Senior Adviser (2007-present) of Oak Hill Capital Partners, L.P. (private equity). Mr. Lacy also served as Chief Executive Officer (2000-2005) and Vice Chairman (2005-2006) of Sears Holdings Corporation and Sears, Roebuck and Co. (retail). In addition, Mr. Lacy serves as a member of the Board of Directors of Dave & Buster's Entertainment, Inc. (restaurant and entertainment complexes, 2010-present), Earth Fare, Inc. (retail grocery, 2012-present), The Hillman Companies, Inc. (hardware wholesalers, 2010-present), and Bristol-Myers Squibb Company (global pharmaceuticals, 2008-present). Mr. Lacy is a member of the Board of Trustees of The National Parks Conservation Association (2006-present). Previously, Mr. Lacy served as Chairman of the Board of Trustees of the National Parks Conservation Association (2008-2011) and as a member of the Board of Directors for the Western Union Company (global money transfer, 2006-2011). |
Ned C. Lautenbach (1944) |
Year of Election or Appointment: 2000 Trustee Chairman of the Independent Trustees |
| Mr. Lautenbach also serves as Trustee of other Fidelity funds. Mr. Lautenbach currently serves as the Lead Director of the Eaton Corporation Board of Directors (diversified industrial, 1997-present). Mr. Lautenbach is Chairman of the Board of Directors of the Philharmonic Center for the Arts in Naples, Florida (2012-present) and a member of the Council on Foreign Relations (1994-present). Previously, Mr. Lautenbach was a Partner/Advisory Partner at Clayton, Dubilier & Rice, LLC (private equity investment, 1998-2010), as well as a Director of Sony Corporation (2006-2007). |
Joseph Mauriello (1944) |
Year of Election or Appointment: 2008 Trustee |
| Mr. Mauriello also serves as Trustee of other Fidelity funds. Prior to his retirement in January 2006, Mr. Mauriello served in numerous senior management positions including Deputy Chairman and Chief Operating Officer (2004-2005), and Vice Chairman of Financial Services (2002-2004) of KPMG LLP US (professional services, 1965-2005). Mr. Mauriello currently serves as a member of the Board of Directors of XL Group plc. (global insurance and re-insurance, 2006-present). Previously, Mr. Mauriello served as a Director of the Hamilton Funds of the Bank of New York (2006-2007) and of Arcadia Resources Inc. (health care services and products, 2007-2012). |
Robert W. Selander (1950) |
Year of Election or Appointment: 2011 Trustee |
| Mr. Selander also serves as Trustee of other Fidelity funds. Previously, Mr. Selander served as a Member of the Advisory Board of other Fidelity funds (2011), and Executive Vice Chairman (2010), Chief Executive Officer (2009-2010), and President and Chief Executive Officer (1997-2009) of Mastercard, Inc. |
Cornelia M. Small (1944) |
Year of Election or Appointment: 2005 Trustee |
| Ms. Small also serves as Trustee of other Fidelity funds. Ms. Small is a member of the Board of Directors (2009-present) and Chair of the Investment Committee (2010-present) of the Teagle Foundation. Ms. Small also serves on the Investment Committee of the Berkshire Taconic Community Foundation (2008-present). Previously, Ms. Small served as Chairperson (2002-2008) and a member of the Investment Committee and Chairperson (2008-2012) and a member of the Board of Trustees of Smith College. In addition, Ms. Small served as Chief Investment Officer, Director of Global Equity Investments, and a member of the Board of Directors of Scudder, Stevens & Clark and Scudder Kemper Investments. |
William S. Stavropoulos (1939) |
Year of Election or Appointment: 2002 Trustee Vice Chairman of the Independent Trustees |
| Mr. Stavropoulos also serves as Trustee of other Fidelity funds. Mr. Stavropoulos serves as President and Founder of the Michigan Baseball Foundation, the Great Lakes Loons (2007-present). Mr. Stavropoulos is Chairman Emeritus of the Board of Directors of The Dow Chemical Company, where he previously served in numerous senior management positions, including President, CEO (1995-2000; 2002-2004), Chairman of the Executive Committee (2000-2006), and as a member of the Board of Directors (1990-2006). Currently, Mr. Stavropoulos is Chairman of the Board of Directors of Univar Inc. (global distributor of commodity and specialty chemicals), a Director of Teradata Corporation (data warehousing and technology solutions), and Maersk Inc. (industrial conglomerate), and a member of the Advisory Board for Metalmark Capital LLC (private equity investment, 2005-present). Mr. Stavropoulos is an operating advisor to Clayton, Dubilier & Rice, LLC (private equity investment). In addition, Mr. Stavropoulos is a member of the University of Notre Dame Advisory Council for the College of Science, a Trustee of the Rollin L. Gerstacker Foundation, and a Director of the Naples Philharmonic Center for the Arts. Previously, Mr. Stavropoulos served as a Director of Chemical Financial Corporation (bank holding company, 1993-2012) and Tyco International, Ltd. (multinational manufacturing and services, 2007-2012). |
David M. Thomas (1949) |
Year of Election or Appointment: 2008 Trustee |
| Mr. Thomas also serves as Trustee of other Fidelity funds. Mr. Thomas serves as Non-Executive Chairman of the Board of Directors of Fortune Brands Home and Security (home and security products, 2011-present), and as a member of the Board of Directors of Interpublic Group of Companies, Inc. (marketing communication, 2004-present). Previously, Mr. Thomas served as Executive Chairman (2005-2006) and Chairman and Chief Executive Officer (2000-2005) of IMS Health, Inc. (pharmaceutical and healthcare information solutions), and a Director of Fortune Brands, Inc. (consumer products, 2000-2011). |
+ The information above includes each Trustee's principal occupation during the last five years and other information relating to the experience, attributes, and skills relevant to each Trustee's qualifications to serve as a Trustee, which led to the conclusion that each Trustee should serve as a Trustee for the fund.
Advisory Board Member and Officers:
Correspondence intended for each officer and Peter S. Lynch may be sent to Fidelity Investments, 245 Summer Street, Boston, Massachusetts 02210. Officers appear below in alphabetical order.
Name, Year of Birth; Principal Occupation |
Peter S. Lynch (1944) |
Year of Election or Appointment: 2003 Member of the Advisory Board |
| Mr. Lynch also serves as Member of the Advisory Board of other Fidelity funds. Mr. Lynch is Vice Chairman and a Director of FMR and FMR Co., Inc. In addition, Mr. Lynch serves as a Trustee of Boston College and as the Chairman of the Inner-City Scholarship Fund. Previously, Mr. Lynch served on the Special Olympics International Board of Directors (1997-2006). |
Christopher S. Bartel (1971) |
Year of Election or Appointment: 2009 Vice President |
| Mr. Bartel also serves as Vice President of other funds. Mr. Bartel serves as a Director, President, and Chief Executive Officer of Fidelity Management & Research (Japan) Inc. (2012-present), a Director of Fidelity Management & Research (Hong Kong) (2012-present), and Senior Vice President of Global Equity Research (2010-present). Previously, Mr. Bartel served as Senior Vice President of Equity Research (2009-2010), Managing Director of Research (2006-2009), and an analyst and portfolio manager (2000-2006). |
Elizabeth Paige Baumann (1968) |
Year of Election or Appointment: 2012 Anti-Money Laundering (AML) Officer |
| Ms. Baumann also serves as AML Officer of other funds. She is Chief AML Officer of FMR LLC (2012-present) and is an employee of Fidelity Investments. Previously, Ms. Baumann served as Vice President and Deputy Anti-Money Laundering Officer (2007-2012). |
William C. Coffey (1969) |
Year of Election or Appointment: 2009 Assistant Secretary |
| Mr. Coffey also serves as Assistant Secretary of other funds. He is Senior Vice President and Deputy General Counsel of FMR LLC (2010-present), and is an employee of Fidelity Investments. Previously, Mr. Coffey served as Vice President and Associate General Counsel of FMR LLC (2005-2009). |
Jonathan Davis (1968) |
Year of Election or Appointment: 2010 Assistant Treasurer |
| Mr. Davis also serves as Assistant Treasurer of other funds. Mr. Davis is an employee of Fidelity Investments. Previously, Mr. Davis served as Vice President and Associate General Counsel of FMR LLC (2003-2010). |
Adrien E. Deberghes (1967) |
Year of Election or Appointment: 2008 Deputy Treasurer |
| Mr. Deberghes also serves as an officer of other funds. He is an employee of Fidelity Investments (2008-present). Prior to joining Fidelity Investments, Mr. Deberghes was Senior Vice President of Mutual Fund Administration at State Street Corporation (2007-2008), Senior Director of Mutual Fund Administration at Investors Bank & Trust (2005-2007), and Director of Finance for Dunkin' Brands (2000-2005). |
Stephanie J. Dorsey (1969) |
Year of Election or Appointment: 2010 Assistant Treasurer |
| Ms. Dorsey also serves as an officer of other funds. She is an employee of Fidelity Investments (2008-present) and has served in other fund officer roles. Prior to joining Fidelity Investments, Ms. Dorsey served as Treasurer (2004-2008) of the JPMorgan Mutual Funds and Vice President (2004-2008) of JPMorgan Chase Bank. |
Howard J. Galligan III (1966) |
Year of Election or Appointment: 2014 Chief Financial Officer |
| Mr. Galligan also serves as Chief Financial Officer of other funds. Mr. Galligan serves as President of Fidelity Pricing and Cash Management Services (FPCMS) (2014-present) and as a Director of Strategic Advisers, Inc. (2008-present). Previously, Mr. Galligan served as Chief Administrative Officer of Asset Management (2011-2014) and Chief Operating Officer and Senior Vice President of Investment Support for Strategic Advisers, Inc. (2003-2011). |
Scott C. Goebel (1968) |
Year of Election or Appointment: 2008 Secretary and Chief Legal Officer (CLO) |
| Mr. Goebel serves as Secretary and CLO of other funds. Mr. Goebel also serves as Secretary of Fidelity SelectCo, LLC (2013-present), Fidelity Investments Money Management, Inc. (FIMM) (2010-present) and Fidelity Research and Analysis Company (FRAC) (2010-present); General Counsel, Secretary, and Senior Vice President of FMR (2008-present) and FMR Co., Inc. (2008-present); Chief Legal Officer of Fidelity Management & Research (Hong Kong) Limited (2008-present); and Assistant Secretary of Fidelity Management & Research (Japan) Inc. (2008-present) and Fidelity Management & Research (U.K.) Inc. (2008-present). Previously, Mr. Goebel served as Secretary and CLO of other Fidelity funds (2008-2013), Assistant Secretary of FIMM (2008-2010), FRAC (2008-2010), and certain funds (2007-2008); and as Vice President and Secretary of Fidelity Distributors Corporation (FDC) (2005-2007). Mr. Goebel has been employed by FMR LLC or an affiliate since 2001. |
Brian B. Hogan (1964) |
Year of Election or Appointment: 2009 Vice President |
| Mr. Hogan also serves as Trustee or Vice President of other funds. Mr. Hogan serves as President of FMR's Equity Division (2009-present). Previously, Mr. Hogan served as Senior Vice President, Equity Research of FMR (2006-2009) and as a portfolio manager. |
Chris Maher (1972) |
Year of Election or Appointment: 2013 Assistant Treasurer |
| Mr. Maher serves as Assistant Treasurer of other funds. Mr. Maher is Vice President of Valuation Oversight and is an employee of Fidelity Investments. Previously, Mr. Maher served as Vice President of Asset Management Compliance (2013), Vice President of FMR's Program Management Group (2010-2013), and Vice President of Valuation Oversight (2008-2010). |
Kenneth B. Robins (1969) |
Year of Election or Appointment: 2008 President and Treasurer |
| Mr. Robins also serves as an officer of other funds. Mr. Robins serves as Executive Vice President of Fidelity Investments Money Management, Inc. (FIMM) (2013-present) and is an employee of Fidelity Investments (2004-present). Previously, Mr. Robins served in other fund officer roles. |
Stephen Sadoski (1971) |
Year of Election or Appointment: 2012 Deputy Treasurer |
| Mr. Sadoski also serves as Deputy Treasurer of other funds. He is an employee of Fidelity Investments (2012-present) and has served in another fund officer role. Prior to joining Fidelity Investments, Mr. Sadoski served as an assistant chief accountant in the Division of Investment Management of the Securities and Exchange Commission (SEC) (2009-2012) and as a senior manager at Deloitte & Touche LLP (1997-2009). |
Stacie M. Smith (1974) |
Year of Election or Appointment: 2013 Deputy Treasurer |
| Ms. Smith also serves as an officer of other funds. She is an employee of Fidelity Investments (2009-present) and has served in other fund officer roles. Prior to joining Fidelity Investments, Ms. Smith served as Senior Audit Manager of Ernst & Young LLP (1996-2009). |
Renee Stagnone (1975) |
Year of Election or Appointment: 2013 Deputy Treasurer |
| Ms. Stagnone also serves as Deputy Treasurer of other funds. Ms. Stagnone is an employee of Fidelity Investments. |
Linda J. Wondrack (1964) |
Year of Election or Appointment: 2014 Chief Compliance Officer |
| Ms. Wondrack also serves as Chief Compliance Officer of other funds. Ms. Wondrack is Executive Vice President and head of the Ethics Office and Asset Management Compliance for Fidelity Investments (2012-present). Ms. Wondrack also serves as Chief Compliance Officer of Fidelity SelectCo, LLC (2014-present); Chief Compliance Officer of Impresa Management LLC (2013-present); and Chief Compliance Officer of FMR Co., Inc., Fidelity Investments Money Management, Inc., Fidelity Management & Research (Japan) Inc., Fidelity Management & Research (U.K.) Inc., Fidelity Management & Research (Hong Kong), Fidelity Management & Research Company, Pyramis Global Advisors, LLC, and Strategic Advisers, Inc., Ballyrock Investment Advisors LLC, and Northern Neck Investors LLC (2012-present). Previously, Ms. Wondrack served as Senior Vice President and Chief Compliance Officer for Columbia Management Investment Advisers, LLC (2005-2012); Chief Compliance Officer for certain funds within the Columbia Family of Funds (2007-2012); and Senior Vice President of Compliance Risk Management at Bank of America (2005-2010). |
Joseph F. Zambello (1957) |
Year of Election or Appointment: 2011 Deputy Treasurer |
| Mr. Zambello also serves as Deputy Treasurer of other funds. Mr. Zambello is an employee of Fidelity Investments. Previously, Mr. Zambello served as Vice President of FMR's Program Management Group (2009-2011) and Vice President of the Transfer Agent Oversight Group (2005-2009). |
Annual Report
The Board of Trustees of Fidelity Advisor Real Estate Income Fund voted to pay to shareholders of record at the opening of business, the following distributions per share derived from capital gains realized from sales of portfolio securities, and dividends derived from net investment income:
| Pay Date | Record Date | Dividends | Capital Gains |
Class A | 09/08/14 | 09/05/14 | $0.125 | $0.182 |
Class T | 09/08/14 | 09/05/14 | $0.125 | $0.182 |
Class C | 09/08/14 | 09/05/14 | $0.106 | $0.182 |
The fund hereby designates as a capital gain dividend with respect to the taxable year ended July 31, 2014, $93,876,025, or, if subsequently determined to be different, the net capital gain of such year.
A total of 0.04% of the dividends distributed during the fiscal year was derived from interest on U.S. Government securities which is generally exempt from state income tax.
The fund will notify shareholders in January 2015 of amounts for use in preparing 2014 income tax returns.
Annual Report
Board Approval of Investment Advisory Contracts and Management Fees
Fidelity Real Estate Income Fund
Each year, the Board of Trustees, including the Independent Trustees (together, the Board), votes on the renewal of the management contract with Fidelity Management & Research Company (FMR) and the sub-advisory agreements (together, the Advisory Contracts) for the fund. The Board, assisted by the advice of fund counsel and Independent Trustees' counsel, requests and considers a broad range of information relevant to the renewal of the Advisory Contracts throughout the year.
The Board meets regularly and, at each of its meetings, covers an extensive agenda of topics and materials and considers factors that are relevant to its annual consideration of the renewal of the fund's Advisory Contracts, including the services and support provided to the fund and its shareholders. The Board has established various standing committees (Committees), each composed of and chaired by Independent Trustees with varying backgrounds, to which the Board has assigned specific subject matter responsibilities in order to enhance effective decision-making by the Board. The Board, acting directly and through its Committees, requests and receives information concerning the annual consideration of the renewal of the fund's Advisory Contracts. The Board also meets as needed to consider matters specifically related to the Board's annual consideration of the renewal of the Advisory Contracts. Members of the Board may also meet with trustees of other Fidelity funds through ad hoc joint committees to discuss certain matters relevant to the Fidelity funds.
At its July 2014 meeting, the Board, including the Independent Trustees, unanimously determined to renew the fund's Advisory Contracts. In reaching its determination, the Board considered all factors it believed relevant, including (i) the nature, extent, and quality of the services to be provided to the fund and its shareholders (including the investment performance of the fund); (ii) the competitiveness of the fund's management fee and total expense ratio relative to peer funds; (iii) the total costs of the services to be provided by and the profits to be realized by Fidelity from its relationship with the fund; (iv) the extent to which economies of scale exist and would be realized as the fund grows; and (v) whether fee levels reflect these economies of scale, if any, for the benefit of fund shareholders. In connection with separate internal corporate reorganizations involving Fidelity Management & Research (U.K.) Inc. (FMR U.K.) and Fidelity Management & Research (Japan) Inc. (FMR Japan), the Board approved certain non-material amendments to the fund's sub-advisory agreements with FMR U.K. and FMR Japan to reflect that, after these reorganizations, FMR Investment Management (UK) Limited and Fidelity Management & Research (Japan) Limited will carry on the business of FMR U.K. and FMR Japan, respectively. The Board noted that no changes to the portfolio managers or to the foreign research or investment advisory services provided to the fund were expected in connection with either reorganization and that the same personnel and resources would continue to be available to the fund at the new entities.
Annual Report
Board Approval of Investment Advisory Contracts and
Management Fees - continued
In considering whether to renew the Advisory Contracts for the fund, the Board reached a determination, with the assistance of fund counsel and Independent Trustees' counsel and through the exercise of its business judgment, that the renewal of the Advisory Contracts was in the best interests of the fund and its shareholders and that the compensation payable under the Advisory Contracts was fair and reasonable. The Board's decision to renew the Advisory Contracts was not based on any single factor, but rather was based on a comprehensive consideration of all the information provided to the Board at its meetings throughout the year. The Board, in reaching its determination to renew the Advisory Contracts, was aware that shareholders of the fund have a broad range of investment choices available to them, including a wide choice among funds offered by Fidelity's competitors, and that the fund's shareholders, who have the opportunity to review and weigh the disclosure provided by the fund in its prospectus and other public disclosures, have chosen to invest in this fund, which is part of the Fidelity family of funds.
Nature, Extent, and Quality of Services Provided. The Board considered Fidelity's staffing as it relates to the fund, including the backgrounds of investment personnel of FMR and the sub-advisers (together, the Investment Advisers), and also considered the fund's investment objective, strategies, and related investment philosophy. The Independent Trustees also had discussions with senior management of Fidelity's investment operations and investment groups. The Board considered the structure of the portfolio manager compensation program and whether this structure provides appropriate incentives to act in the best interests of the fund. Additionally, the Board considered the portfolio managers' investments, if any, in the funds that they manage.
Resources Dedicated to Investment Management and Support Services. The Board and the Fund Oversight and Research Committees reviewed the general qualifications and capabilities of Fidelity's investment staff, including its size, education, experience, and resources, as well as Fidelity's approach to recruiting, training, managing, and compensating investment personnel. The Board noted that Fidelity has continued to increase the resources devoted to non-U.S. offices, including expansion of Fidelity's global investment organization. The Board also noted that Fidelity's analysts have extensive resources, tools and capabilities that allow them to conduct sophisticated quantitative and fundamental analysis, as well as credit analysis of issuers, counterparties and guarantors. Further, the Board believes that Fidelity's investment professionals have sufficient access to global information and data so as to provide competitive investment results over time, and that those professionals also have access to sophisticated tools that permit them to assess portfolio construction and risk and performance attribution characteristics continuously, as well as to transmit new information and research conclusions rapidly around the world. Additionally, in its deliberations, the Board considered Fidelity's trading and risk management capabilities and resources and global compliance infrastructure, which are an integral part of the investment management process.
Annual Report
Shareholder and Administrative Services. The Board considered (i) the nature, extent, quality, and cost of advisory, administrative, and shareholder services performed by the Investment Advisers and their affiliates under the Advisory Contracts and under separate agreements covering transfer agency, pricing and bookkeeping, and securities lending services for the fund; (ii) the nature and extent of the supervision of third party service providers, principally custodians and subcustodians; and (iii) the resources devoted to, and the record of compliance with, the fund's compliance policies and procedures. The Board also reviewed the allocation of fund brokerage, including allocations to brokers affiliated with the Investment Advisers, the use of brokerage commissions to pay fund expenses, and the use of "soft" commission dollars to pay for research services.
The Board noted that the growth of fund assets over time across the complex allows Fidelity to reinvest in the development of services designed to enhance the value or convenience of the Fidelity funds as investment vehicles. These services include 24-hour access to account information and market information through telephone representatives and over the Internet, investor education materials and asset allocation tools, and the expanded availability of Fidelity Investor Centers.
In 2014, the Board formed an ad hoc Committee on Transfer Agency Fees to review the variety of transfer agency fee structures throughout the industry and Fidelity's competitive positioning with respect to industry participants.
Investment in a Large Fund Family. The Board considered the benefits to shareholders of investing in a Fidelity fund, including the benefits of investing in a fund that is part of a large family of funds offering a variety of investment disciplines and providing a large variety of mutual fund investor services. The Board noted that Fidelity had taken, or had made recommendations that resulted in the Fidelity funds taking, a number of actions over the previous year that benefited particular funds, including (i) continuing to dedicate additional resources to investment research and to the support of the senior management team that oversees asset management; (ii) persisting in efforts to enhance Fidelity's global research capabilities; (iii) launching new funds and making other enhancements to meet client needs for income-oriented solutions; (iv) reducing fund expenses for certain index funds; (v) continuing to launch dedicated lower cost underlying funds to meet portfolio construction needs related to expanding underlying fund options for Fidelity funds of funds, specifically for the Freedom Fund product lines; (vi) rationalizing product lines and gaining increased efficiencies through fund mergers; (vii) launching sector-based exchange-traded funds and establishing a new Fidelity adviser to manage sector-based funds and products; (viii) continuing to develop and implement technology to improve security and increase efficiency; (ix) modifying the eligibility criteria for certain share classes to increase their marketability to a portion of the defined contribution plan market; (x) waiving redemption fees for certain qualified fund-of-fund and wrap programs and certain retirement plan transactions; and (xi) launching new Institutional Class shares of certain money market funds to attract and retain assets and to fill a gap in the money market fund lineup.
Annual Report
Board Approval of Investment Advisory Contracts and
Management Fees - continued
Investment Performance. The Board considered whether the fund has operated in accordance with its investment objective, as well as its record of compliance with its investment restrictions and its performance history.
The Board took into account discussions with the Investment Advisers about fund investment performance that occur at Board meetings throughout the year. In this regard the Board noted that as part of regularly scheduled fund reviews and other reports to the Board on fund performance, the Board periodically considers annualized return information for the fund, for different time periods, measured against a securities market index ("benchmark index") and a peer group of funds with similar objectives ("peer group"). In its evaluation of fund investment performance, the Board gave particular attention to information indicating changes in performance of certain Fidelity funds for specific time periods and the Investment Advisers' explanations for any overperformance or underperformance.
In addition to reviewing absolute and relative fund performance, the Independent Trustees periodically consider the appropriateness of fund performance metrics in evaluating the results achieved. In general, the Independent Trustees believe that fund performance should be evaluated based on net performance (after fees and expenses) of both the highest performing and lowest performing classes, where applicable, compared to appropriate benchmark indices, over appropriate time periods which may include full market cycles, and compared to peer groups, as applicable, over the same periods, taking into account relevant factors including the following: general market conditions; issuer-specific information; tactical opportunities for investment; and fund cash flows and other factors.
The Independent Trustees recognize that shareholders evaluate performance on a net basis over their own holding periods, for which one-, three-, and five-year periods are often used as a proxy. For this reason, the performance information reviewed by the Board also included net cumulative calendar year total return information for the fund and an appropriate benchmark index and peer group for the most recent one-, three-, and five-year periods, as shown below. Returns are shown compared to the 25th percentile (top of box, 75% beaten) and 75th percentile (bottom of box, 25% beaten) of the peer universe.
Annual Report
Fidelity Real Estate Income Fund

Based on its review, the Board concluded that the nature, extent, and quality of services provided to the fund under the Advisory Contracts should benefit the fund's shareholders.
Competitiveness of Management Fee and Total Expense Ratio. The Board considered the fund's management fee and total expense ratio compared to "mapped groups" of competitive funds and classes. Fidelity creates "mapped groups" by combining similar Lipper investment objective categories that have comparable investment mandates. Combining Lipper investment objective categories aids the Board's management fee and total expense ratio comparisons by broadening the competitive group used for comparison and by reducing the number of universes to which various Fidelity funds are compared.
Management Fee. The Board considered two proprietary management fee comparisons for the 12-month periods shown in the chart below. The group of Lipper funds used by the Board for management fee comparisons is referred to below as the "Total Mapped Group." The Total Mapped Group is broader than the Lipper peer group used by the Board for performance comparisons because the Total Mapped Group combines several Lipper investment objective categories while the Lipper peer group does not. The Total Mapped Group comparison focuses on a fund's standing in terms of gross management fees before expense reimbursements or caps relative to the total universe of funds with comparable investment mandates, regardless of whether their management fee structures also are comparable. Funds with comparable investment mandates offer exposure to similar types of securities. Funds with comparable management fee structures have similar management fee contractual arrangements (e.g., flat rate charged for advisory services, all-inclusive fee rate, etc.). "TMG %" represents the percentage of funds in the Total Mapped Group that had management fees that were lower than the fund's. For example, a hypothetical TMG % of 20% would mean that 80% of the funds in the Total Mapped Group had higher, and 20% had lower, management fees than the fund. The fund's actual TMG %s are in the chart below. The "Asset-Size Peer Group" (ASPG) comparison focuses on a fund's standing relative to a subset of non-Fidelity funds within the Total Mapped Group that are similar in size and management fee structure. For example, if a fund is in the first quartile of the ASPG, the fund's management fee ranks in the least expensive or lowest 25% of funds in the ASPG. The ASPG represents at least 15% of the funds in the Total Mapped Group with comparable asset size and management fee structures, subject to a minimum of 50 funds (or all funds in the Total Mapped Group if fewer than 50). Additional information, such as the ASPG quartile in which the fund's management fee rate ranked, is also included in the chart and considered by the Board.
Annual Report
Board Approval of Investment Advisory Contracts and
Management Fees - continued
Fidelity Real Estate Income Fund

The Board noted that the fund's management fee rate ranked below the median of its Total Mapped Group and below the median of its ASPG for 2013.
The Board also noted that, in August 2013, the ad hoc Committee on Management Fees was formed to conduct an in-depth review of the management fee rates of Fidelity's active equity mutual funds. The Committee focused on the following areas: (i) standard fee structures; (ii) research consumption and trading evolution; (iii) management fee competitiveness/profitability by category; and (iv) factors that drive institutional pricing.
Based on its review, the Board concluded that the fund's management fee is fair and reasonable in light of the services that the fund receives and the other factors considered.
Annual Report
Total Expense Ratio. In its review of each class's total expense ratio, the Board considered the fund's management fee as well as other fund or class expenses, as applicable, such as transfer agent fees, pricing and bookkeeping fees, fund-paid 12b-1 fees, and custodial, legal, and audit fees. The Board also noted the effects of any waivers and reimbursements on fees and expenses. As part of its review, the Board also considered the current and historical total expense ratios of each class of the fund compared to competitive fund median expenses. Each class of the fund is compared to those funds and classes in the Total Mapped Group (used by the Board for management fee comparisons) that have a similar sales load structure.
The Board noted that the total expense ratio of each class ranked below its competitive median for 2013.
Fees Charged to Other Fidelity Clients. The Board also considered Fidelity fee structures and other information with respect to clients of Fidelity, such as other funds advised or subadvised by Fidelity, pension plan clients, and other institutional clients. The Board noted the findings of the 2013 ad hoc joint committee (created with the board of other Fidelity funds), which reviewed and compared Fidelity's institutional investment advisory business with its business of providing services to the Fidelity funds, including the differences in services provided, fees charged, and costs incurred, as well as competition in their respective marketplaces.
Based on its review of total expense ratios and fees charged to other Fidelity clients, the Board concluded that the total expense ratio of each class of the fund was reasonable in light of the services that the fund and its shareholders receive and the other factors considered.
Costs of the Services and Profitability. The Board considered the revenues earned and the expenses incurred by Fidelity in conducting the business of developing, marketing, distributing, managing, administering and servicing the fund and servicing the fund's shareholders. The Board also considered the level of Fidelity's profits in respect of all the Fidelity funds.
On an annual basis, Fidelity presents to the Board Fidelity's profitability for the fund. Fidelity calculates the profitability for each fund, as well as aggregate profitability for groups of Fidelity funds and all Fidelity funds, using a series of detailed revenue and cost allocation methodologies which originate with the books and records of Fidelity on which Fidelity's audited financial statements are based. The Audit Committee of the Board reviews any significant changes from the prior year's methodologies.
PricewaterhouseCoopers LLP (PwC), independent registered public accounting firm and auditor to Fidelity and certain Fidelity funds, has been engaged annually by the Board as part of the Board's assessment of Fidelity's profitability analysis. PwC's engagement includes the review and assessment of the methodologies used by Fidelity in determining the revenues and expenses attributable to Fidelity's mutual fund business, and completion of agreed-upon procedures in respect of the mathematical accuracy of fund profitability and its conformity to established allocation methodologies. After considering PwC's reports issued under the engagement and information provided by Fidelity, the Board concluded that while other allocation methods may also be reasonable, Fidelity's profitability methodologies are reasonable in all material respects.
Annual Report
Board Approval of Investment Advisory Contracts and
Management Fees - continued
The Board also reviewed Fidelity's non-fund businesses and fall-out benefits related to the mutual fund business as well as cases where Fidelity's affiliates may benefit from or be related to the fund's business.
The Board considered the costs of the services provided by and the profits realized by Fidelity in connection with the operation of the fund and was satisfied that the profitability was not excessive in the circumstances.
Economies of Scale. The Board considered whether there have been economies of scale in respect of the management of the Fidelity funds, whether the Fidelity funds (including the fund) have appropriately benefited from any such economies of scale, and whether there is potential for realization of any further economies of scale. The Board considered the extent to which the fund will benefit from economies of scale through increased services to the fund, through waivers or reimbursements, or through fee or expense ratio reductions. The Board also noted that in 2013, it and the boards of other Fidelity funds created an ad hoc committee (the Economies of Scale Committee) to analyze whether Fidelity attains economies of scale in respect of the management and servicing of the Fidelity funds, whether the Fidelity funds have appropriately benefited from such economies of scale, and whether there is potential for realization of any further economies of scale.
The Board recognized that the fund's management contract incorporates a "group fee" structure, which provides for lower group fee rates as total group assets increase, and for higher group fee rates as total group assets decrease (with "group assets" defined to include fund assets under FMR's management plus sector fund assets previously under FMR's management and currently managed by Fidelity SelectCo, LLC). FMR calculates the group fee rates based on a tiered asset "breakpoint" schedule that varies based on asset class. The Board considered that the group fee is designed to deliver the benefits of economies of scale to fund shareholders when total Fidelity fund assets increase, even if assets of any particular fund are unchanged or have declined, because some portion of Fidelity's costs are attributable to services provided to all Fidelity funds, and all funds benefit if those costs can be allocated among more assets. The Board concluded that, given the group fee structure, fund shareholders will benefit from lower management fees as group assets increase at the fund complex level, regardless of whether Fidelity achieves any such economies of scale.
Annual Report
The Board concluded, taking into account the analysis of the Economies of Scale Committee, that economies of scale, if any, are being appropriately shared between fund shareholders and Fidelity.
Additional Information Requested by the Board. In order to develop fully the factual basis for consideration of the Fidelity funds' Advisory Contracts, the Board requested and received additional information on certain topics, including: (i) fund performance trends and Fidelity's long-term strategies for certain funds; (ii) Fidelity's strategic marketing and product lineup goals; (iii) the methodology with respect to competitive fund data and peer group classifications; (iv) the arrangements with, and performance of, certain sub-advisers on behalf of the Fidelity funds, as well as certain proposed participating affiliate arrangements; (v) the realization of fall-out benefits in certain Fidelity business units; (vi) Fidelity's group fee structures, including the rationale for the individual fee rates of certain categories of funds and the definition of group assets; (vii) trends regarding industry use of performance fee structures and the performance adjustment methodologies applicable to the Fidelity funds; (viii) additional competitive analysis regarding the total expenses for certain classes; (ix) fund profitability methodology, including Fidelity's cost allocation methodology, and the impact of certain factors on fund profitability results; and (x) the process by which Fidelity determines sub-advisory fees for funds it advises.
Based on its evaluation of all of the conclusions noted above, and after considering all factors it believed relevant, the Board ultimately concluded that the advisory fee structures are fair and reasonable, and that the fund's Advisory Contracts should be renewed.
Annual Report
Investment Adviser
Fidelity Management & Research Company
Boston, MA
Investment Sub-Advisers
FMR Co., Inc.
Fidelity Management & Research
(Hong Kong) Limited
Fidelity Management & Research
(Japan) Inc.
Fidelity Management & Research
(U.K.) Inc.
General Distributor
Fidelity Distributors Corporation
Smithfield, RI
Transfer and Service Agents
Fidelity Investments Institutional Operations Company, Inc.
Boston, MA
Fidelity Service Company, Inc.
Boston, MA
Custodian
Citibank, N.A.
New York, NY
(Fidelity Investment logo)(registered trademark)
REIA-UANN-0914
1.907548.104
Fidelity®
Series Real Estate Income
Fund
Fidelity Series Real Estate Income Fund
Class F
Annual Report
July 31, 2014
(Fidelity Cover Art)
Contents
Performance | (Click Here) | How the fund has done over time. |
Management's Discussion of Fund Performance | (Click Here) | The Portfolio Manager's review of fund performance and strategy. |
Shareholder Expense Example | (Click Here) | An example of shareholder expenses. |
Investment Changes | (Click Here) | A summary of major shifts in the fund's investments over the past six months. |
Investments | (Click Here) | A complete list of the fund's investments with their market values. |
Financial Statements | (Click Here) | Statements of assets and liabilities, operations, and changes in net assets, as well as financial highlights. |
Notes | (Click Here) | Notes to the financial statements. |
Report of Independent Registered Public Accounting Firm | (Click Here) | |
Trustees and Officers | (Click Here) | |
Distributions | (Click Here) | |
Board Approval of Investment Advisory Contracts and Management Fees | (Click Here) | |
To view a fund's proxy voting guidelines and proxy voting record for the 12-month period ended June 30, visit http://www.fidelity.com/proxyvotingresults or visit the Securities and Exchange Commission's (SEC) web site at http://www.sec.gov. You may also call 1-800-544-8544 for Fidelity® Series Real Estate Income Fund or 1-800-835-5092 for Class F of the fund to request a free copy of the proxy voting guidelines.
Standard & Poor's, S&P and S&P 500 are registered service marks of The McGraw-Hill Companies, Inc. and have been licensed for use by Fidelity Distributors Corporation.
Other third-party marks appearing herein are the property of their respective owners.
All other marks appearing herein are registered or unregistered trademarks or service marks of FMR LLC or an affiliated company. © 2014 FMR LLC. All rights reserved.
Annual Report
This report and the financial statements contained herein are submitted for the general information of the shareholders of the fund. This report is not authorized for distribution to prospective investors in the fund unless preceded or accompanied by an effective prospectus.
A fund files its complete schedule of portfolio holdings with the SEC for the first and third quarters of each fiscal year on Form N-Q. Forms N-Q are available on the SEC's web site at http://www.sec.gov. A fund's Forms N-Q may be reviewed and copied at the SEC's Public Reference Room in Washington, DC. Information regarding the operation of the SEC's Public Reference Room may be obtained by calling 1-800-SEC-0330. For a complete list of a fund's portfolio holdings, view the most recent holdings listing, semiannual report, or annual report on Fidelity's web site at http://www.fidelity.com, http://www.advisor.fidelity.com, or http://www.401k.com, as applicable.
NOT FDIC INSURED • MAY LOSE VALUE • NO BANK GUARANTEE
Neither the fund nor Fidelity Distributors Corporation is a bank.
Annual Report
Average annual total return reflects the change in the value of an investment, assuming reinvestment of the class' distributions from dividend income and capital gains (the profits earned upon the sale of securities that have grown in value, if any) and assuming a constant rate of performance each year. The $10,000 table and the fund's returns do not reflect the deduction of taxes that a shareholder would pay on fund distributions or the redemption of fund shares. During periods of reimbursement by Fidelity, a fund's total return will be greater than it would be had the reimbursement not occurred. How a fund did yesterday is no guarantee of how it will do tomorrow.
Average Annual Total Returns
Periods ended July 31, 2014 | Past 1
year | Life of
fund A |
Fidelity® Series Real Estate Income Fund | 8.33% | 12.06% |
Class F | 8.60% | 12.28% |
A From October 20, 2011.
$10,000 Over Life of Fund
Let's say hypothetically that $10,000 was invested in Fidelity Series Real Estate Income Fund, a class of the fund, on October 20, 2011, when the fund started. The chart shows how the value of your investment would have changed, and also shows how the S&P 500® Index performed over the same period.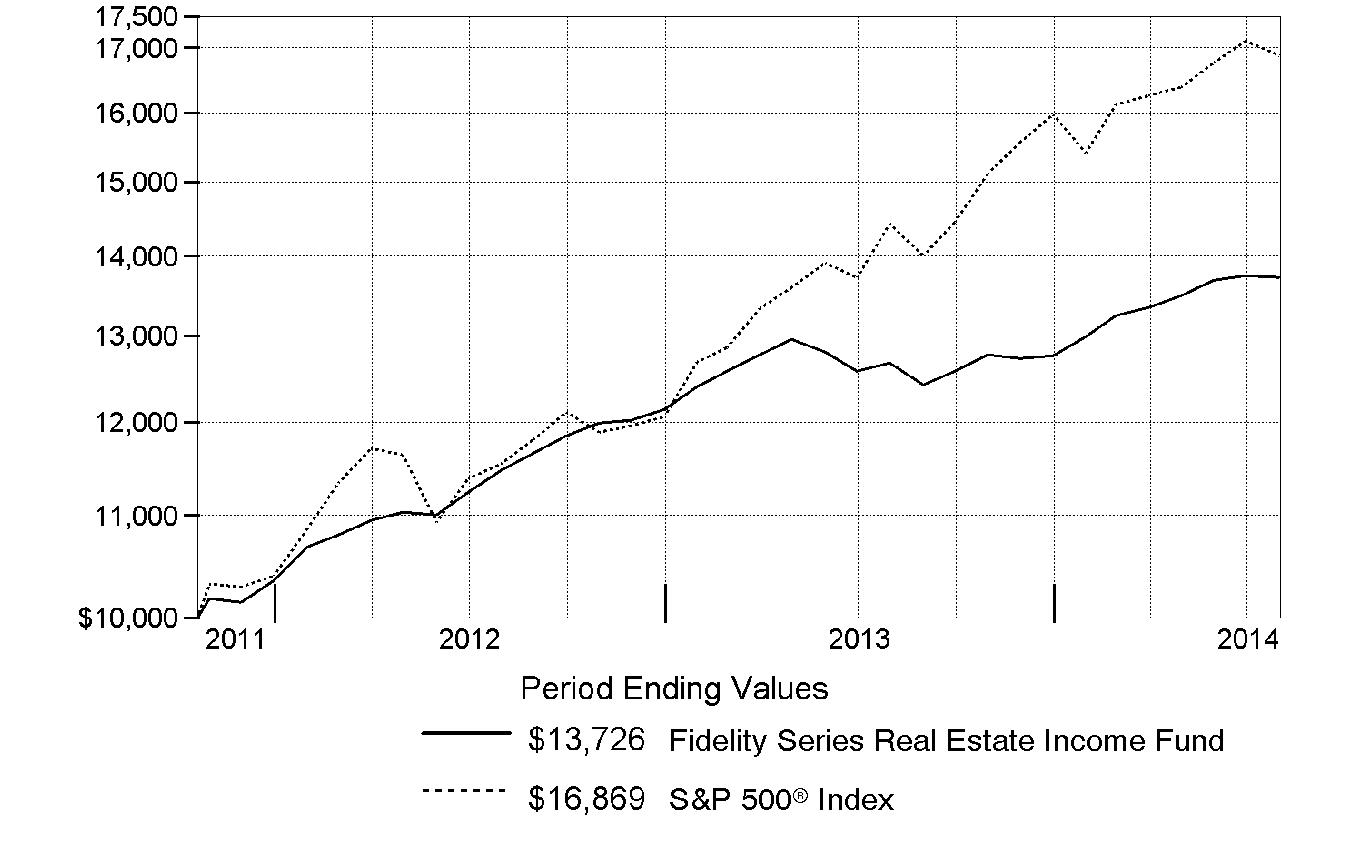
Annual Report
Market Recap: The fundamental backdrop for commercial real estate remained solid throughout the 12 months ending July 31, 2014. Continued favorable demand across most sectors and geographic markets, along with limited new construction, led to rising occupancies. In turn, this led to gently rising rents and cash flow for real estate owners, including real estate investment trusts (REITs). Investors' continued search for yield in a low-interest-rate environment - rates ended the 12-month period roughly at their starting point - helped further boost the performance of multiple types of real estate securities. For the full 12 months, REIT stocks, as measured by the FTSE® NAREIT® All REITs Index, gained 12.90%, with the vast majority of that increase coming in the second half of the period. The MSCI REIT Preferred Index, which reflects the performance of real estate preferred stocks, added 9.62%. On the fixed-income side, The BofA Merrill LynchSM US Real Estate Index - a market-capitalization-weighted measure of investment-grade corporate debt in the domestic real estate sector - advanced 6.67%, benefiting partly from narrowing credit spreads that helped compensate for rising interest rates in the first half of the 12-month period. In comparison, the S&P 500® Index, a proxy for the broad U.S. stock market, was up 16.94%.
Comments from Mark Snyderman, Portfolio Manager of Fidelity® Series Real Estate Income Fund: For the year, the fund's Series Real Estate Income and Class F shares gained 8.33% and 8.60%, respectively, which I consider good absolute returns for a 12-month period. In comparison, however, the Fidelity Real Estate Income Composite IndexSM - a 40/50/10 blend of the MSCI REIT Preferred Index, The BofA Merrill LynchSM US Real Estate Index and the FTSE® NAREIT® All REITs Index, respectively - added 8.53%. Most of the categories in which the fund invests did well. The fund's REIT common stock holdings surpassed the 13% gain in the FTSE® NAREIT® index. Its preferred stocks added about 11%, outpacing the MSCI preferred stock index. On the portfolio's fixed-income side, the fund did particularly well with its commercial mortgage backed securities investments, which rose 10%, compared with approximately 7% for the BofA Merrill Lynch real estate bond index. The fund's high-yield real estate bond picks outpaced this measure, while its investment-grade bonds lagged. Meanwhile, the fund was hampered by a cash position of about 6%, on average. I like to hold enough cash to take advantage of attractive buying opportunities when others must sell; unfortunately, the size of the portfolio's stake here was a drag on results in a rising market during the period.
The views expressed above reflect those of the portfolio manager(s) only through the end of the period as stated on the cover of this report and do not necessarily represent the views of Fidelity or any other person in the Fidelity organization. Any such views are subject to change at any time based upon market or other conditions and Fidelity disclaims any responsibility to update such views. These views may not be relied on as investment advice and, because investment decisions for a Fidelity fund are based on numerous factors, may not be relied on as an indication of trading intent on behalf of any Fidelity fund.
Annual Report
Shareholder Expense Example
As a shareholder of the Fund, you incur two types of costs: (1) transaction costs, and (2) ongoing costs, including management fees and other Fund expenses. This Example is intended to help you understand your ongoing costs (in dollars) of investing in the Fund and to compare these costs with the ongoing costs of investing in other mutual funds.
The Example is based on an investment of $1,000 invested at the beginning of the period and held for the entire period (February 1, 2014 to July 31, 2014).
Actual Expenses
The first line of the accompanying table for each class of the Fund provides information about actual account values and actual expenses. You may use the information in this line, together with the amount you invested, to estimate the expenses that you paid over the period. Simply divide your account value by $1,000.00 (for example, an $8,600 account value divided by $1,000.00 = 8.6), then multiply the result by the number in the first line for a class of the Fund under the heading entitled "Expenses Paid During Period" to estimate the expenses you paid on your account during this period. In addition, the Fund, as a shareholder in the underlying Fidelity Central Funds, will indirectly bear its pro-rata share of the fees and expenses incurred by the underlying Fidelity Central Funds. These fees and expenses are not included in the Fund's annualized expense ratio used to calculate the expense estimate in the table below.
Hypothetical Example for Comparison Purposes
The second line of the accompanying table for each class of the Fund provides information about hypothetical account values and hypothetical expenses based on a Class' actual expense ratio and an assumed rate of return of 5% per year before expenses, which is not the Class' actual return. The hypothetical account values and expenses may not be used to estimate the actual ending account balance or expenses you paid for the period. You may use this information to compare the ongoing costs of investing in the Fund and other funds. To do so, compare this 5% hypothetical example with the 5% hypothetical examples that appear in the shareholder reports of the other funds. In addition, the Fund, as a shareholder in the underlying Fidelity Central Funds, will indirectly bear its pro-rata share of the fees and expenses incurred by the underlying Fidelity Central Funds. These fees and expenses are not included in the Fund's annualized expense ratio used to calculate the expense estimate in the table below.
Please note that the expenses shown in the table are meant to highlight your ongoing costs only and do not reflect any transaction costs. Therefore, the second line of the table is useful in comparing ongoing costs only, and will not help you determine the relative total costs of owning different funds.
Annual Report
Shareholder Expense Example - continued
| Annualized
Expense RatioB | Beginning
Account Value
February 1, 2014 | Ending
Account Value
July 31, 2014 | Expenses Paid
During Period*
February 1, 2014
to July 31, 2014 |
Series Real Estate Income | .77% | | | |
Actual | | $ 1,000.00 | $ 1,056.90 | $ 3.93 |
HypotheticalA | | $ 1,000.00 | $ 1,020.98 | $ 3.86 |
Class F | .61% | | | |
Actual | | $ 1,000.00 | $ 1,058.60 | $ 3.11 |
HypotheticalA | | $ 1,000.00 | $ 1,021.77 | $ 3.06 |
A 5% return per year before expenses
B Annualized expense ratio reflects expenses net of applicable fee waivers.
* Expenses are equal to each Class' annualized expense ratio, multiplied by the average account value over the period, multiplied by 181/365 (to reflect the one-half year period).
Annual Report
Investment Changes (Unaudited)
Top Five Stocks as of July 31, 2014 |
| % of fund's
net assets | % of fund's net assets
6 months ago |
MFA Financial, Inc. | 1.6 | 1.5 |
Equity Lifestyle Properties, Inc. | 1.6 | 1.5 |
Acadia Realty Trust (SBI) | 1.5 | 1.4 |
Ventas, Inc. | 1.2 | 1.2 |
Excel Trust, Inc. Series B, 8.125% | 1.1 | 1.1 |
| 7.0 | |
Top 5 Bonds as of July 31, 2014 |
| % of fund's
net assets | % of fund's net assets
6 months ago |
Standard Pacific Corp. 8.375% 5/15/18 | 1.1 | 1.2 |
Blackstone Mortgage Trust, Inc. 5.25% 12/1/18 | 1.0 | 1.0 |
Blackstone 9.98% 10/1/17 | 0.9 | 0.9 |
iStar Financial, Inc. 5.875% 3/15/16 | 0.9 | 1.1 |
M/I Homes, Inc. 8.625% 11/15/18 | 0.9 | 0.9 |
| 4.8 | |
Top Five REIT Sectors as of July 31, 2014 |
| % of fund's
net assets | % of fund's net assets
6 months ago |
REITs - Mortgage | 15.8 | 15.2 |
REITs - Management/Investment | 6.7 | 7.3 |
REITs - Shopping Centers | 5.9 | 5.8 |
REITs - Health Care Facilities | 5.0 | 4.4 |
REITs - Office Buildings | 4.1 | 3.7 |
Asset Allocation (% of fund's net assets) |
As of July 31, 2014 * | As of January 31, 2014 ** |
 | Common Stocks 15.5% | | | Common Stocks 15.5% | |
 | Preferred Stocks 22.5% | | | Preferred Stocks 20.0% | |
 | Bonds 43.6% | | | Bonds 46.7% | |
 | Convertible
Securities 5.8% | | | Convertible
Securities 6.5% | |
 | Other Investments 6.6% | | | Other Investments 6.9% | |
 | Short-Term
Investments and
Net Other Assets
(Liabilities) 6.0% | | | Short-Term
Investments and
Net Other Assets
(Liabilities) 4.4% | |
* Foreign investments | 2.6% | | ** Foreign investments | 4.5% | |

Annual Report
Investments July 31, 2014
Showing Percentage of Net Assets
Common Stocks - 15.5% |
| Shares | | Value |
FINANCIALS - 15.4% |
Capital Markets - 0.1% |
Ellington Financial LLC | 31,400 | | $ 744,180 |
Real Estate Investment Trusts - 15.1% |
Acadia Realty Trust (SBI) | 442,700 | | 12,497,421 |
American Tower Corp. | 16,900 | | 1,595,191 |
Annaly Capital Management, Inc. | 52,300 | | 580,530 |
Anworth Mortgage Asset Corp. | 271,800 | | 1,380,744 |
Apartment Investment & Management Co. Class A | 113,800 | | 3,889,684 |
Arbor Realty Trust, Inc. | 124,900 | | 883,043 |
Associated Estates Realty Corp. | 18,700 | | 330,429 |
AvalonBay Communities, Inc. | 21,200 | | 3,139,296 |
BioMed Realty Trust, Inc. | 71,400 | | 1,535,100 |
CBL & Associates Properties, Inc. | 251,400 | | 4,701,180 |
Cedar Shopping Centers, Inc. | 64,200 | | 404,460 |
Chambers Street Properties | 139,800 | | 1,087,644 |
Chartwell Retirement Residence (a)(f) | 14,700 | | 145,605 |
CYS Investments, Inc. | 188,400 | | 1,672,992 |
Douglas Emmett, Inc. | 69,000 | | 1,965,810 |
Dynex Capital, Inc. | 228,300 | | 1,894,890 |
EastGroup Properties, Inc. | 10,500 | | 654,780 |
Equity Lifestyle Properties, Inc. | 301,700 | | 13,362,293 |
Equity Residential (SBI) | 31,600 | | 2,042,940 |
Excel Trust, Inc. | 206,300 | | 2,671,585 |
Extra Space Storage, Inc. | 9,600 | | 496,608 |
First Potomac Realty Trust | 120,400 | | 1,588,076 |
Hatteras Financial Corp. | 61,800 | | 1,183,470 |
Highwoods Properties, Inc. (SBI) | 12,900 | | 542,703 |
Lexington Corporate Properties Trust | 393,200 | | 4,301,608 |
Liberty Property Trust (SBI) | 19,700 | | 692,849 |
LTC Properties, Inc. | 57,600 | | 2,207,808 |
MFA Financial, Inc. | 1,657,400 | | 13,491,225 |
Mid-America Apartment Communities, Inc. | 69,200 | | 4,838,464 |
Monmouth Real Estate Investment Corp. Class A (e) | 78,100 | | 802,868 |
National Retail Properties, Inc. (e) | 25,000 | | 889,250 |
Newcastle Investment Corp. | 467,900 | | 2,091,513 |
NorthStar Realty Finance Corp. | 34,700 | | 558,670 |
Piedmont Office Realty Trust, Inc. Class A | 88,700 | | 1,725,215 |
Potlatch Corp. | 4,000 | | 165,200 |
Prologis, Inc. | 49,400 | | 2,016,014 |
Redwood Trust, Inc. | 56,000 | | 1,062,880 |
Select Income (REIT) | 42,500 | | 1,179,375 |
Senior Housing Properties Trust (SBI) | 143,600 | | 3,282,696 |
Common Stocks - continued |
| Shares | | Value |
FINANCIALS - continued |
Real Estate Investment Trusts - continued |
Simon Property Group, Inc. | 16,900 | | $ 2,842,411 |
Stag Industrial, Inc. | 27,100 | | 618,964 |
Terreno Realty Corp. | 160,361 | | 2,998,751 |
Two Harbors Investment Corp. | 163,900 | | 1,676,697 |
Ventas, Inc. | 151,600 | | 9,626,600 |
Washington Prime Group, Inc. (a) | 43,250 | | 816,993 |
Washington REIT (SBI) | 46,100 | | 1,250,232 |
Weyerhaeuser Co. | 78,300 | | 2,452,356 |
WP Carey, Inc. | 58,400 | | 3,838,632 |
| | 125,673,745 |
Real Estate Management & Development - 0.2% |
Kennedy-Wilson Holdings, Inc. | 74,800 | | 1,750,320 |
TOTAL FINANCIALS | | 128,168,245 |
MATERIALS - 0.1% |
Paper & Forest Products - 0.1% |
West Fraser Timber Co. Ltd. | 13,800 | | 628,648 |
TOTAL COMMON STOCKS (Cost $105,656,614) |
128,796,893
|
Preferred Stocks - 23.2% |
| | | |
Convertible Preferred Stocks - 0.7% |
FINANCIALS - 0.7% |
Real Estate Investment Trusts - 0.7% |
Excel Trust, Inc. 7.00% (f) | 24,300 | | 637,875 |
Health Care REIT, Inc. Series I, 6.50% | 16,200 | | 947,700 |
Lexington Corporate Properties Trust Series C, 6.50% | 59,500 | | 2,805,425 |
Weyerhaeuser Co. Series A, 6.375% | 32,000 | | 1,728,998 |
| | 6,119,998 |
Nonconvertible Preferred Stocks - 22.5% |
CONSUMER DISCRETIONARY - 0.3% |
Hotels, Restaurants & Leisure - 0.3% |
Red Lion Hotels Capital Trust 9.50% | 98,191 | | 2,558,857 |
Preferred Stocks - continued |
| Shares | | Value |
Nonconvertible Preferred Stocks - continued |
FINANCIALS - 22.2% |
Capital Markets - 0.1% |
Arlington Asset Investment Corp. 6.625% | 31,528 | | $ 761,716 |
Real Estate Investment Trusts - 21.9% |
AG Mortgage Investment Trust, Inc. 8.00% | 103,304 | | 2,481,362 |
Alexandria Real Estate Equities, Inc. Series E, 6.45% | 24,001 | | 606,505 |
American Capital Agency Corp.: | | | |
8.00% | 120,000 | | 3,102,000 |
Series B, 7.75% | 16,000 | | 390,240 |
American Capital Mortgage Investment Corp. Series A, 8.125% | 33,100 | | 831,141 |
American Homes 4 Rent: | | | |
Series A, 5.00% | 210,000 | | 5,208,000 |
Series B, 5.00% | 80,000 | | 1,950,400 |
Series C, 5.50% | 53,000 | | 1,312,280 |
American Realty Capital Properties, Inc. Series F, 6.70% | 46,191 | | 1,073,941 |
Annaly Capital Management, Inc.: | | | |
Series A, 7.875% | 150,300 | | 3,810,105 |
Series C, 7.625% | 24,839 | | 606,320 |
Series D, 7.50% | 73,213 | | 1,766,630 |
Anworth Mortgage Asset Corp. Series A, 8.625% | 178,800 | | 4,525,428 |
Apollo Commercial Real Estate Finance, Inc. Series A, 8.625% | 61,725 | | 1,625,219 |
Apollo Residential Mortgage, Inc. Series A, 8.00% | 49,077 | | 1,187,663 |
Arbor Realty Trust, Inc.: | | | |
Series A, 8.25% | 41,922 | | 1,048,050 |
Series B, 7.75% | 40,000 | | 980,400 |
Series C, 8.50% | 15,000 | | 378,750 |
Armour Residential REIT, Inc. Series B, 7.875% | 25,701 | | 623,506 |
Ashford Hospitality Trust, Inc.: | | | |
Series D, 8.45% | 51,709 | | 1,321,165 |
Series E, 9.00% | 35,948 | | 974,191 |
Brandywine Realty Trust Series E, 6.90% | 21,000 | | 555,450 |
Campus Crest Communities, Inc. Series A, 8.00% | 71,569 | | 1,835,745 |
Capstead Mortgage Corp. Series E, 7.50% | 37,016 | | 890,938 |
CBL & Associates Properties, Inc.: | | | |
Series D, 7.375% | 67,200 | | 1,683,360 |
Series E, 6.625% | 45,505 | | 1,111,232 |
Cedar Shopping Centers, Inc. Series B, 7.25% | 109,018 | | 2,777,779 |
Chesapeake Lodging Trust Series A, 7.75% | 64,034 | | 1,675,770 |
Colony Financial, Inc. Series A, 8.50% | 77,829 | | 2,035,228 |
Preferred Stocks - continued |
| Shares | | Value |
Nonconvertible Preferred Stocks - continued |
FINANCIALS - continued |
Real Estate Investment Trusts - continued |
CommonWealth REIT: | | | |
7.50% | 24,923 | | $ 505,688 |
Series E, 7.25% | 200,160 | | 5,196,154 |
Coresite Realty Corp. Series A, 7.25% | 42,600 | | 1,092,264 |
Corporate Office Properties Trust Series L, 7.375% | 136,869 | | 3,562,700 |
CubeSmart Series A, 7.75% | 40,000 | | 1,065,200 |
CYS Investments, Inc.: | | | |
Series A, 7.75% | 10,014 | | 244,842 |
Series B, 7.50% | 63,333 | | 1,492,759 |
DDR Corp.: | | | |
Series J, 6.50% | 70,181 | | 1,766,456 |
Series K, 6.25% | 25,489 | | 622,951 |
Digital Realty Trust, Inc.: | | | |
Series E, 7.00% | 40,181 | | 1,020,999 |
Series F, 6.625% | 20,000 | | 483,600 |
Series G, 5.875% | 28,270 | | 625,332 |
Series H, 7.375% | 10,000 | | 255,500 |
Duke Realty LP Series L, 6.60% | 4,300 | | 109,005 |
DuPont Fabros Technology, Inc. Series B, 7.625% | 73,798 | | 1,875,207 |
Dynex Capital, Inc.: | | | |
Series A, 8.50% | 96,313 | | 2,407,825 |
Series B, 7.625% | 47,335 | | 1,135,567 |
Equity Lifestyle Properties, Inc. Series C, 6.75% | 182,313 | | 4,701,852 |
Essex Property Trust, Inc. Series H, 7.125% | 8,100 | | 216,270 |
Excel Trust, Inc. Series B, 8.125% | 360,000 | | 9,385,200 |
First Potomac Realty Trust 7.75% | 107,746 | | 2,817,558 |
Five Oaks Investment Corp. Series A, 8.75% | 40,000 | | 1,006,800 |
General Growth Properties, Inc. Series A, 6.375% | 34,690 | | 839,498 |
Gladstone Commercial Corp. Series C, 7.125% | 67,762 | | 1,749,615 |
Glimcher Realty Trust: | | | |
6.875% | 3,183 | | 80,434 |
Series G, 8.125% | 40,977 | | 1,035,489 |
Series H, 7.50% | 53,575 | | 1,446,525 |
Hatteras Financial Corp. Series A, 7.625% | 65,472 | | 1,551,686 |
Health Care REIT, Inc. Series J, 6.50% | 33,400 | | 859,048 |
Hersha Hospitality Trust Series B, 8.00% | 18,928 | | 503,106 |
Hospitality Properties Trust Series D, 7.125% | 40,200 | | 1,024,296 |
Hudson Pacific Properties, Inc. 8.375% | 84,787 | | 2,246,856 |
Inland Real Estate Corp. Series A, 8.125% | 200,000 | | 5,210,000 |
Preferred Stocks - continued |
| Shares | | Value |
Nonconvertible Preferred Stocks - continued |
FINANCIALS - continued |
Real Estate Investment Trusts - continued |
Invesco Mortgage Capital, Inc. Series A, 7.75% | 30,151 | | $ 734,478 |
Investors Real Estate Trust Series B, 7.95% | 33,428 | | 876,816 |
iStar Financial, Inc.: | | | |
Series E, 7.875% | 24,583 | | 611,379 |
Series F, 7.80% | 128,864 | | 3,182,941 |
Series G, 7.65% | 84,000 | | 2,066,400 |
Kilroy Realty Corp.: | | | |
Series G, 6.875% | 20,300 | | 526,582 |
Series H, 6.375% | 31,704 | | 783,406 |
Kite Realty Group Trust 8.25% | 4,100 | | 106,641 |
LaSalle Hotel Properties: | | | |
Series H, 7.50% | 37,192 | | 976,662 |
Series I, 6.375% | 47,339 | | 1,178,268 |
LBA Realty Fund II Series B, 7.625% | 118,900 | | 2,615,800 |
MFA Financial, Inc.: | | | |
8.00% | 108,747 | | 2,794,798 |
Series B, 7.50% | 188,749 | | 4,526,201 |
Monmouth Real Estate Investment Corp. Series B, 7.875% | 30,000 | | 787,500 |
National Retail Properties, Inc.: | | | |
5.70% | 46,124 | | 1,080,685 |
Series D, 6.625% | 46,667 | | 1,173,675 |
New York Mortgage Trust, Inc. Series B, 7.75% | 70,013 | | 1,659,308 |
NorthStar Realty Finance Corp.: | | | |
Series B, 8.25% | 16,301 | | 407,525 |
Series C, 8.875% | 105,295 | | 2,689,234 |
Series D, 8.50% | 44,213 | | 1,110,631 |
Series E, 8.75% | 63,120 | | 1,592,518 |
Pebblebrook Hotel Trust: | | | |
Series A, 7.875% | 119,000 | | 3,129,700 |
Series B, 8.00% | 37,400 | | 994,092 |
Series C, 6.50% | 66,082 | | 1,622,313 |
Pennsylvania (REIT) 7.375% | 55,408 | | 1,428,418 |
Prologis, Inc. Series Q, 8.54% | 15,800 | | 1,026,013 |
PS Business Parks, Inc.: | | | |
Series R, 6.875% | 1,100 | | 28,259 |
Series T, 6.00% | 26,000 | | 617,500 |
Series U, 5.75% | 102,483 | | 2,351,985 |
RAIT Financial Trust 7.625% | 44,680 | | 1,098,681 |
Preferred Stocks - continued |
| Shares | | Value |
Nonconvertible Preferred Stocks - continued |
FINANCIALS - continued |
Real Estate Investment Trusts - continued |
Regency Centers Corp.: | | | |
Series 6, 6.625% | 17,739 | | $ 459,440 |
Series 7, 6.00% | 22,000 | | 528,660 |
Retail Properties America, Inc. 7.00% | 83,617 | | 2,100,459 |
Sabra Health Care REIT, Inc. Series A, 7.125% | 80,000 | | 2,083,200 |
Saul Centers, Inc.: | | | |
Series A, 8.00% | 14,472 | | 376,272 |
Series C, 6.875% | 69,596 | | 1,739,900 |
Senior Housing Properties Trust 5.625% | 42,353 | | 977,507 |
Stag Industrial, Inc. Series A, 9.00% | 280,000 | | 7,761,600 |
Summit Hotel Properties, Inc. Series A, 9.25% | 173,700 | | 4,776,750 |
Sun Communities, Inc. Series A, 7.125% | 59,000 | | 1,514,530 |
Sunstone Hotel Investors, Inc. Series D, 8.00% | 32,939 | | 878,154 |
Taubman Centers, Inc. Series K, 6.25% | 19,561 | | 479,245 |
Terreno Realty Corp. Series A, 7.75% | 81,048 | | 2,096,712 |
UMH Properties, Inc. Series A, 8.25% | 96,000 | | 2,534,400 |
Urstadt Biddle Properties, Inc. Series F, 7.125% | 30,000 | | 763,500 |
Weingarten Realty Investors (SBI) Series F, 6.50% | 26,708 | | 673,309 |
Winthrop Realty Trust 7.75% | 60,000 | | 1,545,000 |
| | 181,572,127 |
Real Estate Management & Development - 0.2% |
Kennedy-Wilson, Inc. 7.75% | 55,054 | | 1,403,877 |
TOTAL FINANCIALS | | 183,737,720 |
TOTAL NONCONVERTIBLE PREFERRED STOCKS | | 186,296,577 |
TOTAL PREFERRED STOCKS (Cost $184,287,193) |
192,416,575
|
Corporate Bonds - 26.0% |
| Principal
Amount | | |
Convertible Bonds - 5.1% |
CONSUMER DISCRETIONARY - 0.2% |
Hotels, Restaurants & Leisure - 0.2% |
Morgans Hotel Group Co. 2.375% 10/15/14 | | $ 1,365,000 | | 1,354,763 |
Corporate Bonds - continued |
| Principal
Amount | | Value |
Convertible Bonds - continued |
FINANCIALS - 4.9% |
Consumer Finance - 0.4% |
Zais Financial Partners LP 8% 11/15/16 (f) | | $ 3,000,000 | | $ 3,094,071 |
Diversified Financial Services - 0.6% |
IAS Operating Partnership LP 5% 3/15/18 (f) | | 5,420,000 | | 5,312,706 |
Real Estate Investment Trusts - 3.6% |
Annaly Capital Management, Inc. 5% 5/15/15 | | 6,690,000 | | 6,798,713 |
Apollo Commercial Real Estate Finance, Inc. 5.5% 3/15/19 | | 860,000 | | 912,718 |
Ares Commercial Real Estate Corp. 7% 12/15/15 | | 2,300,000 | | 2,380,500 |
Blackstone Mortgage Trust, Inc. 5.25% 12/1/18 | | 7,750,000 | | 8,297,925 |
Campus Crest Communities Operating Partnership LP 4.75% 10/15/18 (f) | | 3,000,000 | | 2,932,500 |
Colony Financial, Inc. 3.875% 1/15/21 | | 1,090,000 | | 1,105,669 |
PennyMac Corp. 5.375% 5/1/20 | | 1,500,000 | | 1,487,619 |
RAIT Financial Trust 4% 10/1/33 | | 2,000,000 | | 1,912,500 |
Redwood Trust, Inc. 4.625% 4/15/18 | | 3,000,000 | | 3,090,000 |
Spirit Realty Capital, Inc. 3.75% 5/15/21 | | 1,000,000 | | 1,011,250 |
| | 29,929,394 |
Real Estate Management & Development - 0.3% |
Forest City Enterprises, Inc. 3.625% 8/15/20 | | 2,450,000 | | 2,560,250 |
Grubb & Ellis Co. 7.95% 5/1/15 (d)(f) | | 1,540,000 | | 0 |
| | 2,560,250 |
TOTAL FINANCIALS | | 40,896,421 |
TOTAL CONVERTIBLE BONDS | | 42,251,184 |
Nonconvertible Bonds - 20.9% |
CONSUMER DISCRETIONARY - 6.6% |
Hotels, Restaurants & Leisure - 1.0% |
FelCor Lodging LP 6.75% 6/1/19 | | 1,375,000 | | 1,436,875 |
Hilton Worldwide Finance LLC/Hilton Worldwide Finance Corp. 5.625% 10/15/21 (f) | | 1,555,000 | | 1,628,863 |
Paris Las Vegas Holding LLC/Harrah's Las Vegas LLC/Flamingo Las Vegas Holdings, Inc. 8% 10/1/20 (f) | | 2,250,000 | | 2,306,250 |
Times Square Hotel Trust 8.528% 8/1/26 (f) | | 2,595,229 | | 3,253,995 |
| | 8,625,983 |
Corporate Bonds - continued |
| Principal
Amount | | Value |
Nonconvertible Bonds - continued |
CONSUMER DISCRETIONARY - continued |
Household Durables - 5.6% |
Ashton Woods U.S.A. LLC/Ashton Woods Finance Co. 6.875% 2/15/21 (f) | | $ 1,800,000 | | $ 1,755,000 |
Brookfield Residential Properties, Inc./Brookfield Residential U.S. Corp. 6.125% 7/1/22 (f) | | 530,000 | | 543,250 |
Brookfield Residential Properties, Inc. 6.5% 12/15/20 (f) | | 395,000 | | 414,256 |
D.R. Horton, Inc.: | | | | |
4.375% 9/15/22 | | 825,000 | | 812,625 |
5.75% 8/15/23 | | 490,000 | | 516,950 |
6.5% 4/15/16 | | 811,000 | | 863,715 |
KB Home: | | | | |
8% 3/15/20 | | 2,395,000 | | 2,712,338 |
9.1% 9/15/17 | | 1,185,000 | | 1,374,600 |
Lennar Corp.: | | | | |
4.125% 12/1/18 | | 1,220,000 | | 1,226,100 |
4.5% 6/15/19 | | 400,000 | | 400,000 |
5.6% 5/31/15 | | 1,216,000 | | 1,253,757 |
6.95% 6/1/18 | | 1,720,000 | | 1,915,650 |
M/I Homes, Inc. 8.625% 11/15/18 | | 6,764,000 | | 7,110,655 |
Meritage Homes Corp.: | | | | |
7% 4/1/22 | | 2,005,000 | | 2,190,463 |
7.15% 4/15/20 | | 1,940,000 | | 2,138,850 |
Ryland Group, Inc.: | | | | |
6.625% 5/1/20 | | 445,000 | | 476,150 |
8.4% 5/15/17 | | 1,446,000 | | 1,662,900 |
Standard Pacific Corp.: | | | | |
8.375% 5/15/18 | | 8,047,000 | | 9,233,933 |
10.75% 9/15/16 | | 3,284,000 | | 3,809,440 |
Toll Brothers Finance Corp. 5.875% 2/15/22 | | 450,000 | | 482,625 |
William Lyon Homes, Inc.: | | | | |
7% 8/15/22 (f)(g) | | 495,000 | | 495,000 |
8.5% 11/15/20 | | 4,320,000 | | 4,762,800 |
| | 46,151,057 |
TOTAL CONSUMER DISCRETIONARY | | 54,777,040 |
FINANCIALS - 12.8% |
Diversified Financial Services - 0.7% |
Cantor Commercial Real Estate Co. LP/CCRE Finance Corp. 7.75% 2/15/18 (f) | | 1,025,000 | | 1,096,750 |
Corporate Bonds - continued |
| Principal
Amount | | Value |
Nonconvertible Bonds - continued |
FINANCIALS - continued |
Diversified Financial Services - continued |
Icahn Enterprises LP/Icahn Enterprises Finance Corp.: | | | | |
5.875% 2/1/22 | | $ 820,000 | | $ 835,888 |
6% 8/1/20 | | 3,500,000 | | 3,648,750 |
| | 5,581,388 |
Real Estate Investment Trusts - 9.5% |
American Campus Communities Operating Partnership LP 4.125% 7/1/24 | | 1,000,000 | | 1,003,290 |
American Tower Corp. 3.4% 2/15/19 | | 2,000,000 | | 2,073,418 |
Camden Property Trust 5% 6/15/15 | | 1,135,000 | | 1,177,548 |
CBL & Associates LP 5.25% 12/1/23 | | 2,000,000 | | 2,131,658 |
Commercial Net Lease Realty, Inc. 6.15% 12/15/15 | | 917,000 | | 980,231 |
Crown Castle International Corp. 5.25% 1/15/23 | | 1,500,000 | | 1,515,000 |
CTR Partnership LP / CareTrust Capital Corp. 5.875% 6/1/21 (f) | | 475,000 | | 476,188 |
CubeSmart LP 4.8% 7/15/22 | | 1,000,000 | | 1,068,722 |
DCT Industrial Operating Partnership LP 4.5% 10/15/23 | | 2,000,000 | | 2,040,838 |
DDR Corp.: | | | | |
7.5% 7/15/18 | | 2,407,000 | | 2,852,066 |
9.625% 3/15/16 | | 2,254,000 | | 2,559,703 |
DuPont Fabros Technology LP 5.875% 9/15/21 | | 2,000,000 | | 2,040,000 |
Equity One, Inc.: | | | | |
5.375% 10/15/15 | | 405,000 | | 425,555 |
6% 9/15/16 | | 811,000 | | 885,876 |
6.25% 1/15/17 | | 811,000 | | 895,505 |
Health Care Property Investors, Inc.: | | | | |
6% 3/1/15 | | 1,216,000 | | 1,253,106 |
6.3% 9/15/16 | | 3,850,000 | | 4,268,630 |
7.072% 6/8/15 | | 405,000 | | 426,416 |
Health Care REIT, Inc. 4.125% 4/1/19 | | 1,000,000 | | 1,075,042 |
Healthcare Realty Trust, Inc.: | | | | |
3.75% 4/15/23 | | 801,000 | | 781,589 |
6.5% 1/17/17 | | 506,000 | | 564,440 |
Highwoods/Forsyth LP: | | | | |
3.625% 1/15/23 | | 393,000 | | 386,578 |
5.85% 3/15/17 | | 2,593,000 | | 2,868,460 |
Hospitality Properties Trust: | | | | |
5% 8/15/22 | | 823,000 | | 868,187 |
5.625% 3/15/17 | | 1,248,000 | | 1,358,886 |
Corporate Bonds - continued |
| Principal
Amount | | Value |
Nonconvertible Bonds - continued |
FINANCIALS - continued |
Real Estate Investment Trusts - continued |
Hospitality Properties Trust: - continued | | | | |
6.7% 1/15/18 | | $ 811,000 | | $ 909,514 |
HRPT Properties Trust 6.25% 8/15/16 | | 4,000,000 | | 4,257,252 |
iStar Financial, Inc.: | | | | |
3.875% 7/1/16 | | 525,000 | | 528,938 |
4% 11/1/17 | | 2,500,000 | | 2,462,500 |
5% 7/1/19 | | 2,500,000 | | 2,462,500 |
5.85% 3/15/17 | | 825,000 | | 866,250 |
5.875% 3/15/16 | | 6,800,000 | | 7,140,000 |
6.05% 4/15/15 | | 2,887,000 | | 2,951,958 |
7.125% 2/15/18 | | 1,010,000 | | 1,090,800 |
9% 6/1/17 | | 2,430,000 | | 2,751,975 |
Lexington Corporate Properties Trust 4.25% 6/15/23 | | 2,500,000 | | 2,497,455 |
MPT Operating Partnership LP/MPT Finance Corp. 6.375% 2/15/22 | | 1,685,000 | | 1,794,525 |
National Retail Properties, Inc. 6.875% 10/15/17 | | 1,621,000 | | 1,870,939 |
Nationwide Health Properties, Inc. 6% 5/20/15 | | 1,540,000 | | 1,603,231 |
Omega Healthcare Investors, Inc.: | | | | |
4.95% 4/1/24 (f) | | 627,000 | | 644,556 |
7.5% 2/15/20 | | 811,000 | | 862,701 |
Potlatch Corp. 7.5% 11/1/19 | | 811,000 | | 940,760 |
Prologis LP 7.625% 7/1/17 | | 1,268,000 | | 1,415,950 |
Reckson Operating Partnership LP/SL Green Realty Corp./SL Green Operating Partnership LP 7.75% 3/15/20 | | 811,000 | | 968,894 |
Senior Housing Properties Trust: | | | | |
4.75% 5/1/24 | | 849,000 | | 864,950 |
6.75% 4/15/20 | | 576,000 | | 661,030 |
6.75% 12/15/21 | | 2,000,000 | | 2,329,218 |
United Dominion Realty Trust, Inc.: | | | | |
5.25% 1/15/15 | | 405,000 | | 413,370 |
5.25% 1/15/16 | | 811,000 | | 858,964 |
| | 79,125,162 |
Real Estate Management & Development - 2.5% |
Brandywine Operating Partnership LP: | | | | |
6% 4/1/16 | | 811,000 | | 870,553 |
7.5% 5/15/15 | | 405,000 | | 425,237 |
CBRE Group, Inc. 5% 3/15/23 | | 1,225,000 | | 1,218,875 |
Excel Trust LP 4.625% 5/15/24 | | 501,000 | | 510,336 |
Corporate Bonds - continued |
| Principal
Amount | | Value |
Nonconvertible Bonds - continued |
FINANCIALS - continued |
Real Estate Management & Development - continued |
First Industrial LP 5.75% 1/15/16 | | $ 811,000 | | $ 857,922 |
Host Hotels & Resorts LP 6% 10/1/21 | | 485,000 | | 558,294 |
Howard Hughes Corp. 6.875% 10/1/21 (f) | | 1,615,000 | | 1,699,788 |
Hunt Companies, Inc. 9.625% 3/1/21 (f) | | 900,000 | | 945,000 |
Kennedy-Wilson, Inc.: | | | | |
5.875% 4/1/24 | | 560,000 | | 561,400 |
8.75% 4/1/19 | | 3,000,000 | | 3,213,750 |
Mid-America Apartments LP: | | | | |
3.75% 6/15/24 | | 337,000 | | 332,520 |
6.05% 9/1/16 | | 1,216,000 | | 1,325,683 |
Realogy Corp. 7.875% 2/15/19 (f) | | 1,450,000 | | 1,529,750 |
Realogy Group LLC/Realogy Co.-Issuer Corp. 4.5% 4/15/19 (f) | | 1,005,000 | | 974,850 |
Regency Centers LP: | | | | |
5.25% 8/1/15 | | 3,250,000 | | 3,392,906 |
5.875% 6/15/17 | | 486,000 | | 543,450 |
Taylor Morrison Communities, Inc./Monarch Communities, Inc. 5.625% 3/1/24 (f) | | 495,000 | | 485,100 |
Ventas Realty LP/Ventas Capital Corp.: | | | | |
3.125% 11/30/15 | | 552,000 | | 568,614 |
4% 4/30/19 | | 597,000 | | 638,930 |
| | 20,652,958 |
Thrifts & Mortgage Finance - 0.1% |
Ocwen Financial Corp. 6.625% 5/15/19 (f) | | 835,000 | | 853,788 |
TOTAL FINANCIALS | | 106,213,296 |
HEALTH CARE - 1.2% |
Health Care Equipment & Supplies - 0.3% |
Aviv Healthcare Properties LP/Aviv Healthcare Capital Corp.: | | | | |
6% 10/15/21 | | 295,000 | | 309,750 |
7.75% 2/15/19 | | 1,835,000 | | 1,926,750 |
| | 2,236,500 |
Corporate Bonds - continued |
| Principal
Amount | | Value |
Nonconvertible Bonds - continued |
HEALTH CARE - continued |
Health Care Providers & Services - 0.9% |
Sabra Health Care LP/Sabra Capital Corp.: | | | | |
5.375% 6/1/23 | | $ 3,500,000 | | $ 3,491,250 |
5.5% 2/1/21 | | 3,805,000 | | 3,900,125 |
| | 7,391,375 |
TOTAL HEALTH CARE | | 9,627,875 |
INDUSTRIALS - 0.1% |
Industrial Conglomerates - 0.1% |
Ladder Capital Finance Holdings LLLP/Ladder Capital Finance Corp. 7.375% 10/1/17 | | 785,000 | | 837,988 |
MATERIALS - 0.2% |
Paper & Forest Products - 0.2% |
Plum Creek Timberlands LP 5.875% 11/15/15 | | 1,621,000 | | 1,713,467 |
TOTAL NONCONVERTIBLE BONDS | | 173,169,666 |
TOTAL CORPORATE BONDS (Cost $203,921,882) |
215,420,850
|
Asset-Backed Securities - 3.1% |
|
Capital Trust RE CDO Ltd. Series 2005-3A Class A2, 5.16% 6/25/35 (f) | | 7,282 | | 7,137 |
CapitalSource Real Estate Loan Trust Series 2006-1A Class A2A, 0.4836% 1/20/37 (f)(h) | | 75,755 | | 74,240 |
CBRE Realty Finance CDO LLC Series 2007-1A Class A1, 0.4821% 4/7/52 (f)(h) | | 204,500 | | 198,365 |
Conseco Finance Securitizations Corp.: | | | | |
Series 2002-1 Class M2, 9.546% 12/1/33 | | 1,216,000 | | 1,148,078 |
Series 2002-2 Class M2, 9.163% 3/1/33 (h) | | 2,026,000 | | 1,753,360 |
Deutsche Financial Capital Securitization LLC Series 1997-I Class M, 7.275% 9/15/27 | | 1,355,314 | | 1,323,758 |
Lehman ABS Manufactured Housing Contract Trust Series 2001-B Class M2, 7.17% 4/15/40 | | 3,406,440 | | 1,663,608 |
Mesa West Capital CDO Ltd. Series 2007-1A: | | | | |
Class A1, 0.415% 2/25/47 (f)(h) | | 928,412 | | 919,128 |
Class A2, 0.445% 2/25/47 (f)(h) | | 4,000,000 | | 3,890,000 |
Asset-Backed Securities - continued |
| Principal
Amount | | Value |
N-Star Real Estate CDO Ltd. Series 1A Class B1, 1.9044% 8/28/38 (f)(h) | | $ 513,869 | | $ 515,153 |
Residential Asset Securities Corp. Series 2003-KS10 Class MI3, 6.41% 12/25/33 | | 219,321 | | 138,569 |
Wachovia Ltd./Wachovia LLC: | | | | |
Series 2006-1 Class 1ML, 5.7326% 9/25/26 (f)(h) | | 2,432,000 | | 1,702,400 |
Series 2006-1A: | | | | |
Class B, 0.5926% 9/25/26 (f)(h) | | 1,155,844 | | 1,135,039 |
Class C, 0.7626% 9/25/26 (f)(h) | | 3,250,000 | | 3,175,250 |
Class D, 0.8626% 9/25/26 (f)(h) | | 460,000 | | 437,230 |
Class E, 0.9626% 9/25/26 (f)(h) | | 1,220,000 | | 1,150,460 |
Class F, 1.3826% 9/25/26 (f)(h) | | 2,408,000 | | 2,233,420 |
Class G, 1.5826% 9/25/26 (f)(h) | | 1,343,000 | | 1,239,589 |
Class H, 1.8826% 9/25/26 (f)(h) | | 3,486,000 | | 3,208,863 |
TOTAL ASSET-BACKED SECURITIES (Cost $24,611,744) |
25,913,647
|
Collateralized Mortgage Obligations - 0.5% |
|
Private Sponsor - 0.5% |
FREMF Mortgage Trust: | | | | |
Series 2010-K6 Class B, 5.5329% 12/25/46 (f)(h) | | 811,000 | | 896,755 |
Series 2010-K7 Class B, 5.618% 4/25/20 (f)(h) | | 2,605,000 | | 2,909,665 |
Merrill Lynch Mortgage Investors Trust Series 1998-C3 Class F, 6% 12/15/30 (f) | | 158,171 | | 165,553 |
TOTAL COLLATERALIZED MORTGAGE OBLIGATIONS (Cost $3,422,868) |
3,971,973
|
Commercial Mortgage Securities - 19.1% |
|
Aventura Mall Trust Series 2013-AVM Class E, 3.8674% 12/5/32 (f)(h) | | 2,000,000 | | 1,938,687 |
Banc of America Commercial Mortgage Trust Series 2005-1 Class CJ, 5.4665% 11/10/42 (h) | | 1,175,000 | | 1,201,509 |
Banc of America Large Loan, Inc. floater Series 2005-MIB1 Class K, 2.152% 3/15/22 (f)(h) | | 387,059 | | 340,987 |
Banc of America REMIC Trust Series 2012-CLMZ Class A, 7.652% 8/15/17 (f)(h) | | 1,010,000 | | 1,011,717 |
Bear Stearns Commercial Mortgage Securities, Inc. Series 2006-PW11 Class AJ, 5.6047% 3/11/39 (h) | | 2,432,000 | | 2,507,699 |
Boca Hotel Portfolio Trust Series 2013-BOCA Class E, 3.902% 8/15/26 (f)(h) | | 1,500,000 | | 1,501,746 |
Commercial Mortgage Securities - continued |
| Principal
Amount | | Value |
CGBAM Commercial Mortgage Trust Series 2013-D Class D, 3.002% 5/15/30 (f)(h) | | $ 2,250,000 | | $ 2,261,628 |
Chase Commercial Mortgage Securities Corp. Series 1998-1 Class H, 6.34% 5/18/30 (f) | | 1,621,000 | | 1,728,138 |
Citigroup Commercial Mortgage Trust Series 2013-GC15 Class D, 5.277% 9/10/46 (f)(h) | | 2,000,000 | | 1,990,044 |
COMM Mortgage Trust: | | | | |
Series 2013-CR10 Class D, 4.958% 8/10/46 (f)(h) | | 1,300,000 | | 1,271,813 |
Series 2013-CR12 Class D, 5.2553% 10/10/46 (f)(h) | | 1,900,000 | | 1,869,845 |
Series 2013-CR9 Class D, 4.4022% 7/10/45 (f)(h) | | 2,397,000 | | 2,248,652 |
Series 2013-LC6 Class D, 4.4319% 1/10/46 (f)(h) | | 1,912,000 | | 1,816,733 |
Series 2014-UBS2 Class D, 5.1831% 3/10/47 (f)(h) | | 537,000 | | 514,733 |
COMM Mortgage Trust pass-thru certificates Series 2005-LP5 Class F, 5.4583% 5/10/43 (f)(h) | | 2,000,000 | | 2,057,232 |
Commercial Mortgage Acceptance Corp. Series 1998-C2 Class J, 5.44% 9/15/30 (f) | | 1,764,106 | | 1,705,954 |
Commercial Mortgage Trust pass-thru certificates: | | | | |
Series 2005-C6 Class AJ, 5.209% 6/10/44 (h) | | 2,000,000 | | 2,070,378 |
Series 2012-CR1: | | | | |
Class C, 5.5464% 5/15/45 (h) | | 3,000,000 | | 3,317,613 |
Class D, 5.5464% 5/15/45 (f)(h) | | 1,350,000 | | 1,380,740 |
Series 2012-CR2 Class D, 5.0196% 8/15/45 (f)(h) | | 500,000 | | 518,911 |
Series 2012-LC4: | | | | |
Class C, 5.8228% 12/10/44 (h) | | 780,000 | | 871,914 |
Class D, 5.8228% 12/10/44 (f)(h) | | 2,830,000 | | 2,975,043 |
Credit Suisse First Boston Mortgage Securities Corp. Series 1998-C2 Class F, 6.75% 11/15/30 (f) | | 581,006 | | 601,183 |
DBUBS Mortgage Trust Series 2011-LC1A: | | | | |
Class E, 5.7302% 11/10/46 (f)(h) | | 2,450,000 | | 2,636,205 |
Class G, 4.652% 11/10/46 (f) | | 2,157,000 | | 1,852,788 |
Deutsche Mortgage & Asset Receiving Corp. Series 1998-C1 Class J, 6.22% 6/15/31 | | 83,422 | | 83,338 |
Extended Stay America Trust Series 2013-ESH7 Class C7, 3.9017% 12/5/31 (f) | | 2,000,000 | | 2,043,656 |
Freddie Mac pass-thru certificates: | | | | |
Series K011 Class X3, 2.6622% 12/25/43 (h)(i) | | 4,947,000 | | 703,414 |
Series K012 Class X3, 2.366% 1/25/41 (h)(i) | | 2,846,999 | | 362,588 |
Series K013 Class X3, 2.8852% 1/25/43 (h)(i) | | 4,806,000 | | 753,350 |
G-Force LLC sequential payer Series 2005-RRA Class A2, 4.83% 8/22/36 (f) | | 5,100 | | 5,100 |
GCCFC Commercial Mortgage Trust Series 2005-GG3 Class B, 4.894% 8/10/42 (h) | | 885,000 | | 897,694 |
GMAC Commercial Mortgage Securities, Inc.: | | | | |
Series 1997-C2 Class G, 6.75% 4/15/29 (h) | | 628,000 | | 680,576 |
Commercial Mortgage Securities - continued |
| Principal
Amount | | Value |
GMAC Commercial Mortgage Securities, Inc.: - continued | | | | |
Series 2000-C1 Class K, 7% 3/15/33 | | $ 11,872 | | $ 12,003 |
GP Portfolio Trust Series 2014-GPP Class E, 4.002% 2/15/27 (f)(h) | | 615,000 | | 615,646 |
GS Mortgage Securities Trust: | | | | |
Series 2010-C2 Class D, 5.3978% 12/10/43 (f)(h) | | 2,000,000 | | 2,088,320 |
Series 2012-GC6 Class C, 5.8259% 1/10/45 (f)(h) | | 2,400,000 | | 2,686,335 |
Series 2012-GCJ7: | | | | |
Class C, 5.9067% 5/10/45 (h) | | 3,500,000 | | 3,912,736 |
Class D, 5.9067% 5/10/45 (f)(h) | | 2,500,000 | | 2,644,356 |
Class E, 5% 5/10/45 (f) | | 1,760,000 | | 1,613,591 |
Series 2013-GC16 Class D, 5.323% 11/10/46 (f)(h) | | 3,000,000 | | 3,042,552 |
Hilton U.S.A. Trust Series 2013-HLT Class EFX, 5.6086% 11/5/30 (f)(h) | | 4,250,000 | | 4,373,360 |
Invitation Homes Trust floater Series 2013-SFR1: | | | | |
Class E, 2.9% 12/17/30 (f)(h) | | 1,500,000 | | 1,470,293 |
Class F, 3.9% 12/17/30 (f)(h) | | 1,750,000 | | 1,730,195 |
JPMorgan Chase Commercial Mortgage Securities Corp.: | | | | |
Series 2003-C1 Class F, 6.1573% 1/12/37 (f)(h) | | 756,000 | | 762,962 |
Series 2009-IWST Class D, 7.6935% 12/5/27 (f)(h) | | 2,779,000 | | 3,389,616 |
Series 2010-CNTM Class MZ, 8.5% 8/5/20 (f) | | 2,620,000 | | 2,733,487 |
Series 2010-CNTR Class D, 6.3899% 8/5/32 (f)(h) | | 1,216,000 | | 1,379,283 |
Series 2012-CBX Class C, 5.358% 6/15/45 (h) | | 1,240,000 | | 1,354,146 |
JPMorgan Chase Commercial Mortgage Securities Trust: | | | | |
floater: | | | | |
Series 2013-JWRZ Class E, 3.892% 4/15/30 (f)(h) | | 1,280,000 | | 1,277,589 |
Series 2014-FBLU Class E, 3.6518% 12/15/28 (f)(h) | | 2,000,000 | | 2,000,802 |
Series 2014-INN: | | | | |
Class E, 3.751% 6/15/29 (f)(h) | | 662,000 | | 662,408 |
Class F, 4.152% 6/15/29 (f)(h) | | 662,000 | | 662,620 |
Series 2005-LDP2 Class C, 4.911% 7/15/42 (h) | | 4,000,000 | | 4,038,004 |
Series 2011-C4 Class E, 5.5765% 7/15/46 (f)(h) | | 1,390,000 | | 1,504,726 |
LB Commercial Conduit Mortgage Trust Series 1998-C4 Class G, 5.6% 10/15/35 (f) | | 34,540 | | 34,610 |
LB-UBS Commercial Mortgage Trust: | | | | |
sequential payer: | | | | |
Series 2005-C3 Class AJ, 4.843% 7/15/40 | | 4,760,000 | | 4,874,997 |
Series 2005-C7 Class AJ, 5.323% 11/15/40 (h) | | 1,240,000 | | 1,294,150 |
Series 2005-C1 Class E, 4.924% 2/15/40 | | 1,000,000 | | 1,008,275 |
Series 2006-C4 Class AJ, 6.0494% 6/15/38 (h) | | 2,511,000 | | 2,663,536 |
Commercial Mortgage Securities - continued |
| Principal
Amount | | Value |
LSTAR Commercial Mortgage Trust Series 2011-1: | | | | |
Class B, 5.3288% 6/25/43 (f)(h) | | $ 1,091,789 | | $ 1,094,183 |
Class D, 5.3288% 6/25/43 (f)(h) | | 1,564,000 | | 1,579,466 |
Mach One Trust LLC Series 2004-1A Class H, 6.2679% 5/28/40 (f)(h) | | 540,000 | | 554,850 |
Mezz Capital Commercial Mortgage Trust sequential payer Series 2004-C2 Class A, 5.318% 10/15/40 (f) | | 1,243,336 | | 1,243,336 |
Morgan Stanley BAML Trust: | | | | |
Series 2012-C6 Class D, 4.8181% 11/15/45 (f)(h) | | 2,000,000 | | 2,041,958 |
Series 2013-C12 Class D, 4.935% 10/15/46 (f) | | 1,500,000 | | 1,457,870 |
Series 2013-C13 Class D, 5.0592% 11/15/46 (f)(h) | | 2,500,000 | | 2,441,438 |
Series 2013-C7 Class E, 4.4423% 2/15/46 (f)(h) | | 1,490,000 | | 1,303,187 |
Morgan Stanley Capital I Trust: | | | | |
sequential payer: | | | | |
Series 2006-HQ10 Class AM, 5.36% 11/12/41 | | 3,769,000 | | 4,075,401 |
Series 2012-C4 Class E, 5.7094% 3/15/45 (f)(h) | | 2,250,000 | | 2,314,595 |
Series 1997-RR Class F, 7.4306% 4/30/39 (f)(h) | | 185,103 | | 195,746 |
Series 1998-CF1 Class G, 7.35% 7/15/32 (f) | | 1,799,392 | | 1,463,728 |
Series 2006-IQ12 Class AMFX, 5.37% 12/15/43 | | 3,242,000 | | 3,497,181 |
Series 2011-C1 Class C, 5.4187% 9/15/47 (f)(h) | | 2,000,000 | | 2,213,685 |
Series 2011-C2: | | | | |
Class D, 5.4817% 6/15/44 (f)(h) | | 1,532,000 | | 1,658,434 |
Class E, 5.4817% 6/15/44 (f)(h) | | 1,946,000 | | 2,047,626 |
Class F, 5.4817% 6/15/44 (f)(h) | | 1,467,000 | | 1,393,085 |
Class XB, 0.534% 6/15/44 (f)(h)(i) | | 51,641,000 | | 1,451,783 |
Series 2011-C3 Class C, 5.3556% 7/15/49 (f)(h) | | 2,000,000 | | 2,184,086 |
Series 2012-C4 Class D, 5.7094% 3/15/45 (f)(h) | | 1,640,000 | | 1,766,651 |
Providence Place Group Ltd. Partnership Series 2000-C1 Class A2, 7.75% 7/20/28 (f) | | 1,164,600 | | 1,496,277 |
RBSCF Trust Series 2010-MB1 Class D, 4.9832% 4/15/24 (f)(h) | | 2,687,000 | | 2,733,547 |
SCG Trust Series 2013-SRP1 Class D, 3.4955% 11/15/26 (f)(h) | | 1,000,000 | | 972,044 |
TimberStar Trust I Series 2006-1 Class F, 7.5296% 10/15/36 (f) | | 2,026,000 | | 2,144,762 |
UBS Commercial Mortgage Trust Series 2007-FL1 Class F, 0.727% 7/15/24 (f)(h) | | 1,459,000 | | 1,457,830 |
UBS-BAMLL Trust Series 12-WRM Class D, 4.3793% 6/10/30 (f)(h) | | 1,460,000 | | 1,410,678 |
Wachovia Bank Commercial Mortgage Trust: | | | | |
Series 2004-C10 Class E, 4.931% 2/15/41 | | 1,391,149 | | 1,392,278 |
Series 2004-C12 Class D, 5.6311% 7/15/41 (h) | | 905,289 | | 907,504 |
Commercial Mortgage Securities - continued |
| Principal
Amount | | Value |
WF-RBS Commercial Mortgage Trust: | | | | |
Series 2011-C3: | | | | |
Class C, 5.335% 3/15/44 (f) | | $ 2,100,000 | | $ 2,303,259 |
Class D, 5.723% 3/15/44 (f)(h) | | 1,000,000 | | 1,060,813 |
Series 2011-C5: | | | | |
Class C, 5.823% 11/15/44 (f)(h) | | 1,250,000 | | 1,399,994 |
Class F, 5.25% 11/15/44 (f)(h) | | 2,000,000 | | 1,861,352 |
Series 2012-C10 Class E, 4.6077% 12/15/45 (f)(h) | | 910,000 | | 788,975 |
Series 2012-C7 Class D, 5.0019% 6/15/45 (f)(h) | | 620,000 | | 645,511 |
TOTAL COMMERCIAL MORTGAGE SECURITIES (Cost $141,069,441) |
158,105,319
|
Bank Loan Obligations - 6.6% |
|
CONSUMER DISCRETIONARY - 2.3% |
Hotels, Restaurants & Leisure - 1.9% |
BRE Select Hotels Corp. 5.892% 5/9/18 (h) | | 2,236,155 | | 2,236,155 |
Caesars Entertainment Resort Properties LLC Tranche B 1LN, term loan 7% 10/11/20 (h) | | 3,233,750 | | 3,225,666 |
Caesars Growth Properties Holdings, LLC Tranche 1LN, term loan 6.25% 5/8/21 (h) | | 1,555,000 | | 1,555,000 |
CityCenter Holdings LLC Tranche B, term loan 4.25% 10/16/20 (h) | | 350,067 | | 349,192 |
Cooper Hotel Group 12% 11/6/17 | | 2,323,517 | | 2,439,693 |
Four Seasons Holdings, Inc. Tranche 2LN, term loan 6.25% 12/27/20 (h) | | 100,000 | | 100,500 |
Hilton Worldwide Finance, LLC Tranche B, term loan 3.5% 10/25/20 (h) | | 4,321,579 | | 4,299,971 |
La Quinta Intermediate Holdings LLC Tranche B LN, Tranche B, term loan 4% 4/14/21 (h) | | 1,370,714 | | 1,357,007 |
| | 15,563,184 |
Media - 0.2% |
CBS Outdoor Americas Capital LLC/CBS Outdoor Americas Capital Corp. Tranche B, term loan 3% 1/31/21 (h) | | 1,705,000 | | 1,692,213 |
Multiline Retail - 0.1% |
JC Penney Corp., Inc. Tranche B, term loan 6% 5/22/18 (h) | | 623,700 | | 629,382 |
Bank Loan Obligations - continued |
| Principal
Amount | | Value |
CONSUMER DISCRETIONARY - continued |
Specialty Retail - 0.1% |
The Pep Boys - Manny, Moe & Jack Tranche B, term loan 4.25% 10/11/18 (h) | | $ 1,339,600 | | $ 1,341,275 |
TOTAL CONSUMER DISCRETIONARY | | 19,226,054 |
FINANCIALS - 2.0% |
Diversified Financial Services - 1.1% |
Blackstone 9.98% 10/1/17 | | 7,372,895 | | 7,520,353 |
Calpine Construction Finance Co. LP Tranche B 2LN, term loan 3.25% 1/31/22 (h) | | 994,990 | | 978,204 |
Pilot Travel Centers LLC Tranche B 2LN, term loan 4.25% 8/7/19 (h) | | 654,039 | | 656,525 |
| | 9,155,082 |
Real Estate Investment Trusts - 0.3% |
Starwood Property Trust, Inc. Tranche B, term loan 3.5% 4/17/20 (h) | | 2,474,937 | | 2,465,656 |
Real Estate Management & Development - 0.6% |
CBRE Group, Inc. Tranche B, term loan 2.9015% 3/28/21 (h) | | 878,875 | | 874,481 |
Realogy Corp. Credit-Linked Deposit 4.4463% 10/10/16 (h) | | 117,069 | | 116,923 |
Realogy Group LLC Tranche B, term loan 3.75% 3/5/20 (h) | | 4,129,902 | | 4,088,603 |
| | 5,080,007 |
Thrifts & Mortgage Finance - 0.0% |
Ocwen Loan Servicing, LLC Tranche B, term loan 5% 2/15/18 (h) | | 212,313 | | 212,313 |
TOTAL FINANCIALS | | 16,913,058 |
HEALTH CARE - 0.5% |
Health Care Providers & Services - 0.5% |
Community Health Systems, Inc.: | | | | |
Tranche D, term loan 4.25% 1/27/21 (h) | | 284,354 | | 285,065 |
Tranche E, term loan 3.4776% 1/25/17 (h) | | 106,686 | | 106,820 |
ESH Hospitality, Inc. Tranche B, term loan 5% 6/24/19 (h) | | 1,500,000 | | 1,516,875 |
Skilled Healthcare Group, Inc. term loan 7% 4/9/16 (h) | | 2,193,924 | | 2,188,439 |
| | 4,097,199 |
Bank Loan Obligations - continued |
| Principal
Amount | | Value |
INDUSTRIALS - 0.4% |
Construction & Engineering - 0.4% |
Drumm Investors LLC Tranche B, term loan 6.75% 5/4/18 (h) | | $ 3,146,654 | | $ 3,142,721 |
TELECOMMUNICATION SERVICES - 0.6% |
Wireless Telecommunication Services - 0.6% |
Crown Castle Operating Co.: | | | | |
Tranche A, term loan 1.905% 1/31/19 (h) | | 811,417 | | 805,332 |
Tranche B 2LN, term loan 3% 1/31/21 (h) | | 1,956,322 | | 1,956,322 |
SBA Senior Finance II, LLC term loan 3.25% 3/24/21 (h) | | 1,935,000 | | 1,910,813 |
| | 4,672,467 |
UTILITIES - 0.8% |
Electric Utilities - 0.5% |
EquiPower Resources Holdings LLC Tranche C, term loan 4.25% 12/31/19 (h) | | 1,027,222 | | 1,029,790 |
Essential Power LLC Tranche B, term loan 4.75% 8/8/19 (h) | | 994,815 | | 999,789 |
La Frontera Generation, LLC Tranche B, term loan 4.5% 9/30/20 (h) | | 1,858,261 | | 1,865,322 |
| | 3,894,901 |
Independent Power Producers & Energy Traders - 0.3% |
Calpine Corp. Tranche B 4LN, term loan 4% 10/31/20 (h) | | 1,990,000 | | 1,990,000 |
Tempus Public Foundation Generation Holdings LLC Tranche B, term loan 4.75% 12/31/17 (h) | | 994,975 | | 957,663 |
| | 2,947,663 |
TOTAL UTILITIES | | 6,842,564 |
TOTAL BANK LOAN OBLIGATIONS (Cost $54,506,895) |
54,894,063
|
Money Market Funds - 5.8% |
| Shares | | Value |
Fidelity Cash Central Fund, 0.11% (b) | 47,004,602 | | $ 47,004,602 |
Fidelity Securities Lending Cash Central Fund, 0.11% (b)(c) | 850,050 | | 850,050 |
TOTAL MONEY MARKET FUNDS (Cost $47,854,652) |
47,854,652
|
TOTAL INVESTMENT PORTFOLIO - 99.8% (Cost $765,331,289) | | 827,373,972 |
NET OTHER ASSETS (LIABILITIES) - 0.2% | | 1,621,841 |
NET ASSETS - 100% | $ 828,995,813 |
Legend |
(a) Non-income producing |
(b) Affiliated fund that is generally available only to investment companies and other accounts managed by Fidelity Investments. The rate quoted is the annualized seven-day yield of the fund at period end. A complete unaudited listing of the fund's holdings as of its most recent quarter end is available upon request. In addition, each Fidelity Central Fund's financial statements, which are not covered by the Fund's Report of Independent Registered Public Accounting Firm, are available on the SEC's website or upon request. |
(c) Investment made with cash collateral received from securities on loan. |
(d) Non-income producing - Security is in default. |
(e) Security or a portion of the security is on loan at period end. |
(f) Security exempt from registration under Rule 144A of the Securities Act of 1933. These securities may be resold in transactions exempt from registration, normally to qualified institutional buyers. At the end of the period, the value of these securities amounted to $170,708,423 or 20.6% of net assets. |
(g) Security or a portion of the security purchased on a delayed delivery or when-issued basis. |
(h) Coupon rates for floating and adjustable rate securities reflect the rates in effect at period end. |
(i) Security represents right to receive monthly interest payments on an underlying pool of mortgages or assets. Principal shown is the outstanding par amount of the pool as of the end of the period. |
Affiliated Central Funds |
Information regarding fiscal year to date income earned by the Fund from investments in Fidelity Central Funds is as follows: |
Fund | Income earned |
Fidelity Cash Central Fund | $ 42,226 |
Fidelity Securities Lending Cash Central Fund | 5,479 |
Total | $ 47,705 |
Other Information |
The following is a summary of the inputs used, as of July 31, 2014, involving the Fund's assets and liabilities carried at fair value. The inputs or methodology used for valuing securities may not be an indication of the risk associated with investing in those securities. For more information on valuation inputs, and their aggregation into the levels used in the tables below, please refer to the Investment Valuation section in the accompanying Notes to Financial Statements. |
Valuation Inputs at Reporting Date: |
Description | Total | Level 1 | Level 2 | Level 3 |
Investments in Securities: | | | | |
Equities: | | | | |
Consumer Discretionary | $ 2,558,857 | $ 2,558,857 | $ - | $ - |
Financials | 318,025,963 | 313,685,377 | 4,340,586 | - |
Materials | 628,648 | 628,648 | - | - |
Corporate Bonds | 215,420,850 | - | 215,420,850 | - |
Asset-Backed Securities | 25,913,647 | - | 25,913,647 | - |
Collateralized Mortgage Obligations | 3,971,973 | - | 3,971,973 | - |
Commercial Mortgage Securities | 158,105,319 | - | 155,398,255 | 2,707,064 |
Bank Loan Obligations | 54,894,063 | - | 42,597,362 | 12,296,701 |
Money Market Funds | 47,854,652 | 47,854,652 | - | - |
Total Investments in Securities: | $ 827,373,972 | $ 364,727,534 | $ 447,642,673 | $ 15,003,765 |
Valuation Inputs at Reporting Date: |
The following is a reconciliation of Investments in Securities for which Level 3 inputs were used in determining value: |
Investments in Securities
Other Investments in Securities: | |
Beginning Balance | $ 9,851,266 |
Net Realized Gain (Loss) on Investment Securities | 115,822 |
Net Unrealized Gain (Loss) on Investment Securities | (111,657) |
Cost of Purchases | 5 |
Proceeds of Sales | (3,332,373) |
Amortization/Accretion | 427,960 |
Transfers into Level 3 | - |
Transfers out of Level 3 | (4,243,959) |
Ending Balance | $ 2,707,064 |
The change in unrealized gain (loss) for the period attributable to Level 3 securities held at July 31, 2014 | $ 46,742 |
Bank Loan Obligations | |
Beginning Balance | $ 18,529,024 |
Net Realized Gain (Loss) on Investment Securities | 34,993 |
Net Unrealized Gain (Loss) on Investment Securities | (124,006) |
Cost of Purchases | - |
Proceeds of Sales | (6,227,608) |
Amortization/Accretion | (17,702) |
Transfers into Level 3 | 102,000 |
Transfers out of Level 3 | - |
Ending Balance | $ 12,296,701 |
The change in unrealized gain (loss) for the period attributable to Level 3 securities held at July 31, 2014 | $ (212,435) |
The information used in the above reconciliations represents fiscal year to date activity for any Investments in Securities identified as using Level 3 inputs at either the beginning or the end of the current fiscal period. Transfers in or out of Level 3 represent the beginning value of any Security or Instrument where a change in the pricing level occurred from the beginning to the end of the period. The cost of purchases and the proceeds of sales may include securities received or delivered through corporate actions or exchanges. Realized and unrealized gains (losses) disclosed in the reconciliations are included in Net Gain (Loss) on the Fund's Statement of Operations. |
Other Information |
The composition of credit quality ratings as a percentage of net assets is as follows (Unaudited): |
U.S. Government and U.S. Government Agency Obligations | 0.7% |
AAA,AA,A | 5.9% |
BBB | 15.1% |
BB | 10.9% |
B | 12.3% |
CCC,CC,C | 1.2% |
Not Rated | 9.2% |
Equities | 38.7% |
Short-Term Investments and Net Other Assets | 6.0% |
| 100.0% |
We have used ratings from Moody's Investors Service, Inc. Where Moody's® ratings are not available, we have used S&P® ratings. All ratings are as of the date indicated and do not reflect subsequent changes. |
See accompanying notes which are an integral part of the financial statements.
Annual Report
Statement of Assets and Liabilities
| July 31, 2014 |
| | |
Assets | | |
Investment in securities, at value (including securities loaned of $820,097) - See accompanying schedule: Unaffiliated issuers (cost $717,476,637) | $ 779,519,320 | |
Fidelity Central Funds (cost $47,854,652) | 47,854,652 | |
Total Investments (cost $765,331,289) | | $ 827,373,972 |
Cash | | 45,420 |
Receivable for investments sold | | 858,634 |
Receivable for fund shares sold | | 60,669 |
Dividends receivable | | 284,396 |
Interest receivable | | 4,624,621 |
Distributions receivable from Fidelity Central Funds | | 4,168 |
Other receivables | | 1,803 |
Total assets | | 833,253,683 |
| | |
Liabilities | | |
Payable for investments purchased
Regular delivery | $ 1,660,065 | |
Delayed delivery | 495,000 | |
Payable for fund shares redeemed | 709,446 | |
Accrued management fee | 381,236 | |
Other affiliated payables | 86,792 | |
Other payables and accrued expenses | 75,281 | |
Collateral on securities loaned, at value | 850,050 | |
Total liabilities | | 4,257,870 |
| | |
Net Assets | | $ 828,995,813 |
Net Assets consist of: | | |
Paid in capital | | $ 739,259,804 |
Undistributed net investment income | | 9,105,015 |
Accumulated undistributed net realized gain (loss) on investments and foreign currency transactions | | 18,588,316 |
Net unrealized appreciation (depreciation) on investments and assets and liabilities in foreign currencies | | 62,042,678 |
Net Assets | | $ 828,995,813 |
See accompanying notes which are an integral part of the financial statements.
Annual Report
Financial Statements - continued
Statement of Assets and Liabilities - continued
| July 31, 2014 |
| | |
Series Real Estate Income:
Net Asset Value, offering price and redemption price per share ($409,084,491 ÷ 35,650,440 shares) | | $ 11.47 |
| | |
Class F:
Net Asset Value, offering price and redemption price per share ($419,911,322 ÷ 36,584,824 shares) | | $ 11.48 |
See accompanying notes which are an integral part of the financial statements.
Annual Report
Statement of Operations
| Year ended July 31, 2014 |
| | |
Investment Income | | |
Dividends | | $ 15,550,027 |
Interest | | 32,681,195 |
Income from Fidelity Central Funds | | 47,705 |
Total income | | 48,278,927 |
| | |
Expenses | | |
Management fee | $ 4,488,540 | |
Transfer agent fees | 678,285 | |
Accounting and security lending fees | 357,525 | |
Custodian fees and expenses | 19,183 | |
Independent trustees' compensation | 3,350 | |
Audit | 86,216 | |
Legal | 2,562 | |
Miscellaneous | 6,856 | |
Total expenses before reductions | 5,642,517 | |
Expense reductions | (6,556) | 5,635,961 |
Net investment income (loss) | | 42,642,966 |
Realized and Unrealized Gain (Loss) Net realized gain (loss) on: | | |
Investment securities: | | |
Unaffiliated issuers | 24,118,639 | |
Foreign currency transactions | (615) | |
Total net realized gain (loss) | | 24,118,024 |
Change in net unrealized appreciation (depreciation) on: Investment securities | (161,301) | |
Assets and liabilities in foreign currencies | (5) | |
Total change in net unrealized appreciation (depreciation) | | (161,306) |
Net gain (loss) | | 23,956,718 |
Net increase (decrease) in net assets resulting from operations | | $ 66,599,684 |
See accompanying notes which are an integral part of the financial statements.
Annual Report
Financial Statements - continued
Statement of Changes in Net Assets
| Year ended
July 31,
2014 | Year ended
July 31,
2013 |
Increase (Decrease) in Net Assets | | |
Operations | | |
Net investment income (loss) | $ 42,642,966 | $ 45,904,082 |
Net realized gain (loss) | 24,118,024 | 16,876,013 |
Change in net unrealized appreciation (depreciation) | (161,306) | 12,483,054 |
Net increase (decrease) in net assets resulting
from operations | 66,599,684 | 75,263,149 |
Distributions to shareholders from net investment income | (42,834,154) | (44,907,661) |
Distributions to shareholders from net realized gain | (17,262,908) | (10,435,441) |
Total distributions | (60,097,062) | (55,343,102) |
Share transactions - net increase (decrease) | 15,810,740 | 83,757,064 |
Total increase (decrease) in net assets | 22,313,362 | 103,677,111 |
| | |
Net Assets | | |
Beginning of period | 806,682,451 | 703,005,340 |
End of period (including undistributed net investment income of $9,105,015 and undistributed net investment income of $9,002,217, respectively) | $ 828,995,813 | $ 806,682,451 |
See accompanying notes which are an integral part of the financial statements.
Annual Report
Financial Highlights - Series Real Estate Income
Years ended July 31, | 2014 | 2013 | 2012G |
Selected Per-Share Data | | | |
Net asset value, beginning of period | $ 11.41 | $ 11.10 | $ 10.00 |
Income from Investment Operations | | | |
Net investment income (loss) D | .58 | .67 | .47 |
Net realized and unrealized gain (loss) | .31 | .46 | .97 |
Total from investment operations | .89 | 1.13 | 1.44 |
Distributions from net investment income | (.59) | (.66) | (.33) |
Distributions from net realized gain | (.24) | (.16) | (.01) |
Total distributions | (.83) | (.82) | (.34) |
Net asset value, end of period | $ 11.47 | $ 11.41 | $ 11.10 |
Total ReturnB, C | 8.33% | 10.50% | 14.67% |
Ratios to Average Net Assets E, H | | | |
Expenses before reductions | .77% | .79% | .80%A |
Expenses net of fee waivers, if any | .77% | .79% | .80%A |
Expenses net of all reductions | .77% | .79% | .80%A |
Net investment income (loss) | 5.15% | 5.85% | 5.70%A |
Supplemental Data | | | |
Net assets, end of period (000 omitted) | $ 409,084 | $ 415,192 | $ 416,151 |
Portfolio turnover rateF | 33% | 25% | 29% A |
A Annualized
B Total returns for periods of less than one year are not annualized.
C Total returns would have been lower if certain expenses had not been reduced during the applicable periods shown.
D Calculated based on average shares outstanding during the period.
E Fees and expenses of any underlying Fidelity Central Funds are not included in the Fund's expense ratio. The Fund indirectly bears its proportionate share of the expenses of any underlying Fidelity Central Funds.
F Amount does not include the portfolio activity of any underlying Fidelity Central Funds.
G For the period October 20, 2011 (commencement of operations) to July 31, 2012.
H Expense ratios reflect operating expenses of the class. Expenses before reductions do not reflect amounts reimbursed by the investment adviser or reductions from brokerage service arrangements or reductions from other expense offset arrangements and do not represent the amount paid by the class during periods when reimbursements or reductions occur. Expense ratios before reductions for start-up periods may not be representative of longer term operating periods. Expenses net of fee waivers reflect expenses after reimbursement by the investment adviser but prior to reductions from brokerage service arrangements or other expense offset arrangements. Expenses net of all reductions represent the net expenses paid by the class.
See accompanying notes which are an integral part of the financial statements.
Annual Report
Financial Highlights - Class F
Years ended July 31, | 2014 | 2013 | 2012G |
Selected Per-Share Data | | | |
Net asset value, beginning of period | $ 11.41 | $ 11.11 | $ 10.00 |
Income from Investment Operations | | | |
Net investment income (loss) D | .60 | .69 | .48 |
Net realized and unrealized gain (loss) | .32 | .45 | .98 |
Total from investment operations | .92 | 1.14 | 1.46 |
Distributions from net investment income | (.60) | (.68) | (.34) |
Distributions from net realized gain | (.24) | (.16) | (.01) |
Total distributions | (.85)I | (.84) | (.35) |
Net asset value, end of period | $ 11.48 | $ 11.41 | $ 11.11 |
Total ReturnB, C | 8.60% | 10.60% | 14.89% |
Ratios to Average Net Assets E, H | | | |
Expenses before reductions | .61% | .61% | .62%A |
Expenses net of fee waivers, if any | .61% | .61% | .62%A |
Expenses net of all reductions | .61% | .61% | .62%A |
Net investment income (loss) | 5.32% | 6.02% | 5.88%A |
Supplemental Data | | | |
Net assets, end of period (000 omitted) | $ 419,911 | $ 391,490 | $ 286,854 |
Portfolio turnover rateF | 33% | 25% | 29% A |
A Annualized
B Total returns for periods of less than one year are not annualized.
C Total returns would have been lower if certain expenses had not been reduced during the applicable periods shown.
D Calculated based on average shares outstanding during the period.
E Fees and expenses of any underlying Fidelity Central Funds are not included in the Fund's expense ratio. The Fund indirectly bears its proportionate share of the expenses of any underlying Fidelity Central Funds.
F Amount does not include the portfolio activity of any underlying Fidelity Central Funds.
G For the period October 20, 2011 (commencement of operations) to July 31, 2012.
H Expense ratios reflect operating expenses of the class. Expenses before reductions do not reflect amounts reimbursed by the investment adviser or reductions from brokerage service arrangements or reductions from other expense offset arrangements and do not represent the amount paid by the class during periods when reimbursements or reductions occur. Expense ratios before reductions for start-up periods may not be representative of longer term operating periods. Expenses net of fee waivers reflect expenses after reimbursement by the investment adviser but prior to reductions from brokerage service arrangements or other expense offset arrangements. Expenses net of all reductions represent the net expenses paid by the class.
I Total distributions of $.85 per share is comprised of distributions from net investment income of $.604 and distributions from net realized gain of $.242 per share.
See accompanying notes which are an integral part of the financial statements.
Annual Report
Notes to Financial Statements
For the period ended July 31, 2014
1. Organization.
Fidelity Series Real Estate Income Fund (the Fund) is a fund of Fidelity Securities Fund (the Trust) and is authorized to issue an unlimited number of shares. Shares of the Fund are only available for purchase by mutual funds for which Fidelity Management & Research Company (FMR) or an affiliate serves as an investment manager. The Trust is registered under the Investment Company Act of 1940, as amended (the 1940 Act), as an open-end management investment company organized as a Massachusetts business trust. The Fund offers Series Real Estate Income and Class F shares, each of which has equal rights as to assets and voting privileges. Each class has exclusive voting rights with respect to matters that affect that class.
2. Investments in Fidelity Central Funds.
The Fund invests in Fidelity Central Funds, which are open-end investment companies generally available only to other investment companies and accounts managed by the investment adviser and its affiliates. The Fund's Schedule of Investments lists each of the Fidelity Central Funds held as of period end, if any, as an investment of the Fund, but does not include the underlying holdings of each Fidelity Central Fund. As an Investing Fund, the Fund indirectly bears its proportionate share of the expenses of the underlying Fidelity Central Funds.
The Money Market Central Funds seek preservation of capital and current income and are managed by Fidelity Investments Money Management, Inc. (FIMM), an affiliate of the investment adviser. Annualized expenses of the Money Market Central Funds as of their most recent shareholder report date are less than .01%.
A complete unaudited list of holdings for each Fidelity Central Fund is available upon request or at the Securities and Exchange Commission (the SEC) website at www.sec.gov. In addition, the financial statements of the Fidelity Central Funds, which are not covered by the Fund's Report of Independent Registered Public Accounting Firm, are available on the SEC website or upon request.
3. Significant Accounting Policies.
The financial statements have been prepared in conformity with accounting principles generally accepted in the United States of America (GAAP), which require management to make certain estimates and assumptions at the date of the financial statements. Actual results could differ from those estimates. Subsequent events, if any, through the date that the financial statements were issued have been evaluated in the preparation of
Annual Report
3. Significant Accounting Policies - continued
the financial statements. The following summarizes the significant accounting policies of the Fund:
Investment Valuation. Investments are valued as of 4:00 p.m. Eastern time on the last calendar day of the period. In accordance with valuation policies and procedures approved by the Board of Trustees (the Board), the Fund attempts to obtain prices from one or more third party pricing vendors or brokers to value its investments. When current market prices, quotations or currency exchange rates are not readily available or reliable, investments will be fair valued in good faith by the Fair Value Committee (the Committee), in accordance with procedures adopted by the Board. Factors used in determining fair value vary by investment type and may include market or investment specific events changes in interest rates and credit quality. The frequency with which these procedures are used cannot be predicted and they may be utilized to a significant extent. The Committee oversees the Fund's valuation policies and procedures and is responsible for approving and reporting to the Board all fair value determinations.
The Fund categorizes the inputs to valuation techniques used to value its investments into a disclosure hierarchy consisting of three levels as shown below:
Level 1 - quoted prices in active markets for identical investments
Level 2 - other significant observable inputs (including quoted prices for similar investments, interest rates, prepayment speeds, etc.)
Level 3 - unobservable inputs (including the Fund's own assumptions based on the best information available)
Valuation techniques used to value the Fund's investments by major category are as follows:
Equity securities, including restricted securities, for which market quotations are readily available, are valued at the last reported sale price or official closing price as reported by a third party pricing vendor on the primary market or exchange on which they are traded and are categorized as Level 1 in the hierarchy. In the event there were no sales during the day or closing prices are not available, securities are valued at the last quoted bid price or may be valued using the last available price and are generally categorized as Level 2 in the hierarchy. For foreign equity securities, when market or security specific events arise, comparisons to the valuation of American Depositary Receipts (ADRs), futures contracts, Exchange-Traded Funds (ETFs) and certain indexes as well as quoted prices for similar securities may be used and would be categorized as Level 2 in the hierarchy. Utilizing these techniques may result in transfers between Level 1 and Level 2. For equity securities, including restricted securities, where observable inputs are limited, assumptions about market activity and risk are used and these securities may be
Annual Report
Notes to Financial Statements - continued
3. Significant Accounting Policies - continued
Investment Valuation - continued
categorized as Level 3 in the hierarchy. The market approach generally consists of using comparable market transactions while the income approach generally consists of using the net present value of estimated future cash flows, adjusted as appropriate for liquidity, credit, market and/or other risk factors.
Debt securities, including restricted securities, are valued based on evaluated prices received from third party pricing vendors or from brokers who make markets in such securities. Corporate bonds and bank loan obligations are valued by pricing vendors who utilize matrix pricing which considers yield or price of bonds of comparable quality, coupon, maturity and type or by broker-supplied prices. Asset backed securities, collateralized mortgage obligations and commercial mortgage securities are valued by pricing vendors who utilize matrix pricing which considers prepayment speed assumptions, attributes of the collateral, yield or price of bonds of comparable quality, coupon, maturity and type or by broker-supplied prices. When independent prices are unavailable or unreliable, debt securities may be valued utilizing pricing methodologies which consider similar factors that would be used by third party pricing vendors. Debt securities are generally categorized as Level 2 in the hierarchy but may be Level 3 depending on the circumstances.
Investments in open-end mutual funds, including the Fidelity Central Funds, are valued at their closing net asset value (NAV) each business day and are categorized as Level 1 in the hierarchy.
The following provides information on Level 3 securities held by the Fund that were valued at period end based on unobservable inputs. These amounts exclude valuations provided by a broker.
Asset Type | Fair Value at
07/31/14 | Valuation
Technique (s) | Unobservable
Input | Amount or Range /
Weighted Average | Impact to
Valuation from an Increase
in Input* |
Bank Loan Obligations | $ 12,196,201 | Discounted
cash flow | Yield | 2.1% - 10.5% / 4.5% | Decrease |
Commercial Mortgage Securities | $ 2,707,064 | Discounted
cash flow | Yield | 2.1% | Decrease |
| | Market
comparable | Spread | 13.0% | Decrease |
Annual Report
3. Significant Accounting Policies - continued
Investment Valuation - continued
Asset Type | Fair Value at
07/31/14 | Valuation
Technique (s) | Unobservable
Input | Amount or Range /
Weighted Average | Impact to
Valuation from an Increase
in Input* |
Corporate Bonds | $ - | Expected
distribution | Recovery rate | 0.0% | Increase |
* Represents the expected directional change in the fair value of the Level 3 investments that would result from an increase in the corresponding
input. A decrease to the unobservable input would have the opposite effect. Significant changes in these inputs could result in significantly higher or
lower fair value measurements.
Changes in valuation techniques may result in transfers in or out of an assigned level within the disclosure hierarchy. The aggregate value of investments by input level, as of July 31, 2014, as well as a roll forward of Level 3 investments, is included at the end of the Fund's Schedule of Investments.
Foreign Currency. The Fund may use foreign currency contracts to facilitate transactions in foreign-denominated securities. Gains and losses from these transactions may arise from changes in the value of the foreign currency or if the counterparties do not perform under the contracts' terms.
Foreign-denominated assets, including investment securities, and liabilities are translated into U.S. dollars at the exchange rates at period end. Purchases and sales of investment securities, income and dividends received and expenses denominated in foreign currencies are translated into U.S. dollars at the exchange rate in effect on the transaction date.
The effects of exchange rate fluctuations on investments are included with the net realized and unrealized gain (loss) on investment securities. Other foreign currency transactions resulting in realized and unrealized gain (loss) are disclosed separately.
Investment Transactions and Income. For financial reporting purposes, the Fund's investment holdings and NAV include trades executed through the end of the last business day of the period. The NAV per share for processing shareholder transactions is calculated as of the close of business of the New York Stock Exchange (NYSE), normally 4:00 p.m. Eastern time and includes trades executed through the end of the prior business day. Gains and losses on securities sold are determined on the basis of identified cost. Dividend income is recorded on the ex-dividend date, except for certain dividends from foreign securities where the ex-dividend date may have passed, which are recorded as soon as the Fund is informed of the ex-dividend date. Non-cash dividends included in dividend income, if any, are recorded at the fair market value of the securities received. Income and capital gain distributions from Fidelity Central Funds, if any, are recorded on the ex-dividend date. Distributions received on securities that represent a return of
Annual Report
Notes to Financial Statements - continued
3. Significant Accounting Policies - continued
Investment Transactions and Income - continued
capital or capital gain are recorded as a reduction of cost of investments and/or as a realized gain. Subsequent to ex-dividend date the Fund determines the components of these distributions, based upon receipt of tax filings or other correspondence relating to the underlying investment. Interest income is accrued as earned and includes coupon interest and amortization of premium and accretion of discount on debt securities as applicable. Investment income is recorded net of foreign taxes withheld where recovery of such taxes is uncertain. Debt obligations may be placed on non-accrual status and related interest income may be reduced by ceasing current accruals and writing off interest receivables when the collection of all or a portion of interest has become doubtful based on consistently applied procedures. A debt obligation is removed from non-accrual status when the issuer resumes interest payments or when collectability of interest is reasonably assured.
Class Allocations and Expenses. Investment income, realized and unrealized capital gains and losses, common expenses of the Fund, and certain fund-level expense reductions, if any, are allocated daily on a pro-rata basis to each class based on the relative net assets of each class to the total net assets of the Fund. Each class differs with respect to transfer agent fees incurred. Certain expense reductions may also differ by class. For the reporting period, the allocated portion of income and expenses to each class as a percent of its average net assets may vary due to the timing of recording these transactions in relation to fluctuating net assets of the classes. Expenses directly attributable to a fund are charged to that fund. Expenses attributable to more than one fund are allocated among the respective funds on the basis of relative net assets or other appropriate methods. Expense estimates are accrued in the period to which they relate and adjustments are made when actual amounts are known.
Income Tax Information and Distributions to Shareholders. Each year, the Fund intends to qualify as a regulated investment company under Subchapter M of the Internal Revenue Code, including distributing substantially all of its taxable income and realized gains. As a result, no provision for U.S. Federal income taxes is required. As of July 31, 2014, the Fund did not have any unrecognized tax benefits in the financial statements; nor is the Fund aware of any tax positions for which it is reasonably possible that the total amounts of unrecognized tax benefits will significantly change in the next twelve months. The Fund files a U.S. federal tax return, in addition to state and local tax returns as required. The Fund's federal income tax returns are subject to examination by the Internal Revenue Service (IRS) for a period of three fiscal years after they are filed. State and local tax returns may be subject to examination for an additional fiscal year depending on the jurisdiction. Foreign taxes are provided for based on the Fund's
Annual Report
3. Significant Accounting Policies - continued
Income Tax Information and Distributions to Shareholders - continued
understanding of the tax rules and rates that exist in the foreign markets in which it invests.
Distributions are declared and recorded on the ex-dividend date. Income dividends and capital gain distributions are declared separately for each class. Income and capital gain distributions are determined in accordance with income tax regulations, which may differ from GAAP.
Capital accounts within the financial statements are adjusted for permanent book-tax differences. These adjustments have no impact on net assets or the results of operations. Capital accounts are not adjusted for temporary book-tax differences which will reverse in a subsequent period.
Book-tax differences are primarily due to foreign currency transactions, passive foreign investment companies (PFIC), equity-debt classifications and losses deferred due to wash sales.
The federal tax cost of investment securities and unrealized appreciation (depreciation) as of period end were as follows:
Gross unrealized appreciation | $ 66,484,843 |
Gross unrealized depreciation | (4,601,869) |
Net unrealized appreciation (depreciation) on securities | $ 61,882,974 |
| |
Tax Cost | $ 765,490,998 |
The tax-based components of distributable earnings as of period end were as follows:
Undistributed ordinary income | $ 12,797,886 |
Undistributed long-term capital gain | $ 15,135,572 |
Net unrealized appreciation (depreciation) on securities and other investments | $ 61,882,969 |
The tax character of distributions paid was as follows:
| July 31, 2014 | July 31, 2013 |
Ordinary Income | $ 47,449,028 | $ 54,427,784 |
Long-term Capital Gains | 12,648,034 | 915,318 |
Total | $ 60,097,062 | $ 55,343,102 |
Delayed Delivery Transactions and When-Issued Securities. During the period, the Fund transacted in securities on a delayed delivery or when-issued basis. Payment
Annual Report
Notes to Financial Statements - continued
3. Significant Accounting Policies - continued
Delayed Delivery Transactions and When-Issued Securities - continued
and delivery may take place after the customary settlement period for that security. The price of the underlying securities and the date when the securities will be delivered and paid for are fixed at the time the transaction is negotiated. The securities purchased on a delayed delivery or when-issued basis are identified as such in the Fund's Schedule of Investments. The Fund may receive compensation for interest forgone in the purchase of a delayed delivery or when-issued security. With respect to purchase commitments, the Fund identifies securities as segregated in its records with a value at least equal to the amount of the commitment. Losses may arise due to changes in the value of the underlying securities or if the counterparty does not perform under the contract's terms, or if the issuer does not issue the securities due to political, economic, or other factors.
Restricted Securities. The Fund may invest in securities that are subject to legal or contractual restrictions on resale. These securities generally may be resold in transactions exempt from registration or to the public if the securities are registered. Disposal of these securities may involve time-consuming negotiations and expense, and prompt sale at an acceptable price may be difficult. Information regarding restricted securities is included at the end of the Fund's Schedule of Investments.
Loans and Other Direct Debt Instruments. The Fund invests in direct debt instruments which are interests in amounts owed to lenders by corporate or other borrowers. These instruments may be in the form of loans, trade claims or other receivables and may include standby financing commitments such as revolving credit facilities that obligate the Fund to supply additional cash to the borrower on demand. Loans may be acquired through assignment or participation. The Fund did not have any unfunded loan commitments, which are contractual obligations for future funding, at period end.
4. Purchases and Sales of Investments.
Purchases and sales of securities other than short-term securities, aggregated $251,776,461 and $254,847,266, respectively.
5. Fees and Other Transactions with Affiliates.
Management Fee. Fidelity Management & Research Company (the investment adviser) and its affiliates provide the Fund with investment management related services for which the Fund pays a monthly management fee. The management fee is the sum of an individual fund fee rate that is based on an annual rate of .30% of the Fund's average net assets and an annualized group fee rate that averaged .25% during the period. The group fee rate is based upon the average net assets of all the mutual funds advised by the investment adviser, including any mutual funds previously advised by the investment adviser that are currently advised by Fidelity SelectCo, LLC, an affiliate of the
Annual Report
5. Fees and Other Transactions with Affiliates - continued
Management Fee - continued
investment adviser. The group fee rate decreases as assets under management increase and increases as assets under management decrease. For the reporting period, the total annual management fee rate was .55% of the Fund's average net assets.
Transfer Agent Fees. Fidelity Investments Institutional Operations Company, Inc., (FIIOC), an affiliate of the investment adviser, is the transfer, dividend disbursing and shareholder servicing agent for each class of the Fund. FIIOC receives account fees and asset-based fees that vary according to the account size and type of account of the shareholders of Series Real Estate Income, except for Class F. FIIOC receives no fees for providing transfer agency services to Class F. FIIOC pays for typesetting, printing and mailing of shareholder reports, except proxy statements.
For the period, transfer agent fees for each class were as follows:
| Amount | % of
Average
Net Assets |
Series Real Estate Income | $ 678,285 | .17 |
Accounting and Security Lending Fees. Fidelity Service Company, Inc. (FSC), an affiliate of the investment adviser, maintains the Fund's accounting records. The accounting fee is based on the level of average net assets for each month. Under a separate contract, FSC administers the security lending program. The security lending fee is based on the number and duration of lending transactions.
Brokerage Commissions. The Fund placed a portion of its portfolio transactions with brokerage firms which are affiliates of the investment adviser. Brokerage commissions are included in net realized gain (loss) and change in net unrealized appreciation (depreciation) in the Statement of Operations. The commissions paid to these affiliated firms were $2,673 for the period.
6. Committed Line of Credit.
The Fund participates with other funds managed by the investment adviser or an affiliate in a $4.25 billion credit facility (the "line of credit") to be utilized for temporary or emergency purposes to fund shareholder redemptions or for other short-term liquidity purposes. The Fund has agreed to pay commitment fees on its pro-rata portion of the line of credit, which amounted to $1,388 and is reflected in Miscellaneous expenses on the Statement of Operations. During the period, the Fund did not borrow on this line of credit.
Annual Report
Notes to Financial Statements - continued
7. Security Lending.
The Fund lends portfolio securities through a lending agent from time to time in order to earn additional income. For equity securities, a lending agent is used and may loan securities to certain qualified borrowers, including Fidelity Capital Markets (FCM), a broker-dealer affiliated with the Fund. On the settlement date of the loan, the Fund receives collateral (in the form of U.S. Treasury obligations, letters of credit and/or cash) against the loaned securities and maintains collateral in an amount not less than 100% of the market value of the loaned securities during the period of the loan. The market value of the loaned securities is determined at the close of business of the Fund and any additional required collateral is delivered to the Fund on the next business day. If the borrower defaults on its obligation to return the securities loaned because of insolvency or other reasons, the Fund may apply collateral received from the borrower against the obligation. The Fund may experience delays and costs in recovering the securities loaned. Any cash collateral received is maintained at the Fund's custodian and/or invested in the Fidelity Securities Lending Cash Central Fund. The value of loaned securities and cash collateral at period end are disclosed on the Fund's Statement of Assets and Liabilities. Security lending income represents the income earned on investing cash collateral, less rebates paid to borrowers and any lending agent fees associated with the loan, plus any premium payments received for lending certain types of securities. Security lending income is presented in the Statement of Operations as a component of income from Fidelity Central Funds. Total security lending income during the period amounted to $5,479. During the period, there were no securities loaned to FCM.
8. Expense Reductions.
Commissions paid to certain brokers with whom the investment adviser, or its affiliates, places trades on behalf of the Fund include an amount in addition to trade execution, which may be rebated back to the Fund to offset certain expenses. This amount totaled $6,110 for the period. In addition, through arrangements with the Fund's custodian, credits realized as a result of uninvested cash balances were used to reduce the Fund's expenses. During the period, these credits reduced the Fund's custody expenses by $446.
9. Distributions to Shareholders.
Distributions to shareholders of each class were as follows:
Years ended July 31, | 2014 | 2013 |
From net investment income | | |
Series Real Estate Income | $ 21,286,598 | $ 24,942,481 |
Class F | 21,547,556 | 19,965,180 |
Total | $ 42,834,154 | $ 44,907,661 |
Annual Report
9. Distributions to Shareholders - continued
Years ended July 31, | 2014 | 2013 |
From net realized gain | | |
Series Real Estate Income | $ 8,798,960 | $ 6,141,225 |
Class F | 8,463,948 | 4,294,216 |
Total | $ 17,262,908 | $ 10,435,441 |
10. Share Transactions.
Transactions for each class of shares were as follows:
| Shares | Dollars |
Years ended July 31, | 2014 | 2013 | 2014 | 2013 |
Series Real Estate Income | | | | |
Shares sold | 5,096,461 | 7,016,602 | $ 56,759,758 | $ 79,894,286 |
Reinvestment of distributions | 2,752,035 | 2,775,858 | 30,085,558 | 31,083,706 |
Shares redeemed | (8,601,530) | (10,869,294) | (95,963,309) | (123,967,802) |
Net increase (decrease) | (753,034) | (1,076,834) | $ (9,117,993) | $ (12,989,810) |
Class F | | | | |
Shares sold | 7,066,532 | 9,486,077 | $ 79,103,585 | $ 108,393,021 |
Reinvestment of distributions | 2,743,696 | 2,161,262 | 30,011,504 | 24,259,396 |
Shares redeemed | (7,540,879) | (3,157,748) | (84,186,356) | (35,905,543) |
Net increase (decrease) | 2,269,349 | 8,489,591 | $ 24,928,733 | $ 96,746,874 |
11. Other.
The Fund's organizational documents provide former and current trustees and officers with a limited indemnification against liabilities arising in connection with the performance of their duties to the Fund. In the normal course of business, the Fund may also enter into contracts that provide general indemnifications. The Fund's maximum exposure under these arrangements is unknown as this would be dependent on future claims that may be made against the Fund. The risk of material loss from such claims is considered remote.
At the end of the period, mutual funds managed by the investment adviser or its affiliates were the owners of record of all of the outstanding shares of the Fund.
Annual Report
To the Trustees of Fidelity Securities Fund and Shareholders of Fidelity Series Real Estate Income Fund:
We have audited the accompanying statement of assets and liabilities of Fidelity Series Real Estate Income Fund (the Fund), a fund of Fidelity Securities Fund, including the schedule of investments, as of July 31, 2014, and the related statement of operations for the year then ended, the statement of changes in net assets for each of the two years in the period then ended, and the financial highlights for the periods presented. These financial statements and financial highlights are the responsibility of the Fund's management. Our responsibility is to express an opinion on these financial statements and financial highlights based on our audits.
We conducted our audits in accordance with the standards of the Public Company Accounting Oversight Board (United States). Those standards require that we plan and perform the audit to obtain reasonable assurance about whether the financial statements and financial highlights are free of material misstatement. The Fund is not required to have, nor were we engaged to perform, an audit of its internal control over financial reporting. Our audits included consideration of internal control over financial reporting as a basis for designing audit procedures that are appropriate in the circumstances, but not for the purpose of expressing an opinion on the effectiveness of the Fund's internal control over financial reporting. Accordingly, we express no such opinion. An audit also includes examining, on a test basis, evidence supporting the amounts and disclosures in the financial statements, assessing the accounting principles used and significant estimates made by management, as well as evaluating the overall financial statement presentation. Our procedures included confirmation of securities owned as of July 31, 2014, by correspondence with the custodians and brokers; where replies were not received from brokers, we performed other auditing procedures. We believe that our audits provide a reasonable basis for our opinion.
In our opinion, the financial statements and financial highlights referred to above present fairly, in all material respects, the financial position of Fidelity Series Real Estate Income Fund as of July 31, 2014, the results of its operations for the year then ended, and the changes in its net assets for each of the two years in the period then ended, and the financial highlights for the periods presented, in conformity with accounting principles generally accepted in the United States of America.
DELOITTE & TOUCHE LLP
Boston, Massachusetts
September 22, 2014
Annual Report
The Trustees, Member of the Advisory Board, and officers of the trust and fund, as applicable, are listed below. The Board of Trustees governs the fund and is responsible for protecting the interests of shareholders. The Trustees are experienced executives who meet periodically throughout the year to oversee the fund's activities, review contractual arrangements with companies that provide services to the fund, oversee management of the risks associated with such activities and contractual arrangements, and review the fund's performance. Except for James C. Curvey, each of the Trustees oversees 173 funds. Mr. Curvey oversees 397 funds.
The Trustees hold office without limit in time except that (a) any Trustee may resign; (b) any Trustee may be removed by written instrument, signed by at least two-thirds of the number of Trustees prior to such removal; (c) any Trustee who requests to be retired or who has become incapacitated by illness or injury may be retired by written instrument signed by a majority of the other Trustees; and (d) any Trustee may be removed at any special meeting of shareholders by a two-thirds vote of the outstanding voting securities of the trust. Each Trustee who is not an interested person (as defined in the 1940 Act) of the trust and the fund (Independent Trustee), shall retire not later than the last day of the calendar year in which his or her 75th birthday occurs. The Independent Trustees may waive this mandatory retirement age policy with respect to individual Trustees. The officers and Advisory Board Member hold office without limit in time, except that any officer and Advisory Board Member may resign or may be removed by a vote of a majority of the Trustees at any regular meeting or any special meeting of the Trustees. Except as indicated, each individual has held the office shown or other offices in the same company for the past five years.
Experience, Skills, Attributes, and Qualifications of the Fund's Trustees. The Governance and Nominating Committee has adopted a statement of policy that describes the experience, qualifications, attributes, and skills that are necessary and desirable for potential Independent Trustee candidates (Statement of Policy). The Board believes that each Trustee satisfied at the time he or she was initially elected or appointed a Trustee, and continues to satisfy, the standards contemplated by the Statement of Policy. The Governance and Nominating Committee also engages professional search firms to help identify potential Independent Trustee candidates who have the experience, qualifications, attributes, and skills consistent with the Statement of Policy. From time to time, additional criteria based on the composition and skills of the current Independent Trustees, as well as experience or skills that may be appropriate in light of future changes to board composition, business conditions, and regulatory or other developments, have also been considered by the professional search firms and the Governance and Nominating Committee. In addition, the Board takes into account the Trustees' commitment and participation in Board and committee meetings, as well as their leadership of standing and ad hoc committees throughout their tenure.
In determining that a particular Trustee was and continues to be qualified to serve as a Trustee, the Board has considered a variety of criteria, none of which, in isolation, was controlling. The Board believes that, collectively, the Trustees have balanced and diverse experience, qualifications, attributes, and skills, which allow the Board to operate effectively in governing the fund and protecting the interests of shareholders. Information about the specific experience, skills, attributes, and qualifications of each Trustee, which in each case led to the Board's conclusion that the Trustee should serve (or continue to serve) as a trustee of the fund, is provided below.
Annual Report
Trustees and Officers - continued
Board Structure and Oversight Function. James C. Curvey is an interested person (as defined in the 1940 Act) and currently serves as Chairman. The Trustees have determined that an interested Chairman is appropriate and benefits shareholders because an interested Chairman has a personal and professional stake in the quality and continuity of services provided to the fund. Independent Trustees exercise their informed business judgment to appoint an individual of their choosing to serve as Chairman, regardless of whether the Trustee happens to be independent or a member of management. The Independent Trustees have determined that they can act independently and effectively without having an Independent Trustee serve as Chairman and that a key structural component for assuring that they are in a position to do so is for the Independent Trustees to constitute a substantial majority for the Board. The Independent Trustees also regularly meet in executive session. Ned C. Lautenbach serves as Chairman of the Independent Trustees and as such (i) acts as a liaison between the Independent Trustees and management with respect to matters important to the Independent Trustees and (ii) with management prepares agendas for Board meetings.
Fidelity funds are overseen by different Boards of Trustees. The fund's Board oversees Fidelity's equity and high income funds and another Board oversees Fidelity's investment-grade bond, money market, and asset allocation funds. The asset allocation funds may invest in Fidelity funds overseen by the fund's Board. The use of separate Boards, each with its own committee structure, allows the Trustees of each group of Fidelity funds to focus on the unique issues of the funds they oversee, including common research, investment, and operational issues. On occasion, the separate Boards establish joint committees to address issues of overlapping consequences for the Fidelity funds overseen by each Board.
The Trustees operate using a system of committees to facilitate the timely and efficient consideration of all matters of importance to the Trustees, the fund, and fund shareholders and to facilitate compliance with legal and regulatory requirements and oversight of the fund's activities and associated risks. The Board, acting through its committees, has charged FMR and its affiliates with (i) identifying events or circumstances the occurrence of which could have demonstrably adverse effects on the fund's business and/or reputation; (ii) implementing processes and controls to lessen the possibility that such events or circumstances occur or to mitigate the effects of such events or circumstances if they do occur; and (iii) creating and maintaining a system designed to evaluate continuously business and market conditions in order to facilitate the identification and implementation processes described in (i) and (ii) above. Because the day-to-day operations and activities of the fund are carried out by or through FMR, its affiliates and other service providers, the fund's exposure to risks is mitigated but not eliminated by the processes overseen by the Trustees. While each of the Board's committees has responsibility for overseeing different aspects of the fund's activities, oversight is exercised primarily through the Operations, Audit, and Compliance Committees. In addition, the Independent Trustees have worked with FMR to enhance the Board's oversight of investment and financial risks, legal and regulatory risks, technology risks, and operational risks, including the development of additional risk reporting to the Board. For example, a working group comprised of Independent Trustees and FMR has worked and continues to work to review the Fidelity funds' valuation-related activities, reporting and risk management. Appropriate personnel, including but not limited to the fund's Chief Compliance Officer (CCO), FMR's internal auditor, the independent accountants, the fund's Treasurer and portfolio management personnel, make periodic reports to the Board's committees, as appropriate, including an annual review of FMR's risk management program for the Fidelity funds. The responsibilities of each standing committee, including their oversight responsibilities, are described further under "Standing Committees of the Fund's Trustees."
Annual Report
The fund's Statements of Additional Information (SAIs) includes more information about the Trustees. To request a free copy, call Fidelity at 1-800-544-8544 for Fidelity Series Real Estate Income Fund or 1-800-835-5092 for Class F.
Interested Trustees*:
Correspondence intended for each Trustee who is an interested person may be sent to Fidelity Investments, 245 Summer Street, Boston, Massachusetts 02210.
Name, Year of Birth; Principal Occupations and Other Relevant Experience+ |
James C. Curvey (1935) |
Year of Election or Appointment: 2007 Trustee Chairman of the Board of Trustees |
| Mr. Curvey also serves as Trustee of other Fidelity funds. Mr. Curvey is a Director of Fidelity Research & Analysis Co. (2009-present), and Vice Chairman (2007-present) and Director of FMR LLC. In addition, Mr. Curvey serves as an Overseer for the Boston Symphony Orchestra and a member of the Trustees of Villanova University. Previously, Mr. Curvey served as a Director of Fidelity Investments Money Management, Inc. (2009-2014), a Director of FMR (2007-2014), a Director of FMR Co., Inc. (2007-2014) and was the Vice Chairman (2006-2007) and Director (2000-2007) of FMR Corp. |
Charles S. Morrison (1960) |
Year of Election or Appointment: 2014 Trustee |
| Mr. Morrison also serves as Trustee of other funds. He serves as President, Asset Management (2014-present) and is an employee of Fidelity Investments. Previously, Mr. Morrison served as Vice President of Fidelity's Fixed Income and Asset Allocation Funds (2012-2014), President, Fixed Income (2011-2014), Vice President of Fidelity's Money Market Funds (2005-2009), President, Money Market Group Leader of FMR (2009), and Senior Vice President, Money Market Group of FMR (2004-2009). Mr. Morrison also served as Vice President of Fidelity's Bond Funds (2002-2005), certain Balanced Funds (2002-2005), and certain Asset Allocation Funds (2002-2007), and as Senior Vice President (2002-2005) of Fidelity's Bond Division. |
* Trustees have been determined to be "Interested Trustees" by virtue of, among other things, their affiliation with the trust or various entities under common control with FMR.
+ The information above includes each Trustee's principal occupation during the last five years and other information relating to the experience, attributes, and skills relevant to each Trustee's qualifications to serve as a Trustee, which led to the conclusion that each Trustee should serve as a Trustee for the fund.
Annual Report
Independent Trustees:
Correspondence intended for each Independent Trustee (that is, the Trustees other than the Interested Trustees) may be sent to Fidelity Investments, P.O. Box 55235, Boston, Massachusetts 02205-5235.
Name, Year of Birth; Principal Occupations and Other Relevant Experience+ |
Dennis J. Dirks (1948) |
Year of Election or Appointment: 2005 Trustee |
| Mr. Dirks also serves as Trustee of other Fidelity funds. Prior to his retirement in May 2003, Mr. Dirks was Chief Operating Officer and a member of the Board of The Depository Trust & Clearing Corporation (DTCC). He also served as President, Chief Operating Officer, and Board member of The Depository Trust Company (DTC) and President and Board member of the National Securities Clearing Corporation (NSCC). In addition, Mr. Dirks served as Chief Executive Officer and Board member of the Government Securities Clearing Corporation, Chief Executive Officer and Board member of the Mortgage-Backed Securities Clearing Corporation, as a Trustee and a member of the Finance Committee of Manhattan College (2005-2008), and as a Trustee and a member of the Finance Committee of AHRC of Nassau County (2006-2008). Mr. Dirks is a member of the Independent Directors Council (IDC) Governing Council (2010-present) and Board of Directors for The Brookville Center for Children's Services, Inc. (2009-present). |
Alan J. Lacy (1953) |
Year of Election or Appointment: 2008 Trustee |
| Mr. Lacy also serves as Trustee of other Fidelity funds. Mr. Lacy serves as Senior Adviser (2007-present) of Oak Hill Capital Partners, L.P. (private equity). Mr. Lacy also served as Chief Executive Officer (2000-2005) and Vice Chairman (2005-2006) of Sears Holdings Corporation and Sears, Roebuck and Co. (retail). In addition, Mr. Lacy serves as a member of the Board of Directors of Dave & Buster's Entertainment, Inc. (restaurant and entertainment complexes, 2010-present), Earth Fare, Inc. (retail grocery, 2012-present), The Hillman Companies, Inc. (hardware wholesalers, 2010-present), and Bristol-Myers Squibb Company (global pharmaceuticals, 2008-present). Mr. Lacy is a member of the Board of Trustees of The National Parks Conservation Association (2006-present). Previously, Mr. Lacy served as Chairman of the Board of Trustees of the National Parks Conservation Association (2008-2011) and as a member of the Board of Directors for the Western Union Company (global money transfer, 2006-2011). |
Ned C. Lautenbach (1944) |
Year of Election or Appointment: 2000 Trustee Chairman of the Independent Trustees |
| Mr. Lautenbach also serves as Trustee of other Fidelity funds. Mr. Lautenbach currently serves as the Lead Director of the Eaton Corporation Board of Directors (diversified industrial, 1997-present). Mr. Lautenbach is Chairman of the Board of Directors of the Philharmonic Center for the Arts in Naples, Florida (2012-present) and a member of the Council on Foreign Relations (1994-present). Previously, Mr. Lautenbach was a Partner/Advisory Partner at Clayton, Dubilier & Rice, LLC (private equity investment, 1998-2010), as well as a Director of Sony Corporation (2006-2007). |
Joseph Mauriello (1944) |
Year of Election or Appointment: 2008 Trustee |
| Mr. Mauriello also serves as Trustee of other Fidelity funds. Prior to his retirement in January 2006, Mr. Mauriello served in numerous senior management positions including Deputy Chairman and Chief Operating Officer (2004-2005), and Vice Chairman of Financial Services (2002-2004) of KPMG LLP US (professional services, 1965-2005). Mr. Mauriello currently serves as a member of the Board of Directors of XL Group plc. (global insurance and re-insurance, 2006-present). Previously, Mr. Mauriello served as a Director of the Hamilton Funds of the Bank of New York (2006-2007) and of Arcadia Resources Inc. (health care services and products, 2007-2012). |
Robert W. Selander (1950) |
Year of Election or Appointment: 2011 Trustee |
| Mr. Selander also serves as Trustee of other Fidelity funds. Previously, Mr. Selander served as a Member of the Advisory Board of other Fidelity funds (2011), and Executive Vice Chairman (2010), Chief Executive Officer (2009-2010), and President and Chief Executive Officer (1997-2009) of Mastercard, Inc. |
Cornelia M. Small (1944) |
Year of Election or Appointment: 2005 Trustee |
| Ms. Small also serves as Trustee of other Fidelity funds. Ms. Small is a member of the Board of Directors (2009-present) and Chair of the Investment Committee (2010-present) of the Teagle Foundation. Ms. Small also serves on the Investment Committee of the Berkshire Taconic Community Foundation (2008-present). Previously, Ms. Small served as Chairperson (2002-2008) and a member of the Investment Committee and Chairperson (2008-2012) and a member of the Board of Trustees of Smith College. In addition, Ms. Small served as Chief Investment Officer, Director of Global Equity Investments, and a member of the Board of Directors of Scudder, Stevens & Clark and Scudder Kemper Investments. |
William S. Stavropoulos (1939) |
Year of Election or Appointment: 2002 Trustee Vice Chairman of the Independent Trustees |
| Mr. Stavropoulos also serves as Trustee of other Fidelity funds. Mr. Stavropoulos serves as President and Founder of the Michigan Baseball Foundation, the Great Lakes Loons (2007-present). Mr. Stavropoulos is Chairman Emeritus of the Board of Directors of The Dow Chemical Company, where he previously served in numerous senior management positions, including President, CEO (1995-2000; 2002-2004), Chairman of the Executive Committee (2000-2006), and as a member of the Board of Directors (1990-2006). Currently, Mr. Stavropoulos is Chairman of the Board of Directors of Univar Inc. (global distributor of commodity and specialty chemicals), a Director of Teradata Corporation (data warehousing and technology solutions), and Maersk Inc. (industrial conglomerate), and a member of the Advisory Board for Metalmark Capital LLC (private equity investment, 2005-present). Mr. Stavropoulos is an operating advisor to Clayton, Dubilier & Rice, LLC (private equity investment). In addition, Mr. Stavropoulos is a member of the University of Notre Dame Advisory Council for the College of Science, a Trustee of the Rollin L. Gerstacker Foundation, and a Director of the Naples Philharmonic Center for the Arts. Previously, Mr. Stavropoulos served as a Director of Chemical Financial Corporation (bank holding company, 1993-2012) and Tyco International, Ltd. (multinational manufacturing and services, 2007-2012). |
David M. Thomas (1949) |
Year of Election or Appointment: 2008 Trustee |
| Mr. Thomas also serves as Trustee of other Fidelity funds. Mr. Thomas serves as Non-Executive Chairman of the Board of Directors of Fortune Brands Home and Security (home and security products, 2011-present), and as a member of the Board of Directors of Interpublic Group of Companies, Inc. (marketing communication, 2004-present). Previously, Mr. Thomas served as Executive Chairman (2005-2006) and Chairman and Chief Executive Officer (2000-2005) of IMS Health, Inc. (pharmaceutical and healthcare information solutions), and a Director of Fortune Brands, Inc. (consumer products, 2000-2011). |
+ The information above includes each Trustee's principal occupation during the last five years and other information relating to the experience, attributes, and skills relevant to each Trustee's qualifications to serve as a Trustee, which led to the conclusion that each Trustee should serve as a Trustee for the fund.
Advisory Board Members and Officers:
Correspondence intended for each officer and Peter S. Lynch may be sent to Fidelity Investments, 245 Summer Street, Boston, Massachusetts 02210. Officers appear below in alphabetical order.
Name, Year of Birth; Principal Occupation |
Peter S. Lynch (1944) |
Year of Election or Appointment: 2003 Member of the Advisory Board |
| Mr. Lynch also serves as Member of the Advisory Board of other Fidelity funds. Mr. Lynch is Vice Chairman and a Director of FMR and FMR Co., Inc. In addition, Mr. Lynch serves as a Trustee of Boston College and as the Chairman of the Inner-City Scholarship Fund. Previously, Mr. Lynch served on the Special Olympics International Board of Directors (1997-2006). |
Christopher S. Bartel (1971) |
Year of Election or Appointment: 2011 Vice President |
| Mr. Bartel also serves as Vice President of other funds. Mr. Bartel serves as a Director, President, and Chief Executive Officer of Fidelity Management & Research (Japan) Inc. (2012-present), a Director of Fidelity Management & Research (Hong Kong) (2012-present), and Senior Vice President of Global Equity Research (2010-present). Previously, Mr. Bartel served as Senior Vice President of Equity Research (2009-2010), Managing Director of Research (2006-2009), and an analyst and portfolio manager (2000-2006). |
Elizabeth Paige Baumann (1968) |
Year of Election or Appointment: 2012 Anti-Money Laundering (AML) Officer |
| Ms. Baumann also serves as AML Officer of other funds. She is Chief AML Officer of FMR LLC (2012-present) and is an employee of Fidelity Investments. Previously, Ms. Baumann served as Vice President and Deputy Anti-Money Laundering Officer (2007-2012). |
William C. Coffey (1969) |
Year of Election or Appointment: 2009 Assistant Secretary |
| Mr. Coffey also serves as Assistant Secretary of other funds. He is Senior Vice President and Deputy General Counsel of FMR LLC (2010-present), and is an employee of Fidelity Investments. Previously, Mr. Coffey served as Vice President and Associate General Counsel of FMR LLC (2005-2009). |
Jonathan Davis (1968) |
Year of Election or Appointment: 2010 Assistant Treasurer |
| Mr. Davis also serves as Assistant Treasurer of other funds. Mr. Davis is an employee of Fidelity Investments. Previously, Mr. Davis served as Vice President and Associate General Counsel of FMR LLC (2003-2010). |
Adrien E. Deberghes (1967) |
Year of Election or Appointment: 2008 Deputy Treasurer |
| Mr. Deberghes also serves as an officer of other funds. He is an employee of Fidelity Investments (2008-present). Prior to joining Fidelity Investments, Mr. Deberghes was Senior Vice President of Mutual Fund Administration at State Street Corporation (2007-2008), Senior Director of Mutual Fund Administration at Investors Bank & Trust (2005-2007), and Director of Finance for Dunkin' Brands (2000-2005). |
Stephanie J. Dorsey (1969) |
Year of Election or Appointment: 2010 Assistant Treasurer |
| Ms. Dorsey also serves as an officer of other funds. She is an employee of Fidelity Investments (2008-present) and has served in other fund officer roles. Prior to joining Fidelity Investments, Ms. Dorsey served as Treasurer (2004-2008) of the JPMorgan Mutual Funds and Vice President (2004-2008) of JPMorgan Chase Bank. |
Howard J. Galligan III (1966) |
Year of Election or Appointment: 2014 Chief Financial Officer |
| Mr. Galligan also serves as Chief Financial Officer of other funds. Mr. Galligan serves as President of Fidelity Pricing and Cash Management Services (FPCMS) (2014-present) and as a Director of Strategic Advisers, Inc. (2008-present). Previously, Mr. Galligan served as Chief Administrative Officer of Asset Management (2011-2014) and Chief Operating Officer and Senior Vice President of Investment Support for Strategic Advisers, Inc. (2003-2011). |
Scott C. Goebel (1968) |
Year of Election or Appointment: 2008 Secretary and Chief Legal Officer (CLO) |
| Mr. Goebel serves as Secretary and CLO of other funds. Mr. Goebel also serves as Secretary of Fidelity SelectCo, LLC (2013-present), Fidelity Investments Money Management, Inc. (FIMM) (2010-present) and Fidelity Research and Analysis Company (FRAC) (2010-present); General Counsel, Secretary, and Senior Vice President of FMR (2008-present) and FMR Co., Inc. (2008-present); Chief Legal Officer of Fidelity Management & Research (Hong Kong) Limited (2008-present); and Assistant Secretary of Fidelity Management & Research (Japan) Inc. (2008-present) and Fidelity Management & Research (U.K.) Inc. (2008-present). Previously, Mr. Goebel served as Secretary and CLO of other Fidelity funds (2008-2013), Assistant Secretary of FIMM (2008-2010), FRAC (2008-2010), and certain funds (2007-2008); and as Vice President and Secretary of Fidelity Distributors Corporation (FDC) (2005-2007). Mr. Goebel has been employed by FMR LLC or an affiliate since 2001. |
Brian B. Hogan (1964) |
Year of Election or Appointment: 2011 Vice President |
| Mr. Hogan also serves as Trustee or Vice President of other funds. Mr. Hogan serves as President of FMR's Equity Division (2009-present). Previously, Mr. Hogan served as Senior Vice President, Equity Research of FMR (2006-2009) and as a portfolio manager. |
Chris Maher (1972) |
Year of Election or Appointment: 2013 Assistant Treasurer |
| Mr. Maher serves as Assistant Treasurer of other funds. Mr. Maher is Vice President of Valuation Oversight and is an employee of Fidelity Investments. Previously, Mr. Maher served as Vice President of Asset Management Compliance (2013), Vice President of FMR's Program Management Group (2010-2013), and Vice President of Valuation Oversight (2008-2010). |
Kenneth B. Robins (1969) |
Year of Election or Appointment: 2008 President and Treasurer |
| Mr. Robins also serves as an officer of other funds. Mr. Robins serves as Executive Vice President of Fidelity Investments Money Management, Inc. (FIMM) (2013-present) and is an employee of Fidelity Investments (2004-present). Previously, Mr. Robins served in other fund officer roles. |
Stephen Sadoski (1971) |
Year of Election or Appointment: 2012 Deputy Treasurer |
| Mr. Sadoski also serves as Deputy Treasurer of other funds. He is an employee of Fidelity Investments (2012-present) and has served in another fund officer role. Prior to joining Fidelity Investments, Mr. Sadoski served as an assistant chief accountant in the Division of Investment Management of the Securities and Exchange Commission (SEC) (2009-2012) and as a senior manager at Deloitte & Touche LLP (1997-2009). |
Stacie M. Smith (1974) |
Year of Election or Appointment: 2013 Deputy Treasurer |
| Ms. Smith also serves as an officer of other funds. She is an employee of Fidelity Investments (2009-present) and has served in other fund officer roles. Prior to joining Fidelity Investments, Ms. Smith served as Senior Audit Manager of Ernst & Young LLP (1996-2009). |
Renee Stagnone (1975) |
Year of Election or Appointment: 2013 Deputy Treasurer |
| Ms. Stagnone also serves as Deputy Treasurer of other funds. Ms. Stagnone is an employee of Fidelity Investments. |
Linda J. Wondrack (1964) |
Year of Election or Appointment: 2014 Chief Compliance Officer |
| Ms. Wondrack also serves as Chief Compliance Officer of other funds. Ms. Wondrack is Executive Vice President and head of the Ethics Office and Asset Management Compliance for Fidelity Investments (2012-present). Ms. Wondrack also serves as Chief Compliance Officer of Fidelity SelectCo, LLC (2014-present); Chief Compliance Officer of Impresa Management LLC (2013-present); and Chief Compliance Officer of FMR Co., Inc., Fidelity Investments Money Management, Inc., Fidelity Management & Research (Japan) Inc., Fidelity Management & Research (U.K.) Inc., Fidelity Management & Research (Hong Kong), Fidelity Management & Research Company, Pyramis Global Advisors, LLC, and Strategic Advisers, Inc., Ballyrock Investment Advisors LLC, and Northern Neck Investors LLC (2012-present). Previously, Ms. Wondrack served as Senior Vice President and Chief Compliance Officer for Columbia Management Investment Advisers, LLC (2005-2012); Chief Compliance Officer for certain funds within the Columbia Family of Funds (2007-2012); and Senior Vice President of Compliance Risk Management at Bank of America (2005-2010). |
Joseph F. Zambello (1957) |
Year of Election or Appointment: 2011 Deputy Treasurer |
| Mr. Zambello also serves as Deputy Treasurer of other funds. Mr. Zambello is an employee of Fidelity Investments. Previously, Mr. Zambello served as Vice President of FMR's Program Management Group (2009-2011) and Vice President of the Transfer Agent Oversight Group (2005-2009). |
Annual Report
The Board of Trustees of Fidelity Series Real Estate Income Fund voted to pay shareholders of record at the opening of business on record date, the following distributions per share derived from capital gains realized from sales of portfolio securities, and dividends derived from net investment income:
| Pay Date | Record Date | Dividends | Capital Gains |
Real Estate Income | 09/08/14 | 09/05/14 | $0.160 | $0.259 |
Class F | 09/08/14 | 09/05/14 | $0.165 | $0.259 |
The fund hereby designates as a capital gain dividend with respect to the taxable year ended July 31, 2014, $19,511,252, or, if subsequently determined to be different, the net capital gain of such year.
A total of 0.03% of the dividends distributed during the fiscal year was derived from interest on U.S. Government securities which is generally exempt from state income tax.
The fund will notify shareholders in January 2015 of amounts for use in preparing 2014 income tax returns.
Annual Report
Board Approval of Investment Advisory Contracts and Management Fees
Fidelity Series Real Estate Income Fund
Each year, the Board of Trustees, including the Independent Trustees (together, the Board), votes on the renewal of the management contract with Fidelity Management & Research Company (FMR) and the sub-advisory agreements (together, the Advisory Contracts) for the fund. The Board, assisted by the advice of fund counsel and Independent Trustees' counsel, requests and considers a broad range of information relevant to the renewal of the Advisory Contracts throughout the year.
The Board meets regularly and, at each of its meetings, covers an extensive agenda of topics and materials and considers factors that are relevant to its annual consideration of the renewal of the fund's Advisory Contracts, including the services and support provided to the fund and its shareholders. The Board has established various standing committees (Committees), each composed of and chaired by Independent Trustees with varying backgrounds, to which the Board has assigned specific subject matter responsibilities in order to enhance effective decision-making by the Board. The Board, acting directly and through its Committees, requests and receives information concerning the annual consideration of the renewal of the fund's Advisory Contracts. The Board also meets as needed to consider matters specifically related to the Board's annual consideration of the renewal of the Advisory Contracts. Members of the Board may also meet with trustees of other Fidelity funds through ad hoc joint committees to discuss certain matters relevant to the Fidelity funds.
At its July 2014 meeting, the Board, including the Independent Trustees, unanimously determined to renew the fund's Advisory Contracts. In reaching its determination, the Board considered all factors it believed relevant, including (i) the nature, extent, and quality of the services to be provided to the fund and its shareholders (including the investment performance of the fund); (ii) the competitiveness of the fund's management fee and total expense ratio relative to peer funds; (iii) the total costs of the services to be provided by and the profits to be realized by Fidelity from its relationship with the fund; (iv) the extent to which economies of scale exist and would be realized as the fund grows; and (v) whether fee levels reflect these economies of scale, if any, for the benefit of fund shareholders. In connection with separate internal corporate reorganizations involving Fidelity Management & Research (U.K.) Inc. (FMR U.K.) and Fidelity Management & Research (Japan) Inc. (FMR Japan), the Board approved certain non-material amendments to the fund's sub-advisory agreements with FMR U.K. and FMR Japan to reflect that, after these reorganizations, FMR Investment Management (UK) Limited and Fidelity Management & Research (Japan) Limited will carry on the business of FMR U.K. and FMR Japan, respectively. The Board noted that no changes to the portfolio managers or to the foreign research or investment advisory services provided to the fund were expected in connection with either reorganization and that the same personnel and resources would continue to be available to the fund at the new entities.
Annual Report
Board Approval of Investment Advisory Contracts and
Management Fees - continued
In considering whether to renew the Advisory Contracts for the fund, the Board reached a determination, with the assistance of fund counsel and Independent Trustees' counsel and through the exercise of its business judgment, that the renewal of the Advisory Contracts was in the best interests of the fund and its shareholders and that the compensation payable under the Advisory Contracts was fair and reasonable. The Board's decision to renew the Advisory Contracts was not based on any single factor, but rather was based on a comprehensive consideration of all the information provided to the Board at its meetings throughout the year. The Board, in reaching its determination to renew the Advisory Contracts, was aware that shareholders of the fund have a broad range of investment choices available to them, including a wide choice among funds offered by Fidelity's competitors, and that the fund's shareholders, who have the opportunity to review and weigh the disclosure provided by the fund in its prospectus and other public disclosures, have chosen to invest in this fund, which is part of the Fidelity family of funds.
Nature, Extent, and Quality of Services Provided. The Board considered Fidelity's staffing as it relates to the fund, including the backgrounds of investment personnel of FMR and the sub-advisers (together, the Investment Advisers), and also considered the fund's investment objective, strategies, and related investment philosophy. The Independent Trustees also had discussions with senior management of Fidelity's investment operations and investment groups. The Board considered the structure of the portfolio manager compensation program and whether this structure provides appropriate incentives to act in the best interests of the fund. Additionally, the Board considered the portfolio managers' investments, if any, in the funds that they manage.
Resources Dedicated to Investment Management and Support Services. The Board and the Fund Oversight and Research Committees reviewed the general qualifications and capabilities of Fidelity's investment staff, including its size, education, experience, and resources, as well as Fidelity's approach to recruiting, training, managing, and compensating investment personnel. The Board noted that Fidelity has continued to increase the resources devoted to non-U.S. offices, including expansion of Fidelity's global investment organization. The Board also noted that Fidelity's analysts have extensive resources, tools and capabilities that allow them to conduct sophisticated quantitative and fundamental analysis, as well as credit analysis of issuers, counterparties and guarantors. Further, the Board believes that Fidelity's investment professionals have sufficient access to global information and data so as to provide competitive investment results over time, and that those professionals also have access to sophisticated tools that permit them to assess portfolio construction and risk and performance attribution characteristics continuously, as well as to transmit new information and research conclusions rapidly around the world. Additionally, in its deliberations, the Board considered Fidelity's trading and risk management capabilities and resources and global compliance infrastructure, which are an integral part of the investment management process.
Annual Report
Shareholder and Administrative Services. The Board considered (i) the nature, extent, quality, and cost of advisory, administrative, and shareholder services performed by the Investment Advisers and their affiliates under the Advisory Contracts and under separate agreements covering transfer agency, pricing and bookkeeping, and securities lending services for the fund; (ii) the nature and extent of the supervision of third party service providers, principally custodians and subcustodians; and (iii) the resources devoted to, and the record of compliance with, the fund's compliance policies and procedures. The Board also reviewed the allocation of fund brokerage, including allocations to brokers affiliated with the Investment Advisers, the use of brokerage commissions to pay fund expenses, and the use of "soft" commission dollars to pay for research services.
The Board noted that the growth of fund assets over time across the complex allows Fidelity to reinvest in the development of services designed to enhance the value or convenience of the Fidelity funds as investment vehicles. These services include 24-hour access to account information and market information through telephone representatives and over the Internet, investor education materials and asset allocation tools, and the expanded availability of Fidelity Investor Centers.
In 2014, the Board formed an ad hoc Committee on Transfer Agency Fees to review the variety of transfer agency fee structures throughout the industry and Fidelity's competitive positioning with respect to industry participants.
Investment in a Large Fund Family. The Board considered the benefits to shareholders of investing in a Fidelity fund, including the benefits of investing in a fund that is part of a large family of funds offering a variety of investment disciplines and providing a large variety of mutual fund investor services. The Board noted that Fidelity had taken, or had made recommendations that resulted in the Fidelity funds taking, a number of actions over the previous year that benefited particular funds, including (i) continuing to dedicate additional resources to investment research and to the support of the senior management team that oversees asset management; (ii) persisting in efforts to enhance Fidelity's global research capabilities; (iii) launching new funds and making other enhancements to meet client needs for income-oriented solutions; (iv) reducing fund expenses for certain index funds; (v) continuing to launch dedicated lower cost underlying funds to meet portfolio construction needs related to expanding underlying fund options for Fidelity funds of funds, specifically for the Freedom Fund product lines; (vi) rationalizing product lines and gaining increased efficiencies through fund mergers; (vii) launching sector-based exchange-traded funds and establishing a new Fidelity adviser to manage sector-based funds and products; (viii) continuing to develop and implement technology to improve security and increase efficiency; (ix) modifying the eligibility criteria for certain share classes to increase their marketability to a portion of the defined contribution plan market; (x) waiving redemption fees for certain qualified fund-of-fund and wrap programs and certain retirement plan transactions; and (xi) launching new Institutional Class shares of certain money market funds to attract and retain assets and to fill a gap in the money market fund lineup.
Annual Report
Board Approval of Investment Advisory Contracts and
Management Fees - continued
Investment Performance. The Board considered whether the fund has operated in accordance with its investment objective, as well as its record of compliance with its investment restrictions and its performance history.
The Board took into account discussions with the Investment Advisers about fund investment performance that occur at Board meetings throughout the year. In this regard the Board noted that as part of regularly scheduled fund reviews and other reports to the Board on fund performance, the Board periodically considers annualized return information for the fund, for different time periods, measured against a securities market index ("benchmark index") and a peer group of funds with similar objectives ("peer group"). In its evaluation of fund investment performance, the Board gave particular attention to information indicating changes in performance of certain Fidelity funds for specific time periods and the Investment Advisers' explanations for any overperformance or underperformance.
In addition to reviewing absolute and relative fund performance, the Independent Trustees periodically consider the appropriateness of fund performance metrics in evaluating the results achieved. In general, the Independent Trustees believe that fund performance should be evaluated based on net performance (after fees and expenses) of both the highest performing and lowest performing classes, where applicable, compared to appropriate benchmark indices, over appropriate time periods which may include full market cycles, and compared to peer groups, as applicable, over the same periods, taking into account relevant factors including the following: general market conditions; issuer-specific information; tactical opportunities for investment; and fund cash flows and other factors.
The Independent Trustees recognize that shareholders evaluate performance on a net basis over their own holding periods, for which one-, three-, and five-year periods are often used as a proxy. For this reason, the performance information reviewed by the Board also included net cumulative calendar year total return information for the fund and an appropriate benchmark index and peer group for the most recent one-year period, as shown below. Returns are shown compared to the 25th percentile (top of box, 75% beaten) and 75th percentile (bottom of box, 25% beaten) of the peer universe.
Annual Report
Fidelity Series Real Estate Income Fund
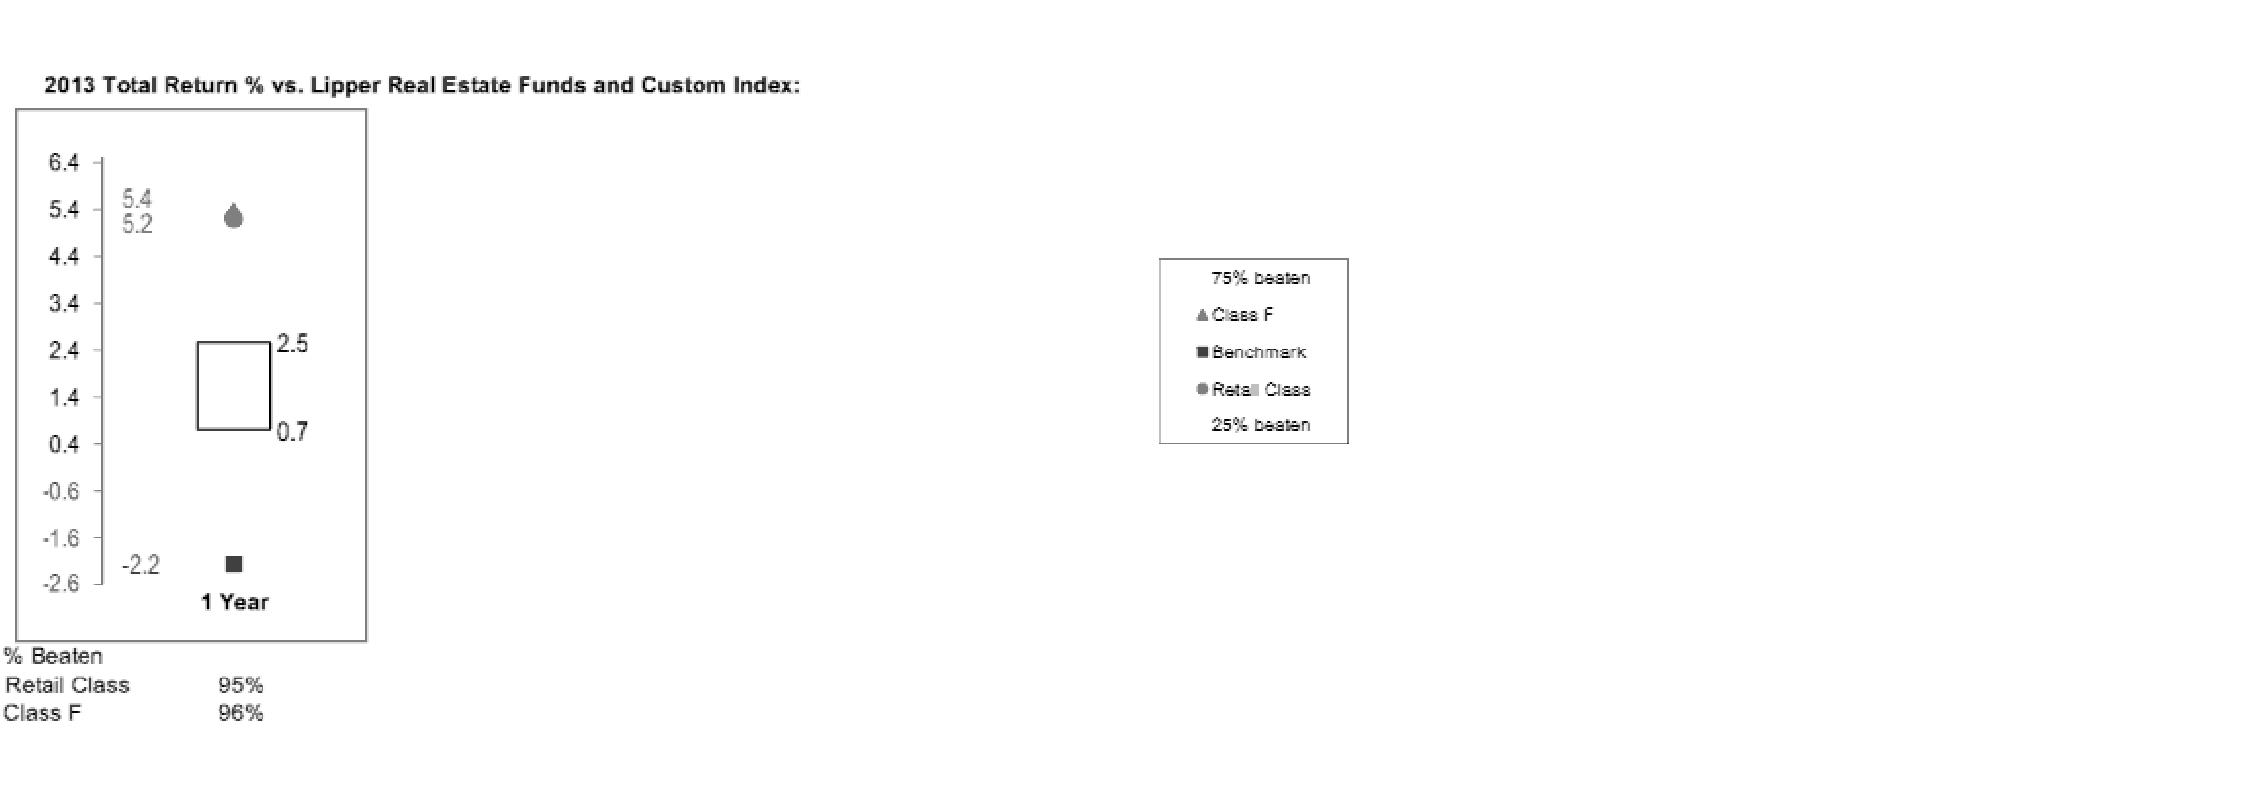
Based on its review, the Board concluded that the nature, extent, and quality of services provided to the fund under the Advisory Contracts should benefit the fund's shareholders.
Competitiveness of Management Fee and Total Expense Ratio. The Board considered the fund's management fee and total expense ratio compared to "mapped groups" of competitive funds and classes. Fidelity creates "mapped groups" by combining similar Lipper investment objective categories that have comparable investment mandates. Combining Lipper investment objective categories aids the Board's management fee and total expense ratio comparisons by broadening the competitive group used for comparison and by reducing the number of universes to which various Fidelity funds are compared.
Management Fee. The Board considered two proprietary management fee comparisons for the 12-month (or shorter) periods shown in the chart below. The group of Lipper funds used by the Board for management fee comparisons is referred to below as the "Total Mapped Group." The Total Mapped Group is broader than the Lipper peer group used by the Board for performance comparisons because the Total Mapped Group combines several Lipper investment objective categories while the Lipper peer group does not. The Total Mapped Group comparison focuses on a fund's standing in terms of gross management fees before expense reimbursements or caps relative to the total universe of funds with comparable investment mandates, regardless of whether their management fee structures also are comparable. Funds with comparable investment mandates offer exposure to similar types of securities. Funds with comparable management fee structures have similar management fee contractual arrangements (e.g., flat rate charged for advisory services, all-inclusive fee rate, etc.). "TMG %" represents the percentage of funds in the Total Mapped Group that had management fees that were lower than the fund's. For example, a hypothetical TMG % of 20% would mean that 80% of the funds in the Total Mapped Group had higher, and 20% had lower, management fees than the fund. The fund's actual TMG %s are in the chart below. The "Asset-Size Peer Group" (ASPG) comparison focuses on a fund's standing relative to a subset of non-Fidelity funds within the Total Mapped Group that are similar in size and management fee structure. For example, if a fund is in the first quartile of the ASPG, the fund's management fee ranks in the least expensive or lowest 25% of funds in the ASPG. The ASPG represents at least 15% of the funds in the Total Mapped Group with comparable asset size and management fee structures, subject to a minimum of 50 funds (or all funds in the Total Mapped Group if fewer than 50). Additional information, such as the ASPG quartile in which the fund's management fee rate ranked, is also included in the chart and considered by the Board.
Annual Report
Board Approval of Investment Advisory Contracts and
Management Fees - continued
Fidelity Series Real Estate Income Fund
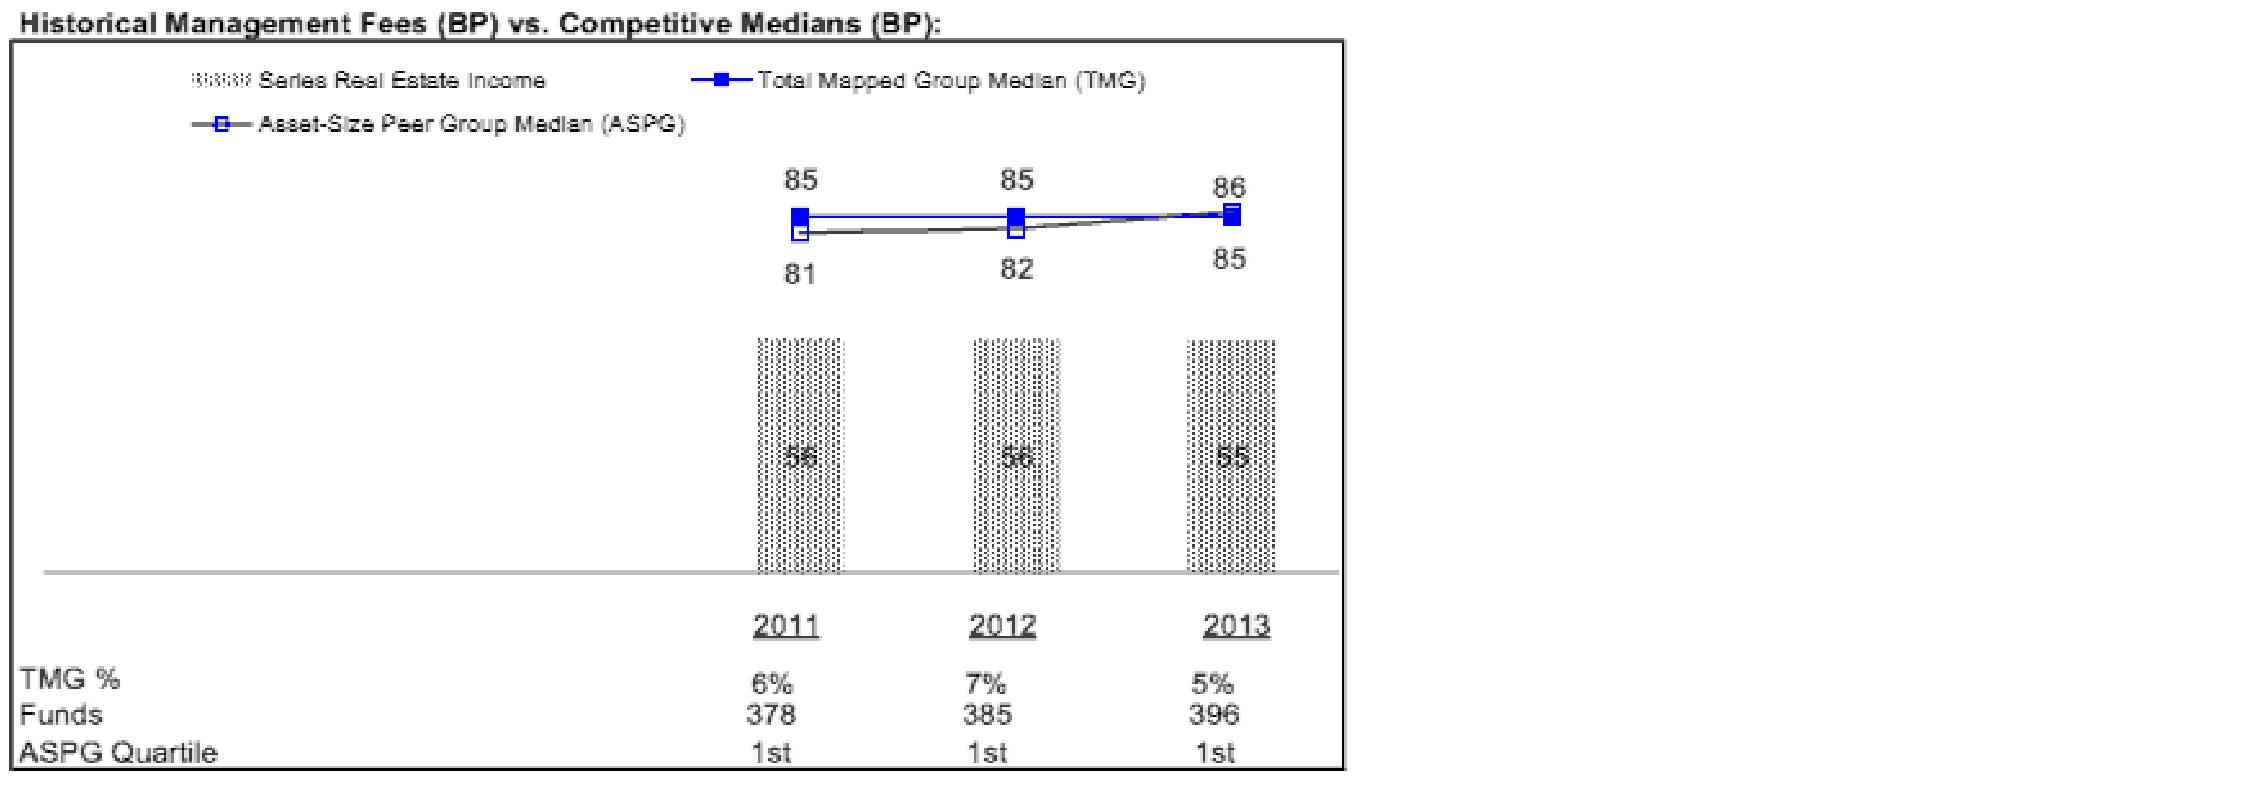
The Board noted that the fund's management fee rate ranked below the median of its Total Mapped Group and below the median of its ASPG for 2013.
The Board also noted that, in August 2013, the ad hoc Committee on Management Fees was formed to conduct an in-depth review of the management fee rates of Fidelity's active equity mutual funds. The Committee focused on the following areas: (i) standard fee structures; (ii) research consumption and trading evolution; (iii) management fee competitiveness/profitability by category; and (iv) factors that drive institutional pricing.
Annual Report
Based on its review, the Board concluded that the fund's management fee is fair and reasonable in light of the services that the fund receives and the other factors considered.
Total Expense Ratio. In its review of each class's total expense ratio, the Board considered the fund's management fee as well as other fund or class expenses, as applicable, such as transfer agent fees, pricing and bookkeeping fees, and custodial, legal, and audit fees. The Board also noted the effects of any waivers and reimbursements on fees and expenses. As part of its review, the Board also considered the current and historical total expense ratios of each class of the fund compared to competitive fund median expenses. Each class of the fund is compared to those funds and classes in the Total Mapped Group (used by the Board for management fee comparisons) that have a similar sales load structure.
The Board noted that the total expense ratio of each class ranked below its competitive median for 2013.
Fees Charged to Other Fidelity Clients. The Board also considered Fidelity fee structures and other information with respect to clients of Fidelity, such as other funds advised or subadvised by Fidelity, pension plan clients, and other institutional clients. The Board noted the findings of the 2013 ad hoc joint committee (created with the board of other Fidelity funds), which reviewed and compared Fidelity's institutional investment advisory business with its business of providing services to the Fidelity funds, including the differences in services provided, fees charged, and costs incurred, as well as competition in their respective marketplaces.
Based on its review of total expense ratios and fees charged to other Fidelity clients, the Board concluded that the total expense ratio of each class of the fund was reasonable in light of the services that the fund and its shareholders receive and the other factors considered.
Costs of the Services and Profitability. The Board considered the revenues earned and the expenses incurred by Fidelity in conducting the business of developing, marketing, distributing, managing, administering and servicing the fund and servicing the fund's shareholders. The Board also considered the level of Fidelity's profits in respect of all the Fidelity funds.
On an annual basis, Fidelity presents to the Board Fidelity's profitability for the fund. Fidelity calculates the profitability for each fund, as well as aggregate profitability for groups of Fidelity funds and all Fidelity funds, using a series of detailed revenue and cost allocation methodologies which originate with the books and records of Fidelity on which Fidelity's audited financial statements are based. The Audit Committee of the Board reviews any significant changes from the prior year's methodologies.
Annual Report
Board Approval of Investment Advisory Contracts and
Management Fees - continued
PricewaterhouseCoopers LLP (PwC), independent registered public accounting firm and auditor to Fidelity and certain Fidelity funds, has been engaged annually by the Board as part of the Board's assessment of Fidelity's profitability analysis. PwC's engagement includes the review and assessment of the methodologies used by Fidelity in determining the revenues and expenses attributable to Fidelity's mutual fund business, and completion of agreed-upon procedures in respect of the mathematical accuracy of fund profitability and its conformity to established allocation methodologies. After considering PwC's reports issued under the engagement and information provided by Fidelity, the Board concluded that while other allocation methods may also be reasonable, Fidelity's profitability methodologies are reasonable in all material respects.
The Board also reviewed Fidelity's non-fund businesses and fall-out benefits related to the mutual fund business as well as cases where Fidelity's affiliates may benefit from or be related to the fund's business.
The Board considered the costs of the services provided by and the profits realized by Fidelity in connection with the operation of the fund and was satisfied that the profitability was not excessive in the circumstances.
Economies of Scale. The Board considered whether there have been economies of scale in respect of the management of the Fidelity funds, whether the Fidelity funds (including the fund) have appropriately benefited from any such economies of scale, and whether there is potential for realization of any further economies of scale. The Board considered the extent to which the fund will benefit from economies of scale through increased services to the fund, through waivers or reimbursements, or through fee or expense ratio reductions. The Board also noted that in 2013, it and the boards of other Fidelity funds created an ad hoc committee (the Economies of Scale Committee) to analyze whether Fidelity attains economies of scale in respect of the management and servicing of the Fidelity funds, whether the Fidelity funds have appropriately benefited from such economies of scale, and whether there is potential for realization of any further economies of scale.
The Board recognized that the fund's management contract incorporates a "group fee" structure, which provides for lower group fee rates as total group assets increase, and for higher group fee rates as total group assets decrease (with "group assets" defined to include fund assets under FMR's management plus sector fund assets previously under FMR's management and currently managed by Fidelity SelectCo, LLC). FMR calculates the group fee rates based on a tiered asset "breakpoint" schedule that varies based on asset class. The Board considered that the group fee is designed to deliver the benefits of economies of scale to fund shareholders when total Fidelity fund assets increase, even if assets of any particular fund are unchanged or have declined, because some portion of Fidelity's costs are attributable to services provided to all Fidelity funds, and all funds benefit if those costs can be allocated among more assets. The Board also considered that although the fund is offered only to other Fidelity funds, it continues to incur investment management expenses. The Board further noted that the fund may continue to realize benefits from the group fee structure, even though assets may not be expected to grow significantly at the fund level. The Board concluded that, given the group fee structure, fund shareholders will benefit from lower management fees as group assets increase at the fund complex level, regardless of whether Fidelity achieves any such economies of scale.
Annual Report
The Board concluded, taking into account the analysis of the Economies of Scale Committee, that economies of scale, if any, are being appropriately shared between fund shareholders and Fidelity.
Additional Information Requested by the Board. In order to develop fully the factual basis for consideration of the Fidelity funds' Advisory Contracts, the Board requested and received additional information on certain topics, including: (i) fund performance trends and Fidelity's long-term strategies for certain funds; (ii) Fidelity's strategic marketing and product lineup goals; (iii) the methodology with respect to competitive fund data and peer group classifications; (iv) the arrangements with, and performance of, certain sub-advisers on behalf of the Fidelity funds, as well as certain proposed participating affiliate arrangements; (v) the realization of fall-out benefits in certain Fidelity business units; (vi) Fidelity's group fee structures, including the rationale for the individual fee rates of certain categories of funds and the definition of group assets; (vii) trends regarding industry use of performance fee structures and the performance adjustment methodologies applicable to the Fidelity funds; (viii) additional competitive analysis regarding the total expenses for certain classes; (ix) fund profitability methodology, including Fidelity's cost allocation methodology, and the impact of certain factors on fund profitability results; and (x) the process by which Fidelity determines sub-advisory fees for funds it advises.
Based on its evaluation of all of the conclusions noted above, and after considering all factors it believed relevant, the Board ultimately concluded that the advisory fee structures are fair and reasonable, and that the fund's Advisory Contracts should be renewed.
Annual Report
Investment Adviser
Fidelity Management & Research Company
Boston, MA
Investment Sub-Advisers
FMR Co., Inc.
Fidelity Management & Research (U.K.) Inc.
Fidelity Management & Research
(Hong Kong) Limited
Fidelity Management & Research
(Japan) Inc.
General Distributor
Fidelity Distributors Corporation
Smithfield, RI
Transfer and Service Agents
Fidelity Investments Institutional Operations Company, Inc.
Boston, MA
Fidelity Service Company, Inc.
Boston, MA
Custodian
The Northern Trust Company
Chicago, IL
(Fidelity Investment logo)(registered trademark)
Corporate Headquarters
245 Summer St., Boston, MA 02210
www.fidelity.com
SRE-ANN-0914
1.924310.102
Item 2. Code of Ethics
As of the end of the period, July 31, 2014, Fidelity Securities Fund (the trust) has adopted a code of ethics, as defined in Item 2 of Form N-CSR, that applies to its President and Treasurer and its Chief Financial Officer. A copy of the code of ethics is filed as an exhibit to this Form N-CSR.
Item 3. Audit Committee Financial Expert
The Board of Trustees of the trust has determined that Joseph Mauriello is an audit committee financial expert, as defined in Item 3 of Form N-CSR. Mr. Mauriello is independent for purposes of Item 3 of Form N-CSR.
Item 4. Principal Accountant Fees and Services
Fees and Services
The following table presents fees billed by Deloitte & Touche LLP, the member firms of Deloitte Touche Tohmatsu, and their respective affiliates (collectively, "Deloitte Entities") in each of the last two fiscal years for services rendered to Fidelity Blue Chip Growth Fund, Fidelity OTC Portfolio, Fidelity Real Estate Income Fund, Fidelity Series Blue Chip Growth Fund, Fidelity Series Real Estate Equity Fund, Fidelity Series Real Estate Income Fund, and Fidelity Series Small Cap Opportunities Fund (the "Funds"):
Services Billed by Deloitte Entities
July 31, 2014 FeesA,B
| Audit Fees | Audit-Related Fees | Tax Fees | All Other Fees |
Fidelity Blue Chip Growth Fund | $52,000 | $- | $5,300 | $4,200 |
Fidelity OTC Portfolio | $44,000 | $- | $5,800 | $2,600 |
Fidelity Real Estate Income Fund | $154,000 | $- | $6,800 | $1,400 |
Fidelity Series Blue Chip Growth Fund | $38,000 | $- | $5,000 | $1,400 |
Fidelity Series Real Estate Equity Fund | $38,000 | $- | $5,800 | $800 |
Fidelity Series Real Estate Income Fund | $74,000 | $- | $5,800 | $700 |
Fidelity Series Small Cap Opportunities Fund | $47,000 | $- | $4,800 | $1,500 |
July 31, 2013 FeesA,B
| Audit Fees | Audit-Related Fees | Tax Fees | All Other Fees |
Fidelity Blue Chip Growth Fund | $53,000 | $- | $4,800 | $3,300 |
Fidelity OTC Portfolio | $45,000 | $- | $5,800 | $1,700 |
Fidelity Real Estate Income Fund | $156,000 | $- | $7,500 | $1,000 |
Fidelity Series Blue Chip Growth Fund | $- | $- | $- | $- |
Fidelity Series Real Estate Equity Fund | $38,000 | $- | $5,800 | $600 |
Fidelity Series Real Estate Income Fund | $74,000 | $- | $5,800 | $600 |
Fidelity Series Small Cap Opportunities Fund | $47,000 | $- | $4,800 | $900 |
A Amounts may reflect rounding.
B Fidelity Series Blue Chip Growth Fund commenced operations on November 7, 2013.
The following table presents fees billed by PricewaterhouseCoopers LLP ("PwC") in each of the last two fiscal years for services rendered to Fidelity Blue Chip Value Fund, Fidelity Dividend Growth Fund, Fidelity Growth & Income Portfolio, Fidelity Leveraged Company Stock Fund, Fidelity Small Cap Growth Fund, and Fidelity Small Cap Value Fund (the "Funds"):
Services Billed by PwC
July 31, 2014 FeesA
| Audit Fees | Audit-Related Fees | Tax Fees | All Other Fees |
Fidelity Blue Chip Value Fund | $51,000 | $- | $3,400 | $1,700 |
Fidelity Dividend Growth Fund | $66,000 | $- | $4,400 | $4,600 |
Fidelity Growth & Income Portfolio | $72,000 | $- | $6,100 | $4,200 |
Fidelity Leveraged Company Stock Fund | $56,000 | $- | $4,500 | $3,500 |
Fidelity Small Cap Growth Fund | $52,000 | $- | $3,600 | $2,200 |
Fidelity Small Cap Value Fund | $54,000 | $- | $3,400 | $2,800 |
July 31, 2013 FeesA
| Audit Fees | Audit-Related Fees | Tax Fees | All Other Fees |
Fidelity Blue Chip Value Fund | $50,000 | $- | $3,500 | $1,600 |
Fidelity Dividend Growth Fund | $65,000 | $- | $3,500 | $4,400 |
Fidelity Growth & Income Portfolio | $71,000 | $- | $7,200 | $3,800 |
Fidelity Leveraged Company Stock Fund | $54,000 | $- | $4,600 | $3,100 |
Fidelity Small Cap Growth Fund | $51,000 | $- | $3,300 | $2,200 |
Fidelity Small Cap Value Fund | $54,000 | $- | $3,300 | $2,800 |
A Amounts may reflect rounding.
The following table presents fees billed by PwC and Deloitte Entities that were required to be approved by the Audit Committee for services that relate directly to the operations and financial reporting of the Funds and that are rendered on behalf of Fidelity Management & Research Company ("FMR") and entities controlling, controlled by, or under common control with FMR (not including any sub-adviser whose role is primarily portfolio management and is subcontracted with or overseen by another investment adviser) that provide ongoing services to the Funds ("Fund Service Providers"):
Services Billed by Deloitte Entities
| July 31, 2014A,B | July 31, 2013A,B |
Audit-Related Fees | $355,000 | $915,000 |
Tax Fees | $- | $- |
All Other Fees | $745,000 | $765,000 |
A Amounts may reflect rounding.
B May include amounts billed prior to the Fidelity Series Blue Chip Growth Fund's commencement of operations.
Services Billed by PwC
| July 31, 2014A | July 31, 2013A |
Audit-Related Fees | $5,975,000 | $4,295,000 |
Tax Fees | $50,000 | $- |
All Other Fees | $- | $- |
A Amounts may reflect rounding.
"Audit-Related Fees" represent fees billed for assurance and related services that are reasonably related to the performance of the fund audit or the review of the fund's financial statements and that are not reported under Audit Fees.
"Tax Fees" represent fees billed for tax compliance, tax advice or tax planning that relate directly to the operations and financial reporting of the fund.
"All Other Fees" represent fees billed for services provided to the fund or Fund Service Provider, a significant portion of which are assurance related, that relate directly to the operations and financial reporting of the fund, excluding those services that are reported under Audit Fees, Audit-Related Fees or Tax Fees.
Assurance services must be performed by an independent public accountant.
* * *
The aggregate non-audit fees billed by PwC and Deloitte Entities for services rendered to the Funds, FMR (not including any sub-adviser whose role is primarily portfolio management and is subcontracted with or overseen by another investment adviser), and any Fund Service Provider for each of the last two fiscal years of the Funds are as follows:
Billed By | July 31, 2014 A, B | July 31, 2013 A, B |
PwC | $7,230,000 | $5,105,000 |
Deloitte Entities | $1,985,000 | $1,820,000 |
A Amounts may reflect rounding.
B May include amounts billed prior to the Fidelity Series Blue Chip Growth Fund's commencement of operations.
The trust's Audit Committee has considered non-audit services that were not pre-approved that were provided by PwC and Deloitte Entities to Fund Service Providers to be compatible with maintaining the independence of PwC and Deloitte Entities in their audits of the Funds, taking into account representations from PwC and Deloitte Entities, in accordance with Public Company Accounting Oversight Board rules, regarding their independence from the Funds and their related entities and FMR's review of the appropriateness and permissibility under applicable law of such non-audit services prior to their provision to the Fund Service Providers.
Audit Committee Pre-Approval Policies and Procedures
The trust's Audit Committee must pre-approve all audit and non-audit services provided by a fund's independent registered public accounting firm relating to the operations or financial reporting of the fund. Prior to the commencement of any audit or non-audit services to a fund, the Audit Committee reviews the services to determine whether they are appropriate and permissible under applicable law.
The Audit Committee has adopted policies and procedures to, among other purposes, provide a framework for the Committee's consideration of non-audit services by the audit firms that audit the Fidelity funds. The policies and procedures require that any non-audit service provided by a fund audit firm to a Fidelity fund and any non-audit service provided by a fund auditor to a Fund Service Provider that relates directly to the operations and financial reporting of a Fidelity fund ("Covered Service") are subject to approval by the Audit Committee before such service is provided.
All Covered Services must be approved in advance of provision of the service either: (i) by formal resolution of the Audit Committee, or (ii) by oral or written approval of the service by the Chair of the Audit Committee (or if the Chair is unavailable, such other member of the Audit Committee as may be designated by the Chair to act in the Chair's absence). The approval contemplated by (ii) above is permitted where the Treasurer determines that action on such an engagement is necessary before the next meeting of the Audit Committee.
Non-audit services provided by a fund audit firm to a Fund Service Provider that do not relate directly to the operations and financial reporting of a Fidelity fund are reported to the Audit Committee on a periodic basis.
Non-Audit Services Approved Pursuant to Rule 2-01(c)(7)(i)(C) and (ii) of Regulation S-X ("De Minimis Exception")
There were no non-audit services approved or required to be approved by the Audit Committee pursuant to the De Minimis Exception during the Funds' last two fiscal years relating to services provided to (i) the Funds or (ii) any Fund Service Provider that relate directly to the operations and financial reporting of the Funds.
Item 5. Audit Committee of Listed Registrants
Not applicable.
Item 6. Investments
(a) Not applicable.
(b) Not applicable
Item 7. Disclosure of Proxy Voting Policies and Procedures for Closed-End Management Investment Companies
Not applicable.
Item 8. Portfolio Managers of Closed-End Management Investment Companies
Not applicable.
Item 9. Purchase of Equity Securities by Closed-End Management Investment Company and Affiliated Purchasers
Not applicable.
Item 10. Submission of Matters to a Vote of Security Holders
There were no material changes to the procedures by which shareholders may recommend nominees to the trust's Board of Trustees.
Item 11. Controls and Procedures
(a)(i) The President and Treasurer and the Chief Financial Officer have concluded that the trust's disclosure controls and procedures (as defined in Rule 30a-3(c) under the Investment Company Act) provide reasonable assurances that material information relating to the trust is made known to them by the appropriate persons, based on their evaluation of these controls and procedures as of a date within 90 days of the filing date of this report.
(a)(ii) There was no change in the trust's internal control over financial reporting (as defined in Rule 30a-3(d) under the Investment Company Act) that occurred during the second fiscal quarter of the period covered by this report that has materially affected, or is reasonably likely to materially affect, the trust's internal control over financial reporting.
Item 12. Exhibits
(a) | (1) | Code of Ethics pursuant to Item 2 of Form N-CSR is filed and attached hereto as EX-99.CODE ETH. |
(a) | (2) | Certification pursuant to Rule 30a-2(a) under the Investment Company Act of 1940 (17 CFR 270.30a-2(a)) is filed and attached hereto as Exhibit 99.CERT. |
(a) | (3) | Not applicable. |
(b) | | Certification pursuant to Rule 30a-2(b) under the Investment Company Act of 1940 (17 CFR 270.30a-2(b)) is furnished and attached hereto as Exhibit 99.906CERT. |
SIGNATURES
Pursuant to the requirements of the Securities Exchange Act of 1934 and the Investment Company Act of 1940, the registrant has duly caused this report to be signed on its behalf by the undersigned, thereunto duly authorized.
Fidelity Securities Fund
By: | /s/Kenneth B. Robins |
| Kenneth B. Robins |
| President and Treasurer |
| |
Date: | September 25, 2014 |
Pursuant to the requirements of the Securities Exchange Act of 1934 and the Investment Company Act of 1940, this report has been signed below by the following persons on behalf of the registrant and in the capacities and on the dates indicated.
By: | /s/Kenneth B. Robins |
| Kenneth B. Robins |
| President and Treasurer |
| |
Date: | September 25, 2014 |
By: | /s/Howard J. Galligan III |
| Howard J. Galligan III |
| Chief Financial Officer |
| |
Date: | September 25, 2014 |